EDI April 17, 2012 - American Society for Engineering ... 1) Navy workforce data ... National...
26
1 EDI April 17, 2012
Transcript of EDI April 17, 2012 - American Society for Engineering ... 1) Navy workforce data ... National...

1
EDI
April 17, 2012
2
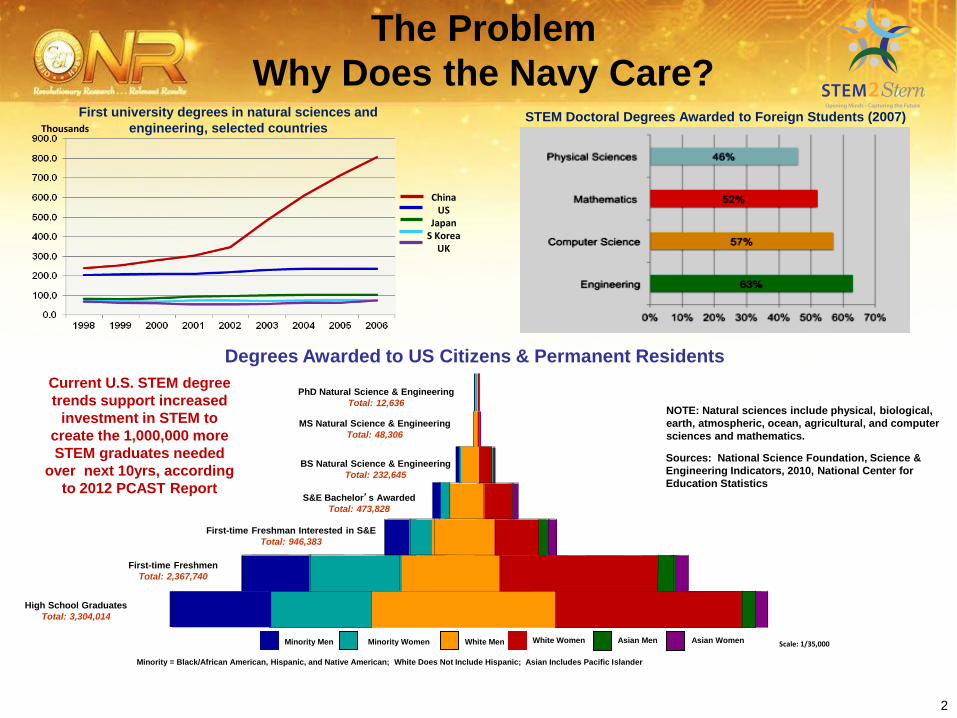
China US
Japan S Korea
UK
Degrees Awarded to US Citizens & Permanent Residents
First university degrees in natural sciences and
engineering, selected countries Thousands
Minority = Black/African American, Hispanic, and Native American; White Does Not Include Hispanic; Asian Includes Pacific Islander
High School Graduates
Total: 3,304,014
First-time Freshmen
Total: 2,367,740
Scale: 1/35,000
First-time Freshman Interested in S&E
Total: 946,383
Minority Men Minority Women White Men White Women Asian Men Asian Women
S&E Bachelor’s Awarded
Total: 473,828
BS Natural Science & Engineering
Total: 232,645
PhD Natural Science & Engineering
Total: 12,636
MS Natural Science & Engineering
Total: 48,306
NOTE: Natural sciences include physical, biological,
earth, atmospheric, ocean, agricultural, and computer
sciences and mathematics.
Sources: National Science Foundation, Science &
Engineering Indicators, 2010, National Center for
Education Statistics
STEM Doctoral Degrees Awarded to Foreign Students (2007)
The Problem
Why Does the Navy Care?
Current U.S. STEM degree
trends support increased
investment in STEM to
create the 1,000,000 more
STEM graduates needed
over next 10yrs, according
to 2012 PCAST Report

3
Nearly 65% of DoN science and engineering
professionals are over age 40, and over 50%
will be retirement eligible by 2020
NOTES:
1) Navy workforce data as of 1 June 2009 provided by the Director, Acquisition Career Management, ASN(RDA)
2) National workforce data from Bureau of Labor Statistics 2008 annual average demographic employment data for selected
occupational groups comparable to the Navy technical workforce
3) Total number of Navy employees is 21,311 and includes members of the Senior Executive Service, but not student
trainees; total number of employees in national workforce data is 5.82 million
4) Navy data includes employees of the Naval Research Laboratory and all warfare centers
4
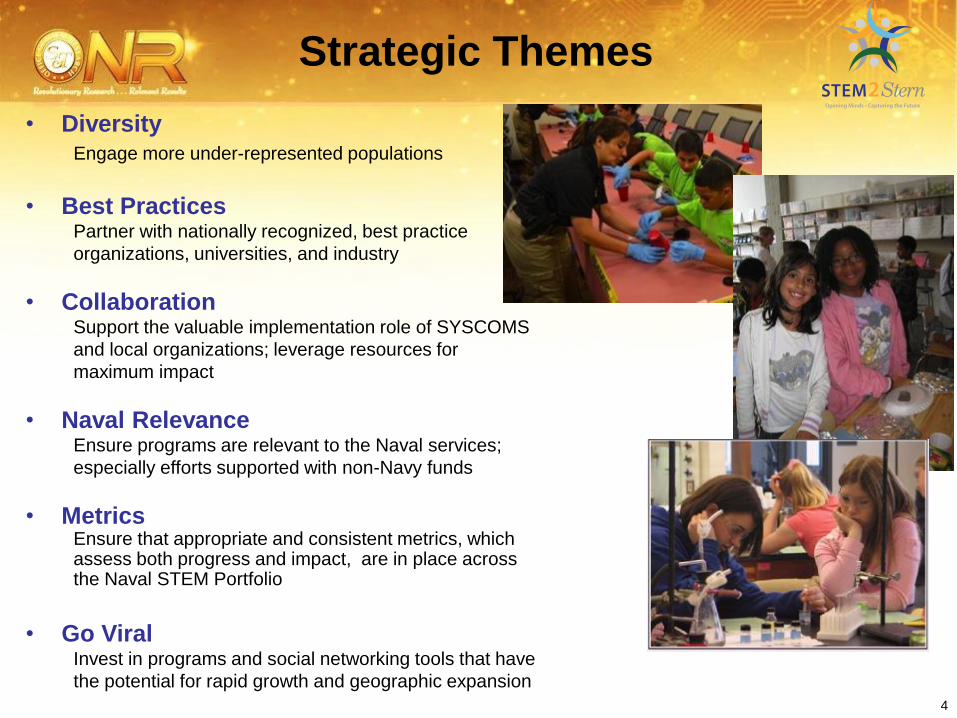
Strategic Themes
• Diversity Engage more under-represented populations
• Best Practices Partner with nationally recognized, best practice
organizations, universities, and industry
• Collaboration Support the valuable implementation role of SYSCOMS
and local organizations; leverage resources for
maximum impact
• Naval Relevance Ensure programs are relevant to the Naval services;
especially efforts supported with non-Navy funds
• Metrics Ensure that appropriate and consistent metrics, which assess both progress and impact, are in place across the Naval STEM Portfolio
• Go Viral Invest in programs and social networking tools that have
the potential for rapid growth and geographic expansion
5
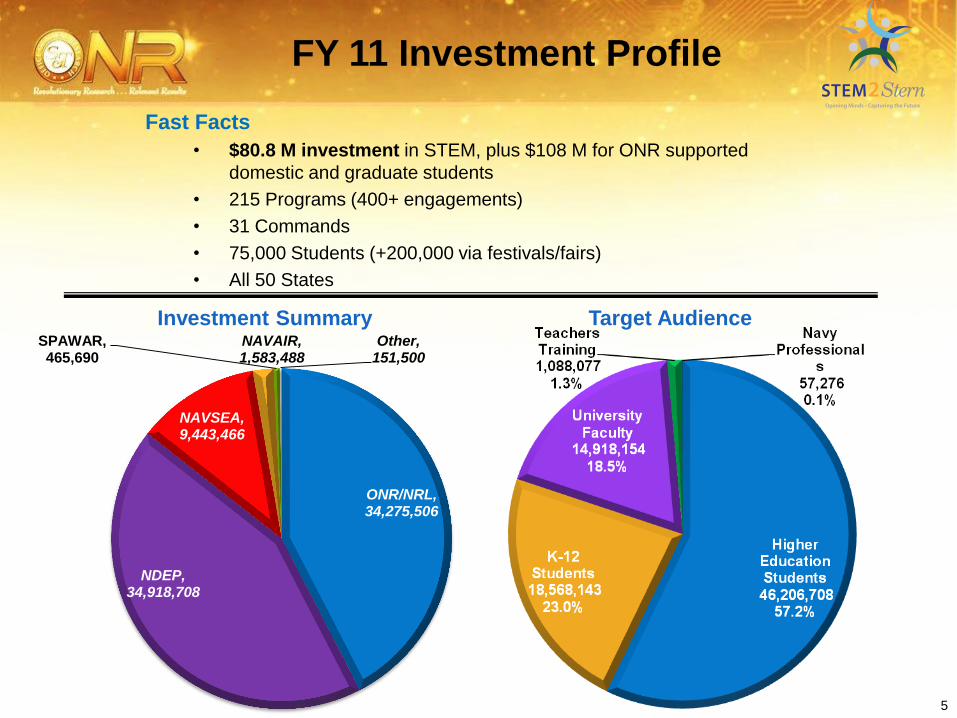
ONR/NRL, 34,275,506
NDEP, 34,918,708
NAVSEA, 9,443,466
NAVAIR, 1,583,488
SPAWAR, 465,690
Other, 151,500
FY 11 Investment Profile
Target Audience Investment Summary
Fast Facts
• $80.8 M investment in STEM, plus $108 M for ONR supported
domestic and graduate students
• 215 Programs (400+ engagements)
• 31 Commands
• 75,000 Students (+200,000 via festivals/fairs)
• All 50 States

6
STEM Landscape
Girls Only
Family Science
Science Fairs
iApps
Internships
Scholarships
Competitions
Co-ops
Internships
Scholarships
Fellowships
Scholarships
Fellowships
Young Investigator
Summer faculty
Levers
Pro
gra
ms
Exciting / Relevant
Competition
Mentoring
Social Networking
Funding / Support
Hands-on Experience
Fun
Interesting
Hands-on
Real-world
Family Involvement
Use of Near-Peers
Employment/Stability
Prestige
Relevance
Compelling Research
Opportunity to Publish
Inspire Engage Educate Employ
Internships
Robotics
Camps
Competitions
$19.7 M $15 M $46.2 M
PhD Masters Undergraduate High School Middle Elementary Faculty Research, Teacher
Training & Professional
Development
Metrics

7
Naval STEM Growth
5868
75
9099
111$63
$74
$82
$94
$105
$116
0
20
40
60
80
100
120
10/1/08-9/30/09
10/1/09-9/30/10
10/1/10-9/30/11
10/1/11-9/30/12
10/1/12-9/30/13
10/1/13-9/30/14
Total Dollars($M) Direct Navy ($M)A
SN
Taskin
g t
o O
NR
(N
OV
2009)
SE
CN
AV
Sp
eech
to
Do
ub
le (
MA
Y 2
010)
7
Double Direct Navy Investment per SECNAV &CNO Guidance
Students (K)
$54 $63
$75
Strong
Estimate To Meet Goal Actual Actual To Meet Goal To Meet Goal
$48
1 2 3 4 5
Currently in year 3 of SECNAV 5
Year Double Investment Plan
$86
$97

8
www.STEM2Stern.org
All Navy STEM programs are stored in database
in central location
•Active since 2009
•Capture all data in one place
•Stakeholders input program details
•Yearly data calls for program demographics
•Creates Navy-relevant STEM community on-line to
share best practices and problem solving

9
K-12 Signature Programs

10
SEAP
Science Engineering Apprenticeship Program
•High School Junior and Seniors
•Hands-on, experiential research internships at
Labs and Warfare Centers alongside scientists and
engineers.
•Research Abstract required at conclusion of
internship
Fast Facts:
• 215 Students
• 38%Female / 62% Male
• 21% Minority Participation
• $701,100 Annually
• 19 Locations
• At end of internship, 60% of interns interested
in Government S&E Career
• 60% alums pursuing STEM Education/Degree
• Program increased student interest in
pursuing a career in STEM
Overall Assessment
•Highly Selective – only 7% applicants selected to
participate
• Overall high satisfaction ratings from students and
mentors
• Intern work product adds significant value to Navy S&T
Ongoing Metrics and Assessment
• Track % students
•Return as interns or participate in other Naval STEM
programs
•Pursuing STEM Education/Degree
•Employed by Navy Labs
• No formal program review to date – slated for FY 2013
11
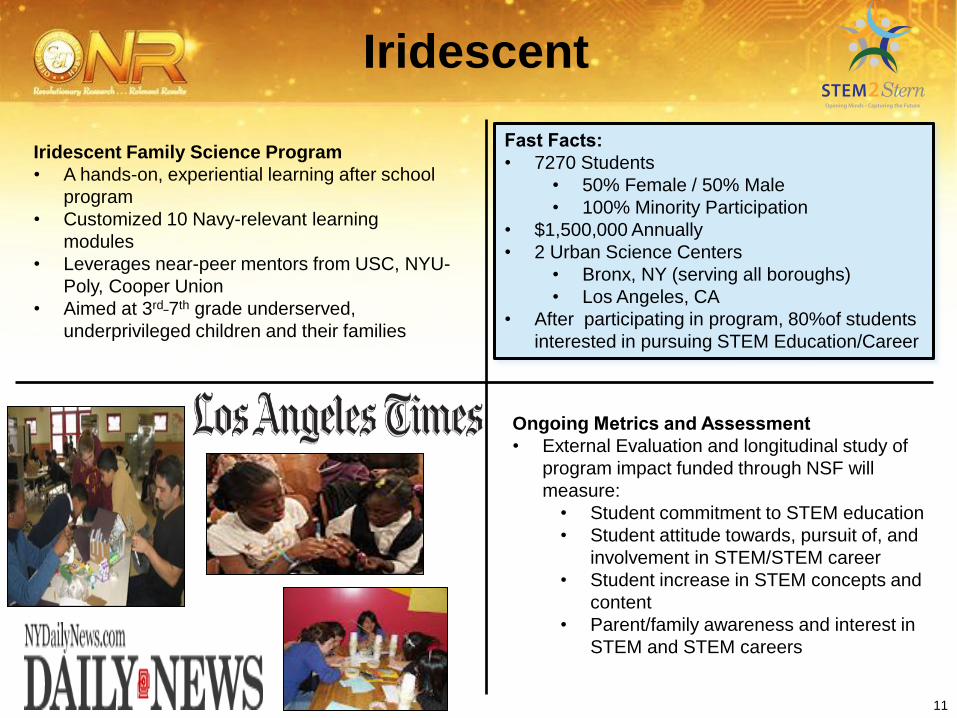
Iridescent
Iridescent Family Science Program
• A hands-on, experiential learning after school
program
• Customized 10 Navy-relevant learning
modules
• Leverages near-peer mentors from USC, NYU-
Poly, Cooper Union
• Aimed at 3rd 7th grade underserved,
underprivileged children and their families
Ongoing Metrics and Assessment
• External Evaluation and longitudinal study of
program impact funded through NSF will
measure:
• Student commitment to STEM education
• Student attitude towards, pursuit of, and
involvement in STEM/STEM career
• Student increase in STEM concepts and
content
• Parent/family awareness and interest in
STEM and STEM careers
Fast Facts:
• 7270 Students
• 50% Female / 50% Male
• 100% Minority Participation
• $1,500,000 Annually
• 2 Urban Science Centers
• Bronx, NY (serving all boroughs)
• Los Angeles, CA
• After participating in program, 80%of students
interested in pursuing STEM Education/Career
SATURDAY, MARCH 17, 2012

12
Technovation Challenge
Iridescent Technovation Challenge
• Entrepreneurial team competition for App
development for young women in HS
• Teams pitch their App and business plan to
panel of venture capitalists
• Winning App is professionally developed
and released
• Each team paired with a female graduate
or undergraduate student near-peer mentor
• Partnership with Google, Microsoft, LinkedIn,
MIT, Twitter
Fast Facts:
• 730 Students
• 100% Female
• 40% Minority Participation
• $850,000 Annually
• After participating in program, 80%of
students interested in pursuing STEM
Education/Career
• Locations in San Francisco Bay Area,
Boston, New York City
Ongoing Metrics and Assessment
•Longitudinal study of program impact funded
through NSF will measure:
• Student commitment to STEM education
• Student attitude towards, pursuit of, and
involvement in STEM/STEM career
• Student increase in STEM concepts and
content
• Parent/family awareness and interest in
STEM and STEM careers
13
YES! Program
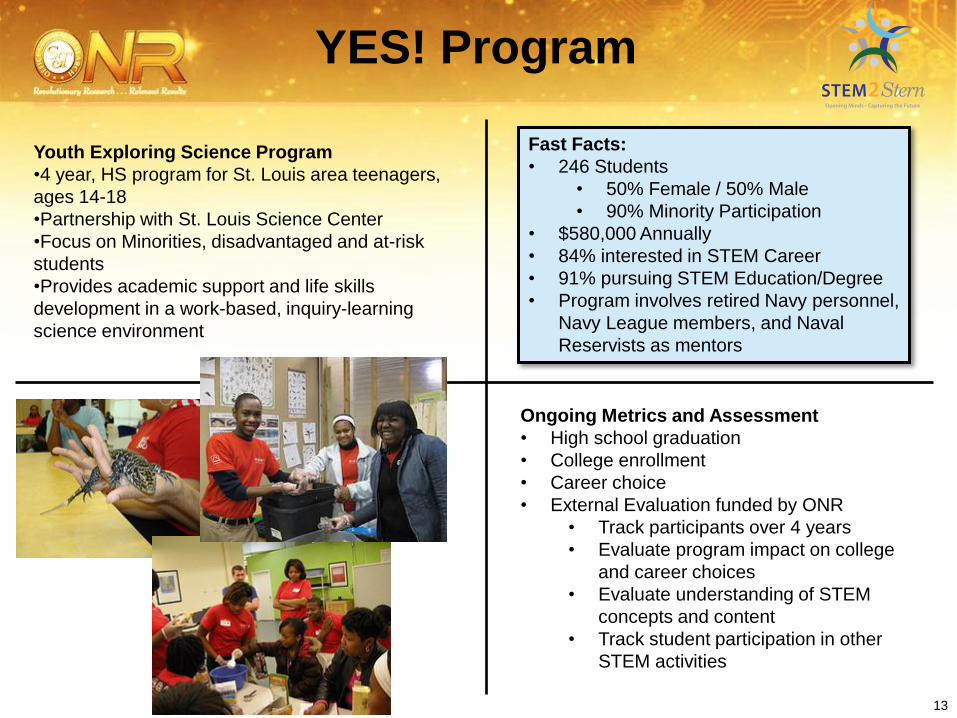
Youth Exploring Science Program
•4 year, HS program for St. Louis area teenagers,
ages 14-18
•Partnership with St. Louis Science Center
•Focus on Minorities, disadvantaged and at-risk
students
•Provides academic support and life skills
development in a work-based, inquiry-learning
science environment
Fast Facts:
• 246 Students
• 50% Female / 50% Male
• 90% Minority Participation
• $580,000 Annually
• 84% interested in STEM Career
• 91% pursuing STEM Education/Degree
• Program involves retired Navy personnel,
Navy League members, and Naval
Reservists as mentors
Ongoing Metrics and Assessment
• High school graduation
• College enrollment
• Career choice
• External Evaluation funded by ONR
• Track participants over 4 years
• Evaluate program impact on college
and career choices
• Evaluate understanding of STEM
concepts and content
• Track student participation in other
STEM activities
14
NMSI
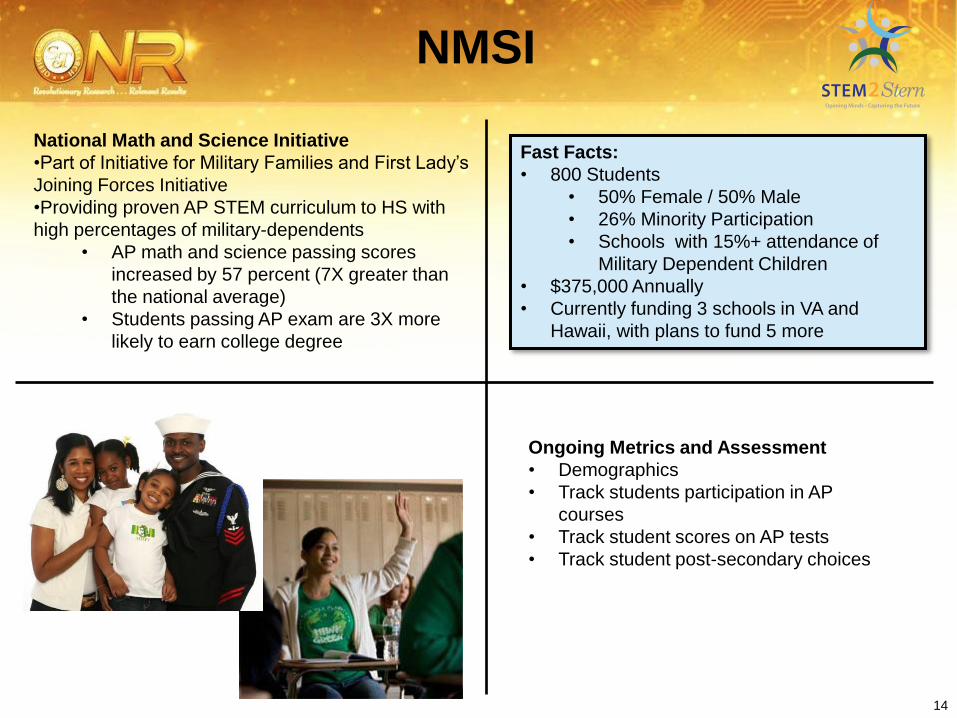
National Math and Science Initiative
•Part of Initiative for Military Families and First Lady’s
Joining Forces Initiative
•Providing proven AP STEM curriculum to HS with
high percentages of military-dependents
• AP math and science passing scores
increased by 57 percent (7X greater than
the national average)
• Students passing AP exam are 3X more
likely to earn college degree
Fast Facts:
• 800 Students
• 50% Female / 50% Male
• 26% Minority Participation
• Schools with 15%+ attendance of
Military Dependent Children
• $375,000 Annually
• Currently funding 3 schools in VA and
Hawaii, with plans to fund 5 more
Ongoing Metrics and Assessment
• Demographics
• Track students participation in AP
courses
• Track student scores on AP tests
• Track student post-secondary choices

15
SMU CSI Summer Camps •Week-long camps for middle school students
• Student learn the science and technology
behind Crime Scene Investigation through
hands-on activities
• Students attend presentations from law
enforcement and forensic scientists
•CSI-kits provided to teachers for replication of
camp activities in their classrooms
Ongoing Metrics and Assessment
•Pre- and post-program student perception
Survey
•Daily Student and Teacher Surveys
•Post-program Teacher Survey to
•Teacher Follow-up Survey
Fast Facts:
• 120 Students per summer
• 50% Male / 50% Female
• 66% Underserved Participation
• $560,000 Annually
• Includes training for 12 Middle School Teachers
• Indirect impact of 1,800 students per year
• CSI camp curriculum and materials free to public
• Posted on Kids Ahead and STEM-Works
websites, reaching over 50,000 visitors
each year
SMU CSI Summer Camp Program
16
Higher Education Signature Programs
17
NREIP
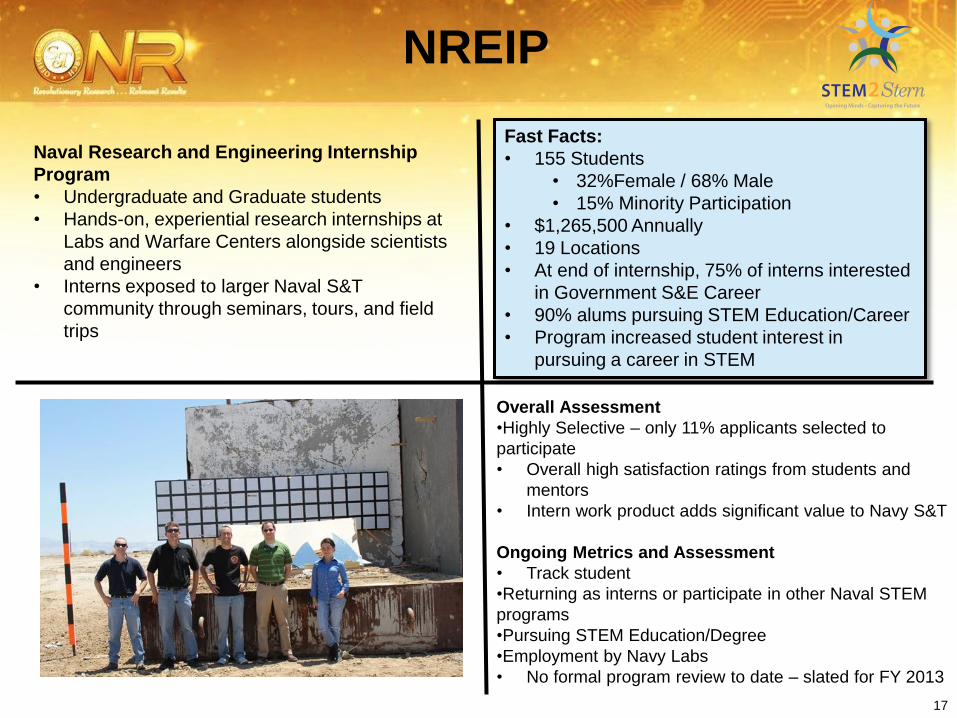
Naval Research and Engineering Internship
Program
• Undergraduate and Graduate students
• Hands-on, experiential research internships at
Labs and Warfare Centers alongside scientists
and engineers
• Interns exposed to larger Naval S&T
community through seminars, tours, and field
trips
Fast Facts:
• 155 Students
• 32%Female / 68% Male
• 15% Minority Participation
• $1,265,500 Annually
• 19 Locations
• At end of internship, 75% of interns interested
in Government S&E Career
• 90% alums pursuing STEM Education/Career
• Program increased student interest in
pursuing a career in STEM
Overall Assessment
•Highly Selective – only 11% applicants selected to
participate
• Overall high satisfaction ratings from students and
mentors
• Intern work product adds significant value to Navy S&T
Ongoing Metrics and Assessment
• Track student
•Returning as interns or participate in other Naval STEM
programs
•Pursuing STEM Education/Degree
•Employment by Navy Labs
• No formal program review to date – slated for FY 2013
18
NRL STEM Academy for
Minority Institutions
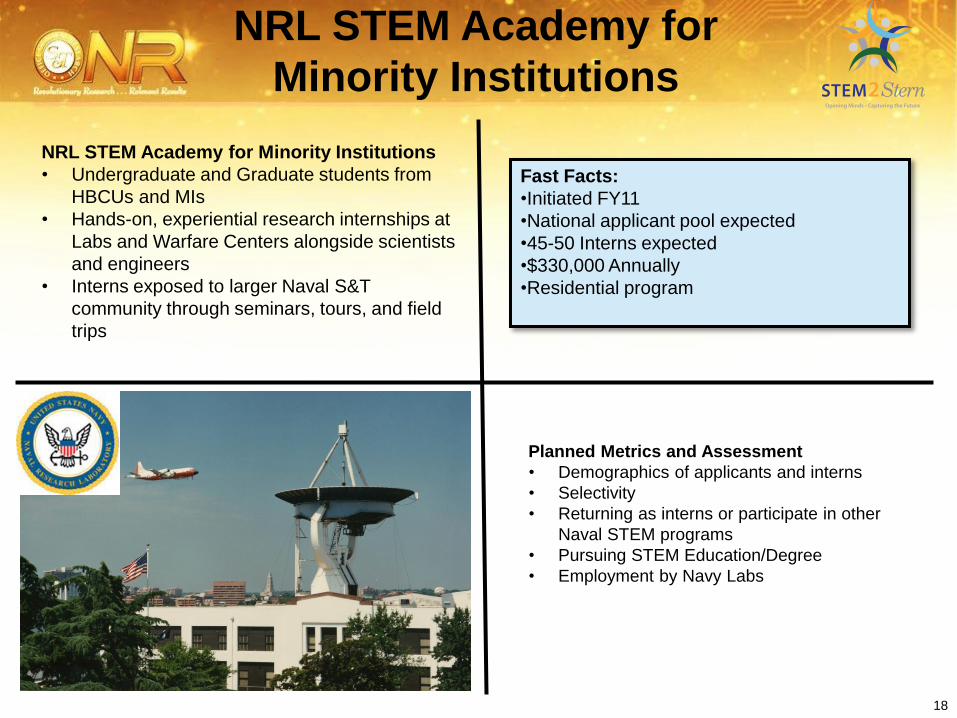
NRL STEM Academy for Minority Institutions
• Undergraduate and Graduate students from
HBCUs and MIs
• Hands-on, experiential research internships at
Labs and Warfare Centers alongside scientists
and engineers
• Interns exposed to larger Naval S&T
community through seminars, tours, and field
trips
Fast Facts:
•Initiated FY11
•National applicant pool expected
•45-50 Interns expected
•$330,000 Annually
•Residential program
Planned Metrics and Assessment
• Demographics of applicants and interns
• Selectivity
• Returning as interns or participate in other
Naval STEM programs
• Pursuing STEM Education/Degree
• Employment by Navy Labs
19
ULI
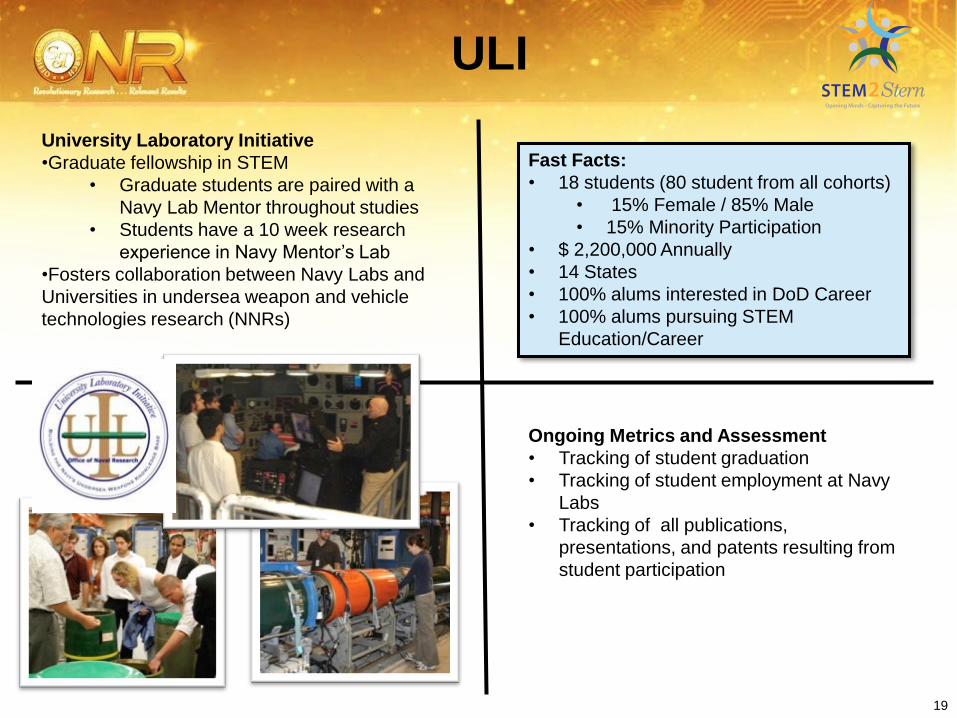
Fast Facts:
• 18 students (80 student from all cohorts)
• 15% Female / 85% Male
• 15% Minority Participation
• $ 2,200,000 Annually
• 14 States
• 100% alums interested in DoD Career
• 100% alums pursuing STEM
Education/Career
Ongoing Metrics and Assessment
• Tracking of student graduation
• Tracking of student employment at Navy
Labs
• Tracking of all publications,
presentations, and patents resulting from
student participation
University Laboratory Initiative
•Graduate fellowship in STEM
• Graduate students are paired with a
Navy Lab Mentor throughout studies
• Students have a 10 week research
experience in Navy Mentor’s Lab
•Fosters collaboration between Navy Labs and
Universities in undersea weapon and vehicle
technologies research (NNRs)

20
HBCU Tuskegee University MS
Systems Engineering Program
Fast Facts:
• 12 Students
• 47% female / 53% Male
• 100% Minority Participation
• Annually
• $2,300,000 from Section 852 Funds
• $600,000 from NAVSEA
Tuskegee University MS Systems Engineering
• Student awarded one-year scholarship for a
MS Systems Engineering with a 3 year work
commitment at NAVSEA
• Students exposed to a highly tailored MS of
Science Systems Engineering curriculum,
emphasizing Navy-relevant technologies
• Enhances Naval Lab workforce diversity
through active engagement with HBCU / MI
students and faculty
Overall Assessment
• 33 Graduates, now full time employees
• Employed by 6 Warfare Centers
• 97% completion rate (1 loss)
Ongoing Metrics and Assessment
• Demographics
• MS completion rate
• Work commitment completion rate
• Post-program student surveys
• Employee retention beyond obligated service

21
STEM Education &
Modeling
BHEF-Navy Modeling Project
•Partnership with the Navy will focus on retention of
STEM-interested students during first two years of
higher education
•Model will validate best practices to ensure
retention and identify pathways for students to
pursue careers with the Navy
•Model will provide an organized, comprehensive
approach to understanding the complex nature of
the Naval STEM workforce needs
Fast Facts:
• Initiated in FY12
• $300,000 Annually
• BHEF Membership includes
• Fortune 500 CEOs and executives
• University Presidents
• Select Government Leaders
• Model developed by Raytheon in 2009
• Tracks students from K-16 education
into STEM careers
• Free and available to public
Goals and Measures of Success
•Identify potential solutions to strengthen the
Navy’s STEM workforce
•Differentiate among the most effective
alternatives for Navy investments in STEM
education in grades 13-14
22
YIP
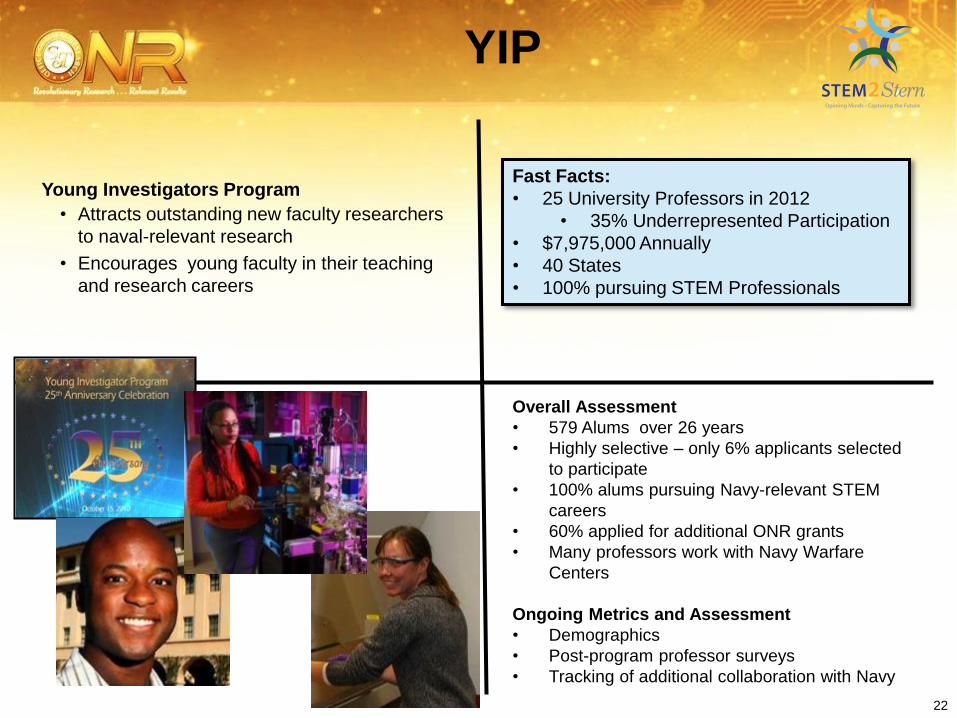
Young Investigators Program
• Attracts outstanding new faculty researchers
to naval-relevant research
• Encourages young faculty in their teaching
and research careers
Fast Facts:
• 25 University Professors in 2012
• 35% Underrepresented Participation
• $7,975,000 Annually
• 40 States
• 100% pursuing STEM Professionals
Overall Assessment
• 579 Alums over 26 years
• Highly selective – only 6% applicants selected
to participate
• 100% alums pursuing Navy-relevant STEM
careers
• 60% applied for additional ONR grants
• Many professors work with Navy Warfare
Centers
Ongoing Metrics and Assessment
• Demographics
• Post-program professor surveys
• Tracking of additional collaboration with Navy
23
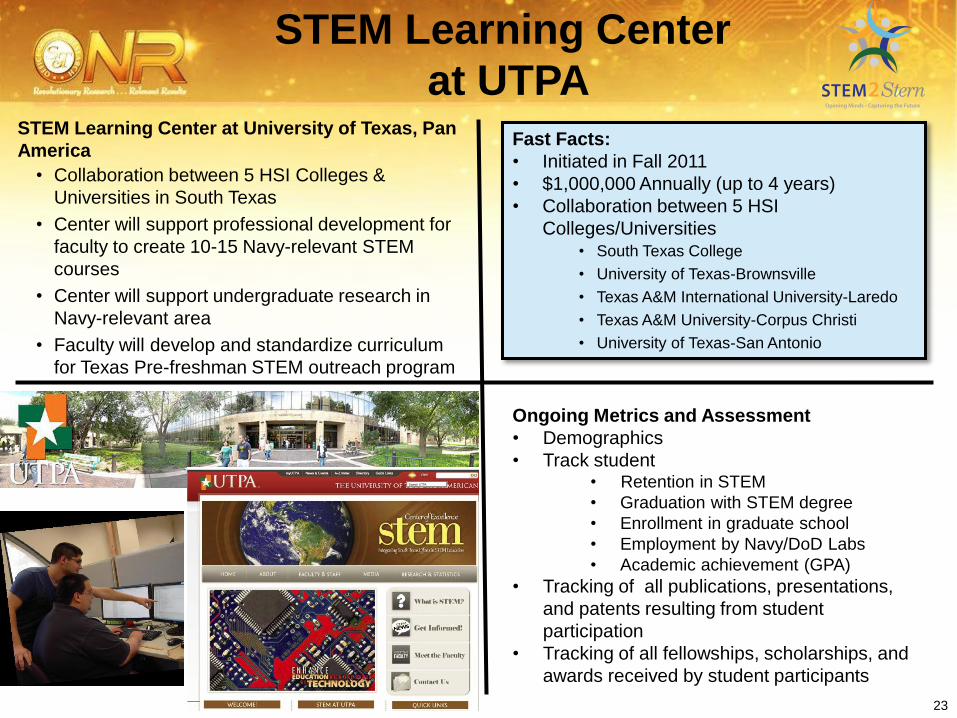
STEM Learning Center
at UTPA STEM Learning Center at University of Texas, Pan
America
• Collaboration between 5 HSI Colleges &
Universities in South Texas
• Center will support professional development for
faculty to create 10-15 Navy-relevant STEM
courses
• Center will support undergraduate research in
Navy-relevant area
• Faculty will develop and standardize curriculum
for Texas Pre-freshman STEM outreach program
Fast Facts:
• Initiated in Fall 2011
• $1,000,000 Annually (up to 4 years)
• Collaboration between 5 HSI
Colleges/Universities • South Texas College
• University of Texas-Brownsville
• Texas A&M International University-Laredo
• Texas A&M University-Corpus Christi
• University of Texas-San Antonio
Ongoing Metrics and Assessment
• Demographics
• Track student • Retention in STEM
• Graduation with STEM degree
• Enrollment in graduate school
• Employment by Navy/DoD Labs
• Academic achievement (GPA)
• Tracking of all publications, presentations,
and patents resulting from student
participation
• Tracking of all fellowships, scholarships, and
awards received by student participants

24
Tools and Resources
Gooru • Gooru is an on-line STEM resource,
organizing free, online education resources
into searchable collections
• Helps students and teachers find high-
quality STEM education resources on-
line
• Accessible from any web or mobile platform
• $1,000,000 Annually
Digital Tutor Grand Challenge
•$8,000,000 Grand Challenge issued at Naval STEM
Forum in June 2011
• Phase I: Develop intelligent tool focused on
middle school STEM course
• Phase II: Transition this tool back to Navy in
form of STEM literacy tool for new recruits
•Phase I Grand Challenge Award Winners:
• University of Memphis
• Arizona State University
• University of Massachusetts
• Raytheon BBN Technologies

25
Media Coverage
.…an
d m
an
y
m
ore
26
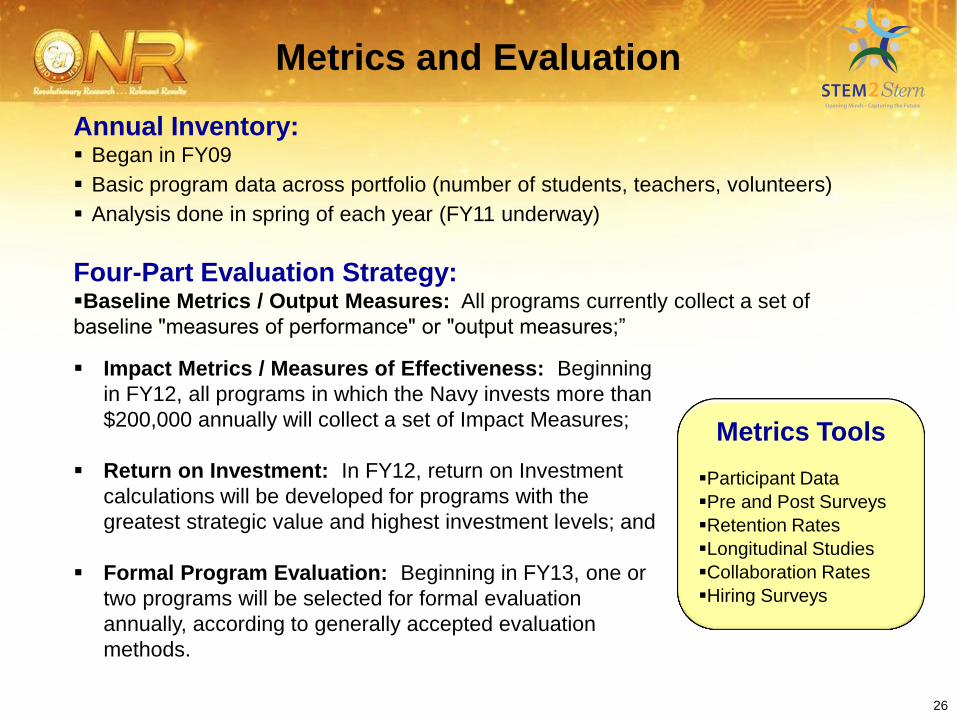
Annual Inventory: Began in FY09
Basic program data across portfolio (number of students, teachers, volunteers)
Analysis done in spring of each year (FY11 underway)
Four-Part Evaluation Strategy: Baseline Metrics / Output Measures: All programs currently collect a set of
baseline "measures of performance" or "output measures;”
Metrics Tools
Participant Data
Pre and Post Surveys
Retention Rates
Longitudinal Studies
Collaboration Rates
Hiring Surveys
Metrics and Evaluation
Impact Metrics / Measures of Effectiveness: Beginning
in FY12, all programs in which the Navy invests more than
$200,000 annually will collect a set of Impact Measures;
Return on Investment: In FY12, return on Investment
calculations will be developed for programs with the
greatest strategic value and highest investment levels; and
Formal Program Evaluation: Beginning in FY13, one or
two programs will be selected for formal evaluation
annually, according to generally accepted evaluation
methods.