EDGES M MASSACHUSETTS INSTITUTE OF TECHNOLOGY HAYSTACK ... · EDGES measurements EDGES measurements...
14
1 EDGES MEMO #052 MASSACHUSETTS INSTITUTE OF TECHNOLOGY HAYSTACK OBSERVATORY WESTFORD, MASSACHUSETTS 01886 November 9, 2009 Telephone: 781-981-5407 Fax: 781-981-0590 To: EDGES Group From: Alan E.E. Rogers and Judd D. Bowman Subject: Measurements of the spectrum from 80 to 200 MHz in the Catlow Valley, Oregon Introduction Using the FCC database and a propagation model Radio-Locator.com (formerly the MIT list of Radio Stations on the Internet) made the map of the integrated received power of the FM band shown in Figure 1. This map predicts a minimum FM strength in the region of the Catlow Valley in Oregon bounded by the small towns of Plush and Adel to the west, Frenchglen to the north and Fields to the south as shown in Figure 2. FM radio reception FM radio reception, based on the car radio, was used as the first indicator of the potential radio quietness of a site. Within the Catlow Valley region we found that continuous reception of any FM station was not possible. Typically a few stations might be sporadically received well enough to catch the occasional word or musical phrase. We judged this reception to be the result of several diffracted and reflected paths with total strength varying on a time scale of seconds as the refraction along the paths changes. Sometimes, the signals were stronger for a few minutes. In this case we were often able to identify the aircraft which was likely to be adding a more significant path as it became mutually visible to us and the FM transmitter. Even less frequently there was a short burst of greatly increased signal on a time scale of less than half a second. Typically this occurred on a time scale of many tens of minutes and was thought to be due to a micrometeor generating a short lived ionized cloud from which the FM signals were being reflected. We noted that the FM reception was stronger in the region south of the Fields, the Alvord desert and even in Frenchglen which is to the east of the Catlow Valley. As a result we only measured the spectrum using the EDGES system at the locations in the Catlow Valley indicated on Figure 2 and at one location in a canyon on highway 205 entering the Catlow Valley. EDGES measurements EDGES measurements were made using the AC240 spectrometer with added “out of band noise” as described in EDGES memo # 51 . An EDGES antenna was deployed on a ~75 m LMR-240 ultraflex cable from the rear of the car. The AC240, monitor and EDGES electronics was powered from the car battery using a DC to AC converter. Owing to a concern of blowing the vehicle outlet fuse we used jumper clips direct to the
Transcript of EDGES M MASSACHUSETTS INSTITUTE OF TECHNOLOGY HAYSTACK ... · EDGES measurements EDGES measurements...
1
EDGES MEMO #052 MASSACHUSETTS INSTITUTE OF TECHNOLOGY
HAYSTACK OBSERVATORY WESTFORD, MASSACHUSETTS 01886
November 9, 2009 Telephone: 781-981-5407 Fax: 781-981-0590 To: EDGES Group
From: Alan E.E. Rogers and Judd D. Bowman
Subject: Measurements of the spectrum from 80 to 200 MHz in the Catlow Valley, Oregon
Introduction
Using the FCC database and a propagation model Radio-Locator.com (formerly the MIT list of Radio Stations on the Internet) made the map of the integrated received power of the FM band shown in Figure 1. This map predicts a minimum FM strength in the region of the Catlow Valley in Oregon bounded by the small towns of Plush and Adel to the west, Frenchglen to the north and Fields to the south as shown in Figure 2.
FM radio reception
FM radio reception, based on the car radio, was used as the first indicator of the potential radio quietness of a site. Within the Catlow Valley region we found that continuous reception of any FM station was not possible. Typically a few stations might be sporadically received well enough to catch the occasional word or musical phrase. We judged this reception to be the result of several diffracted and reflected paths with total strength varying on a time scale of seconds as the refraction along the paths changes. Sometimes, the signals were stronger for a few minutes. In this case we were often able to identify the aircraft which was likely to be adding a more significant path as it became mutually visible to us and the FM transmitter. Even less frequently there was a short burst of greatly increased signal on a time scale of less than half a second. Typically this occurred on a time scale of many tens of minutes and was thought to be due to a micrometeor generating a short lived ionized cloud from which the FM signals were being reflected.
We noted that the FM reception was stronger in the region south of the Fields, the Alvord desert and even in Frenchglen which is to the east of the Catlow Valley. As a result we only measured the spectrum using the EDGES system at the locations in the Catlow Valley indicated on Figure 2 and at one location in a canyon on highway 205 entering the Catlow Valley.
EDGES measurements
EDGES measurements were made using the AC240 spectrometer with added “out of band noise” as described in EDGES memo # 51 . An EDGES antenna was deployed on a ~75 m LMR-240 ultraflex cable from the rear of the car. The AC240, monitor and EDGES electronics was powered from the car battery using a DC to AC converter. Owing to a concern of blowing the vehicle outlet fuse we used jumper clips direct to the

2
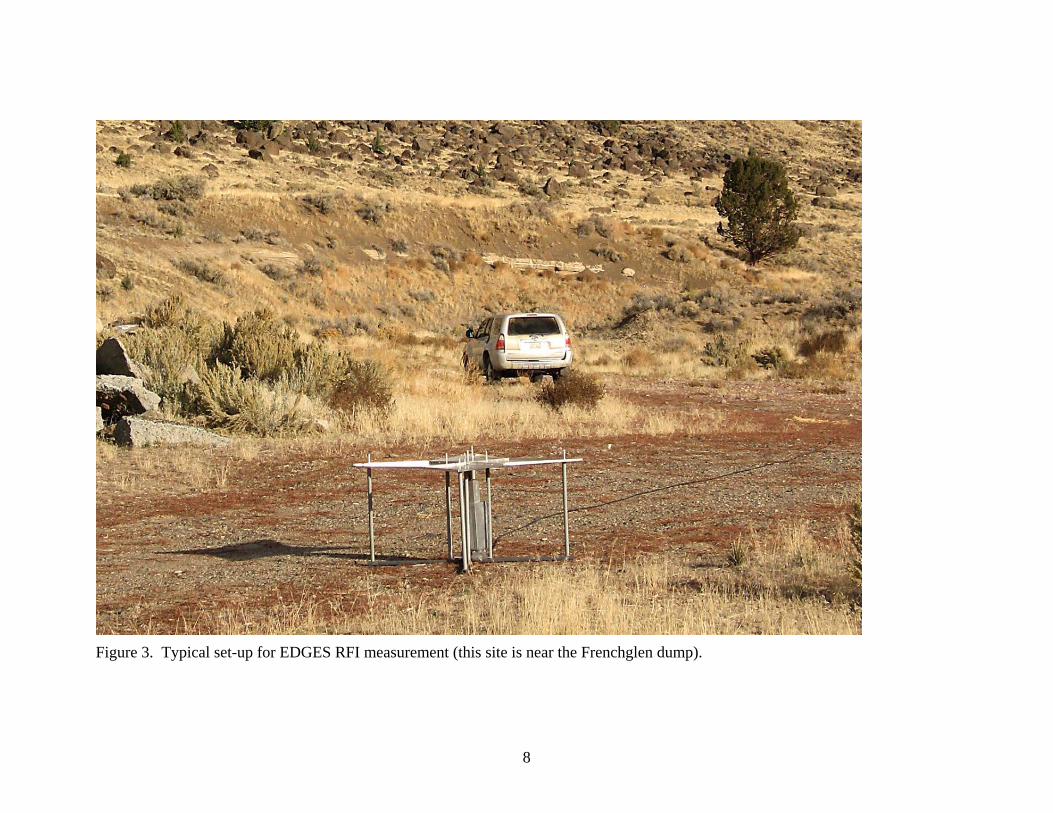
battery. To reduce the weight of EDGES for this exploratory work the AC240 was not shielded. The result is that there is some leakage from the AC240/pc at 166.667 MHz which is picked up by the antenna. To minimize the broadband RFI we shut off the monitor during the measurements but the inverter and AC240/PC may still have contributed a small amount of noise. However, we judged this to be insignificant in the relatively short approximately 10 minute integration at each site. The EDGES antenna was run without a ground screen which results in about 3 dB attenuation of the sky noise. Figure 3 shows a photo of the set-up typical of the measurements made at the sites listed in Table 1.
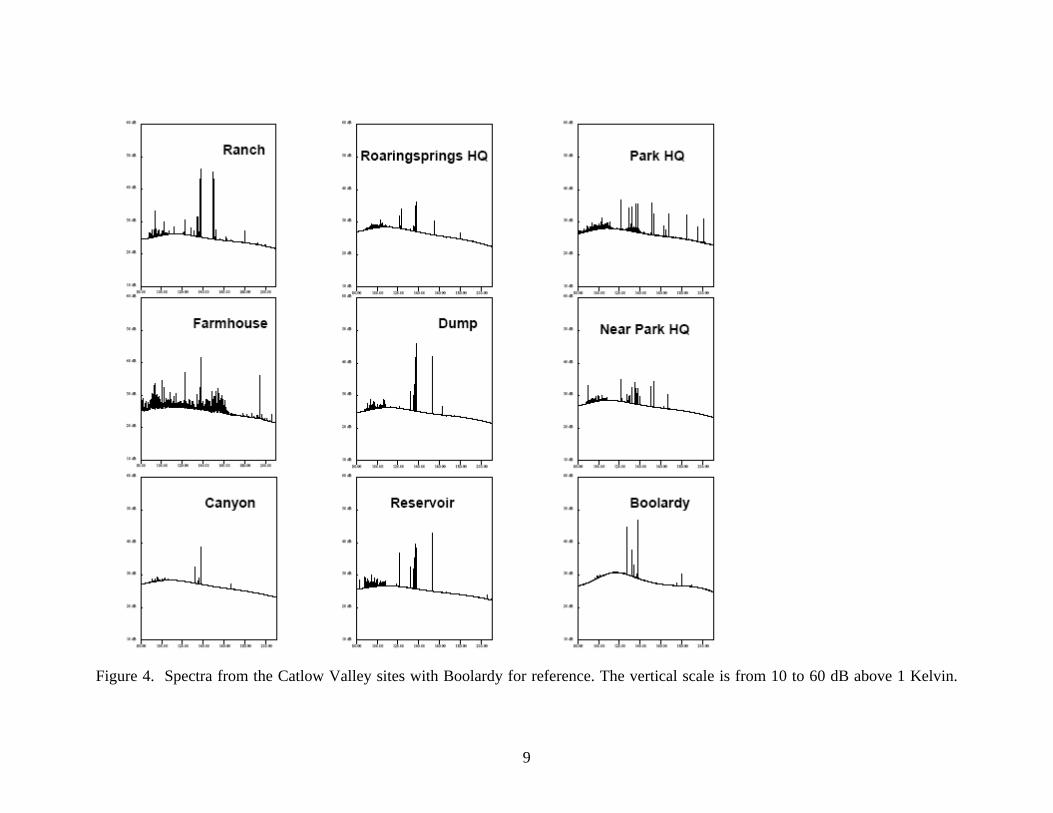
Figure 4 shows the spectra from the 8 sites along with a spectrum from Boolardy on a long scale. In some cases a portion of the integration with a strong transient has been removed. Figure 5 shows a waterfall plot. We noted that the spectrum shown in Figure 6 for a portion of the time when the FM spectrum was not “lit up” by a micrometeor is relatively clean.
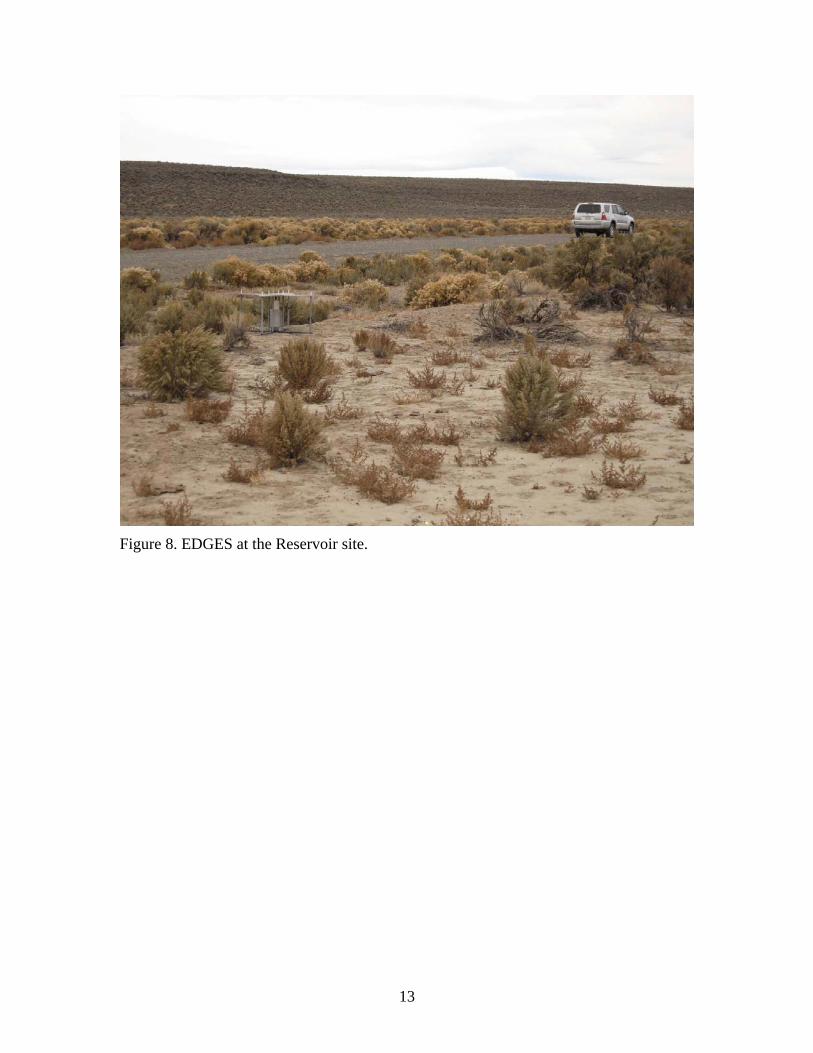
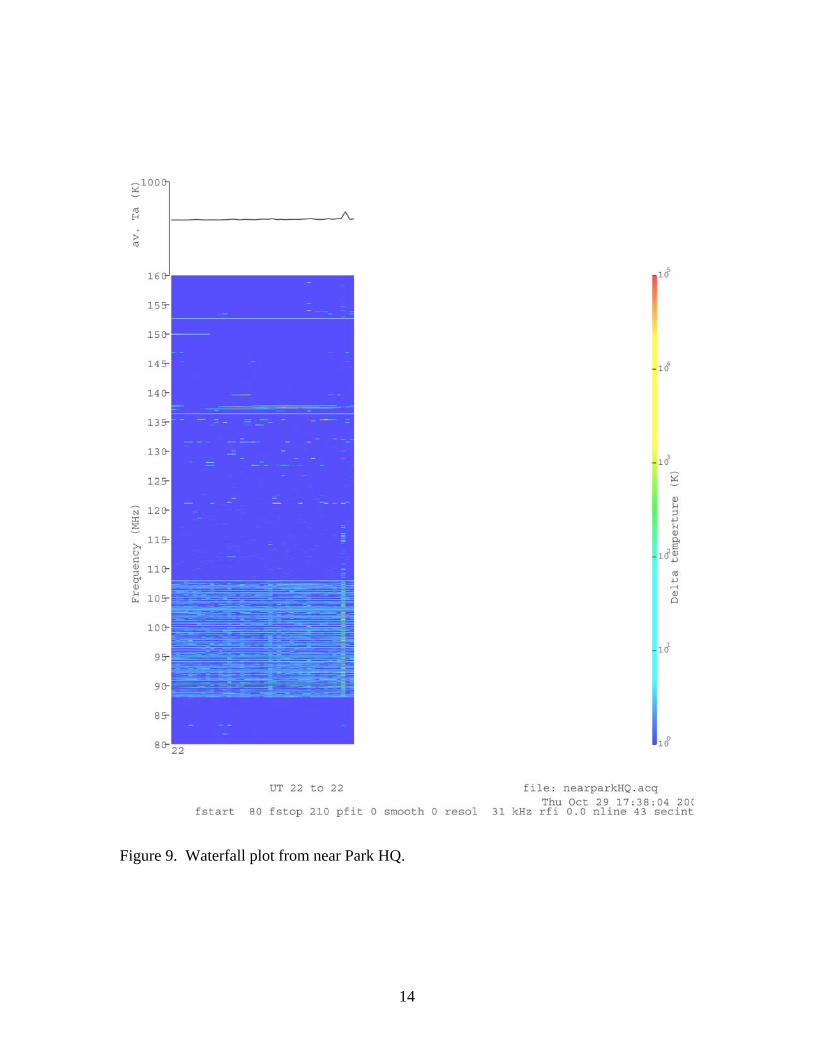
Figure 7 shows the “Canyon” location. Figure 8 shows the typical ground cover in much of the valley. Figure 9 shows a waterfall plot from near the Park headquarters. When outside the Canyon the FM stations, evident in the plot, are present at a low level virtually all the time.
3
Location Lat Long Hgt (ft) Av. FM (dB) Power line noise
Notes
Ranch 42.60343 -118.96157 +4 N
Farmhouse 42.45181 -118.86599 4637 +4 Y 1
Canyon 42.35608 -118.85197 4804 ~+0.5 N
RoaringSprings HQ 42.65335 -118.98995 4500 ~+0.8 N
Dump 42.81807 -118.95876 4673 ~+1.0 N
Reservoir 42.68282 -119.32791 4666 ~+4 N
HartMtn.Park HQ 42.54899 -119.65591 5611 ~+3 N 2,3,4
Near Park HQ ~+2 N 5
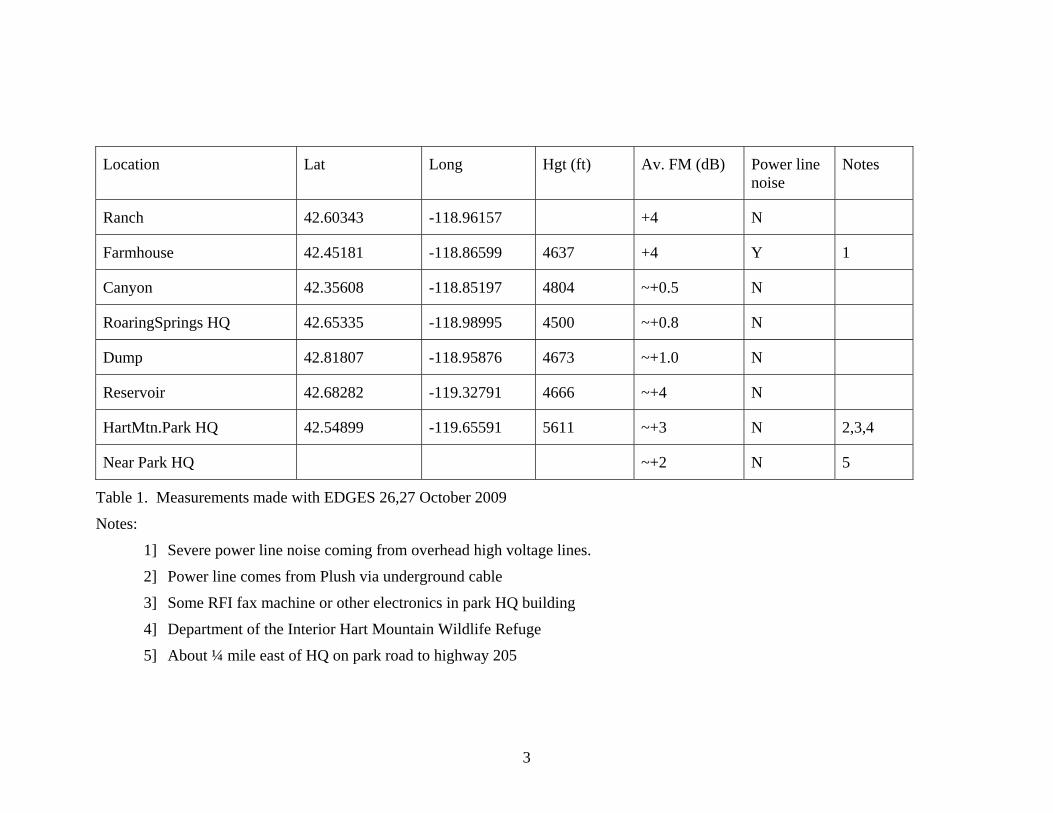
Table 1. Measurements made with EDGES 26,27 October 2009
Notes:
1] Severe power line noise coming from overhead high voltage lines.
2] Power line comes from Plush via underground cable
3] Some RFI fax machine or other electronics in park HQ building
4] Department of the Interior Hart Mountain Wildlife Refuge
5] About ¼ mile east of HQ on park road to highway 205
4
Comments on FM propagation models
The models of radio-locator and fm-fool (part of tv-fool.com) are not accurately known but are most likely based on the EIRP of the FM transmitter, using a single path profile to an isotropic antenna in a plane passing through the transmitter, receiver and Earth center. The profile which accounts for the Earth’s curvature also includes the loss of up to 2 knife edge diffractions.
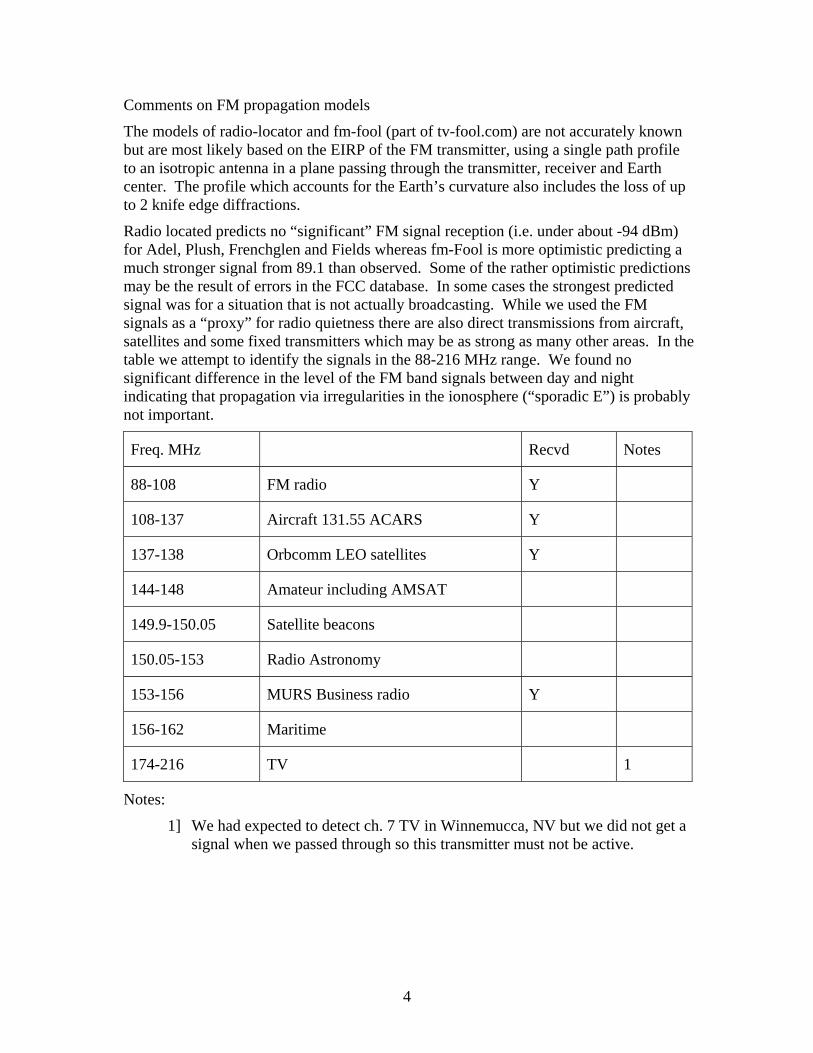
Radio located predicts no “significant” FM signal reception (i.e. under about -94 dBm) for Adel, Plush, Frenchglen and Fields whereas fm-Fool is more optimistic predicting a much stronger signal from 89.1 than observed. Some of the rather optimistic predictions may be the result of errors in the FCC database. In some cases the strongest predicted signal was for a situation that is not actually broadcasting. While we used the FM signals as a “proxy” for radio quietness there are also direct transmissions from aircraft, satellites and some fixed transmitters which may be as strong as many other areas. In the table we attempt to identify the signals in the 88-216 MHz range. We found no significant difference in the level of the FM band signals between day and night indicating that propagation via irregularities in the ionosphere (“sporadic E”) is probably not important.
Freq. MHz Recvd Notes
88-108 FM radio Y
108-137 Aircraft 131.55 ACARS Y
137-138 Orbcomm LEO satellites Y
144-148 Amateur including AMSAT
149.9-150.05 Satellite beacons
150.05-153 Radio Astronomy
153-156 MURS Business radio Y
156-162 Maritime
174-216 TV 1
Notes:
1] We had expected to detect ch. 7 TV in Winnemucca, NV but we did not get a signal when we passed through so this transmitter must not be active.
5
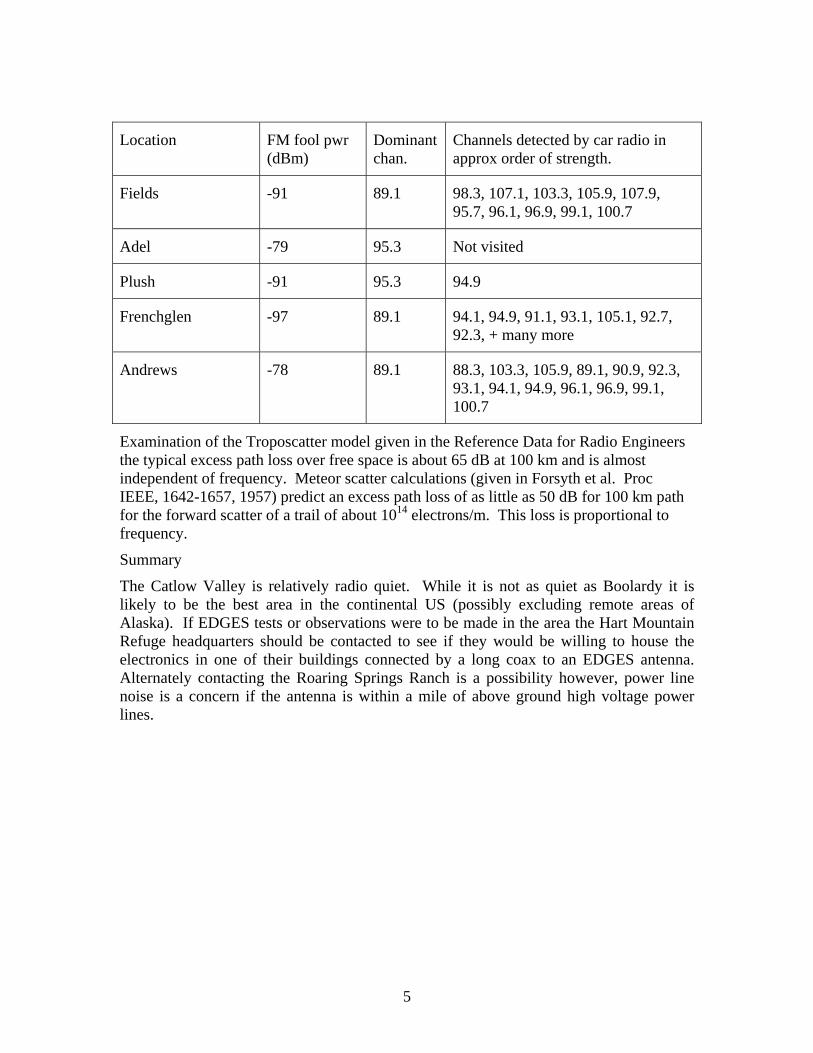
Location FM fool pwr (dBm)
Dominant chan.
Channels detected by car radio in approx order of strength.
Fields -91 89.1 98.3, 107.1, 103.3, 105.9, 107.9, 95.7, 96.1, 96.9, 99.1, 100.7
Adel -79 95.3 Not visited
Plush -91 95.3 94.9
Frenchglen -97 89.1 94.1, 94.9, 91.1, 93.1, 105.1, 92.7, 92.3, + many more
Andrews -78 89.1 88.3, 103.3, 105.9, 89.1, 90.9, 92.3, 93.1, 94.1, 94.9, 96.1, 96.9, 99.1, 100.7
Examination of the Troposcatter model given in the Reference Data for Radio Engineers the typical excess path loss over free space is about 65 dB at 100 km and is almost independent of frequency. Meteor scatter calculations (given in Forsyth et al. Proc IEEE, 1642-1657, 1957) predict an excess path loss of as little as 50 dB for 100 km path for the forward scatter of a trail of about 1014 electrons/m. This loss is proportional to frequency.
Summary
The Catlow Valley is relatively radio quiet. While it is not as quiet as Boolardy it is likely to be the best area in the continental US (possibly excluding remote areas of Alaska). If EDGES tests or observations were to be made in the area the Hart Mountain Refuge headquarters should be contacted to see if they would be willing to house the electronics in one of their buildings connected by a long coax to an EDGES antenna. Alternately contacting the Roaring Springs Ranch is a possibility however, power line noise is a concern if the antenna is within a mile of above ground high voltage power lines.

6
Figure 1.

7
Figure 2. Arrows show the location of areas where EDGES data was taken.
8
Figure 3. Typical set-up for EDGES RFI measurement (this site is near the Frenchglen dump).
9
Figure 4. Spectra from the Catlow Valley sites with Boolardy for reference. The vertical scale is from 10 to 60 dB above 1 Kelvin.

10
Figure 5. Waterfall plot from Canyon site.

11
80.00 100.00 120.00 140.00 160.00 180.00 200.00
-45 K
57 K
158 K
259 K
360 K
461 K
562 K
663 K
764 K
866 K
freq(MHZ) file: temp.acqUT 00 to 24
fstart 80 fstop 210 pfit 0 smooth 0 resol 31 kHz rfi 0.0 int 2 20 sec
Figure 6. Spectrum in Canyon during “quiet” period. Note that the scale is linear in degrees Kelvin. The loss of signal below about 110 MHz is due to antenna mismatch.

12
Figure 7. EDGES being set-up to take data in the Canyon on route 205.
13
Figure 8. EDGES at the Reservoir site.
14
Figure 9. Waterfall plot from near Park HQ.

![Semantic Filtering - Hacettepe Üniversitesierkut/cmp717.s18/materials/w05... · Imperfect confidence measurements around texture edges Apply a Median Filter[1] to the input image](https://static.fdocuments.net/doc/165x107/605e7abae7143b0fba6bad0c/semantic-filtering-hacettepe-oeniversitesi-erkutcmp717s18materialsw05.jpg)