Edge based stochastic block model statistical inference
13
HAL Id: hal-03340026 https://hal.archives-ouvertes.fr/hal-03340026 Submitted on 9 Sep 2021 HAL is a multi-disciplinary open access archive for the deposit and dissemination of sci- entific research documents, whether they are pub- lished or not. The documents may come from teaching and research institutions in France or abroad, or from public or private research centers. L’archive ouverte pluridisciplinaire HAL, est destinée au dépôt et à la diffusion de documents scientifiques de niveau recherche, publiés ou non, émanant des établissements d’enseignement et de recherche français ou étrangers, des laboratoires publics ou privés. Edge based stochastic block model statistical inference Louis Duvivier, Rémy Cazabet, Céline Robardet To cite this version: Louis Duvivier, Rémy Cazabet, Céline Robardet. Edge based stochastic block model statistical in- ference. International Conference on Complex Networks and Their Applications, pp.462-473, 2021, 10.1007/978-3-030-65351-4_37. hal-03340026
Transcript of Edge based stochastic block model statistical inference

HAL Id: hal-03340026https://hal.archives-ouvertes.fr/hal-03340026
Submitted on 9 Sep 2021
HAL is a multi-disciplinary open accessarchive for the deposit and dissemination of sci-entific research documents, whether they are pub-lished or not. The documents may come fromteaching and research institutions in France orabroad, or from public or private research centers.
L’archive ouverte pluridisciplinaire HAL, estdestinée au dépôt et à la diffusion de documentsscientifiques de niveau recherche, publiés ou non,émanant des établissements d’enseignement et derecherche français ou étrangers, des laboratoirespublics ou privés.
Edge based stochastic block model statistical inferenceLouis Duvivier, Rémy Cazabet, Céline Robardet
To cite this version:Louis Duvivier, Rémy Cazabet, Céline Robardet. Edge based stochastic block model statistical in-ference. International Conference on Complex Networks and Their Applications, pp.462-473, 2021,10.1007/978-3-030-65351-4_37. hal-03340026

Edge based stochastic block model statisticalinference
Louis Duvivier1, Remy Cazabet2, and Celine Robardet1
1 Univ Lyon, INSA Lyon, CNRS, LIRIS UMR5205, F-69621 [email protected], [email protected],
2 Univ Lyon, Universite Lyon 1, CNRS, LIRIS UMR5205, F-69622 [email protected]
Abstract. Community detection in graphs often relies on ad hoc algo-rithms with no clear specification about the node partition they define asthe best, which leads to uninterpretable communities. Stochastic blockmodels (SBM) offer a framework to rigorously define communities, andto detect them using statistical inference method to distinguish structurefrom random fluctuations. In this paper, we introduce an alternative def-inition of SBM based on edge sampling. We derive from this definition aquality function to statistically infer the node partition used to generatea given graph. We then test it on synthetic graphs, and on the zacharykarate club network.
Keywords: community, stochastic block model, statistical inference
1 Introduction
Since the introduction of modularity by Girvan and Newman [1], it has beenshown that many networks coming from scientific domain as diverse as sociol-ogy, biology and computer science exhibit a modular structure [2], in the sensethat their nodes can be partitioned in groups characterized by their connectivity.Yet, there is no universal definition of a community. Many techniques and algo-rithms have been developed for detecting remarkable node partition in graphs,most of the time by optimizing a quality function which assigns a score to anode partition [1], [3], [4]. The problem is that these algorithms rarely accountfor random fluctuations and it is thus impossible to say if the communities ob-tained reflect a real property of the graph under study or are just an artefact. Inparticular, it has been shown that even the very popular modularity may findcommunities in random graphs [5].
Stochastic block models offer a theoretical framework to take into accountrandom fluctuations while detecting communities [6]. Since they are probabilisticgenerative models, one can perform statistical inference in order to find the mostprobable model used to generate a given observed graph. The most common wayto do this inference is to associate to each SBM the set of graphs it may generate:the larger the set, the smaller the probability to generate each of them [7], [8].This methodology based on the minimization of entropy has the strength of

2 Louis Duvivier et al.
being rigorously mathematically grounded. Yet it suffers from one drawback: asit considers probability distributions on graph ensembles, the random variableconsidered is the whole graph. Thus statistical inference is performed on a singlerealization, which leads to overfitting. Although techniques have been introducedto mitigate this effect, it cannot be totally eliminated and it induces counter-intuitive behavior in some tricky situations [9].
In this paper, we propose a new quality function for node partitions, basedon stochastic block models defined as probability distributions on a set of edges.This allows us to use statistical inference method in a more relevant way, relyingon several realizations of the same random variable. To do so, we first define anedge-based stochastic block model, then use minimum description length method[10] to infer its parameters from an observed graph. Finally, we test this qualityfunction on synthetic graphs, plus the Zachary Karate Club network.
2 Methodology presentation
Traditionally, a stochastic block model is defined as a couple (B,M), with B apartition of the set of nodes [1, n] in p blocks b1, . . . , bp, and M a p×p block adja-cency matrix whose entries correspond to the number of edges between any twoblocks (or equivalently to the density). These parameters define a set of genera-ble graphs ΩB,M from which graphs are sampled according to some probabilitydistribution. As the probability distribution is defined on a set of graphs, we callthe stochastic block models defined in this way generative models of graphs.
In this paper, we will consider stochastic block models as generative modelsof edges. It also takes as parameters a set of nodes V = [1, n] partitioned in pblocks B = b1, . . . , bp, but instead of a block adjacency matrix, it relies on ap× p block probability matrix M such that:
– ∀i, j,M [i, j] ∈ [0, 1]–∑i,jM [i, j]× |bi||bj | = 1
For a given partition B, the set of all matrices verifying those conditionswill be denoted Mat(B). Given two nodes u and v, belonging respectively tothe block bi and bj , the edge u → v is generated with probability PB,M [u, v] =M [i, j]. This probability distribution can be seen as a block-constant n × nmatrix, and in the following, the notation PB,M will refer indifferently to theprobability distribution and to the corresponding matrix. We will also denoteby Prob mat(B) the set of all B-constant edge probability matrices on [1, n]2,defined as:
Prob mat(B) = P | ∃MP ∈ Mat(B), P = PB,MP (1)
Generating a graph G = (V,E) made of m edges e1, . . . , em with such agenerative model of edges means generating each of its edges independently.Thus, G is generated with probability:
PB,M [G] =
m∏i=1
PB,M [ei]
Edge based stochastic block model statistical inference 3
In particular, this means that the same edge u → v can be sampled more thanonce, so for the rest of the paper we will work with multigraphs. To simplifycomputations, we will consider directed graphs with self-loops. In practice, westudy a graph G made of a set of vertices V = [1, n] and a list E of m edges:e1 = u1 → v1, . . . , em = um → vm. We suppose that G was generated by astochastic block model (B0,M0), thus that all edges in E were independentlysampled from the same probability distribution PB0,M0
, and our objective is toidentify the original parameters B0 and M0 used to generate G.
To do so, we rely on the minimum description length principle. This prin-ciple, borrowed from information theory, relies on the fact that any statisticalregularity can be used for compression. Therefore, the quality of a statisticalmodel can be measured by the compression it allows of the data under study.Let’s give an example: Alice draws messages independently at random from aset Ω, with a probability distribution P and she transmits them to Bob througha binary channel. Each message needs to be encoded through a coding patternC : Ω → 0, 1. For any message x ∈ Ω, we denote by |C(x)| the length of itscode. The expected length of the encoded message will then be:
Ex∈Ω
[|C(x)|] =∑x∈Ω
P[x] · |C(x)|
It can be shown that this expected value is minimum when C is such that∀x, |C(x)| = −log2(P[x]), and in this case, the previous expression is called theentropy of P. This result means that finding an optimal code C∗ and findingthe original probability distribution P are the same problem, because: P[u, v] =2−|C
∗[u,v]|. This is what we will use to recover PB0,M0.
Let’s suppose that Alice does not know P, but that she can draw as manyrandom messages as she wants from Ω. Then, for any probability distribution Qon Ω, she can define a code CQ, under which the mean length of the messagese1, . . . , em transmitted will be:
code len(e1, . . . , em, CQ) = −∑x∈Ω
#k | ek = xm
· log2(Q[x]) (2)
And, as we know that #k|ek=xm −→
m→∞P[x] because of the law of great num-
bers, it means that if m is high enough, the best code C∗ will correspond to adistribution Q which will be a good approximation of P.
In our case, the messages to be transmitted are the edges of G: e1, . . . , em,drawn from the set [1, n]2 with the probability distribution PB0,M0
. We wantto approximate this distribution, to deduce B0 and M0 from it, but to avoidoverfitting, we do not minimize the encoding length of all edges e1, . . . , em atthe same time, we consider them sequentially. It corresponds to a situation inwhich Alice observes the edges one at a time and transmits them right away,updating her code on the fly. At the other end, Bob updates his code in the sameway. When Alice draws the xth edge, Bob only knows edges e1, . . . ex−1, so theyoptimize their code on this limited sample. For the remaining m − x edges, as

4 Louis Duvivier et al.
they have no information, they suppose they are random. Finally, as they knowthat edges are generated by a stochastic block model, they limit themselves tocodes based on B-constant probability distributions, for some partition B. ThusQB,x is defined as:
argminQ∈Prob mat(B)
x · code len(e1, . . . , ex,Q)
m−
∑u,v∈[1,n]
(m− x)
m · n2· log2(Q[u, v])
And the mean code length of the messages sent from Alice to Bob will be:
code len(E,B) = − 1
m
m∑x=1
log2(QB,x−1[ex]) (3)
Of course, it depends on the partition B used by Alice and Bob. If we nowimagine that each partition B is tested in parallel, we can approximate B0 by:
B∗ = argminB
(code len(E,B)) (4)
This partition corresponds to the best sequential compression of edges e1, . . . , em,and according to the minimum description length principle, it should correspondto the original partition B0. It should be noted that sequential encoding sup-pose that edges are ordered, which is typically not the case (except for temporalgraphs). Therefore, we need to choose an order, and it will necessarily be arbi-trary. Yet, we observe in practice that, although it modifies the precise value ofcode len(E,B), fluctuations have a limited impact on the estimation B∗.
3 Tests on synthetic graphs
In order to test this estimator, we generated random graphs using edge-basedstochastic block models, and observed how it behaves for various partitions of thenodes, in particular with underfitted and overfitted partitions. Before looking atthe estimator itself, we investigated how the prediction probability of the nextedge evolves as Alice draws more and more edges. Then, we tested how themean code length behaves on partitions which are a coarsening or a refinementof the original partition, and on partitions with the same number of blocks asthe original, but blocks of differents sizes, or shifted. Finally, we considered morecomplex SBM, with blocks of different sizes and density.
3.1 Prediction probability
We start by considering three graphs G0, G1 and G2. Each of them is made ofn = 128 nodes and m = 2800 edges (density is about 0.17), generated usingthree different stochastic block models described in table 1.

Edge based stochastic block model statistical inference 5
Table 1.
Node partition Block probability matrix
S0 = (B0,M0) ([1, 128])[
1n2
]
S1 = (B1,M1) ([1, 64], [65, 128]) 1n2 ·
[2 00 2
]
S2 = (B2,M2) ([1, 32], [33, 64], [65, 96], [97, 128]) 1n2 ·
4 0 0 00 4 0 00 0 4 00 0 0 4
Fig. 1. Prediction probability against edge rank for three different graphs
For each of these graphs, we consider the prediction probability of the nextedge QB,x−1[ex] against x for the three different partitions B0, B1 and B2, whichare all a refinement of the previous one. Results are shown on figure 1.
We observe for all three graphs, whatever x, the prediction probability basedon the null partition B0 is constant at 1
1282 ≈ 0.00006. This is logical, as the onlyB0-constant probability matrix is the one corresponding to the uniform distri-bution. Therefore, ∀x,QB0,x =
[1n2
]. For other partitions, the results depend on
the graph. On G0, generated with B0 and thus presenting no block structure,the probability distributions associated to more refined partitions do no performbetter than the one based on B0. For some edges their prediction probabilityis better, but as often it is worse. On average, they have the same predictionpower, they are only more sensible to the random fluctuations due to the orderin which edges are drawn. On the other hand, for G1, generated with B1 (twoblocks), we observe that refining the partition from one block to two allows the
6 Louis Duvivier et al.
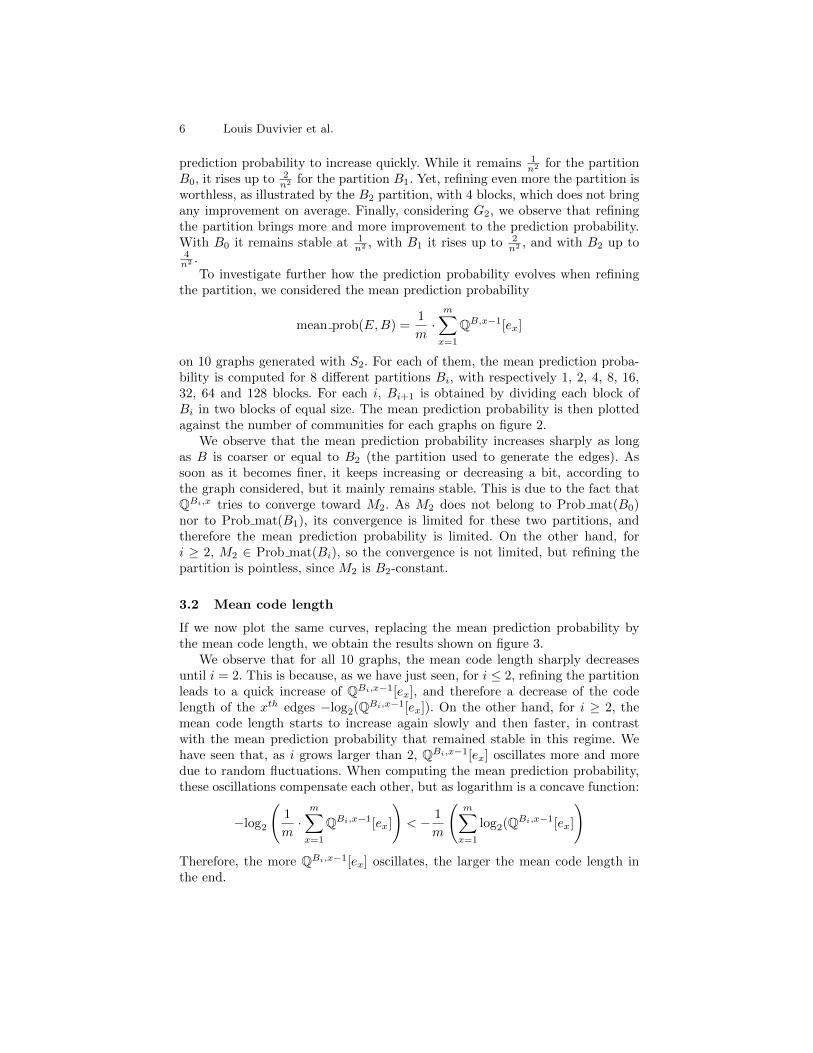
prediction probability to increase quickly. While it remains 1n2 for the partition
B0, it rises up to 2n2 for the partition B1. Yet, refining even more the partition is
worthless, as illustrated by the B2 partition, with 4 blocks, which does not bringany improvement on average. Finally, considering G2, we observe that refiningthe partition brings more and more improvement to the prediction probability.With B0 it remains stable at 1
n2 , with B1 it rises up to 2n2 , and with B2 up to
4n2 .
To investigate further how the prediction probability evolves when refiningthe partition, we considered the mean prediction probability
mean prob(E,B) =1
m·m∑x=1
QB,x−1[ex]
on 10 graphs generated with S2. For each of them, the mean prediction proba-bility is computed for 8 different partitions Bi, with respectively 1, 2, 4, 8, 16,32, 64 and 128 blocks. For each i, Bi+1 is obtained by dividing each block ofBi in two blocks of equal size. The mean prediction probability is then plottedagainst the number of communities for each graphs on figure 2.
We observe that the mean prediction probability increases sharply as longas B is coarser or equal to B2 (the partition used to generate the edges). Assoon as it becomes finer, it keeps increasing or decreasing a bit, according tothe graph considered, but it mainly remains stable. This is due to the fact thatQBi,x tries to converge toward M2. As M2 does not belong to Prob mat(B0)nor to Prob mat(B1), its convergence is limited for these two partitions, andtherefore the mean prediction probability is limited. On the other hand, fori ≥ 2, M2 ∈ Prob mat(Bi), so the convergence is not limited, but refining thepartition is pointless, since M2 is B2-constant.
3.2 Mean code length
If we now plot the same curves, replacing the mean prediction probability bythe mean code length, we obtain the results shown on figure 3.
We observe that for all 10 graphs, the mean code length sharply decreasesuntil i = 2. This is because, as we have just seen, for i ≤ 2, refining the partitionleads to a quick increase of QBi,x−1[ex], and therefore a decrease of the codelength of the xth edges −log2(QBi,x−1[ex]). On the other hand, for i ≥ 2, themean code length starts to increase again slowly and then faster, in contrastwith the mean prediction probability that remained stable in this regime. Wehave seen that, as i grows larger than 2, QBi,x−1[ex] oscillates more and moredue to random fluctuations. When computing the mean prediction probability,these oscillations compensate each other, but as logarithm is a concave function:
−log2
(1
m·m∑x=1
QBi,x−1[ex]
)< − 1
m
(m∑x=1
log2(QBi,x−1[ex]
)Therefore, the more QBi,x−1[ex] oscillates, the larger the mean code length inthe end.

Edge based stochastic block model statistical inference 7
Fig. 2. Mean prediction probability against partition refinement
Fig. 3. Mean code length against partition refinement: four communities graphs
Fig. 4. Mean code length against partition refinement: two communities graphs ofvarious sharpness

8 Louis Duvivier et al.
These two phenomenon are very important, because they explain how themean code length as a quality function prevents both overfitting and underfitting.If the partition tested is too coarse with respect to the original partition, QB,xcannot converge toward the original block probability matrix, and the mean codelength increases. On the other hand, if it is too fine, the convergence occurs butin a more noisy way, and this too leads to an increase of the mean code length.
Of course, it can work only if the edge generation probabilities are differentenough and if the total number of edges drawn is large enough, for #k | uk ∈bi ∧ vk ∈ bj to be significantly different from one pair of blocks (bi, bj) toanother. To illustrate this, we considered a set of 10 graphs, still with 128 nodesand 2800 edges, generated by stochastic block models based on the partition B1
(two blocks) and block probability matrices:
Mi =1
n2·[(2− i
10 ) i10
i10 (2− i
10 )
]Therefore, S0 generates graphs with two perfectly separated communities, whileS9 generates graphs with almost no community structure. For each stochasticblock model, we generate a graph Gi and compute the mean code length for6 different partitions, B0 to B5, defined as before with 1 to 32 blocks. Resultsare plotted on figure 4. We observe that for i = 0, 2, 4, 6, 8, the minimum meancode length is obtained for the two blocks partition B1, while for the other, itis obtained for the four blocks partition B2. This shows that fuzzy communitiesmay lead to limited overfitting, but that the quality function is very robustagainst underfitting.
Finally, we considered the performance of the mean code length when mod-ifing blocks’ sizes or shifting blocks. To do so, we generated 10 graphs with 128nodes and 2800 edges, made of two perfectly separated communities of equalsize. Then, for each of these graphs, we computed the mean code length for twosequence of partitions.
– Scut = (B(c) = ([1, c], [c, 128]))c∈0,8,16,24,...,128– Soffset = (B(o) = ([1 + o, 64 + o], [1, o] ∪ [65 + o, 128])o∈0,4,8,12,...,32)
Results are plotted, respectively against c and o, on figure 5.We observe that for all graphs, the minimum of mean code length is reached
when c = 64 in the first sequence, and when o = 0 in the second, which bothcorrespond to the partition B1 used to generate them. This means that meancode length is robust against shifting blocks and modifying blocks’ sizes.
3.3 Merge / split issue
As of today, the main stochastic block model statistical inference methodologyis based on SBM considered as generative models of graphs, as explained at thebeginning of section 2. The best set of parameters B,M is infered by minimizingthe entropy of the set of generable graphs ΩB,M , as detailed in [6]. In the follow-ing, this entropy will be denoted by entropy(G,B), and we compute it using the

Edge based stochastic block model statistical inference 9
Fig. 5. Mean code length against cut (left) and offset (right)
Fig. 6. Three different partitions of the zachary karate club network. Sociological (up-per left), minimum modularity (upper right), minimum entropy (lower)
Fig. 7. Mean code length for different partitions of the zachary karate club network

10 Louis Duvivier et al.
python library graph tools3. It has been shown that this methodology can leedto a phenomenon of block inversion in graphs made of one large communitiesand a set of smaller ones [9]. Here, we will show how the mean code length allowsto overcome the issue.
To illustrate the phenomenon on a simple example, let’s consider a stochasticblock model S1 defined on a set of n = 12 nodes, partitioned in three communi-ties: B = ([0; 5], [6; 8], [9; 11]) and a probability matrix:
M =
0.026 0 00 0.003 00 0 0.003
We test two different partitions: the original one, B, and the inverse partitionBi = ([0; 2], [3; 5], [6; 11]). To do so, we generate 100 graphs Gi made of m = 378edges with S1 and for each graph, we compute the mean code length and theentropy for both partitions. Then, for both quality function, we compute thepercentage of graphs for which the original partition is identified as better thanthe inverse one. Results are shown in table 2.
Table 2. Percentage of correct match for heterogeneous graphs
SBM mean code length entropy
S1 96% 0%S2 100% 0%
While the mean code length almost always correctly identifies the originalpartition, the entropy of the microcanonical ensemble never does so. The graphsconsidered here had a very high density, which makes them not very realistic,but the same results can be obtained with low density graphs. Let’s considera stochastic block model S2 on n = 256 nodes, partitioned in 33 communities:one of size 128, and 32 of size 4. The internal probability of the big communityis 0.00006, the one of the small communities is 0.00076, and the probabilitybetween communities is null. As before, we generate 100 graphs with S2 andtest for each of them the original partition and the inverse partition obtained bysplitting the big community in 32 small ones and merging the small ones in onebig. The percentage of graph for which the mean code length (resp. the entropy)is smaller for the original partition than the inverse one is shown in table 2. Inthis case too, the mean code length always recovers the original partition, whileminimum entropy never does.
3 https://graph-tool.skewed.de

Edge based stochastic block model statistical inference 11
4 Zachary Karate Club
Finally, we test the mean code length quality function on the zachary karate clubnetwork. We study three different partitions of it. First of all, the sociologicalpartition, B100, which is the partition described in the original paper as corre-sponding to the sociological ground truth about communities in the karate club.B200 is the partition obtained by minimizing the modularity using the louvainalgorithm, and B300 the partition obtained by minimizing the entropy using thegraph tool library. Those partitions are illustrated on figure 6.
For each of these partitions, we compute the mean code length. We also doso for 100 random partitions of the graph, with 1 to 5 blocks, and for each ofthese partitions, we compute the mean code length for 99 random refinement ofthem, obtained by randomly dividing each block in two. Results are plotted onfigure 7.
We observe that the mean code length is minimum for the minimum entropypartition. All studied partitions perform better than the random ones, so themean code length captures the fact that they reproduce part of the structureof the network. Yet, for B100 and B200 many of there random refinements im-prove the compression, sometimes by a large amount, indicating that they arenot optimal. This is not the case for the minimum entropy partition B300. Thereare only 2 refinements out of 99 which perform a little better, an issue we haveseen may happen due to random fluctuations. These results are coherent withprevious work showing that B100 is actually not fully supported by statisticalevidence in the network. In the case of B200, modularity is defined based onnodes’ degree, so the selected partition compensate for node degrees, which arenot considered here. Finally, minimizing the entropy without correcting for thedegree leads to the identification of two blocks of hubs, at the center of eachsociological communities, and two blocks corresponding to their periphery. Thisis not necessarily what we expect, because we are used to communities definedwith an implicit or explicit degree correction, but as we have not imposed con-straints so far, this result corresponds to the statistical evidence present in thenetwork.
5 Conclusion
In conclusion, in this paper, we have defined a new quality function, the meancode length, to evaluate node partitions. It relies on an alternative definition ofthe stochastic block model, as a probability distributions of edges. We make thehypothesis that the edges of the graph G under study were sampled indepen-dently from the same stochastic block model probability distribution. Then, wemake use of the law of great numbers and of the minimum description lengthprinciple to derive a statistical estimator of the partition used to generate G.The mathematical derivation of this estimator allows a clear interpretation ofthe partition identified. What is more, it is a basis for mathematicaly provingproperties about it, for example its convergence toward the original partition.

12 Louis Duvivier et al.
We then test this estimator on synthetic graphs, generated with a knownblock structure. It shows that mean code length is able to correctly identifyblocks of nodes whose internal connections are homogeneous, avoiding both thetendancy to merge distinct communities which leads to underfitting, and to splitcommunities in smaller blocks, which leads to overfitting. Finally, we test it ondifferent partition of the zachary karate club and the result were coherent withprevious results based on statistical inference of the stochastic block model.
Those results are preliminary. This quality function should be tested morethoroughly, against graphs of various sizes and densities, with heterogeneouscommunities. In particular, it would be interesting to measure the density thresh-olds that allows stochastic block models to be recovered using this method, asat been done for other methodology.
Acknowledgments
This work was supported by the ACADEMICS grant of the IDEXLYON, projectof the Universite de Lyon, PIA operated by ANR-16-IDEX-0005, and of theproject ANR-18-CE23-0004 (BITUNAM) of the French National ResearchAgency (ANR).
References
1. Michelle Girvan and Mark EJ Newman. Community structure in social and biolog-ical networks. Proceedings of the national academy of sciences, 99(12):7821–7826,2002.
2. Santo Fortunato and Darko Hric. Community detection in networks: A user guide.Physics reports, 659:1–44, 2016.
3. Aaron Clauset, Mark EJ Newman, and Cristopher Moore. Finding communitystructure in very large networks. Physical review E, 70(6):066111, 2004.
4. Mark EJ Newman. Finding community structure in networks using the eigenvectorsof matrices. Physical review E, 74(3):036104, 2006.
5. Roger Guimera, Marta Sales-Pardo, and Luıs A Nunes Amaral. Modularityfrom fluctuations in random graphs and complex networks. Physical Review E,70(2):025101, 2004.
6. Tiago P Peixoto. Bayesian stochastic blockmodeling. Advances in network clus-tering and blockmodeling, pages 289–332, 2019.
7. Tiago P Peixoto. Entropy of stochastic blockmodel ensembles. Physical Review E,85(5):056122, 2012.
8. Ginestra Bianconi. Entropy of network ensembles. Physical Review E,79(3):036114, 2009.
9. Louis Duvivier, Celine Robardet, and Remy Cazabet. Minimum entropy stochasticblock models neglect edge distribution heterogeneity. In International Conferenceon Complex Networks and Their Applications, pages 545–555. Springer, 2019.
10. Peter Grunwald. A tutorial introduction to the minimum description length prin-ciple. Advances in minimum description length: Theory and applications, pages3–81, 2005.