
Edelweiss Ultra Short Term · PDF fileExchange Traded Funds ... The scheme is currently...
40
-
Upload
nguyennguyet -
Category
Documents
-
view
217 -
download
1
Transcript of Edelweiss Ultra Short Term · PDF fileExchange Traded Funds ... The scheme is currently...


Edelweiss Ultra Short Term
Fund
Edelweiss Short Term
Fund
.

Index
Markets & Beyond
• Penned by the CEO 2
• Market Insights 3
• Edelweiss Arbitrage Fund 4
• Edelweiss Equity Savings Advantage Fund 5
• Edelweiss Dynamic Equity Advantage Fund 6
• Edelweiss Large Cap Advantage Fund 7
• Edelweiss Equity Opportunities Fund 8
• Edelweiss Mid And Small Cap Fund 9
• Edelweiss Economic Resurgence Fund 10
• Edelweiss ELSS Fund 11
• Edelweiss Prudent Advantage Fund 12
• Edelweiss Tax Advantage Fund 13
Equity Funds
Page No.
• Edelweiss Liquid Fund 14
• Edelweiss Ultra Short Term Fund 15
• Edelweiss Short Term Fund 16
• Edelweiss Banking And PSU Debt Fund 17
• Edelweiss Corporate Debt Opportunities Fund 18
• Edelweiss Bond Fund 19
• Edelweiss Government Securities Fund 20
Debt Funds
• Edelweiss ETF - Nifty 50 21
• Edelweiss ETF - Nifty Bank 22
• Edelweiss ETF - Nifty Quality 30 23
Exchange Traded Funds
• SIP Performance 29
• Fund Performance - Direct Plan 30• Dividend History 32
• Schemes managed by Fund Manager 34
• How to Read Factsheet 35
Schedule
• Edelweiss Asean Equity Off-Shore Fund 24
• Edelweiss Greater China Equity Off-Shore Fund 25
• Edelweiss Europe Dynamic Equity Off-Shore Fund 26
• Edelweiss Emerging Markets Opportunities Equity Offshore Fund 27
• Edelweiss US Value Equity Off-Shore Fund 28
Overseas Fund of Funds


Arbitrage Fund
The investment objec�ve of the Scheme is to generate income by predominantly inves�ng in arbitrage opportuni�es in the cash and the deriva�ve segments of the equity markets and the arbitrage opportuni�es available within the deriva�ve segment and by inves�ng the balance in debt and money market instruments. However, there is no assurance that the investment objec�ve of the Scheme will be realized.
INVESTMENT OBJECTIVE
4
LOW HIGH
Investors understand
that their principal will be at
moderately low risk
Riskometer
This product is suitable for investors who are seeking*
• To generate income by predominantly inves�ng in arbitrage opportuni�es.• Investments predominantly in arbitrage opportuni�es in the cash and deriva�ve segments of the equity markets and the arbitrage opportuni�es available within the deriva�ve segment and by inves�ng the balance in debt and money market instruments.
*Investors should consult their financial advisers if in doubt about whether the product is suitable for them.
Past performance may or may not be sustained in future and should not be used as a basis for comparison with other investments. * CAGR Return.
Notes:1. Different plans shall have different expense structure. The performance details provided herein are of of Returns are for Growth Op�on only. Since Regular Plan Edelweiss Arbitrage Fund. Incep�on returns are calculated on Rs. 10/- invested at incep�on of the scheme In case the start/end date is non business day, the NAV of previous day is used for computa�on.. 2. The scheme is currently managed by (managing this fund from , 201 ) . Please refer page no. 34 for name Bhavesh Jain June 27 4 and Mr. Dhawal Dalal (Managing this fund from December 22, 2016) of the other schemes currently managed by the Fund Managers.3. $ Standard Benchmark prescribed by SEBI vide circular August 22, 2011.4. For the performance of other Schemes managed by the Fund Managers, please refer to the relevant scheme.5. Since the scheme is in existence for more than 1 year but less than 5 years hence performance data for 5 years and more is not provided.6. Standard devia�on and Sharpe ra�o are annualized.7. ^ Lower of sales or purchase divided by average AUM for last rolling 12 months.
Equity FundFACTSHEET
October
2017An open-ended equity scheme
Fund Managers Details
Equity Por�on :Mr. Bhavesh Jain 9 years 27-Jun-14
Debt Por�on :Mr. Dhawal Dalal 20 years 22-Dec-16
Managing SinceFund Managers Experience
Incep�on Date 27-Jun-14
NAV (as on 31st 017, in Rs.)October 2Direct Plan Dividend Op�on 10.6013Direct Plan Monthly Dividend Op�on 12.5885Direct Plan Growth Op�on 12.8315Regular Plan Dividend Op�on 10.4586Regular Plan Monthly Dividend Op�on 12.3720Regular Plan Growth Op�on 12.6145
Minimum Investment AmountRs. 5000/- per applica�on & in mul�ples of Re. 1/-therea�er.
Addi�onal investment amountRs. 1000/- per applica�on & in mul�ples of Re.1/- therea�er
Exit Load• If the units are redeemed / switched out on or
before 30 days from the date of allotment - 0.25%• If the Units are redeemed / switched out on a�er 30
days from the date of allotment - Nil
Total Expense Ra�os~: Regular Plan 1.05% Direct Plan 0.40%~Does not include Service Tax on Investment Management fees.
Dewan Housing Finance Corporation Ltd. Housing Finance 2.92JSW Steel Ltd. Ferrous Metals 2.71Maruti Suzuki India Ltd. Auto 2.00DLF Ltd. Construction 1.95Century Textiles & Industries Ltd. Cement 1.88Sun Pharmaceutical Ind Ltd. Pharmaceuticals 1.72Bharat Financial Inclusion Ltd. NBFC 1.51Vedanta Ltd. Non - Ferrous Metals 1.49Sun TV Network Ltd. Media & Entertainment 1.48Reliance Capital Ltd. NBFC 1.40Castrol India Ltd. Petroleum Products 1.38Tata Global Beverages Ltd. Consumer Non Durables 1.35Reliance Infrastructure Ltd. Power 1.33IDFC Bank Ltd. Banks 1.30Indiabulls Real Estate Ltd. Construction 1.28Rural Electrification Corporation Ltd. Public Financial Institution 1.18L&T Finance Holdings Ltd. NBFC 1.17United Spirits Ltd. Consumer Non Durables 1.14IDFC Ltd. NBFC 1.10Tata Communications Ltd. Telecom - Services 0.99Jindal Steel & Power Ltd. Ferrous Metals 0.96Power Finance Corporation Ltd. Public Financial Institution 0.94The India Cements Ltd. Cement 0.92UPL Ltd. Pesticides 0.91The Federal Bank Ltd. Banks 0.90FORTIS HEALTHCARE LIMITED Healthcare Services 0.83Aurobindo Pharma Ltd. Pharmaceuticals 0.83Ashok Leyland Ltd. Auto 0.80Infibeam Incorporation Ltd. Software 0.80Jain Irrigation Systems Ltd. Industrial Products 0.80Others 60.04
Portfolio analysis: Sector-Wise
Name of Instrument Industry % to Net Assets
Top Holdings as on October 31, 2017
Asset alloca�on (% of total)
Cash & Other receivablesDebtEqui�es
Quantitative indicators As on October 31, 2017
Sharpe Ra�o** : 1.45 Beta : 0.46 Total stocks in por�olio : 120 Top 10 stocks : 19.05%
Std. devia�on : 0.50%
Fund Performance As on October 31, 2017
Edelweiss Arbitrage Fund
Scheme - Regular PlanBenchmark
(Nifty 50 Arbitrage Index)
$Additional Benchmark(Nifty 50 TR Index)
Period
1 Year
3 Year
5 Year
Since Inception - Regular Plan
Returns* Returns*Value of Rs. 10000 Invested Returns*Value of Rs. 10000
InvestedValue of Rs. 10000
Invested
5.91% 10,597 4.37% 10,441 20.97% 12,116
6.92% 12,227 6.34% 12,026 8.80% 12,882
NA NA NA NA NA NA
7.18% 12,615 6.50% 12,346 11.39% 14,350
AUM as on 31st October 2017
Month End AUM Monthly Average AUM
Rs. 4,124.88 CroreRs. 4,071.66 Crore
# Yield to maturity (YTM), Modified Dura�on and Average Maturity for Debt Por�on.**Risk free rate of return (FIMMDA Overnight MIBOR) 6.00%.
#Average Maturity : 0.85 years#Modified Dura�on : 0.43 years
#Yield to maturity (YTM) : 7.59%
0.02%
0.03%
0.09%
0.26%
0.51%
0.53%
0.62%
0.65%
0.72%
0.80%
0.83%
0.91%
1.01%
1.02%
1.05%
1.07%
1.38%
1.38%
1.54%
2.11%
2.19%
2.20%
2.39%
3.42%
3.43%
3.78%
4.05%
4.08%
4.18%
4.28%
4.32%
4.62%
7.34%
Chemicals
Gas
Tex�les - Co�on
Trading
Minerals/Mining
Oil
Transporta�on
Finance
Fer�lisers
Industrial Products
Healthcare Services
Pes�cides
Consumer Durables
Telecom - Services
So�ware
Tex�le Products
Construc�on Project
Petroleum Products
Non - Ferrous Metals
Public Financial Ins�tu�on
Industrial Capital Goods
Auto Ancillaries
Media & Entertainment
Cement
Housing Finance
Pharmaceu�cals
Ferrous Metals
Power
Construc�on
Consumer Non Durables
Banks
Auto
NBFC
66.80%
21.01%
12.19%
Por�olio Turnover Ra�o^ : Equity - 2.81 F&O - 9.86 Debt - 0.88 Total Por�olio Turnover Ra�o^ : 13.54

Equity Savings Advantage Fund
The investment objec�ve of the scheme is to provide capital apprecia�on and income distribu�on to the investors by using equity and equity related instruments, arbitrage opportuni�es, and investments in debt and money market instruments. However, there can be no assurance that the investment objec�ve of the Scheme will be realized or that income will be generated and the scheme does not assure or guarantee any returns.
Investment Objec�ve
5
HDFC Bank Ltd. Banks 3.41Reliance Industries Ltd. Refineries/Marketing 2.71ICICI Bank Ltd. Banks 2.32ITC Ltd. Consumer Non Durables 2.23Maruti Suzuki India Ltd. Auto 1.65Larsen & Toubro Ltd. Engineering-Designing- Construction 1.49IndusInd Bank Ltd. Banks 1.19State Bank of India Banks 1.12Kotak Mahindra Bank Ltd. Banks 1.11ICICI Lombard General Insurance Co. Ltd. Finance 1.02Bharat Petroleum Corporation Ltd. Petroleum Products 0.96Tata Motors Ltd. Auto 0.89Tata Consultancy Services Ltd. Software 0.86Asian Paints Ltd. Consumer Non Durables 0.79Hindalco Industries Ltd. Non - Ferrous Metals 0.75Axis Bank Ltd. Banks 0.75Eicher Motors Ltd. Auto 0.75NTPC Ltd. Power 0.62Britannia Industries Ltd. Consumer Non Durables 0.62Dalmia Bharat Ltd. Cement 0.55Petronet LNG Ltd. Gas 0.54Infosys Ltd. Software 0.52Housing Development Finance Corp Ltd. Housing Finance 0.46Syngene International Ltd. Pharmaceuticals 0.44Kansai Nerolac Paints Ltd. Consumer Non Durables 0.41Zee Entertainment Enterprises Ltd. Media & Entertainment 0.38V-Guard Industries Ltd. Industrial Capital Goods 0.38Indraprastha Gas Ltd. Gas 0.37Bosch Ltd. Auto Ancillaries 0.37Whirlpool of India Ltd. Consumer Durables 0.37Others 69.95
Portfolio analysis: Sector-Wise
This product is suitable for investors who are seeking*
• Income distribu�on by inves�ng in debt and money market instrument and arbitrage opportuni�es.• Long term capital apprecia�on by using equity and equity related instruments.
*Investors should consult their financial advisers if in doubt about whether the product is suitable for them.
Investors understand
that their principal will be
at Moderately High Risk
Riskometer
Fund Performance As on October 31, 2017
Edelweiss Equity Savings Advantage Fund
Scheme - Regular Plan Benchmark(70% CRISIL Liquid Fund Index + 30% Nifty 50 Index)
$Additional Benchmark(Nifty 50)
1 Year
3 Year
5 Year
Since Inception - Regular Plan
Returns*Value of Rs. 10000
InvestedReturns* Returns*
Name of Instrument Industry % to Net Assets
Top Holdings as on October 31, 2017
Past performance may or may not be sustained in future and should not be used as a basis for comparison with other investments. * CAGR Return.
Notes:1. Different plans shall have different expense structure. The performance details provided herein are of of Returns are for Growth Op�on only. Since Regular Plan Edelweiss Equity Savings Advantage Fund. Incep�on returns are calculated on Rs. 10/- invested at incep�on of the scheme. In case the start/end date is non business day, the NAV of previous day is used for computa�on.2. The scheme is currently managed by � (managing this fund from September 18, 201 ) (Managing this fund from September 18, 2017) Mr. (Managing Mr. Bharat Laho 7 , Mr. Hiten Shah and Dhawal Dalalthis fund from , 201 ). managed by the Fund Managers. November 28 6 Please refer page no. 34 for name of the other schemes currently3. For the performance of other Schemes managed by the Fund Managers, please refer to the relevant scheme.4. Since the scheme is in existence for more than 1 year but less than 5 years hence performance data for 5 years and more is not provided.5. Standard devia�on and Sharpe ra�o are annualized.6. ^ Lower of sales or purchase divided by average AUM for last rolling 12 months.7. Ac�ve posi�ve bets are those where the fund has a higher weightage as compared to Ni�y 50. Source: Bloomberg.
10.96% 11,106 6.86% 10,692 20.97% 12,116
8.02% 12,607 8.28% 12,697 8.80% 12,882
NA NA NA NA NA NA
8.47% 12,815 8.38% 12,785 10.62% 13,606
Equity FundFACTSHEET
October
2017
Portfolio analysis: Market cap-wise
An Open Ended Equity Scheme
Quantitative indicators As on October 31, 2017
Fund Managers Details
Incep�on Date 13-Oct-14
NAV (as on 31st 017, in Rs.)October 2Direct Plan Dividend Op�on 11.7378Direct Plan Growth Op�on 12.9886Regular Plan Dividend Op�on 11.0361Regular Plan Growth Op�on 12.8154
Minimum Investment AmountRs. 5,000/- per applica�on and in mul�ples of Re. 1/- therea�er
Addi�onal investment amountRs. 1,000/- per applica�on and in mul�ples of Re. 1/- therea�er
Exit Load(With Effect From October 23, 2017)5% of the units allo�ed shall be redeemed without any Exit Load on or before comple�on of 6 months from the date of allotment of units.Any redemp�on in excess of such limit within 6 months from the date of allotment shall be subject to the following Exit Load:• If redeemed or switched out on or before
comple�on of 6 Months from the date of allotment of units - 1.00%
• If redeemed or switched out a er comple�on of 6 months from the date of allotment of units – NIL
Redemp�on of units would be done on First in First out Basis (FIFO).
Total Expense Ra�os~: Regular Plan 1.50% Direct Plan 0.75%~Does not include Service Tax on Investment Management fees.
Value of Rs. 10000 Invested
Value of Rs. 10000 Invested
Asset alloca�on (% of total)
Equity Por�on :Mr. Bharat Laho� 11 years 18-Sep-17Mr. Hiten Shah 9 years 18-Sep-17
Debt Por�on :Mr. Dhawal Dalal 20 years 28-Nov-16
Managing SinceFund Managers Experience
< 6500 Crs. INR 6500 Crs. INR - 19500 Crs. INR 19500 Crs. INR - 97500 Crs. INR > 97500 Crs. INR Equi�es Cash & Other receivables Fixed Deposit Debt
AUM as on 31st October 2017
Month End AUM Monthly Average AUM
Rs. 113.44 CroreRs. 115.70 Crore
Ac�ve posi�ve bets : 15.50% Total stocks in por�olio : 50 Top 10 stocks : 18.26% Net Equity : 33.82%
#Average Maturity : 2.40 years#Modified Dura�on : 1.85 years
#Yield to maturity (YTM) : 7.68%
Period
(0.02%)
0.22%
0.28%
0.37%
0.37%
0.46%
0.52%
0.54%
0.62%
0.65%
0.65%
0.67%
0.96%
1.02%
1.05%
1.18%
1.34%
1.49%
2.71%
3.29%
4.33%
11.12%
Ferrous Metals
Minerals/Mining
Power- Transmission
Industrial Capital Goods
Media & Entertainment
Housing Finance
Cement
Industrial Products
Power
Consumer Durables
Auto Ancillaries
Pharmaceu�cals
Petroleum Products
Finance
Non - Ferrous Metals
Gas
So�ware
Engineering-Designing-Construc�on
Refineries/Marke�ng
Auto
Consumer Non Durables
Banks
7.85%
21.43%
33.25%
37.47%
65.42%
16.29%
9.45%
8.84%
Por�olio Turnover Ra�o^ : Equity - 0.48 F&O - 4.15 Debt - 0.29 Total Por�olio Turnover Ra�o^ : 4.92
# Yield to maturity (YTM), Modified Dura�on and Average Maturity for Debt Por�on.**Risk free rate of return (FIMMDA Overnight MIBOR) 6.00%.
Std. devia�on : 4.39%
Beta : 0.79Sharpe Ra�o** : 0.42

Dynamic Equity Advantage Fund
The primary objective of the Scheme will be to generate absolute returns with low volatility over a longer tenure of time. The Scheme will accordingly invest in arbitrage opportunities and debt and money market instruments on the one hand and in pure equity investments and equity derivative strategies on the other. However, there is no assurance that the investment objective of the Scheme will be realized.
INVESTMENT OBJECTIVE
6
LOW HIGH
Investors understand
that their principal will be at
moderately high risk
Riskometer
• To create wealth over long term and prevent capital erosion in medium term
• Investment predominantly in equity and equity related securities including through arbitrage opportunities with balance exposure to debt and money market securities
*Investors should consult their financial advisers if in doubt about whether the product is suitable for them.
This product is suitable for investors who are seeking*:
Past performance may or may not be sustained in future and should not be used as a basis for comparison with other investments. * CAGR Return.
Notes:1. Different plans shall have different expense structure. The performance details provided herein are of of Regular Plan Edelweiss Dynamic Equity Advantage Fund. Returns are for Growth Op�on only. Since Incep�on returns are calculated on Rs. 10/- invested at incep�on of the scheme. In case the start/end date is non business day, the NAV of previous day is used for computa�on.2. The scheme is currently managed by Mr. Bhavesh Jain (Managing this fund from August 7, 2013) and Mr. Bharat Laho� (Managing this fund from September 18, 2017) Please refer page no. 34 for name of the other schemes currently managed by the Fund Managers.3. $ Standard Benchmark prescribed by SEBI vide circular August 22, 2011.4. For the performance of other Schemes managed by the Fund Managers, please refer to the relevant scheme.5. ̂ Lower of sales or purchase divided by average AUM for last rolling 12 months. 6. Standard devia�on and Sharpe ra�o are annualized.7. Ac�ve posi�ve bets are those where the fund has a higher weightage as compared to Ni�y 50. Source: NSE, Bloomberg.
Equity FundFACTSHEET
October
2017An open-ended equity scheme
Portfolio analysis: Market cap-wise
< 6500 Crs.INR 6500 Crs.INR - 19500 Crs. INR 19500 Crs. INR - 97500 Crs.INR > 97500 Crs. INR
Fund Managers Details
Inception Date 20-Aug-09
NAV (as on 31st 017, in Rs.)October 2Direct Plan Monthly Dividend Option 22.1500Direct Plan Quarterly Dividend Option 15.3400Direct Plan Growth Option 22.5900Regular Plan Monthly Dividend Option 21.5200Regular Plan Quarterly Dividend Option 13.4200Regular Plan Growth Option 21.9600
Minimum Investment Amount : Rs. 1000/- per application & in multiples of Re. 1/-thereafter
Additional investment amountRs. 1000/- per application & in multiples of Re.1/- thereafter
Exit Load10% of the units allotted shall be redeemed without any Exit Load on or before completion of 365 days from the date of allotment of units. Any redemption in excess of such limit within 365 days from the date of allotment shall be subject to the following Exit Load: • If redeemed or switched out on or before
completion of 365 days from the date of allotment of units – 1.00%
• If redeemed or switched out after completion of 365 days from the date of allotment of units – NIL
Redemption of units would be done on First in First out Basis (FIFO).
Total Expense Ratios~: Regular Plan 2.55% Direct Plan 1.77% ~Does not include Service Tax on Investment Management fees.
HDFC Bank Ltd. Banks 4.30Reliance Industries Ltd. Refineries/Marketing 3.84ITC Ltd. Consumer Non Durables 3.38Kotak Mahindra Bank Ltd. Banks 3.01Sun Pharmaceutical Ind Ltd. Pharmaceuticals 2.45State Bank of India Banks 2.43Infosys Ltd. Software 2.19Bharat Financial Inclusion Ltd. NBFC 2.13ICICI Bank Ltd. Banks 2.01Tata Consultancy Services Ltd. Software 1.99Larsen & Toubro Ltd. Engineering-Designing- Construction 1.75Yes Bank Ltd. Banks 1.71Britannia Industries Ltd. Consumer Non Durables 1.52Maruti Suzuki India Ltd. Auto 1.46ICICI Lombard General Insurance Co. Ltd. Finance 1.45Oracle Financial Services Software Ltd. Software 1.42Natco Pharma Ltd. Pharmaceuticals 1.39UPL Ltd. Pesticides 1.34Eicher Motors Ltd. Auto 1.25Tata Motors Ltd. Auto 1.19Hindustan Unilever Ltd. Consumer Non Durables 1.17Page Industries Ltd. Textile Products 1.15Larsen & Toubro Infotech Ltd. Software 1.14Container Corporation Of India Ltd. Transportation 1.08Bharat Petroleum Corporation Ltd. Petroleum Products 1.07Petronet LNG Ltd. Gas 1.07City Union Bank Ltd. Banks 1.05Piramal Enterprises Ltd. Pharmaceuticals 1.04RBL Bank Ltd. Banks 1.02Bharti Airtel Ltd. Telecom - Services 1.00Others 46.99
Portfolio analysis: Sector-Wise
Name of Instrument Industry % to Net Assets
Top Holdings as on October 31, 2017
Quantitative indicators As on October 31, 2017
Sharpe Ra�o** : 0.31
Beta : 0.86
Std. devia�on : 8.17%
Ac�ve posi�ve bets : 30.47% Total stocks in por�olio : 55 Top 10 stocks : 27.74% Net Equity : 77.01%
Edelweiss Dynamic Equity Advantage Fund
Period
Scheme - Regular Plan
Returns* Returns* Returns*
Fund Performance As on October 31, 2017
$Additional Benchmark(Nifty 50 TR Index)
Benchmark(60% Nifty 50 TR Index + 40% CRISIL
Composite Bond Fund Index)
1 Year
3 Year
5 Year
Since Inception - Regular Plan
14.55% 11,467 15.42% 11,556 20.97% 12,116
8.50% 12,775 9.49% 13,130 8.80% 12,882
12.10% 17,710 12.54% 18,057 14.34% 19,547
10.06% 21,960 10.90% 23,370 12.13% 25,582
Value of Rs. 10000 Invested
Value of Rs. 10000 Invested
Value of Rs. 10000 Invested
AUM as on 31st October 2017
Month End AUM Monthly Average AUM
Rs. 332.91 CroreRs. 350.37 Crore
Mr. Bhavesh Jain 9 years 7-Aug-13 Mr. Bharat Laho� 11 years 18-Sep-17
Managing SinceFund Managers Experience
# Yield to maturity (YTM), Modified Dura�on and Average Maturity for Debt Por�on. **Risk free rate of return (FIMMDA Overnight MIBOR) 6.00%.
Asset alloca�on (% of total)
Equi�es Cash & Other receivables Fixed Deposit Debt
#Modified Dura�on : 2.77 years #Average Maturity : 3.53 years#Yield to maturity (YTM) : 8.54%
3.42%
18.12%
26.38%
52.08%
64.66%
20.34%
9.74%
5.26%
0.48%
0.78%
0.83%
0.86%
0.89%
0.93%
1.00%
1.07%
1.08%
1.15%
1.34%
1.75%
1.92%
2.30%
2.89%
3.41%
3.84%
3.90%
5.68%
7.44%
8.93%
16.45%
Auto Ancillaries
Power- Transmission
Media & Entertainment
Industrial Products
Commercial Services
Non - Ferrous Metals
Telecom - Services
Petroleum Products
Transporta�on
Tex�le Products
Pes�cides
Engineering-Designing-Construc�on
Gas
Housing Finance
Finance
NBFC
Refineries/Marke�ng
Auto
Pharmaceu�cals
Consumer Non Durables
So�ware
Banks
Por�olio Turnover Ra�o^ : Equity - 1.59 F&O - 2.62 Debt - 0.68 Total Por�olio Turnover Ra�o^ : 4.89

INVESTMENT OBJECTIVE
The primary objective of the Scheme is to generate capital appreciation, from a portfolio that is substantially constituted of equity securities and equity related securities of the 100 largest corporates by market capitalisation, listed in India. However, there is no assurance that the investment objective of the Scheme will be realized and the Scheme does not assure or guarantee any returns.
7
This product is suitable for investors who are seeking*:
*Investors should consult their financial advisers if in doubt about whether the product is suitable for them.
• To create wealth in the long term• Investment predominantly in equity and equity related securities including equity derivatives of the 100 largest companies by market capitalization, listed in India.
Investors understand
that their principal will be at
Moderately High Risk
Riskometer
Past performance may or may not be sustained in future and should not be used as a basis for comparison with other investments. * CAGR Return.
Notes:1. Different plans shall have different expense structure. The performance details provided herein are of of In Regular Plan Edelweiss Large Cap Advantage Fund. Returns are for Growth Op�on only. case the start/end date is non business day, the NAV of previous day is used for computa�on.2. The scheme is currently managed by (Managing this fund from May 2, 2017). Please refer page no. 34 for name of the other schemes currently managed by the Fund Managers.Mr. Bharat Lahoti3. $ Standard Benchmark prescribed by SEBI vide circular August 22, 2011.4. For the performance of other Schemes managed by the Fund Managers, please refer to the relevant scheme.5. Standard devia�on and Sharpe ra�o are annualized.6. ^ Lower of sales or purchase divided by average AUM for last rolling 12 months. 7. Ac�ve posi�ve bets are those where the fund has a higher weightage as compared to Ni�y 50. Source: Bloomberg.
Equity FundFACTSHEET
October
2017Large Cap Advantage FundAn open ended equity scheme
Portfolio analysis: Market cap-wise
Fund Managers Details
Mr. Bharat Laho� 02-May-17 11 years
Managing SinceFund Managers Experience
Inception Date 20-May-09
NAV (as on 31st 017, in Rs.)October 2Direct Plan Dividend Op�on 23.3800Direct Plan Growth Option 33.2500Regular Plan Dividend Option 20.8200Regular Plan Growth Option 32.2800
Minimum Investment AmountRs. 1000/- per application & in multiples of Re. 1/- thereafter
Additional investment amountRs. 1000/- per application & in multiples of Re. 1/- thereafter
Exit Load • If the Units are redeemed / switched out on or
before 365 days from the date of allotment – 1.00%• If the Units are redeemed / switched out after 365
days from the date of allotment – Nil
Total Expense Ra�os~: Regular Plan 1.30%Direct Plan 0.50%~Does not include Service Tax on Investment
Management fees.
HDFC Bank Ltd. Banks 9.37Reliance Industries Ltd. Refineries/Marketing 5.83Infosys Ltd. Software 4.98IndusInd Bank Ltd. Banks 4.77Kotak Mahindra Bank Ltd. Banks 3.59Larsen & Toubro Ltd. Engineering-Designing- Construction 3.29State Bank of India Banks 3.21Maruti Suzuki India Ltd. Auto 2.99ITC Ltd. Consumer Non Durables 2.95ICICI Bank Ltd. Banks 2.34Yes Bank Ltd. Banks 2.18Bharat Electronics Ltd. Industrial Capital Goods 2.09Natco Pharma Ltd. Pharmaceuticals 2.07Eicher Motors Ltd. Auto 2.06Indraprastha Gas Ltd. Gas 1.89Hindustan Unilever Ltd. Consumer Non Durables 1.77Tata Motors Ltd. Auto 1.72Larsen & Toubro Infotech Ltd. Software 1.61InterGlobe Aviation Ltd. Transportation 1.52Gruh Finance Ltd. Housing Finance 1.46Hindalco Industries Ltd. Non - Ferrous Metals 1.45Sun Pharmaceutical Ind Ltd. Pharmaceuticals 1.33Tata Consultancy Services Ltd. Software 1.22Petronet LNG Ltd. Gas 1.19Britannia Industries Ltd. Consumer Non Durables 1.19Indiabulls Housing Finance Ltd. Housing Finance 1.16Container Corporation Of India Ltd. Transportation 1.11Ultratech Cement Ltd. Cement 1.11Dabur India Ltd. Consumer Non Durables 1.10Vedanta Ltd. Non - Ferrous Metals 1.05Others 26.40
Portfolio analysis: Sector-Wise
Name of Instrument Industry % to Net Assets
Top Holdings as on October 31, 2017
Quantitative indicators As on October 31, 2017
Sharpe Ra�o** : 0.37 Beta : 0.96
Ac�ve posi�ve bets : 33.71% Total stocks in por�olio : 54 Top 10 stocks : 43.32%
Std. devia�on : 13.72%
Fund Performance As on October 31, 2017
PeriodScheme-Regular Plan Benchmark
(Nifty 50 TR Index)
1 Year
3 Year
5 Year
Since Inception - Regular Plan
Returns*
Edelweiss Large Cap Advantage Fund$Additional Benchmark
(S&P BSE Sensex TR Index)
17.95% 11,811 20.97% 12,116 20.24% 12,042
10.67% 13,557 8.80% 12,882 7.51% 12,428
16.26% 21,251 14.34% 19,547 14.07% 19,319
14.87% 32,280 12.38% 26,822 NA NA
Returns* Returns* Value of Rs. 10000 Invested
Value of Rs. 10000 Invested
Value of Rs. 10000 Invested
AUM as on 31st October 2017
Month End AUM Monthly Average AUM
Rs. 141.26 CroreRs. 141.74 Crore
**Risk free rate of return (FIMMDA Overnight MIBOR) 6.00%.
Asset alloca�on (% of total)
Equi�es Fixed Deposit Cash & Other receivables
0.74%
0.84%
0.85%
0.88%
0.88%
0.94%
0.99%
1.05%
1.11%
1.50%
1.76%
2.50%
2.61%
2.64%
2.86%
3.08%
3.29%
5.49%
5.83%
6.77%
9.54%
10.29%
26.19%
Power
Tex�le Products
Telecom - Equipment & Accessories
Oil
Consumer Durables
Petroleum Products
Pes�cides
Auto Ancillaries
Cement
Finance
NBFC
Non - Ferrous Metals
Housing Finance
Transporta�on
Industrial Capital Goods
Gas
Engineering-Designing-Construc�on
Pharmaceu�cals
Refineries/Marke�ng
Auto
Consumer Non Durables
So�ware
Banks
0.00% 14.02%
33.81%
52.18%
< 6500 Crs. INR 6500 Crs. INR - 19500 Crs. INR 19500 Crs. INR - 97500 Crs. INR > 97500 Crs. INR
76.46%
13.68%
9.86%
Por�olio Turnover Ra�o^ : Equity - 1.69 F&O - 1.70 Total Por�olio Turnover Ra�o^ : 3.40

Equity Opportunities Fund
8
INVESTMENT OBJECTIVE The investment objective of the Scheme is to generate income and long-term capital growth from a diversified portfolio of predominantly equity and equity-related securities including equity derivatives. However, there can be no assurance that the investment objective of the Scheme will be realised.
This product is suitable for investors who are seeking*:
*Investors should consult their financial advisers if in doubt about whether the product is suitable for them.
• Long-term capital growth.• Investments predominantly in equity and equity related securities
Investors understand
that their principal will be at
Moderately High Risk
Riskometer
Past performance may or may not be sustained in future and should not be used as a basis for comparison with other investments. * CAGR Return.
Notes:1. Different plans shall have different expense structure. The performance details provided herein are of of Regular Plan Edelweiss Equity Opportuni�es Fund. Returns are for Growth Op�on only. Since Incep�on returns are calculated on Rs. 10/- invested at incep�on of the scheme. In case the start/end date is non business day, the NAV of previous day is used for computa�on.2. The scheme is currently managed by Harshad Patwardhan (managing this fund from June 14, 2007). Please refer page no. 34 for name of the other schemes currently managed by the Fund Managers.3. $ Standard Benchmark prescribed by SEBI vide circular August 22, 2011.4. For the performance of other Schemes managed by the Fund Managers, please refer to the relevant scheme.5. Standard devia�on and Sharpe ra�o are annualized.6. ^ Lower of sales or purchase divided by average AUM for last rolling 12 months. 7. Ac�ve posi�ve bets are those where the fund has a higher weightage as compared to the benchmark S&P BSE 200. Source: Bloomberg.
Equity FundFACTSHEET
October
2017An open-ended equity growth scheme
Portfolio analysis: Market cap-wise
< 6500 Crs. INR 6500 Crs. INR - 19500 Crs. INR 19500 Crs. INR - 97500 Crs. INR > 97500 Crs. INR
Fund Managers Details
Mr. Harshad Patwardhan 23 years 14-Jun-07
Managing SinceFund Managers Experience
Inception Date 14-Jun-07
NAV (as on 31st 017, in Rs.)October 2Direct Plan Dividend Op�on 17.8500Direct Plan Growth Option 30.8240Regular Plan Dividend Option 17.0310Regular Plan Growth Option 29.4040
Minimum Investment Amount`5000/- per application & in multiples of `1/- thereafter
Additional investment amountRs. 1000/- per application & in multiples of ` 1/- thereafter
Exit Load• If the Units are redeemed / switched out on or before
12 months from the date of allotment – 1.00%• If the Units are redeemed / switched out after 12
months from the date of allotment – Nil
Total Expense Ratios~: Regular Plan 2.57%Direct Plan 2.03%~Does not include Service Tax on Investment Management fees.
HDFC Bank Ltd. Banks 8.75Reliance Industries Ltd. Refineries/Marketing 6.74Housing Development Finance Corp Ltd. Housing Finance 5.63ICICI Bank Ltd. Banks 4.58Larsen & Toubro Ltd. Engineering-Designing- Construction 4.47Maruti Suzuki India Ltd. Auto 4.45IndusInd Bank Ltd. Banks 3.42State Bank of India Banks 2.86ITC Ltd. Consumer Non Durables 2.76Kotak Mahindra Bank Ltd. Banks 2.65Bajaj Finance Ltd. NBFC 2.17Britannia Industries Ltd. Consumer Non Durables 1.96Sterlite Technologies Ltd. Telecom - Equipment & Accessories 1.93Motilal Oswal Financial Services Ltd. NBFC 1.84Tata Consultancy Services Ltd. Software 1.67Infosys Ltd. Software 1.52Eicher Motors Ltd. Auto 1.52The Federal Bank Ltd. Banks 1.50Kansai Nerolac Paints Ltd. Consumer Non Durables 1.43Escorts Ltd. Auto 1.42Nbcc India Ltd. Construction 1.40Bharat Forge Ltd. Industrial Products 1.36Whirlpool of India Ltd. Consumer Durables 1.33Bharti Airtel Ltd. Telecom - Services 1.31IIFL Holdings Ltd. NBFC 1.27Vedanta Ltd. Non - Ferrous Metals 1.22Solar Industries India Ltd. Chemicals 1.14Cholamandalam Investment & Fin Co Ltd. NBFC 1.11Kirloskar Brothers Ltd. Industrial Products 1.10Dalmia Bharat Ltd. Cement 1.09Others 24.38
Portfolio analysis: Sector-Wise
Name of Instrument Industry % to Net Assets
Top Holdings as on October 31, 2017
Quantitative indicators As on October 31, 2017
Sharpe Ra�o** : 0.47 Beta : 1.00
Ac�ve posi�ve bets : 44.97% Total stocks in por�olio : 50 Top 10 stocks : 46.32%
Std. devia�on : 13.89%
Fund Performance As on October 31, 2017
Edelweiss Equity Opportunities Fund
Scheme - Regular PlanBenchmark
(S&P BSE 200 TR Index)
1 Year
3 Year
5 Year
Since Inception - Regular Plan
Returns* Returns* Returns*Period
$Additional Benchmark(Nifty 50 TR Index)
19.94% 12,011 22.31% 12,251 20.97% 12,116
12.17% 14,120 11.65% 13,921 8.80% 12,882
16.82% 21,766 16.43% 21,408 14.34% 19,547
10.94% 29,404 NA NA 10.41% 27,980
Value of Rs. 10000 Invested
Value of Rs. 10000 Invested
Value of Rs. 10000 Invested
**Risk free rate of return (FIMMDA Overnight MIBOR) 6.00%.
AUM as on 31st October 2017
Month End AUM Monthly Average AUM
Rs. 262.92 CroreRs. 267.10 Crore
Asset alloca�on (% of total)
Equi�es Fixed Deposit Cash & Other receivables Debt
0.43%
0.48%
0.74%
0.91%
0.95%
0.95%
1.06%
1.07%
1.24%
1.24%
1.31%
1.56%
1.93%
1.99%
2.19%
2.47%
2.71%
2.90%
3.19%
3.31%
4.47%
5.63%
6.40%
6.74%
6.77%
7.40%
24.42%
Auto Ancillaries
Tex�le Products
Finance
Industrial Capital Goods
Ferrous Metals
Retailing
Media & Entertainment
Power- Transmission
Gas
Construc�on Project
Telecom - Services
Pharmaceu�cals
Telecom - Equipment & Accessories
Non - Ferrous Metals
Chemicals
Construc�on
Cement
Consumer Durables
So�ware
Industrial Products
Engineering-Designing-Construc�on
Housing Finance
NBFC
Refineries/Marke�ng
Consumer Non Durables
Auto
Banks
7.65%
15.77%
20.27%
56.31%
82.14%
9.25%
8.58% 0.04%
Por�olio Turnover Ra�o^ : Equity - 0.55 F&O - 1.06 Total Por�olio Turnover Ra�o^ : 1.61

Mid And Small Cap Fund
9
This product is suitable for investors who are seeking*:
• Long Term Capital Growth• Investments predominantly in equity and equity related securities focused on smaller companies (generally,the universe will be the companies constituting the bottom fourth by way of market capitalization of stockslisted on the National Stock Exchange or Bombay Stock Exchange.) ^
*Investors should consult their financial advisers if in doubt about whether the product is suitable for them. ^The Fund Manager may from time to time include other equity and equity related securities outside the universe to achieve optimal portfolio construction
Investors understand
that their principal will be at High Risk
Riskometer
LOW HIGH
INVESTMENT OBJECTIVE The investment objective is to seek to generate long term capital appreciation from a portfolio that is substantially constituted of equity and equity related securities focused on smaller companies. Generally, the universe will be the companies constituting the bottom fourth by way of market capitalization of stocks listed on the NSE or the BSE. The fund manager may from time to time include other equity and equity related securities outside the universe to achieve optimal portfolio construction. However, there can be no assurance that the investment objective of the scheme will be realised.
Past performance may or may not be sustained in future and should not be used as a basis for comparison with other investments. * CAGR Return.
Notes:1. Different plans shall have different expense structure. The performance details provided herein are of of Regular Plan Edelweiss Mid and Small Cap Fund. Returns are for Growth Op�on only. Since Incep�on returns are calculated on Rs. 10/- invested at incep�on of the scheme. In case the start/end date is non business day, the NAV of previous day is used for computa�on.2. The scheme is currently managed by Harshad Patwardhan (managing this fund from December 26, 2007). Please refer page no. 34 for name of the other schemes currently managed by the Fund Managers.3. $ Standard Benchmark prescribed by SEBI vide circular August 22, 2011.4. For the performance of other Schemes managed by the Fund Managers, please refer to the relevant scheme.5. Standard devia�on and Sharpe ra�o are annualized.6. ^ Lower of sales or purchase divided by average AUM for last rolling 12 months. 7. Ac�ve posi�ve bets are those where the fund has a higher weightage as compared to the benchmark Ni�y Free Float Midcap 100. Source: Bloomberg.
Equity FundFACTSHEET
October
2017An open-ended equity growth scheme
Portfolio analysis: Market cap-wise
< 3250 Crs. INR 3250 Crs. INR - 6500 Crs. INR 6500 Crs. INR - 19500 Crs. INR > 19500 Crs. INR
Fund Managers Details
Mr. Harshad Patwardhan 23 years 26-Dec-07
Managing SinceFund Managers Experience
Incep�on Date 26-Dec-2007
NAV (as on 31st 017, in Rs.)October 2Direct Plan Dividend Op�on 27.5460Direct Plan Growth Op�on 28.6180Regular Plan Dividend Op�on 25.2850Regular Plan Growth Op�on 27.4270
Minimum Investment Amount`5000/- per applica�on & in mul�ples of `1/- therea�er
Additional investment amountRs. 1000/- per application & in multiples of ` 1/- thereafter
Exit Load• If the Units are redeemed / switched out on or before12 months from the date of allotment – 1.00%• If the Units are redeemed / switched out a�er 12months from the date of allotment – Nil
Total Expense Ratios~: Regular Plan 2.49%Direct Plan 1.88%~Does not include Service Tax on Investment Management fees.
Sterlite Technologies Ltd. Telecom - Equipment & Accessories 2.97Escorts Ltd. Auto 2.65Vakangee Ltd. Software 2.45Kansai Nerolac Paints Ltd. Consumer Non Durables 2.40Nbcc India Ltd. Construction 2.24Himadri Speciality Chemical Ltd. Chemicals 2.18Mold-Tek Packaging Ltd. Industrial Products 2.12City Union Bank Ltd. Banks 2.09The Federal Bank Ltd. Banks 1.97Birla Corporation Ltd. Cement 1.97Teamlease Services Ltd. Commercial Services 1.95Indraprastha Gas Ltd. Gas 1.94Gruh Finance Ltd. Housing Finance 1.88JK Tyre & Industries Ltd. Auto Ancillaries 1.87Whirlpool of India Ltd. Consumer Durables 1.85Cadila Healthcare Ltd. Pharmaceuticals 1.79Havells India Ltd. Consumer Durables 1.76Cholamandalam Investment & Fin Co Ltd. NBFC 1.74Page Industries Ltd. Textile Products 1.68Crompton Greaves Cons Electrical Ltd. Consumer Durables 1.63Motilal Oswal Financial Services Ltd. NBFC 1.62Divi's Laboratories Ltd. Pharmaceuticals 1.60Vinati Organics Ltd. Chemicals 1.50Kirloskar Brothers Ltd. Industrial Products 1.47Action Construction Equipment Ltd. Industrial Capital Goods 1.45Indian Bank Banks 1.44IIFL Holdings Ltd. NBFC 1.42NCC Ltd. Construction Project 1.41Minda Industries Ltd. Auto Ancillaries 1.39Blue Star Ltd. Consumer Durables 1.36Others 44.22
Portfolio analysis: Sector-Wise
Name of Instrument Industry % to Net Assets
Top Holdings as on October 31, 2017
Quantitative indicators As on October 31, 2017
Sharpe Ra�o** : 0.85 Beta : 0.97
Ac�ve posi�ve bets : 72.89% Total stocks in por�olio : 64 Top 10 stocks : 23.05%
Std. devia�on : 15.42%
Fund Performance As on October 31, 2017
Edelweiss Mid And Small Cap Fund
Scheme - Regular PlanBenchmark
(Nifty Free Float Midcap 100 TR Index)
Returns* Returns* Returns*Period
$Additional Benchmark(Nifty 50 TR Index)
1 Year
3 Year
5 Year
Since Inception - Regular Plan
23.01% 12,322 24.96% 12,519 20.97% 12,116
19.53% 17,086 19.58% 17,108 8.80% 12,882
26.94% 32,981 21.82% 26,838 14.34% 19,547
10.78% 27,427 9.82% 25,174 6.80% 19,120
Value of Rs. 10000 Invested
Value of Rs. 10000 Invested
Value of Rs. 10000 Invested
**Risk free rate of return (FIMMDA Overnight MIBOR) 6.00%.
AUM as on 31st October 2017
Month End AUM Monthly Average AUM
Rs. 499.36 CroreRs. 518.50 Crore
Asset alloca�on (% of total)
Equi�es Fixed Deposit Cash & Other receivables Debt
0.48%
0.51%
0.92%
1.04%
1.18%
1.24%
1.34%
1.61%
1.88%
1.95%
2.37%
2.65%
2.94%
2.97%
3.12%
3.12%
3.52%
4.76%
4.95%
5.05%
5.33%
5.64%
5.65%
7.04%
7.11%
7.41%
8.43%
Paper
Hotels, Resorts and Other Recrea�onal Ac�vi�es
Finance
Pes�cides
Media & Entertainment
Ferrous Metals
Retailing
Power
Housing Finance
Commercial Services
Tex�le Products
Auto
So�ware
Telecom - Equipment & Accessories
Construc�on Project
Gas
Industrial Capital Goods
Chemicals
Auto Ancillaries
Pharmaceu�cals
Cement
Consumer Non Durables
Construc�on
Industrial Products
NBFC
Consumer Durables
Banks
18.11%
16.20%
41.76%
23.93%
83.61%
8.20%
8.17%0.02%
Por�olio Turnover Ra�o^ : Equity - 0.73 F&O - 1.12 Total Por�olio Turnover Ra�o^ : 1.85

Economic Resurgence Fund
The primary investment objective of the scheme is to generate long term capital appreciation, from a diversified portfolio that is substantially constituted of equity and equity related securities of companies with focus on riding economic cycles through dynamic allocation between various sectors and stocks at different stages of economic activity. This Fund will generally not invest in defensive sectors such as pharmaceuticals, fast moving consumer goods and IT services. However, there can be no assurance that the investment objective of the scheme will be realised.
INVESTMENT OBJECTIVE
10
This product is suitable for investors who are seeking*:
• Long Term Capital Growth• Investment in equity and equity-related securities of companies with a focus on riding economic cycles through dynamic allocation between various sectors and stocks at different stages of economic activity.
*Investors should consult their financial advisers if in doubt about whether the product is suitable for them.
Investors understand
that their principal will be at High Risk
Riskometer
LOW HIGH
Past performance may or may not be sustained in future and should not be used as a basis for comparison with other investments. * CAGR Return.
Notes:1. Different plans shall have different expense structure. The performance details provided herein are of of Regular Plan Edelweiss Economic Resurgence Fund. Returns are for Growth Op�on only. Since Incep�on returns are calculated on Rs. 10/- invested at incep�on of the scheme. In case the start/end date is non business day, the NAV of previous day is used for computa�on.2. The scheme is currently managed by Harshad Patwardhan (managing this fund from February 3, 2015). Please refer page no. 34 for name of the other schemes currently managed by the Fund Managers.3. $ Standard Benchmark prescribed by SEBI vide circular August 22, 2011.4. Since the scheme is in existence for more than 1 year but less than 3 years hence performance data for 3 years and more is not provided.5. For the performance of other Schemes managed by the Fund Managers, please refer to the relevant scheme.6. Since the Scheme has not completed 3 years Standard Devia�on, Por�olio Beta and Sharpe Ra�o is not provided.7. ^ Lower of sales or purchase divided by average AUM for last rolling 12 months. 8. Ac�ve posi�ve bets are those where the fund has a higher weightage as compared to the benchmark S&P BSE 200. Source: BSE, Bloomberg.
Equity FundFACTSHEET
October
2017An open-ended Equity Scheme
Portfolio analysis: Market cap-wise
Fund Managers Details
Mr. Harshad Patwardhan 23 years 03-Feb-15
Managing SinceFund Managers Experience
Inception Date 3-Feb-15
NAV (as on 31st 017, in Rs.)October 2Direct Plan Dividend Option 13.8780Direct Plan Growth Option 14.0160Regular Plan Dividend Option 13.7380Regular Plan Growth Option 13.7360
Minimum Investment AmountRs.5000/- per application & in multiples of Re. 1/- thereafter
Additional investment amountRs. 1000/- per application & in multiples of Re 1/- thereafter
Exit Load• If the Units are redeemed / switched out on or
before 12 months from the date of allotment – 1.00%
• If the Units are redeemed / switched out after 12 months from the date of allotment – Nil
Total Expense Ratios~: 2.65%Regular Plan
Direct Plan 2.27%~Does not include Service Tax on Investment Management fees.
AUM as on 31st October 2017
Month End AUM Monthly Average AUM
Rs. 26.53 CroreRs. 27.49 CroreHDFC Bank Ltd. Banks 7.95Reliance Industries Ltd. Refineries/Marketing 5.76Housing Development Finance Corp Ltd. Housing Finance 5.04ICICI Bank Ltd. Banks 4.61Larsen & Toubro Ltd. Engineering-Designing- Construction 4.34Maruti Suzuki India Ltd. Auto 4.24IndusInd Bank Ltd. Banks 3.25State Bank of India Banks 2.81Dalmia Bharat Ltd. Cement 2.25Action Construction Equipment Ltd. Industrial Capital Goods 2.09Blue Star Ltd. Consumer Durables 2.04Sterlite Technologies Ltd. Telecom - Equipment & Accessories 1.99Himadri Speciality Chemical Ltd. Chemicals 1.96Escorts Ltd. Auto 1.92Bajaj Finance Ltd. NBFC 1.85JK Cement Ltd. Cement 1.75Grindwell Norton Ltd Industrial Products 1.71Eicher Motors Ltd. Auto 1.70Whirlpool of India Ltd. Consumer Durables 1.66Solar Industries India Ltd. Chemicals 1.66Nbcc India Ltd. Construction 1.63JK Lakshmi Cement Ltd. Cement 1.48V-Guard Industries Ltd. Industrial Capital Goods 1.44Kirloskar Brothers Ltd. Industrial Products 1.42Century Plyboards (India) Ltd. Consumer Durables 1.38Kansai Nerolac Paints Ltd. Consumer Non Durables 1.34Mold-Tek Packaging Ltd. Industrial Products 1.34BEML Ltd. Industrial Capital Goods 1.32Bharat Electronics Ltd. Industrial Capital Goods 1.29Vedanta Ltd. Non - Ferrous Metals 1.27Others 25.50
Portfolio analysis: Sector-Wise
Name of Instrument Industry % to Net Assets
Top Holdings as on October 31, 2017
Quantitative indicators As on October 31, 2017
Ac�ve posi�ve bets : 58.17% Total stocks in por�olio : 51 Top 10 stocks : 42.35%
Fund Performance As on October 31, 2017
Edelweiss Economic Resurgence Fund
Scheme - Regular PlanBenchmark
(S&P BSE 200 TR Index)
Returns* Returns* Returns*Period
$Additional Benchmark(Nifty 50 TR Index)
1 Year
3 Year
5 Year
Since Inception - Regular Plan
25.52% 12,575 22.31% 12,251 20.97% 12,116
NA NA NA NA NA NA
NA NA NA NA NA NA
12.27% 13,736 10.13% 13,031 7.64% 12,237
Value of Rs. 10000 Invested
Value of Rs. 10000 Invested
Value of Rs. 10000 Invested
< 6500 Crs. INR 6500 Crs. INR - 19500 Crs. INR 19500 Crs. INR - 97500 Crs. INR > 97500 Crs. INR
Asset alloca�on (% of total)
Equi�es Fixed Deposit Cash & Other receivables
0.00%
0.63%
0.90%
0.93%
0.93%
0.98%
1.03%
1.34%
2.24%
2.30%
2.52%
3.04%
3.61%
4.34%
5.04%
5.18%
5.48%
5.76%
5.98%
7.79%
7.87%
8.00%
20.29%
Finance
Gas
So�ware
Telecom - Services
Tex�le Products
Engineering Services
Ferrous Metals
Consumer Non Durables
Construc�on Project
Non - Ferrous Metals
Telecom - Equipment & Accessories
NBFC
Chemicals
Engineering-Designing-Construc�on
Housing Finance
Construc�on
Cement
Refineries/Marke�ng
Consumer Durables
Industrial Capital Goods
Auto
Industrial Products
Banks
23.20%
21.64%
14.75%
40.40%
87.40%
6.50% 6.10%
Por�olio Turnover Ra�o^ : Equity - 0.54 F&O - 0.86 Total Por�olio Turnover Ra�o^ : 1.40

ELSS Fund
The primary objective of the Scheme is to generate long-term capital appreciation with an option of periodic payouts at the end of lock in periods from a portfolio that invests predominantly in equity and equity related instruments. However, there is no assurance that the investment objective of the Scheme will be realized and the Scheme does not assure or guarantee any returns.
INVESTMENT OBJECTIVE
11
This product is suitable for investors who are seeking*:
• To create wealth in the long term• Investment in equity and equity-related securities that will be locked-in for the first three years.
*Investors should consult their financial advisers if in doubt about whether the product is suitable for them.
Investors understand
that their principal will be at
Moderately High Risk
Riskometer
Past performance may or may not be sustained in future and should not be used as a basis for comparison with other investments. * CAGR Return.
Notes:1. Different plans shall have different expense structure. The performance details provided herein are of of In case the start/end date Regular Plan Edelweiss ELSS Fund. Returns are for Growth Op�on only.is non business day, the NAV of previous day is used for computa�on.2. The scheme is currently managed by (Managing this fund from September 18, 201 ). Please refer page no. 34 for name of the other schemes currently managed by the Fund Mr. Harshad Patwardhan 7 Managers.3. $ Standard Benchmark prescribed by SEBI vide circular August 22, 2011.4. For the performance of other Schemes managed by the Fund Managers, please refer to the relevant scheme.5. Standard devia�on and Sharpe ra�o are annualized.6. ^ Lower of sales or purchase divided by average AUM for last rolling 12 months. 7. Ac�ve posi�ve bets are those where the fund has a higher weightage as compared to the benchmark Ni�y 500. Source: Bloomberg.
Equity FundFACTSHEET
October
2017An Open Ended Equity Linked Savings Scheme
Portfolio analysis: Market cap-wise
Inception Date 30-Dec-08
NAV (as on 31st 017, in Rs.)October 2Direct Plan Dividend Op�on 21.8000Direct Plan Growth Option 47.9400Regular Plan Dividend Option 17.8900Regular Plan Growth Option 46.0200
Minimum Investment AmountRs. Re. 500/- 500/- per application & in multiples of thereafter
Additional investment amountRs. 500/- per application & in multiples of Re 500/- thereafter
Exit Load Nil
Total Expense Ratios~: Plan 2.68%Regular
Direct Plan 1.93%~Does not include Service Tax on Investment Management fees.
HDFC Bank Ltd. Banks 7.89Reliance Industries Ltd. Refineries/Marketing 5.79Housing Development Finance Corp Ltd. Housing Finance 4.75ICICI Bank Ltd. Banks 4.19Maruti Suzuki India Ltd. Auto 4.02Larsen & Toubro Ltd. Engineering-Designing- Construction 3.43IndusInd Bank Ltd. Banks 3.28Tata Consultancy Services Ltd. Software 3.10State Bank of India Banks 2.82Indraprastha Gas Ltd. Gas 2.57Escorts Ltd. Auto 2.20Kotak Mahindra Bank Ltd. Banks 2.18Finolex Industries Ltd. Industrial Products 2.01Sterlite Technologies Ltd. Telecom - Equipment & Accessories 1.82Nbcc India Ltd. Construction 1.73IIFL Holdings Ltd. NBFC 1.72Mold-Tek Packaging Ltd. Industrial Products 1.66Infosys Ltd. Software 1.65Britannia Industries Ltd. Consumer Non Durables 1.59Kansai Nerolac Paints Ltd. Consumer Non Durables 1.55Birla Corporation Ltd. Cement 1.49Future Retail Ltd. Retailing 1.43Bajaj Finance Ltd. NBFC 1.37Minda Industries Ltd. Auto Ancillaries 1.36JK Cement Ltd. Cement 1.36Bharat Electronics Ltd. Industrial Capital Goods 1.32Petronet LNG Ltd. Gas 1.26Action Construction Equipment Ltd. Industrial Capital Goods 1.25Sun Pharmaceutical Ind Ltd. Pharmaceuticals 1.20Vedanta Ltd. Non - Ferrous Metals 1.10Others 26.89
Portfolio analysis: Sector-Wise
Name of Instrument Industry % to Net Assets
Top Holdings as on October 31, 2017
Quantitative indicators As on October 31, 2017
Sharpe Ra�o** : 0.51 Beta : 0.97
Ac�ve posi�ve bets : 51.70%
Por�olio Turnover Ra�o^ : 2.40
Total stocks in por�olio : 58 Top 10 stocks : 41.85%
Std. devia�on : 14.14%
Fund Performance As on October 31, 2017
Edelweiss ELSS Fund
Scheme - Regular PlanBenchmark
(Nifty 500 TR Index)
Returns* Returns* Returns*Period
$Additional Benchmark(Nifty 50 TR Index)
1 Year
3 Year
5 Year
Since Inception - Regular Plan
18.17% 11,833 23.50% 12,371 20.97% 12,116
12.97% 14,422 12.30% 14,168 8.80% 12,882
17.86% 22,748 16.84% 21,784 14.34% 19,547
18.85% 46,020 18.24% 43,979 16.48% 38,539
Value of Rs. 10000 Invested
Value of Rs. 10000 Invested
Value of Rs. 10000 Invested
**Risk free rate of return (FIMMDA Overnight MIBOR) 6.00%.
< 6500 Crs. INR 6500 Crs. INR - 19500 Crs. INR 19500 Crs. INR - 97500 Crs. INR > 97500 Crs. INR
AUM as on 31st October 2017
Month End AUM Monthly Average AUM
Rs. 70.57 CroreRs. 72.43 Crore
Fund Managers Details
Mr. Harshad Patwardhan 23 years 18-Sep-17
Managing SinceFund Managers Experience
Asset alloca�on (% of total)
Equi�es Fixed Deposit Cash & Other receivables
0.00%
0.93%
1.01%
1.07%
1.36%
1.43%
1.79%
1.82%
1.82%
2.57%
2.83%
3.43%
3.64%
3.77%
3.83%
3.90%
3.97%
4.75%
4.75%
5.13%
5.21%
5.79%
7.19%
22.97%
Finance
Commercial Services
Chemicals
Ferrous Metals
Construc�on Project
Retailing
Non - Ferrous Metals
Auto Ancillaries
Telecom - Equipment & Accessories
Industrial Capital Goods
Consumer Durables
Engineering-Designing-Construc�on
Construc�on
Pharmaceu�cals
Gas
Cement
Consumer Non Durables
So�ware
Housing Finance
Industrial Products
NBFC
Refineries/Marke�ng
Auto
Banks
9.63%
20.33%
20.78%
49.26%
94.97%
3.65% 1.37%

INVESTMENT OBJECTIVE
Prudent Advantage Fund
The objective of the Scheme is to generate returns through a combination of dividend income and capital appreciation by investing primarily in a well-diversified portfolio of Value Stocks. Value Stocks are those stocks, which tend to trade at a lower price relative to their fundamentals (i.e. dividends, earnings, sales, etc.) and thus considered undervalued by investors. They have attractive valuations in relation to earnings or book value or current and/or future dividends. However, there is no assurance that the investment objective of the Scheme will be realized and the Scheme does not assure or guarantee any returns.
12
This product is suitable for investors who are seeking*:
*Investors should consult their financial advisers if in doubt about whether the product is suitable for them.
• To create wealth in the long term• Investment in equity and equity-related securities including equity derivatives
Investors understand
that their principal will be at
Moderately High Risk
Riskometer
Fund Performance As on October 31, 2017
Past performance may or may not be sustained in future and should not be used as a basis for comparison with other investments. * CAGR Return.
Notes:1. Different plans shall have different expense structure. The performance details provided herein are of Plan of In case the Regular Edelweiss Prudent Advantage Fund. Returns are for Growth Op�on only. start/end date is non business day, the NAV of previous day is used for computa�on.2. The scheme is currently managed by Bharat Laho� (managing this fund from October 14, 2015). Please refer page no. 34 for name of the other schemes currently managed by the Fund Managers.3. $ Standard Benchmark prescribed by SEBI vide circular August 22, 2011.4. For the performance of other Schemes managed by the Fund Managers, please refer to the relevant scheme.5. Standard devia�on and Sharpe ra�o are annualized.6. ^ Lower of sales or purchase divided by average AUM for last rolling 12 months. 7. Ac�ve posi�ve bets are those where the fund has a higher weightage as compared to the benchmark Ni�y 200. Source: Bloomberg.
Edelweiss Prudent Advantage Fund
Period
Scheme - Regular Plan Benchmark(Nifty 200 TR Index)
Returns* Returns* Returns*
$Additional Benchmark(Nifty 50 TR Index)
1 Year
3 Year
5 Year
Since Inception - Regular Plan
13.04% 11,315 22.62% 12,283 20.97% 12,116
9.07% 12,979 11.40% 13,827 8.80% 12,882
13.67% 18,984 16.23% 21,217 14.34% 19,547
11.21% 23,968 12.78% 26,899 12.09% 25,572
Equity FundFACTSHEET
October
2017An open-ended equity scheme
Portfolio analysis: Market cap-wise
Fund Managers Details
Mr. Bharat Laho� 11 years 14-Oct-15
Managing SinceFund Managers Experience
Inception Date 12-Aug-09
NAV (as on 31st 017, in Rs.)October 2Direct Plan Dividend Op�on 19.2900Direct Plan Growth Option 24.3600Regular Plan Dividend Option 18.8500Regular Plan Growth Option 23.9200
Minimum Investment AmountRs. 1000/- per application & in multiples of Re. 1/- thereafter
Additional investment amountRs. 1000/- per application & in multiples of Re 1/- thereafter
Exit Load Nil
Total Expense Ratios~: Plan 2.66%Regular
Direct Plan 2.13%~Does not include Service Tax on Investment Management fees.
HDFC Bank Ltd. Banks 7.20Reliance Industries Ltd. Refineries/Marketing 5.74IndusInd Bank Ltd. Banks 4.53Infosys Ltd. Software 3.88ITC Ltd. Consumer Non Durables 3.49Yes Bank Ltd. Banks 2.83ICICI Bank Ltd. Banks 2.74Larsen & Toubro Ltd. Engineering-Designing- Construction 2.64State Bank of India Banks 2.15Tata Consultancy Services Ltd. Software 2.07Maruti Suzuki India Ltd. Auto 1.96Tata Motors Ltd. Auto 1.89Hindustan Unilever Ltd. Consumer Non Durables 1.77Indian Oil Corporation Ltd. Petroleum Products 1.76Oil & Natural Gas Corp Ltd. Oil 1.62Bajaj Finserv Ltd. NBFC 1.56Kotak Mahindra Bank Ltd. Banks 1.50Colgate Palmolive (India) Ltd. Consumer Non Durables 1.42HCL Technologies Ltd. Software 1.36Asian Paints Ltd. Consumer Non Durables 1.30Bharti Airtel Ltd. Telecom - Services 1.24Sun Pharmaceutical Ind Ltd. Pharmaceuticals 1.23Mahindra & Mahindra Ltd. Auto 1.21Piramal Enterprises Ltd. Pharmaceuticals 1.21IIFL Holdings Ltd. NBFC 1.17Power Grid Corporation of India Ltd. Power- Transmission 1.16Bajaj Auto Ltd. Auto 1.15Tech Mahindra Ltd. Software 1.14Eicher Motors Ltd. Auto 1.14Ultratech Cement Ltd. Cement 1.09Others 34.85
Portfolio analysis: Sector-Wise
Name of Instrument Industry % to Net Assets
Top Holdings as on October 31, 2017
Quantitative indicators As on October 31, 2017
Sharpe Ra�o** : 0.29 Beta : 0.78
Ac�ve posi�ve bets : 30.46%
Por�olio Turnover Ra�o^ : 1.21
Total stocks in por�olio : 59 Top 10 stocks : 37.27%
Std. devia�on : 11.38%
Value of Rs. 10000 Invested
**Risk free rate of return (FIMMDA Overnight MIBOR) 6.00%.
Value of Rs. 10000 Invested
Value of Rs. 10000 Invested
AUM as on 31st October 2017
Month End AUM Monthly Average AUM
Rs. 14.60 CroreRs. 14.31 Crore
Asset alloca�on (% of total)
Equi�es Fixed DepositCash & Other receivables Debt
0.00%
0.04%
0.49%
0.62%
0.69%
0.90%
0.92%
0.96%
1.02%
1.16%
1.24%
1.61%
1.62%
1.68%
1.70%
1.81%
1.97%
2.64%
2.64%
3.76%
5.70%
5.74%
8.45%
9.44%
9.66%
21.97%
Finance
Hotels/Resorts
Industrial Products
Minerals/Mining
Consumer Durables
Pes�cides
Power
Housing Finance
Ferrous Metals
Power- Transmission
Telecom - Services
Non - Ferrous Metals
Oil
Industrial Capital Goods
Gas
Cement
Auto Ancillaries
Engineering-Designing-Construc�on
Petroleum Products
NBFC
Pharmaceu�cals
Refineries/Marke�ng
So�ware
Auto
Consumer Non Durables
Banks
0.00% 5.52%
94.48%
< 3250 Crs. INR 6500 Crs. INR - 19500 Crs. INR > 19500 Crs. INR
79.44%
12.93%
5.06% 2.57%
Por�olio Turnover Ra�o^ : Equity - 1.21 F&O - 1.27 Total Por�olio Turnover Ra�o^ : 2.48
INVESTMENT OBJECTIVE
$Tax Advantage Fund
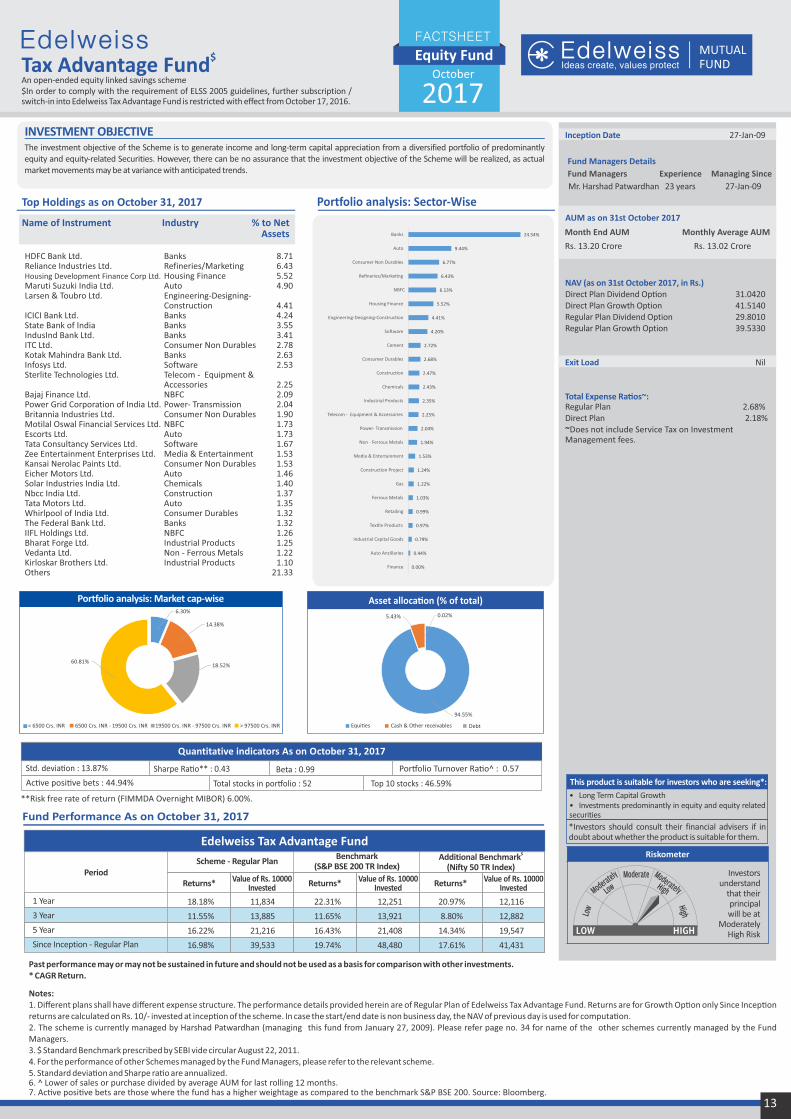
The investment objective of the Scheme is to generate income and long-term capital appreciation from a diversified portfolio of predominantly equity and equity-related Securities. However, there can be no assurance that the investment objective of the Scheme will be realized, as actual market movements may be at variance with anticipated trends.
13
Fund Performance As on October 31, 2017
Edelweiss Tax Advantage Fund
Scheme - Regular PlanBenchmark
(S&P BSE 200 TR Index)
Returns* Returns* Returns*Period
Past performance may or may not be sustained in future and should not be used as a basis for comparison with other investments. * CAGR Return.
Notes:1. Different plans shall have different expense structure. The performance details provided herein are of of Regular Plan Edelweiss Tax Advantage Fund. Returns are for Growth Op�on only Since Incep�on returns are calculated on Rs. 10/- invested at incep�on of the scheme. In case the start/end date is non business day, the NAV of previous day is used for computa�on.2. The scheme is currently managed by Harshad Patwardhan (managing this fund from January 27, 2009). Please refer page no. 34 for name of the other schemes currently managed by the Fund Managers.3. $ Standard Benchmark prescribed by SEBI vide circular August 22, 2011.4. For the performance of other Schemes managed by the Fund Managers, please refer to the relevant scheme.5. Standard devia�on and Sharpe ra�o are annualized.6. ^ Lower of sales or purchase divided by average AUM for last rolling 12 months. 7. Ac�ve posi�ve bets are those where the fund has a higher weightage as compared to the benchmark S&P BSE 200. Source: Bloomberg.
$Additional Benchmark(Nifty 50 TR Index)
1 Year
3 Year
5 Year
Since Inception - Regular Plan
18.18% 11,834 22.31% 12,251 20.97% 12,116
11.55% 13,885 11.65% 13,921 8.80% 12,882
16.22% 21,216 16.43% 21,408 14.34% 19,547
16.98% 39,533 19.74% 48,480 17.61% 41,431
Equity FundFACTSHEET
October
2017
Portfolio analysis: Market cap-wise
An open-ended equity linked savings scheme$In order to comply with the requirement of ELSS 2005 guidelines, further subscription / switch-in into Edelweiss Tax Advantage Fund is restricted with effect from October 17, 2016.
This product is suitable for investors who are seeking*:
*Investors should consult their financial advisers if in doubt about whether the product is suitable for them.
• Long Term Capital Growth• Investments predominantly in equity and equity related securities
Investors understand
that their principal will be at
Moderately High Risk
Riskometer
Fund Managers Details
Mr. Harshad Patwardhan 23 years 27-Jan-09
Managing SinceFund Managers Experience
Inception Date 27-Jan-09
NAV (as on 31st 017, in Rs.)October 2Direct Plan Dividend Op�on 31.0420Direct Plan Growth Option 41.5140Regular Plan Dividend Option 29.8010Regular Plan Growth Option 39.5330
Exit Load Nil
Total Expense Ra�os~: Regular Plan 2.68%Direct Plan 2.18%~Does not include Service Tax on Investment Management fees.
Portfolio analysis: Sector-Wise
Name of Instrument Industry % to Net Assets
Top Holdings as on October 31, 2017
Quantitative indicators As on October 31, 2017
Sharpe Ra�o** : 0.43 Beta : 0.99
Ac�ve posi�ve bets : 44.94%
Por�olio Turnover Ra�o^ : 0.57
Total stocks in por�olio : 52 Top 10 stocks : 46.59%
Std. devia�on : 13.87%
Value of Rs. 10000 Invested
Value of Rs. 10000 Invested
Value of Rs. 10000 Invested
**Risk free rate of return (FIMMDA Overnight MIBOR) 6.00%.
AUM as on 31st October 2017
Month End AUM Monthly Average AUM
Rs. 13.20 Crore Rs. 13.02 Crore
Asset alloca�on (% of total)
Equi�es Cash & Other receivables Debt
HDFC Bank Ltd. Banks 8.71Reliance Industries Ltd. Refineries/Marketing 6.43Housing Development Finance Corp Ltd. Housing Finance 5.52Maruti Suzuki India Ltd. Auto 4.90Larsen & Toubro Ltd. Engineering-Designing- Construction 4.41ICICI Bank Ltd. Banks 4.24State Bank of India Banks 3.55IndusInd Bank Ltd. Banks 3.41ITC Ltd. Consumer Non Durables 2.78Kotak Mahindra Bank Ltd. Banks 2.63Infosys Ltd. Software 2.53Sterlite Technologies Ltd. Telecom - Equipment & Accessories 2.25Bajaj Finance Ltd. NBFC 2.09Power Grid Corporation of India Ltd. Power- Transmission 2.04Britannia Industries Ltd. Consumer Non Durables 1.90Motilal Oswal Financial Services Ltd. NBFC 1.73Escorts Ltd. Auto 1.73Tata Consultancy Services Ltd. Software 1.67Zee Entertainment Enterprises Ltd. Media & Entertainment 1.53Kansai Nerolac Paints Ltd. Consumer Non Durables 1.53Eicher Motors Ltd. Auto 1.46Solar Industries India Ltd. Chemicals 1.40Nbcc India Ltd. Construction 1.37Tata Motors Ltd. Auto 1.35Whirlpool of India Ltd. Consumer Durables 1.32The Federal Bank Ltd. Banks 1.32IIFL Holdings Ltd. NBFC 1.26Bharat Forge Ltd. Industrial Products 1.25Vedanta Ltd. Non - Ferrous Metals 1.22Kirloskar Brothers Ltd. Industrial Products 1.10Others 21.33
< 6500 Crs. INR 6500 Crs. INR - 19500 Crs. INR 19500 Crs. INR - 97500 Crs. INR > 97500 Crs. INR
6.30%
14.38%
18.52%60.81%
94.55%
5.43% 0.02%
0.00%
0.44%
0.79%
0.97%
0.99%
1.03%
1.22%
1.24%
1.53%
1.94%
2.04%
2.25%
2.35%
2.43%
2.47%
2.68%
2.72%
4.20%
4.41%
5.52%
6.13%
6.43%
6.77%
9.44%
24.54%
Finance
Auto Ancillaries
Industrial Capital Goods
Tex�le Products
Retailing
Ferrous Metals
Gas
Construc�on Project
Media & Entertainment
Non - Ferrous Metals
Power- Transmission
Telecom - Equipment & Accessories
Industrial Products
Chemicals
Construc�on
Consumer Durables
Cement
So�ware
Engineering-Designing-Construc�on
Housing Finance
NBFC
Refineries/Marke�ng
Consumer Non Durables
Auto
Banks

Liquid Fund
The investment objec�ve of the Scheme is to provide reasonable returns, commensurate with low risk while providing a high level of liquidity, through a por�olio of money market and debt securi�es. However there can be no assurance that the investment objec�ves of the Scheme will be realized.
INVESTMENT OBJECTIVE
14
Fund Performance As on October 31, 2017
Past performance may or may not be sustained in future and should not be used as a basis for comparison with other investments. * CAGR Return.
Notes:1. Different plans shall have different expense structure. The performance details provided herein are of Regular Plan of Edelweiss Liquid Fund. Returns are for Growth Op�on only. Since Incep�on returns are calculated on Rs. 1000/- invested at incep�on of the scheme. In case the start/end date is non business day, the NAV of previous day is used for computa�on.2. The scheme is currently managed by Gautam Kaul (managing this fund from February 1, 2017). Please refer page no. 34 for name of the other schemes currently managed by the Fund Managers.3. $ Standard Benchmark prescribed by SEBI vide circular August 22, 2011.4. @ Returns are annualized5. For the performance of other Schemes managed by the Fund Managers, please refer to the relevant scheme.
Edelweiss Liquid Fund
Period
Scheme - Regular Plan Benchmark(CRISIL Liquid Fund Index)
Returns* Returns*
$Additional Benchmark(CRISIL 1 year T-bill Index)
Value of Rs. 10000 Invested
Value of Rs. 10000 InvestedReturns*Value of Rs. 10000
Invested
Investors understand
that their principal
will beat Low Risk
Riskometer
This product is suitable for investors who are seeking*
• Income Over Short Term• Investments in money market and debt securi�es
*Investors should consult their financial advisers if in doubt about whether the product is suitable for them.
Last 7 days@
Last 15 days@
Last 30 days@
1 Year
3 Year
5 Year
Since Inception - Regular Plan
Debt FundFACTSHEET
October
2017An open-ended liquid scheme
Fund Managers Details
Mr. Gautam Kaul 15 years 1-Feb-17
Managing SinceFund Managers Experience
Quantitative indicators As on October 31, 2017
Modified Dura�on : 0.06 years Average Maturity : 0.06 yearsYield to maturity (YTM) : 6.60%
Incep�on Date 21-Sep-07
NAV (as on 31st October 2017, in Rs.)Direct Plan Daily Dividend Op�on 1001.0100Direct Plan Monthly Dividend Op�on 1026.0914Direct Plan Growth Op�on 2171.5190Regular Plan Annual Dividend Op�on 1494.7728Regular Plan Monthly Dividend Op�on 1004.1311Regular Plan Weekly Dividend Op�on 1019.0587Regular Plan Daily Dividend Op�on 1002.7900Regular Plan Growth Op�on 2160.5398
Minimum Investment AmountRs 5,000 per applica�on and in mul�ples of Re 1/-therea�er.
Addi�onal investment amountRs 1,000/- per applica�on and in mul�ples of Re 1/- therea�er.
Exit Load Nil
Total Expense Ra�os~:Regular Plan 0.13%Direct Plan 0.02%~Does not include Service Tax on Investment Management fees.
91 DAYS TBILL RED 21-12-2017 SOV 11.24
ICICI BANK CD RED 17-11-2017 ICRA A1+ 11.15
BAJAJ FINANCE CP 09-11-2017 CRISIL A1+ 8.08
ADITYA BIRLA FIN CP 09-11-17 ICRA A1+ 8.08
NABARD CP RED 20-11-17 CRISIL A1+ 8.07
L&T HSG FIN LTD CP 27-11-17 CRISIL A1+ 6.05
L&T INFRASTRUCTURE FIN CP RED 06-11-2017 ICRA A1+ 4.04
IL & FS LTD RED CP 13-11-2017 CARE A1+ 4.04
KOTAK MAHINDRA BANK CD RED 16-11-2017 CRISIL A1+ 4.04
RELIANCE INDUSTRIES CP RED 20-11-2017 CRISIL A1+ 4.04
IIFL WEALTH FINANCE CP 28-11-17 ICRA A1+ 4.03
IDFC BANK LTD CD RED 04-12-2017 ICRA A1+ 4.03
INDIABULLS HSG FIN CP RED 04-12-2017 CRISIL A1+ 4.03
POWER FIN CORP CP RED 14-12-2017 CRISIL A1+ 4.02
CBLO 2.54
91 DAYS TREASURY BILL RED 30-11-2017 SOV 2.42
HDFC LTD CP RED 07-11-2017 CRISIL A1+ 2.02
KOTAK MAHINDRA BANK CD RED 29-11-2017 CRISIL A1+ 2.02
AXIS BANK LTD CD RED 30-11-2017 CRISIL A1+ 2.01
L&T FINANCE LTD CP RED 22-12-2017 CARE A1+ 2.01
ECL FINANCE LTD ELD RED 02-11-17 F7K503A ICRA AA 1.78
ECL FINANCE LTD ELD RED 13-11-17 G9H601C ICRA AA 0.18
Others 0.09
Top Holdings as on October 31, 2017
Name of Instrument % to NAVRa�ngAUM as on 31st October 2017
Month End AUM Monthly Average AUM
Rs. 1,448.62 CroreRs. 1,069.58 Crore
Rating Profile
Maturity Profile
Asset alloca�on (% of total)
6.29% 10,012 6.06% 10,012 2.51% 10,005
6.26% 10,026 6.20% 10,025 3.83% 10,016
6.32% 10,050 6.30% 10,050 5.28% 10,042
6.52% 10,652 6.71% 10,671 5.91% 10,591
7.29% 12,354 7.57% 12,450 7.30% 12,357
8.03% 14,716 8.17% 14,810 7.23% 14,179
7.91% 21,605 7.55% 20,890 6.42% 18,768
58.51%
23.24%
13.66%
2.54% 1.96% 0.09%
Commercial Paper Cer�ficate of Deposit Treasury Bill
CBLO/Repo Zero Coupon Bonds Net Rec / (Pay)
1.96%
81.75%
2.62%
13.66%
AA A1+ Cash & Other Receivables SOV
30.86%
69.14%
0%
10%
20%
30%
40%
50%
60%
70%
80%
0 to 1 month 1 - 2 Month

Ultra Short Term Fund
The investment objec�ve is to provide liquidity and op�mal returns to the investors by inves�ng primarily in a mix of short term debt and money market instruments which results in a por�olio having marginally higher maturity and moderately higher credit risk as compared to a liquid fund at the same �me maintaining a balance between safety and liquidity. However, there can be no assurance that the investment objec�ve of the Scheme will be realized.
INVESTMENT OBJECTIVE
15
Fund Performance As on October 31, 2017
Edelweiss Ultra Short Term Fund
Period
Benchmark(CRISIL Liquid Fund Index)
Returns* Returns*
Past performance may or may not be sustained in future and should not be used as a basis for comparison with other investments. * CAGR Return.
Notes:1. Different plans shall have different expense structure. The performance details provided herein are of of Regular Plan Edelweiss Ultra Short Term Fund. Returns are for Growth Op�on only. Since Incep�on returns are calculated on Rs. 1000/- invested at incep�on of the scheme. In case the start/end date is non business day, the NAV of previous day is used for computa�on.2. The scheme is currently managed by Gautam Kaul (managing this fund from February 1, 2017). Please refer page no. 34 for name of the other schemes currently managed by the Fund Managers.3. $ Standard Benchmark prescribed by SEBI vide circular August 22, 2011.4. For the performance of other Schemes managed by the Fund Managers, please refer to the relevant scheme.
$Additional Benchmark(CRISIL 1 year T-bill Index)
Scheme - Regular Plan
7.13% 10,719 6.71% 10,677 5.92% 10,597
4.50% 11,413 7.57% 12,450 7.30% 12,357
6.38% 13,623 8.17% 14,810 7.23% 14,179
7.21% 20,221 7.55% 20,890 6.42% 18,768
Returns*
LOW HIGH
Investors understand
that their principal will be at
moderately low risk
Riskometer
This product is suitable for investors who are seeking*
• Op�mal returns over short term• Investments primarily in a mix of short term debt and money market instruments
*Investors should consult their financial advisers if in doubt about whether the product is suitable for them.
1 Year
3 Year
5 Year
Since Inception - Regular Plan
Debt FundFACTSHEET
October
2017An open ended income scheme
Fund Managers Details
Mr. Gautam Kaul 15 years 1-Feb-17
Managing SinceFund Managers Experience
AUM as on 31st October 2017
Month End AUM Monthly Average AUM
Rs. 182.50 CroreRs. 334.10 Crore
Incep�on Date 21-Sep-07
NAV (as on 31st October 2017, in Rs.)
Direct Plan Daily Dividend Op�on 1008.2500
Direct Plan Growth Op�on 2040.8101
Direct Plan Weekly Dividend Op�on 1037.4789
Regular Plan Daily Dividend Op�on 1000.8900
Regular Plan Weekly Dividend Op�on 1008.1954
Regular Plan Monthly Dividend Op�on 1005.8469
Regular Plan Dividend Op�on 1368.7197
Regular Plan Growth Op�on 2022.0599
Minimum Investment Amount
Rs 5,000 per applica�on and in mul�ples of Re 1/-
therea�er.
Addi�onal investment amount
Rs 1,000/- per applica�on and in mul�ples of Re 1/- therea�er.
Exit Load Nil
Total Expense Ra�os~:
Regular Plan # 1.01%
Direct Plan 0.25%~Does not include Service Tax on Investment Management fees.
Value of Rs. 10000 Invested
Quantitative indicators As on October 31, 2017
Modified Dura�on : 0.34 years Average Maturity : 0.57 yearsYield to maturity (YTM) : 7.18%
323 DAYS TBILL RED 13-03-2018 SOV 30.46
CBLO 29.43
9.00% EDEL COMM 17-04-2020 P/C 19-04-18 ICRA AA 8.04
INFINA FINANCE PVT CP 06-11-17 CRISIL A1+ 7.78
JM FIN PRODUCTS CP 06-11-17 CRISIL A1+ 7.78
9.1% DEWAN HSG FIN NCD RED 16-08-2019 CARE AAA 2.50
6.95% LIC HOUSING FIN NCD RED 06-09-2018 CRISIL AAA 2.49
ICICI BANK CD RED 17-11-2017 ICRA A1+ 2.17
9% EDEL RETAIL 190820 P190218 P/C 200818 ICRA AA 1.62
9.80% ECL FINANCE LTD NCD RED 31-12-2020 CARE AA 1.60
7.81% EXIM BANK NCD RED 05-11-2018 CRISIL AAA 1.57
8.95% POWER FIN CORP NCD RED 11-03-2018 CRISIL AAA 1.57
8.14% HUDCO NCD RED 30-05-2018 CARE AAA 1.57
7% IRFC LTD NCD RED 10-09-2018 CRISIL AAA 1.56
EDELWEISS COMM SERV ZCB RED 14-02-2020 CRISIL AA 0.67
EDELWEISS FIN SER ZCB RED 10-04-18 ICRA AA 0.67
8.92% ADITYA BIRLA FIN NCD RED 12-04-18 ICRA AA+ 0.63
NABARD ZCB RED 01-01-2018 CRISIL AAA 0.59
EDEL FIN & INV ELD 12-01-18 SR H7I401 ICRA AA 0.45
9.63% RURAL ELEC CORP NCD RED 05-02-2019 CARE AAA 0.32
8.84% POWER GRID CORP NCD RED 21-10-2018 CRISIL AAA 0.32
10.60% INDIAN RAIL FIN NCD RED 11-09-18 CRISIL AAA 0.26
9.39% POWER FIN CORP NCD RED 27-08-2019 CRISIL AAA 0.19
9.28% POWER FIN CORP NCD RED 28-12-17 CRISIL AAA 0.19
8.19% NABARD NCD RED 08-06-2018 CRISIL AAA 0.16
9.53% PNB HOUSING FIN LTD NCD 31-01-19 ICRA AA+ 0.10
8.80% POWER GRID CORP NCD RED 29-09-19 CRISIL AAA 0.08
8.65% RURAL ELEC CORP NCD RED 15-01-2019 CRISIL AAA 0.06
9.14% LIC HOUSING FIN NCD RED 16-01-2018 CRISIL AAA 0.06
Others -4.87
Top Holdings as on October 31, 2017
Name of Instrument % to NAVRa�ng
Value of Rs. 10000 Invested
Value of Rs. 10000 Invested
Rating Profile
Maturity Profile
Asset alloca�on (% of total)
30.46%
29.43%
24.88%
15.55%
2.37%
2.17%-4.87%
Treasury Bill CBLO/Repo Non -Conver�ble Debentures Commercial Paper
Zero Coupon Bonds Cer�ficate of Deposit Net Rec / (Pay)
13.04%
13.49%
0.72%
17.73%
24.56%
30.46%
AA AAA AA+ A1+ Cash & Other Receivables SOV
43.57%
33.32%
1.72%4.62%
16.76%
0%
5%
10%
15%
20%
25%
30%
35%
40%
45%
50%
0 - 3 month 3 - 6 month 6 - 9 month 9 - 12 month More than 1 Year
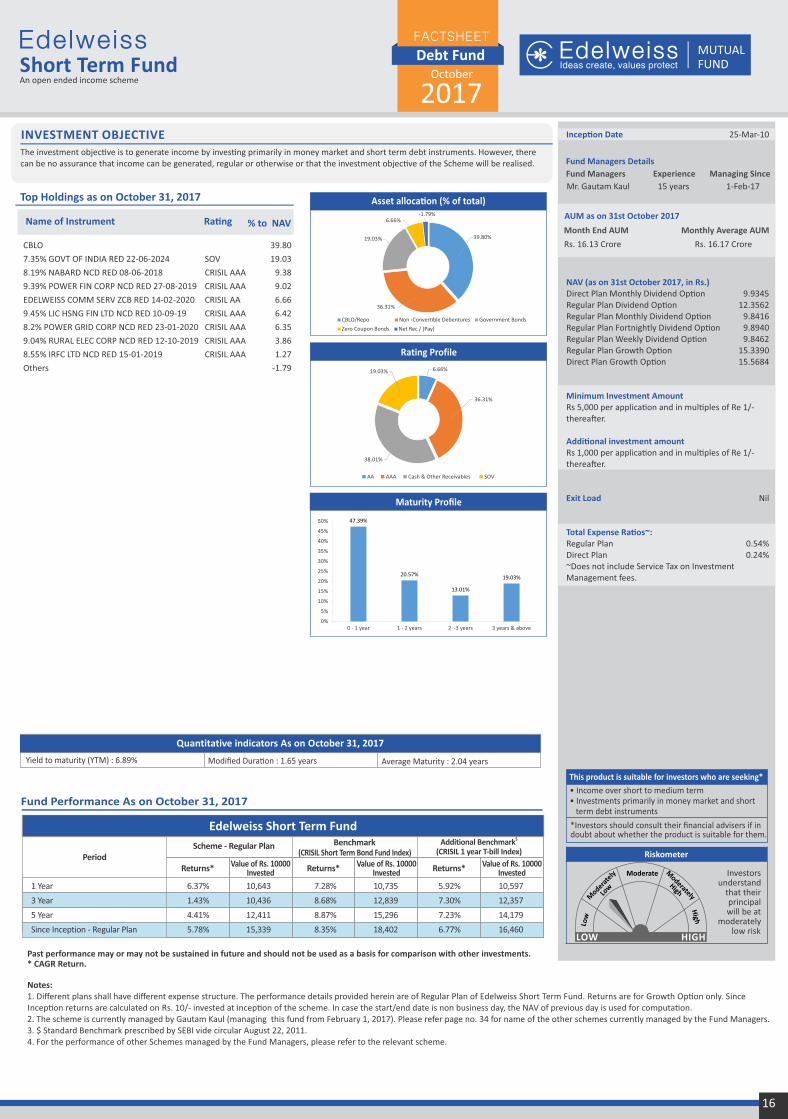
Short Term Fund
The investment objec�ve is to generate income by inves�ng primarily in money market and short term debt instruments. However, there can be no assurance that income can be generated, regular or otherwise or that the investment objec�ve of the Scheme will be realised.
INVESTMENT OBJECTIVE
16
LOW HIGH
Investors understand
that their principal will be at
moderately low risk
Riskometer
This product is suitable for investors who are seeking*
• Income over short to medium term• Investments primarily in money market and short term debt instruments
*Investors should consult their financial advisers if in doubt about whether the product is suitable for them.
Fund Performance As on October 31, 2017
Edelweiss Short Term Fund
PeriodScheme - Regular Plan Benchmark
(CRISIL Short Term Bond Fund Index)
Returns* Returns* Returns*
Past performance may or may not be sustained in future and should not be used as a basis for comparison with other investments. * CAGR Return.
Notes:1. Different plans shall have different expense structure. The performance details provided herein are of of Regular Plan Edelweiss Short Term Fund. Returns are for Growth Op�on only. Since Incep�on returns are calculated on Rs. 10/- invested at incep�on of the scheme. In case the start/end date is non business day, the NAV of previous day is used for computa�on.2. The scheme is currently managed by Gautam Kaul (managing this fund from February 1, 2017). Please refer page no. 34 for name of the other schemes currently managed by the Fund Managers.3. $ Standard Benchmark prescribed by SEBI vide circular August 22, 2011.4. For the performance of other Schemes managed by the Fund Managers, please refer to the relevant scheme.
$Additional Benchmark(CRISIL 1 year T-bill Index)
1 Year
3 Year
5 Year
Since Inception - Regular Plan
6.37% 10,643 7.28% 10,735 5.92% 10,597
1.43% 10,436 8.68% 12,839 7.30% 12,357
4.41% 12,411 8.87% 15,296 7.23% 14,179
5.78% 15,339 8.35% 18,402 6.77% 16,460
Debt FundFACTSHEET
October
2017An open ended income scheme
Fund Managers Details
Mr. Gautam Kaul 15 years 1-Feb-17
Managing SinceFund Managers Experience
AUM as on 31st October 2017
Month End AUM
Incep�on Date 25-Mar-10
NAV (as on 31st October 2017, in Rs.)Direct Plan Monthly Dividend Op�on 9.9345Regular Plan Dividend Op�on 12.3562Regular Plan Monthly Dividend Op�on 9.8416Regular Plan Fortnightly Dividend Op�on 9.8940Regular Plan Weekly Dividend Op�on 9.8462Regular Plan Growth Op�on 15.3390Direct Plan Growth Op�on 15.5684
Minimum Investment AmountRs 5,000 per applica�on and in mul�ples of Re 1/-therea�er.
Addi�onal investment amountRs 1,000 per applica�on and in mul�ples of Re 1/- therea�er.
Exit Load Nil
Total Expense Ra�os~:Regular Plan 0.54%Direct Plan 0.24%~Does not include Service Tax on Investment Management fees.
Value of Rs. 10000 Invested
Value of Rs. 10000 Invested
Value of Rs. 10000 Invested
Quantitative indicators As on October 31, 2017
Modified Dura�on : 1.65 years Average Maturity : 2.04 yearsYield to maturity (YTM) : 6.89%
CBLO 39.80
7.35% GOVT OF INDIA RED 22-06-2024 SOV 19.03
8.19% NABARD NCD RED 08-06-2018 CRISIL AAA 9.38
9.39% POWER FIN CORP NCD RED 27-08-2019 CRISIL AAA 9.02
EDELWEISS COMM SERV ZCB RED 14-02-2020 CRISIL AA 6.66
9.45% LIC HSNG FIN LTD NCD RED 10-09-19 CRISIL AAA 6.42
8.2% POWER GRID CORP NCD RED 23-01-2020 CRISIL AAA 6.35
9.04% RURAL ELEC CORP NCD RED 12-10-2019 CRISIL AAA 3.86
8.55% IRFC LTD NCD RED 15-01-2019 CRISIL AAA 1.27
Others -1.79
Top Holdings as on October 31, 2017
Name of Instrument % to NAVRa�ng
Rating Profile
Maturity Profile
Asset alloca�on (% of total)
Monthly Average AUM
Rs. 16.17 Crore39.80%
36.31%
19.03%
6.66%-1.79%
CBLO/Repo Non -Conver�ble Debentures Government Bonds
Zero Coupon Bonds Net Rec / (Pay)
6.66%
36.31%
38.01%
19.03%
AA AAA Cash & Other Receivables SOV
47.39%
20.57%
13.01%
19.03%
0%
5%
10%
15%
20%
25%
30%
35%
40%
45%
50%
0 - 1 year 1 - 2 years 2 -3 years 3 years & above
Rs. 16.13 Crore

Banking And PSU Debt Fund
The investment objec�ve of the Scheme is to seek to generate income by inves�ng predominantly in a por�olio of Debt Securi�es and Money Market Instruments issued by banks and PSUs. However, there can be no assurance that the investment objec�ve of the Scheme will be realized or that income will be generated.
INVESTMENT OBJECTIVE
17
Investors understand
that their principal will be at
Moderate Risk
Riskometer
This product is suitable for investors who are seeking*
• Income Over short to medium term• Investments in Debt Securi�es and Money Market Instruments issued by Banks and PSUs.
*Investors should consult their financial advisers if in doubt about whether the product is suitable for them.
Fund Performance As on October 31, 2017
Edelweiss Banking And PSU Debt Fund
PeriodScheme - Regular Plan Benchmark
(CRISIL Short Term Bond Fund Index)
1 Year
3 Year
5 Year
Since Inception - Regular Plan
Returns* Returns* Returns*
Past performance may or may not be sustained in future and should not be used as a basis for comparison with other investments. * CAGR Return.
Notes:1. Different plans shall have different expense structure. The performance details provided herein are of of Regular Plan Edelweiss Banking And PSU Debt Fund. Returns are for Growth Op�on only. Since Incep�on returns are calculated on Rs. 10/- invested at incep�on of the scheme. In case the start/end date is non business day, the NAV of previous day is used for computa�on.2. The scheme is currently managed by Dhawal Dalal (managing this fund from November 28, 2016).Please refer page no. 34 for name of the other schemes currently managed by the Fund Managers.3. $ Standard Benchmark prescribed by SEBI vide circular August 22, 2011.4. Since the scheme is in existence for more than 1 year but less than 5 years hence performance data for 5 years and more is not provided5.For the performance of other Schemes managed by the Fund Managers, please refer to the relevant scheme.
$Additional Benchmark(CRISIL 1 year T-bill Index)
7.10% 10,716 7.28% 10,735 5.92% 10,597
7.94% 12,578 8.68% 12,839 7.30% 12,357
NA NA NA NA NA NA
8.69% 14,112 9.23% 14,402 7.61% 13,543
Debt FundFACTSHEET
October
2017An open-ended income scheme
Value of Rs. 10000 Invested
Value of Rs. 10000 Invested
Value of Rs. 10000 Invested
Quantitative indicators As on October 31, 2017
Modified Dura�on : 2.39 years Average Maturity : 3.05 yearsYield to maturity (YTM) : 7.38%
8% IDBI BANK LTD NCD RED 01-08-2018 ICRA A 8.71
CBLO 6.67
9.5% INDUSIND BANK PERPE CALL 18-04-2022 CRISIL AA 6.29
8.15% NABARD NCD RED 04-03-20 (P 040518) CRISIL AAA 6.29
7.20% IRFC LTD NCD RED 29-05-2020 CRISIL AAA 6.17
7.03% RURAL ELECTR NCD RED 07-09-2022 CARE AAA 6.11
9.25% DEWAN HOUSING FIN NCD RED 09-09-23 CARE AAA 5.31
8.85% HDFC BANK PERPETUAL C 12/05/2022 CRISIL AA+ 4.99
7.17% NHAI LTD NCD RED 23-12-2021 CRISIL AAA 4.92
7.42% POWER FIN COR SR165 RED 26-06-2020 CRISIL AAA 4.69
6.95% LIC HOUSING FIN NCD RED 06-09-2018 CRISIL AAA 4.16
9.20% ICICI BK PERPETUAL CALL-17/03/2022 CARE AA+ 3.77
7.35% GOVT OF INDIA RED 22-06-2024 SOV 3.76
8.37% RURAL ELEC CORP NCD RED 14-08-2020 CRISIL AAA 2.54
8.85% POWER GRID CORP NCD RED 19-10-2018 CRISIL AAA 2.50
6.90% NABARD RED 09-03-20 P/C 12/03/18 CRISIL AAA 2.45
6.73% IRFC LTD NCD RED 23-03-2020 CRISIL AAA 2.44
6.79% GOVT OF INDIA RED 15-05-2027 SOV 2.44
8.84% POWER GRID CORP NCD RED 21-10-2018 CRISIL AAA 2.25
8.55% ICICI BANK PERPETUAL CALL 20-09-22 CARE AA+ 1.72
7.72% GOVT OF INDIA RED 25-05-2025 SOV 1.28
9.30% POWER GRID CORP NCD RED 28-06-2019 CRISIL AAA 1.27
9.47% POWER GRID CORP NCD RED 31-03-2019 CRISIL AAA 1.27
8.55% IRFC LTD NCD RED 15-01-2019 CRISIL AAA 1.25
8.73% POWER GRID CORP NCD RED 11-10-2018 CRISIL AAA 1.25
7.95% NABARD NCD 21-01-2019 PUT-200117 CRISIL AAA 1.24
7.81% EXIM BANK NCD RED 05-11-2018 CRISIL AAA 1.24
9.45% LIC HSNG FIN LTD NCD RED 10-09-19 CRISIL AAA 1.02
8.45% HOUSING DEV FIN NCD RED 08-02-19 CRISIL AAA 0.99
8.06% SIDBI NCD RED 28-03-2019 CARE AAA 0.52
Others 0.45
Top Holdings as on October 31, 2017
Name of Instrument % to NAVRa�ng
Fund Managers Details
Mr. Dhawal Dalal 20 years 28-Nov-16
Managing SinceFund Managers Experience
Incep�on Date 13-Sep-13
NAV (as on 31st October 2017, in Rs.)Direct Plan Growth Op�on 14.2858Direct Plan Monthly Dividend Op�on 10.3472Direct Plan Weekly Dividend Op�on 10.9506Regular Plan Dividend Op�on 14.1112Regular Plan Growth Op�on 14.1116Regular Plan Monthly Dividend Op�on 10.3332Regular Plan Weekly Dividend Op�on 10.4920
Minimum Investment AmountRs 5,000 per applica�on and in mul�ples of Re 1/-therea�er.
Addi�onal investment amountRs 1,000 per applica�on and in mul�ples of Re 1/- therea�er.
Exit Load Nil
Total Expense Ra�os~:Regular Plan 0.55%Direct Plan 0.25%~Does not include Service Tax on Investment Management fees.
AUM as on 31st October 2017
Month End AUM Monthly Average AUM
Rs. 408.09 CroreRs. 407.51 Crore
Rating Profile
Maturity Profile
Asset alloca�on (% of total)
85.54%
7.49%
6.67% 0.30%
Non -Conver�ble Debentures Government Bonds CBLO/Repo Net Rec / (Pay)
6.29%
60.05%
8.71%
10.48%
6.98%
7.49%
AA AAA A AA+ Cash & Other Receivables SOV
25.86%
8.96%
24.59%
27.80%
12.79%
0%
5%
10%
15%
20%
25%
30%
0 - 1 year 1 - 2 years 2 - 3 years 3 - 5 years 5 years & above

Corporate DebtOpportuni�es Fund
The investment objec�ve is to generate regular income and opportuni�es for capital apprecia�on while maintaining liquidity through ac�ve management of a diversified por�olio comprising of corporate bonds and securi�es across the investment grade credit ra�ng and maturity spectrum. However, there can be no assurance that the investment objec�ves of the Scheme will be realized.
INVESTMENT OBJECTIVE
18
Fund Performance As on October 31, 2017
Edelweiss Corporate Debt Opportunities Fund
Period
Scheme - Regular Plan Benchmark(CRISIL Short Term Bond Fund Index)
Returns*
Past performance may or may not be sustained in future and should not be used as a basis for comparison with other investments. * CAGR Return.
Notes:1. Different plans shall have different expense structure. The performance details provided herein are of of Regular Plan Edelweiss Corporate Debt Opportuni�es Fund. Returns are for Growth Op�on only. Since Incep�on returns are calculated on Rs. 10/- invested at incep�on of the scheme. In case the start/end date is non business day, the NAV of previous day is used for computa�on.2. The scheme is currently managed by August 03, 2017).Dhawal Dalal (managing this fund from November 28, 2016) and Mr. Gautam Kaul (Managing this fund from Please refer page no. 34 for name of the other schemes currently managed by the Fund Managers.3. $ Standard Benchmark prescribed by SEBI vide circular August 22, 2011.4. Since the scheme is in existence for more than 1 year but less than 5 years hence performance data for 5 years and more is not provided5. For the performance of other Schemes managed by the Fund Managers, pleaserefer to the relevant scheme.
$Additional Benchmark(CRISIL 10 year Gilt Index)
1 Year
3 Year
5 Year
Since Inception - Regular Plan
8.44% 10,851 7.28% 10,735 5.11% 10,516
8.79% 12,878 8.68% 12,839 9.43% 13,107
NA NA NA NA NA NA
9.27% 13,173 8.81% 13,004 9.75% 13,356
Returns* Returns* Investors understand
that their principal will be at
Moderate Risk
Riskometer
This product is suitable for investors who are seeking*
• Regular income & capital apprecia�on through ac�ve management across �me frames.• Investment in corporate bonds and securi�es across the investment grade credit ra�ng and maturity spectrum.*Investors should consult their financial advisers if in doubt about whether the product is suitable for them.
Debt FundFACTSHEET
October
2017An open-ended income scheme
Value of Rs. 10000 Invested
Value of Rs. 10000 Invested
Value of Rs. 10000 Invested
10.25% ECL FIN PERPET CALL 08-05-27 BWR AA 9.63
9.25% DEWAN HOUSING FIN NCD RED 09-09-23 CARE AAA 9.36
CBLO 8.38
9.95% SYNDICATE BANK CALL 25/10/2021 CARE AA- 8.07
7.60% NHAI LTD NCD RED 18-03-2022 CRISIL AAA 6.37
8.7% EDELWEISS COMM 15-04-2020 C/P140818 CRISIL AA 6.28
9.75% RELIANCE UTILI & POWER 02-08-2024 CRISIL AAA 5.13
8.20% POWER GRID CORP NCD RED 23-01-2025 CRISIL AAA 4.87
8.45% RELIANCE PORTS & TER NCD 12-06-23 CRISIL AAA 4.86
8.37% RURAL ELEC CORP NCD RED 14-08-2020 CRISIL AAA 4.86
8.75% INDIABULLS HSNG FIN NCD 26-09-2021 CARE AAA 4.80
10.6% FULLERTON INDIA CR NCD RED 280423 ICRA AA+ 3.41
EDELWEISS COMM SERV ZCB RED 14-02-2020 CRISIL AA 3.36
8.5% INDIAN RAIL FIN NCD RED 22-06-2020 CRISIL AAA 3.25
7.50% POWER FIN CORP NCD RED 17-09-2020 CRISIL AAA 3.16
2% THE INDIAN HOTELS CO NCD RED 09-12-19 ICRA AA 3.07
7.42% POWER FIN COR SR165 RED 26-06-2020 CRISIL AAA 1.89
9.04% EXIM BANK OF INDIA NCD RED 210922 CRISIL AAA 1.69
10.75% SHRIRAM TRAN FIN NCD RED 24102020 CRISIL AA+ 1.69
8.65% BANK OF BARODA PERP CAL 11-08-2022 CRISIL AA+ 1.57
8.55% ICICI BANK PERPETUAL CALL 20-09-22 CARE AA+ 1.57
Others 2.76
Top Holdings as on October 31, 2017
Name of Instrument % to NAVRa�ng
Quantitative indicators As on October 31, 2017
Modified Dura�on : 3.22 years Average Maturity : 4.50 yearsYield to maturity (YTM) : 8.00%
Incep�on Date 22-Sep-14
NAV (as on 31st October 2017, in Rs.)Direct Plan Dividend Op�on 13.3672Direct Plan Growth Op�on 13.3679Regular Plan Annual Dividend Op�on 13.1732Regular Plan Monthly Dividend Op�on 10.4954Regular Plan Fortnightly Dividend Op�on 10.8184Regular Plan Weekly Dividend Op�on 10.5715Regular Plan Dividend Op�on 13.1754Regular Plan Growth Op�on 13.1732
Minimum Investment AmountRs 5,000 per applica�on and in mul�ples of Re 1/-therea�er.
Addi�onal investment amountRs 1,000 per applica�on and in mul�ples of Re 1/- therea�er.
Exit Load 10% of the units allo�ed shall be redeemed without any Exit Load on or before comple�on of 365 days from the date of allotment of units. Any redemp�on in excess of such limit within 365 days from the date of allotment shall be subject to the following Exit Load: • If redeemed or switched out on or before
completion of 365 days from the date of allotment of units – 1.00%
• If redeemed or switched out after completion of 365 days from the date of allotment of units – NIL
Redemption of units would be done on First in First out Basis (FIFO).
Total Expense Ra�os~:Regular Plan 1.00%Direct Plan 0.50%~Does not include Service Tax on Investment Management fees.
AUM as on 31st October 2017
Month End AUM Monthly Average AUM
Rs. 312.44 CroreRs. 319.43 Crore
Rating Profile
Maturity Profile
Asset alloca�on (% of total)
Fund Managers Details
Mr. Dhawal Dalal 20 years 28-Nov-16Mr. Gautam Kaul 15 years 03-Aug-17
Managing SinceFund Managers Experience
85.51%
8.38%
3.36% 2.76%
Non -Conver�ble Debentures CBLO/Repo Zero Coupon Bonds Net Rec / (Pay)
22.35%
50.22%
8.23%
8.07%
11.13%
AA AAA AA+ AA- Cash & Other Receivables
11.13%
27.56%
24.05%
37.26%
0%
5%
10%
15%
20%
25%
30%
35%
40%
0 - 1 year 2 - 3 years 3 - 5 years 5 years & above

Bond Fund
To generate op�mal returns while maintaining liquidity through ac�ve management of the por�olio by inves�ng in debt and money market instruments. However, there can be no assurance that the investment objec�ve of the Scheme will be realised.
INVESTMENT OBJECTIVE
19
Investors understand
that their principal will be at
Moderate Risk
Riskometer
This product is suitable for investors who are seeking*
• Op�mal returns over medium to long term• Investments in debt and money market instruments with an ac�ve management of the por�olio.
*Investors should consult their financial advisers if in doubt about whether the product is suitable for them.
Fund Performance As on October 31, 2017
Past performance may or may not be sustained in future and should not be used as a basis for comparison with other investments. * CAGR Return.
Notes:1. Different plans shall have different expense structure. The performance details provided herein are of of Regular Plan Edelweiss Bond Fund. Returns are for Growth Op�on only. Since Incep�on returns are calculated on Rs. 10/- invested at incep�on of the scheme. In case the start/end date is non business day, the NAV of previous day is used for computa�on.2. The scheme is currently managed by Dhawal Dalal (managing this fund from November 28, 2016). Please refer page no. 34 for name of the other schemes currently managed by the Fund Managers.3. $ Standard Benchmark prescribed by SEBI vide circular August 22, 2011.4. For the performance of other Schemes managed by the Fund Managers, please refer to the relevant scheme.
Edelweiss Bond Fund
Period
Scheme - Regular Plan Benchmark(CRISIL Composite Bond Fund Index)
Returns* Returns*
$Additional Benchmark(CRISIL 10 year Gilt Index)
1 Year
3 Year
5 Year
Since Inception - Regular Plan
4.82% 10,486 7.17% 10,723 5.11% 10,516
7.35% 12,374 9.92% 13,284 9.43% 13,107
7.48% 14,344 9.25% 15,566 7.89% 14,622
6.45% 17,940 8.40% 21,255 7.45% 19,586
Debt FundFACTSHEET
October
2017An open-ended income scheme
Quantitative indicators As on October 31, 2017
Modified Dura�on : 4.35 years Average Maturity : 6.70 yearsYield to maturity (YTM) : 7.75%
CBLO 29.02
9.25% DEWAN HOUSING FIN NCD RED 09-09-23 CARE AAA 9.94
8.65% BANK OF BARODA PERP CAL 11-08-2022 CRISIL AA+ 9.66
6.79% GOVT OF INDIA RED 15-05-2027 SOV 9.60
6.68% GOVT OF INDIA RED 17-09-2031 SOV 9.37
8.40% NUCLEAR POW COR IN LTD NCD28-11-25 CRISIL AAA 7.68
10.25% ECL FIN PERPET CALL 08-05-27 BWR AA 6.85
7.73% GOVT OF INDIA RED 19-12-2034 SOV 5.01
8.7% EDELWEISS COMM 15-04-2020 C/P140818 CRISIL AA 4.84
8.55% ICICI BANK PERPETUAL CALL 20-09-22 CARE AA+ 3.86
9.54% TATA SONS LTD NCD RED 25-04-2022 CRISIL AAA 2.57
8.80% POWER FIN CORP NCD RED 15-01-2025 CRISIL AAA 2.56
9.68% I L & F S LTD NCD RED 25-07-2021 FITCH AAA 2.54
7.68% GOVT OF INDIA RED 15-12-2023 SOV 2.51
EDELWEISS COMM SERV ZCB RED 14-02-2020 CRISIL AA 2.49
7.59% GOVT OF INDIA RED 20-03-2029 SOV 2.48
7.60% NHAI LTD NCD RED 18-03-2022 CRISIL AAA 2.45
8.25% INDIABULLS HSNG FIN NCD 13-03-2020 CARE AAA 1.37
Others -14.82
Top Holdings as on October 31, 2017
Name of Instrument % to NAVRa�ng
Fund Managers Details
Mr. Dhawal Dalal 20 years 28-Nov-16
Managing SinceFund Managers Experience
Incep�on Date 27-Jun-08
NAV (as on 31st October 2017, in Rs.)Direct Plan Dividend Op�on 17.4944Direct Plan Growth Op�on 18.7585Regular Plan Dividend Op�on 16.8739Regular Plan Growth Op�on 17.9400
Minimum Investment AmountRs 5,000 per applica�on and in mul�ples of Re 1/-therea�er.
Addi�onal investment amountRs. 1/- per applica�on and in mul�ples of Re. 1/- therea�er.
Exit Load Nil
Total Expense Ra�os~:Regular Plan 1.75%Direct Plan 0.87%~Does not include Service Tax on Investment Management fees.
Value of Rs. 10000 Invested
Value of Rs. 10000 Invested
Value of Rs. 10000 Invested Returns*
AUM as on 31st October 2017
Month End AUM Monthly Average AUM
Rs. 208.03 CroreRs. 206.92 Crore
Rating Profile
Maturity Profile
Asset alloca�on (% of total)
54.34%
29.02%
28.98%
2.49%
-14.82%
Non -Conver�ble Debentures CBLO/Repo Government Bonds
Zero Coupon Bonds Net Rec / (Pay)
14.17%
29.12%
13.53%
14.20%
28.98%
AA AAA AA+ Cash & Other Receivables SOV
14.20%
8.70%
21.10%
56.00%
0%
10%
20%
30%
40%
50%
60%
0 - 1 year 2 - 3 years 3 - 5 years 5 years & above

Government Securi�es Fund
The investment objec�ve of the Scheme is to generate income through investment in Securi�es of various maturi�es issued and/or created by the Central Government and State Governments of India. However, there can be no assurance that the investment objec�ves of the Scheme will be realized.
INVESTMENT OBJECTIVE
20
Investors understand
that their principal will be at
Moderate Risk
Riskometer
This product is suitable for investors who are seeking*
• Credit risk free returns over medium to long term• Investments in Government Securi�es.
*Investors should consult their financial advisers if in doubt about whether the product is suitable for them.
Past performance may or may not be sustained in future and should not be used as a basis for comparison with other investments. * CAGR Return.
Notes:1. Different plans shall have different expense structure. The performance details provided herein are of of Regular Plan Edelweiss Government Securi�es Fund. Returns are for Growth Op�on only. Since Incep�on returns are calculated on Rs. 10/- invested at incep�on of the scheme. In case the start/end date is non business day, the NAV of previous day is used for computa�on.2. The scheme is currently managed by Dhawal Dalal (managing this fund from November 28, 2016). Please refer page no. 34 for name of the other schemes currently managed by the Fund Managers.3. $ Standard Benchmark prescribed by SEBI vide circular August 22, 2011.4. Since the scheme is in existence for more than 1 year but less than 5 years hence performance data for 5 years and more is not provided5. For the performance of other Schemes managed by the Fund Managers, please refer to the relevant scheme.
Debt FundFACTSHEET
October
2017An open-ended gilt scheme
Fund Performance As on October 31, 2017
Edelweiss Government Securities Fund
PeriodScheme - Regular Plan
Benchmark(CRISIL Gilt index)
1 Year
3 Year
5 Year
Since Inception - Regular Plan
Returns* Returns* Returns*
$Additional Benchmark(CRISIL 10 year Gilt Index)
5.19% 10,523 5.77% 10,582 5.11% 10,516
10.46% 13,482 9.78% 13,234 9.43% 13,107
NA NA NA NA NA NA
9.71% 14,108 11.05% 14,762 10.03% 14,263
Value of Rs. 10000 Invested
Value of Rs. 10000 Invested
Value of Rs. 10000 Invested
Quantitative indicators As on October 31, 2017
Modified Dura�on : 1.10 years Average Maturity : 1.28 yearsYield to maturity (YTM) : 6.18%
91 DAYS TREASURY BILL RED 09-11-2017 SOV 19.07
91 DAYS TREASURY BILL RED 30-11-2017 SOV 15.94
6.9% GOVT OF INDIA RED 13-07-2019 SOV 13.65
CBLO 12.16
8.27% GOVT OF INDIA RED- 09-06-2020 SOV 7.70
7.80% GOVT OF INDIA RED 03-05-2020 SOV 6.97
6.35% GOVT OF INDIA RED 02-01-2020 SOV 6.76
7.80% GOVT OF INDIA RED 11-04-2021 SOV 6.38
8.12% GOVT OF INDIA RED 10-12-2020 SOV 5.79
6.25% GOVT OF INDIA RED 02-01-2018 SOV 3.08
8.39% RAJASTHAN SDL RED 15-03-2020 SOV 0.51
7.35% GOVT OF INDIA RED 22-06-2024 SOV 0.25
8.30% GOVT OF INDIA RED 02-07-2040 SOV 0.20
Others 1.56
Top Holdings as on October 31, 2017
Name of Instrument % to NAVRa�ng
Incep�on Date 13-Feb-14
NAV (as on 31st October 2017, in Rs.)Direct Plan Growth Op�on 14.3518Regular Plan Dividend Op�on 14.1169Regular Plan Growth Op�on 14.1076Regular Plan Monthly Dividend Op�on 10.6725Regular Plan Weekly Dividend Op�on 10.6440Regular Plan Annual Dividend Op�on 14.1141
Minimum Investment AmountRs 5,000 per applica�on and in mul�ples of Re 1/-therea�er.
Addi�onal investment amountRs 1,000 per applica�on and in mul�ples of Re 1/- therea�er.
Exit Load Nil
Total Expense Ra�os~:Regular Plan 1.25%Direct Plan 0.75%~Does not include Service Tax on Investment Management fees.
Fund Managers Details
Mr. Dhawal Dalal 20 years 28-Nov-16
Managing SinceFund Managers Experience
AUM as on 31st October 2017
Month End AUM Monthly Average AUM
Rs. 810.94 CroreRs. 811.90 Crore
Rating Profile
Maturity Profile
Asset alloca�on (% of total)
50.77%
35.00%
12.16%
1.56% 0.51%
Government Bonds Treasury Bill CBLO/Repo Net Rec / (Pay) SDL
13.72%
86.28%
Cash & Other Receivables SOV
51.80%
13.65%
21.93%
12.17%
0.25% 0.20%0%
10%
20%
30%
40%
50%
60%
0 - 1 year 1 - 2 years 2 - 3 years 3 - 5 years 5 - 15 years More than 15Years

INVESTMENT OBJECTIVE
ETF - Nifty 50
The investment objective of the scheme is to provide returns before expenses that closely correspond to the total returns of the Nifty 50 subject to tracking errors. However, there is no assurance that the investment objective of the Scheme will be realized and the Scheme does not assure or guarantee any returns.
SECTOR ALLOCATION - % of Equity Holdings
21
Name of Instrument Industry % to Net Assets
HDFC Bank Ltd. Banks 9.26Reliance Industries Ltd. Refineries/Marketing 7.84Housing Development Finance Corp Ltd. Housing Finance 6.84ITC Ltd. Consumer Non Durables 5.69ICICI Bank Ltd. Banks 4.84Infosys Ltd. Software 4.63Larsen & Toubro Ltd. Engineering-Designing- Construction 3.78Kotak Mahindra Bank Ltd. Banks 3.36Tata Consultancy Services Ltd. Software 3.28State Bank of India Banks 2.85Maruti Suzuki India Ltd. Auto 2.75Axis Bank Ltd. Banks 2.24Hindustan Unilever Ltd. Consumer Non Durables 2.22IndusInd Bank Ltd. Banks 2.08Tata Motors Ltd. Auto 2.02Bharti Airtel Ltd. Telecom - Services 1.65Mahindra & Mahindra Ltd. Auto 1.57Vedanta Ltd. Non - Ferrous Metals 1.55Sun Pharmaceutical Ind Ltd. Pharmaceuticals 1.53Yes Bank Ltd. Banks 1.45NTPC Ltd. Power 1.37Oil & Natural Gas Corp Ltd. Oil 1.36Asian Paints Ltd. Consumer Non Durables 1.34Hero MotoCorp Ltd. Auto 1.25HCL Technologies Ltd. Software 1.20Tata Steel Ltd. Ferrous Metals 1.19Power Grid Corporation of India Ltd. Power- Transmission 1.17Ultratech Cement Ltd. Cement 1.15Bajaj Auto Ltd. Auto 1.11Eicher Motors Ltd. Auto 1.08Others 16.35
This product is suitable for investors who are seeking*:
*Investors should consult their financial advisers if in doubt about whether the product is suitable for them.
• Long term capital appreciation• Investment in securities covered by Nifty 50 Index.
Investors understand
that their principal will be at
Moderately High Risk
Riskometer
Fund Performance As on October 31, 2017
Top Holdings as on October 31, 2017
Past performance may or may not be sustained in future and should not be used as a basis for comparison with other investments. * CAGR Return.
Notes:1. The Scheme does not offer any Plans. The performance details provided herein are of Since Incep�on returns are Edelweiss ETF - Ni�y 50. calculated on Rs. 8191.50/- and invested at incep�on In case the start/end date is non business day, the NAV of previous day is used for . computa�on.2. The scheme is currently managed by Bhavesh Jain (managing this fund from May 8, 2015) and Mr. Hiten Shah (Managing this fund from May 24, 2016). Please refer page no. 34 for name of the other schemes currently managed by the Fund Managers. 3. $ Standard Benchmark prescribed by SEBI vide circular August 22, 2011.4. Since the scheme is in existence for more than 1 year but less than 3 years hence performance data for 3 years and more is not provided5. For the performance of other Schemes managed by the Fund Managers, please refer to the relevant scheme.6. Since the Scheme has not completed 3 years Standard Devia�on, Por�olio Beta and Sharpe Ra�o is not provided.7. ^ Lower of sales or purchase divided by average AUM for last rolling 12 months.
Disclaimer of NSE: It is to be dis�nctly understood that the permission given by NSE should not in any way be deemed or construed that the Scheme Informa�on Document has been cleared or approved by NSE nor does it cer�fy the correctness or completeness of any of the contents of the Scheme Informa�on Document. The investors are advised to refer to the Scheme Informa�on Document for the full text of the 'Disclaimer Clause of NSE'.Disclaimer of BSE: It is to be dis�nctly understood that the permission given by BSE Ltd. Should not in any way be deemed or construed that the SID has been cleared or approved by BSE Ltd. nor does it cer�fy the correctness or completeness of any of the contents of the SID. The investors are advised to refer to the SID for the full text of the Disclaimer Clause of BSE Ltd.Disclaimer of IISL : The “Product” offered by “the issuer” is not sponsored, endorsed, sold or promoted by India Index Services & Products Limited (IISL). IISL does not make any representa�on or warranty, express or implied (including warran�es of merchantability or fitness for par�cular purpose or use) and disclaims all liability to the owners of “the Product” or any member of the public regarding the advisability of inves�ng in securi�es generally or in “the Product” linked to Ni�y 50 Index or par�cularly in the ability of the Ni�y 50 Index to track general stock market performance in India. Please read the full Disclaimers in rela�on to the Ni�y 50 Index in the in the Scheme Informa�on Document.
Exchange Traded Fund
FACTSHEET
October
2017An Open-Ended Exchange Traded Fund
Edelweiss ETF - Nifty 50
Period
Since Inception - Edelweiss ETF - Nifty 50
1 Year
3 Year
5 Year
Scheme-Edelweiss ETF - Nifty 50
Returns* Returns*
Benchmark(Nifty 50 TR Index)
21.69% 12,189 20.97% 12,116
NA NA NA NA
NA NA NA NA
11.92% 13,230 11.30% 13,049
Value of Rs. 10000 Invested
Value of Rs. 10000 Invested
Quantitative indicators As on October 31, 2017
Por�olio Turnover Ra�o^ : 1.38Total stocks in por�olio : 50 Top 10 stocks : 52.37%
Fund Managers Details
Mr. Bhavesh Jain 9 years 8-May-15Mr. Hiten Shah 9 years 24-May-16
Managing SinceFund Managers Experience
Inception Date 8-May-15
NAV (as on 31st October 2017, in Rs.)Edelweiss ETF - Ni�y 50 10837.5096
Plan/Options: The Scheme does not offer any Plans/Options for investment.
Minimum Investment Amounta. Directly with the Mutual Fund (Only for Authorized
Participants/Large Investors): In Creation Unit size will be 400 units and in multiples thereof
b. On the Stock Exchange(s): 1 unit and multiple thereof
Tracking Error:Please note that since the Scheme has not completed 3years, the same is not provided.
Exit Load Nil
Total Expense Ra�os~: Edelweiss ETF - Nifty 50 0.07%~Does not include Service Tax on Investment Management fees.
AUM as on 31st October 2017
Month End AUM Monthly Average AUM
Rs. 2.92 CroreRs. 2.98 Crore
0.49%
0.72%
0.75%
0.75%
0.78%
0.85%
0.94%
1.06%
1.17%
1.19%
1.36%
1.37%
1.65%
1.67%
2.13%
2.53%
3.78%
4.23%
7.85%
8.67%
9.25%
9.80%
10.80%
26.07%
Auto Ancillaries
Pes�cides
Media & Entertainment
Gas
Telecom - Equipment & Accessories
Transporta�on
Minerals/Mining
NBFC
Power- Transmission
Ferrous Metals
Oil
Power
Telecom - Services
Cement
Petroleum Products
Non - Ferrous Metals
Engineering-Designing-Construc�on
Pharmaceu�cals
Housing Finance
Refineries/Marke�ng
Consumer Non Durables
Auto
So�ware
Banks

INVESTMENT OBJECTIVE
ETF - Nifty Bank
The investment objective of the scheme is to provide returns before expenses that closely correspond to the total returns of the Nifty Bank Index subject to tracking errors. However, there is no assurance that the investment objective of the Scheme will be realized and the Scheme does not assure or guarantee any returns.
Name of Instrument Industry % to Net Assets
SECTOR ALLOCATION - % of Equity Holdings
22
HDFC Bank Ltd. Banks 33.19ICICI Bank Ltd. Banks 17.33Kotak Mahindra Bank Ltd. Banks 12.08State Bank of India Banks 10.22Axis Bank Ltd. Banks 8.01IndusInd Bank Ltd. Banks 7.45Yes Bank Ltd. Banks 5.18The Federal Bank Ltd. Banks 2.14Bank of Baroda Banks 1.44Punjab National Bank Banks 1.32Canara Bank Banks 0.74IDFC Bank Ltd. Banks 0.68Others 0.23
This product is suitable for investors who are seeking*:
*Investors should consult their financial advisers if in doubt about whether the product is suitable for them.
• Long term capital appreciation• Investment in securities covered by Nifty Bank Index.
Investors understand
that their principal will be at High Risk
Riskometer
LOW HIGH
Fund Performance As on October 31, 2017
Top Holdings as on October 31, 2017
Past performance may or may not be sustained in future and should not be used as a basis for comparison with other investments. * CAGR Return.
Notes:1. The Scheme does not offer any Plans. The performance details provided herein are of Since Incep�on returns are Edelweiss ETF - Ni�y Bank. calculated on Rs. 1639.87 invested at incep�on In case the start/end date is non business day, the NAV of previous day is used for computa�on.. 2. The scheme is currently managed by Bhavesh Jain (managing this fund from December 15, 2015) and Mr. Hiten Shah (Managing this fund from May 24, 2016). Please refer page no. 34 for name of the other schemes currently managed by the Fund Managers. 3. $ Standard Benchmark prescribed by SEBI vide circular August 22, 2011.4. Since the scheme is in existence for more than 1 year but less than 3 years hence performance data for 3 years and more is not provided5. For the performance of other Schemes managed by the Fund Managers, please refer to the relevant scheme.6. Since the Scheme has not completed 3 years Standard Devia�on, Por�olio Beta and Sharpe Ra�o is not provided.7. ̂ Lower of sales or purchase divided by average AUM for last rolling 12 months.
Disclaimer of NSE: It is to be dis�nctly understood that the permission given by NSE should not in any way be deemed or construed that the Scheme Informa�on Document has been cleared or approved by NSE nor does it cer�fy the correctness or completeness of any of the contents of the Scheme Informa�on Document. The investors are advised to refer to the Scheme Informa�on Document for the full text of the 'Disclaimer Clause of NSE'.Disclaimer of IISL : The “Product” offered by “the issuer” is not sponsored, endorsed, sold or promoted by India Index Services & Products Limited (IISL). IISL does not make any representa�on or warranty, express or implied (including warran�es of merchantability or fitness for par�cular purpose or use) and disclaims all liability to the owners of “the Product” or any member of the public regarding the advisability of inves�ng in securi�es generally or in “the Product” linked to Ni�y Bank Index or par�cularly in the ability of the Ni�y Bank Index to track general stock market performance in India. Please read the full Disclaimers in rela�on to the Ni�y Bank Index in the in the Scheme Informa�on Document.
Exchange Traded Fund
FACTSHEET
October
2017An Open-Ended Exchange Traded Fund
Edelweiss ETF - Nifty BankScheme-
Edelweiss ETF - Nifty Bank
Returns* Returns* Returns*Period
$Additional Benchmark(Nifty 50 TR Index)
Benchmark(Nifty Bank TR Index)
Since Inception - Edelweiss ETF - Nifty Bank
28.33% 12,860 28.50% 12,876 20.97% 12,116
NA NA NA NA NA NA
NA NA NA NA NA NA
25.96% 15,430 26.29% 15,506 18.54% 13,766
1 Year
3 Year
5 Year
Value of Rs. 10000 Invested
Value of Rs. 10000 Invested
Value of Rs. 10000 Invested
Fund Managers Details
Mr. Bhavesh Jain 9 years 15-Dec-15Mr. Hiten Shah 9 years 24-May-16
Managing SinceFund Managers Experience
Inception Date 15-Dec-15
NAV (as on 31st October 2017, in Rs.)Edelweiss ETF - Ni�y Bank 2530.3701
Plan / Op�ons: The Scheme does not offer anyPlans/Op�ons for investment.
Minimum Investment Amounta. Directly with the Mutual Fund (Only for Authorized
Participants/Large Investors): The Creation Unit size will be 2000 units, with one unit of the Scheme approximately equivalent to 1/10 the value of Nifty Bank.
b. On the Stock Exchange(s): 1 unit and multiple thereof
Tracking Error: Please note that since the Scheme has not completed 3 years, the same is not provided.
Exit Load Nil
Total Expense Ra�os~: Edelweiss ETF - Nifty Bank 0.15%~Does not include Service Tax on Investment Management fees.
Quantitative indicators As on October 31, 2017
Por�olio Turnover Ra�o^ : 0.04Total stocks in por�olio : 12 Top 10 stocks : 98.36%
99.77% Banks
AUM as on 31st October 2017
Month End AUM Monthly Average AUM
Rs. 1.45 Crore Rs. 1.41 Crore

INVESTMENT OBJECTIVE
ETF - Nifty Quality 30
The investment objective of the scheme is to provide returns before expenses that closely correspond to the total returns of the Nifty Quality 30 Index subject to tracking errors. However, there is no assurance that the investment objective of the Scheme will be realized and the Scheme does not assure or guarantee any returns.
Name of Instrument Industry % to Net Assets
SECTOR ALLOCATION - % of Equity Holdings
23
Tata Consultancy Services Ltd. Software 10.13Infosys Ltd. Software 9.94ITC Ltd. Consumer Non Durables 9.58Maruti Suzuki India Ltd. Auto 8.50Hindustan Unilever Ltd. Consumer Non Durables 6.88Sun Pharmaceutical Ind Ltd. Pharmaceuticals 4.75Asian Paints Ltd. Consumer Non Durables 4.14Hero MotoCorp Ltd. Auto 3.89HCL Technologies Ltd. Software 3.71Bajaj Auto Ltd. Auto 3.45Eicher Motors Ltd. Auto 3.36Bharat Petroleum Corporation Ltd. Petroleum Products 3.29Coal India Ltd. Minerals/Mining 2.91Wipro Ltd. Software 2.90Tech Mahindra Ltd. Software 2.35Dr. Reddy's Laboratories Ltd. Pharmaceuticals 2.29Motherson Sumi Systems Ltd. Auto Ancillaries 2.22Britannia Industries Ltd. Consumer Non Durables 2.12Titan Company Ltd. Consumer Durables 2.06Lupin Ltd. Pharmaceuticals 1.92Dabur India Ltd. Consumer Non Durables 1.46MRF Ltd. Auto Ancillaries 1.20Colgate Palmolive (India) Ltd. Consumer Non Durables 1.10Cummins India Ltd. Industrial Products 0.96Havells India Ltd. Consumer Durables 0.90Divi's Laboratories Ltd. Pharmaceuticals 0.88NMDC Ltd. Minerals/Mining 0.80Castrol India Ltd. Petroleum Products 0.77Exide Industries Ltd. Auto Ancillaries 0.76Torrent Pharmaceuticals Ltd. Pharmaceuticals 0.50Others 0.27
This product is suitable for investors who are seeking*:
*Investors should consult their financial advisers if in doubt about whether the product is suitable for them.
• Long term capital appreciation• Investment in securities covered by Nifty Quality 30 Index
Investors understand
that their principal will be at
Moderately High Risk
Riskometer
Top Holdings as on October 31, 2017
Disclaimer of NSE: It is to be dis�nctly understood that the permission given by NSE should not in any way be deemed or construed that the Scheme Informa�on Document has been cleared or approved by NSE nor does it cer�fy the correctness or completeness of any of the contents of the Scheme Informa�on Document. The investors are advised to refer to the Scheme Informa�on Document for the full text of the 'Disclaimer Clause of NSE'. Disclaimer of IISL: The “Product” offered by “the issuer” is not sponsored, endorsed, sold or promoted by India Index Services & Products Limited (IISL). IISL does not make any representa�on or warranty, express or implied (including warran�es of merchantability or fitness for par�cular purpose or use) and disclaims all liability to the owners of “the Product” or any member of the public regarding the advisability of inves�ng in securi�es generally or in “the Product” linked to Ni�y Bank Index or par�cularly in the ability of the Ni�y Bank Index to track general stock market performance in India. Please read the full Disclaimers in rela�on to the Ni�y Bank Index in the in the Scheme Informa�on Document.
Exchange Traded Fund
FACTSHEET
October
2017
Fund Performance As on October 31, 2017
Past performance may or may not be sustained in future and should not be used as a basis for comparison with other investments. * CAGR Return.
An Open-Ended Exchange Traded Fund
Notes:1. The Scheme does not offer any Plans. The performance details provided herein are of Edelweiss ETF - Ni�y Quality 30. Since Incep�on returns are calculated on Rs. 206.89 invested at incep�on. In case the start/end date is non business day, the NAV of previous day is used for computa�on.2. The scheme is currently managed by Bhavesh Jain (managing this fund from May 25, 2016) and Mr. Hiten Shah (Managing this fund from May 25, 2016). Please refer page no. 34 for name of the other schemes currently managed by the Fund Managers. 3. $ Standard Benchmark prescribed by SEBI vide circular August 22, 2011.4. Since the scheme is in existence for more than 1 year but less than 3 years hence performance data for 3 years and more is not provided5. For the performance of other Schemes managed by the Fund Managers, please refer to the relevant scheme.6. Since the Scheme has not completed 3 years Standard Devia�on, Por�olio Beta and Sharpe Ra�o is not provided.7. ^ Lower of sales or purchase divided by average AUM for last rolling 12 months.
Edelweiss ETF - Nifty Quality 30
Period
Since Inception - Edelweiss ETF - Nifty Quality 30
1 Year
3 Year
5 Year
Edelweiss ETF - Nifty Quality 30
Returns* Returns* Returns*
$Additional Benchmark(Nifty 50 TR Index)
Benchmark(Nifty Quality 30 TR Index)
11.56% 11,167 11.87% 11,198 20.97% 12,116
NA NA NA NA NA NA
NA NA NA NA NA NA
13.27% 11,959 13.75% 12,032 22.13% 13,324
Value of Rs. 10000 Invested
Value of Rs. 10000 Invested
Value of Rs. 10000 Invested
Fund Managers Details
Mr. Bhavesh Jain 9 years Since Incep�onMr. Hiten Shah 9 years Since Incep�on
Managing SinceFund Managers Experience
Inception Date 25 -May-16
NAV (as on 31st October 2017, in Rs.)Edelweiss ETF - Ni�y Quality 30 247.4275
Plan / Option: The Scheme does not offer any plans / options for investment.
Minimum Investment Amounta. Directly with the Mutual Fund (Only for Authorized
Participants/Large Investors): The Creation Unit size will be 24000 units, with one unit of the Scheme approximately equivalent to 1/10 the value of Nifty Quality 30 Index.
b. On the Stock Exchange(s): 1 unit and multiplethereof
Tracking Error: Please note that since the Scheme has not completed 3 years, the same is not provided.
Exit Load Nil
Total Expense Ra�os~: Edelweiss ETF - Nifty Quality 30 0.46%~Does not include Service Tax on Investment Management fees.
Quantitative indicators As on October 31, 2017
Total stocks in por�olio : 30 Top 10 stocks : 64.99%
AUM as on 31st October 2017
Month End AUM Monthly Average AUM
Rs. 4.41 Crore Rs. 4.34 Crore
0.96%
2.96%
3.71%
4.06%
4.18%
10.33%
19.20%
25.30%
29.03%
Industrial Products
Consumer Durables
Minerals/Mining
Petroleum Products
Auto Ancillaries
Pharmaceu�cals
Auto
Consumer Non Durables
So�ware
Por�olio Turnover Ra�o^ : Equity - 0.51 F&O - 0.04 Total Por�olio Turnover Ra�o^ : 0.55

INVESTMENT OBJECTIVE
Asean Equity Off-Shore Fund
The primary investment objective of the Scheme is to provide long term capital growth by investing predominantly in JPMorgan Funds – ASEAN Equity Fund, an equity fund which invests primarily in companies of countries which are members of the Association of South East Asian Nations (ASEAN). However, there can be no assurance that the investment objective of the Scheme will be realized.
Name of Instrument Exposure
24
This product is suitable for investors who are seeking*:
*Investors should consult their financial advisers if in doubt about whether the product is suitable for them.
• Long term capital growth• Investments predominantly in JPMorgan Funds - ASEAN Equity Fund, an equity fund which invests primarily in companies of countries which are members of the Association of South East Asian Nations.
Investors understand
that their principal will be at High Risk
Riskometer
LOW HIGH
Fund Performance As on October 31, 2017
Holdings as on October 31, 2017
Past performance may or may not be sustained in future and should not be used as a basis for comparison with other investments. * CAGR Return.
Notes:1. Different plans shall have different expense structure. The performance details provided herein are of of Regular Plan Edelweiss Asean Equity Off-Shore Fund. Returns are for Growth Op�on only. Since Incep�on returns are calculated on Rs. 10/- invested at incep�on of the scheme. In case the start/end date is non business day, the NAV of previous day is used for computa�on.2. The scheme is currently managed by Gautam Kaul (Managing this fund from May 2, 2017). Please refer page no. 34 for name of the other schemes currently managed by the Fund Managers.3. For the performance of other Schemes managed by the Fund Managers, please refer to the relevant scheme.
JPMorgan Funds - ASEAN Equity Fund 99.71% CBLO/Repo 0.96% Net Receivables/(Payables) (0.66%)Grand Total 100.00%
Overseas Fund of Funds
FACTSHEET
October
2017An open-ended fund of funds scheme
Fund Managers Details
Mr. Gautam Kaul 15 years 02-May-17
Managing SinceFund Managers Experience
Inception Date 1-Jul-11
NAV (as on 31st October 2017, in Rs.)Direct Plan Growth Op�on 19.8510Regular Plan Growth Option 18.8290
Minimum Investment AmountRs. 5,000/- per application & in multiples of Re.1/- thereof
Additional investment amountRs. 1,000/- per application & in multiples of Re. 1/- thereof
Exit Load • If the Units are redeemed / switched out on or before 12 months from the date of allotment –
1.00%• If the Units are redeemed / switched out after 12
months from the date of allotment – Nil
Total Expense Ratios~: Regular Plan 1.70%Direct Plan 0.56%~Does not include Service Tax on Investment Management fees.
AUM as on 31st October 2017
Month End AUM Monthly Average AUM
Rs. 50.32 CroreRs. 49.91 Crore
Edelweiss Asean Equity Off-Shore Fund
Period
Edelweiss Asean Equity Off-Shore Fund
1 Year
3 Year
5 Year
Scheme - Regular Plan
Returns* Returns* Returns*
$Additional Benchmark(Nifty 50 TR Index)
Benchmark(MSCI South East Asia Index)
13.05% 11,317 9.87% 10,996 20.97% 12,116
4.63% 11,457 -0.52% 9,845 8.80% 12,882
7.67% 14,475 2.76% 11,459 14.34% 19,547
10.50% 18,829 5.32% 13,892 11.42% 19,849
Value of Rs. 10000 Invested
Value of Rs. 10000 Invested
Value of Rs. 10000 Invested

INVESTMENT OBJECTIVE
Greater China Equity Off-Shore Fund
The primary investment objective of the Scheme is to provide long term capital appreciation by investing in JPMorgan Funds - Greater China Fund, an equity fund which invests primarily in a diversified portfolio of companies that are domiciled in, or carrying out the main part of their economic activity in, a country of Greater China region. However, there can be no assurance that the investment objective of the Scheme will berealised.
25
This product is suitable for investors who are seeking*:
*Investors should consult their financial advisers if in doubt about whether the product is suitable for them.
• Long term capital growth• Investment in JPMorgan Funds - Greater China Fund, an equity fund which invests primarily in a diversified portfolio of companies that are domiciled in, or carrying out the main part of their economic activity in, a country of Greater China region.
Investors understand
that their principal will be at High Risk
Riskometer
LOW HIGH
JPMorgan Funds - Greater China Fund 98.49% CBLO/Repo 1.74% Net Receivables/(Payables) (0.23%)Grand Total 100.00%
Name of Instrument Exposure
Fund Performance As on October 31, 2017
Holdings as on October 31, 2017
Past performance may or may not be sustained in future and should not be used as a basis for comparison with other investments. * CAGR Return.
Notes:1. Different plans shall have different expense structure. The performance details provided herein are of of Regular Plan Edelweiss Greater China Equity Off-Shore Fund. Returns are for Growth Op�on only. Since Incep�on returns are calculated on Rs. 10/- invested at incep�on of the scheme. In case the start/end date is non business day, the NAV of previous day is used for computa�on.2. The scheme is currently managed by Gautam Kaul (Managing this fund from May 2, 2017). Please refer page no. 34 for name of the other schemes currently managed by the Fund Managers.3. For the performance of other Schemes managed by the Fund Managers, please refer to the relevant scheme.
Overseas Fund of Funds
FACTSHEET
October
2017An open ended fund of funds scheme
Fund Managers Details
Mr. Gautam Kaul 15 years 02-May-17
Managing SinceFund Managers Experience
Inception Date 26-Aug-09
NAV (as on 31st October 2017, in Rs.)Direct Plan Growth Op�on 27.4980Regular Plan Growth Option 26.2160
Minimum Investment AmountRs. 10,000/- per application & in multiples of Re.1/- thereof
Additional investment amountRs. 1,000/- per application & in multiples ofRe. 1/- thereof
Exit load• If the Units are redeemed / switched out on or before
12 months from the date of allotment – 1.00%• If the Units are redeemed / switched out a�er 12
months from the date of allotment – Nil
Total Expense Ratios~: Regular Plan 1.72%Direct Plan 0.69%~Does not include Service Tax on Investment Management fees.
AUM as on 31st October 2017
Month End AUM Monthly Average AUM
Rs. 34.44 CroreRs. 35.02 Crore
Edelweiss Greater China Equity Off-Shore Fund
Period
Edelweiss Greater China Equity Off-Shore Fund
1 Year
3 Year
5 Year
Scheme - Regular Plan
Returns* Returns* Returns*
$Additional Benchmark(Nifty 50 TR Index)
Benchmark(MSCI Golden Dragon Index)
30.34% 13,062 24.61% 12,483 20.97% 12,116
12.68% 14,310 10.04% 13,326 8.80% 12,882
15.22% 20,313 11.93% 17,571 14.34% 19,547
12.49% 26,216 9.66% 21,271 11.48% 24,335
Value of Rs. 10000 Invested
Value of Rs. 10000 Invested
Value of Rs. 10000 Invested

INVESTMENT OBJECTIVE
Europe Dynamic Equity Off-Shore Fund
The primary investment objective of the Scheme is to seek to provide long term capital growth by investing predominantly in the JPMorgan Funds - Europe Dynamic Fund, an equity fund which invests primarily in an aggressively managed portfolio of European companies. However, there can be no assurance that the investment objective of the Scheme will be realized.
26
This product is suitable for investors who are seeking*:
*Investors should consult their financial advisers if in doubt about whether the product is suitable for them.
• Long term capital appreciation• Investments predominantly in the JPMorgan Funds - Europe Dynamic Fund, an equity fund which invests primarily in an aggressively managed portfolio of European companies.
Investors understand
that their principal will be at High Risk
Riskometer
LOW HIGH
JP Morgan Funds- Europe Dynamic Fund 100.15% CBLO/Repo 0.59% Net Receivables/(Payables) (0.75%)Grand Total 100.00%
Name of Instrument Exposure
Fund Performance As on October 31, 2017
Holdings as on October 31, 2017
Past performance may or may not be sustained in future and should not be used as a basis for comparison with other investments. * CAGR Return.
Notes:1. Different plans shall have different expense structure. The performance details provided herein are of of Regular Plan Edelweiss Europe Dynamic Equity Off-Shore Fund. Returns are for Growth Op�on only. Since Incep�on returns are calculated on Rs. 10/- invested at incep�on of the scheme. In case the start/end date is non business day, the NAV of previous day is used for computa�on.2. The scheme is currently managed by Gautam Kaul (Managing this fund from May 2, 2017). Please refer page no. 34 for name of the other schemes currently managed by the Fund Managers.3. Since the scheme is in existence for more than 1 year but less than 5 years hence performance data for 5 years and more is not provided4. For the performance of other Schemes managed by the Fund Managers, please refer to the relevant scheme.
Overseas Fund of Funds
FACTSHEET
October
2017An open ended fund of funds scheme
Inception Date 7-Feb-14
NAV (as on 31st October 2017, in Rs.)Direct Plan Growth Op�on 11.7092Regular Plan Growth Option 11.2953
Minimum Investment AmountRs. 5,000/- per application & in multiples of Re.1/- thereafter
Additional investment amountRs. 1,000/- per application & in multiples ofRe. 1/- thereafter
Exit load• If the Units are redeemed / switched out on or before
12 months from the date of allotment – 1.00%• If the Units are redeemed / switched out a�er 12
months from the date of allotment – Nil
Total Expense Ratios~: Regular Plan 1.66%Direct Plan 0.69%~Does not include Service Tax on Investment Management fees.
Fund Managers Details
Mr. Gautam Kaul 15 years 02-May-17
Managing SinceFund Managers Experience
AUM as on 31st October 2017
Month End AUM Monthly Average AUM
Rs. 25.47 CroreRs. 25.26 Crore
Edelweiss Europe Dynamic Equity Off-Shore Fund
Period
Edelweiss Europe Dynamic Equity Off-Shore Fund
1 Year
3 Year
5 Year
Scheme - Regular Plan
Returns* Returns* Returns*
$Additional Benchmark(Nifty 50 TR Index)
Benchmark(MSCI Europe Index)
20.53% 12,072 19.03% 11,920 20.97% 12,116
6.01% 11,917 4.34% 11,360 8.80% 12,882
NA NA NA NA NA NA
3.32% 11,295 1.89% 10,723 16.83% 17,867
Value of Rs. 10000 Invested
Value of Rs. 10000 Invested
Value of Rs. 10000 Invested

INVESTMENT OBJECTIVE
Emerging Markets Opportunities Equity Offshore Fund
The primary investment objective of the Scheme is to seek to provide long term capital growth by investing predominantly in the JPMorgan Funds - Emerging Markets Opportunities Fund, an equity fund which invests primarily in an aggressively managed portfolio of emerging market companies. However, there can be no assurance that the investment objective of the Scheme will be realised.
27
This product is suitable for investors who are seeking*:
*Investors should consult their financial advisers if in doubt about whether the product is suitable for them.
• Long term capital growth• Investments predominantly in JPMorgan Funds - Emerging Markets Opportunities Funds, an equity orientedfund which invests primarily in an aggressively managed portfolio of emerging market companies.
Investors understand
that their principal will be at High Risk
Riskometer
LOW HIGH
JP Morgan Emerging Mkts Opp Eq Offshore 96.65% CBLO/Repo 3.31% Net Receivables/(Payables) 0.04% Grand Total 100.00%
Name of Instrument Exposure
Fund Performance As on October 31, 2017
Holdings as on October 31, 2017
Past performance may or may not be sustained in future and should not be used as a basis for comparison with other investments. * CAGR Return.
Notes:1. Different plans shall have different expense structure. The performance details provided herein are of of Regular Plan Edelweiss Emerging Markets Opportuni�es Equity Offshore Fund. Returns are for Growth Op�on only. Since Incep�on returns are calculated on Rs. 10/- invested at incep�on of the scheme. In case the start/end date is non business day, the NAV of previous day is used for computa�on.2. The scheme is currently managed by Gautam Kaul (Managing this fund from May 2, 2017). Please refer page no. 34 for name of the other schemes currently managed by the Fund Managers.3. Since the scheme is in existence for more than 1 year but less than 5 years hence performance data for 5 years and more is not provided4. For the performance of other Schemes managed by the Fund Managers, please refer to the relevant scheme.
Overseas Fund of Funds
FACTSHEET
October
2017An open ended fund of funds scheme
Fund Managers Details
Mr. Gautam Kaul 15 years 02-May-17
Managing SinceFund Managers Experience
Inception Date 7-Jul-14
NAV (as on 31st October 2017, in Rs.)Direct Plan Growth Op�on 12.0253Regular Plan Growth Option 11.8567
Minimum Investment AmountRs. 5,000/- per application & in multiples of Re.1/- thereafter
Additional investment amountRs. 1,000/- per application & in multiples ofRe. 1/- thereafter
Exit load• If the Units are redeemed / switched out on or before
12 months from the date of allotment – 1.00%• If the Units are redeemed / switched out a�er 12
months from the date of allotment – Nil
Total Expense Ratios~: Regular Plan 1.56%Direct Plan 1.30%~Does not include Service Tax on Investment Management fees.
AUM as on 31st October 2017
Month End AUM Monthly Average AUM
Rs. 4.77 CroreRs. 4.84 Crore
Edelweiss Emerging Markets Opportunities Equity Offshore Fund
Period
Edelweiss Emerging Markets Opportunities Equity Offshore Fund
1 Year
3 Year
5 Year
Scheme - Regular Plan
Returns* Returns* Returns*
$Additional Benchmark(Nifty 50 TR Index)
Benchmark(MSCI Emerging Markets Index)
24.16% 12,438 19.72% 11,990 20.97% 12,116
5.95% 11,894 5.06% 11,597 8.80% 12,882
NA NA NA NA NA NA
5.23% 11,845 3.88% 11,348 10.24% 13,821
Value of Rs. 10000 Invested
Value of Rs. 10000 Invested
Value of Rs. 10000 Invested
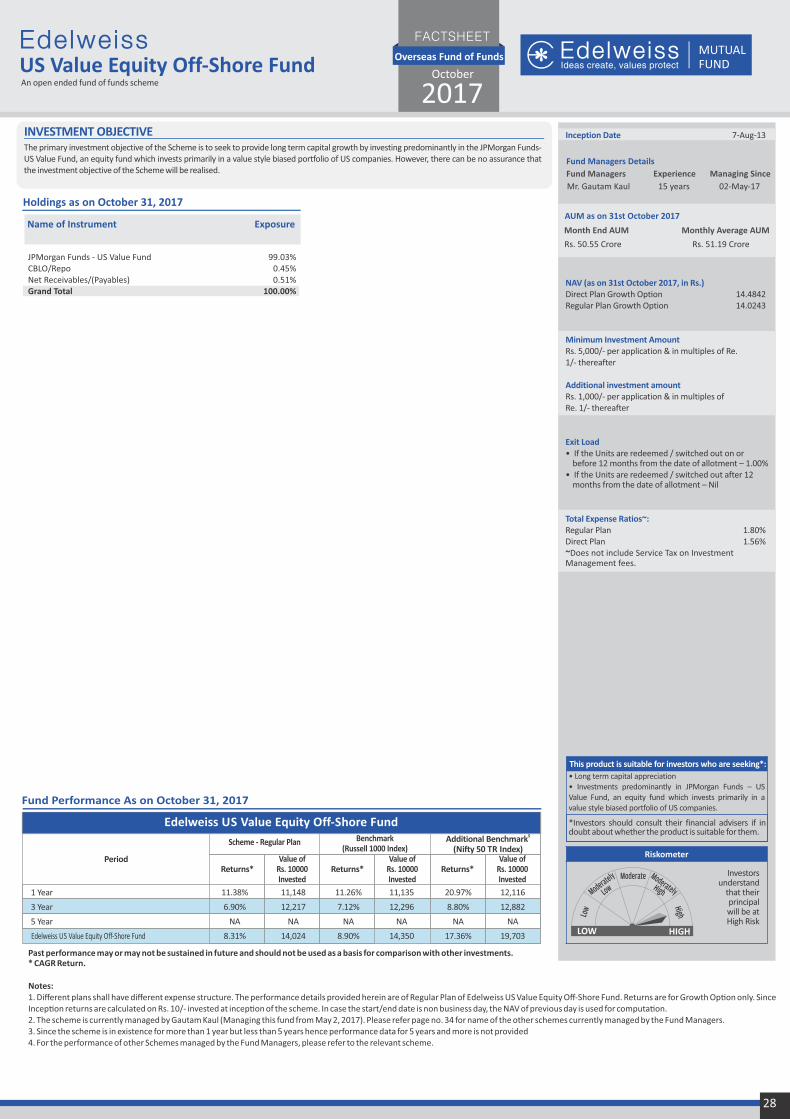
INVESTMENT OBJECTIVE
US Value Equity Off-Shore Fund
The primary investment objective of the Scheme is to seek to provide long term capital growth by investing predominantly in the JPMorgan Funds- US Value Fund, an equity fund which invests primarily in a value style biased portfolio of US companies. However, there can be no assurance that the investment objective of the Scheme will be realised.
28
This product is suitable for investors who are seeking*:
*Investors should consult their financial advisers if in doubt about whether the product is suitable for them.
• Long term capital appreciation• Investments predominantly in JPMorgan Funds – US Value Fund, an equity fund which invests primarily in a value style biased portfolio of US companies.
Investors understand
that their principal will be at High Risk
Riskometer
LOW HIGH
JPMorgan Funds - US Value Fund 99.03% CBLO/Repo 0.45% Net Receivables/(Payables) 0.51% Grand Total 100.00%
Name of Instrument Exposure
Fund Performance As on October 31, 2017
Holdings as on October 31, 2017
Past performance may or may not be sustained in future and should not be used as a basis for comparison with other investments. * CAGR Return.
Notes:1. Different plans shall have different expense structure. The performance details provided herein are of of Regular Plan Edelweiss US Value Equity Off-Shore Fund. Returns are for Growth Op�on only. Since Incep�on returns are calculated on Rs. 10/- invested at incep�on of the scheme. In case the start/end date is non business day, the NAV of previous day is used for computa�on.2. The scheme is currently managed by Gautam Kaul (Managing this fund from May 2, 2017). Please refer page no. 34 for name of the other schemes currently managed by the Fund Managers. 3. Since the scheme is in existence for more than 1 year but less than 5 years hence performance data for 5 years and more is not provided4. For the performance of other Schemes managed by the Fund Managers, please refer to the relevant scheme.
Overseas Fund of Funds
FACTSHEET
October
2017An open ended fund of funds scheme
Fund Managers Details
Mr. Gautam Kaul 15 years 02-May-17
Managing SinceFund Managers Experience
Inception Date 7-Aug-13
NAV (as on 31st October 2017, in Rs.)Direct Plan Growth Op�on 14.4842Regular Plan Growth Option 14.0243
Minimum Investment AmountRs. 5,000/- per application & in multiples of Re.1/- thereafter
Additional investment amountRs. 1,000/- per application & in multiples ofRe. 1/- thereafter
Exit Load • If the Units are redeemed / switched out on or
before 12 months from the date of allotment – 1.00%• If the Units are redeemed / switched out after 12
months from the date of allotment – Nil
Total Expense Ratios~: Regular Plan 1.80%Direct Plan 1.56%~Does not include Service Tax on Investment Management fees.
AUM as on 31st October 2017
Month End AUM Monthly Average AUM
Rs. 51.19 CroreRs. 50.55 Crore
Edelweiss US Value Equity Off-Shore Fund
Period
Edelweiss US Value Equity Off-Shore Fund
1 Year
3 Year
5 Year
Scheme - Regular Plan
Returns* Returns* Returns*
$Additional Benchmark(Nifty 50 TR Index)
Benchmark(Russell 1000 Index)
11.38% 11,148 11.26% 11,135 20.97% 12,116
6.90% 12,217 7.12% 12,296 8.80% 12,882
NA NA NA NA NA NA
8.31% 14,024 8.90% 14,350 17.36% 19,703
Value of Rs. 10000 Invested
Value of Rs. 10000 Invested
Value of Rs. 10000 Invested

SIP Performance (As on October 31, 2017)
1 Year 3 Year 5 Year
Total Amount Invested 1,20,000 3,60,000 6,00,000
Total Value as on 31-Oct-2017 1,36,137 4,47,801 9,24,784
Returns 25.87% 14.70% 17.33%
Total Value of Nifty 500 TR Index 1,39,074 4,68,234 9,35,541
Total Value of Nifty 50 TR Index 1,36,603 4,46,437 8,61,527
Nifty 500 TR Index Returns 30.77% 17.83% 17.80%
Nifty 50 TR Index Returns 26.64% 14.48% 14.45%
Edelweiss ELSS Fund
Edelweiss Dynamic Equity Advantage Fund
1 Year 3 Year 5 Year 1 Year 3 Year
Edelweiss Arbitrage Fund
Total Amount Invested 1,20,000 3,60,000
Total Value as on 31-Oct-2017 1,23,812 3,96,766
Returns 5.95% 6.42%
Total Value of Nifty 50 Arbitrage Index 1,22,689 3,91,386
Total Value of Nifty 50 TR Index 1,36,603 4,46,437
Nifty 50 Arbitrage Index Returns 4.18% 5.50%
Nifty 50 TR Index Returns 26.64% 14.48%
1 Year
Edelweiss Economic Resurgence Fund
Total Amount Invested 1,20,000
Total Value as on 31-Oct-2017 1,42,024
Returns 35.74%
Total Value of S&P BSE 200 TR Index 1,38,079
Total Value of Nifty 50 TR Index 1,36,603
S&P BSE 200 TR Index Returns 29.10%
Nifty 50 TR Index Returns 26.64%
1 Year 3 Year 5 Year
Total Amount Invested 1,20,000 3,60,000 6,00,000
Total Value as on 31-Oct-2017 1,38,533 4,52,716 9,23,311
Returns 29.86% 15.46% 17.27%
Total Value of S&P BSE 200 TR Index 1,38,079 4,62,084 9,17,872
Total Value of Nifty 50 TR Index 1,36,603 4,46,437 8,61,527
S&P BSE 200 TR Index Returns 29.10% 16.90% 17.03%
Nifty 50 TR Index Returns 26.64% 14.48% 14.45%
Edelweiss Equity Opportunities Fund
1 Year 3 Year 5 Year
Total Amount Invested 1,20,000 3,60,000 6,00,000
Total Value as on 31-Oct-2017 1,41,407 4,86,141 11,67,454
Returns 34.69% 20.51% 26.98%
Total Value of Nifty Free Float Midcap 100 TR Index 1,40,463 5,04,303 11,02,747
Total Value of Nifty 50 TR Index 1,36,603 4,46,437 8,61,527
Nifty Free Float Midcap 100 TR Index Returns 33.10% 23.16% 24.59%
Nifty 50 TR Index Returns 26.64% 14.48% 14.45%
Edelweiss Mid and Small Cap Fund
1 Year 3 Year 5 Year
Total Amount Invested 1,20,000 3,60,000 6,00,000
Total Value as on 31-Oct-2017 1,32,396 4,26,909 8,53,153
Returns 19.72% 11.39% 14.05%
Total Value of Nifty 200 TR Index 1,38,179 4,61,397 9,13,225
Total Value of Nifty 50 TR Index 1,36,603 4,46,437 8,61,527
Nifty 200 TR Index Returns 29.27% 16.79% 16.82%
Nifty 50 TR Index Returns 26.64% 14.48% 14.45%
Edelweiss Prudent Advantage Fund
1 Year 3 Year 5 Year
Total Amount Invested 1,20,000 3,60,000 6,00,000
Total Value as on 31-Oct-2017 1,36,894 4,44,380 9,08,202
Returns 27.13% 14.16% 16.59%
Total Value of S&P BSE 200 TR Index 1,38,079 4,62,084 9,17,872
Total Value of Nifty 50 TR Index 1,36,603 4,46,437 8,61,527
S&P BSE 200 TR Index Returns 29.10% 16.90% 17.03%
Nifty 50 TR Index Returns 26.64% 14.48% 14.45%
Edelweiss Tax Advantage Fund
1 Year 3 Year 5 Year
Total Amount Invested 1,20,000 3,60,000 6,00,000
Total Value as on 31-Oct-2017 1,36,565 4,42,443 8,88,155
Returns 26.58% 13.86% 15.68%
Total Value of Nifty 50 TR Index 1,36,603 4,46,437 8,61,527
Total Value of S&P BSE Sensex TR Index 1,36,007 4,39,556 8,43,609
Nifty 50 TR Index Returns 26.64% 14.48% 14.45%
S&P BSE Sensex TR Index Returns 25.66% 13.40% 13.59%
Edelweiss Large Cap Advantage Fund
1 Year 3 Year
Edelweiss Equity Savings Advantage Fund
Total Amount Invested 1,20,000 3,60,000
Total Value as on 31-Oct-2017 1,28,681 4,13,500
Returns 13.70% 9.21%
Total Value of 70% CRISIL Liquid Fund Index + 30% 1,24,196 4,04,868
Nifty 50 TR Index
Total Value of Nifty 50 TR Index 1,36,603 4,46,437
70% CRISIL Liquid Fund Index + 30% Nifty 50 TR Index 6.55% 7.78%
Returns
Nifty 50 TR Index Returns 26.64% 14.48%
29
Total Amount Invested 1,20,000 3,60,000 6,00,000
Total Value as on 31-Oct-2017 1,31,300 4,16,536 8,03,903
Returns 17.93% 9.70% 11.65%
Total Value of 60% Nifty 50 TR Index + 40% 1,31,442 4,33,902 8,25,774
CRISIL Composite Bond Fund Index
Total Value of Nifty 50 TR Index 1,36,603 4,46,437 8,61,527
60% Nifty 50 TR Index + 40% CRISIL Composite 18.16% 12.51% 12.73%
Bond Fund Index Returns
Nifty 50 TR Index Returns 26.64% 14.48% 14.45%
For SIP returns, monthly investment of equal amounts invested on the 1st working day of every month. Past performance may or may not be sustained in future

Fund Performance - Direct Plan (As on October 31, 2017)
Edelweiss Arbitrage Fund
Scheme - Direct Plan
Benchmark(Nifty 50 Arbitrage
Index)
Additional $Benchmark
(Nifty 50 TR Index)Period
1 Year
3 Year
5 Year**
Since Inception - Direct Plan
Returns* Returns*Value of
Rs. 10000 Invested
Value of Rs. 10000 Invested
Returns*Value of
Rs. 10000 Invested
6.60% 10,666 4.37% 10,441 20.97% 12,116
7.48% 12,420 6.34% 12,026 8.80% 12,882
NA NA NA NA NA NA
7.73% 12,832 6.50% 12,346 11.39% 14,350
Edelweiss Mid And Small Cap Fund
Scheme - Direct Plan
Benchmark(Nifty Free Float
Midcap 100 TR Index)
Additional $Benchmark
(Nifty 50 TR Index)Period
1 Year
3 Year
5 Year**
Since Inception - Direct Plan
Returns* Returns*Value of
Rs. 10000 Invested
Value of Rs. 10000 Invested
Returns*Value of
Rs. 10000 Invested
23.60% 12,382 24.96% 12,519 20.97% 12,116
20.48% 17,496 19.58% 17,108 8.80% 12,882
NA NA NA NA NA NA
26.52% 31,164 20.06% 24,191 13.50% 18,441
Edelweiss Equity Savings Advantage Fund
Scheme - Direct Plan
Benchmark Additional $Benchmark
(Nifty 50)Period
1 Year
3 Year**
5 Year**
Since Inception - Direct Plan
Returns* Returns*Value of
Rs. 10000 Invested
Value of Rs. 10000 Invested
Returns*Value of
Rs. 10000 Invested
(70% CRISIL Liquid Fund Index + 30% Nifty 50 Index)
Edelweiss Dynamic Equity Advantage Fund
Scheme - Direct Plan
Benchmark Additional $Benchmark
(Nifty 50 TR Index)Period
1 Year
3 Year
5 Year**
Since Inception - Direct Plan
Returns* Returns*Value of
Rs. 10000 Invested
Value of Rs. 10000 Invested
Returns*Value of
Rs. 10000 Invested
(60% Nifty 50 TR Index + 40% CRISIL Composite Bond
Fund Index)
15.41% 11,555 15.42% 11,556 20.97% 12,116
9.27% 13,050 9.49% 13,130 8.80% 12,882
NA NA NA NA NA NA
12.78% 17,759 11.87% 17,089 13.28% 18,142
Edelweiss Large Cap Advantage Fund
Scheme - Direct Plan
BenchmarkAdditional
$Benchmark(S&P BSE Sensex
TR Index)Period
1 Year
3 Year
5 Year**
Since Inception - Direct Plan
Returns* Returns*Value of
Rs. 10000 Invested
Value of Rs. 10000 Invested
Returns*Value of
Rs. 10000 Invested
(Nifty 50 TR Index)
18.92% 11,909 20.97% 12,116 20.24% 12,042
11.50% 13,866 8.80% 12,882 7.51% 12,428
NA NA NA NA NA NA
15.91% 20,361 13.40% 18,325 13.15% 18,128
Edelweiss Equity Opportunities Fund
Period
1 Year
3 Year
5 Year**
Since Inception - Direct Plan
Returns* Returns*Value of
Rs. 10000 Invested
Value of Rs. 10000 Invested
Returns*Value of
Rs. 10000 Invested
Edelweiss Economic Resurgence Fund
Scheme - Direct Plan
Benchmark(S&P BSE 200
TR Index)
Additional $Benchmark
(Nifty 50 TR Index)Period
1 Year
3 Year**
5 Year**
Since Inception - Direct Plan
Returns* Returns*Value of
Rs. 10000 Invested
Value of Rs. 10000 Invested
Returns*Value of
Rs. 10000 Invested
25.85% 12,609 22.31% 12,251 20.97% 12,116
NA NA NA NA NA NA
NA NA NA NA NA NA
13.10% 14,016 10.13% 13,031 7.64% 12,237
Edelweiss ELSS Fund
Scheme - Direct Plan
Benchmark(Nifty 500 TR Index)
Additional $Benchmark
(Nifty 50 TR Index)Period
1 Year
3 Year
5 Year**
Since Inception - Direct Plan
Returns* Returns*Value of
Rs. 10000 Invested
Value of Rs. 10000 Invested
Returns*Value of
Rs. 10000 Invested
Edelweiss Prudent Advantage Fund
Scheme - Direct Plan
Benchmark(Nifty 200 TR Index)
Additional $Benchmark
(Nifty 50 TR Index)Period
1 Year
3 Year
5 Year**
Since Inception - Direct Plan
Returns* Returns*Value of
Rs. 10000 Invested
Value of Rs. 10000 Invested
Returns*Value of
Rs. 10000 Invested
Edelweiss Tax Advantage Fund
Scheme - Direct Plan
Benchmark(S&P BSE 200 TR
Index)
Additional $Benchmark
(Nifty 50 TR Index)Period
1 Year
3 Year
5 Year**
Since Inception - Direct Plan
Returns* Returns*Value of
Rs. 10000 Invested
Value of Rs. 10000 Invested
Returns*Value of
Rs. 10000 Invested
30
Edelweiss Liquid FundScheme -
Direct PlanBenchmark
(CRISIL Liquid Fund Index)
$Additional Benchmark(CRISIL 1 year T-bill Index)
Period
Returns* Returns*Value of
Rs. 10000 Invested
Value of Rs. 10000 Invested
Returns*Value of
Rs. 10000 Invested
Scheme - Direct Plan
Benchmark Additional $Benchmark
(Nifty 50 TR Index)(S&P BSE 200 TR Index)
Last 7 days@
Last 15 days@
Last 30 days@
1 Year
3 Year
5 Year**
Since Inception - Direct Plan
Notes :
1. Different plans shall have different expense structure. The performance details provided herein are of Direct Plan of the funds. Returns are for Growth Option only.Since Inception returns are calculated on Rs. 10/- invested at inception of the scheme. In case the start/end date is non business day, the NAV of previous day is used for computation. For Edelweiss Liquid Fund, Since Inception returns are calculated on Rs. 1000/- invested at inception of the scheme.
2. Past performance may or may not be sustained in future and should not be used as a basis for comparison with other investments.
3. **Since respective schemes/ options have not completed relevant period (3yr or 5yr) after allotment or units were not available throughout the respective period, no returns are available.
* CAGR Return.
11.57% 11,167 6.86% 10,692 20.97% 12,116
8.49% 12,773 8.28% 12,697 8.80% 12,882
NA NA NA NA NA NA
8.95% 12,989 8.38% 12,785 10.62% 13,606
19.32% 11,949 23.50% 12,371 20.97% 12,116
13.81% 14,746 12.30% 14,168 8.80% 12,882
NA NA NA NA NA NA
18.17% 22,174 16.03% 20,322 13.41% 18,228
13.55% 11,367 22.62% 12,283 20.97% 12,116
9.58% 13,160 11.40% 13,827 8.80% 12,882
NA NA NA NA NA NA
16.38% 20,767 14.91% 19,529 13.40% 18,325
20.51% 12,069 22.31% 12,251 20.97% 12,116
13.11% 14,476 11.65% 13,921 8.80% 12,882
NA NA NA NA NA NA
17.24% 21,570 15.29% 19,893 13.50% 18,441
18.81% 11,898 22.31% 12,251 20.97% 12,116
12.78% 14,348 11.65% 13,921 8.80% 12,882
NA NA NA NA NA NA
16.70% 21,091 15.29% 19,893 13.50% 18,441
6.42% 10,012 6.06% 10,012 2.51% 10,005
6.38% 10,026 6.20% 10,025 3.83% 10,016
6.44% 10,051 6.30% 10,050 5.28% 10,042
6.62% 10,662 6.71% 10,671 5.91% 10,591
7.39% 12,388 7.57% 12,450 7.30% 12,357
NA NA NA NA NA NA
8.11% 14,580 8.18% 14,620 7.19% 13,989

Edelweiss Ultra Short Term Fund
Scheme - Direct Plan
Benchmark Additional $Benchmark
(CRISIL 1 year T-bill Index)Period
1 Year
3 Year
5 Year**
Since Inception - Direct Plan
Returns* Returns*Value of
Rs. 10000 Invested
Value of Rs. 10000 Invested
Returns*Value of
Rs. 10000 Invested
(CRISIL Liquid Fund Index)
7.70% 10,776 6.71% 10,677 5.92% 10,597
4.73% 11,488 7.57% 12,450 7.30% 12,357
NA NA NA NA NA NA
6.49% 13,550 8.18% 14,620 7.19% 13,989
Edelweiss Short Term Fund
Scheme - Direct Plan
Benchmark Additional $Benchmark
(CRISIL 1 year T-bill Index)Period
1 Year
3 Year
5 Year**
Since Inception - Direct Plan
Returns* Returns*Value of
Rs. 10000 Invested
6.58% 10,664 7.28% 10,735 5.92% 10,597
1.64% 10,499 8.68% 12,839 7.30% 12,357
NA NA NA NA NA NA
4.56% 12,404 8.88% 15,086 7.18% 13,976
Value of Rs. 10000 Invested
Returns*Value of
Rs. 10000 Invested
(CRISIL Short Term Bond Fund Index)
Edelweiss Banking And PSU Debt Fund
Scheme - Direct Plan
BenchmarkAdditional
$Benchmark(CRISIL 1 year T-bill
Index)Period
1 Year
3 Year
5 Year**
Since Inception - Direct Plan
Returns* Returns*Value of
Rs. 10000 Invested
7.42% 10,748 7.28% 10,735 5.92% 10,597
8.26% 12,692 8.68% 12,839 7.30% 12,357
NA NA NA NA NA NA
9.01% 14,286 9.23% 14,402 7.61% 13,543
Value of Rs. 10000 Invested
Returns*Value of
Rs. 10000 Invested
(CRISIL Short Term Bond Fund Index)
Edelweiss Corporate Debt Opportunities Fund
Scheme - Direct Plan
Benchmark Additional $Benchmark
(CRISIL 10 year Gilt Index)Period
1 Year
3 Year
5 Year**
Since Inception - Direct Plan
Returns* Returns*Value of
Rs. 10000 Invested
8.98% 10,906 7.28% 10,735 5.11% 10,516
9.31% 13,063 8.68% 12,839 9.43% 13,107
NA NA NA NA NA NA
9.78% 13,368 8.81% 13,004 9.75% 13,356
Value of Rs. 10000 Invested
Returns*Value of
Rs. 10000 Invested
(CRISIL Short Term Bond Fund Index)
Edelweiss Government Securities Fund
Scheme - Direct Plan
Benchmark(CRISIL Gilt index)
Additional $Benchmark
(CRISIL 10 year Gilt Index)
Period
1 Year
3 Year
5 Year**
Since Inception - Direct Plan
Returns* Returns*Value of
Rs. 10000 Invested
Value of Rs. 10000 Invested
Returns*Value of
Rs. 10000 Invested
5.71% 10,576 5.77% 10,582 5.11% 10,516
11.02% 13,686 9.78% 13,234 9.43% 13,107
NA NA NA NA NA NA
10.21% 14,352 11.05% 14,762 10.03% 14,263
31
Fund Performance - Direct Plan (As on October 31, 2017)
Notes :
1. Different plans shall have different expense structure. The performance details provided herein are of Direct Plan of the funds. Returns are for Growth Option only.Since Inception returns are calculated on Rs. 10/- invested at inception of the scheme. In case the start/end date is non business day, the NAV of previous day is used for computation. For Edelweiss Ultra Short Term Fund,Since Inception returns are calculated on Rs. 1000/- invested at inception of the scheme.
2. Past performance may or may not be sustained in future and should not be used as a basis for comparison with other investments.
3. **Since respective schemes/ options have not completed relevant period (3yr or 5yr) after allotment or units were not available throughout the respective period, no returns are available.
* CAGR Return.
Edelweiss Bond Fund
Scheme - Direct Plan
Benchmark(CRISIL Composite Bond
Fund Index)
Additional $Benchmark
(CRISIL 10 year Gilt Index)Period
1 Year
3 Year
5 Year**
Since Inception - Direct Plan
Returns* Returns*Value of
Rs. 10000 Invested
Value of Rs. 10000 Invested
Returns*Value of
Rs. 10000 Invested
5.72% 10,577 7.17% 10,723 5.11% 10,516
8.36% 12,726 9.92% 13,284 9.43% 13,107
NA NA NA NA NA NA
8.42% 14,767 9.15% 15,258 7.46% 14,150
Edelweiss Greater China Equity Off-Shore Fund
Scheme - Direct Plan
Benchmark(MSCI Golden Dragon
Index)
Additional $Benchmark
(Nifty 50 TR Index)Period
1 Year
3 Year
5 Year**
Since Inception - Direct Plan
Returns* Returns*Value of
Rs. 10000 Invested
Value of Rs. 10000 Invested
Returns*Value of
Rs. 10000 Invested
31.70% 13,200 24.61% 12,483 20.97% 12,116
13.72% 14,713 10.04% 13,326 8.80% 12,882
NA NA NA NA NA NA
14.62% 19,333 10.19% 15,980 13.34% 18,310
Edelweiss Emerging Markets Opportunities Equity Offshore Fund
Scheme - Direct Plan
Benchmark(MSCI Emerging Markets Index)
Additional $Benchmark
(Nifty 50 TR Index)Period
1 Year
3 Year
5 Year**
Since Inception - Direct Plan
Returns* Returns*Value of
Rs. 10000 Invested
Value of Rs. 10000 Invested
Returns*Value of
Rs. 10000 Invested
24.52% 12,474 19.72% 11,990 20.97% 12,116
6.37% 12,038 5.06% 11,597 8.80% 12,882
NA NA NA NA NA NA
5.68% 12,013 3.88% 11,348 10.24% 13,821
Edelweiss Europe Dynamic Equity Off-Shore Fund
Scheme - Direct Plan
Benchmark(MSCI Europe Index)
Additional $Benchmark
(Nifty 50 TR Index)Period
1 Year
3 Year
5 Year**
Since Inception - Direct Plan
Returns* Returns*Value of
Rs. 10000 Invested
Value of Rs. 10000 Invested
Returns*Value of
Rs. 10000 Invested
21.71% 12,191 19.03% 11,920 20.97% 12,116
7.06% 12,274 4.34% 11,360 8.80% 12,882
NA NA NA NA NA NA
4.32% 11,709 1.89% 10,723 16.83% 17,867
Edelweiss Asean Equity Off-Shore Fund
Scheme - Direct Plan
Benchmark(MSCI South East
Asia Index)
Additional $Benchmark
(Nifty 50 TR Index)Period
1 Year
3 Year
5 Year**
Since Inception - Direct Plan
Returns* Returns*Value of
Rs. 10000 Invested
Value of Rs. 10000 Invested
Returns*Value of
Rs. 10000 Invested
14.39% 11,452 9.87% 10,996 20.97% 12,116
5.82% 11,852 -0.52% 9,845 8.80% 12,882
NA NA NA NA NA NA
7.56% 14,220 1.88% 10,939 13.34% 18,310

Edelweiss Bond Fund
Direct Plan Dividend Option (Monthly)
Record Date NAV (`)Dividend per Unit (`)
Individuals/HUF Others
1013.2109
1012.3626
4.5553
3.8304
4.9167
4.1344
30-Sep-16
28-Oct-16
Record Date NAV (`)Dividend per Unit (`)
Regular Plan - Quarterly Dividend
26-Oct-16
18-Jan-17
10-Jul-17
21-Sep-17
0.22
0.22
0.22
0.22
12.74
12.21
13.44
13.17
04-May-17 0.22 15.00
Direct Plan Dividend Option
Direct Plan – Monthly Dividend
21-Sep-17
23-Oct-17
0.22
0.22
21.93
22.35
Direct Plan - Quarterly Dividend
26-Oct-16
18-Jan-17
10-Jul-17
21-Sep-17
0.22
0.22
0.22
0.22
14.31
13.77
15.27
15.05
Dividend Option
04-May-17 0.22 13.24
Regular Plan - Monthly Dividend
21-Sep-17
23-Oct-17
0.22
0.22
21.33
21.73
Dividend History
Edelweiss Arbitrage Fund
Regular Plan Dividend Option
Monthly Dividend Regular Plan
Direct Plan Dividend Option
Monthly Dividend Direct Plan
24-Jul-17
28-Aug-17
25-Sep-17
23-Oct-17
12.6038
12.6280
12.5730
12.6286
Dividend Option
05-Jun-17 10.6109 Edelweiss Dynamic Equity Advantage Fund
32
Direct Plan Dividend
22-Sep-16
20-Oct-16
17-Nov-16
18-Jan-17
15-Feb-17
29-Mar-17
27-Apr-17
30-May-17
20-Jun-17
10-Jul-17
22-Aug-17
21-Sep-17
23-Oct-17
0.20
0.20
0.20
0.36
0.19
0.19
0.13
0.13
0.10
0.10
0.10
0.10
0.10
17.0680
16.6960
15.0650
15.3280
15.4320
16.1140
16.5260
16.8110
16.8880
16.9500
16.8930
17.2370
17.6990
Regular Plan Dividend
22-Sep-16
20-Oct-16
17-Nov-16
18-Jan-17
15-Feb-17
29-Mar-17
27-Apr-17
30-May-17
20-Jun-17
10-Jul-17
22-Aug-17
21-Sep-17
23-Oct-17
0.20
0.20
0.20
0.36
0.19
0.19
0.13
0.13
0.10
0.10
0.10
0.10
0.10
16.4620
16.0910
14.5080
14.7430
14.8250
15.4660
15.8350
16.0970
16.1610
16.2120
16.1450
16.4600
16.8940
Edelweiss Equity Opportunities Fund
Record Date NAV (`)Dividend per Unit (`)
13-Oct-16
10-Nov-16
19-Dec-16
18-Jan-17
09-Feb-17
10-Jul-17
12-Sep-17
10-Oct-17
0.1000
0.0800
0.0600
0.0500
0.0450
0.0600
0.1000
0.0700
10.5588
10.5087
10.4801
10.4672
10.4486
10.4905
10.4510
10.4929
13-Oct-16
10-Nov-16
19-Dec-16
18-Jan-17
09-Feb-17
05-Jun-17
10-Jul-17
12-Sep-17
10-Oct-17
0.1000
0.0800
0.0600
0.0500
0.0500
0.1700
0.0600
0.1000
0.0700
24-Jul-17
28-Aug-17
25-Sep-17
23-Oct-17
0.0600
0.0600
0.0600
0.0600
10.6276
10.5831
10.5622
10.5555
10.5412
10.7224
10.6090
10.5834
10.6309
12.4123
12.4281
12.3655
12.4142
0.0600
0.0600
0.0600
0.0600
0.1700
Edelweiss Banking and PSU Debt Fund
Regular Plan Monthly Dividend
Record Date NAV (`)Dividend per Unit (`)
Individuals/HUF Others
10.3990
10.3921
10.4436
10.4116
10.3472
10.3776
10.3847
10.4071
10.4315
10.4260
10.3778
10.3299
10.3951
0.0462
0.0416
0.0751
0.0591
0.0126
0.0308
0.0317
0.0560
0.0639
0.0618
0.0350
0.0072
0.0469
0.0499
0.0449
0.0811
0.0637
0.0136
0.0333
0.0342
0.0604
0.0690
0.0667
0.0378
0.0077
0.0507
26-Sep-16
25-Oct-16
26-Dec-16
25-Jan-17
27-Feb-17
27-Mar-17
25-Apr-17
25-May-17
27-Jun-17
25-Jul-17
28-Aug-17
25-Sep-17
25-Oct-17Direct Plan Monthly Dividend
10.4154
10.4082
10.4627
10.4278
10.3635
10.3936
10.4006
10.4233
10.4497
10.4407
10.3942
10.3435
10.4113
0.0481
0.0433
0.0789
0.0609
0.0144
0.0325
0.0333
0.0578
0.0670
0.0625
0.0370
0.0087
0.0487
0.0520
0.0468
0.0851
0.0658
0.0156
0.0351
0.0360
0.0624
0.0723
0.0675
0.0399
0.0094
0.0526
26-Sep-16
25-Oct-16
26-Dec-16
25-Jan-17
27-Feb-17
27-Mar-17
25-Apr-17
25-May-17
27-Jun-17
25-Jul-17
28-Aug-17
25-Sep-17
25-Oct-17
Edelweiss Corporate Debt Opportunities Fund
Regular Monthly Dividend
Record Date NAV (`)Dividend per Unit (`)
Individuals/HUF Others
10.5770
10.5612
10.6155
10.5891
10.5275
10.5460
10.5592
10.5691
10.6226
10.5688
10.5745
10.4921
10.5394
0.0568
0.0463
0.0799
0.0676
0.0251
0.0401
0.0407
0.0576
0.0855
0.0518
0.0568
0.0271
0.0334
0.0613
0.0499
0.0863
0.0729
0.0271
0.0432
0.0439
0.0621
0.0922
0.0559
0.0613
0.0293
0.0361
26-Sep-16
25-Oct-16
26-Dec-16
25-Jan-17
27-Feb-17
27-Mar-17
25-Apr-17
25-May-17
27-Jun-17
25-Jul-17
28-Aug-17
25-Sep-17
25-Oct-17Regular Fortnightly Dividend
10.5886
10.5931
10.6051
10.5545
10.6213
10.6118
10.6191
10.5714
10.5483
10.5752
10.5485
10.6070
10.5942
10.5845
10.5923
10.6518
10.5676
0.0261
0.0292
0.0372
0.0034
0.0480
0.0413
0.0479
0.0161
0.0034
0.0149
0.0044
0.0430
0.0304
0.0246
0.0276
0.0732
0.0133
0.0282
0.0315
0.0401
0.0036
0.0518
0.0446
0.0517
0.0174
0.0036
0.0161
0.0048
0.0464
0.0328
0.0266
0.0297
0.0790
0.0144
14-Sep-16
28-Sep-16
14-Oct-16
28-Oct-16
15-Nov-16
28-Nov-16
16-Jan-17
30-Jan-17
14-Feb-17
28-Feb-17
14-Mar-17
29-Mar-17
17-Apr-17
15-May-17
29-May-17
14-Jun-17
28-Jun-17
Record Date NAV (`)Dividend per Unit (`)
Edelweiss Equity Savings Advantage Fund
Regular Plan Dividend
18-Oct-16
20-Feb-17
20-Jun-17
23-Oct-17
0.2500
0.1800
0.1500
0.1500
10.6527
10.5293
10.8779
11.1039
Record Date NAV (`)Dividend per Unit (`)
Direct Plan Dividend
18-Oct-16
20-Feb-17
20-Jun-17
23-Oct-17
0.0600
0.1800
0.1500
0.1500
11.0353
11.1166
11.5197
11.7985
Edelweiss Government Securities Fund
Regular Plan Monthly Dividend
Record Date NAV (`)Dividend per Unit (`)
Individuals/HUF Others
10.7237
10.7344
10.7746
10.7990
10.7157
10.7511
10.7183
10.7208
10.6701
10.7094
0.0359
0.0430
0.0680
0.0908
0.0340
0.0543
0.0325
0.0356
0.0192
0.0272
0.0387
0.0464
0.0734
0.0980
0.0367
0.0586
0.0351
0.0384
0.0207
0.0294
26-Sep-16
25-Oct-16
26-Dec-16
25-Jan-17
25-May-17
27-Jun-17
25-Jul-17
28-Aug-17
25-Sep-17
25-Oct-17
Dividend Option (Fortnightly)
1009.1865
1009.2693
1011.9176
1009.5922
1011.5789
1.8117
1.4735
1.9572
1.1703
2.1227
1.9555
1.5905
2.1125
1.2631
2.2911
12-Sep-16
26-Sep-16
10-Oct-16
25-Oct-16
10-Nov-16
Dividend Option (Monthly)
1012.8865
1012.0825
4.3174
3.6148
4.6600
3.9016
30-Sep-16
28-Oct-16
Retail Plan - Dividend Option (Fortnightly)
1010.0342
1009.5838
1012.1874
1010.0228
1011.6211
2.3763
1.6884
2.1283
1.4647
2.1553
2.5649
1.8224
2.2972
1.5810
2.3263
12-Sep-16
26-Sep-16
10-Oct-16
25-Oct-16
10-Nov-16
Retail Plan - Dividend Option (Monthly)
1013.3056
1012.5013
4.3192
3.6163
4.6620
3.9032
30-Sep-16
28-Oct-16
After payment of dividend, the NAV will fall to the extent of dividend payout and statutory levy (if applicable). Past performance may or may not be sustained in future.
Dividend is declared on the face value of Rs. 10/- per unit.

33
Dividend History
Edelweiss ELSS Fund
Direct Plan Dividend Option
18-Jan-17
21-Sep-17
0.50
0.65
18.36
20.86
Regular Plan Dividend Option
18-Jan-17
21-Sep-17
0.50
0.65
15.34
17.13
Record Date NAV (`)Dividend per Unit (`)
Edelweiss Liquid Fund
Record Date NAV (`)Dividend per Unit (`)
Individuals/HUF Others
Regular Plan Fortnightly dividend
10.2079
10.2045
10.2088
10.2038
1018.00
1018.00
2159.7614
0.0187
0.0164
0.0193
0.0159
623.2863
623.2863
5.0041
0.0201
0.0177
0.0208
0.0172
672.7458
672.7458
5.4012
14-Sep-16
28-Sep-16
14-Oct-16
28-Oct-16
14-Sep-17
15-Sep-17
29-Oct-17
Direct Plan Dividend Option (Monthly)
1005.0342
1004.6285
3.4824
3.2107
3.7587
3.4655
30-Sep-16
28-Oct-16
Dividend Option (Monthly)
1004.9586
1004.6577
3.3786
3.1776
3.6467
3.4297
30-Sep-16
28-Oct-16
Direct Plan Monthly Dividend
10.1859
10.0884
10.0344
10.0851
10.0838
10.0877
0.1038
0.0371
0.0337
0.0363
0.0355
0.0381
0.1120
0.0400
0.0364
0.0392
0.0383
0.0411
25-Jan-17
26-Feb-17
28-Mar-17
25-Apr-17
25-May-17
26-Jun-17
Retail Plan Monthly Dividend
10.0786
10.0738
10.1201
10.0765
10.0788
10.0257
10.0753
10.0739
10.0776
0.0366
0.0334
0.0656
0.0364
0.0380
0.0330
0.0356
0.0346
0.0371
0.0395
0.0361
0.0708
0.0393
0.0410
0.0356
0.0384
0.0373
0.0401
26-Sep-16
25-Oct-16
25-Dec-16
25-Jan-17
26-Feb-17
28-Mar-17
25-Apr-17
25-May-17
26-Jun-17
Retail Plan - Dividend Option (Monthly)
1004.3464
1004.0475
3.0066
2.8062
3.2451
3.0289
30-Sep-16
28-Oct-16
Regular Plan Monthly Dividend
10.0878
10.0830
10.1297
10.0858
10.0880
10.0344
1008.3712
1008.9088
1003.26
10.0845
10.0830
10.0867
1008.3369
0.0369
0.0337
0.0662
0.0368
0.0383
0.0333
3.5383
3.8947
3.3959
0.0359
0.0349
0.0375
3.5131
0.0398
0.0364
0.0715
0.0397
0.0413
0.0359
3.8190
4.2037
3.6653
0.0387
0.0377
0.0404
3.7919
26-Sep-16
25-Oct-16
25-Dec-16
25-Jan-17
26-Feb-17
28-Mar-17
25-Jul-17
27-Aug-17
25-Sep-17
25-Apr-17
25-May-17
26-Jun-17
25-Oct-17
Edelweiss Prudent Advantage Fund
Dividend Option
27-Apr-17
30-May-17
20-Jun-17
0.10
0.10
0.10
18.33
18.17
18.29
Regular Plan Dividend Option
26-Sep-16
27-Oct-16
23-Nov-16
19-Dec-16
18-Jan-17
15-Feb-17
29-Mar-17
10-Jul-17
22-Aug-17
21-Sep-17
23-Oct-17
0.10
0.10
0.10
0.10
0.10
0.10
0.10
0.10
0.10
0.11
0.10
18.04
17.89
16.59
16.31
16.70
17.14
17.75
18.35
18.23
18.49
18.86Direct Plan Dividend Option
26-Sep-16
27-Oct-16
23-Nov-16
19-Dec-16
18-Jan-17
15-Feb-17
29-Mar-17
27-Apr-17
30-May-17
20-Jun-17
10-Jul-17
22-Aug-17
21-Sep-17
23-Oct-17
0.10
0.10
0.10
0.10
0.10
0.10
0.10
0.10
0.10
0.10
0.10
0.10
0.11
0.10
18.33
18.19
16.88
16.60
17.00
17.46
18.09
18.69
18.53
18.66
18.72
18.64
18.92
19.30
Record Date NAV (`)Dividend per Unit (`)
After payment of dividend, the NAV will fall to the extent of dividend payout and statutory levy (if applicable). Past performance may or may not be sustained in future.
Dividend is declared on the face value of Rs. 10/- per unit.
For Edelweiss Liquid Fund and Edelweiss Ultra Short Term Fund, the Dividend is declared on the face value of Rs. 1000/-
Edelweiss Ultra Short Term Fund
Regular Plan Monthly Dividend
Record Date NAV (`)Dividend per Unit (`)
Individuals/HUF Others
10.0623
10.0964
10.1003
10.0940
10.1041
10.1036
10.1202
1010.5155
1009.4221
1004.1700
1009.5367
0.0145
0.0388
0.0410
0.0374
0.0423
0.0444
0.0524
4.3408
3.6208
2.9734
3.6809
0.0157
0.0419
0.0442
0.0403
0.0457
0.0479
0.0566
4.6852
3.9081
3.2094
3.9730
26-Dec-16
25-Jan-17
27-Feb-17
27-Mar-17
25-Apr-17
25-May-17
27-Jun-17
25-Jul-17
28-Aug-17
25-Sep-17
25-Oct-17Retail Plan Monthly Dividend
10.1077
10.0903
10.0840
10.0925
10.0945
10.1090
0.0530
0.0409
0.0373
0.0413
0.0450
0.0516
0.0572
0.0442
0.0403
0.0446
0.0486
0.0557
25-Jan-17
27-Feb-17
27-Mar-17
25-Apr-17
25-May-17
27-Jun-17
Edelweiss Large Cap Advantage Fund
Direct Plan Dividend Option
27-Apr-17
21-Sep-17
0.17
0.73
21.98
22.57
Dividend Option
27-Apr-17
21-Sep-17
0.17
0.73
19.75
20.12
Record Date NAV (`)Dividend per Unit (`)

34
MR. HARSHAD PATWARDHAN
EQUITY ORIENTED SCHEME
Fund Manager:
1 Edelweiss Equity Opportuni�es Fund
2. Edelweiss Tax Advantage Fund
3. Edelweiss Mid and Small Cap Fund
4. Edelweiss Economic Resurgence Fund
MR. BHAVESH JAIN
EQUITY ORIENTED SCHEME
Fund Manager:1. Edelweiss Arbitrage Fund (Equity Por�on)
. E2 delweiss Dynamic Equity Advantage Fund
Fund Manager:
1. Edelweiss ETF – Ni�y 50
2. Edelweiss ETF – Ni�y Bank
3. Edelweiss ETF – Ni�y Quality 30
EXCHANGE TRADED FUND
Schemes managed by Fund Manager
Fund Manager:
1. Edelweiss Prudent Advantage Fund2. Edelweiss Large Cap Advantage Fund3. Edelweiss Equity Savings Advantage Fund (Equity Por�on)
MR. BHARAT LAHOTI
EQUITY ORIENTED SCHEME
Co-Fund Manager
1 delweiss Dynamic Equity Advantage Fund. E
MR. HITEN SHAH
EQUITY ORIENTED SCHEME
Co-Fund Manager
1. Edelweiss ETF – Ni�y 50
2. Edelweiss ETF – Ni�y Bank
3. Edelweiss ETF – Ni�y Quality 30
Fund Manager:
1. Edelweiss Bond Fund
2. Edelweiss Banking and PSU Debt Fund
3. Edelweiss Corporate Debt Opportuni�es Fund
4. Edelweiss Government Securi�es Fund
Fund Manager (Debt Por�on):
1. Edelweiss Equity Savings Advantage Fund
2. Edelweiss Arbitrage Fund
DEBT ORIENTED SCHEME
MR. DHAWAL DALAL
EQUITY ORIENTED SCHEME
Fund Manager:
1. Edelweiss Liquid Fund
2. Edelweiss Ultra Short Term Fund
3. Edelweiss Short Term Fund
DEBT ORIENTED SCHEME
MR. GAUTAM KAUL
FIXED MATURITY PLANS:
Fund Manager:
1. Edelweiss Fixed Maturity Plan – Series 14
2. Edelweiss Fixed Maturity Plan – Series 20
3. Edelweiss Fixed Maturity Plan – Series 35
4. Edelweiss Fixed Maturity Plan – Series 38
5. Edelweiss Fixed Maturity Plan – Series 41
OVERSEAS FOF
Fund Manager:
1. Edelweiss ASEAN Equity Off-shore Fund
2. Edelweiss Emerging Markets Opportuni�es Equity Offshore Fund
3. Edelweiss Europe Dynamic Equity Offshore Fund
4. Edelweiss US Value Equity Offshore Fund
Co-Fund Manager
1. Edelweiss Corporate Debt Opportuni�es Fund
Fund Manager:
1. Edelweiss Equity Savings Advantage Fund (Equity Por�on)
5. Edelweiss Greater China Equity Off-Shore Fund
5. Edelweiss ELSS Fund

35
HOW TO READ A FACTSHEET
Fund Manager : An employee of the asset management company such as a mutual fund or life insurer, who manages investments of the
scheme. He is usually part of a larger team of fund managers and research analysts.
Applica�on Amount for Fresh Subscrip�on : This is the minimum investment amount for a new investor in a mutual fund scheme.
Minimum Addi�onal Amount : This is the minimum investment amount for an exis�ng investor in a mutual fund scheme.
Yield to Maturity : The Yield to Maturity or the YTM is the rate of return an�cipated on a bond if held un�l maturity. YTM is expressed as an
annual rate. The YTM factors in the bond's current market price, par value, coupon interest rate and �me to maturity.
SIP : SIP or systema�c investment plan works on the principle of making periodic investments of a fixed sum. It works similar to a recurring
bank deposit. For instance, an investor may opt for an SIP that invests Rs 500 every 15th of the month in an equity fund for a period of three
years.
NAV : The NAV or the net asset value is the total asset value per unit of the mutual fund a�er deduc�ng all related and permissible expenses.
The NAV is calculated at the end of every business day. It is the value at which the investor enters or exits the mutual fund.
Benchmark : A group of securi�es, usually a market index, whose performance is used as a standard or benchmark to measure investment
performance of mutual funds, among other investments. Some typical benchmarks include the Ni�y, Sensex, BSE200, BSE500, 10-Year Gsec.
Entry Load : A mutual fund may have a sales charge or load at the �me of entry and/or exit to compensate the distributor/agent. Entry load is
charged at the �me an investor purchases the units of a mutual fund. The entry load is added to the prevailing NAV at the �me of investment.
For instance, if the NAV is Rs. 100 and the entry load is 1%, the investor will enter the fund at Rs 101.
Note: SEBI, vide circular dated June 30, 2009 has abolished entry load and mandated that the upfront commission to distributors will be paid
by the investor directly to the distributor, based on his assessment of various factors including the service rendered by the distributor
Exit Load : Exit load is charged at the �me an investor redeems the units of a mutual fund. The exit load is deducted from the prevailing NAV
at the �me of redemp�on. For instance, if the NAV is Rs 100 and the exit load is 1%, the redemp�on price would be Rs 99 Per Unit.
Modified Dura�on : Modified dura�on is the price sensi�vity and the percentage change in price for a unit change in yield
Standard Devia�on : Standard devia�on is a sta�s�cal measure of the range of an investment's performance. When a mutual fund has a high
standard devia�on, its means its range of performance is wide, implying greater vola�lity.
Sharpe Ra�o : The Sharpe Ra�o, named a�er its founder, the Nobel Laureate William Sharpe, is a measure of risk-adjusted returns. It is
calculated using standard devia�on and excess return to determine reward per unit of risk.
Beta : Beta is a measure of an investment's vola�lity vis-à-vis the market. Beta of less than 1 means that the security will be less vola�le than
the market. A beta of greater than 1 implies that the security's price will be more vola�le than the market.
AUM : AUM or assets under management refers to the recent / updated cumula�ve market value of investments managed by a mutual fund
or any investment firm.
Holdings : The holdings or the por�olio is a mutual fund's latest or updated reported statement of investments/securi�es. These are usually
displayed in terms of percentage to net assets or the rupee value or both. The objec�ve is to give investors an idea of where their money is
being invested by the fund manager.
Nature of Scheme : The investment objec�ve and underlying investments determine the nature of the mutual fund scheme. For instance, a
mutual fund that aims at genera�ng capital apprecia�on by inves�ng in stock markets is an equity fund or growth fund.Likewise, a mutual
fund that aims at capital preserva�on by inves�ng in debt markets is a debt fund or income fund. Each of these categories may have subcategories.
Ra�ng Profile : Mutual funds invest in securi�es a�er evalua�ng their creditworthiness as disclosed by the ra�ngs. A depic�on of the mutual
fund in various investments based on their ra�ngs becomes the ra�ng profile of the fund. Typically, this is a feature of debt funds.

Notes
36

EDELWEISS ASSET MANAGEMENT LIMITED - ISC / OPAAhmedabad� : Ground Floor, Madhusudan House, Opp. Shail Building, Near Girish Cold Drink Cross Road, Off CG Road, Navrangpura, Ahmedabad - 380 009. Tel No. : 079 26461040/ 26461070Bengaluru� : Unit No. 912, 9th floor, Prestige Meridian-1, No.20 , M.G Road, Bengaluru -560001 Karnataka. Tel No. : 080-69001508Chandigarh � : Cabin No. 19, 2nd Floor of Meeting point, SCO 487-488, Sector 35-C, Chandigarh - 160035. Tel No. : 0172-5086890 / 2603771Chennai� : No. 40, 3rd Floor, North Wing, Bazullah Road, T. Nagar, Chennai - 600017. Tel No. : 044-40221391Indore� : 312-313, D.M. Tower, Third Floor, Race Course Road, Indore, Madhya Pradesh - 452001. Tel No. : 0731 6701522Kolkata� : Savitri Tower, 2nd Floor, 3A Upper Wood Street, Kolkata - 700017. Tel No. : 033 - 4421 8800Lucknow� : Cabin No. 102, A Small Store Trade Point, Ground Floor, Saran Chamber-1, 5-Park Road, Hazratgunj, Lucknow - 226001. Tel No. : 0522-4070679Mumbai� : Edelweiss House, 4th Floor, Off C.S.T. Road, Kalina, Mumbai - 400 098, Maharashtra. Tel No. : 022 4097 9900 / 4097 9821
New Delhi� : 104, 5th Floor, Mercantile House, 15 Kasturba Gandhi Marg, New Delhi - 110 001. Tel No. : 011-43571105
KARVY COMPUTERSHARE PRIVATE LIMITED - ISC / OPAUNIT : Edelweiss Mutual Fund, Karvy Selenium Tower B, Plot No 31 & 32, Gachibowli, Financial, District, Nanakramguda, Serilingampally , Hyderabad – 500 008 Tel: 040-67161500Agra : Ahmedabad : 1st Floor, Deepak Wasan Plaza, Behind Holiday Inn, Sanjay Place, Agra - 282002. Tel.: 8899928346 • 201/202 Shail Complex, Opp. Madhusudan House, B/H Girish Cold Drink, Off C G Road, Navrangpura, Ahmedabad - 380006. Tel.: 079-65445550, 079-26402967 • 302, 3rd Floor, Ajmer Auto Building, Opposite City Power House, Jaipur Road, Ajmer - 305001. Tel.: 0145-Ajmer :5120725 • 1st Floor, Kumar Plaza, Ramghat Road, Aligarh - 202001. Tel.: 8899928347 • Rsa Towers, 2nd Floor, Above Sony Tv Showroom, 57, S P Marg, Civil Lines, Allahabad - Aligarh : Allahabad :211001. Tel.: 8081127728 • 6349, Nicholson Road, Adjacent Kos Hospitalambala Cant, Ambala - 133001. Tel.: 9541721382 • 72-A, Taylor'S Road, Opp Aga Heritage Club, Amritsar - Ambala : Amritsar : 143001. Tel.: 0183-5053802 • B-42 Vaibhav Commercial Center, Nr Tvs Down Town Shrow Room, Grid Char Rasta, Anand - 380001. Tel.: 9662020623 • L/2 Keval Shopping Anand : Ankleshwar : Center, Old National Highway, Ankleshwar, Ankleshwar - 393002. Tel.: 02646 645326 • 114/71 G T Road, Near Sony Centre, Bhanga Pachil, Asansol - 713303. Tel.: 9332095447 • Asansol : Aurangabad : Balasore : Ramkunj Niwas, Railway Station Road, Near Osmanpura Circle, Aurangabad - 431005. Tel.: 0240-2343414 • M.S Das Street, Gopalgaon, Balasore, Orissa, Balasore - 756001. Tel.: 06782-260503 • 59, Skanda puttanna Road, Basavanagudi, Bangalore - 560004. Tel.: 080-26602852 • 1st Floor, 165, Civil Lines, opp. Hotel Bareilly Palace, Near Railway Station, Bangalore : Bareilly : Bareilly - 243001. Tel.: 8899928348 • 203, Corner point, Jetalpur Road, Gujarat, Baroda - 390007. Tel.: 0265-2353506 • Near Hotel Diamond Surbhi Complex, O.C Township Gate, Baroda : Begusarai :Kapasiya Chowk, Begusarai - 851117. Tel.: 7857015101 • Cts No. 3939/ A2 A1, Above Raymonds Show Room, Beside Harsha Appliances, Club Road, Belgaum - 590001. Tel.: 0831 2402544 • Belgaum : Berhampur (Or) : Bhagalpur : Divya Nandan Kalyan Mandap, 3rd Lane Dharam Nagar, Near Lohiya Motor, Berhampur (Or) - 760001. Tel.: 0680-2228106 • 2nd Floor, Chandralok Complex, Ghantaghar, Radha Rani Sinha Road, Bhagalpur - 812001. Tel.: 7857015102 • Shop No 147-148, Aditya Complex, Near Kasak Circle, Bharuch - 392001. Tel.: 02642-229022 • Bharuch : Bhavnagar : Krushna Darshan Complex, Parimal Chowk, Office No. 306-307, 3rd Floor, Above Jed Blue Show Room, Bhavnagar - 364002. Tel.: 278-3003149 • Shop No -1, First Floor Plot No -1, Commercial Bhilai :Complex, Nehru Nagar - East, Bhilai - 490020. Tel.: 0788-2295999 / 2295332 • Kay Kay Business Centre, 133, Zone I, Mp Nagar, Above City Bank, Bhopal - 462011. Tel.: 0755-4092712,0755-Bhopal : 4092715 • A/181 , Back Side of Shivam Honda Show Room, Saheed Nagar, Bhubaneswar - 751007. Tel.: 0674-6534585 • B-1, 1st Floor, City Centre, Sector- 4, Near Sona Chandi Bhubaneswar : Bokaro :Jwellars, Bokaro - 827004. Tel.: 9204061959 • Gomati Smuti,Ground Floor, Jambli Gully, Near Railway Station, Borivali, Mumbai - 400 092. Tel - 022- 28916319 • 63 GT Road, Borivali : Burdwan :Halder Complex 1st Floor, Burdwan - 713101. Tel.: 0342-2665140 • 2nd Floor Soubhagya Shopping Complex, Arayidathpalam, Mavoor Road, Calicut - 673004. Tel.: 0495-4022480 • Calicut :Chandigarh : Chennai :Sco-2423-2424, Above Mirchi Restaurant, New Aroma Hotel, First Floor, Sector 22-C, Chandigarh - 160022. Tel.: 0172-5101342 • F-11, Akshaya Plaza, 1st Floor, 108, Adhithanar Salai, Egmore, Opp to Chief Metropolitan Court, Chennai - 600002. Tel.: 044-42028512 • Ali Arcade, 1st Floor, Kizhavana Road, Panampilly Nagar, Near Atlantis Junction, Ernakualm - Cochin :682036. Tel.: 0484 3000231 / 32 • 3rd Floor, Jaya Enclave, 1057 Avinashi Road, Coimbatore - 641018. Tel.: 0422 - 4388011 • Opp Dargha Bazar Police station, Dargha Bazar, Po Coimbatore : Cuttack :- Buxi Bazar, Cuttack - 753001. Tel.: 0-9238102118 (Tata Basephone) • Kaulagarh Road, Near Sirmaur Margabove, Reliance Webworld, Dehradun - 248001. Tel.: 8899928349 / Dehradun :8899928350 • 208 New Market, 2nd Floor, Bank More, Dhanbad - 826001. Tel.: 0326-6452027 • 307/9-A 1st Floor, Nagarkar Colony, Elite Business Center, Nagarkar Colony, P B Dhanbad : Dharwad :Road, Dharwad - 580001. Tel.: 0836- 2744207 • MWAV-16 Bengal Ambuja, 2nd Floor City Centre, Distt. Burdwan, Durgapur - 713216. Tel.: 0343-6512111 • No: 4, Veerappan Traders Durgapur : Erode :Complex, KMY Salai, Sathy Road, Opp. Erode Bus Stand, Erode - 638003. Tel.: 0424-4021212 • A-2B, 3rd Floor, Neelam Bata Road, Peer ki Mazar, Nehru Groundnit, Faridabad - 121001. Tel.: Faridabad :8287922816 • Shop # 12, Shree Ambica Arcade, Plot # 300, Ward 12, Opp. CG High School, Near HDFC Bank, Gandhidham - 370201. Tel.: 02836 651296 • 54 Lal Kothi Compound, Gandhidham : Gaya :Shree Krishna Road, 2nd Floor, North Side, Near Royal Surya Hotel, Gaya - 823001. Tel - 0631-2220065 • 1st Floor C-7, Lohia Nagar, Ghaziabad - 201001. Tel.: 8287059970 • Ghaziabad : Gorakhpur :Above V.I.P. House Ajdacent, A.D. Girls College, Bank Road, Gorakhpur - 273001. Tel.: 8081127735 • D No 6-10-27, Srinilayam, Arundelpet, 10/1, Guntur - 522002. Tel.: 0863-2339094 • Guntur :Gurgaon : Guwahati :Shop No. 18, Ground Floor, Sector - 14, Opp. Akd Tower, Near Huda Office, Gurgaon - 122001. Tel.: 8287956344 • 1st Floor, Bajrangbali Building, Near Bora Service Station, GS Road, Guwahati - 781007. Tel.: 8811036746 • 2nd Floor, Rajeev Plaza, Jayendra Ganj, Lashkar, Gwalior - 474009. Tel.: 9907342201 • Above Kapilaz, Sweet House, Opp LIC Gwalior : Haldwani :Building, Pilikothi, Kaladhungi Road, Haldwani - 263139. Tel.: 8899928351 • SCO 71, 1st Floor, Red Square Market, Hissar - 125001. Tel.: 9541721383 • CTC No.483/A1/A2, Ground Floor, Hissar : Hubli :Shri Ram Palza, Behind Kotak Mahindra Bank, Club Road, Hubli - 580029. Tel.: 0836-2252444 • Karvy House, No:46, 8-2-609/K, Avenue 4, Street No. 1, Banjara Hills, Hyderabad - Hyderabad :500034. Tel.: 040-44857874 / 75/ 76 • Karvy Selenium, Plot No: 31 & 32, Tower B, Survey No. 115/22, 115/24, 115/25, Financial District, Gachibowli, Nanakramguda, Hyderabad (Gachibowli) :Serilimgampally Mandal, Hyderabad - 500032. Tel.: 040-33215122 • 2nd floor, 203-205 Balaji Corporate House, Above ICICI bank, 19/1 New Palasia, Near Curewell Hospital, Janjeerwala Indore :Square Indore, Indore - 452001. Tel.: 0731-4266828/4218902 • S16/A IIIrd Floor, Land Mark Building, Opp. Jai Club, Mahaver Marg, C Scheme, Jaipur - 302001. Tel.: 01414167715/17 • Jaipur :Jalandhar : Jalgaon : 1st Floor, Shanti Towers, SCO No. 37, PUDA Complex, , Opposite Tehsil Complex, Jalandhar - 144001. Tel.: 0181-5094410 • 269, Jaee Vishwa, 1st Floor, Baliram Peth, Above United Bank of India, Near Kishor Agencies, Jalgaon - 425001. Tel.: 9421521406 • D B C Road, Opp Nirala Hotel, Opp. Nirala Hotel, Opp. Nirala Hotel, Jalpaiguri - 735101. Tel.: 03561-222136 • Jalpaiguri : Jammu : Jamnagar :Gupta's Tower, 2nd Floor, CB-12, Rail Head Complex, Jammu - 180012. Tel.: 0191-2470860 / 2458818 • 136-137-138 Madhav Palaza, Opp SBI Bank, Nr. Lal Bunglow, Jamnagar - 361001. Tel.: 0288 3065810 • 2nd Floor, R. R. Square, SB Shop Area, Near Reliance Foot Print & Hotel- BS Park Plaza, Main Road, Bistupur, Jamshedpur - 831001. Tel.: 0657-6655003/ Jamshedpur :6655004/ 6655005/ 6655006/ 6655007 • 371/01, Narayan Plaza, Gwalior Road, Near Jeevan Shah Chauraha, Jhansi - 284001. Tel.: 7851827396 • 203, Modi Arcade, Chopasni Jhansi : Jodhpur :Road, Jodhpur - 342001. Tel.: 0291-6454590 • 15/46, B, Ground Floor, Opp. Muir Mills, Civil Lines, Kanpur - 208001. Tel.: 8081127738 / 8081127740 • No. 2, Gopi Arcade, 100 Feet Kanpur : Karaikudi :Road, Karaikudi - 630001. Tel.: 04565-237192 • No.6, old No.1304, Thiru-vi-ka Road, Near G.R.Kalyan Maha, Karur - 639001. Tel.: 04324-241755 • 180 Malancha Road, Beside Axis Karur : Kharagpur :Bank Ltd, Kharagpur - 721304. Tel.: 03222-253380 • 605/1/4 E Ward, Shahupuri, 2nd Lane, Laxmi Niwas, Near Sultane Chambers, Kolhapur - 416001. Tel.: 0231 2653656 • Kolhapur : Kolkata : Apeejay House (Beside Park Hotel), C Block, 3rd Floor, 15 Park Street, Kolkata - 700016. Tel.: 033 66285900 • 29, Ist Floor, Near Lala Lajpat Rai Circle, Shopping Centre, Kota - 324007. Tel.: 0744-Kota :5100964 • 1st Floor Csiascension Square, Railway Station Road, Collectorate P O, Kottayam - 686002. Tel.: 0481-2300868/2302420 • Ist Floor, A. A. Complex, 5 Park Road, Kottayam : Lucknow :Hazratganj, Thaper House, Lucknow - 226001. Tel.: 8081127722 • Sco - 136 , 1st Floor, Above Airtel Showroom, Feroze Gandhi Market, Ludhiana - 141001. Tel.: 0161-4648747 • Ludhiana : Madurai :Rakesh towers, 30-C, Ist floor, Bye pass Road, Opp. Nagappa motors, Madurai - 625010. Tel.: 0452-2605856 • Sahis Tuli, Under Ward No.6, No.1 Govt Colony, English Bazar Municipality, Malda - Malda : 732101. Tel.: 03512-223763 • Mahendra Arcade, Opp. Court Road, Karangal Padi, Mangalore - 575003. Tel.: 0824-2496289 • 2nd Floor, Dalal Commercial Complex, Pajifond, Mangalore : Margao :Margao - 403601. Tel.: 0832-2731823 • Ambey Crown, 2nd Floor, In Front Of Bsa College, Gaushala Road, Mathura - 281001. Tel.: 8899928354 • 1st Floor, Medi Centre, Opp Icici Mathura : Meerut : Bank, Hapur Road, Near Bachha Park, Meerut - 250002. Tel.: 8899928339 • Ul/47 Apollo Enclave, Opp Simandhar Temple, Modhera Cross Road, Mehsana - 384002. Tel.: 02762-242950 • Mehsana : Moradabad : Mumbai : Om Arcade, Parker Road, Above Syndicate Bank, Chowk Tari Khana, Moradabad - 244001. Tel.: 8899328356 • 24/B, Raja Bahadur Compound, Ambalal Doshi Marg, Behind Bse Bldg, Fort - 400001. Tel.: 022-66235353 • First Floor, Shukla Complex, Near ICICI Bank, Civil Court Branch, Company Bagh, Muzaffarpur - 842001. Tel.: 7857015105 • L-Muzaffarpur : Mysore : 350, Silver Tower, Ashoka Road, Opp. Clock Tower, Mysore - 570001. Tel.: 0821-2438006 • 104/105, Near Paras Cinema, City Point Nadiad, Nadiad - 387001. Tel.: 0268-2563245 • Nadiad : Nagercoil :45, East Car Street, 1st Floor, Nagercoil - 629001. • Plot No 2/1 House No 102/1, Mata Mandir Road, Mangaldeep Appartment Opp Khandelwal Jewelers, Dharampeth, Nagpur - 440010. Tel.: Nagpur : 0712-2533040 • F-1, Suyojit Sankul, Sharanpur Road, Near Rajiv Gandhi Bhavan, Nasik - 422002. Tel.: 0253-6611395 • 1/1 Chinmay Aracade, Opp Sattapir Rd, Tower Rd, Navsari - Nasik : Navsari : 396445. Tel.: 02637-280367 • 305 New Delhi House , 27 Barakhamba Road, New Delhi - 110001. Tel.: 011- 43681700 • 405,4th Floor,Vishal Chamber, Plot No.1,Sector-18, Noida - New Delhi : Noida :201301. Mob - 8287831058. • JAVA Complex, 1st Floor, Above Vijaya Bank, G T Road, Panipat - 132103. Tel.: 9541721384 • Flat No.1-A, H. No. 13/70, Timotio Bldg, Heliodoro Salgado Panipat : Panjim : Road, Next to Navhind Bhavan (Market Area), Panjim - 403001. Tel.: 0832-2426873 • Sco 27 D, Chotti Baradari, Near Car Bazaar, Patiala - 147001. Tel.: 0175-5004349 • 3A, 3rd Floor Patiala : Patna : Anand Tower, Exhibition Road, Opp Icici Bank, Patna - 800001. Tel.: 0612-4323066 • Building No:7, 1st Floor, Thiayagaraja Street, Pondicherry - 605001. Tel.: 0413 2220640 • Pondicherry : Pune : Mozaic Bldg, CTS No.1216/1, Final, Plot No.576/1 TP, Scheme No.1, F C Road, Bhamburda, Shivaji Nagar, Pune - 411004. Tel.: 020-66496700 / 66496701 • Shop No-TF-31, 3rd Floor, Millenium Raipur : Plaza, Near Old Indian Coffee House, G E Road, Raipur - 492001. Tel.: 0771-4052620 • D.No.6-1-4, Rangachary Street, T.Nagar, Near Axis Bank Street, Rajahmundry - 533101. Tel.: Rajahmundry : 0883-2434469 • 302, Metro Plaza, Near Moti Tanki Chowky, Rajkot, Gujarat - 360001. Tel : 0281-6545888 • Room No 307 3rd Floor, Commerce Tower, Beside Mahabir Tower, Ranchi - Rajkot : Ranchi : 834001. Tel.: 0651-2331320 • 1st Floor, Ashoka Plaza, Delhi Road, Rohtak - 124001. Tel.: 9541721385 • 1st Floor, Sandhu Complex, Kachery Road, Uditnagar, Rourekla - 769012. Tel.: Rohtak : Rourkela : 0661-2500005 • 18 Mission Market, Court Road, Saharanpur - 247001. Tel.: 8899928353 • NO 3/250, Brindavan Road, 6th Cross, Perumal kovil back side, Fairland's, Salem - Saharanpur : Salem : 636016. Tel.: 0427-4020300 • Koshal Builder Complex, Near Goal Bazaar Petrol pump, Sambalpur - 768001. Tel - 0663-2533437 • Crystal Plaza, 2nd Floor, Manday Sambalpur : Secunderabad : Lane, Near Sunshine Hospital, P G Road, Secunderabad - 500 003, Tel.: 8985469607 • Annex Mani Bhawan, Lower Thana Road, Near R K M Lp School, Shillong - 793001. Tel.: 0364 - Shillong : 2506106 • Triveni Building, By Pas Chowkkhallini, Shimla - 171002. Tel.: 8263860395 • Sri Matra Naika Complex, 1st Floor, Above Shimoga Diagnostic Centre, Llr Road, Durgigudi, Shimla : Shimoga : Shimoga - 577201. Tel.: 08182-228799 • N.N. Dutta Road, Chowchakra Complex, Premtala, Silchar - 788001. Tel.: 3842261714 • Nanak Complex, Sevoke Road, Siliguri - 734001. Tel.: Silchar : Siliguri : 0353-2522579 • G-5 Empire State Buliding, Nr Udhna Darwaja, Ring Road, Surat - 395002. Tel.: 0261-2311100 / 2339100 • G1, Ground Floor, No 22, Vijayaraghava Road, Swathi Court, T Surat : T Nagar :Nagar, Chennai - 600 017. Tel.: 044 - 28151034 • 101, Yaswant Tower, 1st Floor, Opposite Puja Hotel, Ram Maruti Road, Naupada Thane (West), Mumbai - 400 602. Tel.: 022 25428475 • Thane :Tirunelveli : Tirupur : 55/18, Jeney Building, S N Road, Near Aravind Eye Hospital, Tirunelveli - 627001. Tel.: 0462 2335137 • First floor, 244 A, Above Selvakumar Dept stores, Palladam Road, Opp to Cotton market complex, Tirupur - 641604. Tel.: 0421-2214221 • 2nd Floor, Brothers Complex, Naikkanal Junction, Shornur Road, Near Dhanalakshmi Bank H O, Thrissur - 680001. Tel.: 0487- Trichur : 6999987 • 60, Sri Krishna Arcade, Thennur High Road, Trichy - 620017. Tel.: 0431-4020227 • 2nd Floor, Akshaya Tower, Sasthamangalam, Trivandrum - 695010. Tel.: 0471 - Trichy : Trivandrum : 2725728 • 201-202, Madhav Chambers, Opp G P O , Chetak Circle , Udaipur - 313001. Tel.: 0294 2429370 • Shop No 2 , Phiroza Corner, Opp Next Show Room, Tithal Road, Valsad - Udaipur : Valsad : 396001. Tel.: 02632-258481 • Shop No-12, Ground Floor, Sheetal Appatment, Near K P Tower, Vapi - 396195. Tel.: 9228012909 • D-64/1321St Floor, Anant Complex, Sigra, Varanashi - Vapi : Varanasi : 221010. Tel.: 8081127746 • 39-10-7, Opp : Municipal Water Tank, Labbipet, Vijayawada - 520010. Tel.: 0866-6604032/39/40 • V P Road, Opp: Railway Station, Above Axis Vijayawada : Vile Parle :Bank Atm, Vile Parle (west), Mumbai - 400 056. Tel.: 022-26100967 • Door No: 48-8-7, Dwaraka Diamond, Ground Floor, Srinagar, Visakhapatnam - 530016. Tel.: 0891-2714125 • Visakhapatnam : Warangal : 5-6-95, 1st Floor, Opp: B.Ed Collage, Lashkar Bazar, Chandra Complex, Hanmakonda, Warangal - 506001. Tel.: 0870-2501664


