EDC MarketUpdate november 2015
16
NOVEMBER 2015 Research MARKET UPDATE Erhverv Poul Erik Bech
-
Upload
edc-erhverv -
Category
Documents
-
view
213 -
download
0
description
Our report EDC Market Update features market data in great detail on yields, rents, vacancy rates and an outlook on pricing in the following property sectors: office, retail, industrial & logistics and residential rental properties.
Transcript of EDC MarketUpdate november 2015

N O V E M B E R 2 0 1 5
Research
MARKET UPDATE
Erhverv Poul Erik Bech
EDC Research - November 2015 - page 2
MARKET UPDATE EDC
Contact us:Robert Neble LarsenCEOTel: +45 33 30 10 54 Mail: [email protected]
Copenhagen:Morten Westphal JensenRegional directorTel: + 45 38 77 05 22Mail: [email protected]
Aarhus:Søren Leth PedersenRegional Director, Partner, MSc.(f), Chartered Surveyor, MDETel: +45 58 58 78 76Mail: [email protected]
Aalborg:Frank Jensen Regional Director, Partner, CBATel: +45 58 58 75 72Mail: [email protected]
Kolding:Karsten L Jensen Regional Director, Partner, Tel: +45 58 58 74 07 Mail: [email protected]
Odense:Morten Nielsen Dept. Manager, Partner, Chartered Surveyor, MDETel: +45 58 58 78 56Mail: [email protected]
Research:Andreas BrandtAnalyst, MSc in EconomicsTel: +45 33 30 10 95Mail: [email protected]
edc.dk/erhverv
N O V E M B E R 2 0 1 5
REMARKS FOR OUR ESTIMATES:
The valuation of a property depends on various property specific attributes, including, but not limited to, the lease conditions, the tenant’s credit rating and the property’s condition. When valuing a property, the estimates should not be relied upon without seeking qualified, professional advice. However, the estimates can serve as useful in-put in the valuation process. Any reproduction of data in this report should be credited to EDC Erhverv Poul Erik Bech. Whilst data and estimates have been rigorously checked, EDC Erhverv Poul Erik Bech can take no responsibility for any inaccuracy within this report. Estimates and forecasts of rents and yields are as of 1. October 2015. Estimates are subject to change.
YIELDS, MARKET RENTS AND FORECASTS:
LOCATION: Yield and market rent estimates covers properties with prime, secondary and tertiary location.
FACILITY CLASS: Location aside, our estimates are based upon a segmentation of pro-perty facility classes; facility class A, B and C, where class A is the best facility class. Various variables for each property type have been taken into consideration with regards to deter-mine the facility classes, such as: size, floor plan structure, year of construction, lifts, climate control, cabling infrastructure, staff facilities, customer facilities, parking facilities, building energy rating, ceiling height, general accessibility, general condition of the property, etc. A property with prime location and class A facilities has the best possible location in an area, the highest standard when it comes to facilities, is modern and ready to move into. This type of property will typically be traded at the lowest yield for the area, have the highest market rent and have a short reletting process. Naturally, yield and market rent estimates are subject to certain deviations depending on the exact location and property specific facilities.
YIELD DEFINITION: All yields are net initial yields and is defined as the annualised rent generated by the property, after the deduction of estimated annual irrecoverable property outgoings, expressed as a percentage of the property valuation (property valuation is adjusted for the value of rental deposits and prepaid rent). For comparison purposes it is assumed that all properties are fully let at market-conform conditions.
MARKET RENT ESTIMATES: All rents are headline rents, in other words the con-tracted gross rent receivable which becomes payable after any tenant incentives have expired. Market rent estimates are expressed in €/sq m/year. Figures have been roun-ded when converting from DKK (Danish Kroner) to €. It is assumed that all properties are let at market-conform conditions.
FORECASTS: All forecasts reflect our expectations for the development over the next 3 to 6 months.
RESIDENTIAL RENTAL PROPERTIES: In this report estimates are included for “Newer residential rental properties”, “Fully developed older residential rental proper-ties” and “Older residential rental properties”. In Denmark residential rental levels cannot be determined freely and is subject to far reaching rent control. The major dif-ference between the before mentioned types of residential rental property is that older residential rental properties are regulated by the provisions in the Danish rent act (Le-jeloven) and the Housing Regulation Act (Boligreguleringsloven) concerning cost dri-ven rental levels. Newer residential rental properties taken in to use no earlier than 1 April 1992 are subject to the rules concerning free market rent, pursuant to the Housi-ng Regulation Act § 15 A and others.
DATA FOR VACANT COMMERCIAL SPACE ( VACANCY RATE)
Source: Oline ED-Statistikken (Oline-ED Statistics) as of 1. October 2015. For more information we refer to www.oline.dk/info/statistik. The forecasts of the vacancy rates have been made by EDC Erhverv Poul Erik Bech and reflect our expectations for the development over the next 3 to 6 months.
Forecasts
Increasing
Stable
Decreasing
EDC Research - November 2015 - page 3
MARKET UPDATE EDC
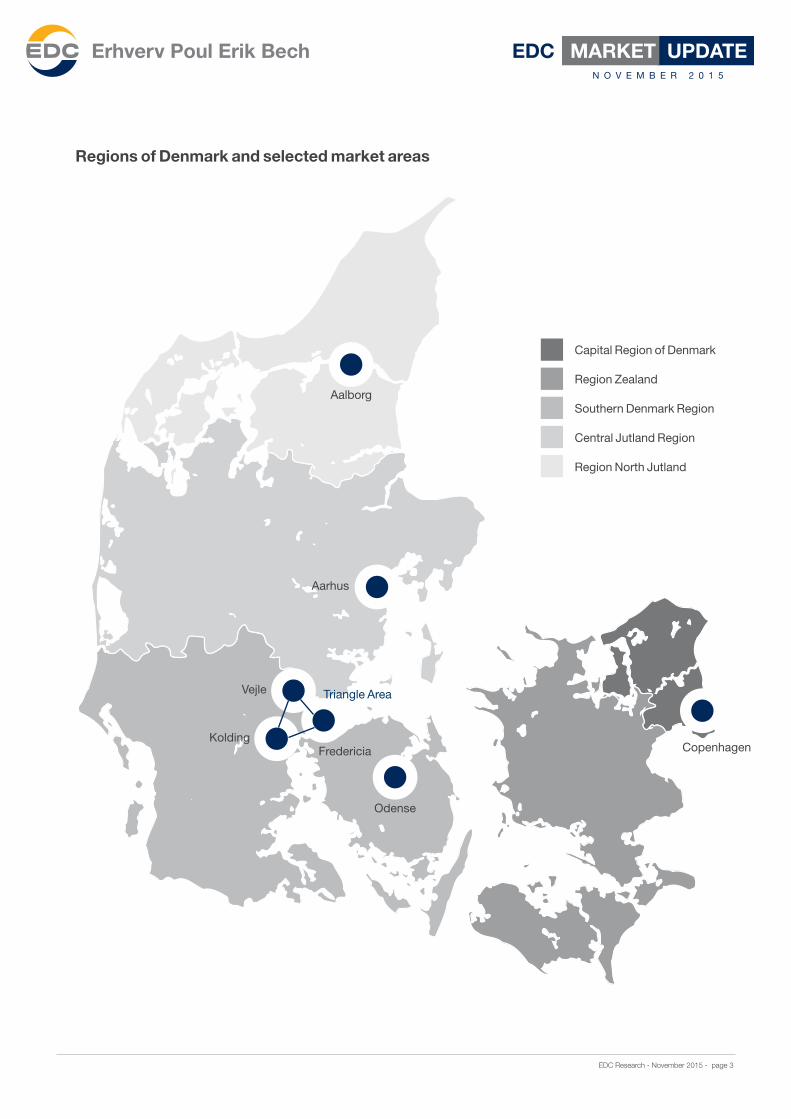
Regions of Denmark and selected market areas
N O V E M B E R 2 0 1 5
Capital Region of Denmark
Region Zealand
Southern Denmark Region
Central Jutland Region
Region North Jutland
Copenhagen
Odense
Aarhus
KoldingFredericia
Vejle
Aalborg
Triangle Area

EDC Research - November 2015 - page 4
MARKET UPDATE EDC
Facility class A Facility class B Facility class C Facility class A Facility class B Facility class C
Copenhagen Yield in % Yearly market rent in €/sq m
Prime 5.00 5.50 6.00 245 190 155
Secondary 5.50 6.00 6.75 190 150 130
Tertiary 6.75 7.25 7.75 150 130 110
Aarhus
Prime 5.25 5.75 6.25 185 145 120
Secondary 6.00 6.50 7.25 150 115 95
Tertiary 6.50 7.00 8.00 115 85 75
Aalborg
Prime 6.00 6.50 7.50 135 125 105
Secondary 6.25 7.25 8.00 125 110 95
Tertiary 7.25 8.00 8.50 110 90 75
Triangle area
Prime 6.75 7.00 7.25 145 105 75
Secondary 7.00 7.50 7.75 110 85 70
Tertiary 7.75 8.75 9.75 60 55 50
Odense
Prime 6.25 7.00 8.00 155 125 95
Secondary 7.00 8.00 9.00 135 110 90
Tertiary 8.00 9.00 10.00 90 85 70
Vacancy sq m As % of building stock Change % QoQ Change % YoY Forecast
Central Copenhagen 473,300 8.1 0.6 -0.4
East Jutland (including Aarhus) 282,800 9.3 -2.8 -3.2
North Jutland Region (including Aalborg) 153,600 7.9 -0.8 0.0
South Jutland (including the Triangle Area) 226,600 9.7 -0.6 -1.0
Funen (including Odense) 119,800 8.0 -0.8 -1.9
Yield in %, yearly market rent in €/sq m and forecast for the next 3-6 months
Vacant office space in sq m, in % of building stock and forecast for the next 3-6 months
Source: EDC Erhverv Poul Erik Bech. Data as of 1. October 2015.Forecasts: All forecasts reflect our expectations for the development over the next 3 to 6 months.
Source: Oline ED-Statistikken (Oline ED-statistics), data as of 1. October 2015. Changes quarter on quarter and year on year. Forecasts: All forecasts reflect our expectations for the development over the next 3 to 6 months.
O F F I C E - N O V E M B E R 2 0 1 5
Office

EDC Research - November 2015 - page 5
MARKET UPDATE EDC
Office Building stock Vacancy sq m Change sq m QoQ As % of building stock Change in % QoQ
Central Copenhagen 5,824,100 473,300 35,100 8.1% 0.6%
Copenhagen area 3,691,400 542,000 -21,100 14.7% -0.6%
North Zealand 1,585,500 151,900 -39,800 9.6% -2.5%
Bornholm 114,100 1,200 0 1.0% 0.0%
Capital Region of Denmark 11,215,200 1,168,400 -25,800 10.4% -0.2%
East Zealand 692,800 31,500 -2,800 4.5% -0.4%
West- and South Zealand 1,558,100 73,400 -300 4.7% 0.0%
Region Zealand 2,250,900 104,900 -3,000 4.7% -0.1%
Funen (including Odense) 1,493,200 119,800 -11,100 8.0% -0.8%
South Jutland 2,324,400 226,600 -12,200 9.7% -0.6%
Southern Denmark Region 3,817,600 346,400 -23,200 9.1% -0.6%
East Jutland 3,052,700 282,800 -86,200 9.3% -2.8%
West Jutland 1,396,300 71,200 -1,100 5.1% -0.1%
Central Jutland Region 4,449,100 354,000 -87,400 8.0% -1.9%
North Jutland 1,938,900 153,600 -15,200 7.9% -0.8%
Region North Jutland 1,938,900 153,600 -15,200 7.9% -0.8%
Denmark, total 23,671,700 2,127,300 -154,700 9.0% -0.6%
Vacant office space in sq m, in % of building stock and forecast for the next 3-6 months
Key vacancy figures from Oline ED-Statistikken (Oline ED-statistics)
Source: Oline ED-Statistikken (Oline ED-statistics), data as of 1. October 2015. "% of building stock" is the proportion of empty space in sq m relative to the total building stock.
Source: Vacancy data from Oline ED-Statistikken (Oline ED-statistics). Data as of 1. October 2015.Forecasts: EDC Erhverv Poul Erik Bech. All forecasts reflect our expectations for the development over the next 3 to 6 months.
Central East Jutland North Jutland Region South Jutland Funen Copenhagen (including Aarhus) (Including Aalborg) (including the (including Odense) Triangle Area)
O F F I C E - N O V E M B E R 2 0 1 5
0%
2%
4%
6%
8%
10%
12%
Central Copenhagen East Jutland(Including Aarhus)
Region North Jutland(Including Aalborg)
South Jutland(including theTriangle area)
Funen(including Odense)
473,300 sq m
282,800 sq m
153,600 sq m
226,600 sq m
119,800 sq m
EDC Research - November 2015 - page 6
MARKET UPDATE EDC
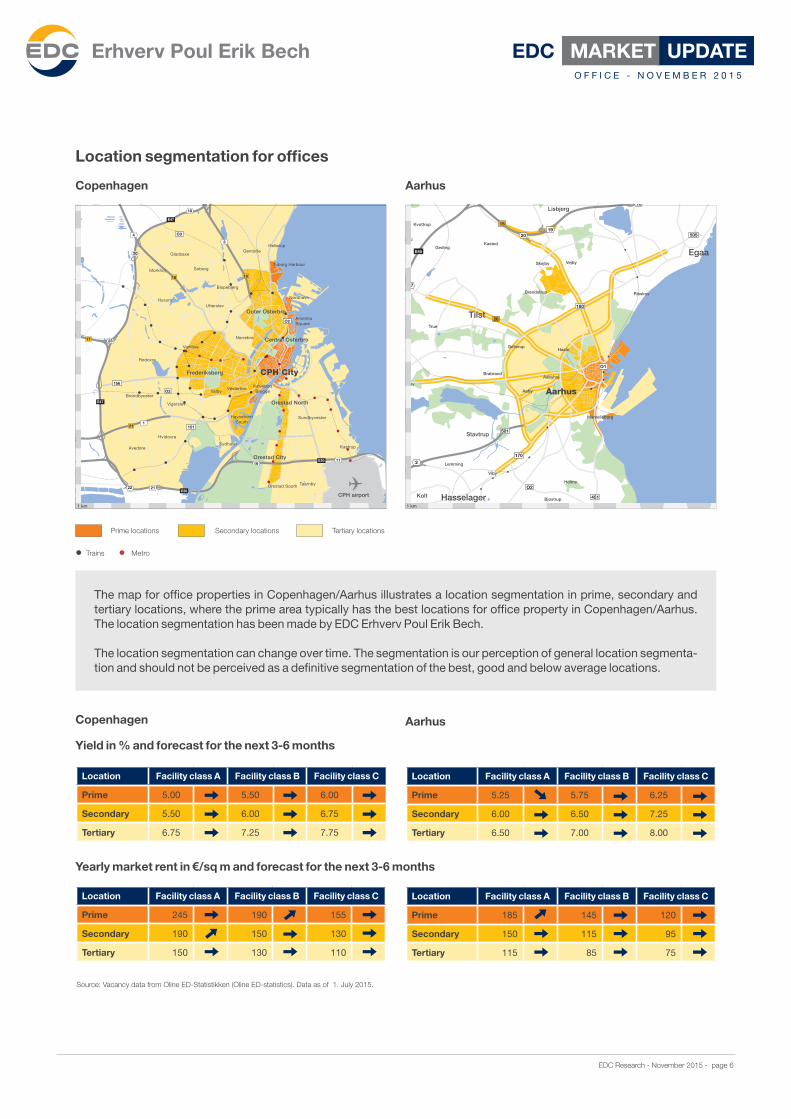
The map for office properties in Copenhagen/Aarhus illustrates a location segmentation in prime, secondary and tertiary locations, where the prime area typically has the best locations for office property in Copenhagen/Aarhus. The location segmentation has been made by EDC Erhverv Poul Erik Bech.
The location segmentation can change over time. The segmentation is our perception of general location segmenta-tion and should not be perceived as a definitive segmentation of the best, good and below average locations.
Copenhagen Aarhus
O F F I C E - N O V E M B E R 2 0 1 5
Location segmentation for offices
Copenhagen Aarhus
O2
O3
O2
O3
O4
151
151
E20
E20E20
E47
E47
156
201
21
2
1
22
23
20
4
3
8
18
21
1917
21
17
16 19
Frederiksberg
CPH airport
Orestad North
Orestad City
Orestad South
Norrebro
Outer Osterbro
Central Osterbro
Tuborg Harbour
VesterbroKalvebodBrygge
HavnefrontSouth
Nordhavn
CPH City
Vanlose
Bispebjerg
SoborgMorkhoj
UtterslevHusum
Hellerup
Valby
Vigerslev
Brondbyoster
Rodovre
Hvidovre
Avedore
Sundbyvester
Kastrup
Taarnby
GentofteGladsaxe
Amerika Square
Sydhavn
180
O1
O2
505
501
451
501
195
511
46
47
2
2019
18
E45
E45
15
15
26Tilst
Aarhus
Sotoften
Sabro
Lisbjerg
Lystrup
Egaa
Risskov
Olsted
Kasted
Skejby Vejby
Brendstrup
Geding
Kvottrup
Faarup
Skjoldelev
Borum
Yderup
True
LyngbyLabing
Brabrand
GellerupHasle
Marselisborg
Holme
Stavtrup
Aarslev
Aarslev Mark
Ormslev Stationsby
Ormslev Aabo
Lemming
Viby
BeringKolt
Kattrup
Horning Overballe
Jegstrup
Tranbjerg
Slet
Bjostrup
Skaade
Storhoj
HorretOsterby
Hasselager
Aaby
Aabyhoj
170
Location Facility class A Facility class B Facility class C
Prime 5.00 5.50 6.00
Secondary 5.50 6.00 6.75
Tertiary 6.75 7.25 7.75
Location Facility class A Facility class B Facility class C
Prime 245 190 155
Secondary 190 150 130
Tertiary 150 130 110
Yield in % and forecast for the next 3-6 months
Yearly market rent in €/sq m and forecast for the next 3-6 months
Location Facility class A Facility class B Facility class C
Prime 5.25 5.75 6.25
Secondary 6.00 6.50 7.25
Tertiary 6.50 7.00 8.00
Location Facility class A Facility class B Facility class C
Prime 185 145 120
Secondary 150 115 95
Tertiary 115 85 75
1 km1 km
Prime locations Secondary locations Tertiary locations
• Trains • Metro
Source: Vacancy data from Oline ED-Statistikken (Oline ED-statistics). Data as of 1. July 2015.

EDC Research - November 2015 - page 7
MARKET UPDATE EDCR E T A I L - N O V E M B E R 2 0 1 5
Facility class A Facility class B Facility class C Facility class A Facility class B Facility class C
Copenhagen Yield in % Yearly market rent in €/sq m
Prime 4.50 5.00 5.25 2,555 1,885 1,615
Secondary 5.75 6.00 6.50 500 340 270
Tertiary 7.00 7.50 7.75 150 130 110
Aarhus
Prime 5.00 5.25 5.50 740 605 475
Secondary 5.25 5.50 6.00 540 475 340
Tertiary 6.00 6.50 7.00 270 220 165
Aalborg
Prime 5.25 5.75 6.25 540 440 270
Secondary 6.25 6.50 7.00 175 145 95
Tertiary 7.00 7.50 8.00 85 70 60
Triangle area
Prime 5.75 6.00 6.25 405 325 190
Secondary 6.50 6.75 7.00 230 150 125
Tertiary 7.25 7.75 8.25 110 85 70
Odense
Prime 5.25 6.00 6.50 675 515 340
Secondary 6.00 6.75 7.50 405 270 175
Tertiary 8.00 9.00 10.00 110 85 55
Vacancy sq m As % of building stock Change % QoQ Change % YoY Forecast
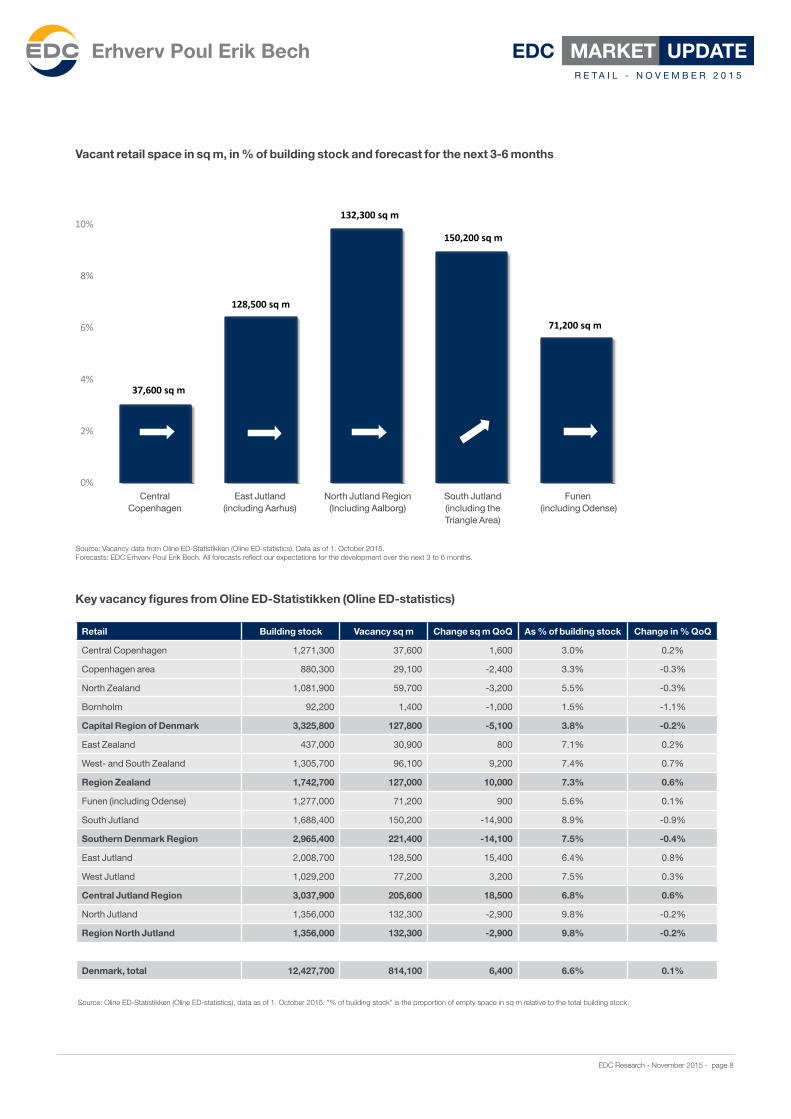
Central Copenhagen 37,600 3.0 0.2 0.4
East Jutland (including Aarhus) 128,500 6.4 0.8 1.1
North Jutland Region (including Aalborg) 132,300 9.8 -0.2 0.8
South Jutland (including the Triangle Area) 150,200 8.9 -0.9 -0.8
Funen (including Odense) 71,200 5.6 0.1 0.5
Yield in %, yearly market rent in €/sq m and forecast for the next 3-6 months
Vacant retail space in sq m, in % of building stock and forecast for the next 3-6 months
Source: Oline ED-Statistikken (Oline ED-statistics), data as of 1. October 2015. Changes quarter on quarter and year on year. Forecasts: All forecasts reflect our expectations for the development over the next 3 to 6 months.
Retail
Source: EDC Erhverv Poul Erik Bech. Data as of 1. October 2015.Forecasts: All forecasts reflect our expectations for the development over the next 3 to 6 months.
EDC Research - November 2015 - page 8
MARKET UPDATE EDC
Retail Building stock Vacancy sq m Change sq m QoQ As % of building stock Change in % QoQ
Central Copenhagen 1,271,300 37,600 1,600 3.0% 0.2%
Copenhagen area 880,300 29,100 -2,400 3.3% -0.3%
North Zealand 1,081,900 59,700 -3,200 5.5% -0.3%
Bornholm 92,200 1,400 -1,000 1.5% -1.1%
Capital Region of Denmark 3,325,800 127,800 -5,100 3.8% -0.2%
East Zealand 437,000 30,900 800 7.1% 0.2%
West- and South Zealand 1,305,700 96,100 9,200 7.4% 0.7%
Region Zealand 1,742,700 127,000 10,000 7.3% 0.6%
Funen (including Odense) 1,277,000 71,200 900 5.6% 0.1%
South Jutland 1,688,400 150,200 -14,900 8.9% -0.9%
Southern Denmark Region 2,965,400 221,400 -14,100 7.5% -0.4%
East Jutland 2,008,700 128,500 15,400 6.4% 0.8%
West Jutland 1,029,200 77,200 3,200 7.5% 0.3%
Central Jutland Region 3,037,900 205,600 18,500 6.8% 0.6%
North Jutland 1,356,000 132,300 -2,900 9.8% -0.2%
Region North Jutland 1,356,000 132,300 -2,900 9.8% -0.2%
Denmark, total 12,427,700 814,100 6,400 6.6% 0.1%
Key vacancy figures from Oline ED-Statistikken (Oline ED-statistics)
Vacant retail space in sq m, in % of building stock and forecast for the next 3-6 months
Source: Oline ED-Statistikken (Oline ED-statistics), data as of 1. October 2015. "% of building stock" is the proportion of empty space in sq m relative to the total building stock.
R E T A I L - N O V E M B E R 2 0 1 5
Central East Jutland North Jutland Region South Jutland Funen Copenhagen (including Aarhus) (Including Aalborg) (including the (including Odense) Triangle Area)
Source: Vacancy data from Oline ED-Statistikken (Oline ED-statistics). Data as of 1. October 2015.Forecasts: EDC Erhverv Poul Erik Bech. All forecasts reflect our expectations for the development over the next 3 to 6 months.
0%
2%
4%
6%
8%
10%
Central Copenhagen East Jutland(Including Aarhus)
Region North Jutland(Including Aalborg)
South Jutland(including theTriangle area)
Funen(including Odense)
37,600 sq m
128,500 sq m
132,300 sq m
150,200 sq m
71,200 sq m
EDC Research - November 2015 - page 9
MARKET UPDATE EDC
Above Average Average Below Average Above Average Average Below Average
Capital Region of Denmark Yield in % Yearly market rent in €/sq m
Primary 6.50 7.00 7.50 150 135 125
Secondary 7.00 8.00 9.00 110 95 85
Region Zealand
Primary 7.00 8.00 9.00 125 110 95
Secondary 8.00 9.00 10.00 95 85 70
Central Jutland Region
Primary 7.00 7.25 7.50 150 135 125
Secondary 7.75 8.00 8.25 110 95 85
Region North Jutland
Primary 7.00 7.50 8.80 150 125 110
Secondary 7.50 8.00 8.50 125 110 95
South Jutland
Primary 7.25 7.50 8.00 150 135 125
Secondary 7.50 7.75 8.50 110 95 85
Tertiary 8.00 8.25 9.50 95 85 70
Funen
Primary 7.50 8.00 8.50 150 125 110
Secondary 8.25 9.00 9.50 125 110 90
Yield in %, yearly market rent in €/sq m and forecast for the next 3-6 months
Box retail
Source: EDC Erhverv Poul Erik Bech. Data as of 1. October 2015.Forecasts: All forecasts reflect our expectations for the development over the next 3 to 6 months.
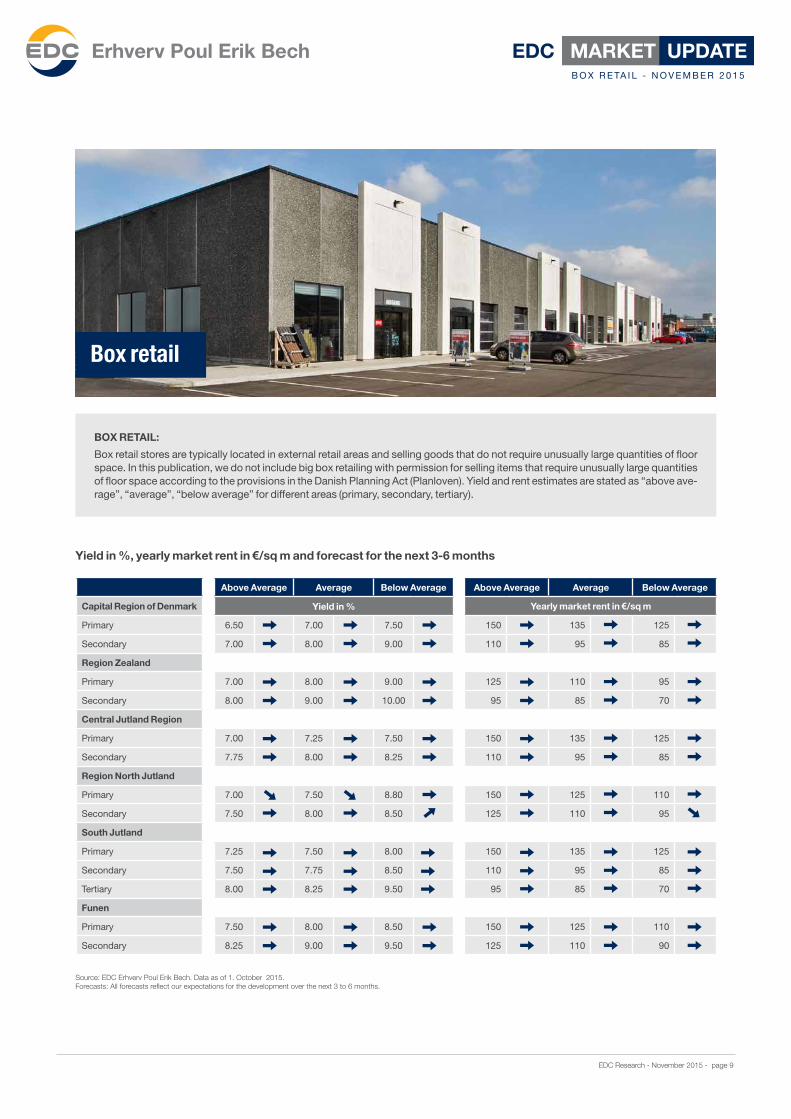
BOX RETAIL:
Box retail stores are typically located in external retail areas and selling goods that do not require unusually large quantities of floor space. In this publication, we do not include big box retailing with permission for selling items that require unusually large quantities of floor space according to the provisions in the Danish Planning Act (Planloven). Yield and rent estimates are stated as “above ave-rage”, “average”, “below average” for different areas (primary, secondary, tertiary).
B O X R E TA I L - N O V E M B E R 2 0 1 5

EDC Research - November 2015 - page 10
MARKET UPDATE EDCI N D U S T R I A L & L O G I S T I C S
N O V E M B E R 2 0 1 5
Facility class A Facility class B Facility class C Facility class A Facility class B Facility class C
Copenhagen Yield in % Yearly market rent in €/sq m
Prime 7.00 7.75 8.25 70 60 50
Secondary 7.50 8.25 8.75 60 55 45
Tertiary 8.00 9.00 9.50 50 45 35
Aarhus
Prime 7.50 8.25 9.00 55 45 35
Secondary 8.00 8.50 9.50 45 40 35
Aalborg
Prime 7.50 8.00 9.00 45 40 35
Secondary 8.75 9.25 10.25 35 35 25
Triangle area
Prime 7.75 8.25 8.50 45 40 35
Secondary 8.00 8.50 9.00 40 35 35
Odense
Prime 8.00 8.50 9.00 50 45 35
Secondary 8.50 9.50 10.50 45 35 25
Vacancy sq m As % of building stock Change % QoQ Change % YoY Forecast
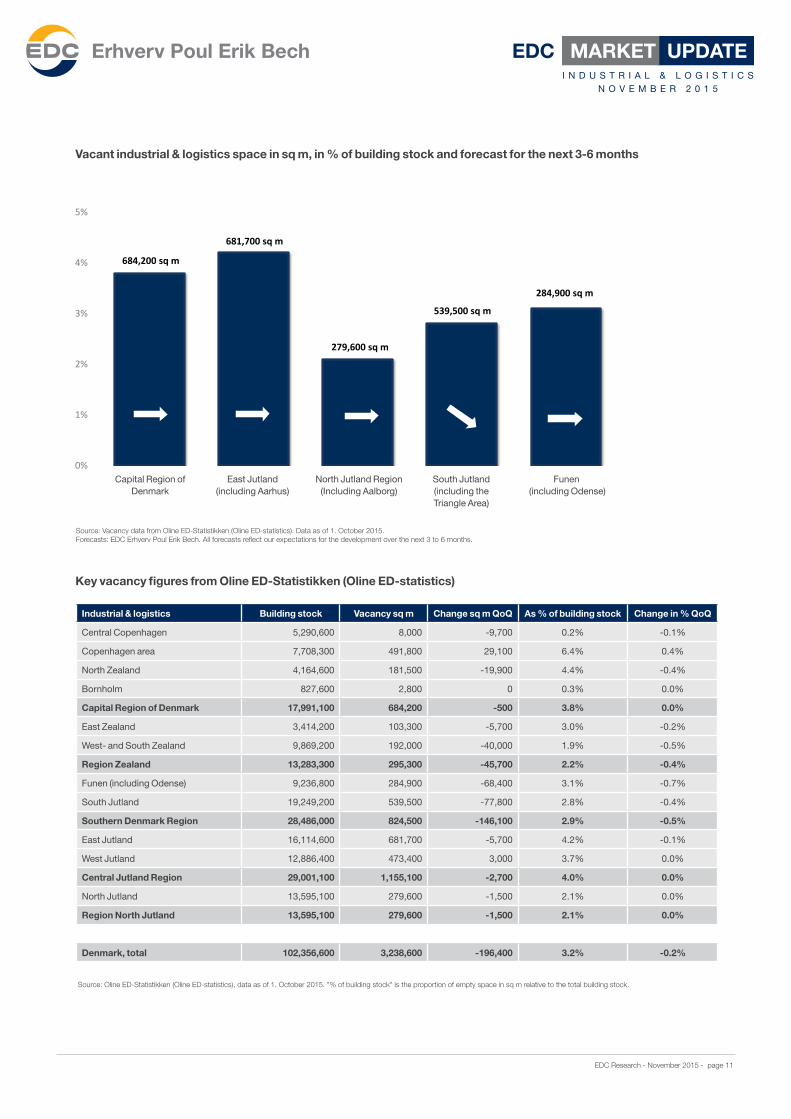
Capital Region of Denmark 684,200 3.8 0.0 -0.2
East Jutland (including Aarhus) 681,700 4.2 -0.1 0.0
North Jutland Region (including Aalborg) 279,600 2.1 0.0 0.1
South Jutland (including the Triangle Area) 539,500 2.8 -0.4 -0.9
Funen (including Odense) 284,900 3.1 -0.7 -0.2
Yield in %, yearly market rent in €/sq m and forecast for the next 3-6 months
Vacant industrial & logistics space in sq m, in % of building stock and forecast for the next 3-6 months
Source: Oline ED-Statistikken (Oline ED-statistics), data as of 1. October 2015. Changes quarter on quarter and year on year. Forecasts: All forecasts reflect our expectations for the development over the next 3 to 6 months.
Industrial & Logistics
Source: EDC Erhverv Poul Erik Bech. Data as of 1. October 2015.Forecasts: All forecasts reflect our expectations for the development over the next 3 to 6 months.
EDC Research - November 2015 - page 11
MARKET UPDATE EDCI N D U S T R I A L & L O G I S T I C S
N O V E M B E R 2 0 1 5
Industrial & logistics Building stock Vacancy sq m Change sq m QoQ As % of building stock Change in % QoQ
Central Copenhagen 5,290,600 8,000 -9,700 0.2% -0.1%
Copenhagen area 7,708,300 491,800 29,100 6.4% 0.4%
North Zealand 4,164,600 181,500 -19,900 4.4% -0.4%
Bornholm 827,600 2,800 0 0.3% 0.0%
Capital Region of Denmark 17,991,100 684,200 -500 3.8% 0.0%
East Zealand 3,414,200 103,300 -5,700 3.0% -0.2%
West- and South Zealand 9,869,200 192,000 -40,000 1.9% -0.5%
Region Zealand 13,283,300 295,300 -45,700 2.2% -0.4%
Funen (including Odense) 9,236,800 284,900 -68,400 3.1% -0.7%
South Jutland 19,249,200 539,500 -77,800 2.8% -0.4%
Southern Denmark Region 28,486,000 824,500 -146,100 2.9% -0.5%
East Jutland 16,114,600 681,700 -5,700 4.2% -0.1%
West Jutland 12,886,400 473,400 3,000 3.7% 0.0%
Central Jutland Region 29,001,100 1,155,100 -2,700 4.0% 0.0%
North Jutland 13,595,100 279,600 -1,500 2.1% 0.0%
Region North Jutland 13,595,100 279,600 -1,500 2.1% 0.0%
Denmark, total 102,356,600 3,238,600 -196,400 3.2% -0.2%
Key vacancy figures from Oline ED-Statistikken (Oline ED-statistics)
Vacant industrial & logistics space in sq m, in % of building stock and forecast for the next 3-6 months
Source: Oline ED-Statistikken (Oline ED-statistics), data as of 1. October 2015. "% of building stock" is the proportion of empty space in sq m relative to the total building stock.
Source: Vacancy data from Oline ED-Statistikken (Oline ED-statistics). Data as of 1. October 2015.Forecasts: EDC Erhverv Poul Erik Bech. All forecasts reflect our expectations for the development over the next 3 to 6 months.
Capital Region of East Jutland North Jutland Region South Jutland Funen Denmark (including Aarhus) (Including Aalborg) (including the (including Odense) Triangle Area)
0%
1%
2%
3%
4%
5%
Capital Region ofDenmark
East Jutland(Including Aarhus)
Region North Jutland(Including Aalborg)
South Jutland(including theTriangle area)
Funen(including Odense)
684,200 sq m
681,700 sq m
279,600 sq m
539,500 sq m
284,900 sq m
EDC Research - November 2015 - page 12
MARKET UPDATE EDCR E S I D E N T I A L R E N TA L P R O P E RT I E S
N O V E M B E R 2 0 1 5
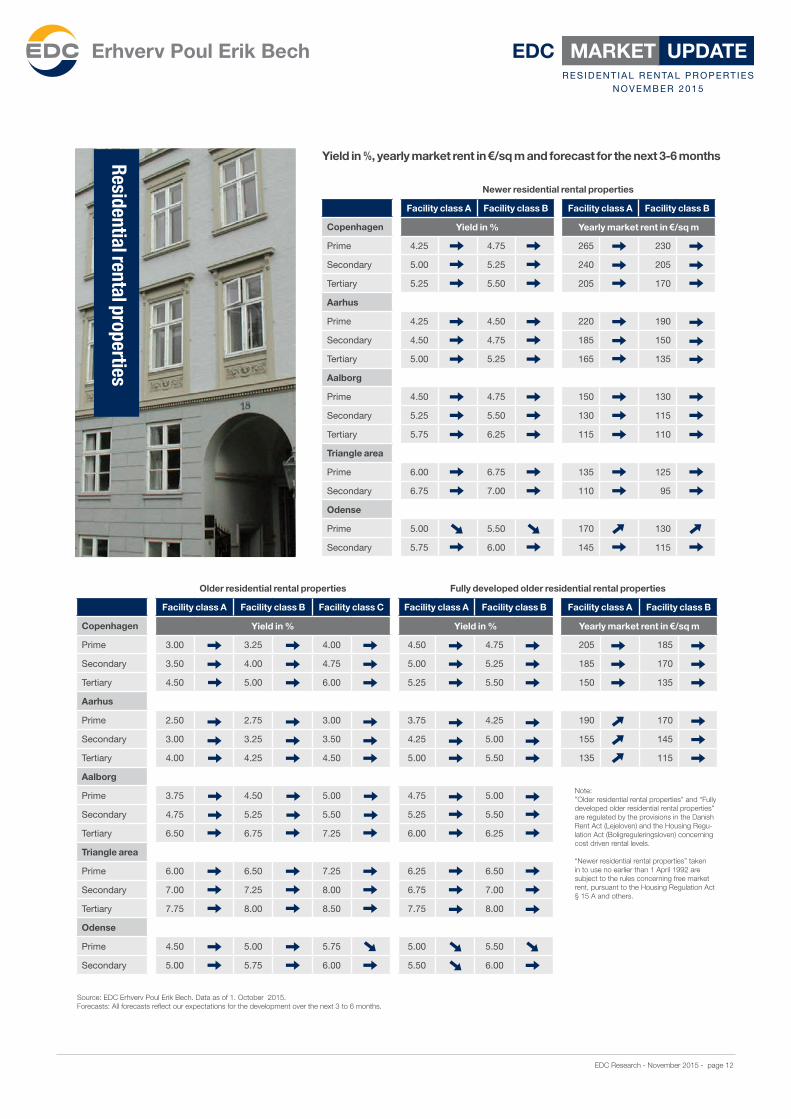
Newer residential rental properties
Facility class A Facility class B Facility class A Facility class B
Copenhagen Yield in % Yearly market rent in €/sq m
Prime 4.25 4.75 265 230
Secondary 5.00 5.25 240 205
Tertiary 5.25 5.50 205 170
Aarhus
Prime 4.25 4.50 220 190
Secondary 4.50 4.75 185 150
Tertiary 5.00 5.25 165 135
Aalborg
Prime 4.50 4.75 150 130
Secondary 5.25 5.50 130 115
Tertiary 5.75 6.25 115 110
Triangle area
Prime 6.00 6.75 135 125
Secondary 6.75 7.00 110 95
Odense
Prime 5.00 5.50 170 130
Secondary 5.75 6.00 145 115
Older residential rental properties Fully developed older residential rental properties
Facility class A Facility class B Facility class C Facility class A Facility class B Facility class A Facility class B
Copenhagen Yield in % Yield in % Yearly market rent in €/sq m
Prime 3.00 3.25 4.00 4.50 4.75 205 185
Secondary 3.50 4.00 4.75 5.00 5.25 185 170
Tertiary 4.50 5.00 6.00 5.25 5.50 150 135
Aarhus
Prime 2.50 2.75 3.00 3.75 4.25 190 170
Secondary 3.00 3.25 3.50 4.25 5.00 155 145
Tertiary 4.00 4.25 4.50 5.00 5.50 135 115
Aalborg
Prime 3.75 4.50 5.00 4.75 5.00
Secondary 4.75 5.25 5.50 5.25 5.50
Tertiary 6.50 6.75 7.25 6.00 6.25
Triangle area
Prime 6.00 6.50 7.25 6.25 6.50
Secondary 7.00 7.25 8.00 6.75 7.00
Tertiary 7.75 8.00 8.50 7.75 8.00
Odense
Prime 4.50 5.00 5.75 5.00 5.50
Secondary 5.00 5.75 6.00 5.50 6.00
Yield in %, yearly market rent in €/sq m and forecast for the next 3-6 months
Note: ”Older residential rental properties” and “Fully developed older residential rental properties” are regulated by the provisions in the Danish Rent Act (Lejeloven) and the Housing Regu-lation Act (Boligreguleringsloven) concerning cost driven rental levels.
“Newer residential rental properties” taken in to use no earlier than 1 April 1992 are subject to the rules concerning free market rent, pursuant to the Housing Regulation Act § 15 A and others.
Residential rental properties
Source: EDC Erhverv Poul Erik Bech. Data as of 1. October 2015. Forecasts: All forecasts reflect our expectations for the development over the next 3 to 6 months.

EDC Research - November 2015 - page 13
MARKET UPDATE EDC
Hard work, ethics and a solid business sense
– were the three pillars on which I founded my company in 1978. These core values are still the same and their legitimacy has been confirmed by good results, solid growth and satisfied clients.
Hard work is part of our culture which is deeply rooted throughout the company. Every day our employees do their utmost to provide our clients with knowledge-based advice and first-class service and our phones are open from 7 a.m. to 9. p.m. - 365 days a year.
Our ethics mean you can have confidence in us; in our dedication and our business ethics, in our way of working together, and in our transparent processes that provide our clients with security and overview.
A solid business sense is your guarantee for a satisfactory and profitable business outcome. Our focus is representing our clients and their interests in the most optimal way possible. The performance of our experienced specialists is continuously assessed with regards to competence, performance and negotiating skills to ensure our clients always have confidence in the quality of our services.
Nationwide commercial real estate company – with local knowledge
Our commitment to our core values has turned EDC Poul Erik Bech in to a nationwide company with a strong presence in Denmark. Our 15 commercial offices ensure that we have in-depth knowledge of the local area and the market as a whole. We continuously work actively and highly focused to have the industry’s most powerful network in order to be up to date with the changing market and our clients’ needs.
We look forward to working with you.
Poul Erik BechChairman
N O V E M B E R 2 0 1 5
International division
Purchases
Letting services
Sale & Lease
BackAdvisory
Property & facilities
management
Developer advisory
Selling of development
projects
Selling
Valuations(RICS)
EDC Property Invest
– a complete solution for commercial property

EDC Research - November 2015 - page 14
MARKET UPDATE EDCN O V E M B E R 2 0 1 5
Why invest in Danish real estate?
• Low transaction costs
• High degree of market transparency and stability
• Low financing rates through Danish mortgage credit institutions
• Solid key economic indicators
• AAA/A-1+ credit rating and stable outlook** S&P as of 27 March 2015.
Low financing rates
• Low origination costs
• Low APR compared to the majority of European markets
• Highly transparent, stable and liquid mortgage bond market
• Flexible loans on conditions close to funding conditions of capital market players
Why invest in Denmark
The Danish mortgage system
Loan
Borrower InvestorMortgage institution
Repayment. interest and
marginRepayment and interest
Bonds
Investment

EDC Research - November 2015 - page 15
MARKET UPDATE EDCN O V E M B E R 2 0 1 5
• Low financing rate: Bond yield plus a small markup (margin) for the mortgage bank
• Debt/value ratio: Financing through the mortgage institutions, normally up to 60% of valuation
• Loan maturity: Min. 1 year (yearly refinancing), max. 20 years
• Payment structure: Floating or fixed rates, with or without quarterly principal repayments
• Each new loan is in principle funded by the issuance of new mortgage bonds of equal size and identical cash flow and maturity characteristics, called the Balance Principle. Proceeds from the sale of the bonds are passed on to the borrower and similarly, interest and principal payments are passed directly to investors holding mortgage bonds
• The Danish mortgage institutions have existed since 1850 and are considered very strong and very low risk financial instruments
• In terms of volume outstanding, Denmark has the second largest share of the mortgage bond market in Europe
• There has never been an incidence of default on a Danish mortgage bond
Low transaction costs
As buyer:
Deed registration: 0.6% of purchase price + € 190
Mortgage: 1.5% of the mortgage’s principal +€ 190
Costs for own advisor, lawyer, agent etc. are typically very low
As seller:
Agent, lawyer etc. varies, but typically between 1 - 4% of purchase price depending on deal size
Denmark is known to have some of the lowest roundtrip property transactions costs
2014 2015 2016
GDP growth (%), YOY
Denmark 1.1 1.8 2.1
EU 1.4 1.8 2.1
Unemployment rate (%)
Denmark 6.6 6.2 5.9
EU 10.2 9.6 9.2
Current account balance (% of GDP)
Denmark 6.2 6.1 6.2
EU 1.6 1.9 1.9
Inflation (%)
Denmark 0.3 0.6 1.7
EU 0.6 0.1 1.5
Source: The Economic forecast (Spring forecast 2015) from the European Commission.
Solid key economic indicatorsHigh degree of transparency
Denmark is among the most transparent markets in Euro-pe and worldwide*. The transparent Danish market provi-des the investor with a secure and low risk environment for foreign direct investment.
Investments in Denmark are conducted in a market which benefits from a highly transparent and stable legal and re-gulatory framework coupled with a simple transaction process.
*In the recent 2014 version of the Jones Lang LaSalle Global Real Estate Transparency Index ®,Denmark was rated a transparent market and ranked no. 16 worldwide, when it comes to market transparency.
Lease structure
• Rent adjustment, normally adjusted yearly with the rate of inflation or a fixed minimum rate
• Rent review every fourth year. Terms are flexible
• It is possible to agree on a threshold for the rent. Eg. the rent cannot drop further than the rent in force at the start of the tenancy
• The landlord and the tenant can freely agree on the rent amount as long as the rent is not unreasonable or contrary to sound business practices
• Lease length: There are no statutory restrictions on the duration of a commercial lease agreement. It is normal to have interminable leases in place
• The leading real estate agency in Denmark in the areas of selling, leasing, valuation and advisory
• Founded in 1978, operating nationwide across 15 commercial real estate branches, more than 45 residential real estate branches, and finally 3 residential real estate branches in France and Sweden.
• Owner of the property management company LEA Ejendomspartner
• More than 450 employees
Our greatest strength is our nationwide presence and local knowledge with 70 commercial specialists servicing our clients. We are chartered surveyors, valuers and certified members of RICS. We espe-cially deal with the following types of properties:
• Investment properties, properties for rent and owner-user properties
• Offices, high street retail, industrial & logistics and mixed-use properties
• Residential rental properties
• Land and development projects
• Hotels, restaurants and other properties in the leisure sector
We offer our clients a wide range of services:
• Execution of investment transactions of single assets. portfolios and on a company level
• Letting services
• Valuations (RICS)
• Sale and Lease Back
• Due diligence
• Project development consultancy
• Property and facilities management
• Capital structure advisory
• Tenant and landlord representation
• EDC Location Search
• EDC PropertySWAP®
• Research services
• Bespoke consultancy and market study services
CHARTERED SURVEYORS & INTERNATIONAL PROPERTY CONSULTANTS
Copenhagen Herlev Hillerod Roskilde +45 33 30 10 00 • [email protected] +45 44 57 03 37 • [email protected] +45 48 26 99 10 • [email protected] +45 46 33 33 33 • [email protected]
Koge Naestved Odense Kolding +45 55 35 55 53 • [email protected] +45 55 78 66 03 • [email protected] +45 58 58 82 00 • [email protected] +45 76 33 80 10 • [email protected]
Aabenraa Sonderborg Esbjerg Vejle +45 73 33 13 00 • [email protected] +45 58 58 80 20 • [email protected] +45 76 10 48 00 • [email protected] +45 75 83 13 11 • [email protected]
Holstebro Aarhus Aalborg +45 58 58 77 10 • [email protected] +45 87 30 99 30 • [email protected] +45 96 31 49 00 • [email protected]
Read more: edc.dk/erhverv
Office locations:


![[May2012] edc](https://static.fdocuments.net/doc/165x107/55cf881955034664618d5a8b/may2012-edc.jpg)