Ecuador - iuj.ac.jp
57
COUNTRY PROFILE Ecuador Our quarterly Country Report on Ecuador analyses current trends. This annual Country Profile provides background political and economic information. 1998-99 The Economist Intelligence Unit 15 Regent Street, London SW1Y 4LR United Kingdom
Transcript of Ecuador - iuj.ac.jp

COUNTRY PROFILE
EcuadorOur quarterly Country Report on Ecuador analyses currenttrends. This annual Country Profile provides backgroundpolitical and economic information.
1998-99The Economist Intelligence Unit15 Regent Street, London SW1Y 4LRUnited Kingdom

The Economist Intelligence Unit
The Economist Intelligence Unit is a specialist publisher serving companies establishing and managingoperations across national borders. For over 50 years it has been a source of information on businessdevelopments, economic and political trends, government regulations and corporate practice worldwide.
The EIU delivers its information in four ways: through subscription products ranging from newslettersto annual reference works; through specific research reports, whether for general release or for particularclients; through electronic publishing; and by organising conferences and roundtables. The firm is amember of The Economist Group.
London New York Hong KongThe Economist Intelligence Unit The Economist Intelligence Unit The Economist Intelligence Unit15 Regent Street The Economist Building 25/F, Dah Sing Financial CentreLondon 111 West 57th Street 108 Gloucester RoadSW1Y 4LR New York Wanchai United Kingdom NY 10019, US Hong KongTel: (44.171) 830 1000 Tel: (1.212) 554 0600 Tel: (852) 2802 7288Fax: (44.171) 499 9767 Fax: (1.212) 586 1181/2 Fax: (852) 2802 7638E-mail: [email protected] E-mail: [email protected] E-mail: [email protected]
Website: http://www.eiu.com
Electronic deliveryEIU ElectronicNew York: Lou Celi or Lisa Hennessey Tel: (1.212) 554 0600 Fax: (1.212) 586 0248London: Jeremy Eagle Tel: (44.171) 830 1183 Fax: (44.171) 830 1023
This publication is available on the following electronic and other media:
Online databases Microfilm
FT Profile (UK) NewsEdge Corporation (US) World Microfilms Publications (UK)Tel: (44.171) 825 8000 Tel: (1.781) 229 3000 Tel: (44.171) 266 2202
DIALOG (US) University Microfilms Inc (US)Tel: (1.415) 254 7000 CD-ROM Tel: (1.800) 521 0600
LEXIS-NEXIS (US) The Dialog Corporation (US)Tel: (1.800) 227 4908 SilverPlatter (US)
M.A.I.D/Profound (UK)Tel: (44.171) 930 6900
Copyright© 1998 The Economist Intelligence Unit Limited. All rights reserved. Neither this publication nor any part of it may be reproduced, stored in a retrieval system, or transmitted in any form or by anymeans, electronic, mechanical, photocopying, recording or otherwise, without the prior permission of The Economist Intelligence Unit Limited.
All information in this report is verified to the best of the author’s and the publisher’s ability. However,the EIU does not accept responsibility for any loss arising from reliance on it.
Symbols for tables“n/a” means not available; “–” means not applicable
Printed and distributed by Redhouse Press Ltd, Unit 151, Dartford Trade Park, Dartford, Kent DA1 1QB, UK
ISSN 0269-7971


Comparative economic indicators, 1997
0 100 200 300 400
Brazil
Mexico
Argentina
Colombia
Venezuela
Chile
Peru
Ecuador
Uruguay
Paraguay
Bolivia
Gross domestic product$ bn
Sources: EIU estimates; national sources.
798.8798.8798.8798.8798.8798.8798.8798.8
0 2,000 4,000 6,000 8,000 10,000
Argentina
Uruguay
Chile
Brazil
Mexico
Venezuela
Peru
Colombia
Paraguay
Ecuador
Bolivia
Gross domestic product per head$
Sources: EIU estimates; national sources.
0 2 4 6 8 10
Argentina
Peru
Chile
Mexico
Venezuela
Uruguay
Bolivia
Ecuador
Brazil
Colombia
Paraguay
Gross domestic product% change, year on year
Sources: EIU estimates; national sources.
0 10 20 30 40 50 60
Venezuela
Ecuador
Mexico
Uruguay
Colombia
Peru
Paraguay
Brazil
Chile
Bolivia
Argentina
Consumer prices% change, year on year
Sources: EIU estimates; national sources.
EIU Country Profile 1998-99 © The Economist Intelligence Unit Limited 1998

November 13th 1998 Contents
3 Basic data
4 Political background4 Historical background8 Constitution and institutions
10 Political forces11 International relations and defence
12 The economy12 Economic structure13 Economic policy16 Economic performance19 Regional trends
19 Resources19 Population20 Education21 Health22 Natural resources and the environment
23 Economic infrastructure23 Transport and communications24 Energy provision26 Financial services27 Tourism
28 Production28 Industry29 Mining30 Agriculture31 Construction
32 The external sector32 Merchandise trade35 Invisibles and the current account35 Capital flows and foreign debt36 Foreign reserves and the exchange rate
38 Appendices38 Sources of information39 Reference tables39 Government finances39 Money supply40 Interest rates40 Gross domestic product41 Gross domestic product by expenditure42 Gross domestic product by sector
1
© The Economist Intelligence Unit Limited 1998 EIU Country Profile 1998-99
42 Manufacturing gross domestic product43 Prices43 Earnings43 Population43 Labour force44 Transport statistics44 National energy statistics45 Banking statistics45 Stockmarket indicators46 Tourism46 Foreign direct investment in manufacturing46 Gold production46 Agricultural production47 Livestock numbers47 Fishing exports47 Construction statistics48 Exports48 Imports49 Key exports and imports49 Main trading partners50 Balance of payments, IMF estimates51 Balance of payments, national estimates51 Net foreign investment by sector51 Net foreign investment by source country52 External debt, World Bank estimates53 External debt, national estimates53 Exchange rates
2
EIU Country Profile 1998-99 © The Economist Intelligence Unit Limited 1998
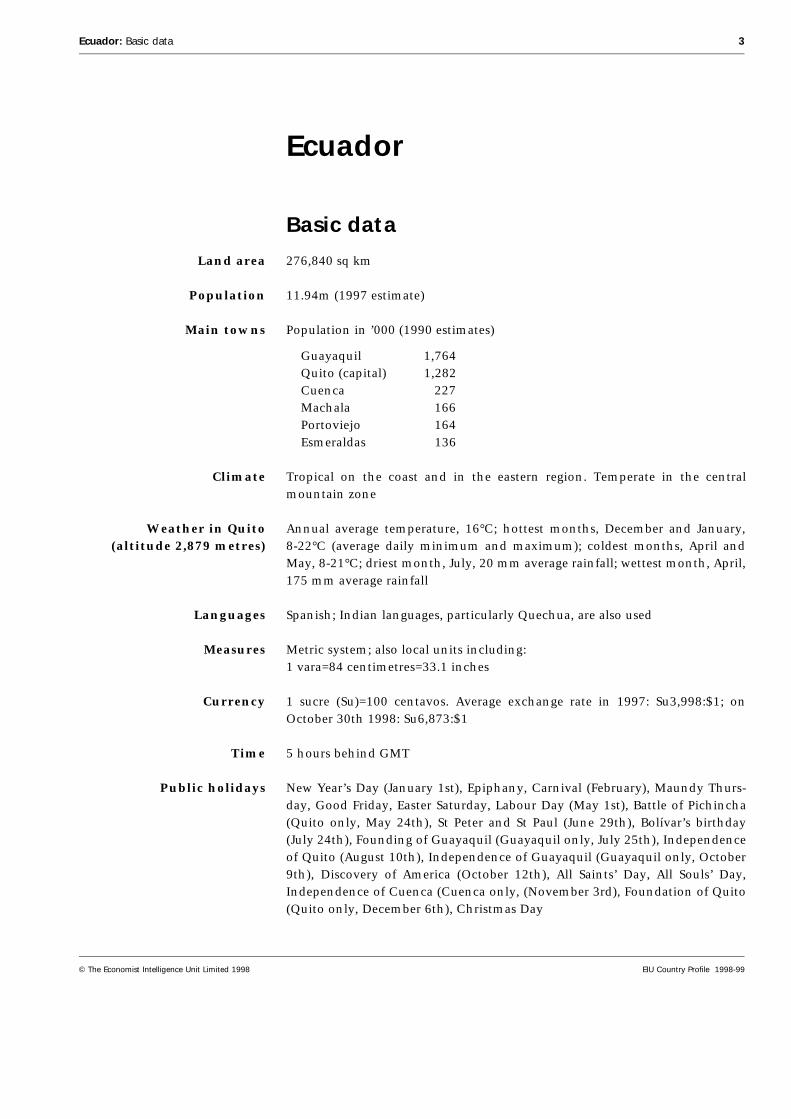
Ecuador
Basic data
Land area 276,840 sq km
Population 11.94m (1997 estimate)
Main towns Population in ’000 (1990 estimates)
Guayaquil 1,764Quito (capital) 1,282Cuenca 227Machala 166Portoviejo 164Esmeraldas 136
Climate Tropical on the coast and in the eastern region. Temperate in the centralmountain zone
Weather in Quito(altitude 2,879 metres)
Annual average temperature, 16°C; hottest months, December and January,8-22°C (average daily minimum and maximum); coldest months, April andMay, 8-21°C; driest month, July, 20 mm average rainfall; wettest month, April,175 mm average rainfall
Languages Spanish; Indian languages, particularly Quechua, are also used
Measures Metric system; also local units including:1 vara=84 centimetres=33.1 inches
Currency 1 sucre (Su)=100 centavos. Average exchange rate in 1997: Su3,998:$1; onOctober 30th 1998: Su6,873:$1
Time 5 hours behind GMT
Public holidays New Year’s Day (January 1st), Epiphany, Carnival (February), Maundy Thurs-day, Good Friday, Easter Saturday, Labour Day (May 1st), Battle of Pichincha(Quito only, May 24th), St Peter and St Paul (June 29th), Bolívar’s birthday(July 24th), Founding of Guayaquil (Guayaquil only, July 25th), Independenceof Quito (August 10th), Independence of Guayaquil (Guayaquil only, October9th), Discovery of America (October 12th), All Saints’ Day, All Souls’ Day,Independence of Cuenca (Cuenca only, (November 3rd), Foundation of Quito(Quito only, December 6th), Christmas Day
Ecuador: Basic data 3
© The Economist Intelligence Unit Limited 1998 EIU Country Profile 1998-99

Political background
Jamil Mahuad assumed the presidency on August 10th 1998 after defeating hismain opponent in a second-round election. His party, the centrist DemocraciaPopular (DP), is the largest in the country’s unicameral Congress, but does nothave an overall majority. Mr Mahuad will hold office until August 2002.
Historical background
Independence— Prior to the arrival of the Spanish in 1531, the territory which is now Ecuadorwas dominated by regional trading confederacies. For 80 years it was the north-ern outpost of the Inca empire, which introduced the Quechua language. Thecountry gained independence from Spain in 1822 and temporarily joined Vene-zuela, Colombia and Panama in Simón Bolívar’s Grancolombian Federation. In1830 it left to become an independent nation.
—leads to politicalinstability
The period after independence was characterised by government instabilityand economic and political rivalry between the coastal and highland regions.Political power was concentrated in the hands of a highland landowning classallied with the Catholic Church, yet growth of the banking sector and rapidexpansion in cocoa production created a wealthy coastal banking and agricul-tural middle class seeking greater political power. State power remained decen-tralised at a regional level until Gabriel García Moreno came to power in 1860and attempted to centralise public administration and tax collection. Externalshocks, in the shape of a collapse in the cocoa market in the 1920s and theGreat Depression of the 1930s, were at the root of severe instability from 1931to 1948. Of 21 governments, none survived to complete a term in office. JoséMaría Velasco Ibarra was a particularly important figure in the period. A popu-list who was first elected in 1933, he was to hold office a total of five times (thelast time in 1968), and was overthrown four times. From 1948 to 1960, how-ever, Ecuador enjoyed 12 years of stable civilian rule. Increasing banana ex-ports helped to finance development policies, and also stimulated theemergence of growers as a powerful economic group.
Modernisation and themilitary
A move towards industrial development took place in the 1960s. The influenceof the Cuban revolution coincided with growing social unrest, leading themilitary government of 1963-66 to take a strongly anti-communist stance.Great emphasis was placed upon economic modernisation, and the role of thestate in the economy was expanded. Another military dictatorship from 1972began the exploitation of extensive oil reserves under state control. The in-come from oil exports was used for modernisation, but also led to high levelsof indebtedness to foreign banks. In 1978 a referendum approved a new con-stitution which was to form the basis for a return to civilian rule and demo-cratic elections in 1979.
Democratic governmentsface economic crisis—
Jaime Roldós of the populist Concentración de Fuerzas Populares (CFP) led thenew government. Mr Roldós was killed in a plane crash in 1981, giving him thestatus of political martyr even though his reformist intentions had been under-
4 Ecuador: Historical background
EIU Country Profile 1998-99 © The Economist Intelligence Unit Limited 1998

mined by conflict within his government. Mr Roldós was succeeded by hismore moderate vice-president, Osvaldo Hurtado of Democracia Popular (DP).Mr Hurtado was able to provide more organised government but faced eco-nomic difficulties. Falling oil prices meant that the government was unable tomeet rising current spending commitments. An increasing debt burden con-tributed to a debt crisis in 1982 and the subsequent need for fiscal austerityprovoked social and labour protest.
—and initiate structuralreforms
A shift to the right followed in 1984 with the government of the centre-rightFrente de Reconstrucción Nacional, led by León Febres Cordero of the PartidoSocial Cristiano (PSC). Often authoritarian and corrupt in its methods, withsome notorious cases of human rights abuses, the administration moved awayfrom the state intervention of the military regimes of the 1970s, liberalising andopening the economy. Although the government was unpopular, an attemptedmilitary coup in March 1986 proved unsuccessful. A left-wing alliance won amajority in the mid-term congressional election of 1986, amid worsening rel-ations between Congress and the executive. The situation deteriorated furtherwhen oil prices collapsed and oil exports were suspended for six months after anearthquake damaged the cross-country oil pipeline in March 1987.
Although the left regained the presidency in the 1988 elections, under RodrigoBorja of Izquierda Democrática (ID), the administration implemented tightfiscal and monetary policies which weakened growth. The government’s popu-larity suffered because of shortages of basic commodities, high inflation andrising unemployment. Once again, a mid-term election resulted in the loss ofthe regime’s congressional majority and relations between the executive andthe legislature deteriorated further. At the same time there was an upsurge insocial unrest. Indigenous groups began to have a greater impact on the politicalscene, seeking land titles and recognition of Ecuador as a plurinational state.Disillusionment was reflected in the 1992 elections, where both presidentialfinalists were from the centre right.
Political stalemate underMr Durán Ballén—
The priorities of the new government of Sixto Durán Ballén were to reduceinflation, curb the public-sector deficit, modernise the state sector and normal-ise relations with foreign creditors. It faced several political problems, however.The government was unable to create a consensus in favour of its reformsamong key interest groups. Trade unions were unhappy about the govern-ment’s privatisation plans, which implied huge redundancies and publicspending cuts. This led to strikes and demonstrations, which disrupted publicservices. The government also lacked a majority in Congress, which led to theblocking of legislation on key issues such as privatisation, and the frequentimpeachment of government ministers. Government weakness and internaldivisions worsened when the vice-president, Alberto Dahik, an important fig-ure in the administration, fled to Costa Rica in October 1995 to avoid arrest oncorruption charges. This further discredited a government already widely un-popular because of its reform plans and the impact of austerity measures.
—and chaos underMr Bucaram
Abdalá Bucaram of the populist Partido Roldosista Ecuatoriano (PRE) managedto tap popular feeling to win the second round of the presidential election inJuly 1996. Although painfully crude, his platform of poverty reduction and the
Ecuador: Historical background 5
© The Economist Intelligence Unit Limited 1998 EIU Country Profile 1998-99

elimination of economic and political oligarchies from power led to victory in20 out of 21 provinces, with his strongest vote in both rural and urban mar-ginal areas. Mr Bucaram beat the PSC candidate, Jaime Nebot, who promisedpolicy continuity with the outgoing government. But with only 19 seats inCongress out of 82, the PRE was forced into a broad centre-left coalition whichincluded members of three of the four largest parties in Congress.
However, it was not long before Mr Bucaram’s flamboyant, heavy-handed, andunrefined style of government began to antagonise both coalition membersand his supporters in the electorate. His inability to present a coherent eco-nomic package added to growing political uncertainty. In February 1997 anationwide general strike took place in protest against Mr Bucaram’s cronyism,authoritarian tendencies, and contradictory economic policies. Protesters inQuito forced Mr Bucaram to barricade himself in the presidential palace underheavy military protection. Almost immediately, Congress voted by 44 votes to34 to dismiss Mr Bucaram from office on the grounds of mental incapacity.Although the constitutional basis for taking this step was unclear, the militarywithdrew its support for the Bucaram administration, forcing the president toflee the country. After a brief power struggle between Congress and the vice-president, Rosalía Arteaga, the legislature appointed its leader, Fabián Alarcón,to serve as interim president until August 1998.
Constitutional reformbegins under Mr Alarcón
Although Mr Alarcón had long been regarded as a skilful politician, the circum-stances under which his appointment was made did not provide him with astrong mandate for effective government at the outset of his term. To remedythis situation, Mr Alarcón held a referendum in May 1997 asking the electorateto support his appointment as interim president. Although this gamble paidoff, it soon became obvious that the interim president was both unable andunwilling to provide focused government. Instead of using his brief term topush through important economic measures which past incumbents hadfound too politically difficult to implement, Mr Alarcón used his tenure tostrengthen his personal support base and that of his small party, the populistFrente Radical Alfarista (FRA), with a view to regaining the presidency for a fullterm in 2002 (the constitution barred him from seeking the presidency in the1998 elections). This preoccupation made Mr Alarcón reluctant to address thecountry’s serious fiscal imbalance. In fact he worsened it by making substantialconcessions to powerful public-sector unions and regional lobbies. Towards theend of his term Mr Alarcón became embroiled in accusations that he andmembers of his administration had misappropriated state funds while inpower. These allegations are still being investigated.
The highlight of Mr Alarcón’s term in office was undoubtedly constitutionalreform. This reform was the direct result of the popular approval of variousproposals which were also put to the vote in the May 1997 referendum, andwas carried out by a popularly elected National Assembly between December1997 and April 1998. Although the deliberations of the National Assemblywere marred by inter-party squabbles and consequently failed to achieve asmuch as its supporters had hoped (particularly the reform of the social securitysystem), some important constitutional changes were approved (see box).
6 Ecuador: Historical background
EIU Country Profile 1998-99 © The Economist Intelligence Unit Limited 1998

Mr Mahuad assumes thepresidency promising
reforms
Ecuadorean political life returned to some degree of normality with the elec-tion to the presidency of the reform-minded Jamil Mahuad of the centristDemocracia Popular (DP). Mr Mahuad, who had two consecutive terms as apopular mayor of Quito, took office on August 10th 1998 after narrowly beat-ing the PRE’s populist candidate, Álvaro Noboa. Mr Mahuad gained 51% of thevote in a second-round run-off. Despite this narrow margin, the election ofMr Mahuad—who campaigned on a moderate platform emphasising free-market policies and reform coupled with a social element—gives three reasonsto believe that Ecuador is entering a period of greater political stability whichwill make long-awaited economic reform possible. First, Mr Mahuad is an expe-rienced public administrator who appears reform-minded. Second, the constit-utional reforms approved shortly before his accession to office should improvethe country’s governability by strengthening the presidency, especially in itsrelations with Congress, and open up the way for substantial structural reform.Third, in October 1998 Mr Mahuad signed a permanent peace agreement withPeru over the long-running border dispute, bringing to a close a peace processwhich began after the brief war between the two countries in 1995.
But before Mr Mahuad can contemplate reactivating growth he must stabilisethe economy, primarily by rectifying the fiscal imbalance. This will dependgreatly on the goodwill of Congress, where the DP is the largest party but doesnot enjoy a working majority. As always, relations with Congress will deter-mine the success of the president’s term in office. In particular, Mr Mahuad will
Key points of the 1998 constitutional reform
Political
• The abolition of mid-term congressional elections.
• The abolition of the legislature’s ability to impeach cabinet ministers.
• The institutionalisation of the corruption commission set up temporarily in1997 to investigate allegations of corruption made against Abdalá Bucaram.
• The expansion of Congress from 82 to 121 members. The expansion of thechamber will increase the number of deputies from densely populated areas,redressing imbalances which led to the disproportionately higher representationfrom marginal and sparsely populated provinces.
Economic
• Repeal of the state’s monopoly in the so-called strategic sectors of theeconomy, opening the way for greater private-sector participation in oil,electricity and telecommunications.
• The abolition of the Monetary Board, granting the Central Bank full autonomyover monetary policy.
• The budget will now require the approval of the whole Congress rather than ofa select committee. Once the budget has been approved, Congress will beunable to introduce extra expenditure items without specifying their source offunding.
Ecuador: Historical background 7
© The Economist Intelligence Unit Limited 1998 EIU Country Profile 1998-99
have to woo the PSC, which is the second largest party in Congress and has itsstronghold in the Pacific lowlands. The PSC, which was left without a pres-idential candidate in the 1998 elections after Jaime Nebot turned down theparty nomination, is the DP’s obvious ideological ally. Collaboration with thePSC would allow Mr Mahuad to compensate voters in the coastal region(Mr Mahuad is from the highlands) for shunning Mr Noboa (who is a bananamagnate from Guayaquil) in the 1998 elections.
Constitution and institutions
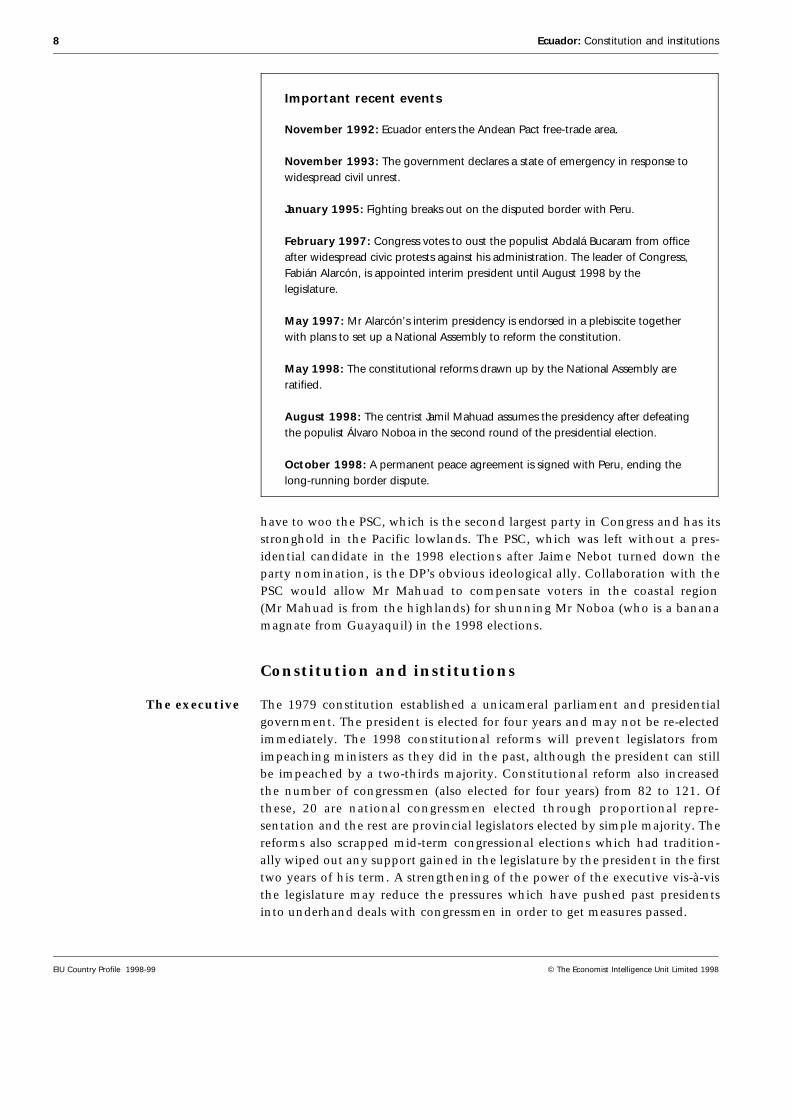
The executive The 1979 constitution established a unicameral parliament and presidentialgovernment. The president is elected for four years and may not be re-electedimmediately. The 1998 constitutional reforms will prevent legislators fromimpeaching ministers as they did in the past, although the president can stillbe impeached by a two-thirds majority. Constitutional reform also increasedthe number of congressmen (also elected for four years) from 82 to 121. Ofthese, 20 are national congressmen elected through proportional repre-sentation and the rest are provincial legislators elected by simple majority. Thereforms also scrapped mid-term congressional elections which had tradition-ally wiped out any support gained in the legislature by the president in the firsttwo years of his term. A strengthening of the power of the executive vis-à-visthe legislature may reduce the pressures which have pushed past presidentsinto underhand deals with congressmen in order to get measures passed.
Important recent events
November 1992: Ecuador enters the Andean Pact free-trade area.
November 1993: The government declares a state of emergency in response towidespread civil unrest.
January 1995: Fighting breaks out on the disputed border with Peru.
February 1997: Congress votes to oust the populist Abdalá Bucaram from officeafter widespread civic protests against his administration. The leader of Congress,Fabián Alarcón, is appointed interim president until August 1998 by thelegislature.
May 1997: Mr Alarcón’s interim presidency is endorsed in a plebiscite togetherwith plans to set up a National Assembly to reform the constitution.
May 1998: The constitutional reforms drawn up by the National Assembly areratified.
August 1998: The centrist Jamil Mahuad assumes the presidency after defeatingthe populist Álvaro Noboa in the second round of the presidential election.
October 1998: A permanent peace agreement is signed with Peru, ending thelong-running border dispute.
8 Ecuador: Constitution and institutions
EIU Country Profile 1998-99 © The Economist Intelligence Unit Limited 1998

Congress The congressional year begins on August 10th, when coalitions are establishedand a congressional chairman is elected. The latter has considerable power overlegislation as he can convoke extraordinary congressional sessions and deter-mine the agenda for discussion. He is a key negotiator between the executiveand the legislature. The formal parliamentary session is short, lasting only toearly October. However, extraordinary sessions are then called to continuecongressional business. Legislative commissions continue to sit even whenCongress is in recess.
Despite the fact that Ecuadorean voters tend to back the traditional parties, aproliferation of small parties forming shifting coalitions has contributed to thefragmentation of Congress in recent years. The 1998 constitutional reformsseek to reverse this by striking from the party register any political party thatfails to win less than 5% of the national vote in two consecutive elections.Independents have been allowed to run for Congress and other official posi-tions since 1996.
A new Supreme Court Judicial and regulatory bodies in Ecuador have traditionally been highly poli-ticised. Congress appoints officials to the Electoral Supreme Tribunal and Tri-bunal of Constitutional Guarantees, as well as the superintendents of banksand companies, the state attorney-general, procurator-general and comptroller-general. Until recently, Congress was also responsible for appointing judges tothe Supreme Court for fixed terms. This practice changed in July 1997, how-ever, when Congress voted to dismiss the 31 members of the Supreme Court,including its president. This unprecedented move followed the popular sup-port voiced in the May 1997 referendum for the modernisation of the judiciary.In removing the judges, Congress argued that the Supreme Court had becometoo politicised. In early October 1997 a new Supreme Court was appointed. Thejudges, who will serve for life, were selected by Congress from a shortlist pre-sented by a commission, which in turn received nominations from 12 electoralcolleges representing different civic groups as well as individuals. The extent ofdepoliticisation will only become clear once the new court begins taking dec-isions. Of particular significance will be the court rulings with respect to cor-ruption charges brought against the former president, Mr Alarcón (although heremains exiled in Panama, Mr Bucaram has already been found guilty for themisappropriation of funds by the new court). Mr Alarcón is currently underinvestigation over allegations that he approved the appointment of over 1,000pipones (individuals on the state’s payroll but doing little or no work) as con-gressional advisers during his time as leader of the legislature. As before, theSupreme Court is responsible for appointing the judges of provincial superiorcourts.
Political forces
A diverse party system Ecuador’s largest political parties in terms of congressional representation arethe centrist Democracia Popular (DP), the right-of-centre Partido Social Cris-tiano (PSC), the populist Partido Roldosista Ecuatoriano (PRE) and the left-of-centre Izquierda Democrática (ID). All have held power at some time since thetransition to democracy in 1979. The PSC was founded in the 1950s by a group
Ecuador: Political forces 9
© The Economist Intelligence Unit Limited 1998 EIU Country Profile 1998-99

of upper-middle-class Roman Catholics in Quito, but soon established a strongnational party organisation under Camilo Ponce, especially on the coast. TheDP developed in the 1970s out of the Partido Demócrata Cristiano, founded byuniversity students and Christian trade unionists in the 1960s. Although it hasclear left-wing roots, the party has evolved to espouse free-market policieswhile emphasising a concern for social issues. It derives its greatest supportfrom the highland middle classes. The populist PRE was founded in memory ofMr Roldós. It is strongest on the coast and in marginal urban and rural areas,but was discredited by Mr Bucaram’s brief tenure. The ID, founded in 1970,combined an offshoot of the Liberal Party and independent socialists. It has amoderate reformist wing and a more radical element. The MovimientoPachacutik is an umbrella group of indigenous organisations, social move-ments and trade unions which was formed in 1996 and achieved immediateelectoral success that year. Although it continues to be the main formal polit-ical vehicle for indigenous groups, organised in the Confederación de Nacion-alidades Indígenas del Ecuador (Conaie), its support diminished somewhat inthe 1998 elections.
Congressional election results(no. of seats)
1994 1996 1998
Partido Conservador 7 2 2
Partido Social Cristiano 26 24 26
Partido Roldosista Ecuatoriano 11 19 23
Izquierda Democrática 7 4 16
Democracia Popular 6 6 33
Movimiento Pachacutik-Nuevo País n/a 7 6
Movimiento Popular Democrático 8 3 2
Frente Radical Alfarista 4 4 4
Independents n/a 12 8
Other 1 1 1
Total 82 82 121Sources: Local press; Análisis Semanal.
The military Since leaving power in 1978, the Ecuadorean military has continued to play animportant political role. It exerts pressure behind the scenes, especially at timesof political instability. This was evident in February 1997 when the militaryplayed a key role in negotiating the agreement which brought a swift end tothe constitutional crisis after Mr Bucaram’s ousting. The silent threat of directintervention acts to some extent as a brake on civilian politicians. The armedforces occupy a type of moral high ground from which military leaders, such asa former general, Paco Moncayo, have criticised the corruption and ineffi-ciency of civilian political institutions. This contrasts with the relative effi-ciency and lack of corruption of the military, as proven in the economicsuccess of their extensive commercial interests. Their reputation was enhancedby their success on the battlefield against Peru in 1995. Deep respect for themilitary among the Ecuadorean population is also due to a role in providingeducation, infrastructure and health facilities in many marginal rural commu-nities, especially in the Amazon region. The military faces a period of adjust-ment now that a permanent peace agreement with Peru has been signed.
10 Ecuador: Political forces
EIU Country Profile 1998-99 © The Economist Intelligence Unit Limited 1998

International relations and defence
The conflict with Peru A border conflict with Peru, which lasted for more than five decades and led towar in 1941 and brief clashes as recently as 1995, finally came to an end whenMr Mahuad signed a permanent peace agreement with the Peruvian president,Alberto Fujimori, in October 1998. This agreement was the result of a five-stagepeace process agreed in the Itamaraty Declaration in February 1995. Observersfrom the four guarantor countries of the 1942 Rio Protocol (the US, Brazil, Chileand Argentina), the border treaty signed by Peru and Ecuador after the 1941 war,monitored demilitarisation of the conflict zone, which was in dense Amazonjungle. Tensions rose at various points, and when the two sides were unable toagree on a common border, Mr Mahuad and Mr Fujimori agreed to accept theruling of the guarantor countries.
The final agreement defines a permanent border, and awards Ecuador unlimited(not sovereign) perpetual navigation rights on the Amazon River. It will alsoallow the two countries to lower defence expenditure, which has risen consider-ably over the last decade. (Between 1985 and 1994 there was a 57% real increasein defence spending in Ecuador, while the armed forces increased in sizeby 35%.)
Internationalorganisations
Ecuador is a member of many international organisations, including the UN,the World Trade Organisation (WTO), the Organisation of American States
Main political figures
Jamil Mahuad: Prior to his election, Mr Mahuad was mayorof Quito, where he established a reputation as an able publicadministrator, a consensus-oriented politician and a skilfulnegotiator. Nonetheless, all of his skills will be stretched as heattempts to restore order to the public finances, restructure aweak economy, reduce the size of the state, restore investorconfidence and combat corruption. Mr Mahuad hasappointed able technocrats to his economic cabinet, and willbenefit from the permanent peace agreement with Peru.
Juan José Pons: The new leader of Congress is a close allyof the president. A polished consensus-builder and asuccessful businessman, Mr Pons will be critical to theadministration’s efforts to consolidate a working majority inCongress. Mr Pons has so far focused on forging a deal withthe Partido Social Cristiano (PSC), to which significantpolitical concessions may have to be made in order to securecontinued co-operation.
Jaime Nebot: A lawyer from Guayaquil and head of thePSC. Mr Nebot came second in his second attempt to winthe presidency in 1996, and disappointed his party byrefusing to run in 1998. As the leader of the powerful PSCbloc in Congress, Mr Nebot will wield considerable influence
in the party’s negotiations with the government. He has areputation for being single-minded and stubborn, and isregarded as having little patience for consensus building.
León Febres Cordero: Although aged, ill, and somewhatovershadowed by his protégé, Mr Nebot, the formerpresident is the current mayor of Guayaquil, Ecuador’s largestand richest city, where he enjoys overwhelming support.Mr Febres Cordero continues to wield considerable politicalclout and is still in a position to exert decisive influence overhis party, the PSC, and over many national-level politicalissues.
Paco Moncayo: The retired former chairman of the jointchiefs-of-staff was elected to Congress in May 1998 as anIzquierda Democrática (ID) legislator, quickly becoming theID’s leader in the legislature. As army chief, Mr Moncayoplayed a crucial role in the 1995 war against Peru. He is astaunch nationalist and moderate leftist. He and his party areopposed to most free-market reforms and neo-liberalpolicies. But Mr Moncayo has presidential ambitions, and thismay push him to adopt a more centrist stance on many keyissues. Mr Moncayo may become the informal leader of theleftist opposition.
Ecuador: International relations and defence 11
© The Economist Intelligence Unit Limited 1998 EIU Country Profile 1998-99

(OAS), the Inter-American Development Bank (IDB), the IMF, the InternationalBank for Reconstruction and Development (IBRD) and affiliates, the Inter-national Finance Corporation, the International Development Association(IDA), the World Health Organisation (WHO) and the Rio Group. Other inter-national bodies of which Ecuador is a member include the International SugarOrganisation (ISO), the International Cocoa Organisation (ICCO) and theLatin American Economic System (SELA). It is also a member of the AsociaciónLatinoamericana de Integración (ALADI), the Andean Community and theNon-Aligned Movement. Ecuador was a member of OPEC until November1992, when it downgraded its participation to observer status. Ecuador left theInternational Coffee Organisation (ICO) in October 1998 after the body votedto make increasing export cuts to counter falling world coffee prices.
The economy
Economic structure
Main economic indicators, 1997
Real GDP growth (%) 3.4
Consumer price inflation (av; %) 30.7
Current-account balance ($ m) –743
Total external debt ($ bn) 15.5
Exchange rate (av; Su:$) 3,998
Population (m) 11.9Sources: Banco Central del Ecuador, Información Estadística Mensual; EIU.
Comparative economic indicators, 1997
Ecuador Colombia Peru US
GDP ($ bn) 19.8 96.4 65.1 8,111
GDP per head ($) 1,656 2,293 2,674 30,263
Consumer price inflation (year-end; %) 30.5 18.4 6.5 2.4
Current-account balance ($ bn) –0.7 –5.5 –3.4 –166.8
Merchandise exports fob ($ bn) 5.3 11.7 6.8 680.3
Merchandise imports fob ($ bn) 4.7 14.4 8.6 877.3
Total merchandise foreign trade (% of GDP) 59.7 35.9 29.4 19.2Sources: IMF, International Financial Statistics; EIU.
The agricultural, forestry and fishing sector is the most important in Ecuador’seconomy, having contributed an average of 17.5% of GDP over the last tenyears. The principal agricultural crops for export—bananas, coffee and cocoa—are grown on the coastal plain, with the banana industry centred in the south-western province of El Oro. The coast is also the basis for the fishing industry,with prawn farms concentrated around the Gulf of Guayaquil. Since seriouscommercial exploitation began in 1972, the oil sector has become extremelyimportant and is the area to which most longer-term foreign investment isattracted. The contribution of the oil and mining sector to GDP has grown
12 Ecuador: Economic structure
EIU Country Profile 1998-99 © The Economist Intelligence Unit Limited 1998
steadily during the 1990s from 11.7% in 1990 to 14% in 1997, although thecollapse of world oil prices in 1998 is likely to reverse this trend. Most oilexploration and production activity is found in the east of the country, in therain forests of the Amazon basin. Principal refining facilities are located atEsmeraldas on the northern coast and at La Libertad in the south.
Manufacturing industry is located mainly around Ecuador’s two largest cities,Guayaquil and Quito. Trade liberalisation has stripped away the protectionpreviously enjoyed by industry which has been facing difficult trading condi-tions owing to high interest rates and scarce credit. Its contribution to GDPdropped from 18.1% in 1987 to 15.5% in 1990 and has since stood at around15.4%. Trade and tourism have represented an average of 15% of GDP over thelast ten years. The international tourism industry focuses on the GalapagosIslands, with the mainland a secondary attraction. The coast is the focus forlocal tourism but facilities for international visitors are as yet underdeveloped(see Reference table 6).
Economic policy
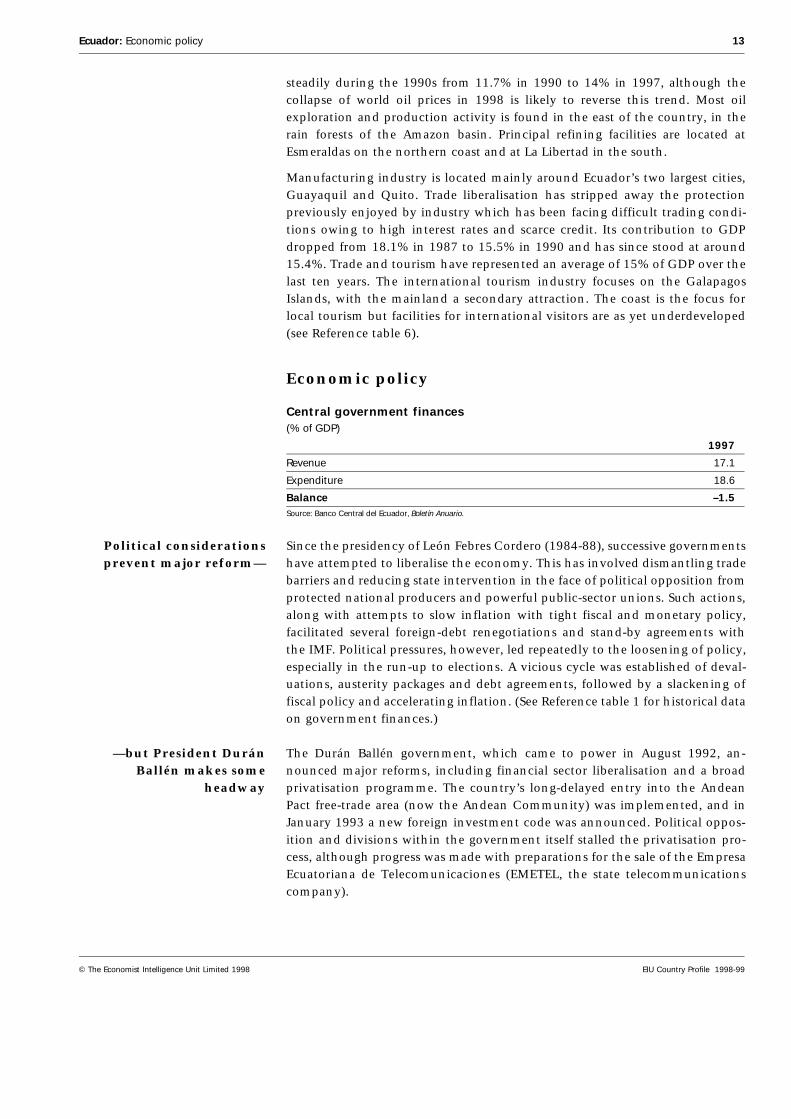
Central government finances(% of GDP)
1997
Revenue 17.1
Expenditure 18.6
Balance –1.5Source: Banco Central del Ecuador, Boletín Anuario.
Political considerationsprevent major reform—
Since the presidency of León Febres Cordero (1984-88), successive governmentshave attempted to liberalise the economy. This has involved dismantling tradebarriers and reducing state intervention in the face of political opposition fromprotected national producers and powerful public-sector unions. Such actions,along with attempts to slow inflation with tight fiscal and monetary policy,facilitated several foreign-debt renegotiations and stand-by agreements withthe IMF. Political pressures, however, led repeatedly to the loosening of policy,especially in the run-up to elections. A vicious cycle was established of deval-uations, austerity packages and debt agreements, followed by a slackening offiscal policy and accelerating inflation. (See Reference table 1 for historical dataon government finances.)
—but President DuránBallén makes some
headway
The Durán Ballén government, which came to power in August 1992, an-nounced major reforms, including financial sector liberalisation and a broadprivatisation programme. The country’s long-delayed entry into the AndeanPact free-trade area (now the Andean Community) was implemented, and inJanuary 1993 a new foreign investment code was announced. Political oppos-ition and divisions within the government itself stalled the privatisation pro-cess, although progress was made with preparations for the sale of the EmpresaEcuatoriana de Telecomunicaciones (EMETEL, the state telecommunicationscompany).
Ecuador: Economic policy 13
© The Economist Intelligence Unit Limited 1998 EIU Country Profile 1998-99

A precarious adjustmentstrategy
A key aim of the government’s economic policy was to slow down inflation bymeans of a nominal exchange-rate anchor and fiscal austerity. Growth in themoney supply, however, initially accelerated as financial liberalisation andshort-term capital inflows created aggressive competition for lending. This inturn led to inflationary pressures and a credit boom. However, towards the endof 1994 political crisis and the conflict with Peru reduced short-term capitalinflows. The Banco Central del Ecuador (the Central Bank) responded by rais-ing interest rates, causing a severe tightening of liquidity. Public spending wascut further and emergency war taxes imposed, and two minor devaluationstook place. Thus, large-scale capital flight was stemmed and a major deval-uation of the sucre averted, but the measures also caused recession and uncer-tainty surrounding the sustainability of the system of exchange-rate bands.Credit restrictions severely affected production and investment, while publicspending cuts and structural reforms harmed poorer sectors. In 1996 thegovernment was forced to bail out several banks hit by reduced liquidity and ahigh ratio of bad debts (see Reference tables 2, 3, 14 and 33).
Structural problemspersist
Several underlying problems remain, including: a weak financial sector; a de-pendence on short-term capital inflows to finance the current-account deficit;an overdependence on oil export receipts for fiscal revenue (oil-related revenueamounted to 34.6% of total central government revenue in 1997); tax evasion;and, finally, wage-indexation which obstructs progress on price stabilisation.Although trade liberalisation has stimulated the growth of non-traditional ex-ports, Ecuador remains overdependent on oil and bananas, which togetherrepresented 52% of exports in 1997. The other principal exports are agriculturalprimary products, exposing the economy to the external shocks of price anddemand movements in international markets (see Reference table 23 for his-torical data on exports). Finally, Ecuador’s low domestic savings rate has leftthe country dependent on external finance. As it has not developed the polit-ical or economic stability necessary to attract medium- and longer-term capitalinflows, it has had to rely on short-term speculative capital to finance itscurrent-account deficit.
Mr Alarcón missesopportunities owing to
political expediency
Repeated delays in the presentation of his promised economic plan meant thatAbdalá Bucaram implemented little in terms of economic policy during his sixmonths as president. His tentative plans to introduce a currency board put himin direct conflict with those who had elected him on a clearly populist plat-form, and it was the preparatory increases in utility tariffs that triggered theprotests that ultimately led to the president’s ousting.
Mr Bucaram’s drastic plans were scrapped by Fabián Alarcón as soon as heassumed office as interim president. Despite promises to lay the foundations fora recovery in production by stabilising the macroeconomic environment, itsoon became apparent that political expediency would keep Mr Alarcón frommaking progress on this front. A sound stance by the Central Bank did permitthe stabilisation of key macroeconomic variables (the devaluation rate of theexchange-rate band was increased in order to minimise the real appreciation ofthe currency in the face of rising inflation, and the introduction of daily foreign-exchange auctions curtailed currency volatility, leading to lower interest rates).But the government’s failure to tackle the fiscal deficit ensured this was
14 Ecuador: Economic policy
EIU Country Profile 1998-99 © The Economist Intelligence Unit Limited 1998

shortlived. Soon after partially reversing the utility tariff increases introduced byMr Bucaram, a set of emergency measures—import tariff surcharges and a$400m cut in public expenditure—were announced by the Alarcón governmentto curb the deterioration of public finances. These, however, were more thanoffset by Mr Alarcón’s willingness to give in to the demands made in late 1997for higher public-sector wages in the hope that this would strengthen his sup-port base. This, together with the collapse in world oil prices in late 1997 andearly 1998, put increasing pressure on public finances, fuelling inflation andultimately leading to a moderate devaluation of the sucre in March 1998. Thedegree of perceived policy uncertainty and regulatory inadequacy was behindthe government’s failure to sell a 35% stake of EMETEL on two separate occa-sions, the first in November 1997 and the second in April 1998.
Mr Mahuad promiseswide-ranging reforms
Jamil Mahuad has assumed the presidency at a time of deep economic crisis,and he has spared no effort in highlighting this to explain the need for far-reaching reform. Soon after he took office, the government eliminated utilitysubsidies on electricity and domestic gas, replacing these with “poverty cou-pons” to compensate the poorest families. Although this is a key step towardsrestoring balance to public finances (and one which his predecessors repeatedlyshied away from), the government must still address the problems posed byinefficient tax collection (income tax receipts are estimated at 1% of GDP),which lead to an overreliance on oil export receipts and a heavy debt-servicingburden. As regards tax collection, the government is considering a number ofproposals, including reducing value-added tax (VAT) exemptions and replacingincome tax with a flat tax on financial transactions.
Important economic policy initiatives of recent years
1992: Ecuador leaves OPEC in November, gaining completefreedom to produce and export oil.
1994: A stand-by agreement is signed with the IMF in May,running until end-1995. All targets are met.
1994: The Financial Institutions Law deregulates the financialsector, leading to a proliferation of institutions and intensecompetition for deposits. Interest rates are pushed up andaggressive marketing of credit leads to accelerating growth inmoney supply.
1994: A crawling-peg exchange-rate system from Decemberhas a Su50 band either side of the central parity rate.
1995: A Brady Plan debt-restructuring agreement iscompleted in February, re-establishing Ecuador’s sovereigncreditworthiness and opening the door to fresh credit. InAugust Congress approves the sale of 35% of the statetelecommunications institute to private operators and 10%to the workforce. Proceeds go to a Solidarity Fund for socialspending.
1995: Faced with a liquidity crisis in the financial sector, theCentral Bank provides emergency 60-day credits to 29institutions in December. Capital requirements are raised tostrengthen the sector and encourage mergers, a moratoriumis imposed on new institutions and limits placed onforeign-currency holdings.
1996: Ecuador joins the World Trade Organisation in Januaryand removes all remaining non-tariff barriers, while amaximum tariff 10 percentage points above the Andean Pactcommon external tariff is allowed.
1997: A daily auction system for foreign-exchange tradingbetween the Central Bank and commercial banks isintroduced in March in order to reduce exchange-rate andinterest-rate volatility.
1998: State subsidies on electricity and domestic gas areabolished in September.
Ecuador: Economic policy 15
© The Economist Intelligence Unit Limited 1998 EIU Country Profile 1998-99
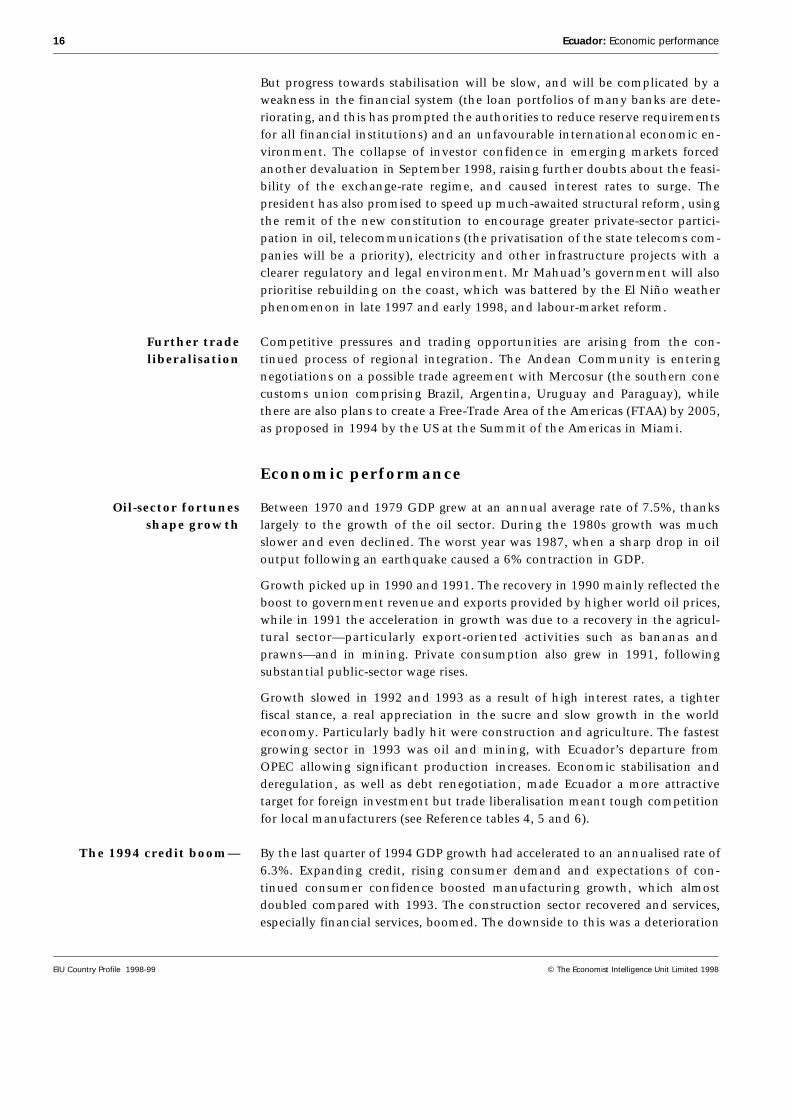
But progress towards stabilisation will be slow, and will be complicated by aweakness in the financial system (the loan portfolios of many banks are dete-riorating, and this has prompted the authorities to reduce reserve requirementsfor all financial institutions) and an unfavourable international economic en-vironment. The collapse of investor confidence in emerging markets forcedanother devaluation in September 1998, raising further doubts about the feasi-bility of the exchange-rate regime, and caused interest rates to surge. Thepresident has also promised to speed up much-awaited structural reform, usingthe remit of the new constitution to encourage greater private-sector partici-pation in oil, telecommunications (the privatisation of the state telecoms com-panies will be a priority), electricity and other infrastructure projects with aclearer regulatory and legal environment. Mr Mahuad’s government will alsoprioritise rebuilding on the coast, which was battered by the El Niño weatherphenomenon in late 1997 and early 1998, and labour-market reform.
Further tradeliberalisation
Competitive pressures and trading opportunities are arising from the con-tinued process of regional integration. The Andean Community is enteringnegotiations on a possible trade agreement with Mercosur (the southern conecustoms union comprising Brazil, Argentina, Uruguay and Paraguay), whilethere are also plans to create a Free-Trade Area of the Americas (FTAA) by 2005,as proposed in 1994 by the US at the Summit of the Americas in Miami.
Economic performance
Oil-sector fortunesshape growth
Between 1970 and 1979 GDP grew at an annual average rate of 7.5%, thankslargely to the growth of the oil sector. During the 1980s growth was muchslower and even declined. The worst year was 1987, when a sharp drop in oiloutput following an earthquake caused a 6% contraction in GDP.
Growth picked up in 1990 and 1991. The recovery in 1990 mainly reflected theboost to government revenue and exports provided by higher world oil prices,while in 1991 the acceleration in growth was due to a recovery in the agricul-tural sector—particularly export-oriented activities such as bananas andprawns—and in mining. Private consumption also grew in 1991, followingsubstantial public-sector wage rises.
Growth slowed in 1992 and 1993 as a result of high interest rates, a tighterfiscal stance, a real appreciation in the sucre and slow growth in the worldeconomy. Particularly badly hit were construction and agriculture. The fastestgrowing sector in 1993 was oil and mining, with Ecuador’s departure fromOPEC allowing significant production increases. Economic stabilisation andderegulation, as well as debt renegotiation, made Ecuador a more attractivetarget for foreign investment but trade liberalisation meant tough competitionfor local manufacturers (see Reference tables 4, 5 and 6).
The 1994 credit boom— By the last quarter of 1994 GDP growth had accelerated to an annualised rate of6.3%. Expanding credit, rising consumer demand and expectations of con-tinued consumer confidence boosted manufacturing growth, which almostdoubled compared with 1993. The construction sector recovered and services,especially financial services, boomed. The downside to this was a deterioration
16 Ecuador: Economic performance
EIU Country Profile 1998-99 © The Economist Intelligence Unit Limited 1998

in the current-account balance, as an overvalued exchange rate sucked incheap imports.
—leads to bust in 1995 A series of external shocks, internal energy supply difficulties and increasedpolitical instability brought an abrupt end to this nascent boom in 1995.The sectors which had grown fastest in 1994 were among the worst affected—financial services and construction. The costs of the conflict with Peru strainedthe public-sector budget, and armaments imports contributed to a widening ofthe current-account deficit. Electricity rationing due to drought at the principalhydroelectric plant disrupted production and imposed alternative generationcosts. Political uncertainty increased following the flight of the vice-president,Alberto Dahik, and interest rates were raised to prevent capital leaving thecountry. Producers and the financial sector struggled against lower liquidity,rising interest rates and bad debts. The export sector was unable to compensatefully for these difficulties, with major products such as bananas, oil, coffee andprawns facing poor international trading conditions or domestic productionproblems.
The difficulties faced by producers and the financial sector continued into 1996with high interest rates, low liquidity and investor uncertainty as to the out-come of elections and the future of economic policy. Even after Mr Bucaramhad taken office, uncertainty continued to be fuelled by repeated delays in theannouncement of an economic package and, subsequently, by doubts over theviability of the planned currency board. As a result of this uncertainty, con-sumption and investment stagnated, prompting a fall in borrowing and adownward trend in interest rates. The problems facing production were com-pounded once again by power shortages towards the end of the year. Lowdomestic demand caused a sharp contraction in import levels, swinging thecurrent account into surplus for the first time in ten years. The contraction inimports meant that GDP was able to expand by 2% in that year despitethe problems.
Real growth in gross domestic product(% change)
Annual average1997 1993-97
Private consumption 2.4 2.4
Public consumption –0.3 –0.1
Gross fixed investment 4.0 3.3
Change in stocks –1.7 –0.1
Exports 4.3 5.2
Imports 8.8 3.9
GDP 3.4 2.8Source: Banco Central del Ecuador, Información Estadística Mensual.
The following year was another lost year for Ecuador. Although Mr Alarcón wassuccessful in restoring some degree of calm following the ousting of his prede-cessor in February 1997, consumption remained stagnant and investment dis-played only a modest improvement. The lack of demand for credit createdexcess liquidity in the banking system, making it increasingly difficult forcommercial banks to invest assets profitably at a time when interest rates had
Ecuador: Economic performance 17
© The Economist Intelligence Unit Limited 1998 EIU Country Profile 1998-99

already turned negative in real terms. On the supply side, oil production begana slow decline owing to a transport bottleneck, and towards the end of the yearmanufacturing was hit once again by electricity shortages, despite prior assur-ances by the government that the problem had been resolved. Agricultureperformed well throughout most of the year, with strong output rises partic-ularly visible in bananas and prawns. However, excess rainfall and floodingcaused by the arrival of the El Niño climatic pattern in late 1997 devastated keyexport crops on the coast, destroyed infrastructure and left thousands homelessuntil the early months of 1998. Despite ongoing political uncertainty in 1997,a moderate rate of recovery in domestic demand revived import growth andallowed the economy to expand by 3.4%, returning the current-account bal-ance to its customary deficit.
Fiscal imbalance drivesinflation—
Since the early 1980s inflation has been fuelled by large public-sector deficits,currency devaluations, production problems in the agricultural sector and thegradual reduction of fuel and utilities subsidies. The Durán Ballén governmentsucceeded in lowering the annual average rate from 54.6% in 1992 to 22.9% in1995, through a combination of fiscal austerity and a nominal exchange-rateanchor (see Reference table 8). However, price pressures were stirred once againin early 1997 by the rises in utility prices, causing year-end inflation to reach30.5%. Mr Alarcón’s refusal to exercise fiscal rectitude fuelled price pressuresfurther in early 1998. Currency weakness and President Mahuad’s abolitionof state subsidies on utilities put inflation at just under 44% in the year toOctober 1998.
—affecting real wages— The official monthly minimum wage and associated benefits are revised inter-mittently by a committee consisting of representatives of the government,unions and employers—usually twice a year. In the second half of the 1980sand early 1990s nominal increases failed to keep pace with inflation. The realaverage wage index (1990=100) fell from 162.2 in January 1986 to a low of 65.1in mid-1992. Although it rose to 130.8 in August 1997 as inflation eased, itplummeted back to 113.5 in September as price pressures gained once more(see Reference table 9).
—making poverty aproblem
The country’s failure to embark on a sustainable growth path has caused em-ployment to fall, forcing a growing proportion of the economically active pop-ulation into the informal sector (for historical data on the labour force, seeReference table 11). This trend has been made more acute because of barriers tolabour market entry placed by powerful trade unions—particularly in the exten-sive public-sector workforce—and a pro-labour legal framework. Rural-urbanmigration has increased the supply of unskilled labour in urban areas. Privatestudies indicate that the share in income of the poorest 20% of the urbanpopulation dropped from 2.55% to 1.68% between 1988 and 1993. The share ofthe richest 5% increased from 33% to 41%. In 1994, 25% of the urban popul-ation and 47% of the rural were considered poor, while 10% of the urbanpopulation and 22% of the rural were living in conditions of extreme poverty.
18 Ecuador: Economic performance
EIU Country Profile 1998-99 © The Economist Intelligence Unit Limited 1998

Inflation and wages
Annual average1997 1993-97
Consumer prices (% change) 30.7 30.0
Real minimum wage index (Jan 1990=100) 126.1 102.3Source: Banco Central del Ecuador, Información Estadística Mensual.
Regional trends
A move to devolution Opinion has been tilting in recent years towards the devolution of greaterfinancial and administrative control to the provinces. A constitutional reformto this effect was defeated in the November 1995 referendum only because themajority of the population used the referendum to express rejection of thegovernment, although the measure itself had majority support. There are alsogrowing pressures for central government allocation of funds to be distributedmore evenly on the basis of the size and needs of the local population. Cur-rently, distribution is determined by political pressures at the centre and byhistorical distribution.
Resources
Population
Ecuador’s population was 10.3m at the 1990 census, and is expected to reach12.6m by 2000. It grew by an average rate of 2.5% per year between 1982 (theprevious census) and 1990, and by an estimated 2.3% per year in the 1990s (seeReference table 10). The infant mortality rate fell from 60.4 per 1,000 childrenborn alive in 1982 to 52.7 in 1990, while the birth rate rose from 2.5% of thepopulation to 3.2%, and the death rate from 0.6% to 0.8% of the population.
Urbanisation Between 1982 and 1990 the urban population increased from 49.2% to 55.4%of the total population, and is forecast to reach 64% by 2000. The three prin-cipal cities, Quito, Guayaquil and Cuenca, accounted for a roughly constant30% of total population between 1982 and 1993, with the relative increase inthe urban population due to migration towards major secondary cities such asLoja, Santo Domingo and Machala—a trend expected to continue. The coastremains slightly more densely populated than the highlands.
Population indicators, Nov 1990 census(%)
By age0-14 38.815-24 20.325-59 34.560+ 6.4
continued
Ecuador: Regional trends 19
© The Economist Intelligence Unit Limited 1998 EIU Country Profile 1998-99

By regionHighlands 45.6Coast 49.7Amazon 3.9Galapagos & others 0.8Sources: Instituto Nacional de Estadística y Censos (INEC); Banco Central del Ecuador, Boletín Anuario.
A growing workforce The age trend of the 1980s is forecast to continue in the 1990s. The proportionof the population under 15 years of age is projected to fall from 38.8% in 1990to 33.8% by 2000. The proportion of those between 15 and 64 rose from 54.1%to 56.9% between 1982 and 1990. This trend implies less demand for educationbut an increase in those seeking employment.
Access to basic services, 1994(% of income category, unless otherwise indicated)
Poor Non-poor
Years spent in education by head of household 4.0 7.5
Informal health treatment 29.4 18.0
Sewage systems 29.6 63.8
Electricity 75.8 91.1
Drinking water 34.8 59.3Source: Gestión.
Race Indigenous people account for an estimated 43% of the population. The mes-tizo population includes descendants of foreign immigrants who have inter-married with indigenous people. These immigrants have included Spanishcolonialists and other European settlers; Arabs, especially Lebanese, who ar-rived at the beginning of this century and form an economically and politicallypowerful community, particularly on the coast; Chinese; and other LatinAmericans, especially from neighbouring Colombia. Two areas of northernEcuador, around the port of Esmeraldas and in the Chota valley near theColombian border, have a mainly black population, descendants of slaves ofAfrican origin.
Education
Universal education isunderfunded
Since the 1970s successive Ecuadorean governments have sought to reduceilliteracy and increase the output of trained professionals through the provi-sion of free education. Since the early 1980s, however, state resources availablefor education have been squeezed. Although the constitution requires 30% ofthe budget to be spent on education, parents have increasingly been requiredto contribute towards fees, materials and uniforms. The number of institutions,teachers and pupils has continued to rise at the expense of educational quality.Only a small proportion of the population can afford private education, whichis concentrated in urban areas at secondary and university levels.
According to the latest census in 1990, 10.2% of the population aged ten andover were illiterate (compared with 14.8% in 1982) and 87% of children aged6-11 years were in education although there are high rates of absenteeism,repetition and irregular attendance, especially in rural and the poorest urban
20 Ecuador: Education
EIU Country Profile 1998-99 © The Economist Intelligence Unit Limited 1998

areas. Poor health and nutrition, and a lack of transport, materials and teacherscompound these problems, which are further aggravated by uncreative, trad-itional teacher-training methods. Teachers are also underpaid and strikes causerepeated disruption.
Secondary education Only the first three years of secondary school are compulsory, but even theseprovide many with inadequate preparation for work. The subsequent threeyears are intended to prepare pupils for further study or provide technicaltraining. Most students graduate in science, social science or business studies.In technical colleges pupils favour business administration over industrial andagricultural studies. Although the proportion of children aged 12 to 14 years insecondary education totalled 63.9% in 1990, the value of this education islimited by a shortage of institutions, inadequate teacher training, the pupils’wide range of academic backgrounds and an excess of theoretical material overtechnical fieldwork.
Higher education The tertiary education sector has also seen a rapid rise in the number of institu-tions, pupils and teachers since the 1970s. The proportion of the populationover 24 years with higher education rose from 6.8% in 1982 to 12.7% in 1990.A policy of free entry to state universities combined with budget cuts, however,has inevitably led to a decline in quality. Most university courses are directedtowards training professionals for the services sector and bureaucracy ratherthan for industry.
Health
Treatment rather thanprevention
Financial constraints mean that public healthcare has tended to concentrateon treatment rather than prevention, although vaccination programmes sincethe 1970s have considerably reduced the incidence of illnesses such as measles,polio, diphtheria, tetanus and whooping cough. The diseases which most affectthe Ecuadorean population are those related to inadequate nutrition and poorsanitation and housing, especially in marginal urban and rural areas. Between1987 and 1990 the principal causes of death were intestinal infections andrespiratory diseases. There has been a resurgence of diseases such as cholera,dengue fever, malaria and rabies in recent years. Urbanisation and the shift ofemployment towards more sedentary, office-based activities have also led to anincrease in the diseases more prevalent in developed countries, such as heartdisease and stress-related illnesses.
Spending cuts Healthcare has been one of the public-service areas affected by governmentdrives to cut fiscal spending since the early 1980s. According to the WorldBank, Ecuador had one of the lowest levels of expenditure on health in LatinAmerica in 1990, at 3.7% of GDP (compared with 10% in Argentina). Com-pounding this is the fact that limited funds are not targeted effectively. TheMinistry of Health allocates funds on the basis of historical spending levels andpolitical pressures rather than population or need. Most of the budget is spenton salaries, yet services are frequently disrupted by strikes over low wages andpoor working conditions, leading to shortages of equipment and medicines.Public-health benefits are provided by the Instituto Ecuatoriano de Seguridad
Ecuador: Health 21
© The Economist Intelligence Unit Limited 1998 EIU Country Profile 1998-99

Social (IESS, the social security department). However, only 17% of the popul-ation—mostly employees—are affiliated. Private health-insurance schemeshave marketed their services aggressively in recent years.
Natural resources and the environment
Ecuador is situated on the Pacific coast of South America, and influences on itsclimate include the Andean mountain range and the warm El Niño and coldHumboldt currents. Its total area of 276,840 sq km includes the Galapagosarchipelago, 1,552 km off the coast. Owing to the country’s location on theequator, there are no extreme variations in climate during the year and thereare approximately 12 hours of daylight all year round. There are essentiallythree regions—the western coastal plain, the central highland corridor of vol-canoes and the eastern rainforest in the Amazon basin.
Biodiversity On the coast the rainy season lasts from January to May and the rest of the yearis dry. In the highlands the rainy season is from October to June. Rainfall isheavier throughout the year in the Amazon region. Around 78% of the countryhas a tropical or subtropical climate, 20% is temperate and there are 23 differ-ent microclimates, resulting in a high level of biodiversity. The alluvial soils ofthe coast and the Oriente are the most fertile and can be used to cultivate awide range of crops.
Agricultural resources Around 8.29m ha of land have potential for agricultural use, of which 74% liesin tropical and subtropical zones. Large oil and gas reserves are located in theOriente, although there is also gas in the Gulf of Guayaquil. Water is animportant potential source of hydroelectric energy.
Fishing resources Inland rivers and lakes, as well as the coastline, provide a wide variety of fishand sea products. Fresh-water prawn production for export has expanded rap-idly in recent years, especially in the Gulf of Guayaquil, and in Esmeraldas andManabí provinces.
Environmental conditions
Principal problems: Oil spillages; urban fumes and lack of waste-disposalfacilities; destruction of coastal mangrove swamps for prawn farming;deforestation and soil erosion; indiscriminate use of pesticides; mercurycontamination in unauthorised mining areas; and overfishing.
Legal framework: 1976 Law for Environmental Control and Protection andmany sector-specific regulations. The technical capacity, personnel and politicalwill necessary to fulfil regulations is lacking, however. Control is dissipated amonga number of organisations.
22 Ecuador: Natural resources and the environment
EIU Country Profile 1998-99 © The Economist Intelligence Unit Limited 1998

Economic infrastructure
Transport and communications
Investment in highwaysreceives a boost
Most transport in Ecuador is by road. The number of vehicles registered rose by25% to 463,000 between 1990 and 1994, although this figure understates thetrue quantity owing to evasion of the vehicle tax. Most of the road network isin poor condition for lack of public funds. The Durán Ballén government’sNational Highway Plan improved 35 major provincial motorways with anoverall investment of around $500m, partially financed by multilateral andbilateral credits. Work also began in 1996 on the Ecuadorean section of theInteroceanic Way, which will eventually join the Pacific and Atlantic oceansvia Ecuadorean roadways and Brazilian waterways.
In 1995 the Ministry of Public Works called for bids from private-sector con-tractors to repair, maintain and administer 1,315 km of roads under two-yearconcessions. Investment would be recovered through tolls. Progress hasonly been made with the first stage of bids for the Rumichaca-Guayllabambaroute in the north and Aloag-Riobamba route in the central highlands. Thesecond stage will include the Santo Domingo bypass and Santo Domingo-Jujánroutes. Floods caused by El Niño have destroyed much of the road network incoastal areas, and it must be rebuilt in 1999.
The rail system is indecline
The railway system, built at the turn of the century, is now of relatively littleimportance. Service is irregular and the track and rolling stock are in urgentneed of modernisation. The state modernisation body, Corporación Nacionalpor la Modernación del Estado (Conam), plans to wind up the state railway
Telecommunications privatisation
August 1995: Congress passes the Telecommunications Law, allowing theprivatisation of the state telecommunications company, Empresa Ecuatoriana deTelecomunicaciones (EMETEL).
January-June 1996: Tariff structure agreed by the regulatory Comisión deTelecomunicaciones (Conatel), EMETEL, government and private bidders.
September 1997: EMETEL converted into two regional companies—Andinateland Pacifictel. 100% of EMETEL valued at $1.82bn; qualified operators invited tobid.
November 1997: Auction to sell 35% of Andinatel and Pacifictel fails becauseonly one operator presented a bid (the law requires at least two bidders).
April 1998: Second attempt fails after all bidders withdraw from process, citingan uncertain legal and regulatory environment.
Ecuador: Transport and communications 23
© The Economist Intelligence Unit Limited 1998 EIU Country Profile 1998-99

company, which requires an annual state subsidy of around $8m, and is seek-ing private purchasers or subcontractors.
Air traffic is on theincrease
Ecuador’s two main airports are in Quito and Guayaquil. International passen-ger traffic is projected to increase over the next 30 years by 7% in Quito and 6%in Guayaquil, while freight volumes are expected to rise by 16.5%. The need foran expansion of capacity and improved safety means that the two airports areto be moved out of the city centres, and Conam recently called for private bids.There are three national airlines: TAME, SAETA and Ecuatoriana. TAME(military-owned) is the principal domestic airline, but it also began flying toChile, Panama and Cuba in 1996. SAETA, a private airline, operates inter-nationally, mainly to the US, and has a domestic wing, SAN SAETA. However,the former state airline, Ecuatoriana, was grounded in 1993, benefiting variousUS airlines. Ecuatoriana’s privatisation in 1995 and return to internationaloperations in June 1996 have since meant tough competition. A serious acci-dent in September 1998 involving a Cuban aircraft taking off from Quitoairport has increased pressure to finalise plans to build new airports forEcuador’s two main cities.
Telecommunications:privatisation has been
difficult
Ecuador has an average of eight telephone lines per 100 inhabitants (just overone-third of the Latin American average of 20), but the service is concentratedin urban areas. Years of underinvestment have led to a poorly maintained andinadequate infrastructure. The Durán Ballén government introduced the legalframework for the privatisation of the state-owned telecommunications sector.However, opposition from interest groups and a lack of political will has meantrepeated delays in the privatisation process. The auction to sell off a 35% stakein each of the two regional companies into which the state telecoms enterprisewas divided had to be abandoned at the last minute when only one operatorpresented a bid. An uncertain regulatory environment was probably the mainfactor prompting other registered bidders to withdraw from the process. Muchto the government’s embarrassment, a second attempt to sell the stake in theentities in April 1998 had to be cancelled, also at the last minute, when the twoprincipal bidders told the government that their previous concerns had notbeen addressed.
Port modernisation isunder way
Ecuador’s four main ports are Guayaquil, Esmeraldas, Manta and PuertoBolívar. Two additional ports, at Balao and La Libertad, are equipped to accom-modate oil tankers. Port trade has been rising rapidly and the number of shipsdeparting rose by 165% between 1990 and 1994, to 16,340. A modernisationprogramme is under way, which in the short term involves the subcontractingof port services to the private sector and in the longer term an internationalbidding round. Customs control, which was tightened as inspection washanded over to the private sector under the Durán Ballén government, deterio-rated following its renationalisation under Abdalá Bucaram. Customs control islikely to be handed back to the private sector in 1998 under new arrangements.(For historical data on transport see Reference table 12)
24 Ecuador: Transport and communications
EIU Country Profile 1998-99 © The Economist Intelligence Unit Limited 1998

Energy provision
The growth in oilproduction—
Oil production in Ecuador took off in the 1970s and has since risen steadilyfrom an average of 78,000 barrels/day (b/d) in 1972 to 389,000 b/d in 1997.Export volumes have also increased, from 25m barrles to 91m, although at aslower rate than overall production owing to growing domestic consumptionand internal transport bottlenecks. At the end of 1993 proven reservesamounted to 3.7bn barrels. Crude exports, which come mainly from Oriente,are of medium heaviness, 27°API, although the most recent discoveries havebeen of heavy crude (see Reference table 13).
Since the foundation of the state oil company, CEPE (now Petroecuador), in1972, the state has dominated production. In 1989, however, 13 risk-servicecontracts were signed with private operators, seven of which are still in force(with Occidental, Arco, Oryx, Tripetrol, Elf, Braspetro and Maxus). Most ofthese have started producing since 1990, reducing Petroecuador’s share ofproduction in 1994 to 88%. In 1993 a further reform to the Hydrocarbons Lawintroduced production-sharing contracts (PSCs), six of which were signed withthe private sector in 1994, followed by a further two in 1996.
—is limited by poorrefining and transport
facilities
The increasing production of derivatives has meant the need for expandedtransport and refining facilities. Refining capacity has increased from some31,500 b/d in 1972 to 157,000 b/d in 1995 but is still insufficient to meetdomestic demand, leading Ecuador to import fuel. Recent programmes havebeen aimed at further increasing capacity, producing lead-free and high-octanefuel and diesel, and processing heavier crude.
Lack of transport capacity has been the principal obstacle to increased oilproduction in recent years. Plans to expand pipeline capacity have been repeat-edly disrupted by political opposition to handing this “strategic” national assetover to private-sector management. A programme to expand transport capacityto 410,000 b/d by the end of 1999 has now been scrapped by President JamilMahuad, and is expected to be replaced with a project to build a second pipe-line dedicated to transporting heavy crude. The government is likely to look forgreater private-sector participation in this sector.
Gas production Ecuador has the refining capacity to process only around 20% of the natural gasproduced in the Oriente oilfields, and imports are necessary to meet about 50%of national demand. The existing national network of poliducts transportinggas and other derivatives is 1,300 km long, but there are plans to increase thisto 2,000 km. Mr Mahuad’s government plans to restructure the sector with thehelp of private investors. It has already abolished the state subsidy on domesticgas consumption.
Investment is sought inelectricity generation
Hydroelectric resources are estimated to represent 70% of Ecuador’s commer-cial energy resources, but only 3% is actually tapped for generation. Thecountry is dependent for around 65% of its electricity on the Paute hydro-electric plant, but low rainfall, inadequate water storage and the accumulationof silt due to deforestation have reduced generating capacity. At the same timethe contribution of thermal stations has declined markedly owing to poor
Ecuador: Energy provision 25
© The Economist Intelligence Unit Limited 1998 EIU Country Profile 1998-99

maintenance and a lack of investment in new technology. Until recently heav-ily subsidised tariffs discouraged international aid, as donors judge that theyare unlikely to recoup their investments.
A series of hydroelectric plants have been built by the private sector underconcession and build-operate-transfer (BOT) schemes. It was hoped that theserecently completed projects would provide the necessary capacity to meet theshortfall from the Paute plant in the dry season, but electricity rationing had tobe reimposed in late 1997 regardless, and more rationing is expected in late1998. The ratification of the Electricity Law in 1997 paves the way for thedivision of Inecel, the state electricity company, into regional entities whichwill be privatised in 1999.
Financial services
Deregulation leads to acredit boom—
The financial sector was deregulated by the 1994 Financial Institutions Law,which led to a large increase in the number of institutions and the expansionof banks into new activities such as leasing, credit cards and investment bank-ing. Ecuador now has over 300 financial institutions, including 31 banks,although 90% of assets are held by only ten institutions.
—followed by collapse In the context of strong short-term capital flows after 1992, institutions aggres-sively marketed credit (see Reference table 14). Competition for deposits be-tween the many institutions pushed up savings rates, while strong demand forloans enabled them to maintain high margins. The regulatory Superintendencyof Banks lacked the resources and the political will necessary for the efficientmonitoring of this expansion. The weaknesses of the system were exposed whencapital flows dried up in 1995. Higher interest rates led to rising bad debts, andthe collapse of several brokerages revealed practices of illegal deposit-taking. InMarch 1996 the Banco Central del Ecuador (the Central Bank) intervened in oneof Ecuador’s largest banks, Banco Continental, ostensibly to protect depositorsand prevent panic spreading to the rest of the market. The subsequent investig-ation showed that it had inflated its capital by a process of “pyramidisation”—lending to related offshore companies to enable them to finance the bank’scapital increases. The Central Bank is eager to sell Banco Continental but, so far,no potential buyers have been found.
Controls tighten Since the end of 1995 the financial authorities have tightened controls overoperations by raising capital requirements, encouraging mergers and dissolu-tions of weaker institutions, and by imposing a moratorium on the creation ofnew institutions. The Central Bank provided emergency liquidity credits to 29institutions in December 1995, some of which were renewed in February 1996.A credit line of Su1.1bn ($344m) aimed at restructuring bank loans to theprivate sector over the medium term was created. The level of overdue debts isnot reflected in official figures, as financial institutions tend to roll over non-performing loans prior to reporting dates or move them offshore. Private ana-lysts estimate them at around 8%.
In April 1997 the monetary authorities raised the proportion of short-term(360 days or less) deposits which private financial institutions are required to
26 Ecuador: Financial services
EIU Country Profile 1998-99 © The Economist Intelligence Unit Limited 1998

lodge with the Central Bank from 10% to 12%. This was done to avoid anundue rise in the demand for dollars in the face of falling nominal and realinterest rates, and high levels of liquidity. High liquidity levels brought aboutby a low demand for credit have made it more and more difficult for commer-cial banks to invest assets profitably in 1997. Financial institutions in Ecuadorhave been limited to buying large amounts of government debt paper whichthe authorities have issued in the form of monetary stabilisation bonds in anumber of open-market operations throughout the year. Limited opportunityto fulfil their role as financial intermediaries in 1997 and surging interest ratesin 1998 have put increasing pressure on the banks, with the loan portfolios ofmany important institutions undergoing serious deteriorations. Mr Mahuad’sgovernment has so far attempted to ease these pressures by reducing banks’reserve requirements on dollar deposits to 2%, but further, more substantialmeasures are expected.
The stockmarket isunderdeveloped
The stockmarket remains small and illiquid. Little progress has been made withthe privatisation programme and the creation of private pension funds wasrejected in a national referendum in November 1995. Government and CentralBank debt issues traditionally accounted for around one-third of transactions.However, private-sector activity has expanded rapidly in recent years and ac-counted for 97% of transactions in 1995. The trend had been towards medium-term investments, including share transactions, yet this was reversed after theeconomic downturn and interest rate rise of 1995. Depressed prices led to ashift in trading away from shares towards interest-bearing investments. Uncer-tainty over economic prospects encouraged a move into short-term instru-ments, which represented 88% of total transactions in 1996. A boom in the saleof promissory notes was particularly marked (see Reference table 15).
Tourism
Galapagos dominates— Tourism is the fourth largest foreign-exchange earner (see Reference table 16).Ecuador has the benefit of a range of natural attractions in a relatively smallarea—mountains, beaches, tropical rainforest and a vast range of flora andfauna. The Galapagos Islands are the principal attraction for foreign visitors,followed by Quito and the highlands, and the Oriente. Although coastal resortssuch as Manta, Salinas and Esmeraldas are important tourist destinations forEcuadorean tourists, the area lacks sufficient infrastructure to attract manytourists from abroad. Improved training and tighter control over quality, oper-ating permits and tariffs are also required.
—but investment in themainland is rising
Most visitors are from the US and Colombia. International hotel chains are be-latedly discovering Ecuador, and the Hilton, Sheraton, Marriott and Radissongroups are among those involved in own-building or in management agree-ments in Quito and Guayaquil. This will significantly increase luxury andbusiness hotel capacity, and is likely to attract more international conferenceactivity to Ecuador. Greater competition at the top end of the market shouldraise standards. Ecotourism, particularly on the Galapagos Islands and in theAmazon region in the Oriente, is another fast-growing area.
Ecuador: Tourism 27
© The Economist Intelligence Unit Limited 1998 EIU Country Profile 1998-99

Production
Industry
A boom in the 1970sfinances expansion
Industrial development in the 1960s built on the traditional, existing manufac-turing sectors of textiles, food and drink, tobacco, oil-refining and cementproduction. Rapid expansion took place in the 1970s as a result of the oilboom, sectoral development laws which encouraged import substitution and aprotectionist trade policy.
Geographicalconcentration
Although the development laws also aimed to decentralise industrial activity,78% of production and 70% of businesses remain concentrated in the prov-inces of Guayas and Pichincha. Nonetheless, there are important industrialsectors in the provinces of Azuay (ceramics, furniture and tyres), Esmeraldas(oil-refining and wood), Manabí (sea and agricultural products), Cotopaxi (ironand steel), and the towns of Ambato, Milagro, Riobamba and Latacunga.
The state rolls backprotection for producers
The 1990s have seen a dramatic shift in state policy towards industry, with thestripping away of special benefits and protection. The development laws re-main, but tax deductions and import duty exemptions have been eliminated.Membership of both the World Trade Organisation (WTO) and the AndeanCommunity has meant removing non-tariff barriers and reduction of tariffs.While this has exposed domestic industry to tough competition in terms ofquality and prices, it has also widened its traditionally narrow focus on thenational market, providing an incentive to export. In 1990 a maquiladora (in-bond) programme was established, allowing export companies to import tariff-free the raw materials and equipment needed for assembly. More recently, theDurán Ballén government adopted a largely hands-off approach, leaving ind-ustry to sink or swim in the face of tougher international competition, whilereducing the bureaucratic burden on businesses.
Exports are stimulated Stimulated by the prospect of new export markets, especially in the AndeanCommunity, chemicals, machinery, minerals, paper, printing and wood prod-ucts industries have been the growth areas of the 1990s. Between 1990 and 1994the number of firms exporting industrial goods increased by 213%, according toa consultancy firm, Multiplica. However, food, drink and the tobacco industryremain the most important sectors (see Reference table 7).
A shortage of finance Apart from private financial institutions, the Corporación Financiera Nacional(CFN, National Finance Corporation) is the principal source of external fund-ing for industry. The CFN acts as a second-tier bank, obtaining multilateralfunding from institutions such as the Inter-American Development Bank (IDB)and the Corporación Andina de Fomento (CAF, Andean Development Corpor-ation) which is then channelled through the private banks. Interest is onlyslightly below market rates, however, and chambers of industry and commercehave been among the most vociferous critics of the government’s failure toreduce the high interest rates of recent years. There is also a shortage of me-dium- and long-term financing. The Ecuadorean stockmarket is as yet too
28 Ecuador: Industry
EIU Country Profile 1998-99 © The Economist Intelligence Unit Limited 1998

underdeveloped and illiquid to represent a financing option for most busi-nesses.
Mining
Rich mineral deposits The non-hydrocarbons mining sector is a small part of the economy, contrib-uting less than 1% of GDP. Mineral resources include gold, silver, copper, iron,lead, zinc, uranium, magnesium, phosphates, limestone, kaolin, marble andsulphur. Most activity is concentrated in the production of non-metal con-struction materials such as limestone, sand and clay, as well as pumice stone,although the production of gold offers the most promising prospects (for his-torical data on gold production, see Reference table 18). The main areas formining activity are in the southern provinces of Zamora Chinchipe, El Oro andAzuay, where there are precious metal deposits. The limestone deposits whichsupply Ecuador’s four major cement companies are found across 15 provinces,while sand is found mainly in the Oriente provinces of Morona Santiago andNapo. Pumice stone deposits, said to be among the ten largest in the world, arein the highland provinces of Cotopaxi, Pichincha and Tungurahua. Clay prod-uction occurs in Loja but important deposits for future exploitation have beenfound in the Oriente.
The government welcomesinvestment
The mining sector was opened to foreign investment in the 1980s in the searchfor alternatives to oil. The absence of a large state-owned mining industrymeans that private operators do not face the political opposition aroused incountries like Chile and Peru, yet development of the sector was held back byfrequent changes in government legislation and uncertainty over the enforce-ment of property and exploration rights. A mining law increasing protection todomestic and foreign mining companies was passed in 1991 and a state corpor-ation, CODIGEM, was created to oversee the sector’s development. Althoughownership of mineral resources remains with the state, mining contracts orpermits to exploit mineral resources were formalised into deeds with a desig-nated set of tradeable rights. Special tax and tariff exemptions were set up toencourage foreign investors, and the Durán Ballén government streamlinedprocedures for registering titles.
A bill aiming to reform the mining law and make the tax regime inter-nationally competitive is awaiting congressional approval. Proposals includethe elimination of royalties and value-added tax (VAT) on imports. This wouldbe compensated for by higher concession fees and income tax receipts as theinformal mining sector becomes incorporated into the tax system. There willbe a single concession for the exploration and exploitation phases of miningprojects rather than separate ones as at present. The reform will face toughopposition in Congress because it favours multinational mining companieswhile imposing the accounting, incorporation and tax costs of joining theformal sector on poor miners. Although environmental regulations for thesector are also being prepared, official commitment to this issue is in doubt. In1996 the state forestry commission, INEFAN, ruled that mining activity isallowed in protected forests. In some areas, the local population has resistedthe exploitation of concessions.
Ecuador: Mining 29
© The Economist Intelligence Unit Limited 1998 EIU Country Profile 1998-99

Mineral exports, 1996(’000 kg)
Gold & silver 444
Other 67,035Source: Banco Central del Ecuador, Dirección de Estúdios.
Agriculture
Low efficiency Approximately one-third of Ecuadorean territory is used for agricultural pur-poses. The more modern agro-export sector is concentrated on the coast, whereforests and swamps have been converted into plantations. Production for nat-ional consumption, including the dairy sector, is mostly in the highlands (fordata on livestock numbers, see Reference table 20). Agriculture is Ecuador’slargest employer, but holdings are generally small, and productivity and mech-anisation rates are low. Infrastructure is inadequate and irrigation systems arein need of extension.
Financial problems limitthe sector’s development
The country is largely dependent on foreign aid to increase levels of prod-uctivity and mechanisation. In July 1996, 29 such projects with a total value of$172m were under way, with another five worth $49m in the pipeline. Ecuadorprovides 30% of funding. Credit to the agricultural sector is channelledthrough the Banco Nacional de Fomento (BNF, the state development bank).Farmers have struggled to service loans at the high interest rates of recent years,however, and there has been a marked increase in bad debts. The governmentcomes under periodic political pressure to write off or restructure the BNF’sagricultural loan portfolio.
Agricultural land use, 1995(’000 ha)
Rotating Permanentcrops crops Pasture Fallow Total
Highlands 280 361 1,940 461 3,043
Coast 111 936 2,337 677 4,058
Oriente 27 132 830 17 1,006
Total 418 1,428 5,107 1,156 8,107Source: INEC, Encuesta de Superficie y Producción Agropecuaria.
Agricultural inputs such as fertilisers are free of import duties. A system of pricebands has protected national producers in the past, but the phasing out of thissystem over seven years was agreed when Ecuador joined the WTO at thebeginning of 1996.
Land reform remains adistant hope
Factors such as insecurity of tenure, land shortages and overfarmed small-scaleholdings deter investment and prevent productivity increases. They have alsodriven the rural population to the cities in search of alternative employmentand led to the occupation of land in rural and urban areas. Colonisation of theOriente, which accounts for about 50% of Ecuador’s territory but only 4% of itspopulation, has risen but this is increasingly opposed by indigenous groups. TheInstituto de Desarrollo Agrario (Inda, Agrarian Development Institute) haslacked the financial autonomy, technical resources and freedom from political
30 Ecuador: Agriculture
EIU Country Profile 1998-99 © The Economist Intelligence Unit Limited 1998

pressures necessary for it to carry out its plan to issue land titles on a massivescale.
Water shortages affectyields
Inadequate irrigation facilities represent another barrier to the development ofthe agricultural sector, especially in poorer highland communities with limitedfinancial resources and education. Almost all areas of the country face watershortages during the summer. To tackle the problems of lack of infrastructure,technical training and environmental awareness, the government has em-barked on a five-year project to decentralise the control and operation of irriga-tion facilities and hand them over to users.
Shifting demand has ledto changes in production
patterns
Expectations of higher returns in the medium term have led farmers to substi-tute rice production for the domestic market and African Palm for export forthe traditional crops of coffee and cocoa (see Reference table 19). Rising de-mand from China has pushed up international palm-oil prices and in 1994-95,9% of production was exported. Certain growers of palm also process crudepalm oil, resulting in an alliance between the two sectors which helps to keeplocal prices up. Although cocoa production fell in the first half of the 1990s,depressed banana prices, due to the saturation of world markets, have led someproducers to shift from bananas (of which Ecuador is the world’s largest ex-porter) into the cocoa sector. Unlike the producers of the other export crops,soya farmers are small scale. They have lacked the means to control the whitefly pest which has damaged crops since the end of 1995. Productivity has fallenby 28% and some producers have changed to maize, resulting in a 40% drop inthe area sown to soya over 1996.
El Niño creates problemsfor farmers
Heavy rains and flooding caused by the El Niño climatic pattern in late 1997and early 1998 devastated agriculture in coastal areas, adversely affecting keyexport crops such as bananas, coffee, and cocoa. Yields of domestic staples suchas rice, corn, soybean and sugarcane were also badly hit, often necessitatingimports. The agriculture sector’s losses as a result of El Niño are estimated at$714m. Although agricultural production displayed a strong recovery in thesecond half of the year, thousands of rural dwellers are still homeless andtransport remains disrupted.
Output of key crops in 1996(’000 tonnes)
Bananas 5,727 Potatoes 454
Sugarcane 4,122 Coffee 191
Rice 1,270 Cocoa 94
African palm 1,043 Soya 78
Maize 569Source: Banco Central del Ecuador, Boletín Anuario.
Construction
Construction hit byrecession
The construction sector has been hard hit in recent years by cuts in publicspending, a shortage of credit and high interest rates. Between 1989 and 1993it contracted by 20%. This had an important overall effect on the economy, asconstruction is a major employer of lower-income, unskilled workers. There
Ecuador: Construction 31
© The Economist Intelligence Unit Limited 1998 EIU Country Profile 1998-99
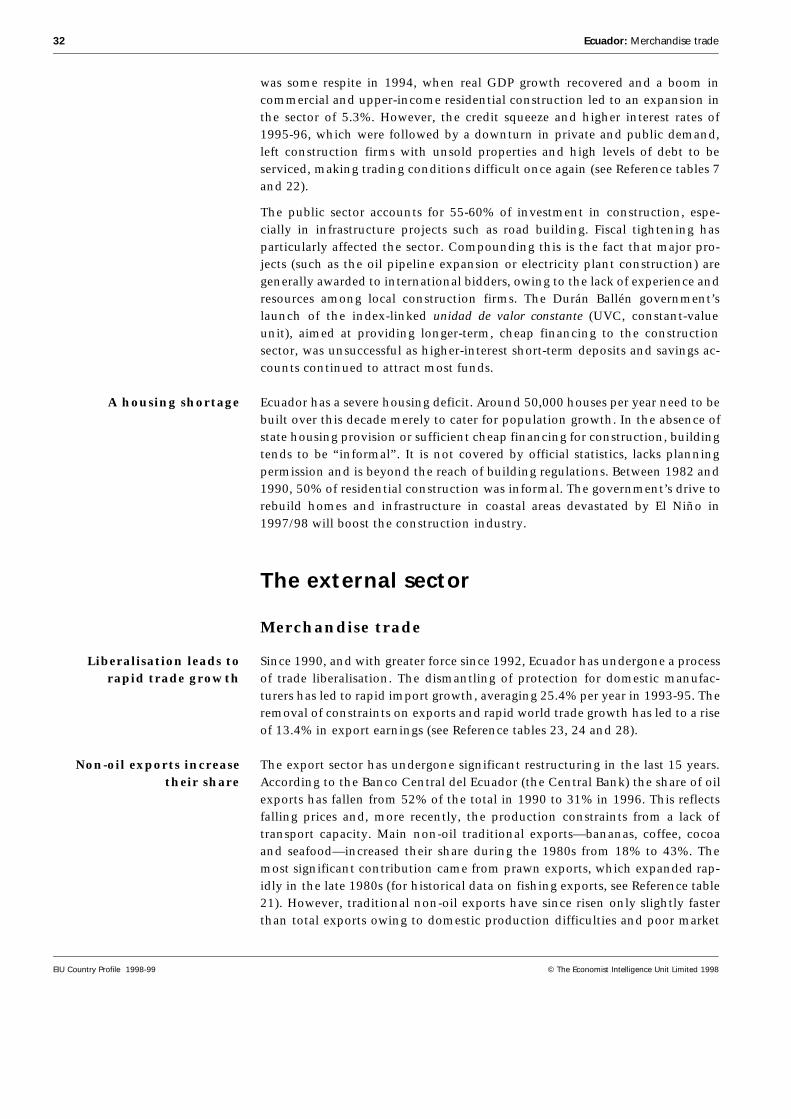
was some respite in 1994, when real GDP growth recovered and a boom incommercial and upper-income residential construction led to an expansion inthe sector of 5.3%. However, the credit squeeze and higher interest rates of1995-96, which were followed by a downturn in private and public demand,left construction firms with unsold properties and high levels of debt to beserviced, making trading conditions difficult once again (see Reference tables 7and 22).
The public sector accounts for 55-60% of investment in construction, espe-cially in infrastructure projects such as road building. Fiscal tightening hasparticularly affected the sector. Compounding this is the fact that major pro-jects (such as the oil pipeline expansion or electricity plant construction) aregenerally awarded to international bidders, owing to the lack of experience andresources among local construction firms. The Durán Ballén government’slaunch of the index-linked unidad de valor constante (UVC, constant-valueunit), aimed at providing longer-term, cheap financing to the constructionsector, was unsuccessful as higher-interest short-term deposits and savings ac-counts continued to attract most funds.
A housing shortage Ecuador has a severe housing deficit. Around 50,000 houses per year need to bebuilt over this decade merely to cater for population growth. In the absence ofstate housing provision or sufficient cheap financing for construction, buildingtends to be “informal”. It is not covered by official statistics, lacks planningpermission and is beyond the reach of building regulations. Between 1982 and1990, 50% of residential construction was informal. The government’s drive torebuild homes and infrastructure in coastal areas devastated by El Niño in1997/98 will boost the construction industry.
The external sector
Merchandise trade
Liberalisation leads torapid trade growth
Since 1990, and with greater force since 1992, Ecuador has undergone a processof trade liberalisation. The dismantling of protection for domestic manufac-turers has led to rapid import growth, averaging 25.4% per year in 1993-95. Theremoval of constraints on exports and rapid world trade growth has led to a riseof 13.4% in export earnings (see Reference tables 23, 24 and 28).
Non-oil exports increasetheir share
The export sector has undergone significant restructuring in the last 15 years.According to the Banco Central del Ecuador (the Central Bank) the share of oilexports has fallen from 52% of the total in 1990 to 31% in 1996. This reflectsfalling prices and, more recently, the production constraints from a lack oftransport capacity. Main non-oil traditional exports—bananas, coffee, cocoaand seafood—increased their share during the 1980s from 18% to 43%. Themost significant contribution came from prawn exports, which expanded rap-idly in the late 1980s (for historical data on fishing exports, see Reference table21). However, traditional non-oil exports have since risen only slightly fasterthan total exports owing to domestic production difficulties and poor market
32 Ecuador: Merchandise trade
EIU Country Profile 1998-99 © The Economist Intelligence Unit Limited 1998

conditions. Banana plantations have been damaged by disease and exportslimited by EU quotas. After booming in 1994, coffee production has beenstruck by a sharp fall in world prices, leading the Association of Coffee Produc-ing Countries (ACPC) to introduce a retention scheme. Cocoa producers arestruggling to improve quality in order to recover the aroma classification with-drawn by the International Cocoa Organisation (ICCO) in 1994. Prawn farmshave also been struck by disease and high diesel costs. In 1997 traditionalnon-oil exports stood at 49% of the total (see Reference tables 23 and 25).
Sales of manufacturesboom
Before the 1980s non-traditional exports were mainly sales of manufacturedgoods to other Andean countries. Demand was dramatically reduced after the1982 debt crisis provoked economic disarray and the imposition of importrestrictions in these countries. In 1990 non-traditional exports accounted foronly 7% of the Ecuadorean total. The sector has been booming in recent years,however, as a result of trade liberalisation and the relaunch of the AndeanCommunity. By 1997 its share had risen to 22% of total exports.
Strong import growth Over the 1990s trade liberalisation and the real appreciation of the exchangerate have contributed to strong import growth. However, the pace of importgrowth has fluctuated with domestic demand as rapid GDP growth alternatedwith the imposition of austerity measures. Thus imports surged in 1991, fellback in 1992 and recovered in 1993-94. Despite the economic downturn, im-ports grew in 1995 owing to large one-off purchases of arms for the conflictwith Peru. The political uncertainty caused imports to contract in 1996, al-though there was a marked recovery in 1997 as firms became unable to post-pone the replacement of equipment any further.
Trade liberalisation
1990: Reform of Tariff Law; elimination of import quotas, permits and subsidies;adoption of Andean tariff classifications.
1992: Reduction in tariff ceiling from 290% to 27%, excluding vehicles;unification of exchange markets.
1994: Andean Pact common external tariff (CET) introduced, with 0% tariff forimports from Andean Pact countries and 5-20% for external imports, excludingvehicles; Organic Customs Law reformed, and independent internationalinspection agencies employed.
1995: Import and export registration procedures transferred from Central Bankto private banks, and simplified through the creation of the documento único deimportación (DUI, unique import document).
1996: Ecuador joins the World Trade Organisation. All remaining non-tariffrestrictions must be phased out, and maximum tariff 10 percentage points aboveCET established.
Ecuador: Merchandise trade 33
© The Economist Intelligence Unit Limited 1998 EIU Country Profile 1998-99

Key export and import aggregates($ m unless otherwise indicated)
1993 1994 1995 1996 1997
Exports fob 3,066 3,843 4,411 4,900 5,264 % change –1.1 25.3 14.8 11.1 7.4
Imports fob –2,474 –3,282 –4,057 –3,680 –4,666 % change 18.8 32.6 23.6 –9.3 26.8
Trade balance 592 563 354 1,220 592
Major trade partners The US is Ecuador’s largest single trading partner, ahead of Latin America, theEU and Asia. Trade with the Andean Community has increased rapidly inrecent years, but Ecuador’s deficit with the rest of the region is widening. Wheninternal tariffs were removed in 1994 imports from the region almost doubled,from 7.1% of Ecuador’s total in 1993 to 14.1%. Trade with the rest of LatinAmerica is expected to continue expanding, with the Andean Communitycountries entering negotiations for an agreement with Mercosur (the southerncone customs union comprising Brazil, Argentina, Uruguay and Paraguay). Theeffect of a free-trade agreement with Chile was evident in an 18% increase inexports and 71% rise in imports from that country in 1995. An agreement withMexico is also under negotiation, which could ease Ecuador’s access to NorthAmerican Free-Trade Area (NAFTA) markets. The EU and US shares of Ecuador’simports have been declining as a result of the process of regional integration inLatin America (see Reference table 26).
A dependence ontraditional exports
As Ecuador’s principal exports are oil and agricultural products, the country ishighly susceptible to external shocks resulting from international price anddemand movements. A future challenge for policy will be the establishment ofmeasures to cushion the economy against these movements. Though exportershave benefited from trade liberalisation and exchange-rate stability in recentyears, specific government policy to promote the sector has been lacking. Exportassociations, such as FEDEXPORT, have called on the government to set up atrade ministry to avoid the current overlap of policy and duplication of meas-ures among the foreign, industrial, finance and agricultural ministries. The asso-ciations also seek greater consultation over policy, state provision of exportcredit and insurance, and a state fund for export promotion and training.
Key exports, imports and trading partners, 1997(% of total)
Exports (fob) Imports (cif)
Traditional Capital goods 30.9 Oil & derivatives 29.6 Raw materials 39.7 Bananas, prawns, coffee, cocoa, Consumer goods 21.0 fish & products 48.7 Fuel & lubricants 8.4Non-traditional 21.7
Markets Origins
US 38.6 US 30.6Andean Community 12.0 Andean Community 18.5Rest of Latin America 21.5 Rest of Latin America 30.9EU 19.3 EU 16.3Asia 10.9 Asia 11.5Source: Banco Central del Ecuador, Información Estadística Mensual.
34 Ecuador: Merchandise trade
EIU Country Profile 1998-99 © The Economist Intelligence Unit Limited 1998

Invisibles and the current account
Foreign debt paymentscause deficits
Ecuador has traditionally recorded invisibles deficits. From the late 1970s on-wards this was exacerbated by the accumulation of foreign debt and an increasein interest payments. Since 1975 the deficit on invisibles has outweighed themerchandise trade surplus, producing a current-account deficit in every yearexcept 1985 and 1996. Tourism is Ecuador’s fourth largest export and withinthe invisibles deficit there has generally been a small surplus on the travelbalance in the last ten years. Unrequited transfers have risen between 1990 and1996 from $107m to $290m.
Capital flows and foreign debt
The foreign debt burdengrows
Despite the oil boom, Ecuador’s public sector built up considerable foreign debtover the 1970s. High international interest rates and falling oil prices werereflected in a growing current-account deficit. Onerous repayment schedulescontributed to the financing gap. A drop in the level of medium- and long-termcommercial capital flows, however, meant that the financing requirement hadto be met in other ways: through the drawing down of foreign reserves anddisbursements from international agencies and government donors. Mean-while, the government had to reschedule external debt and allow paymentsarrears to build (see Reference tables 17, 29 and 30 for historical data onexternal finance). The country is currently running principal and interest ar-rears on its Paris Club debt.
IMF accords Relations with official and commercial creditors have been erratic. A number ofIMF stand-by facilities have been agreed since the debt crisis, most of whichhave been suspended owing to non-fulfilment of targets. Ecuador was typicallyunable to fully meet principal and interest liabilities on its commercial andofficial debt, but this pattern was broken under the government of Sixto DuránBallén. Another IMF stand-by facility was agreed in 1994 and this time targetswere fulfilled. Negotiations over a new stand-by agreement took place betweenthe IMF and the Alarcón government in 1997, but failed soon after the pres-ident made it clear that he was unwilling to take the steps required to meet IMFtargets. President Jamil Mahuad is expected to reach an agreement with theIMF in late 1998 or early 1999. The collapse of world oil prices and volatility inthe foreign-exchange market have weakened the country’s reserve position.The country also needs to secure an IMF agreement before it can renegotiate itsParis Club debt arrears. Paris Club debt was rescheduled and in February 1995 aBrady Plan agreement to restructure commercial bank debt was concluded.
External debt, 1997
$ m % of total
Public medium- & long-term debt 12,980 83.8
Private medium- & long-term debt 360 2.0
IMF 133 0
Short-term debt 2,014 13.0
Total debt stocks 15,488 100.0Source: EIU.
Ecuador: Invisibles and the current account 35
© The Economist Intelligence Unit Limited 1998 EIU Country Profile 1998-99

These debt negotiations helped to re-establish Ecuador’s creditworthiness andfacilitate new lending. Disbursements almost doubled between 1994 and 1995to $1.1bn. Exchange-rate stability has also led to the rapid expansion of privateforeign borrowing in recent years, which soared from $30m in 1990 to $3.9bnin 1995 (see Reference table 31).
Foreign investmentliberalised
Net foreign direct investment (FDI) averaged $90m per year from 1988 to 1993.In January 1993 sweeping changes to the foreign investment code were an-nounced. The lifting of virtually all restrictions, together with greater macro-economic stability and the later success of the Brady Plan increased net FDIflows to an average of $498m per year in 1995-97. However, as an exception tothis trend capital outflows were registered in 1995-96 as a result of the 1995Mexican crisis, the political instability resulting from the conflict with Peru,corruption charges against senior government figures and uncertainty over thefuture of economic policy.
Foreign reserves and the exchange rate
Foreign-currency reserves increased significantly under the Durán Balléngovernment, from $781m at the end of 1992 to a record level of $1.7bn at theend of 1994. This reflected both the repatriation of capital by Ecuadoreancitizens and increased FDI. Reserves fell slightly in 1995, but remained abovethe $2bn mark throughout most of 1997 as a result of reasonable export per-formance and weak imports despite spells of currency pressure brought aboutby political and economic uncertainty (when the Central Bank responded byraising interest rates and selling dollars to keep the sucre within its bands). Thecollapse of international oil prices in late 1997 and 1998, and the growingfinancial uncertainty affecting emerging markets following the Russian deval-uation, caused reserves to fall well below $2bn in late 1998 (see Reference tables26 and 27).
Key changes to investment code
June 1991: Foreign investment regime brought in line with rest of AndeanCommunity. Equal treatment for domestic and Andean Community investment;removal of “fade away” clauses which had required foreign-owned companies toadopt majority national ownership; reduction of number of areas in which foreigninvestment restricted.
January 1993: New foreign investment code. Ceiling of 49% foreign equity onfinancial sector and insurance holdings removed, along with requirement of priorauthorisation. Limits on profit and dividend remittances removed. Investmentneed only be registered with the Central Bank for statistical purposes. Restrictionsremain on investments in fishing, domestic air transport, media, defence andborder areas.
36 Ecuador: Foreign reserves and the exchange rate
EIU Country Profile 1998-99 © The Economist Intelligence Unit Limited 1998

Real exchange rate against major trading partners, 1997(annual average, Aug 1992=100)
US ($) 86.56
Japan (¥) 108.77
Germany (DM) 82.43
Colombia (Ps) 129.35
Chile (Ps) 102.49
Total (trade-weighted index of 18 countries) 83.43Source: Banco Central del Ecuador, Información Estadística Mensual.
A system of exchange-ratebands
The exchange-rate system has undergone a series of changes in recent years.Before November 1992 there was a three-tier system of official, interventionand free-market rates, and the Central Bank dealt with all trade-related foreignexchange. In September 1993 the weekly intervention rate was set at the pre-vious week’s average free-market rate, and in January 1994 the official rate ofSu390:$1 was abolished. Finally, at the end of 1994 a crawling-peg exchange-rate system was introduced, with an Su50 band either side of the central parityrate. The bands were widened in October 1995 to give the Central Bank moreflexibility to reduce interest rates and maintain reserve levels (see Referencetable 33). At present, the sucre may fluctuate by up to 5% either side of thecentre of the band. On the eve of Abdalá Bucaram’s assumption of office inAugust 1996 the band was pushed up by Su271 and the annual movement ofthe band accelerated from 16.5% to 18.5%. In March 1997 the movement ofthe band was accelerated again to provide an annual devaluation of 21%. Atthe same time, a system of daily foreign-exchange auctions with commercialbanks was introduced by the Central Bank in order to reduce exchange-rate andinterest-rate volatility. The sucre was devalued by 7.4% in March 1998 in thelight of plunging oil prices, and again by 14% in September 1998 owing toincreasing pressure in the foreign-exchange market following the devaluationof the Russian rouble in August 1998.
Ecuador: Foreign reserves and the exchange rate 37
© The Economist Intelligence Unit Limited 1998 EIU Country Profile 1998-99

Appendices
Sources of information
National statistical sources Banco Central del Ecuador, Boletín Anuario (annual)
Banco Central del Ecuador, Boletín de Precios, Salarios y Empleo (monthly)
Banco Central del Ecuador, Información Estadística Mensual (monthly),
Corporación Ecuatoriana de Turismo, Boletín Estadística, (annual)
Instituto Nacional de Estadística y Censos (INEC), Encuesta Urbana de Empleo,Subempleo y Desempleo (biannual)
Instituto Nacional de Estadística y Censos (INEC), Encuesta de Superficie y Producción Agropecuaria (annual)
Ministerio de Obras Públicas, Estadísticas de Transporte en el Ecuador (annual)
International sources Energy Data Associates, 1 Regent Street, London SW1Y 4NR
IMF, International Financial Statistics World Bank, Global Development Finance
World Bank, Ecuador Poverty Report, 1995
Select bibliography Alberto Acosta, Breve Historia Económica del Ecuador, Quito, 1995
Enrique Ayala Mora (ed.), Nueva Historia del Ecuador, Vol.11, EpocaRepublicana V, Quito, 1991
Corporación de Estudios para el Desarrollo (Cordes), Carta Económica
Agustín Grijalva Jiménez (ed.), Datos Básicos de la Realidad Nacional, Quito,1995
Oswaldo Hurtado, El Poder Político en el Ecuador, Quito, 1993
Multiplica, Gestión (monthly)
Multiplica, Informe Macroeconómico, Quito (monthly)
PMC, Ekos Economia, Quito (monthly)
Walter Spurrier (ed), Análisis Semanal, Guayaquil (weekly)
38 Ecuador: Sources of information
EIU Country Profile 1998-99 © The Economist Intelligence Unit Limited 1998

Reference tables
Reference table 1
Government finances(Su bn)
1992 1993 1994 1995 1996
Total revenue 3,130 4,315 5,648 8,030 10,634 Petroleum receipts 1,538 2,070 2,345 3,051 5,008 Non-petroleum receipts 1,592 2,245 3,302 4,980 5,626 of which: VAT 61 898 1,239 1,590 2,013 income tax 253 331 494 885 1,090 import duties 274 392 607 754 767
Total expenditure 3,103 4,333 6,320 10,993 14,139 Expenditure excl debt repayments 2,548 3,764 5,532 8,451 10,917 General services 736 1,144 1,679 2,343 3,875 Education & culture 605 747 1,067 1,477 2,803 Health & community development 200 203 319 501 475 Agricultural development 89 146 230 283 299 Transport & communications 127 328 446 779 603 Others 317 696 893 1,001 906 Internal interest payments 100 110 149 226 386 External interest payments 374 391 750 1,840 1,570
Internal debt repayments 64 77 151 287 1,779
External debt repayments 491 491 637 2,256 1,442
Total debt service 1,029 1,070 1,686 4,609 5,177
Budget balance 582 551 115 –420 –283
Financing of deficit/surplus –582 –551 –115 420 283 Internal financing 95 282 457 641 834 External financing –491 –491 –637 –517 –196 Changes in cash balances –185 –342 64 296 –355Source: Banco Central del Ecuador, Información Estadística Mensual.
Reference table 2
Money supply(Su bn; end-period)
1993 1994 1995 1996 1997
Currency in circulation 846.8 1,111.6 1,364.3 1,859.0 2,357.3
M1 2,244.0 3,045.7 3,432.3 4,647.5 6,030.0
M2 5,654.7 8,864.6 12,518.0 18,083.0 24,424.5Source: Banco Central del Ecuador, Información Estadística Mensual.
Ecuador: Reference tables 39
© The Economist Intelligence Unit Limited 1998 EIU Country Profile 1998-99

Reference table 3
Interest rates(%; end period)
1993 1994 1995 1996 1997
Interbank rate 62.4 79.0 78.7 39.0 22.6
Government bonds 29.6 32.2 36.3 35.1 20.2
Deposit rate 32.0 33.7 43.3 41.5 28.09
Lending rate 47.8 44.0 55.7 54.5 43.02
Note. Government bonds: weekly weighted average rate for 84- to 91-day stabilisation bonds.Deposit rate: average of free market rates for 30- to 83-day time deposits, and from 1992 weightedaverage of free market rates for 30- to 83-day time deposits. Lending rate: rate charged on 90- to179-day loans, and from 1992 weighted average rate on 97- to 175-day loans.
Sources: Banco Central del Ecuador, Información Estadística Mensual; IMF, International Financial Statistics.
Reference table 4
Gross domestic product
1993 1994 1995 1996 1997
Total (Su bn)At current prices 27,451 36,478 46,006 60,727 79,040At constant 1990 prices 9,104 9,502 9,723 10,008 n/aReal change (%) 2.0 4.0 2.3 2.0 3.4
Per head (Su ’000)At current prices (’000) 2,500 3,351 4,014 5,191 6,622At constant 1975 prices 18,345 18,728 18,767 18,749 18,996Sources: IMF, International Financial Statistics; Instituto Nacional de Estadística y Censos (INEC); Banco Central del Ecuador, Boletín
Anuario.
40 Ecuador: Reference tables
EIU Country Profile 1998-99 © The Economist Intelligence Unit Limited 1998

Reference table 5
Gross domestic product by expenditure(Su bn unless otherwise indicated; constant 1975 prices)
1993 1994 1995 1996 1997
Private consumption 131 135 138 141 144 % change 2.5 2.9 2.2 1.9 2.4 % of total 65.2 64.3 64.2 64.2 63.7
Government consumption 20 20 20 20 20 % change –1.2 0.0 1.9 –1.0 –0.3 % of total 9.9 9.5 9.5 9.2 8.8
Fixed investment 29 30 32 32 33 % change 1.1 4.5 5.3 1.8 4.0 % of total 14.3 14.3 14.7 14.7 14.6
Stockbuilding 0 1 1 –2 1 % change – – – – – % of total 0.8 0.1 0.3 0.8 –1.3
Exports of goods & services 65 70 74 76 80 % change 4.2 8.7 5.0 3.6 4.3 % of total 32.0 33.4 34.2 34.8 35.4
Imports of goods & services –43 –46 –50 –48 –52 % change 0.8 6.0 9.8 –5.9 8.8 % of total 21.5 21.8 23.4 21.6 23.0
Total 201 210 215 219 226 % change 2.0 4.0 2.3 2.0 3.4 % of total 100.0 100.0 100.0 100.0 100.0
Note. Inconsistency in % change due to rounding in source.
Source: Banco Central del Ecuador, Información Estadística Mensual.
Ecuador: Reference tables 41
© The Economist Intelligence Unit Limited 1998 EIU Country Profile 1998-99
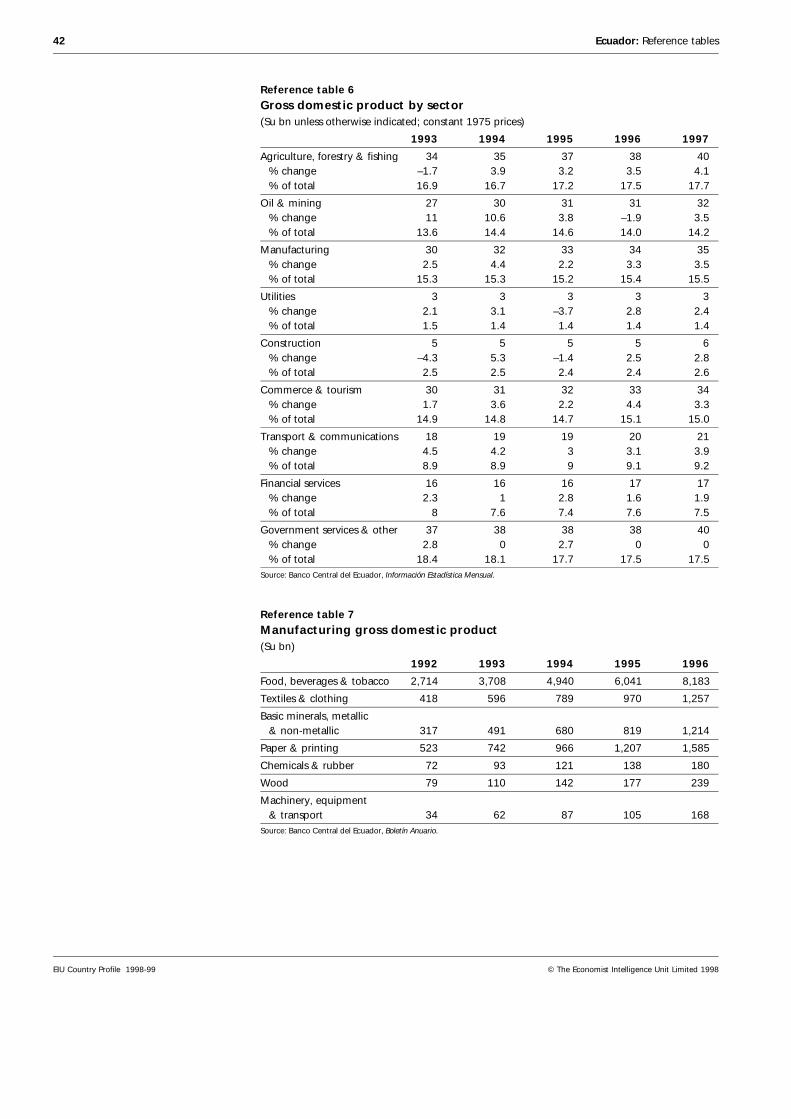
Reference table 6
Gross domestic product by sector(Su bn unless otherwise indicated; constant 1975 prices)
1993 1994 1995 1996 1997
Agriculture, forestry & fishing 34 35 37 38 40 % change –1.7 3.9 3.2 3.5 4.1 % of total 16.9 16.7 17.2 17.5 17.7
Oil & mining 27 30 31 31 32 % change 11 10.6 3.8 –1.9 3.5 % of total 13.6 14.4 14.6 14.0 14.2
Manufacturing 30 32 33 34 35 % change 2.5 4.4 2.2 3.3 3.5 % of total 15.3 15.3 15.2 15.4 15.5
Utilities 3 3 3 3 3 % change 2.1 3.1 –3.7 2.8 2.4 % of total 1.5 1.4 1.4 1.4 1.4
Construction 5 5 5 5 6 % change –4.3 5.3 –1.4 2.5 2.8 % of total 2.5 2.5 2.4 2.4 2.6
Commerce & tourism 30 31 32 33 34 % change 1.7 3.6 2.2 4.4 3.3 % of total 14.9 14.8 14.7 15.1 15.0
Transport & communications 18 19 19 20 21 % change 4.5 4.2 3 3.1 3.9 % of total 8.9 8.9 9 9.1 9.2
Financial services 16 16 16 17 17 % change 2.3 1 2.8 1.6 1.9 % of total 8 7.6 7.4 7.6 7.5
Government services & other 37 38 38 38 40 % change 2.8 0 2.7 0 0 % of total 18.4 18.1 17.7 17.5 17.5Source: Banco Central del Ecuador, Información Estadística Mensual.
Reference table 7
Manufacturing gross domestic product(Su bn)
1992 1993 1994 1995 1996
Food, beverages & tobacco 2,714 3,708 4,940 6,041 8,183
Textiles & clothing 418 596 789 970 1,257
Basic minerals, metallic & non-metallic 317 491 680 819 1,214
Paper & printing 523 742 966 1,207 1,585
Chemicals & rubber 72 93 121 138 180
Wood 79 110 142 177 239
Machinery, equipment & transport 34 62 87 105 168Source: Banco Central del Ecuador, Boletín Anuario.
42 Ecuador: Reference tables
EIU Country Profile 1998-99 © The Economist Intelligence Unit Limited 1998

Reference table 8
Prices(annual averages)
1993 1994 1995 1996 1997
Consumer price index (1990=100) 333.0 424.4 521.5 648.3 847.4 % change 45.0 27.4 22.9 24.3 30.7
Wholesale price index (1990=100) 318.3 376.4 n/a n/a n/a % change 39.1 18.3 n/a n/a n/a
Export price index (1990=100; unit values in dollars) 75.0 83.4 84.1 96.0 89.3 % change –28.8 11.2 0.8 14.1 –7.0Sources: Banco Central del Ecuador, Información Estadística Mensual; IMF, International Financial Statistics.
Reference table 9
Earnings(Su, average monthly)
1993 1994 1995 1996 1997
Minimum wage plus statutory bonuses 164,750 244,000 354,833 483,681 609,257 % change 65.7 48.1 45.4 36.3 26.0Source: Banco Central del Ecuador, Información Estadística Mensual.
Reference table 10
Population
1993 1994 1995 1996 1997
Total (m) 10.98 11.22 11.46 11.70 11.94
Growth rate (% change) 2.2 2.2 2.1 2.1 2.1Sources: Instituto Nacional de Estadística y Censos (INEC); Banco Central del Ecuador, Boletín Anuario; Inter-American Development
Bank, website.
Reference table 11
Labour force(urban; % unless otherwise indicated)
1992 1993 1994 1995 1996
Economically active population (’000) 2,957 2,892 2,904 3,104 3,223
Male 59.5 60.3 60.8 60.5 60.5
Female 40.5 39.7 39.2 39.5 39.5
Unemployed 8.9 8.3 7.1 6.9 n/a
Underemployed 47.9 47.2 45.2 45.9 n/a
By sectorAgriculture 17.7 18 17.3 15.2 n/aIndustry 8.2 10.1 7.4 9.7 n/aServices 45.3 41.8 46.1 44 n/aSources: Banco Central del Ecuador, Boletín de Precios, Salarios y Empleo; Boletín Anuario; INEC, Encuesta Urbana de Empleo, Subempleo
y Desempleo.
Ecuador: Reference tables 43
© The Economist Intelligence Unit Limited 1998 EIU Country Profile 1998-99

Reference table 12
Transport statistics
1991 1992 1993 1994 1995
RailwayPassengers transported (’000) 928 1,169 2,619 2,899 n/aCargo carried (’000 tonnes) 27 48 34 58 n/a
Road transportPassenger vehicles registered (’000) 195 230 235 251 n/aGoods vehicles registered (’000) 192 197 199 212 n/a
Air transportPassenger landings (’000) 347 407 445 496 519Aircraft landings (’000) 7 n/a 9 11 11Cargo loaded (’000 kg) 26,813 31,702 35,412 43,700 58,523
Sea transportVessel departures 7,773 9,895 12,677 16,340 n/aCargo loaded (’000 tonnes) 12,343 13,743 14,372 17,683 19,368 of which: bananas 2,817 2,655 2,748 3,338 3,625 coffee 74 66 89 129 89 fish & seafood 108 117 120 125 36 wood & balsa 23 47 29 123 300Source: Ministry of Public Works, Estadísticas de Transporte en el Ecuador 1996.
Reference table 13
National energy statistics
1992 1993 1994 1995 1996
Electricity generation (’000 mwh) 7,164 6,102 8,120 n/a n/a Sales 5,472 5,722 6,094 n/a n/a
Crude oil output (m barrels) 117.1 125.4 138.2 141.2 140.4 Exports 74.4 79.7 86.6 94.1 84.4 Consumption 42.7 45.7 51.6 47.1 56.0
Natural gas production (’000 barrels) 5,880 6,485 6,285 n/a n/a Processed 1,222 1,451 1,283 2,503 n/a Consumption (incl imports) 3,559 3,776 5,644 6,489 n/aSources: Banco Central del Ecuador, Boletín Anuario; Petroecuador.
44 Ecuador: Reference tables
EIU Country Profile 1998-99 © The Economist Intelligence Unit Limited 1998
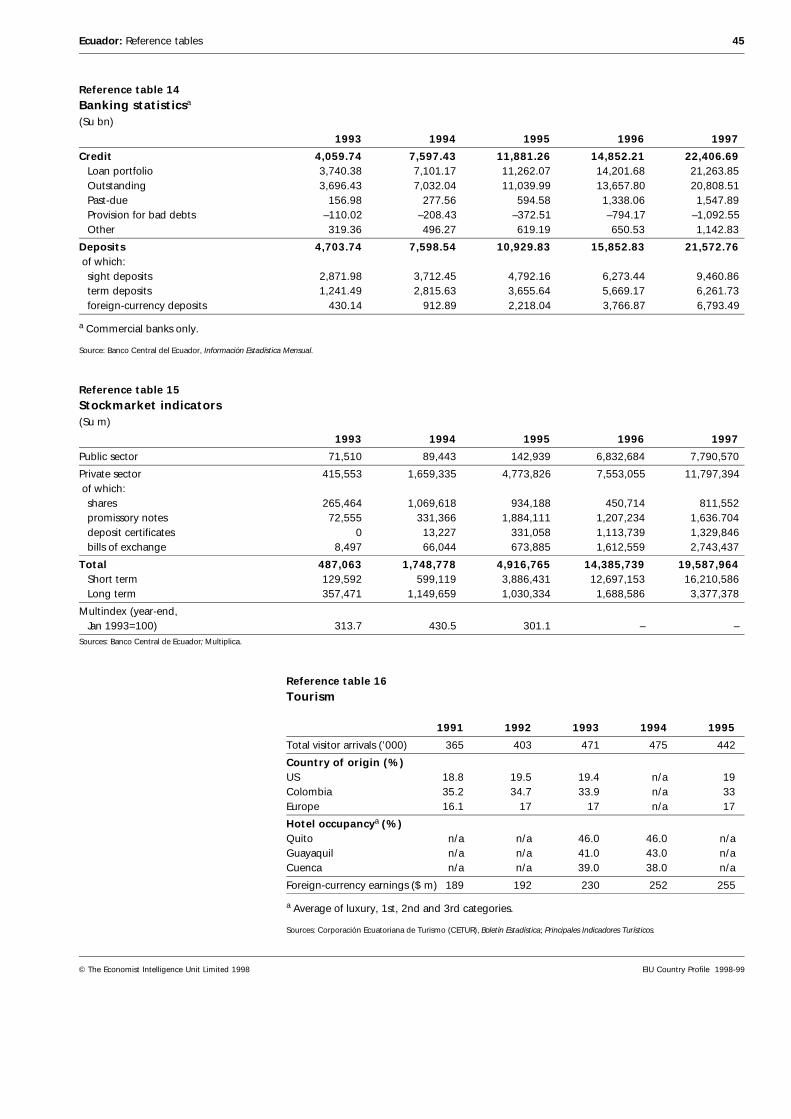
Reference table 14
Banking statisticsa
(Su bn)
1993 1994 1995 1996 1997
Credit 4,059.74 7,597.43 11,881.26 14,852.21 22,406.69 Loan portfolio 3,740.38 7,101.17 11,262.07 14,201.68 21,263.85 Outstanding 3,696.43 7,032.04 11,039.99 13,657.80 20,808.51 Past-due 156.98 277.56 594.58 1,338.06 1,547.89 Provision for bad debts –110.02 –208.43 –372.51 –794.17 –1,092.55 Other 319.36 496.27 619.19 650.53 1,142.83
Deposits 4,703.74 7,598.54 10,929.83 15,852.83 21,572.76 of which: sight deposits 2,871.98 3,712.45 4,792.16 6,273.44 9,460.86 term deposits 1,241.49 2,815.63 3,655.64 5,669.17 6,261.73 foreign-currency deposits 430.14 912.89 2,218.04 3,766.87 6,793.49
a Commercial banks only.
Source: Banco Central del Ecuador, Información Estadística Mensual.
Reference table 15
Stockmarket indicators(Su m)
1993 1994 1995 1996 1997
Public sector 71,510 89,443 142,939 6,832,684 7,790,570
Private sector 415,553 1,659,335 4,773,826 7,553,055 11,797,394 of which: shares 265,464 1,069,618 934,188 450,714 811,552 promissory notes 72,555 331,366 1,884,111 1,207,234 1,636.704 deposit certificates 0 13,227 331,058 1,113,739 1,329,846 bills of exchange 8,497 66,044 673,885 1,612,559 2,743,437
Total 487,063 1,748,778 4,916,765 14,385,739 19,587,964 Short term 129,592 599,119 3,886,431 12,697,153 16,210,586 Long term 357,471 1,149,659 1,030,334 1,688,586 3,377,378
Multindex (year-end, Jan 1993=100) 313.7 430.5 301.1 – –Sources: Banco Central de Ecuador; Multiplica.
Reference table 16
Tourism
1991 1992 1993 1994 1995
Total visitor arrivals (’000) 365 403 471 475 442
Country of origin (%)US 18.8 19.5 19.4 n/a 19Colombia 35.2 34.7 33.9 n/a 33Europe 16.1 17 17 n/a 17
Hotel occupancya (%)Quito n/a n/a 46.0 46.0 n/aGuayaquil n/a n/a 41.0 43.0 n/aCuenca n/a n/a 39.0 38.0 n/a
Foreign-currency earnings ($ m) 189 192 230 252 255
a Average of luxury, 1st, 2nd and 3rd categories.
Sources: Corporación Ecuatoriana de Turismo (CETUR), Boletín Estadística; Principales Indicadores Turísticos.
Ecuador: Reference tables 45
© The Economist Intelligence Unit Limited 1998 EIU Country Profile 1998-99
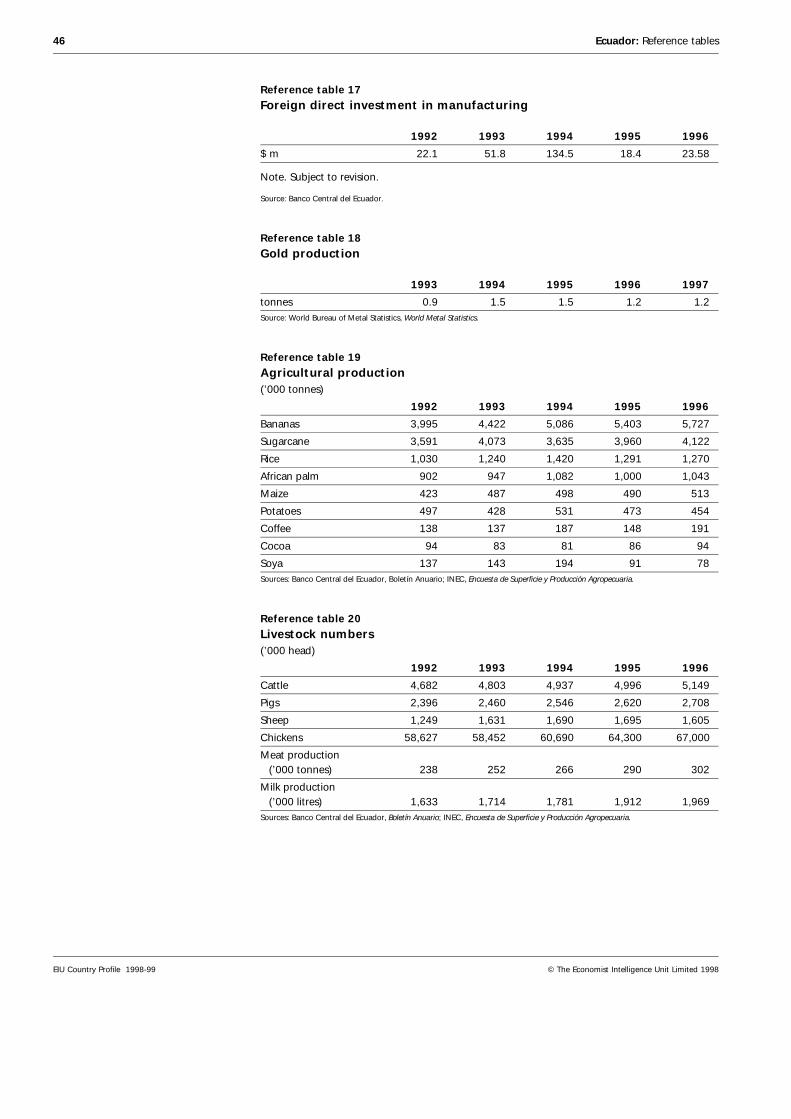
Reference table 17
Foreign direct investment in manufacturing
1992 1993 1994 1995 1996
$ m 22.1 51.8 134.5 18.4 23.58
Note. Subject to revision.
Source: Banco Central del Ecuador.
Reference table 18
Gold production
1993 1994 1995 1996 1997
tonnes 0.9 1.5 1.5 1.2 1.2Source: World Bureau of Metal Statistics, World Metal Statistics.
Reference table 19
Agricultural production(’000 tonnes)
1992 1993 1994 1995 1996
Bananas 3,995 4,422 5,086 5,403 5,727
Sugarcane 3,591 4,073 3,635 3,960 4,122
Rice 1,030 1,240 1,420 1,291 1,270
African palm 902 947 1,082 1,000 1,043
Maize 423 487 498 490 513
Potatoes 497 428 531 473 454
Coffee 138 137 187 148 191
Cocoa 94 83 81 86 94
Soya 137 143 194 91 78Sources: Banco Central del Ecuador, Boletín Anuario; INEC, Encuesta de Superficie y Producción Agropecuaria.
Reference table 20
Livestock numbers(’000 head)
1992 1993 1994 1995 1996
Cattle 4,682 4,803 4,937 4,996 5,149
Pigs 2,396 2,460 2,546 2,620 2,708
Sheep 1,249 1,631 1,690 1,695 1,605
Chickens 58,627 58,452 60,690 64,300 67,000
Meat production (’000 tonnes) 238 252 266 290 302
Milk production (’000 litres) 1,633 1,714 1,781 1,912 1,969Sources: Banco Central del Ecuador, Boletín Anuario; INEC, Encuesta de Superficie y Producción Agropecuaria.
46 Ecuador: Reference tables
EIU Country Profile 1998-99 © The Economist Intelligence Unit Limited 1998

Reference table 21
Fishing exports($ ’000)
1993 1994 1995 1996 1997
Shrimp 471 551 673 631 886
Tuna 10 21 66 59 69
Other fish 45 52 23 26 30
Fishmeal 12 10 12 54 23
Other sea products 75 105 121 152 185Source: Banco Central del Ecuador, Información Estadística Mensual.
Reference table 22
Construction statisticsa
1992 1993 1994 1995 1996
ResidentialValue (Su bn) 93.2 171.7 594.1 607.2 497.4
OtherValue (Su bn) 58.1 111.8 363.6 301.8 240.2
a Quito, Guayaquil and Cuenca.
Source: Banco Central del Ecuador, Boletín Anuario.
Reference table 23
Exports($ m; fob)
1993 1994 1995 1996 1997
Primary products 2,521 3,157 3,556 3,809 4,253 of which: agricultural 766 1,250 1,258 1,398 1,610 forestry 14 20 31 29 38 fish & seafood 526 629 769 716 985 crude oil 1,152 1,185 1,395 1,521 1,412
Industrialised goods 542 681 850 1,091 1,011 of which: chemicals & pharmaceuticals 27 32 44 46 51 food & beverages 212 267 343 448 n/a oil derivatives 105 120 165 255 146 polished woods 26 27 34 52 n/a metal manufactures 91 119 118 109 142 textiles 30 41 46 52 61
Totala 3,066 3,843 4,411 4,900 5,264
a Includes re-exports and the export of waste and live animals not for human consumption.
Source: Banco Central del Ecuador, Información Estadistica Mensual.
Ecuador: Reference tables 47
© The Economist Intelligence Unit Limited 1998 EIU Country Profile 1998-99

Reference table 24
Imports($ m; cif)
1993 1994 1995 1996 1997
Consumer goods Non-durables 248 345 442 502 612 Durables 294 465 382 355 428
Fuel & lubricants 88 104 241 162 437
Raw materials & intermediate goods Agricultural 82 131 196 244 280 Industrial 788 1,086 1,388 1,351 1,534 Construction materials 76 101 125 164 181
Capital goods Agricultural 30 35 46 37 48 Industrial 593 651 752 738 969 Transport equipment 361 704 580 378 464
Other 2 1 1 1 1
Total 2,562 3,622 4,153 3,932 4,955Source: Banco Central del Ecuador, Información Estadística Mensual.
Reference table 25
Key exports and imports(’000 tonnes)
1992 1993 1994 1995 1996
ExportsOil & derivatives 11,585 12,602 13,690 15,027 14,200Bananas 2,757 2,626 3,123 3,815 3,931Prawns 89 75 74 87 86Coffee & products 70 92 125 88 78Cocoa & products 67 76 76 88 103
ImportsIndustrial food inputs 486 299 580 502 528Fuel 292 285 252 1,011 454Industrial chemical inputs 326 206 341 418 382Construction materials 178 74 224 342 266Industrial mining inputs 527 325 518 611 549Source: Banco Central del Ecuador, Boletín Anuario.
48 Ecuador: Reference tables
EIU Country Profile 1998-99 © The Economist Intelligence Unit Limited 1998

Reference table 26
Main trading partners($ m)
1993 1994 1995 1996 1997
Exports (fob) to:US 1,305 1,594 1,769 1,852 2,032Colombia 147 226 253 301 356Italy 123 155 174 195 273Chile 117 168 197 221 239Peru 131 157 69 53 224Germany 82 189 168 176 207Japan 53 76 118 139 150Spain 83 115 150 133 142Argentina 54 76 90 84 77EU 502 753 844 942 1,018
Imports (cif) from:US 864 964 1,302 1,172 1,516Colombia 98 294 393 379 511Venezuela 48 162 269 171 338Japan 331 511 329 210 290Germany 132 216 191 155 200Spain 111 83 93 169 173Mexico 58 154 150 196 168Chile 50 67 112 135 165Brazil 94 223 186 143 146Italy 193 137 103 98 133EU 562 578 638 654 807Source: Banco Central del Ecuador, Información Estadística Mensual.
Ecuador: Reference tables 49
© The Economist Intelligence Unit Limited 1998 EIU Country Profile 1998-99
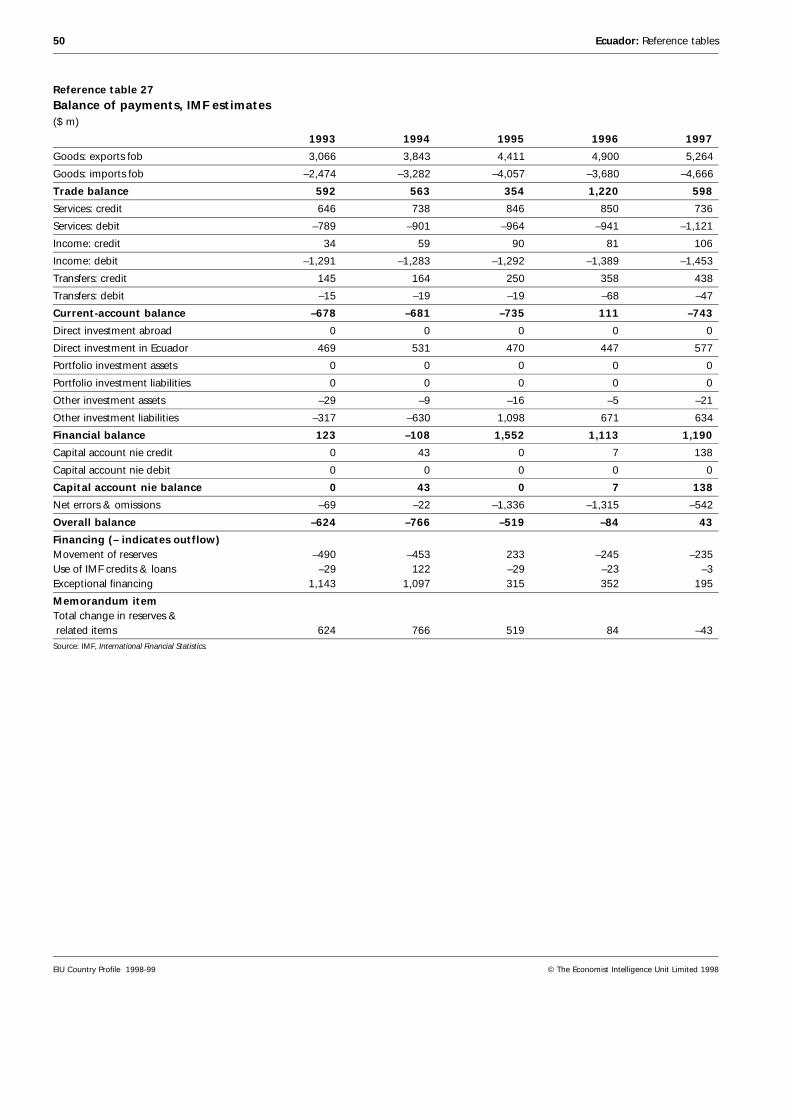
Reference table 27
Balance of payments, IMF estimates($ m)
1993 1994 1995 1996 1997
Goods: exports fob 3,066 3,843 4,411 4,900 5,264
Goods: imports fob –2,474 –3,282 –4,057 –3,680 –4,666
Trade balance 592 563 354 1,220 598
Services: credit 646 738 846 850 736
Services: debit –789 –901 –964 –941 –1,121
Income: credit 34 59 90 81 106
Income: debit –1,291 –1,283 –1,292 –1,389 –1,453
Transfers: credit 145 164 250 358 438
Transfers: debit –15 –19 –19 –68 –47
Current-account balance –678 –681 –735 111 –743
Direct investment abroad 0 0 0 0 0
Direct investment in Ecuador 469 531 470 447 577
Portfolio investment assets 0 0 0 0 0
Portfolio investment liabilities 0 0 0 0 0
Other investment assets –29 –9 –16 –5 –21
Other investment liabilities –317 –630 1,098 671 634
Financial balance 123 –108 1,552 1,113 1,190
Capital account nie credit 0 43 0 7 138
Capital account nie debit 0 0 0 0 0
Capital account nie balance 0 43 0 7 138
Net errors & omissions –69 –22 –1,336 –1,315 –542
Overall balance –624 –766 –519 –84 43
Financing (– indicates outflow)Movement of reserves –490 –453 233 –245 –235Use of IMF credits & loans –29 122 –29 –23 –3Exceptional financing 1,143 1,097 315 352 195
Memorandum itemTotal change in reserves & related items 624 766 519 84 –43Source: IMF, International Financial Statistics.
50 Ecuador: Reference tables
EIU Country Profile 1998-99 © The Economist Intelligence Unit Limited 1998

Reference table 28
Balance of payments, national estimates($ m)
1993 1994 1995 1996 1997
Exports fob 3,066 3,843 4,411 4,900 5,264
Imports fob –2,474 –3,282 –4,057 –3,680 –4,666
Trade balance 592 561 354 1,220 598
Services credit 680 797 936 931 842
Services debit –2,080 –2,184 –2,256 –2,330 –2,577
Unilateral transfers 130 145 231 290 391
Current-account balance –678 –681 –735 111 –746
Direct investment 469 531 470 469 575
External debt 300 471 1,565 972 859
Arrears 471 114 –110 66 –13
Other capital –90 23 –1,345 –1,344 –413
FinancingReserves (– indicates increase) –472 –458 155 –274 –262Source: Banco Central del Ecuador, Información Estadística Mensual.
Reference table 29
Net foreign investment by sector($ ’000)
1993 1994 1995 1996 1997
Agriculture, forestry & fishing 9,362 3,983 4,476 4,803 n/a
Mining & quarrying 395,345 368,032 320,336 280.083 n/a
Manufacturing 51,773 134,520 18,350 23,577 n/a
Utilities 0 44 89 38 n/a
Construction 178 654 110 3,550 n/a
Trade 6,948 9,937 85,610 103,645 n/a
Transport, warehousing & communications 1,529 3,739 24,640 14,220 n/a
Services 4,031 9,906 16,366 17,279 n/a
Total 469,166 530,814 469,977 447,213 575,000Source: Banco Central del Ecuador.
Reference table 30
Net foreign investment by source country($ m)
1992 1993 1994 1995 1996
US 125 367 379 306 223
Brazil 1 1 0 21 7
UK 16 30 30 46 47
France 9 18 16 30 28
Panama 6 13 15 8 14
Netherlands 1 0 8 27 25
Spain 1 1 43 10 18Source: Banco Central del Ecuador, Boletín Anuario.
Ecuador: Reference tables 51
© The Economist Intelligence Unit Limited 1998 EIU Country Profile 1998-99

Reference table 31
External debt, World Bank estimates($ m unless otherwise indicated)
1992 1993 1994 1995 1996
Total external debt 12,280 14,150 15,075 13,990 14,491 Long-term debt 9,931 10,215 10,777 12,504 12,755 Short-term debt 2,249 3,864 4,100 1,312 1,592 Use of IMF credit 100 71 198 174 145
Public & publicly guaranteed long-term debt 9,831 9,974 10,552 12,064 12,435 Official creditors 4,399 4,570 4,934 5,257 5,108 Multilateral 2,253 2,371 2,580 2,995 2,910 Bilateral 2,146 2,199 2,354 2,262 2,198 Private creditors 5,432 5,405 5,618 6,807 7,327 Bonds 0 0 191 5,999 6,013 Banks 4,763 4,831 4,959 492 1,056
Total debt service 981 921 1,000 1,412 1,314 Principal 561 517 509 746 645 Interest 420 404 492 666 669 of which: short-term debt 33 95 88 81 92
Ratios (%)Total external debt/GNP 101.9 103 98.4 83.9 82.1Debt-service ratioa 26.8 24.6 21.6 26.4 22.6Short-term debt/total external debt 18.3 27.3 27.2 9.4 11.0Concessional loans/total debt 10.8 10.4 11.1 13.0 12.9
Note. Long-term debt is defined as having original maturity of more than one year.a Debt service as a percentage of earnings from exports of goods and services.
Source: World Bank, Global Development Finance.
52 Ecuador: Reference tables
EIU Country Profile 1998-99 © The Economist Intelligence Unit Limited 1998

Reference table 32
External debt, national estimates($ m; end-period)
1993 1994 1995 1996 1997
Public debtInitial debt stocks 9,824 9,830 10,440 12,351 12,531Total disbursementsa 519 902 7,235 1,097 1,351Total repaymentsb 594 554 5,450 574 1,113Total interest paymentsc 307 648 4,043 653 761Total debt service paid 902 1,202 9,493 1,227 1,874
Final debt stocksd 9,830 10,440 12,351 12,531 12,495Interest arrears 2,713 3,317 28 97 84
Final debt stocks incl interest arrears 13,025 13,758 12,379 12,628 12,579
Total public debt/GDP (%) 89.58 81.5 68.76 65.92 62.76
Private debtInitial debt stocks 255 603 828 1,551 1,958Total disbursementse 486 1,240 3,190 3,869 4,430Total repaymentsb 138 1,015 2,465 3,466 3,868Total interest paymentsa 26 130 184 196 202Total debt service paid 164 1,144 2,649 3,661 4,069
Final debt stocks 603 828 1,555 1,958 2,520Interest arrears 3.2 3.2 – – –
Final debt stocks incl interest arrears 606 832 1,555 1,958 2,520
Total final debt incl interest arrears 13,631 14,589 13,934 14,586 15,099
a Including refinanced disbursements and capitalisation of interest payments. b Including refinanced and forgiven payments. c Includingrefinanced and forgiven interest payments. d Including exchange-rate adjustments. e Including refinanced disbursements.
Source: Banco Central del Ecuador, Información Estadística Mensual.
Reference table 33
Exchange rates(annual average)
1993 1994 1995 1996 1997
NominalSu:$ 1,919.4 2,197.8 2,566.0 3,191.3 3,998.0
Real (Aug 1992=100)Su:$ 95.4 87.8 85.5 88.1 86.6Su:¥ 107.1 105.2 108.8 93.8 82.4Su:Ps 98.1 110.9 117.8 124.8 129.4Su:DM 84.9 79.9 87.2 82.5 70.0
Note. Ps=Colombian peso.
Sources: Banco Central del Ecuador, Información Estadística Mensual; IMF, International Financial Statistics.
Editor: Juan Sebastián EspinosaAll queries: Tel: (44.171) 830 1007 Fax: (44.171) 830 102
Ecuador: Reference tables 53
© The Economist Intelligence Unit Limited 1998 EIU Country Profile 1998-99