
ECO/WKP(99)9 COPING WITH POPULATION AGEING IN AUSTRALIA … · COPING WITH POPULATION AGEING IN...
67
Unclassified ECO/WKP(99)9 Organisation de Coopération et de Développement Economiques OLIS : 23-Jul-1999 Organisation for Economic Co-operation and Development Dist. : 30-Jul-1999 __________________________________________________________________________________________ English text only ECONOMICS DEPARTMENT COPING WITH POPULATION AGEING IN AUSTRALIA ECONOMICS DEPARTMENT WORKING PAPERS No. 217 by David Carey Unclassified ECO/WKP(99)9 English text only Most Economics Department Working Papers beginning with No. 144 are now available through OECD’s Internet Web site at http://www.oecd.org/eco/eco/ 80223 Document complet disponible sur OLIS dans son format d’origine Complete document available on OLIS in its original format
Transcript of ECO/WKP(99)9 COPING WITH POPULATION AGEING IN AUSTRALIA … · COPING WITH POPULATION AGEING IN...
Unclassified ECO/WKP(99)9
Organisation de Coopération et de Développement Economiques OLIS : 23-Jul-1999Organisation for Economic Co-operation and Development Dist. : 30-Jul-1999__________________________________________________________________________________________
English text onlyECONOMICS DEPARTMENT
COPING WITH POPULATION AGEING IN AUSTRALIAECONOMICS DEPARTMENT WORKING PAPERS No. 217
byDavid Carey
Unclassified
EC
O/W
KP
(99)9E
nglish text only
Most Economics Department Working Papers beginning with No. 144 are now available throughOECD’s Internet Web site at http://www.oecd.org/eco/eco/
80223
Document complet disponible sur OLIS dans son format d’origine
Complete document available on OLIS in its original format
ECO/WKP(99)9
2
ABSTRACT / RÉSUMÉ
As in other OECD countries Australia’s population is ageing progressively. On unchanged policies, thiswill increase government outlays for public pensions and health care, causing a deterioration in budgetbalances, and reduce economic growth (mainly by lowering growth in the labour force). Nevertheless, theprospective deterioration in Australia’s budget finances is much less than in most other OECD countriesbecause the government only provides the first pillar of retirement income arrangements and means teststhis age pension. Moreover, superannuation (private pension fund) benefits are growing, reducingentitlements to the age pension. Even so, the budget costs of population ageing could be lowered byreducing the scope for early retirees to draw on superannuation savings and by requiring individuals to pre-fund part of the costs of long-term aged care. But the greatest challenge facing Australia policy makers inreducing the costs of population ageing is to roll back the trend to early retirement evident in recentdecades. In the long-term raising levels of educational attainment and increasing investment in lifelonglearning are likely to be most successful policies in this regard.
* * * * *
Comme dans d’autres pays de l’OCDE, la population australienne vieillit peu à peu. Si l’on ne prendaucune mesure pour faire face à ce vieillissement, il gonflera les dépenses publiques au titre de pensions etde la santé, ce qui se traduira par une dégradation des soldes budgétaires, et réduira la croissanceéconomique (due en particulier à la faible progression de la population active). Néanmoins, la dégradationprévisible des finances publiques en Australie est moindre par rapport aux autres pays de l’OCDE car legouvernement prend en charge seulement le premier pilier des dispositifs de revenu pour la retraite qui estsoumis aux conditions de ressources. Par ailleurs, les cotisations de retraite (fonds de pension privé)augmentent, réduisant ainsi les droits à la pension de vieillesse. Cependant, les coûts budgétaires duvieillissement de la population pourraient être réduits en diminuant les possibilités pour les pré- retraités deretirer leur épargne des fonds de retraite et en exigeant chaque personne de pré-financer une partie des fraisde la prise en charge de longue durée des personnes âgées. Mais le grand défi des autorités australiennespour réduire les coûts dus au veillissement de la population est d’inverser la tendance de la retraiteanticipée de ces dernières decennies. A long terme , le relèvement du niveau de l’instruction etl’augmentation de l’investissement dans la formation permanente sont probablement les clés du succès decette politique.
Copyright OECD, 1999Applications for permission to reproduce or translate all, or part of, this material should be made to:Head of Publications Service, OECD, 2 rue André Pascal, 75775 Paris, Cedex 16, France.

ECO/WKP(99)9
3
TABLE OF CONTENTS
COPING WITH POPULATION AGEING IN AUSTRALIA....................................................................... 6
The scale of the demographic problem ....................................................................................................... 6Institutional arrangements for supporting the elderly ................................................................................. 8Retirement income ...................................................................................................................................... 8Health care ................................................................................................................................................ 14Economic effects of population ageing under the existing framework..................................................... 15Public finances .......................................................................................................................................... 15National saving ......................................................................................................................................... 17Overall economic growth.......................................................................................................................... 17Policy implications.................................................................................................................................... 18The retirement decision............................................................................................................................. 18Age pension .............................................................................................................................................. 20Health care ................................................................................................................................................ 22Concluding remarks .................................................................................................................................. 24
BIBLIOGRAPHY......................................................................................................................................... 64
Boxes
1. OECD principles for population ageing reforms
2. User charges for long-term residential care
3. Effective taxation of superannuation benefits

ECO/WKP(99)9
4
Tables
1. Population growth
2. Features of Australian age pension
3. Coverage of occupational superannuation
4. Features of the Superannuation Guarantee
5. The taxation of superannuation
6. Superannuation benefits paid by type of fund
7. Employee superannuation contributions
8. Superannuation income for persons retiring at different times
9. Assets of pension funds
10. Returns on pension fund portfolios, 1967-90
11. Projections of total health costs under various assumptions
12. Projected public health care costs in 2030, across OECD countries
13. Comparison of disability-free and total life expectancy
14. Fiscal indicators
15. Relative hiring intensities by age group
16. Unemployment rates and the incidence of long-term unemployment
17. Labour force participation rates by educational attainment and age

ECO/WKP(99)9
5
Figures
1. Ageing Australia
2. Demographic projections, by age sub-group
3. Dependency ratios
4. OECD dependency ratios: an international comparison
5. Labour force participation rates
6. Labour force and employment shares in the total population
7. Share of owner-occupied housing in selected OECD countries
8. Proportion of superannuation assets not preserved
9. Quasi replacement ratios for persons aged 65-75
10. Replacement rates of expenditure in the final working year
11. Age pension outlays
12. Outlays for public pension: an international comparison
13. Health expenditure per person by age by area of expenditure
14. Health expenditure per person by survival status
15. Growth in employment, population and GDP per capita
16. Demographics and dwelling investment
17. Labour force participation rates of persons aged 55 and over
18. Expected number of years in and out of employment
19. Estimates of the average age of retirement
20. Reasons for early retirement
ECO/WKP(99)9
6
COPING WITH POPULATION AGEING IN AUSTRALIA
by
David Carey1
1. Australia’s population is ageing progressively. As in other OECD countries, this is mainlyattributable to the sharp decline in natality in the last three decades. The economic effects of thesedevelopments are expected to be most strongly felt when the large ‘‘baby boom’’ generation, born in thetwo decades following World War II, moves into retirement. Population ageing creates inter-relatedproblems of three main kinds: fiscal; macroeconomic; and social. In particular, on unchanged policies itincreases government outlays for public pensions and health care, causing a deterioration in budgetbalances. This aggravates the decline in economic growth caused by lower growth in the labour force byreducing investment and hence, the capital intensity of production. And these developments place pressureon the relationship between generations, notably by leaving future generations with an increased taxburden and smaller capital stock. The challenge for policy makers is to effect reforms which minimisethese kinds of problems. OECD Ministers have agreed to take into account the principles (see Box 1) toguide such reforms enunciated in Maintaining Prosperity in an Ageing Society (OECD, 1998c) and tomonitor progress in implementing them through the OECD. This chapter is part of that surveillanceprocess.
2. The gravity of these problems depends in particular on the scale of population ageing and oninstitutional arrangements for supporting the elderly, the topics covered in the first two sections of thechapter. The main economic effects of population ageing, including those on public finances, are thendiscussed, followed by an examination of some aspects of government policy where reforms couldfacilitate adjustment. A summing up of the main conclusions closes the discussion.
The scale of the demographic problem
3. Australia’s population age structure is changing from the traditional pyramid shape to somethingmore like a high-rise building and the median age is rising (Figure 1). On the basis of central assumptionsabout fertility rates, net immigration and life expectancy,2 the Retirement Income Modelling (RIM) Unit.
1 . The author is economist on the Australia Desk in the Economics Department. This paper was originally
produced for the OECD Economic Survey of Australia, which was published in December 1998 under theauthority of the Economic and Development Review Committee. The author is indebted to theCommonwealth Treasury of Australia for considerable assistance with the preparation of this paper.Special thanks also go to Val Koromzay, Andrew Dean, Jean-Claude Chouraqui and to other colleagues inthe Department of Economics and the Directorate for Education, Employment, Labour and Social Affairsof the OECD who provided comments and drafting suggestions. The author would also like to thankJosette Rabesona for technical support, Lyn Louichaoui and Sylvie Ricordeau for secretarial assistance.

ECO/WKP(99)9
7
Box 1. OECD principles for population ageing reforms
Seven principles have been identified to guide reforms aimed at ensuring that the way societiestransfer resources to a rapidly growing number of retired people creates neither major economic nor socialstrains:
1. Public pension systems, taxation systems and social transfer programmes should be reformed toremove financial incentives to early retirement, and financial disincentives to later retirement.
2. A variety of reforms will be needed to ensure that more job opportunities are available for olderworkers and that they are equipped with the necessary skills and competencies to make them.
3. Fiscal consolidation should be pursued, and public debt burdens should be reduced. This couldinvolve phased reductions in public pension benefits and anticipatory hikes in contribution rates.
4. Retirement income should be provided by a mix of tax-and-transfer systems, funded systems, privatesavings and earnings. The objective is risk diversification, a better balance of burden-sharingbetween generations, and to give individuals more flexibility over their retirement decision.
5. In health and long-term care, there should be a greater focus on cost-effectiveness. Medicalexpenditure and research should be increasingly directed to ways of reducing physical dependence,and explicit policies for providing care to frail older people should be developed.
6. The development of advance-funded pension systems should go hand-in-hand with that of astrengthening of the financial market infrastructure, including the establishment of a modern andeffective regulatory framework.
7. Strategic frameworks should be put in place at the national level now in order to harmonise theseageing reforms over time, and to ensure adequate attention to implementation and the build-up ofpublic understanding and support.
projects that the median age of the population will rise from 34.3 years presently to 44.1 years in 2051.Growth in the working age population (defined in Australia to be aged 18-64) is projected to slow from anannual average rate of 1.3 per cent in the current decade to 0.2 per cent in the 2020s while growth in theelderly population (65+) is expected to rise to a peak of 3.1 per cent per year in the 2010s (Table 1).Overall, growth in Australia’s total population is predicted to slow progressively to just 0.3 per cent perannum in the 2040s. These projections imply reductions in the proportions of the population aged less than18 and 18-64 and a steep rise in the proportion aged 65 and over (Figure 2).
4. The aged dependency ratio (i.e. the ratio of people aged 65 and over to those of working age)rises in these projections from 18 per cent in 1997 to 40 per cent by the year 2051 (Figure 3). In otherwords, the number of people of working age for each person aged 65 and over is expected to decline from5.6 to 2.5. A better indication of the scale of the long-term challenge of funding retirement and age-relatedservices can be obtained by considering developments in the ratio of persons aged 65 and over to the actualnumber of workers,3 as it is they who pay the bulk of taxes. While this ratio is also projected to double bythe middle of next century, the level attained means that eventually there will be less than two workers perperson aged 65 and over. This ratio also provides a better indication of the total funding pressures whichmay come to bear on government than the total dependency ratio (the ratio of persons not working toworking) because the cost to government of an aged person considerably exceeds that for a young person: 2. These assumptions are that: the fertility rate declines slightly from 1.8 presently to 1.75 by 2000 and
subsequently remains at this level; net immigration remains at 70 000 per year/life expectancy increases onaverage by six years by 2051.
3. Including workers aged 65 and over.
ECO/WKP(99)9
8
indeed, an aged person costs all governments 2.3 times as much as a young person and for theCommonwealth government the ratio is 4:1 (Gallagher, 1995).
5. These projections are not greatly affected by plausible changes in the underlying assumptions. Inparticular, increased immigration would only have a small effect because it only accounts for a modest partof population growth in Australia and the age structure of immigrants is quite similar to that of the totalpopulation.4 For example, an increase in net immigration from 70 000 per year (the central assumption) to90 000 would only reduce the aged dependency ratio attained in 2051 by 1 percentage point. Similarly,stable instead of rising life expectancy would lower the aged dependency ratio reached in 2051 by less than1 percentage point. The ageing of Australia’s population is therefore inevitable, mainly depending on pastdemographic developments.
6. The factors which underpin such an evolution – the ageing of the baby boom generation, thesmall generations which follow and increasing longevity – are also common to other OECD countries. Forthe OECD as a whole, the aged dependency ratio is projected to rise by 75 per cent between 1995 and2030, similar to the increase projected for Australia on the OECD’s standardised assumptions (these aresummarised in Annex 1)5 (Figure 4). This would leave Australia with an age dependency ratio about 15 percent lower than the OECD average. A slightly greater increase in the ratio of the population aged 65 andover to employment is projected for both Australia and the OECD as a whole (see Figure 5), despite theassumption that the unemployment rate falls to 5 per cent from 2005 onwards. This reflects declines inlabour force participation rates based on an extrapolation of recent trends. Participation rates in bothAustralia and the OECD have fallen sharply for males aged 55 to 64 and 15-24, outweighing the increasefor females (Figure 5).6 The smaller decline in participation rates for older males in recent years reflectsmore buoyant economic activity, while the rise in rates for older females reflects the ageing of generationswith greater prior labour force experience. Overall, the proportion of the population in employment isprojected to continue to rise until 2005 but to fall steeply thereafter, reaching a little over 40 per cent inAustralia and slightly less for the OECD by 2030 (Figure 6).
Institutional arrangements for supporting the elderly
7. Population ageing will increase transfers to the elderly. The scale and nature of this increase willdepend on institutional arrangements for supporting the elderly, notably in the form of retirement incomeand subsidies for health-care costs. These arrangements are described in this section.
Retirement income
8. Retirement income can be considered to comprise three main components in Australia.7 The firstis the targeted age pension, which provides a safety net and is financed out of general taxation. The secondis distributions from pension funds (known locally as superannuation funds) financed by employment
4. Population growth was 1.2 per cent in 1997, with net immigration contributing 0.4 percentage point. The
age structure of immigrants is similar to that of the total population owing to the importance of the familyreunion category of immigrants.
5. Compared with the RIM Unit’s central assumptions, the OECD’s standardised assumptions are forAustralia to have a higher fertility rate, less net immigration and a similar increase in life expectancy.
6. The assumed on-going decline in participation rates underlying the OECD projections contrasts with theoutlook for broadly stable rates in the RIM Unit’s projections. This is one of the many uncertaintiessurrounding the projections. Even so, the two sets of projections for Australia are quite similar overall.
7. This paragraph is based on Bateman and Piggott, 1997.
ECO/WKP(99)9
9
related contributions mandated by the Superannuation Guarantee. And the third is voluntary savings, whichinclude sums voluntarily placed in superannuation funds, the purchase of owner-occupied housing andother private savings. These arrangements are similar to those in most other OECD countries except thatthe second pillar is generally funded and managed privately in Australia but publicly managed on a pay-as-you-go basis in most other countries. Each of the pillars is discussed below followed by a brief descriptionof the regulation relevant to superannuation funds.
Age pension
9. The age pension is a non-contributory flat-rate entitlement to which persons continuouslyresident in Australia for at least 10 years become eligible when they attain the qualifying age, subject tomeeting income and assets tests (Table 2). To qualify, men must be 65 years or older and, since July 1997,women must be 61 years or older.8 The minimum qualifying age for women is being increased by sixmonths at two-year intervals until January 2014, when it will be 65 years.
10. The age pension is adjusted every six months in line with movements in the Consumer PriceIndex (CPI). In addition, in 1997 the Government also introduced legislation to maintain the single rate ofpension at no less than 25 per cent of Male Total Average Weekly Earnings.9 This is the first time agovernment has explicitly committed itself to implementing the benchmark through legislation. Thepension for an aged pension couple (combined) is 1.6 times that of the single age pension. Thesereplacement rates are comparable to those for first pillar arrangements in many other OECD countries. InSeptember 1998, the single rate of pension was A$ 357 per fortnight and the married rate was A$ 596. Netof tax, this represented a replacement rate for a single person who had been earning average weeklyordinary (i.e. full) time earnings of 32 per cent of final salary.
11. The rate of pension is means tested on the basis of a person’s income or assets, whichever givesthe lower rate of pension. Under the income test, the pension is reduced by 50 cents10 for every dollar thatincome exceeds the allowable limits.11 Currently an individual may receive up to A$ 100 each fort-nightand still receive the maximum age pension (couples A$ 176 combined). They cease to receive any paymentif their fortnightly income exceeds A$ 825.40(A$ 1 379.20 for a couple). Under the assets test, the pensionis reduced by A$ 3 per fortnight for every A$ 1 000 of assets over the allowable limits. The asset limits arehigher for couples and for non-homeowners. Owner-occupied housing is exempt from the assets test.
12. Pension payments are subject to personal income tax but a pensioner rebate is available whichfully exempts full-rate pensioners from income tax and provides partial exemption for part-rate pensioners.
8. War veterans who have qualifying service may receive a service pension instead of the aged pension. The
main difference from the age pension is that the minimum qualifying age is 60 for men and 56 for women,rising to 60 by 2014.
9. This legislation commenced on 20 September 1997. If the benchmark has not been met by way of CPIindex increases, the single rate of pension will be increased to 25 per cent of MTAWE with the appropriateflowons.
10. Note that it is proposed in the tax reform package to change the age pension taper rate to 40 per cent.
11. The income test free area is the amount of non-pension income a pensioner can earn before the amount ofpension begins to reduce. These limits are indexed to the CPI.
ECO/WKP(99)9
10
The Superannuation Guarantee12
13. In the mid-1980s, less than one half of the labour force was covered by occupationalsuperannuation (Table 3). Coverage was much higher in the public sector than in the private sector. Boththe government and unions considered that greater coverage was required so that retirees could have higherliving standards in the future – too many people were relying exclusively on the age pension, which wasonly intended to provide a safety net. At the same time, the government and unions wanted to reduce theeffects of wage rises on inflation and the balance of payments. Accordingly, in the context of the Accord in1987 they agreed a wage increase (6 per cent) half of which was to be paid in the form of employersuperannuation contributions on behalf of employees. Following difficulties in ensuring that awardsuperannuation contributions were actually paid by employers and the refusal by the Australian IndustrialRelations Court to rule in favour of a further increase, the government legislated in 1992 the Super-annuation Guarantee (Table 4). This scheme requires employers to make super-annuation contributions onbehalf of their employees to complying superannuation funds, which are frequently industry based.Employers who fail to do so are subject to the Superannuation Guarantee Charge (SGC), which is greaterthan the SG contributions as it consists of the employer’s individual shortfall, an interest component and anadministration fee. In addition, the charge is not a tax deductible business expense (SG contributions aretax deductible within the age-based limits). The SGC is paid to the Australian Tax Office, which thentransfers the shortfall and interest components to the chosen fund of the employee.
14. Almost all employers pay the required contributions rather than the Charge. Contribution rateswere initially set at 3 per cent, rising progressively to 9 per cent by 2002. Increases in contribution ratesduring the early years were lower for small employers.
15. The Superannuation Guarantee applies to most workers, the main exceptions being employeesearning less than A$ 450 per month and part-time employees under 18.13 Low wage employees areexcluded on the grounds of high relative administrative costs for small amounts. The Government hasannounced that it will give workers earning between A$ 450 and A$ 900 per month the option of optingout of compulsory superannuation in favour of higher wages or salary. However, legislation for opting outof superannuation arrangements has not been passed. Following the introduction of the SuperannuationGuarantee, the proportion of workers covered by superannuation arrangements has risen markedly, to over90 per cent (see Table 3).
16. Employer contributions made under the Superannuation Guarantee must be fully vested (i.e. themember is entitled to all accrued benefits) and fully funded in an approved fund.14 Benefits must remain inthe fund until retirement and the attainment of the statutory age for access to them (the preservation age)except in limited circumstances.15 The preservation age is currently 55, but will be increased progressivelyto 60 between 2015 and 2025. This is being done to reduce the scope for individuals to dissipatesuperannuation benefits before reaching age pension age and thereby maximise their age pensionentitlements; this practice is known in Australia as ‘‘double dipping’’. There is an indexed cap on earnings
12. This section draws extensively on Bateman and Piggott, 1997.
13. Other exceptions are: members of the Defense Reserve Forces (only in respect of their reserveemployment); certain non-resident employees; and employees of non-resident employers.
14. A government guarantee can substitute for full funding in the case of public sector employees. Definedbenefit schemes can meet the requirements of the Superannuation Guarantee, which is framed in terms ofcontributions, provided that an actuarial certificate is obtained specifying that the implicit level ofsuperannuation support is obtained.
15. These circumstances include death disability, compassionate grounds or financial hardship.
ECO/WKP(99)9
11
subject to the Superannuation Guarantee, which was A$ 94 520 in FY 1997/98, about 2 ½ times averageearnings.
17. Contributions paid by the employer are tax deductible, just as other wage and salary payments.However, funds must pay a concessional tax in respect of contributions received. Fund earnings andbenefits are also taxed concessionally (Table 5).
18. Superannuation benefits may be taken as a lump sum, a retirement income stream or anycombination. Most benefits are taken as lump sums (Table 6). Insurance and Superannuation Commission(ISC) data for 1992/93 show that 84 per cent of the value of benefits was paid as lump sums. However,almost half of lump sums are transferred to other superannuation funds or rolled over in the same fund; thismostly occurs with large lump sums. Transfers and rollovers are generally used to buy retirement incomestreams known as -allocated pensions. These entail regular drawings from an account containing aretirement accumulation which is subject to legislated annual limits. The maximum withdrawal rate wouldempty the account by age 80 while the minimum rate never liquidates the account. Allocated pensions aremore attractive than lifetime annuities because beneficiaries have greater flexibility to take extra incomewhen exceptional expenses arise (such as an operation in a private hospital, moving house or replacing thecar) and because the purchase price is not inflated by adverse selection problems.16 In addition, allocatedpensions enable beneficiaries to maximise age pension receipts later in life. Amounts left in an allocatedpension account at the end of life form part of the deceased person’s estate.
Voluntary savings
19. There are two main tax-preferred channels for voluntary saving in Australia – owner-occupiedhousing and superannuation – and not surprisingly, these are the vehicles through which Australians domost of their saving. The most significant other vehicle for savings is negatively-geared propertyinvestment. Approximately 70 per cent of households own their principal residence, a high rate of owner-occupation by international standards (Figure 7), and around one half of superannuation members makevoluntary contributions, with the average rate of contribution being about 5¾ per cent (Table 7). Membersare encouraged through tax incentives to retain their benefits in the superannuation system until at least thepreservation age is attained. So as to reduce further the possibilities for double dipping, all contributionsand earnings accruing from 1 July 1999 will have to be retained in the superannuation system at least untilpreservation age. This measure, together with the increase in the preservation age, will contribute to asignificant reduction in the proportion of superannuation assets which are not preserved (Figure 8).
Total retirement income
20. At present, the major sources of retirement income for persons eligible for pension benefits arethe age- and age-related pensions and home ownership. In 1997, over half of persons old enough to qualifyfor an age pension received a full pension and a little over 80 per cent received at least some pension. And69 per cent of age pensioners were homeowners, mostly with little or no mortgage debt. For most membersof this group, imputed rental income is substantial in relation to other sources of income.17 Most agepensioners receive some income from financial investments but only about 10 per cent get an income fromsuper-annuation. Excluding imputed rental income on owner-occupied housing, the average income of
16. Lifetime annuities tend to be priced above their actuarially fair value (for the population as a whole)
because people who expect to live longest are most likely to buy them.
17. Rental assistance contributes towards the higher living costs of some non-homeowners – it was received by16 per cent of age pensioners in 1997.
ECO/WKP(99)9
12
retired households (i.e. not receiving wage or business income, not in the labour force and aged 55 ormore) was 27 per cent of that of prime-age worker households (i.e. receiving wage or business income,aged 25-54). The age and equivalent pensions18 accounted for a little over one half of retired house-holds’income. For couples aged 65-74, total disposable income (net of taxes) was three-quarters of that forcouples aged 55-64, similar to the proportion in many other OECD countries (Figure 9). This shows thatolder people, on average, rely on alternative income sources in addition to public pensions so as to generatea suitable standard of living.
21. The contribution of superannuation to retirement income is set to grow markedly owing to theSuperannuation Guarantee. The RIM Unit projects an increase in average gross annual retirement incomefrom superannuation from A$ 2 012 for people presently retiring to A$ 10 214 (in constant FY 1997/98dollars) for people retiring in FY 2015/16 (Table 8). However, allowing for reductions in the means-testedage pension, the extra average income from superannuation.
22. General government transfers Capital and self-employment Earnings only rises to A$ 6 407 forretirees in FY 2015/16; the extra income for present retirees is unaffected by the age pension means test,falling within the test-free area. The combination of both means testing and tax almost halves the averageextra income from superannuation for people retiring in FY 2015/16.19
23. As the Superannuation Guarantee matures, retirement income replacement rates will risesignificantly, especially for low income persons. The RIM Unit estimates that for a couple with a singleearner on average weekly ordinary time earnings (AWOTE) throughout a 40 year working life, thereplacement rate relative to expenditure in the final working year will be a little over 80 per cent in 2032(Figure 10). This compares with a replacement rate of a little over 40 per cent in 2032 for a full-rate agepension alone.20 Replacement rates in the matured system are inversely related to earnings owing to meanstesting of the age pension and progressive income tax rates; someone earning 75 per cent of AWOTE has areplacement rate of over 90 per cent, while the rate falls to 60 per cent for someone earning twiceAWOTE. Concomitantly, the proportion of retirement income derived from the age pension is inverselyrelated to earnings.
24. A strength of these arrangements is that income sources are diversified. This reduces the risk oftotal retirement income differing markedly from what had been expected as the components of retirementincome are not perfectly correlated. In particular, the age pension is subject to the political risk thatbenefits could be altered: the budgetary problems caused by population ageing could lead to benefit cuts;on the other hand, electoral pressure from the increasingly elderly electorate could mean benefits are notcut and indeed, could even be increased. Superannuation income, on the other hand, is subject to marketrisk: the value of superannuation assets available to pay for consumption in retirement depends oninvestment returns. This risk is borne by beneficiaries in defined contribution (DC) schemes, the mostcommon arrangement, and by sponsors in defined benefit (DB) schemes. Because the age pension is meanstested, it is automatically inversely related to market returns, reducing the variation in expected retirementincome for persons with DC superannuation schemes and ho expect to receive a part pension. For personswhose DC superannuation benefits are likely either to have no effect on age pension entitlements or todisqualify them from receiving the age pension there is still risk diversification, albeit less than for partpensioners. The small DC superannuation benefits of full pensioners still depend on market returns, whichhave little relation to political risk, while persons with large expected DC superannuation benefits still havethe safety net back-up of the age pension should market returns turn out to be very low. Investment in
18. Service pension or income support supplement.
19. This assumes the current taper rate of 50 per cent for the income test and CPI indexed tax rates.
20. This assumes the current taper rate of 50 per cent for the income test and CPI indexed tax rates.
ECO/WKP(99)9
13
owner-occupied housing also reduces the risk of financing expenditures in retirement as imputed rentalreturns are perfectly correlated with implicit outgoings for rent.
Regulation, size and performance of superannuation funds21
25. The Superannuation Industry (Supervision) Act 1993 stipulates rules in the following areas withwhich superannuation schemes must comply:
− management of the trust structure (the predominant form in which superannuation is offered),with trustees charged with prudent man-agement on behalf of fund members;
− vesting and preservation;
− requirements that member benefits be fully secure and not restricted by lien; and
− obligations to inform members through annual reports detailing benefits, fees and charges,investment strategy and the fund’s financial position.
26. Since its inception in July 1998, the Australian Prudential Regulation Authority (APRA) has beenresponsible for ensuring that superannuation schemes comply with these rules, except those pertaining todisclosure, and more generally with government retirement income policies. Superannuation which takesthe form of a deposit or other capital backed product is prudentially regulated on the same basis as similarproducts. However, where the superannuation benefits promised depend on market returns, as is generallythe case, the focus of regulation is on ensuring that superannuation funds have risk management strategiesand conduct, and administrative systems, which are appropriate to their purpose and which accord withboth government requirements and with the governing investment policies contained in the trust deed.Regulations pertaining to consumer protection and market integrity have been administered by theAustralian Securities and Investments Commission (ASIC) since its inception in July 1998.
27. The assets of superannuation funds are growing quickly in Australia, having more than doubledbetween 1990 and 1996 (Table 9). By comparison, the average increase in the OECD over this period wasonly 11 per cent. Pension fund assets in Australia are now considerably higher than in many OECDcountries, notably in continental Europe, but are lower than in the United States, the United Kingdom, theNetherlands and Switzerland.
28. Long-term returns on pension fund portfolios in Australia, on average, have been rather low byinternational comparison over the period from 1967 to 1990 (Table 10). A factor contributing to thisoutcome may have been that regulation was used to reduce risk by restricting asset choice in Australia upuntil the mid 1980s. Australia since has followed other countries in adopting a ‘‘prudent man’’ approach toregulation, which does not impose quantitative restrictions but rather requires managers to behave ascareful professionals, which should result in higher long-term returns. On the other hand, there is a risk inall OECD countries that population ageing could reduce long-term returns for the ‘‘baby boom’’generation. This is because their high demand to accumulate stocks during middle age may have driven upprices (reduced the equity premium over bond yields) and high net sales when they retire (to a muchsmaller younger generation) could drive down prices.
21. The description of superannuation regulation is based on the Financial Services Inquiry, Final Report,
pp. 332-333.
ECO/WKP(99)9
14
Health care
29. Australia has a universal public medical insurance scheme, known as Medicare. It subsidisesaccess to ambulatory care in the private sector and to pharmaceuticals and finances Medicare-designated(i.e. public) hospitals; they are open to all citizens. In all, government finances about 69 per cent of totalhealth-care expenditures. These outlays are financed from general taxation, supplemented by the Medicarelevy (1.5 per cent of taxable income). Around 60 per cent of public expenditure is used to subsidise accessto private providers in the areas of: community-based medical care; hospital-based medical care;pharmaceutical products; allied health care by optometrists and dentists; domiciliary care; and long-termcare for the elderly. The remaining 40 per cent of public expenditure mainly finances Medicare-designated(i.e. public) hospitals. Private outlays are essentially for out-of-pocket costs (i.e. not reimbursed) andprivate insurance. Pensioners, including part-pensioners, may be eligible for a Pensioner Concession Card,which entitles the holder and dependants to concessional pharmaceuticals and other concessions whichvary in each State and Territory. The Commonwealth Seniors Health Card (CHSC) provides equivalentpharmaceutical concessions to non-pensioners whose income is below the pension income test cut off(around A$ 22 000), but who are not eligible for the pension due to assets. From 1 January 1999, eligibilityfor the CSHC will be determined by a means test based on taxable income. The annual income limit for asingle person will be A$ 40 000, and A$ 67 000 for a couple. It is estimated that up to 220 000 additionalnon-pensioners will be eligible to receive the CHSC.
Long-term care for the elderly
30. A significant and growing part of health-care and related expenditures for the elderly is for long-term care. Government plays the leading role in planning and funding such care. Long-term residential careis available for those elderly people whose level of disability prevents them from remaining in thecommunity, with nursing homes generally catering for the most disabled in this group and hostels for theleast disabled; around half of the nursing homes are run by private for profit providers (47 per cent), whilehostels are almost all run by community and government organisations (98 per cent). Community AgedCare Packages (CACPs) and community services under the Home and Community Care Program (HACC)provide assistance for people who wish to remain, and are able to be supported, in the community. CACPsprovide hostel equivalent care for people with an equivalent level of dependency. The Commonwealthgovernment finances all of these programmes, with state governments also contributing to the HACCprogram. In all, government expenditure on such programmes amounts to A$ 5 billion, 2 ½ per cent oftotal public expenditure. Commonwealth subsidies for long-term residential care cover about ¾ of the costsof such care; residents pay the balance of the costs.
Box 2. User charges for long-term residential care
The Australian government sets the daily care fees which nursing homes and hostels may chargebased on residents’ capacity to pay. Residents are required to pay a basic daily fee (currently A$ 21.69 forpensioners and A$ 27.11 for non pensioners), which is defined as a proportion of the maximum incometested age pension so as to be affordable for all residents. New residents are subject to an additional incometested fee, assessed using the same rules as for the age pension. 65 per cent of residents receive themaximum rate of pension and so will not pay this additional fee. Residents cannot pay more than the costof their care, or a total of three times the basic daily fee if this is lower. Most residents will pay much less.
The government subsidy is the government contribution to the costs of care based on the assessedneeds of residents. The subsidy is reduced by the means tested amount paid by residents. Because thegovernment subsidy falls as resident income increases, there is no incentive for providers to take residentswho pay higher fees. Income testing is expected to finance 2.5 per cent of total residential care expenditureby 2007. Presently, the government subsidy averages A$ 30 000 a year for each nursing home resident, A$8 000 for each hostel resident, and A$ 9 500 for each community care place.
ECO/WKP(99)9
15
Nursing homes and hostels which are certified as meeting set standards of care andaccommodation can charge capital contributions, known as accommodation payments. These payments,which are new for nursing homes, are kept by the provider and must be used for accommodation and carein that facility. Residents are not required to make an accommodation payment which would leave themwith less than a minimum asset level (currently A$ 23 000), amounting to 2.5 times the age pension; assetsfor a married resident are half the couple’s combined assets, and the former home is not included if apartner or dependent child is living in it. There are two types of accommodation payment, depending onwhether people enter a nursing home or hostel level care. Those who benefit from nursing home level caremay pay the accommodation charge, which is an additional fee of up to A$ 12 per day payable for up tofive years from entry, while those who enter a hostel level care may be asked for an accommodation bond,which is generally paid as a lump sum and is largely refundable. The provider retains interest on the bondand a retention amount of up to A$ 2 600 per year for up to five years. Residents can alternatively pay anequivalent periodic payment, or a combination.
31. Over the past 20 years, the Federal Government has introduced reforms aimed at containing thegrowth in nursing home places and shifting the balance of care to more appropriate and less costly forms,in hostels and in the community. Since 1986, the government has operated a needs-based planningframework, which sets long-term targets for the numbers of places to be offered in the different forms oflong-term care. Presently, these targets are for 40 nursing home level places, 50 hostel level places, and 10community care places per 1 000 older people; in 1995, there were 51 nursing home level places and 43hostel level equivalent places (including CACPs) per 1 000 people aged 70 and over. Under the 1986reforms, gate-keeping for long-term care was also introduced. Teams of health professionals called AgedCare Assessment Teams are funded to act as gatekeepers to care, approving applicants for different formsof residential care and community care based on their care needs.
32. Further reforms in long-term care were announced in the Federal Government’s 1996-97 Budget.These are intended to contribute towards the long-term sustainability of funding in the face of populationageing, to recognise the increasing dependency levels of residents and to improve the quality of aged careinfrastructure, particularly some nursing home accommodation. A single resident classification andfunding system has been created, spanning both nursing home and hostel care. The system classifiesresidents’ care needs by degree for the purpose of determining government funding levels. A new systemof accreditation has also been introduced to improve the quality of care and the quality of life for residents.Some nursing home and hostel residents entering care may pay increased charges (in hostels, new residentsmay pay lower fees than under the old arrangements, and the level of accommodation payments for hostelresidents has not been affected) (Box 2).
Economic effects of population ageing under the existing framework
33. Ageing of the population can be expected to have pervasive effects on the economy. Itsconsequences on government finances are discussed first, followed by an analysis of its impact on nationalsaving and on economic growth. It should be borne in mind that the consequences discussed areprojections, not forecasts – unforeseen developments could easily result in quite different out-comes,especially over such long time horizons.
Public finances
34. Government’s financial position is likely to be affected by population ageing, as in particular, itis expected to raise government expenditures on age and related pensions and for health care. A number ofother smaller influences which nevertheless could still be significant are abstracted from in this section.
ECO/WKP(99)9
16
These include: the likely increase in social security payments as the ‘‘baby boom’’ generation passesthrough the 55-64 age group, where labour force participation falls off sharply; unfunded public servicepensions, for which the annual payments to beneficiaries are projected to decline from the current 0.6 percent of GDP owing to the closure of the most generous schemes;22 and possible effects on tax revenues.23
Pension outlays
35. Government outlays on age and related pensions are projected by the RIM Unit to rise by about1½ percentage points of GDP by the middle of next century, to around 4 1½ per cent of GDP (Figure 11).This increase (50 per cent) is modest in relation to the rise in the share of the elderly in the total populationbecause the age pension is means tested and the Superannuation Guarantee will reduce pensionentitlements. As a percentage of GDP, the rise in public pension outlays in Australia (on standardisedassumptions for all OECD countries) is smaller than that in the United States and much smaller than thosein the European Union (EU) or in Japan (Figure 12). This reflects the means-tested nature of the first pillarand that the second pillar of the pension system (the earnings-related component) is funded and privatelymanaged in Australia, whereas in many EU countries and Japan it is largely or totally provided through the(pay-as-you-go) public pension system.
Health care expenditure
36. Government outlays for health care expenditures can be expected to rise as the population agesbecause older people use health-care services more intensively than does the rest of the population(Figure 13). Per person, health-care expenditure for persons aged 65 and over is 3.8 times higher than it isfor persons aged less than 65, rising to 5 times more for persons aged 75 and over. The increase inexpenditure per person with age is greatest for nursing homes and acute hospital services; it should benoted, however, that the nursing home category overstates the increase in health expenditures by agebecause it includes the food and accommodation costs of residents. As much of the increase in expenditureper person with age reflects high spending in the last two years of life (Figure 14), the increase in healthexpenditure caused by population ageing is likely to be considerably smaller than the growing weight ofthe elderly in the total population. The RIM Unit estimates that population ageing will contribute about0.6 percentage point to annual growth in health expenditures over the next two decades, similar to thecontribution over the past 20 years, and a little more subsequently when the proportion of the populationwithin two years of death begins to increase. Overall, assuming that growth in age-adjusted per capitahealth expenditures slows to 1 per cent per annum (the rate since 1996) and that the long-run labourproductivity growth rate remains at around 1.25 per cent, the RIM Unit projects a rise in healthexpenditures by about 2 percentage points of GDP by 2041 (Table 11). This would correspond to an 22. In the case of the Commonwealth Government, which accounts for a little over one half of unfunded public
service pensions, the Commonwealth Superannuation Scheme (CSS) was closed to new members from 1July 1990 and the Public Service Superannuation Scheme (PSS) will (pending the passage of legislation)close to new employees on 1 July 1999. From that date, new Commonwealth employees will be able tohave their employer superannuation paid to an available complying superannuation fund, or RetirementSavings Account of their choice. As at June 1997, the present value of unfunded (Commonwealth andstate) pension liabilities for Australian public servants was about A$ 115.7 billion (22 per cent of GDP).
23. There is much uncertainty about these effects, especially in relation to personal income tax receipts. Sloweremployment growth will reduce growth in wage income, and hence personal income tax receipts but, otherthings being equal, greater scarcity of labour should increase growth in wage rates. The overall effectdepends on which of these effects is greater. Recent (unpublished) OECD estimates for Australia suggestthat they tend to cancel out, leaving the share of wages in national income constant; in other words, theelasticity of substitution (s) between capital and labour in Australia is estimated to be unity.
ECO/WKP(99)9
17
increase in government outlays for health care of about 1.5 percentage points of GDP. Considerably largerincreases would occur if age-adjusted health expenditures per capita were to continue growing at 2 per centper annum, the long-term average rate.
37. On standardised assumptions – including, that per capita health care treatment costs grow by thesame rate as GDP per capita – the OECD projects that government outlays for health care in Australia willincrease by about 2 ½ per cent of GDP by 2030, if costs depend on the proportion of elderly in thepopulation, and by around 3 /4 per cent of GDP if costs depend on the number of deaths, similar to theincreases in many other countries (Table 12). The OECD projected increase for the ‘‘number of theelderly’’ scenario for Australia is higher than in the RIM Unit’s work on the comparable one per cent realper capita growth assumption, where the projected increase in government health outlays by 2031 is 1 percent of GDP. This RIM projection is higher than the OECD projection on a ‘‘number of deaths’’ approach.These differences in part reflect the OECD’s use of different methodologies as well as assumptions whichmay be more realistic for a large number of countries than for individual countries. A difference in thisregard, which tends to reduce the OECD’s ‘‘number of elderly’’ projection, is that it assumes that personsaged 65 will spend a declining proportion of their remaining lives with severe disabilities, attenuating theincrease in the costs of long-term care, whereas there is no evidence to date of such a decline in Australia(Table 13). Indeed, as noted above, there is a risk that there will be greater call on government subsidiesfor long-term care owing to social trends which may reduce the supply of care givers in the home.
Budget balances
38. Overall, Australia’s primary balance (i.e. the government budget balance less net debt interestpayments) is projected to deteriorate by about 3 percentage points of GDP between 2000 and 2030 on theOECD’s standardised assumptions (Table 14). This deterioration is less than in most other OECD countriesthanks to a smaller rise in pension outlays. Allowing for net interest payments, the projected deteriorationin Australia’s budget balance falls to about 1½ per cent of GDP between 2000 and 2030; by contrast, mostother countries’ financial balances deteriorate by more than their primary balances because of the effects ofsnow-balling public debt.
National saving
39. The deterioration in budget balances will lower public saving rates. Uncertainty about what mayhappen to private saving rates, however, makes it difficult to project the overall effect on national savingrates. According to the life cycle theory of consumption, private saving rates should decline as the ‘‘babyboom’’ generation spends savings accumulated during their working lives. However, empirical evidence insupport of the life-cycle model is mixed (Meredith, 1995). A factor which should attenuate any decline inprivate saving in Australia is the maturing of the compulsory superannuation scheme. The RIM Unitestimates that this could contribute about 2.1 per cent of GDP to private saving when the scheme is matureand a little less to national saving.
Overall economic growth
40. The decline in the annual growth of the working-age population (RIM Unit projections) from 1.9per cent in 1992-2000 to 0.3 per cent in the 2020s will lower the annual growth rate of GDP by 1.6percentage points (Figure 15). Assuming labour productivity growth of 1.25 per cent per annum (the RIM
ECO/WKP(99)9
18
Unit’s central assumption and the historical rate since the early 1970s)24 and an unchanged aggregatesaving rate, GDP growth would fall to 1.5 per cent per annum by the 2020s and remain at this rate throughthe middle of the century. On this basis, real growth in GDP per capita would fall to about 1 per cent perannum over 2010-40 as the total population is projected to grow more quickly than the labour force overthis period, in contrast to the situation over recent decades.
41. There is much uncertainty about the possible effects of population ageing on labour productivitygrowth. Greater scarcity of labour could encourage firms to adopt more capital-intensive methods ofproduction, temporarily raising labour productivity growth. On the other hand, the likely decline in thenational saving rate would reduce investment and hence, capital intensity in production. This latter effect isgenerally expected to predominate. However, it is likely to be less significant in Australia than in mostother OECD countries thanks to its healthier budget outlook.
42. A factor which may attenuate the decline in saving available for business investment is areduction in dwellings investment. This might occur as baby boomers move into older age cohorts, slowingthe rate of household formation. Based on projected developments in weighted housing demand,25 whichappears to be related to growth in the dwelling capital stock (Figure 16), demographic factors may reducethe underlying growth of the dwelling stock by up to 1 percentage point (amounting to 1 percentage pointof GDP) over the coming decade, other things being equal. The other major determinant of underlyingdemand for housing is trend growth in income per household. While this has picked up in recent years, it islikely to decline as a result of population ageing. This would further reduce dwelling investment.
Policy implications
43. Population ageing is likely to put pressure on government budgets in the medium term. A declinein public saving could, under certain assumptions, reduce the capital intensity of production, intensifyingthe slowdown in the growth of real income per capita directly caused by population ageing. Any decline inprivate saving could reinforce this process. Future generations could be left with increased tax burdens anda smaller capital stock.
44. The main policy options for government to attenuate these adverse effects are to reduce bothincentives to early retirement and disincentives to late retirement and to implement other reforms whichwould constrain the growth in government expenditures. Insofar as reforms are necessary to governmentprogrammes, early action is preferable as it reduces the eventual scale of the adjustment required and givesfuture retirees more time to make alternative arrangements. These issues are considered in the remainder ofthe chapter.
The retirement decision
45. Labour force participation rates for persons aged 55 and over have fallen sharply in recentdecades (Figure 17). This reflects declining male participation rates (see Figure 6). Should these trends andthose for other age groups continue, males will soon spend more time out of employment than inemployment, while females will continue to spend a high, albeit initially declining proportion of their livesnot in employment (Figure 18). If it were possible to increase labour force participation rates amongst
24. Since the mid-1980s, however, labour productivity growth has averaged 1.5 per cent. It is too early to
know if this reflects an increase in the long-term trend rate of labour productivity growth.
25. This is derived by applying cross sectional estimates of housing consumption estimates by age to ABSprojections of population by age.
ECO/WKP(99)9
19
persons aged 55 and over to the levels recorded in the 1960s, this could offset about one half of the declinein the proportion of the population in employment by 2030, greatly diminishing the economic effects ofpopulation ageing.
46. Declining labour force participation rates for older workers mainly reflect the trend to earlyretirement among males. Between 1960 and 1995, the average age of male retirement (defined aswithdrawing from the labour force at age 45 or more) in Australia has fallen by four years, to 62, despitean unchanged age pension age during this period (Figure 19). This decline and the current average age ofretirement are in line with the OECD average. The average age of female retirement has also declined,although the effect of this on participation rates has been more than offset by the ageing of youngergenerations with greater prior labour force experience (see Figure 6). Only a small minority of peopleretiring early (i.e. before age pension age) from full-time work do so for voluntary work-related reasons26
(Figure 20). Most males retiring early do so involuntarily27 while most females do so for family reasons.28
47. Older males who lose their jobs appear to have great difficulty finding another job. They areunder-represented in new hirings29 (Table 15) and are at great risk of entering long-term unemployment(Table 16) or of withdrawing from the labour force, usually into early retirement. However, the rate of newhires of older males is greater in Australia than in other OECD countries. The decline in labour forceparticipation is most marked for those without tertiary education (Table 17). These trends, which are alsoevident in other OECD countries, mainly seem to be related to the decline in the manufacturing sector.This is reducing the supply of well-paid blue collar jobs, a disproportionate share of which are held byolder workers (declining industries hire fewer young workers). When older workers lose these jobs, theirmain employment options are in the service sector where many are uncompetitive on the basis of basiceducation skills. Faced with the option of a large wage cut to get a new full-time job or either long-termunemployment or early retirement, many older workers prefer the latter options.
48. Early retirement is made more palatable by the variety of social security benefits available toolder workers (and others) without a full-time job. If they are actively seeking a full-time job, they areeligible for the unemployed benefit, known as New Start Allowance. In the event that they withdraw fromthe labour force, they may be eligible for the Mature Age Allowance if they are aged 60 or over but lessthan age pension age. Alternatively, if they have a disability which prevents them from working full-timefor award wages or are blind, they may be eligible for Disability Support Pension.30 All of these benefitsoffer a similar rate of payment, are for a duration limited only by biological factors (reaching age pensionage or death) and are means tested. Recipients of the New Start Allowance and Mature Age Allowance
26. Voluntary work-related reasons include: retired; did not want to work any longer; wanted to work part-
time; early retirement package; and returned to study.
27. Involuntary reasons include: retrenched; job was temporary; own ill health; business closed down;unsatisfactory work arrangements; and employer thought too old.
28. Family reasons include: to get married; pregnancy; to have children; and to look after family, house orsomeone else.
29. A regression equation predicting hiring shares by age, controlling for differences by age in the share ofworkers who actively search for a new job and for other relevant factors, implies that, on average acrossnine EU countries, the share of older workers in recent hires is almost 13 percentage points lower than thatof prime-age workers (OECD, 1998b, p. 144).
30. The proportion of the total population receiving Disability Support Pension has grown rapidly in recentyears, from 2.7 per cent in 1990 to 4.2 per cent in 1996. This has occurred despite the fact that labour-market conditions may not be considered as a factor in the assessment of disability. The proportion ofpeople receiving DSP is highest just before age pension age.
ECO/WKP(99)9
20
may work part-time as may some disability support pensioners, notably participants in the SupportedWages System.
49. Reliance on social security is high amongst male early retirees. Of men who retired 11-20 yearsbefore age pension age, 52 per cent have a social security benefit as their main source of income atretirement (ABS, 1994); this estimate does not include those receiving service pension at service pensionage as early retirees. For those retiring 6-10 years early the corresponding estimate is 37 per cent and forthose retiring up to 5 years early it is 38 per cent. In addition, an unknown number of early retireesreporting superannuation or investment income as a main source were part-rate pensioners or allowees.
50. In view of the causes of early retirement (or long-term unemployment) of males, the mosteffective policy remedies are likely to be those aimed at improving labour market opportunities anddiscouraging premature take-up of social security benefits. Reductions in social security taper rates and theextension of in-work benefits to the low paid without families could be particularly beneficial in thisregard. These measures could encourage more older male workers to work part-time or in low-paid full-time jobs, topping up their incomes with social security benefits. The alternative of reducing social securitybenefits and/or their duration is unlikely to be socially acceptable as this could push some people intopoverty.
51. A deterioration of general skills does not appear to be an important reason for older low-skilledworkers experiencing greater employment difficulties than their younger counterparts. Internationalevidence on workers’ literacy suggests that, adjusting for demographic and economic control variables –including educational attainment – literacy skills generally decline only modestly between the ages of 40and 65 (OECD, 1998b, p. 138). Moreover, even if older low-skilled workers were to gain a vocationalqualification, they would still be at considerable risk of not having a job: the odds of someone aged 55 toage pension age with a skilled vocational qualification being unemployed or not in the labour force are 6 to10. But in the longer term, the higher levels of educational attainment of future cohorts of older workersshould lower rates of early retirement. This effect could be reinforced by greater investment in lifelonglearning, which would help to keep workers’ skills up to date, enhancing adaptability. As older workersmay have to bear more of the labour market adjustment which inevitably occurs as the economy evolvesowing to the declining share of younger workers in the labour force, such adaptability could become moreimportant than ever.
52. A factor contributing to low labour force participation rates for persons aged 65 and over is thatthey are subject to high marginal effective tax rates. Someone qualifying for a part age pension would haveit reduced by 50 cents for every extra dollar earned, bringing the marginal effective tax rate to 66-86 percent (including the medicare levy). So as to reduce the disincentive to late retirement, the governmentintroduced in July 1998 a scheme which provides a bonus to persons who remain in full-time employmentand defer taking up the age pension. The bonus is weighted towards retirement at age 70, at which point itreaches its maximum value. The maximum bonus is currently A$ 21 831 for a single person and A$ 36 428for a couple. The bonus is indexed to movements in the Age pension. The planned tax package would alsoreduce disincentives to late retirement, both lowering marginal income tax rates and by reducing the agepension taper rate to 40 per cent.
Age pension
53. Pension outlays are projected to rise by 1 ½ per cent of GDP by the middle of next century, muchless than the increases projected in most other countries; the increase in Australia is relatively smallbecause the public pension only covers the first pillar of retirement income arrangements, is means testedand compulsory superannuation is steadily maturing, reducing average age pension entitlements. In view of
ECO/WKP(99)9
21
the commitment to maintain the (single rate of) age pension at 25 per cent of male total average weeklyearnings, the main options for avoiding a future increase in taxes to finance these outlays (apart fromavoiding them by deferring retirement) are to raise compulsory superannuation contributions and/or reducescope for dissipation of superannuation benefits, reducing average age pension entitlements, accumulate apublic fund which subsequently could be run down, or increase the proportion of the populationparticipating in the workforce.
54. There is a risk that outlays could be higher than projected if there were to be an increase in therate at which superannuation benefits are dissipated (i.e. an increase in ‘‘double dipping’’). In order to limitthe scope for ‘‘double dipping’’, the preservation age (i.e. the age until which superannuation benefits mustbe preserved in a superannuation fund to qualify for concessional tax treatment) will be raisedprogressively from 55 to 60 between 2015 and 2025. The scope for ‘‘double dipping’’ could be limitedfurther by raising the preservation age to age pension age (65).
55. Another approach to limiting ‘‘double dipping’’ is to shift the balance of effective tax incentives(i.e. allowing for means testing of the age pension) towards taking superannuation benefits as lifetimeincome streams rather than as lump sums. This would reduce the scope to dissipate superannuation benefitsduring the early years of retirement and/or invest them in forms (such as a more expensive home, or afamily trust) which are exempt from the age pension means test. Arrangements for the taxation ofsuperannuation benefits and their treatment in the age pension means test (Box 3) are so complex that it isnot immediately obvious to most people what the incentives are; there is a thriving consulting industryadvising retirees how to take their superannuation benefits so as to minimise effective taxation. Policyneeds to remain attuned to the need to encourage people to use their superannuation benefits to generatesustainable retirement income streams, maximising self reliance. It also would be useful to limit the valueof owner-occupied housing which is exempt from means tests.
Box 3. Effective taxation of superannuation benefits
The taxation of superannuation benefits and their treatment in the age pension means test dependon the form in which they are taken and whether they relate to contributions which were taxedconcessionally. Only benefits which relate to contributions which were taxed concessionally are taxed; allbenefits, however, may potentially be included in the means test for the age pension. Lump sums are taxedat 15 per cent (plus the medicare levy) above a tax-free limit (presently A$ 93 731) up to a ReasonableBenefit Limit (RBL) and then at the highest personal marginal income tax rate. Pensions and annuities,purchased with superannuation monies, up to the RBL are taxed as ordinary income less a 15 per centrebate, with the excess over the RBL being taxed as ordinary income with no rebate. The RBLs for lumpsums and pensions annuities (or where at least half of the benefit is taken as a qualifying income stream)are respectively A$ 471 088 and A$ 942 175. These amounts, and the tax-free limit for lump sums, areindexed to average weekly ordinary time earnings (AWOTE). The RIM Unit estimates that the pensionRBL would be exceeded at the SG contribution rates with a salary of 6.34 times AWOTE over 40 years.
Under the current means-test rules, which came into effect from 20 September 1998, incomestreams are classified and means tested on the basis of their characteristics. Products which provide anincome stream for life or for a fixed term of life expectancy – or at least 15 years where the life expectancyexceeds 15 years – and which meet other requirements set out in the social security legislation (e.g. non-commutable, no residual capital value) are exempt under the social security assets test. All other incomestream products are assets tested. Under the income test, the actual income paid from income streamproducts with a term in excess of five years is assessed, with a deduction allowed based on the purchaseprice. Assessable income from other income stream products is deemed at standard rates.* Where lumpsums are invested in income-earning assets, assessable income is deemed. Such assets are also subject tothe assets test. Pension entitlements are determined by whichever test gives the lower pension.
ECO/WKP(99)9
22
________________* Deemed income is the income an asset is considered to earn, not the actual income earned. Deeming rates are set
from time to time based on market rates of return. They are presently 3 per cent for the first A$ 30 400 of assets ofa single person and A$ 50 600 of assets of a couple and 5 per cent on the remainder of assets. Deeming rates wereintroduced to discourage people from investing in assets with low or zero returns so as to minimise the effects ofmeans testing on their age pension entitlements.
Health care
56. The major risk to government finances in the long-term comes from rising health-careexpenditures. For the most part, this reflects underlying growth in real age-adjusted health-care expenditureper capita;31 population ageing is only expected to contribute about 0.6 percentage point to the annualgrowth rate in health-care expenditures over the next two decades, the same as in the past two decades.Underlying growth in health-care outlays is mainly occurring for ambulatory services covered by theMedicare Benefits Scheme (MBS) for pharmaceuticals, which are subsidised under the PharmaceuticalsBenefits Scheme (PBS). A key factor contributing to the high growth in MBS outlays is that ambulatoryservices are generally provided on a fee-for-service basis. Given that patients are usually not in a positionto judge what treatment they require, the combination of fee-for-service and payment by a third partycreates an incentive for excessive service provision (i.e. there is moral hazard). The main cause of highgrowth in the PBS during the 1990s has been the shift to new higher priced drugs. Other causes have beenthe increase in the proportion of the population eligible for concession cards (and therefore making smallerco-payments) and the rising number of doctors, which has increased the number of prescriptions beingwritten. The most recent reforms aimed at stemming growth in these two schemes have been measureswhich should slow the growth in the number of general practitioners (effective January 1997) and themove to subsidise only a set base price within certain therapeutic groups (drugs that are not chemicallyidentical but which have similar clinical effects, effective February 1998) (OECD Survey of Australia,1998, Chapter III); the price difference between higher priced drugs and the base price must be paid by thepatient, in addition to the usual co-payment. While these measures should slow the growth in outlays, thefundamental drivers of growth remain in place. Further measures which address the moral hazard inherentin current arrangements are likely to be required if a substantial increase in health-care outlays as aproportion of GDP is to be avoided in the long-term.
57. An important initiative in this regard is the co-ordinated care trials presently underway. Co-ordinated care is about enabling health and related professionals to co-ordinate health and communityservices for people with a chronic illness (or multiple service needs) to achieve better outcomes, in termsof health and well-being, within current funding levels. Funds from the MBS, PBS, HACC, state hospitaland community services budgets are pooled in the trials; the amount pooled is based on the best estimatesof what would have been spent on trial participants had there not been a trial. The trials are intended to testwhether better health and well -being outcomes can be achieved for such people within current fundinglevels and whether the pooling of Commonwealth and State funds allows better care co-ordination. Theexpectation is that trials will be able to generate sufficient savings to pay for care co-ordination and fortheir own administration. To achieve these savings, trials aim to:
− reduce unnecessary servicing;
− improve effectiveness, thereby reducing costly institutionalisation;
− improve purchasing arrangements for goods and services; and 31 . The factors driving growth in health-care outlays are discussed more extensively in OECD Economic
Survey of Australia, 1995, Chapter IV. Reforms since then are discussed in OECD Economic Survey ofAustralia, 1998, Chapter III.
ECO/WKP(99)9
23
− better integrate medical workers to allow strategic use of the more costly professions.
The trials are to run from late 1997/early 1998 until December 1999 and a final national evaluation reportis to be prepared in June 2000.
58. Coordinated care could bring substantial benefits to the elderly as they are much more likely thanthe rest of the population to have a chronic illness or to require regular assistance. They would gain accessto paramedical services, such as podiatry, which may be an appropriate part of a treatment package for anelderly person but which currently tend to be under-utilised because they are not covered by the MBS;when care is not coordinated, there is a tendency to substitute more expensive and often less appropriateservices which are covered by the MBS. Coordinated care could also pave the way to increasedprofessionalism in the management of geriatric care.
59. Population ageing is already placing pressures on health care expenditures, and will increase overthe next 30 years as increasing numbers of baby boomers begin entering the ranks of the very elderly. Thiswill contribute to higher mortality- and morbidity rates. Health-care expenditures tend to rise sharply in thelast months of a person’s life mainly because they are frequently hospitalised and receive intensive care:expenditure during the last three months of an elderly person’s life is eight times that for survivors. Thispattern became much more pronounced in the 1980s reflecting enhanced income-earning opportunitieswith the introduction of Medicare and the availability of new techniques, which doctors were ethicallyobliged to use.
60. The other main factor contributing to high outlays towards the end of an elderly person’s life isthat they are often obliged to stay in a nursing home owing to severe disability: some 40 per cent of thoseover 70 will enter residential care in their lifetime, with the average length of stay (usually terminated bydeath or transfer to a hospital, where they die) being about 22 months. The incidence of severe or profounddisability (meaning that daily assistance is required) rises sharply with age: 17 per cent of people aged 65and over have a severe or profound handicap, rising to 41 per cent for people aged 80 and over (ABS,1993). The main cause of disability amongst the very elderly is dementia: approximately 25 per cent of thepopulation aged 85 and over suffers from it. The most recent resident classification data suggests thataround 60 per cent of nursing home residents have dementia, and 28 per cent of hostel residents. Asdementia is age-related, the number of years that people suffer from it may possibly increase as lifeexpectancy rises. Accordingly, the need for long-term residential care is likely to rise in step with growthin the very elderly population.
61. This suggests that the government may eventually have to review its needs-based planningtargets for long-term care. Demand for residential care is also being managed by a change in the balance ofcare to increase the provision of community based care options as an alternative, for example, throughincreased funding for Health and Community Care services. Presently, these provide for a target of 40nursing home level places, 50 hostel level places and 10 community care places per 1 000 people aged 70and over; on the basis of demographic trends, the target number of packages would more than double overthe next 30 years. Changing social patterns also pose a risk to these targets. Changing family structures anddifferentials between male and female life expectancy mean that very old people are increasingly likely tolive alone. In addition, female participation in the labour force is still rising. All of these factors will tendto reduce the supply of spouses and daughters available to care for people with severe and profoundhandicaps (i.e. requiring daily assistance) in the home. Surveys on disability and handicap suggest thatonly about one-third of persons with a severe and profound handicap presently receive government-financed services. This proportion could grow markedly in the medium-term.
62. In the absence of the development of an effective treatment for dementia, large increases inoutlays for long-term care can be expected, especially after 2030. These could be funded by increased
ECO/WKP(99)9
24
taxation, but there are already likely to be other pressures on government finances associated withpopulation ageing. Alternatively, the financing burden could be shifted back to individuals. One approach,recommended by the Commission of Audit, would be to recuperate as much of the subsidies as possiblefrom the estate of the person who received them. But given the inevitable pressures to exempt the familyhome, as occurs in other forms of means testing, this strategy is unlikely to be very successful.Alternatively, individuals could be required to pre-fund long-term care; compulsion would be necessarybecause pre-funding would reduce individuals’ eligibility for government subsidies. This could involveincreased superannuation contributions, which would have to be preserved until either long-term care wasrequired or death, or insurance (including an increase in the Medicare levy now to pre-fund future rises inoutlays for long-term care). The advantage of insurance is that contributions could be lower as they wouldonly have to cover the expected costs of long-term care rather than the actual costs. Given a life-timeprobability of requiring long-term residential care of about 40 per cent, this would make a substantialdifference to the required contribution rates32. On the other hand, Australians are familiar withsuperannuation and have shown a distinct aversion to lifetime annuities, which offer the comparableadvantage of reducing the cost of providing for the risk of longevity (although the unpopularity of lifetimeannuities is partly explained by adverse selection, which makes them expensive, a factor which would notapply to a compulsory insurance scheme). In either case, long phase-in periods would be required to reducethe transitional problem of the generation which pays twice.
63. It also may be possible to enhance the efficiency of supply of long-term care. Presently, there islittle scope for private provision of community-based care. There is no incentive for such care to be paidfor privately. A move to long-term care insurance also could enhance efficiency, as people would be ableto choose their providers rather than being locked into public provision. Insurance-type mechanisms couldalso contribute to greater innovation and diversity in the provision of long-term residential care for thesame reasons. However, considerable care would be required in designing a system so that it did not leadto inappropriate incentives and increased costs.
Concluding remarks
64. A significant challenge for the Australian government is to roll back the trend to early retirementevident in recent decades. This could go a long way towards easing the economic and social problemscaused by population ageing. The government has taken steps to reduce disincentives to late retirement andwill go further in this direction when the tax package is implemented. But more needs to be done to reduceearly retirement. In the short term, the most effective approach could be to increase in-work benefits forlow-paid older workers, thereby encouraging them to accept low paid jobs. This would probably be lesscostly for the government than paying social security benefits to early retirees. In the long term, raisinglevels of educational attainment and increasing investment in lifelong learning should help to increaselabour force participation rates for older persons.
65. Compared with most other OECD countries, the prospective increase in government pensionoutlays in Australia is modest, despite a similar increase in the share of the elderly in the total population.This reflects the facts that the government only provides the first pillar of retirement income arrangements– in contrast to many other OECD countries, where the government also provides the second (income-related) pillar – the age pension is means tested and, with growing superannuation benefits, the average agepension to which retired persons are eligible will decline (as a proportion of wage rates). Concomitantly,Australians are pre-funding an increasing proportion of their retirement incomes through superannuation(i.e. pension funds), which became compulsory in 1992. The projected increase in pension outlays could be
32. At age 65, the life-time probabilities of requiring nursing home care or hostel are respectively 40 per cent
and 25 per cent.

ECO/WKP(99)9
25
avoided altogether by raising compulsory superannuation contributions, which would reduce average agepension entitlements. Alternatively, the increase in pension outlays associated with the retirement of the‘‘baby boom’’ generation could be financed without causing a concurrent rise in taxation by accumulatinga public fund to finance the bulge in outlays. There is also a risk that retirees could take superannuationbenefits as lump sums and dissipate them and/or place them in a form which is sheltered from the agepension means test, thereby increasing the amount of age pension to which they are entitled. This riskcould be reduced by raising the preservation age to age pension age and by limiting the exemption ofowner-occupied housing in the age pension means test.
66. Health-care outlays pose a much greater risk to government finances. This mainly reflectsunderlying growth in age-adjusted expenditure per person and, towards the middle of next century, therising costs of long-term care. To contain these outlays, further reforms which reduce the scope of fee-for-service care under Medicare and which address pressure on long-term care costs are likely to be required.
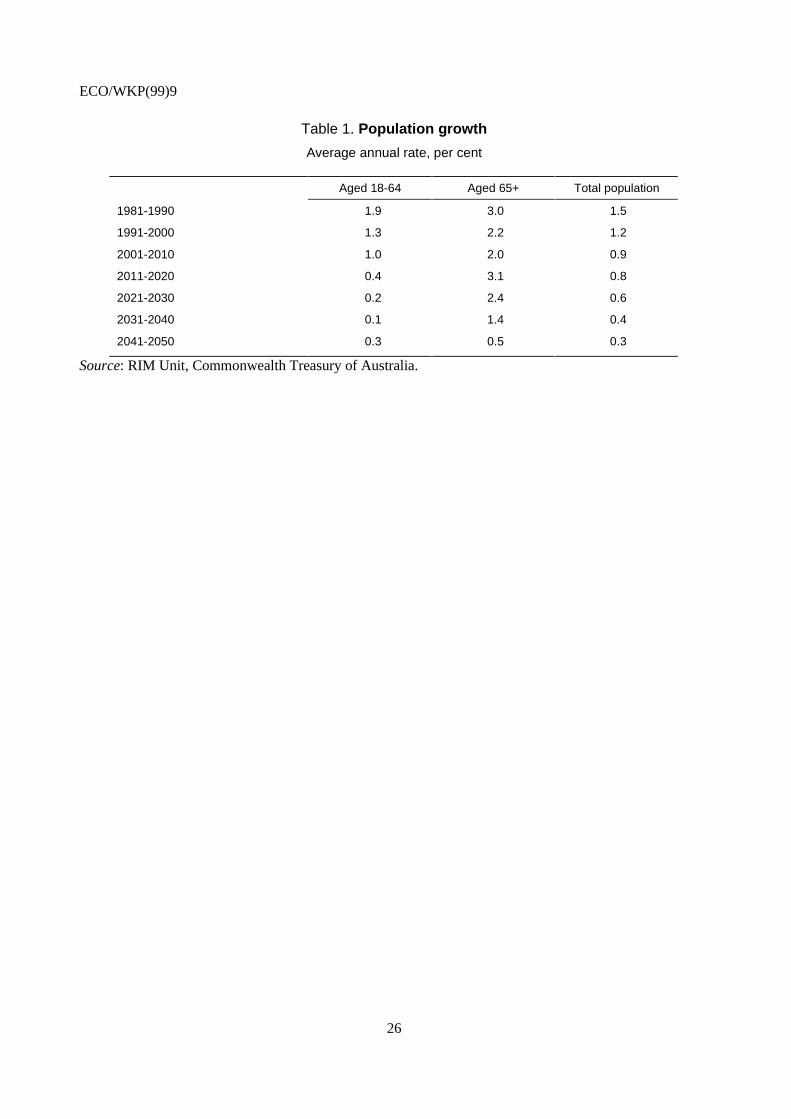
ECO/WKP(99)9
26
Table 1. Population growth
Average annual rate, per cent
Aged 18-64 Aged 65+ Total population
1981-1990 1.9 3.0 1.5
1991-2000 1.3 2.2 1.2
2001-2010 1.0 2.0 0.9
2011-2020 0.4 3.1 0.8
2021-2030 0.2 2.4 0.6
2031-2040 0.1 1.4 0.4
2041-2050 0.3 0.5 0.3
Source: RIM Unit, Commonwealth Treasury of Australia.
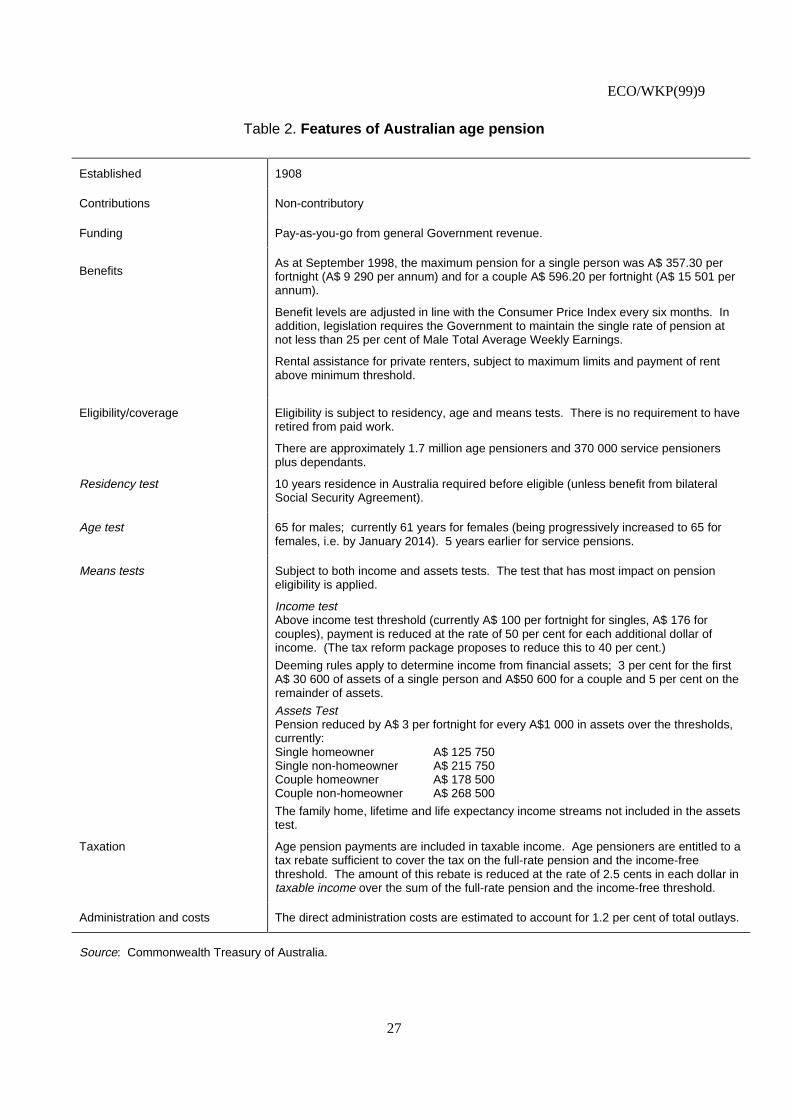
ECO/WKP(99)9
27
Table 2. Features of Australian age pension
Established 1908
Contributions Non-contributory
Funding Pay-as-you-go from general Government revenue.
BenefitsAs at September 1998, the maximum pension for a single person was A$ 357.30 perfortnight (A$ 9 290 per annum) and for a couple A$ 596.20 per fortnight (A$ 15 501 perannum).
Benefit levels are adjusted in line with the Consumer Price Index every six months. Inaddition, legislation requires the Government to maintain the single rate of pension atnot less than 25 per cent of Male Total Average Weekly Earnings.
Rental assistance for private renters, subject to maximum limits and payment of rentabove minimum threshold.
Eligibility/coverage Eligibility is subject to residency, age and means tests. There is no requirement to haveretired from paid work.
There are approximately 1.7 million age pensioners and 370 000 service pensionersplus dependants.
Residency test 10 years residence in Australia required before eligible (unless benefit from bilateralSocial Security Agreement).
Age test 65 for males; currently 61 years for females (being progressively increased to 65 forfemales, i.e. by January 2014). 5 years earlier for service pensions.
Means tests Subject to both income and assets tests. The test that has most impact on pensioneligibility is applied.
Income testAbove income test threshold (currently A$ 100 per fortnight for singles, A$ 176 forcouples), payment is reduced at the rate of 50 per cent for each additional dollar ofincome. (The tax reform package proposes to reduce this to 40 per cent.)
Deeming rules apply to determine income from financial assets; 3 per cent for the firstA$ 30 600 of assets of a single person and A$50 600 for a couple and 5 per cent on theremainder of assets.
Assets TestPension reduced by A$ 3 per fortnight for every A$1 000 in assets over the thresholds,currently:Single homeowner A$ 125 750Single non-homeowner A$ 215 750Couple homeowner A$ 178 500Couple non-homeowner A$ 268 500
The family home, lifetime and life expectancy income streams not included in the assetstest.
Taxation Age pension payments are included in taxable income. Age pensioners are entitled to atax rebate sufficient to cover the tax on the full-rate pension and the income-freethreshold. The amount of this rebate is reduced at the rate of 2.5 cents in each dollar intaxable income over the sum of the full-rate pension and the income-free threshold.
Administration and costs The direct administration costs are estimated to account for 1.2 per cent of total outlays.
Source: Commonwealth Treasury of Australia.
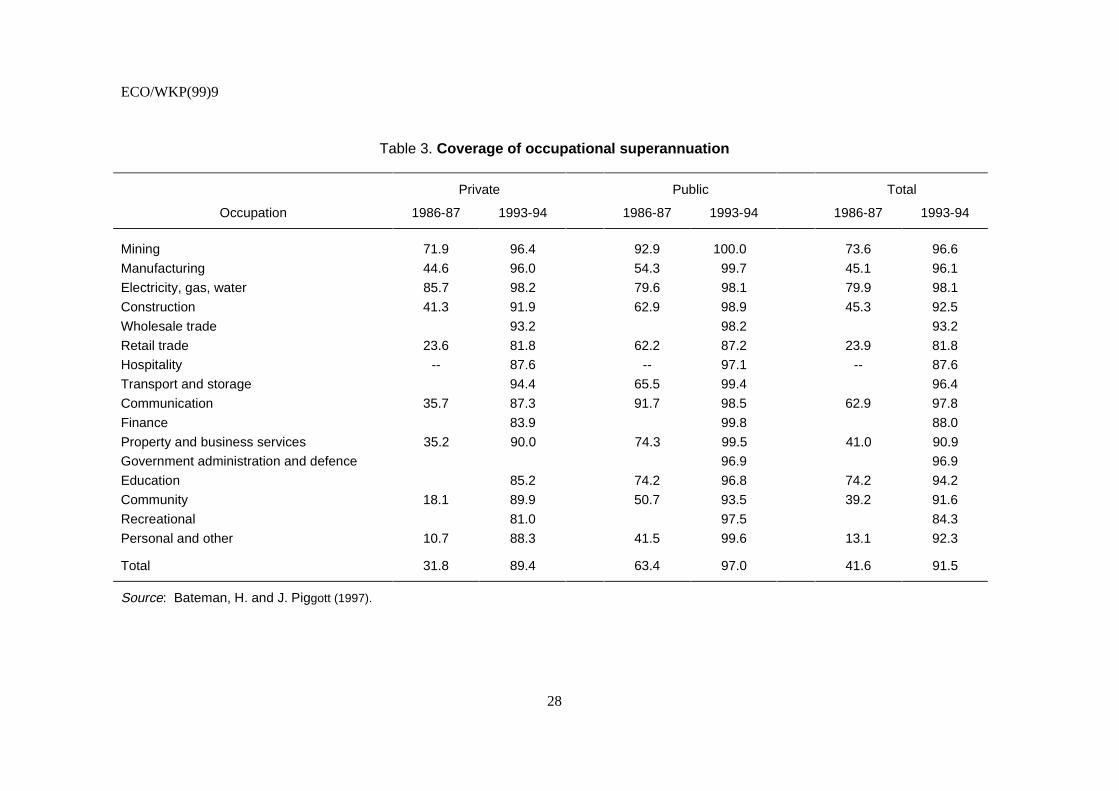
ECO/WKP(99)9
28
Table 3. Coverage of occupational superannuation
Private Public Total
Occupation 1986-87 1993-94 1986-87 1993-94 1986-87 1993-94
Mining 71.9 96.4 92.9 100.0 73.6 96.6
Manufacturing 44.6 96.0 54.3 99.7 45.1 96.1
Electricity, gas, water 85.7 98.2 79.6 98.1 79.9 98.1
Construction 41.3 91.9 62.9 98.9 45.3 92.5
Wholesale trade 93.2 98.2 93.2
Retail trade 23.6 81.8 62.2 87.2 23.9 81.8
Hospitality -- 87.6 -- 97.1 -- 87.6
Transport and storage 94.4 65.5 99.4 96.4
Communication 35.7 87.3 91.7 98.5 62.9 97.8
Finance 83.9 99.8 88.0
Property and business services 35.2 90.0 74.3 99.5 41.0 90.9
Government administration and defence 96.9 96.9
Education 85.2 74.2 96.8 74.2 94.2
Community 18.1 89.9 50.7 93.5 39.2 91.6
Recreational 81.0 97.5 84.3
Personal and other 10.7 88.3 41.5 99.6 13.1 92.3
Total 31.8 89.4 63.4 97.0 41.6 91.5
Source: Bateman, H. and J. Piggott (1997).
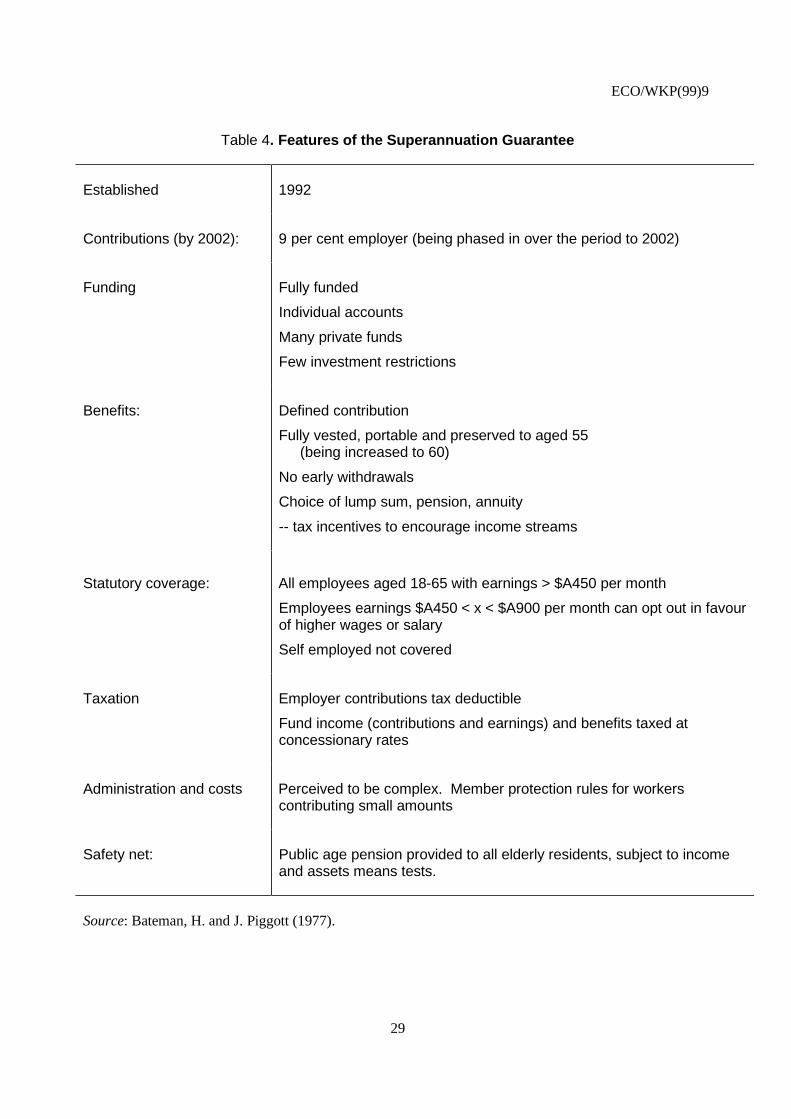
ECO/WKP(99)9
29
Table 4. Features of the Superannuation Guarantee
Established 1992
Contributions (by 2002): 9 per cent employer (being phased in over the period to 2002)
Funding Fully funded
Individual accounts
Many private funds
Few investment restrictions
Benefits: Defined contribution
Fully vested, portable and preserved to aged 55(being increased to 60)
No early withdrawals
Choice of lump sum, pension, annuity
-- tax incentives to encourage income streams
Statutory coverage: All employees aged 18-65 with earnings > $A450 per month
Employees earnings $A450 < x < $A900 per month can opt out in favourof higher wages or salary
Self employed not covered
Taxation Employer contributions tax deductible
Fund income (contributions and earnings) and benefits taxed atconcessionary rates
Administration and costs Perceived to be complex. Member protection rules for workerscontributing small amounts
Safety net: Public age pension provided to all elderly residents, subject to incomeand assets means tests.
Source: Bateman, H. and J. Piggott (1977).
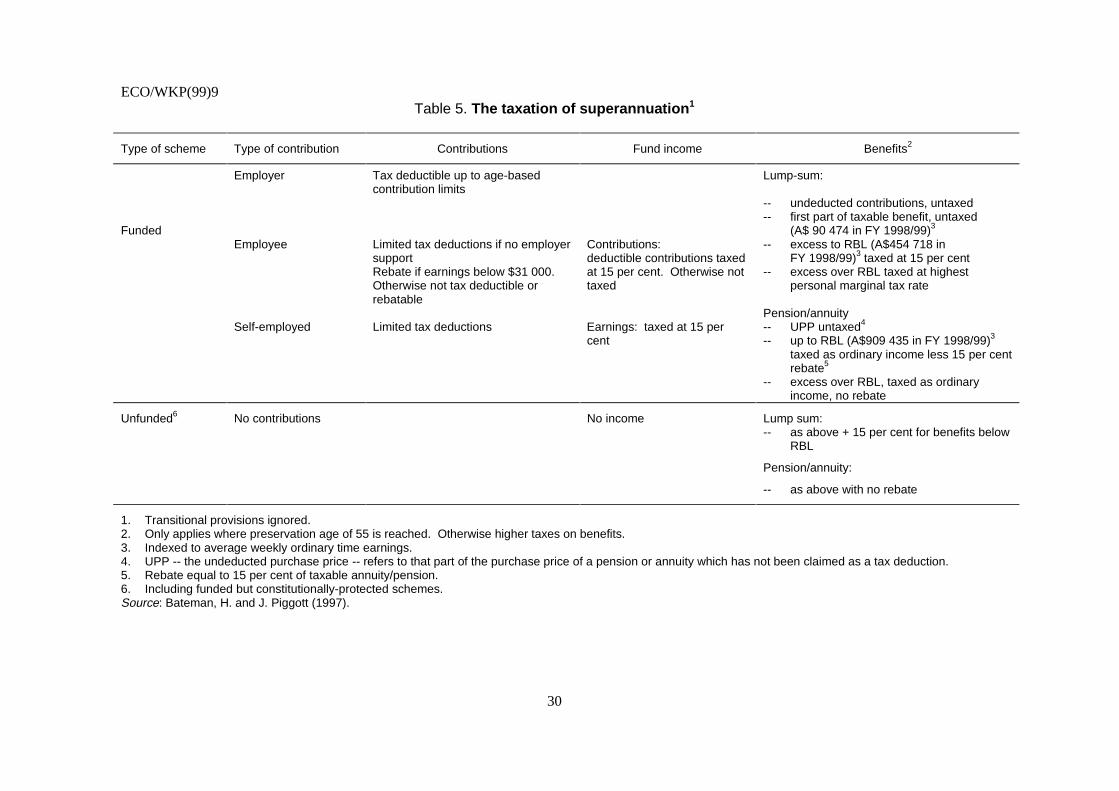
ECO/WKP(99)9
30
Table 5. The taxation of superannuation1
Type of scheme Type of contribution Contributions Fund income Benefits2
Employer Tax deductible up to age-basedcontribution limits
Lump-sum:
FundedEmployee Limited tax deductions if no employer
supportRebate if earnings below $31 000.Otherwise not tax deductible orrebatable
Contributions:deductible contributions taxedat 15 per cent. Otherwise nottaxed
-- undeducted contributions, untaxed-- first part of taxable benefit, untaxed
(A$ 90 474 in FY 1998/99)3
-- excess to RBL (A$454 718 inFY 1998/99)3 taxed at 15 per cent
-- excess over RBL taxed at highestpersonal marginal tax rate
Pension/annuitySelf-employed Limited tax deductions Earnings: taxed at 15 per
cent-- UPP untaxed4
-- up to RBL (A$909 435 in FY 1998/99)3
taxed as ordinary income less 15 per centrebate5
-- excess over RBL, taxed as ordinaryincome, no rebate
Unfunded6 No contributions No income Lump sum:-- as above + 15 per cent for benefits below
RBL
Pension/annuity:
-- as above with no rebate
1. Transitional provisions ignored.2. Only applies where preservation age of 55 is reached. Otherwise higher taxes on benefits.3. Indexed to average weekly ordinary time earnings.4. UPP -- the undeducted purchase price -- refers to that part of the purchase price of a pension or annuity which has not been claimed as a tax deduction.5. Rebate equal to 15 per cent of taxable annuity/pension.6. Including funded but constitutionally-protected schemes.Source: Bateman, H. and J. Piggott (1997).
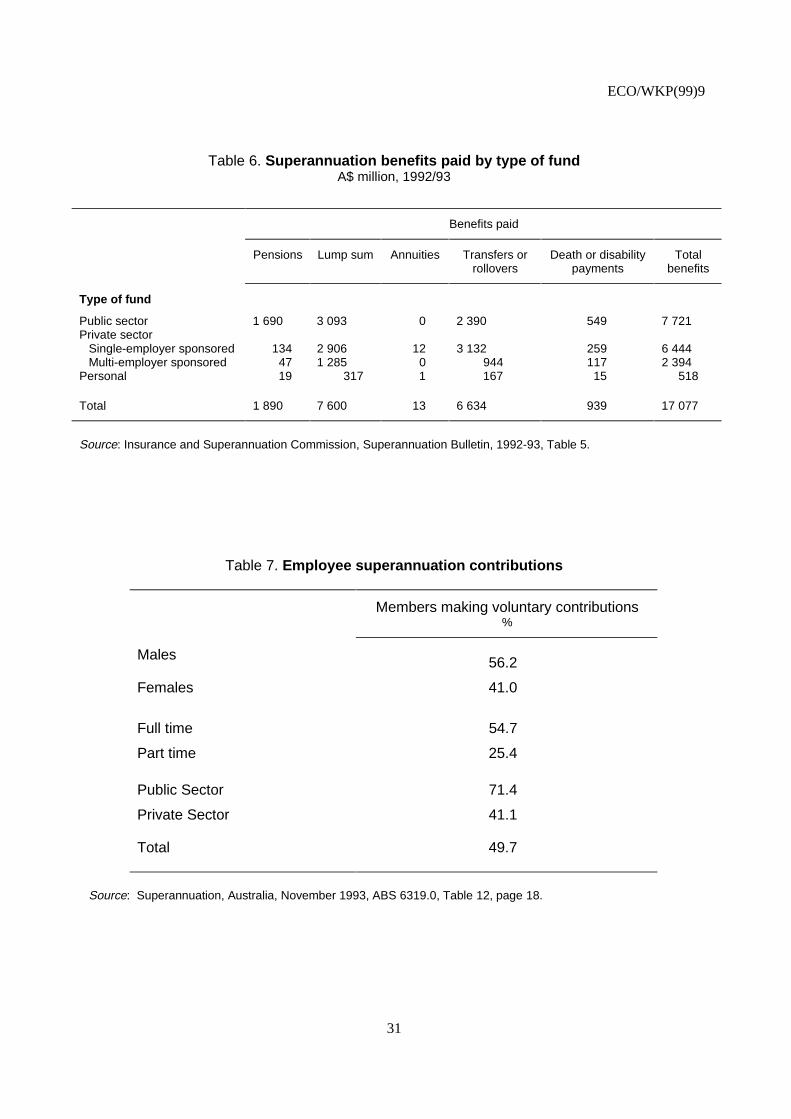
ECO/WKP(99)9
31
Table 6. Superannuation benefits paid by type of fundA$ million, 1992/93
Benefits paid
Pensions Lump sum Annuities Transfers orrollovers
Death or disabilitypayments
Totalbenefits
Type of fund
Public sector 1 690 3 093 0 2 390 549 7 721Private sector
Single-employer sponsored 134 2 906 12 3 132 259 6 444Multi-employer sponsored 47 1 285 0 944 117 2 394
Personal 19 317 1 167 15 518
Total 1 890 7 600 13 6 634 939 17 077
Source: Insurance and Superannuation Commission, Superannuation Bulletin, 1992-93, Table 5.
Table 7. Employee superannuation contributions
Members making voluntary contributions%
Males 56.2
Females 41.0
Full time 54.7
Part time 25.4
Public Sector 71.4
Private Sector 41.1
Total 49.7
Source: Superannuation, Australia, November 1993, ABS 6319.0, Table 12, page 18.
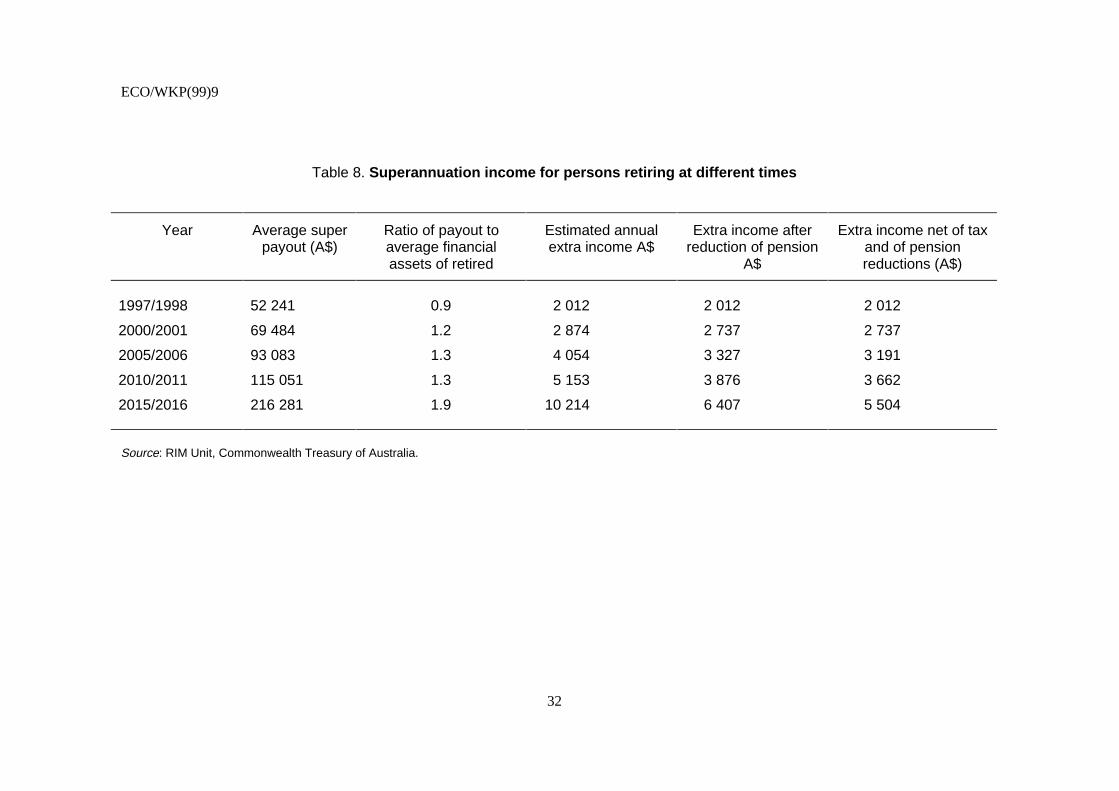
ECO/WKP(99)9
32
Table 8. Superannuation income for persons retiring at different times
Year Average superpayout (A$)
Ratio of payout toaverage financialassets of retired
Estimated annualextra income A$
Extra income afterreduction of pension
A$
Extra income net of taxand of pensionreductions (A$)
1997/1998 52 241 0.9 2 012 2 012 2 012
2000/2001 69 484 1.2 2 874 2 737 2 737
2005/2006 93 083 1.3 4 054 3 327 3 191
2010/2011 115 051 1.3 5 153 3 876 3 662
2015/2016 216 281 1.9 10 214 6 407 5 504
Source: RIM Unit, Commonwealth Treasury of Australia.
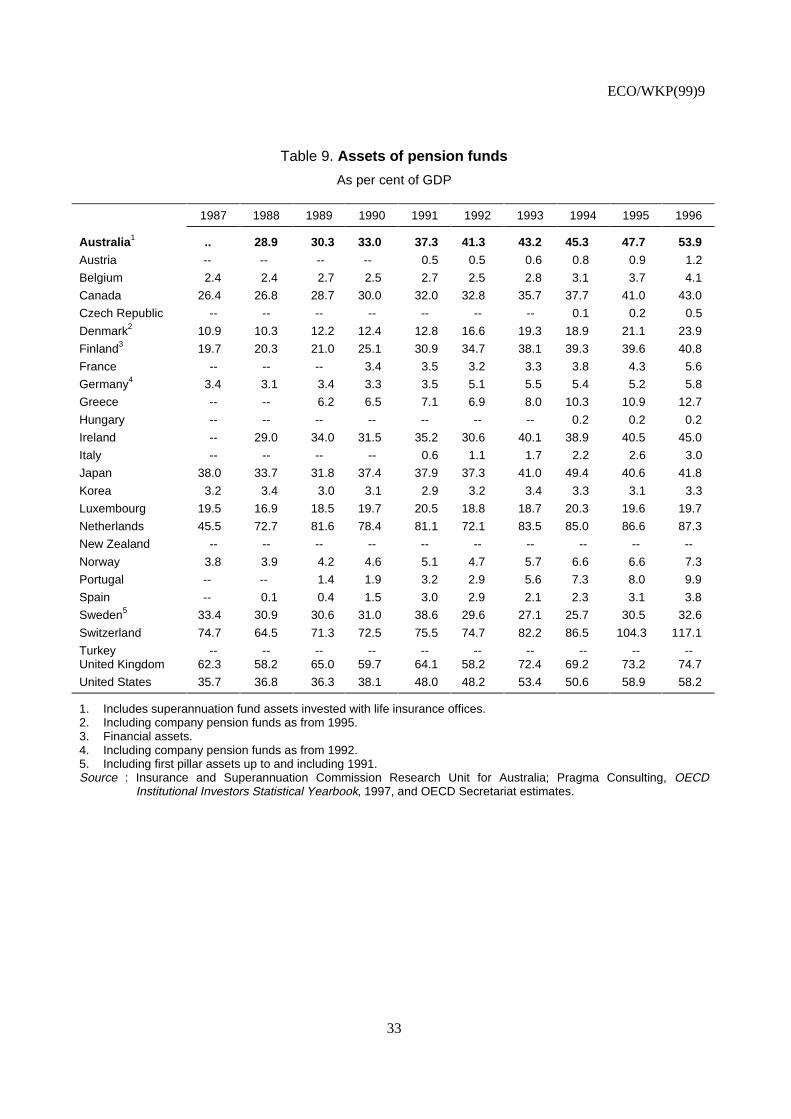
ECO/WKP(99)9
33
Table 9. Assets of pension funds
As per cent of GDP
1987 1988 1989 1990 1991 1992 1993 1994 1995 1996
Australia1 .. 28.9 30.3 33.0 37.3 41.3 43.2 45.3 47.7 53.9
Austria -- -- -- -- 0.5 0.5 0.6 0.8 0.9 1.2
Belgium 2.4 2.4 2.7 2.5 2.7 2.5 2.8 3.1 3.7 4.1
Canada 26.4 26.8 28.7 30.0 32.0 32.8 35.7 37.7 41.0 43.0
Czech Republic -- -- -- -- -- -- -- 0.1 0.2 0.5
Denmark2 10.9 10.3 12.2 12.4 12.8 16.6 19.3 18.9 21.1 23.9
Finland3 19.7 20.3 21.0 25.1 30.9 34.7 38.1 39.3 39.6 40.8
France -- -- -- 3.4 3.5 3.2 3.3 3.8 4.3 5.6
Germany4 3.4 3.1 3.4 3.3 3.5 5.1 5.5 5.4 5.2 5.8
Greece -- -- 6.2 6.5 7.1 6.9 8.0 10.3 10.9 12.7
Hungary -- -- -- -- -- -- -- 0.2 0.2 0.2
Ireland -- 29.0 34.0 31.5 35.2 30.6 40.1 38.9 40.5 45.0
Italy -- -- -- -- 0.6 1.1 1.7 2.2 2.6 3.0
Japan 38.0 33.7 31.8 37.4 37.9 37.3 41.0 49.4 40.6 41.8
Korea 3.2 3.4 3.0 3.1 2.9 3.2 3.4 3.3 3.1 3.3
Luxembourg 19.5 16.9 18.5 19.7 20.5 18.8 18.7 20.3 19.6 19.7
Netherlands 45.5 72.7 81.6 78.4 81.1 72.1 83.5 85.0 86.6 87.3
New Zealand -- -- -- -- -- -- -- -- -- --
Norway 3.8 3.9 4.2 4.6 5.1 4.7 5.7 6.6 6.6 7.3
Portugal -- -- 1.4 1.9 3.2 2.9 5.6 7.3 8.0 9.9
Spain -- 0.1 0.4 1.5 3.0 2.9 2.1 2.3 3.1 3.8
Sweden5 33.4 30.9 30.6 31.0 38.6 29.6 27.1 25.7 30.5 32.6
Switzerland 74.7 64.5 71.3 72.5 75.5 74.7 82.2 86.5 104.3 117.1
Turkey -- -- -- -- -- -- -- -- -- --United Kingdom 62.3 58.2 65.0 59.7 64.1 58.2 72.4 69.2 73.2 74.7
United States 35.7 36.8 36.3 38.1 48.0 48.2 53.4 50.6 58.9 58.2
1. Includes superannuation fund assets invested with life insurance offices.2. Including company pension funds as from 1995.3. Financial assets.4. Including company pension funds as from 1992.5. Including first pillar assets up to and including 1991.Source : Insurance and Superannuation Commission Research Unit for Australia; Pragma Consulting, OECD
Institutional Investors Statistical Yearbook, 1997, and OECD Secretariat estimates.
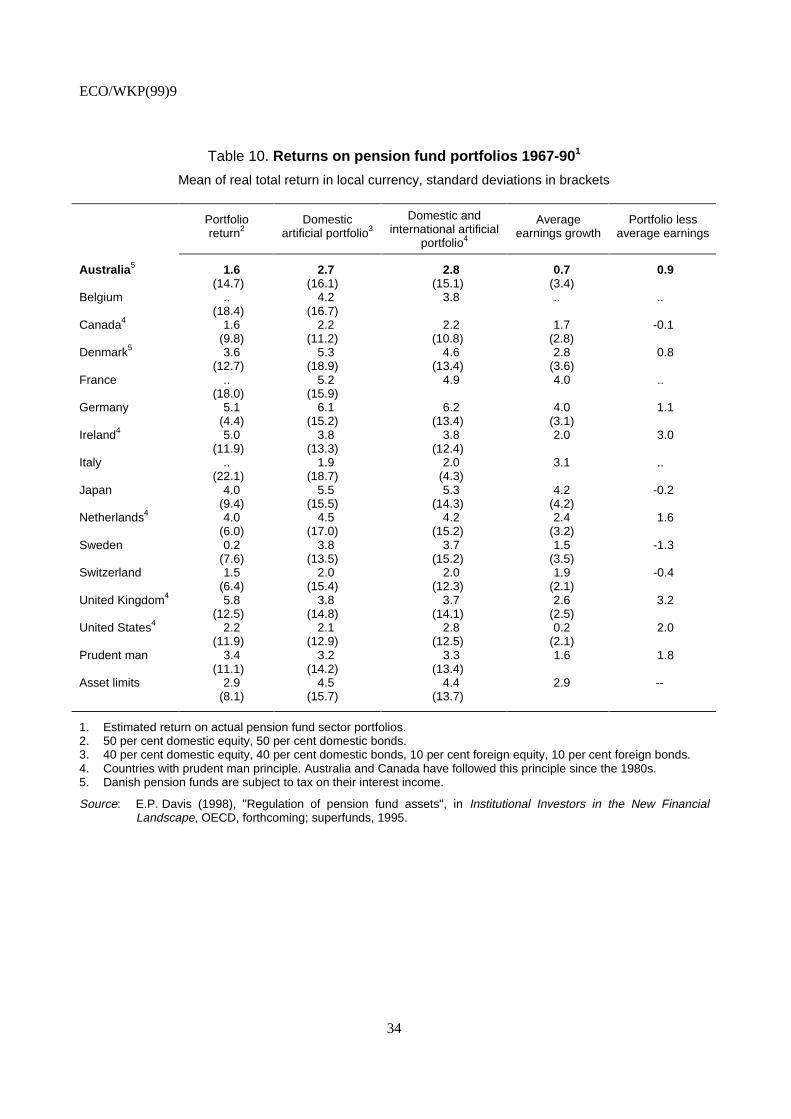
ECO/WKP(99)9
34
Table 10. Returns on pension fund portfolios 1967-901
Mean of real total return in local currency, standard deviations in brackets
Portfolioreturn2
Domesticartificial portfolio3
Domestic andinternational artificial
portfolio4
Averageearnings growth
Portfolio lessaverage earnings
Australia5 1.6 2.7 2.8 0.7 0.9(14.7) (16.1) (15.1) (3.4)
Belgium .. 4.2 3.8 .. ..(18.4) (16.7)
Canada4 1.6 2.2 2.2 1.7 -0.1(9.8) (11.2) (10.8) (2.8)
Denmark5 3.6 5.3 4.6 2.8 0.8(12.7) (18.9) (13.4) (3.6)
France .. 5.2 4.9 4.0 ..(18.0) (15.9)
Germany 5.1 6.1 6.2 4.0 1.1(4.4) (15.2) (13.4) (3.1)
Ireland4 5.0 3.8 3.8 2.0 3.0(11.9) (13.3) (12.4)
Italy .. 1.9 2.0 3.1 ..(22.1) (18.7) (4.3)
Japan 4.0 5.5 5.3 4.2 -0.2(9.4) (15.5) (14.3) (4.2)
Netherlands4 4.0 4.5 4.2 2.4 1.6(6.0) (17.0) (15.2) (3.2)
Sweden 0.2 3.8 3.7 1.5 -1.3(7.6) (13.5) (15.2) (3.5)
Switzerland 1.5 2.0 2.0 1.9 -0.4(6.4) (15.4) (12.3) (2.1)
United Kingdom4 5.8 3.8 3.7 2.6 3.2(12.5) (14.8) (14.1) (2.5)
United States4 2.2 2.1 2.8 0.2 2.0(11.9) (12.9) (12.5) (2.1)
Prudent man 3.4 3.2 3.3 1.6 1.8(11.1) (14.2) (13.4)
Asset limits 2.9 4.5 4.4 2.9 --(8.1) (15.7) (13.7)
1. Estimated return on actual pension fund sector portfolios.2. 50 per cent domestic equity, 50 per cent domestic bonds.3. 40 per cent domestic equity, 40 per cent domestic bonds, 10 per cent foreign equity, 10 per cent foreign bonds.4. Countries with prudent man principle. Australia and Canada have followed this principle since the 1980s.5. Danish pension funds are subject to tax on their interest income.
Source: E.P. Davis (1998), "Regulation of pension fund assets", in Institutional Investors in the New FinancialLandscape, OECD, forthcoming; superfunds, 1995.

ECO/WKP(99)9
35
Table 11. Projections of total health costs under various assumptions
Per cent of GDP
Real annual growth rate in age-adjusted percapita health expenditures
Productivity growth per annum 2031 2041
1% 2% 1% 2%
1 10.7 15.9 11.7 19.11.25 9.8 14.5 10.4 17.01.5 8.9 13.2 9.3 15.1
Source: RIM Unit, Commonwealth Treasury of Australia.
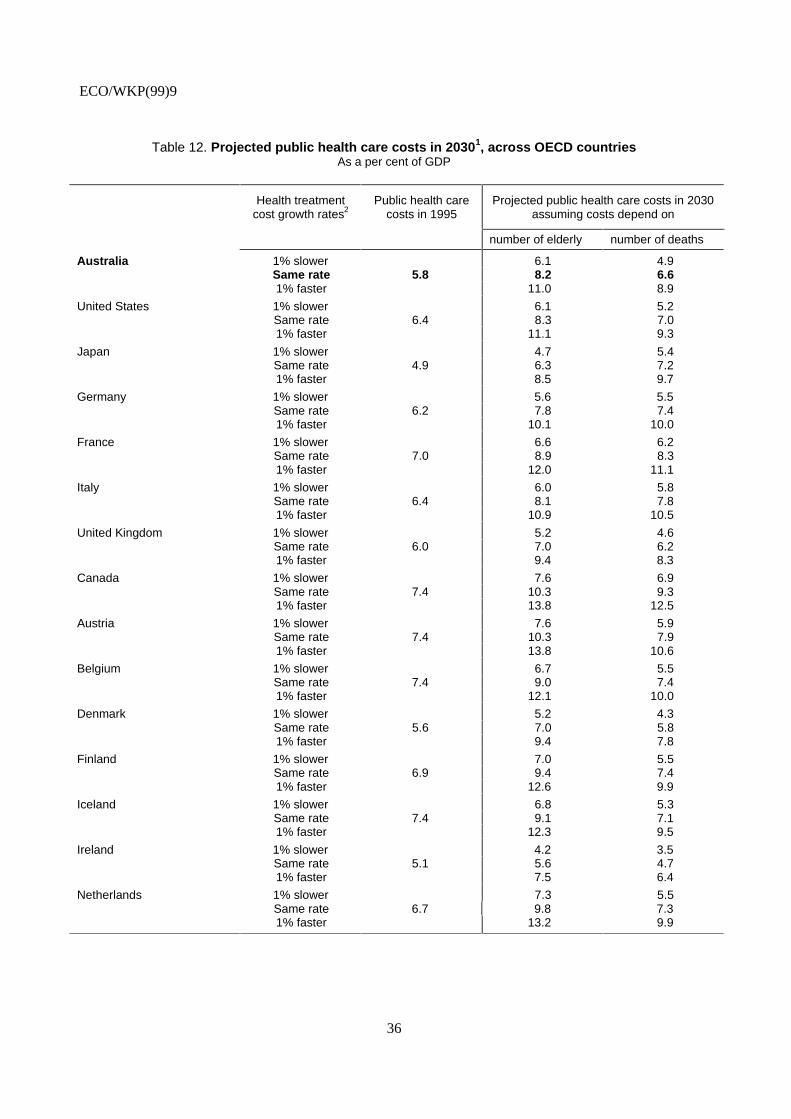
ECO/WKP(99)9
36
Table 12. Projected public health care costs in 20301, across OECD countriesAs a per cent of GDP
Health treatmentcost growth rates2
Public health carecosts in 1995
Projected public health care costs in 2030assuming costs depend on
number of elderly number of deaths
Australia 1% slower 6.1 4.9Same rate 5.8 8.2 6.61% faster 11.0 8.9
United States 1% slower 6.1 5.2Same rate 6.4 8.3 7.01% faster 11.1 9.3
Japan 1% slower 4.7 5.4Same rate 4.9 6.3 7.21% faster 8.5 9.7
Germany 1% slower 5.6 5.5Same rate 6.2 7.8 7.41% faster 10.1 10.0
France 1% slower 6.6 6.2Same rate 7.0 8.9 8.31% faster 12.0 11.1
Italy 1% slower 6.0 5.8Same rate 6.4 8.1 7.81% faster 10.9 10.5
United Kingdom 1% slower 5.2 4.6Same rate 6.0 7.0 6.21% faster 9.4 8.3
Canada 1% slower 7.6 6.9Same rate 7.4 10.3 9.31% faster 13.8 12.5
Austria 1% slower 7.6 5.9Same rate 7.4 10.3 7.91% faster 13.8 10.6
Belgium 1% slower 6.7 5.5Same rate 7.4 9.0 7.41% faster 12.1 10.0
Denmark 1% slower 5.2 4.3Same rate 5.6 7.0 5.81% faster 9.4 7.8
Finland 1% slower 7.0 5.5Same rate 6.9 9.4 7.41% faster 12.6 9.9
Iceland 1% slower 6.8 5.3Same rate 7.4 9.1 7.11% faster 12.3 9.5
Ireland 1% slower 4.2 3.5Same rate 5.1 5.6 4.71% faster 7.5 6.4
Netherlands 1% slower 7.3 5.5Same rate 6.7 9.8 7.31% faster 13.2 9.9
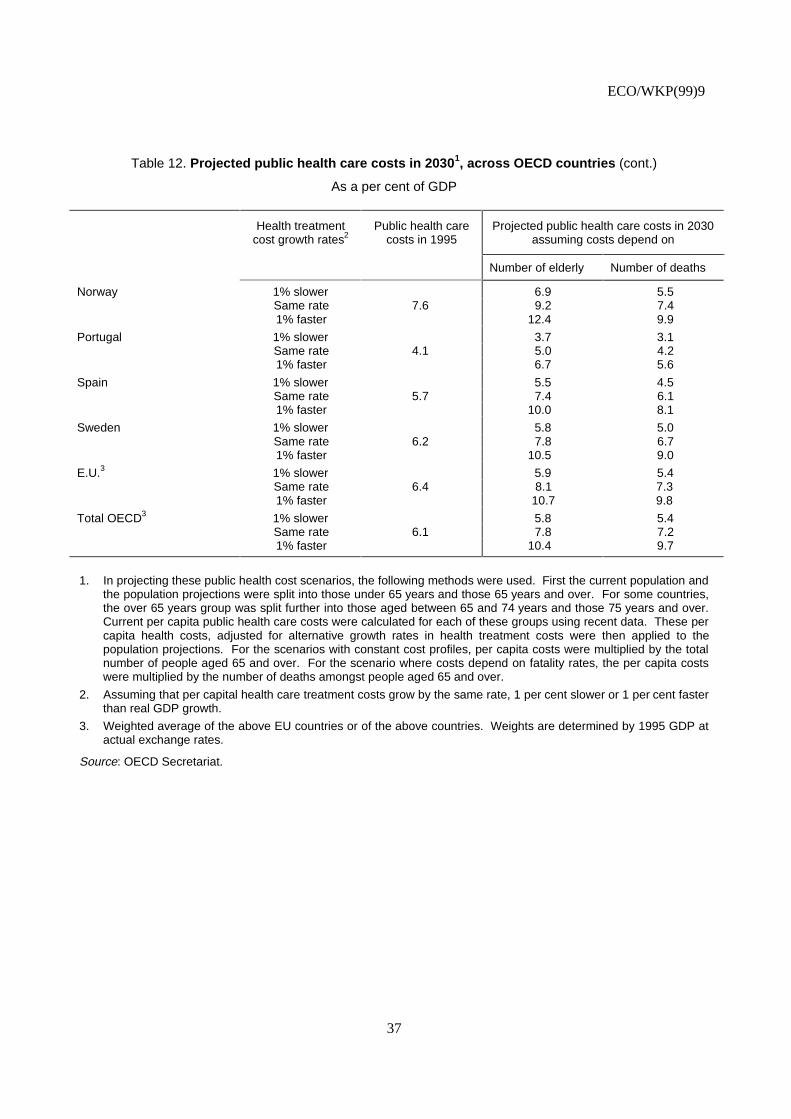
ECO/WKP(99)9
37
Table 12. Projected public health care costs in 20301, across OECD countries (cont.)
As a per cent of GDP
Health treatmentcost growth rates2
Public health carecosts in 1995
Projected public health care costs in 2030assuming costs depend on
Number of elderly Number of deaths
Norway 1% slower 6.9 5.5Same rate 7.6 9.2 7.41% faster 12.4 9.9
Portugal 1% slower 3.7 3.1Same rate 4.1 5.0 4.21% faster 6.7 5.6
Spain 1% slower 5.5 4.5Same rate 5.7 7.4 6.11% faster 10.0 8.1
Sweden 1% slower 5.8 5.0Same rate 6.2 7.8 6.71% faster 10.5 9.0
E.U.3 1% slower 5.9 5.4Same rate 6.4 8.1 7.31% faster 10.7 9.8
Total OECD3 1% slower 5.8 5.4Same rate 6.1 7.8 7.21% faster 10.4 9.7
1. In projecting these public health cost scenarios, the following methods were used. First the current population andthe population projections were split into those under 65 years and those 65 years and over. For some countries,the over 65 years group was split further into those aged between 65 and 74 years and those 75 years and over.Current per capita public health care costs were calculated for each of these groups using recent data. These percapita health costs, adjusted for alternative growth rates in health treatment costs were then applied to thepopulation projections. For the scenarios with constant cost profiles, per capita costs were multiplied by the totalnumber of people aged 65 and over. For the scenario where costs depend on fatality rates, the per capita costswere multiplied by the number of deaths amongst people aged 65 and over.
2. Assuming that per capital health care treatment costs grow by the same rate, 1 per cent slower or 1 per cent fasterthan real GDP growth.
3. Weighted average of the above EU countries or of the above countries. Weights are determined by 1995 GDP atactual exchange rates.
Source: OECD Secretariat.
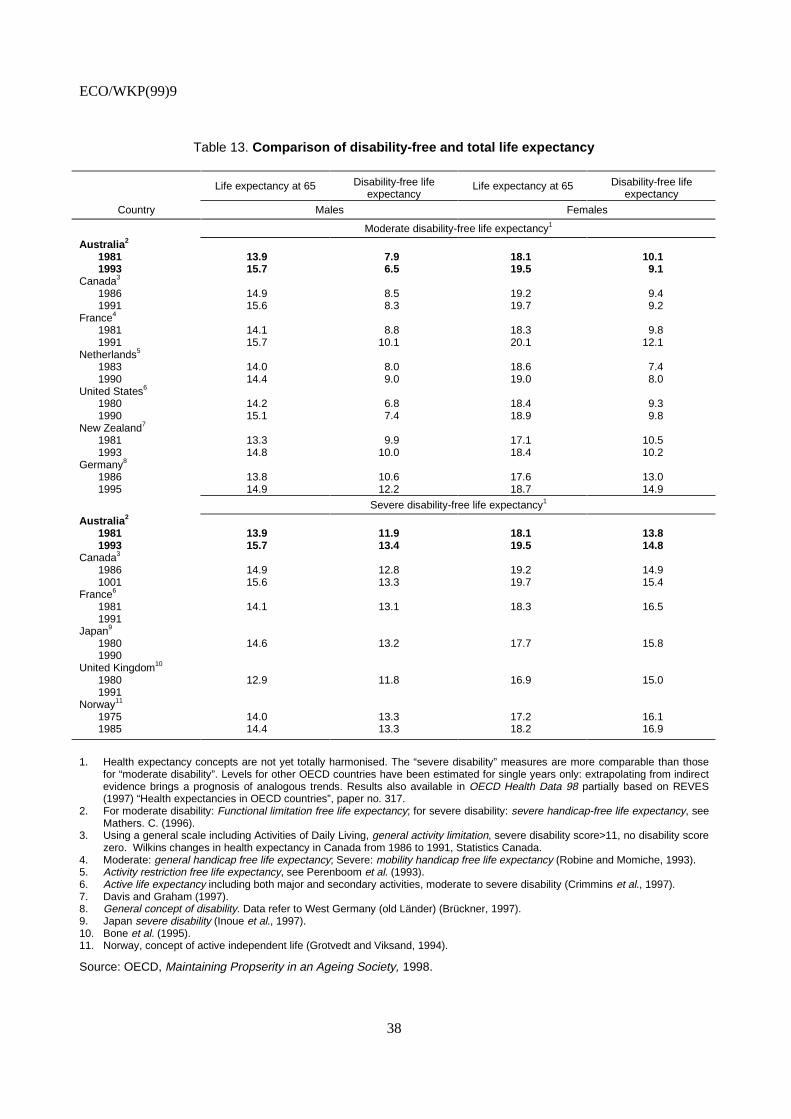
ECO/WKP(99)9
38
Table 13. Comparison of disability-free and total life expectancy
Life expectancy at 65 Disability-free lifeexpectancy
Life expectancy at 65 Disability-free lifeexpectancy
Country Males Females
Moderate disability-free life expectancy1
Australia2
1981 13.9 7.9 18.1 10.11993 15.7 6.5 19.5 9.1
Canada3
1986 14.9 8.5 19.2 9.41991 15.6 8.3 19.7 9.2
France4
1981 14.1 8.8 18.3 9.81991 15.7 10.1 20.1 12.1
Netherlands5
1983 14.0 8.0 18.6 7.41990 14.4 9.0 19.0 8.0
United States6
1980 14.2 6.8 18.4 9.31990 15.1 7.4 18.9 9.8
New Zealand7
1981 13.3 9.9 17.1 10.51993 14.8 10.0 18.4 10.2
Germany8
1986 13.8 10.6 17.6 13.01995 14.9 12.2 18.7 14.9
Severe disability-free life expectancy1
Australia2
1981 13.9 11.9 18.1 13.81993 15.7 13.4 19.5 14.8
Canada3
1986 14.9 12.8 19.2 14.91001 15.6 13.3 19.7 15.4
France6
1981 14.1 13.1 18.3 16.51991
Japan9
1980 14.6 13.2 17.7 15.81990
United Kingdom10
1980 12.9 11.8 16.9 15.01991
Norway11
1975 14.0 13.3 17.2 16.11985 14.4 13.3 18.2 16.9
1. Health expectancy concepts are not yet totally harmonised. The “severe disability” measures are more comparable than thosefor “moderate disability”. Levels for other OECD countries have been estimated for single years only: extrapolating from indirectevidence brings a prognosis of analogous trends. Results also available in OECD Health Data 98 partially based on REVES(1997) “Health expectancies in OECD countries”, paper no. 317.
2. For moderate disability: Functional limitation free life expectancy; for severe disability: severe handicap-free life expectancy, seeMathers. C. (1996).
3. Using a general scale including Activities of Daily Living, general activity limitation, severe disability score>11, no disability scorezero. Wilkins changes in health expectancy in Canada from 1986 to 1991, Statistics Canada.
4. Moderate: general handicap free life expectancy; Severe: mobility handicap free life expectancy (Robine and Momiche, 1993).5. Activity restriction free life expectancy, see Perenboom et al. (1993).6. Active life expectancy including both major and secondary activities, moderate to severe disability (Crimmins et al., 1997).7. Davis and Graham (1997).8. General concept of disability. Data refer to West Germany (old Länder) (Brückner, 1997).9. Japan severe disability (Inoue et al., 1997).10. Bone et al. (1995).11. Norway, concept of active independent life (Grotvedt and Viksand, 1994).
Source: OECD, Maintaining Propserity in an Ageing Society, 1998.
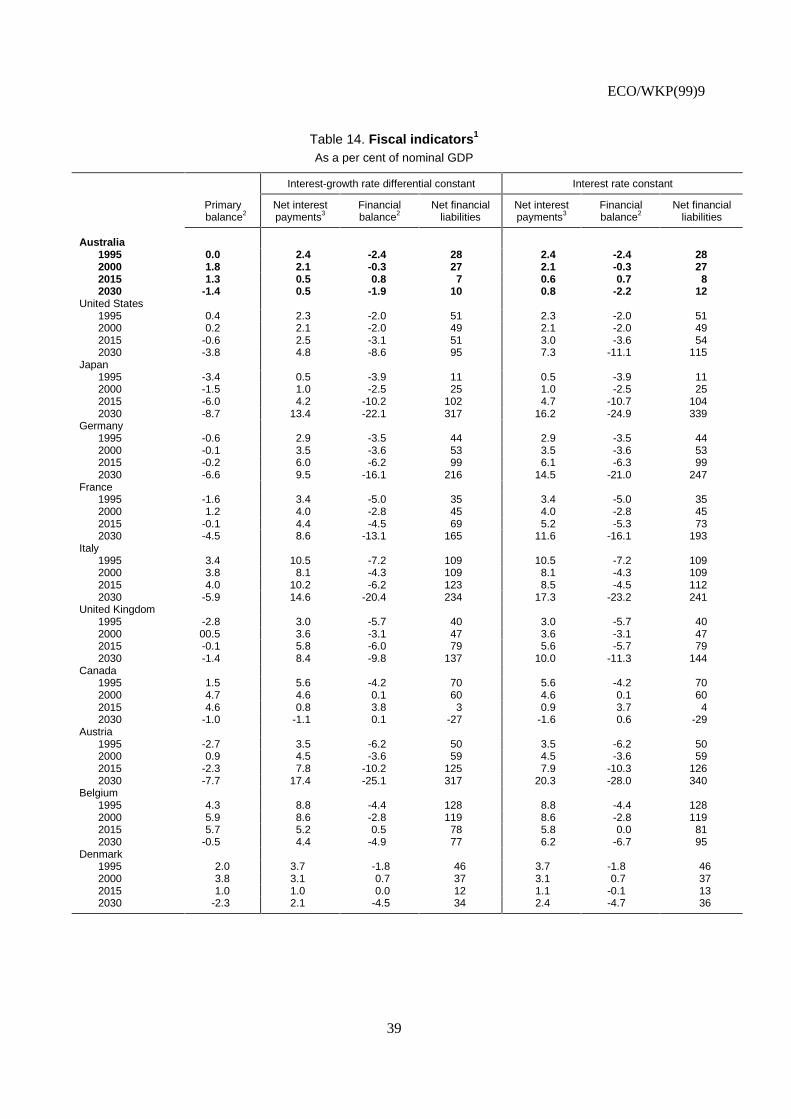
ECO/WKP(99)9
39
Table 14. Fiscal indicators1
As a per cent of nominal GDP
Interest-growth rate differential constant Interest rate constant
Primarybalance2
Net interestpayments3
Financialbalance2
Net financialliabilities
Net interestpayments3
Financialbalance2
Net financialliabilities
Australia1995 0.0 2.4 -2.4 28 2.4 -2.4 282000 1.8 2.1 -0.3 27 2.1 -0.3 272015 1.3 0.5 0.8 7 0.6 0.7 82030 -1.4 0.5 -1.9 10 0.8 -2.2 12
United States1995 0.4 2.3 -2.0 51 2.3 -2.0 512000 0.2 2.1 -2.0 49 2.1 -2.0 492015 -0.6 2.5 -3.1 51 3.0 -3.6 542030 -3.8 4.8 -8.6 95 7.3 -11.1 115
Japan1995 -3.4 0.5 -3.9 11 0.5 -3.9 112000 -1.5 1.0 -2.5 25 1.0 -2.5 252015 -6.0 4.2 -10.2 102 4.7 -10.7 1042030 -8.7 13.4 -22.1 317 16.2 -24.9 339
Germany1995 -0.6 2.9 -3.5 44 2.9 -3.5 442000 -0.1 3.5 -3.6 53 3.5 -3.6 532015 -0.2 6.0 -6.2 99 6.1 -6.3 992030 -6.6 9.5 -16.1 216 14.5 -21.0 247
France1995 -1.6 3.4 -5.0 35 3.4 -5.0 352000 1.2 4.0 -2.8 45 4.0 -2.8 452015 -0.1 4.4 -4.5 69 5.2 -5.3 732030 -4.5 8.6 -13.1 165 11.6 -16.1 193
Italy1995 3.4 10.5 -7.2 109 10.5 -7.2 1092000 3.8 8.1 -4.3 109 8.1 -4.3 1092015 4.0 10.2 -6.2 123 8.5 -4.5 1122030 -5.9 14.6 -20.4 234 17.3 -23.2 241
United Kingdom1995 -2.8 3.0 -5.7 40 3.0 -5.7 402000 00.5 3.6 -3.1 47 3.6 -3.1 472015 -0.1 5.8 -6.0 79 5.6 -5.7 792030 -1.4 8.4 -9.8 137 10.0 -11.3 144
Canada1995 1.5 5.6 -4.2 70 5.6 -4.2 702000 4.7 4.6 0.1 60 4.6 0.1 602015 4.6 0.8 3.8 3 0.9 3.7 42030 -1.0 -1.1 0.1 -27 -1.6 0.6 -29
Austria1995 -2.7 3.5 -6.2 50 3.5 -6.2 502000 0.9 4.5 -3.6 59 4.5 -3.6 592015 -2.3 7.8 -10.2 125 7.9 -10.3 1262030 -7.7 17.4 -25.1 317 20.3 -28.0 340
Belgium1995 4.3 8.8 -4.4 128 8.8 -4.4 1282000 5.9 8.6 -2.8 119 8.6 -2.8 1192015 5.7 5.2 0.5 78 5.8 0.0 812030 -0.5 4.4 -4.9 77 6.2 -6.7 95
Denmark1995 2.0 3.7 -1.8 46 3.7 -1.8 462000 3.8 3.1 0.7 37 3.1 0.7 372015 1.0 1.0 0.0 12 1.1 -0.1 132030 -2.3 2.1 -4.5 34 2.4 -4.7 36
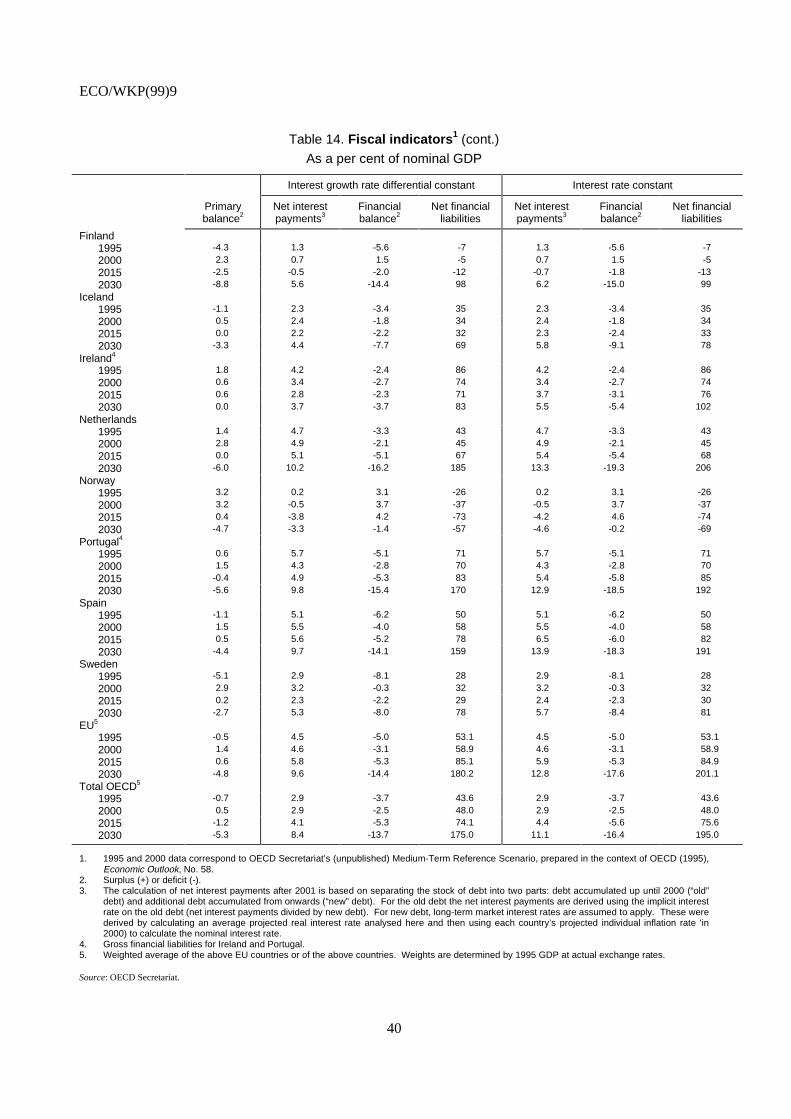
ECO/WKP(99)9
40
Table 14. Fiscal indicators1 (cont.)
As a per cent of nominal GDP
Interest growth rate differential constant Interest rate constant
Primarybalance2
Net interestpayments3
Financialbalance2
Net financialliabilities
Net interestpayments3
Financialbalance2
Net financialliabilities
Finland1995 -4.3 1.3 -5.6 -7 1.3 -5.6 -7
2000 2.3 0.7 1.5 -5 0.7 1.5 -5
2015 -2.5 -0.5 -2.0 -12 -0.7 -1.8 -13
2030 -8.8 5.6 -14.4 98 6.2 -15.0 99
Iceland1995 -1.1 2.3 -3.4 35 2.3 -3.4 35
2000 0.5 2.4 -1.8 34 2.4 -1.8 34
2015 0.0 2.2 -2.2 32 2.3 -2.4 33
2030 -3.3 4.4 -7.7 69 5.8 -9.1 78
Ireland4
1995 1.8 4.2 -2.4 86 4.2 -2.4 86
2000 0.6 3.4 -2.7 74 3.4 -2.7 74
2015 0.6 2.8 -2.3 71 3.7 -3.1 76
2030 0.0 3.7 -3.7 83 5.5 -5.4 102
Netherlands1995 1.4 4.7 -3.3 43 4.7 -3.3 43
2000 2.8 4.9 -2.1 45 4.9 -2.1 45
2015 0.0 5.1 -5.1 67 5.4 -5.4 68
2030 -6.0 10.2 -16.2 185 13.3 -19.3 206
Norway1995 3.2 0.2 3.1 -26 0.2 3.1 -26
2000 3.2 -0.5 3.7 -37 -0.5 3.7 -37
2015 0.4 -3.8 4.2 -73 -4.2 4.6 -74
2030 -4.7 -3.3 -1.4 -57 -4.6 -0.2 -69
Portugal4
1995 0.6 5.7 -5.1 71 5.7 -5.1 71
2000 1.5 4.3 -2.8 70 4.3 -2.8 70
2015 -0.4 4.9 -5.3 83 5.4 -5.8 85
2030 -5.6 9.8 -15.4 170 12.9 -18.5 192
Spain1995 -1.1 5.1 -6.2 50 5.1 -6.2 50
2000 1.5 5.5 -4.0 58 5.5 -4.0 58
2015 0.5 5.6 -5.2 78 6.5 -6.0 82
2030 -4.4 9.7 -14.1 159 13.9 -18.3 191
Sweden1995 -5.1 2.9 -8.1 28 2.9 -8.1 28
2000 2.9 3.2 -0.3 32 3.2 -0.3 32
2015 0.2 2.3 -2.2 29 2.4 -2.3 30
2030 -2.7 5.3 -8.0 78 5.7 -8.4 81
EU5
1995 -0.5 4.5 -5.0 53.1 4.5 -5.0 53.1
2000 1.4 4.6 -3.1 58.9 4.6 -3.1 58.9
2015 0.6 5.8 -5.3 85.1 5.9 -5.3 84.9
2030 -4.8 9.6 -14.4 180.2 12.8 -17.6 201.1
Total OECD5
1995 -0.7 2.9 -3.7 43.6 2.9 -3.7 43.6
2000 0.5 2.9 -2.5 48.0 2.9 -2.5 48.0
2015 -1.2 4.1 -5.3 74.1 4.4 -5.6 75.6
2030 -5.3 8.4 -13.7 175.0 11.1 -16.4 195.0
1. 1995 and 2000 data correspond to OECD Secretariat’s (unpublished) Medium-Term Reference Scenario, prepared in the context of OECD (1995),Economic Outlook, No. 58.
2. Surplus (+) or deficit (-).3. The calculation of net interest payments after 2001 is based on separating the stock of debt into two parts: debt accumulated up until 2000 (“old”
debt) and additional debt accumulated from onwards (“new” debt). For the old debt the net interest payments are derived using the implicit interestrate on the old debt (net interest payments divided by new debt). For new debt, long-term market interest rates are assumed to apply. These werederived by calculating an average projected real interest rate analysed here and then using each country’s projected individual inflation rate ‘in2000) to calculate the nominal interest rate.
4. Gross financial liabilities for Ireland and Portugal.5. Weighted average of the above EU countries or of the above countries. Weights are determined by 1995 GDP at actual exchange rates.
Source: OECD Secretariat.
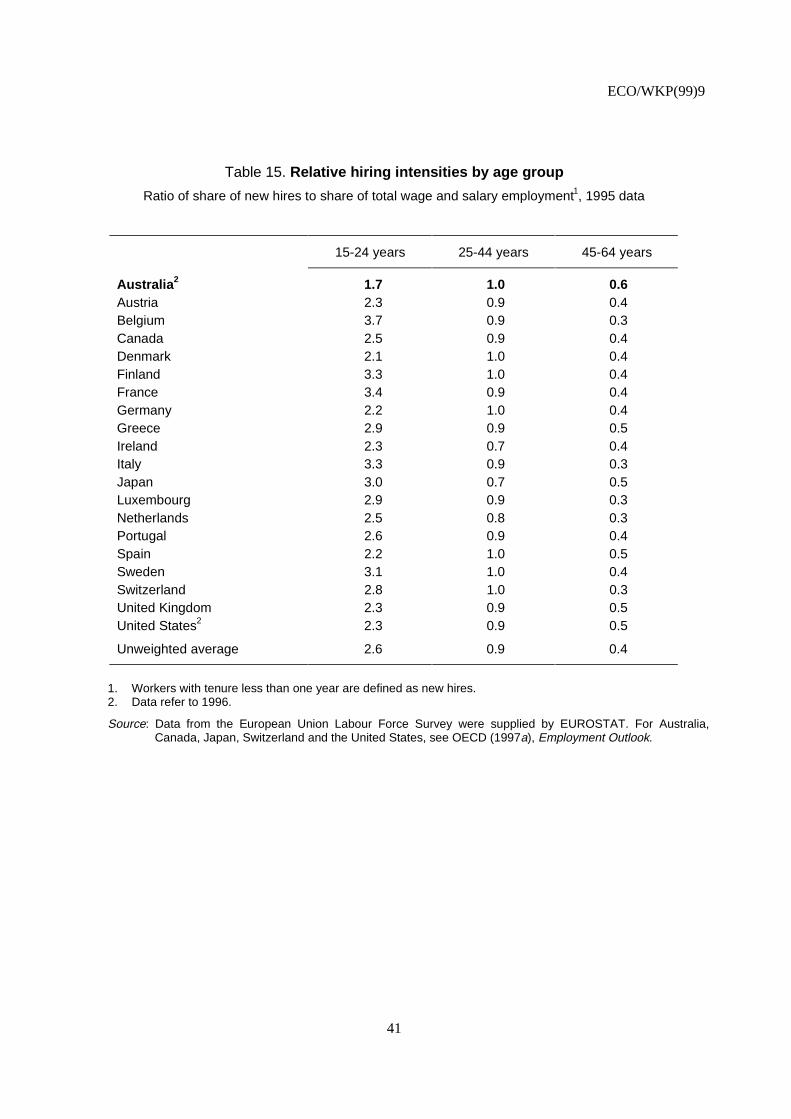
ECO/WKP(99)9
41
Table 15. Relative hiring intensities by age group
Ratio of share of new hires to share of total wage and salary employment1, 1995 data
15-24 years 25-44 years 45-64 years
Australia2 1.7 1.0 0.6Austria 2.3 0.9 0.4Belgium 3.7 0.9 0.3Canada 2.5 0.9 0.4Denmark 2.1 1.0 0.4Finland 3.3 1.0 0.4France 3.4 0.9 0.4Germany 2.2 1.0 0.4Greece 2.9 0.9 0.5Ireland 2.3 0.7 0.4Italy 3.3 0.9 0.3Japan 3.0 0.7 0.5Luxembourg 2.9 0.9 0.3Netherlands 2.5 0.8 0.3Portugal 2.6 0.9 0.4Spain 2.2 1.0 0.5Sweden 3.1 1.0 0.4Switzerland 2.8 1.0 0.3United Kingdom 2.3 0.9 0.5United States2 2.3 0.9 0.5
Unweighted average 2.6 0.9 0.4
1. Workers with tenure less than one year are defined as new hires.2. Data refer to 1996.
Source: Data from the European Union Labour Force Survey were supplied by EUROSTAT. For Australia,Canada, Japan, Switzerland and the United States, see OECD (1997a), Employment Outlook.
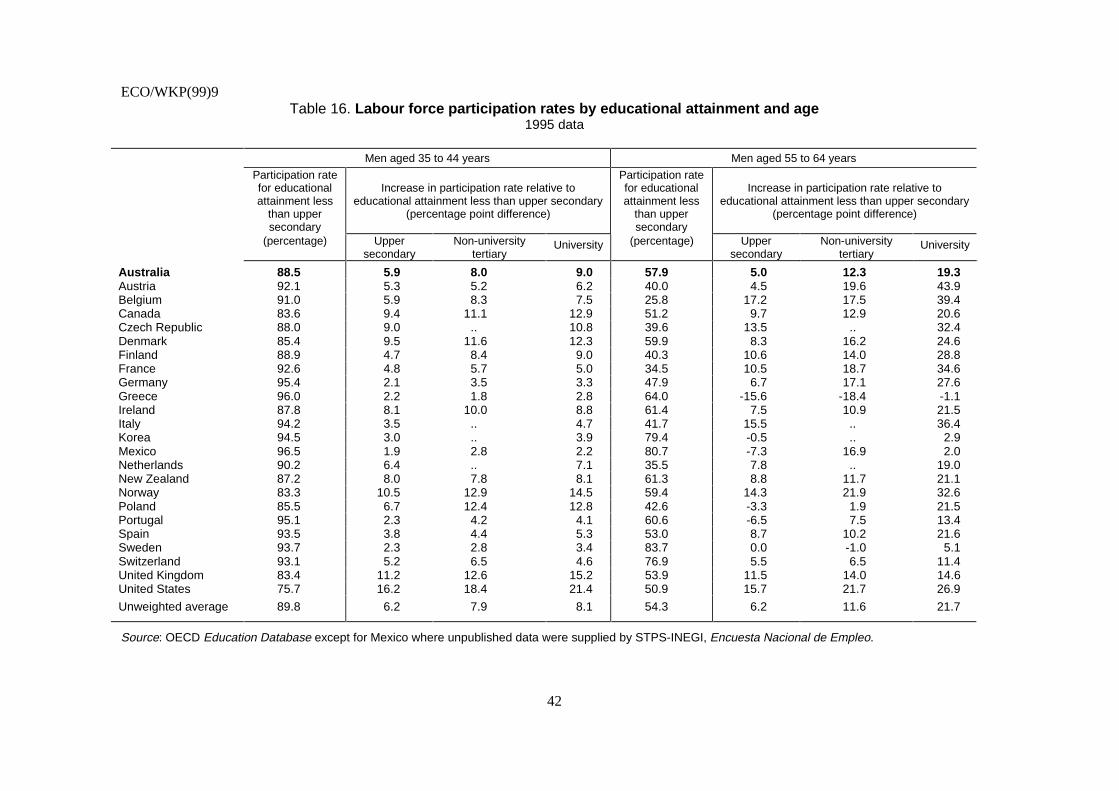
ECO/WKP(99)9
42
Table 16. Labour force participation rates by educational attainment and age1995 data
Men aged 35 to 44 years Men aged 55 to 64 years
Participation ratefor educationalattainment less
than uppersecondary
Increase in participation rate relative toeducational attainment less than upper secondary
(percentage point difference)
Participation ratefor educationalattainment less
than uppersecondary
Increase in participation rate relative toeducational attainment less than upper secondary
(percentage point difference)
(percentage) Uppersecondary
Non-universitytertiary
University (percentage) Uppersecondary
Non-universitytertiary
University
Australia 88.5 5.9 8.0 9.0 57.9 5.0 12.3 19.3Austria 92.1 5.3 5.2 6.2 40.0 4.5 19.6 43.9Belgium 91.0 5.9 8.3 7.5 25.8 17.2 17.5 39.4Canada 83.6 9.4 11.1 12.9 51.2 9.7 12.9 20.6Czech Republic 88.0 9.0 .. 10.8 39.6 13.5 .. 32.4Denmark 85.4 9.5 11.6 12.3 59.9 8.3 16.2 24.6Finland 88.9 4.7 8.4 9.0 40.3 10.6 14.0 28.8France 92.6 4.8 5.7 5.0 34.5 10.5 18.7 34.6Germany 95.4 2.1 3.5 3.3 47.9 6.7 17.1 27.6Greece 96.0 2.2 1.8 2.8 64.0 -15.6 -18.4 -1.1Ireland 87.8 8.1 10.0 8.8 61.4 7.5 10.9 21.5Italy 94.2 3.5 .. 4.7 41.7 15.5 .. 36.4Korea 94.5 3.0 .. 3.9 79.4 -0.5 .. 2.9Mexico 96.5 1.9 2.8 2.2 80.7 -7.3 16.9 2.0Netherlands 90.2 6.4 .. 7.1 35.5 7.8 .. 19.0New Zealand 87.2 8.0 7.8 8.1 61.3 8.8 11.7 21.1Norway 83.3 10.5 12.9 14.5 59.4 14.3 21.9 32.6Poland 85.5 6.7 12.4 12.8 42.6 -3.3 1.9 21.5Portugal 95.1 2.3 4.2 4.1 60.6 -6.5 7.5 13.4Spain 93.5 3.8 4.4 5.3 53.0 8.7 10.2 21.6Sweden 93.7 2.3 2.8 3.4 83.7 0.0 -1.0 5.1Switzerland 93.1 5.2 6.5 4.6 76.9 5.5 6.5 11.4United Kingdom 83.4 11.2 12.6 15.2 53.9 11.5 14.0 14.6United States 75.7 16.2 18.4 21.4 50.9 15.7 21.7 26.9
Unweighted average 89.8 6.2 7.9 8.1 54.3 6.2 11.6 21.7
Source: OECD Education Database except for Mexico where unpublished data were supplied by STPS-INEGI, Encuesta Nacional de Empleo.
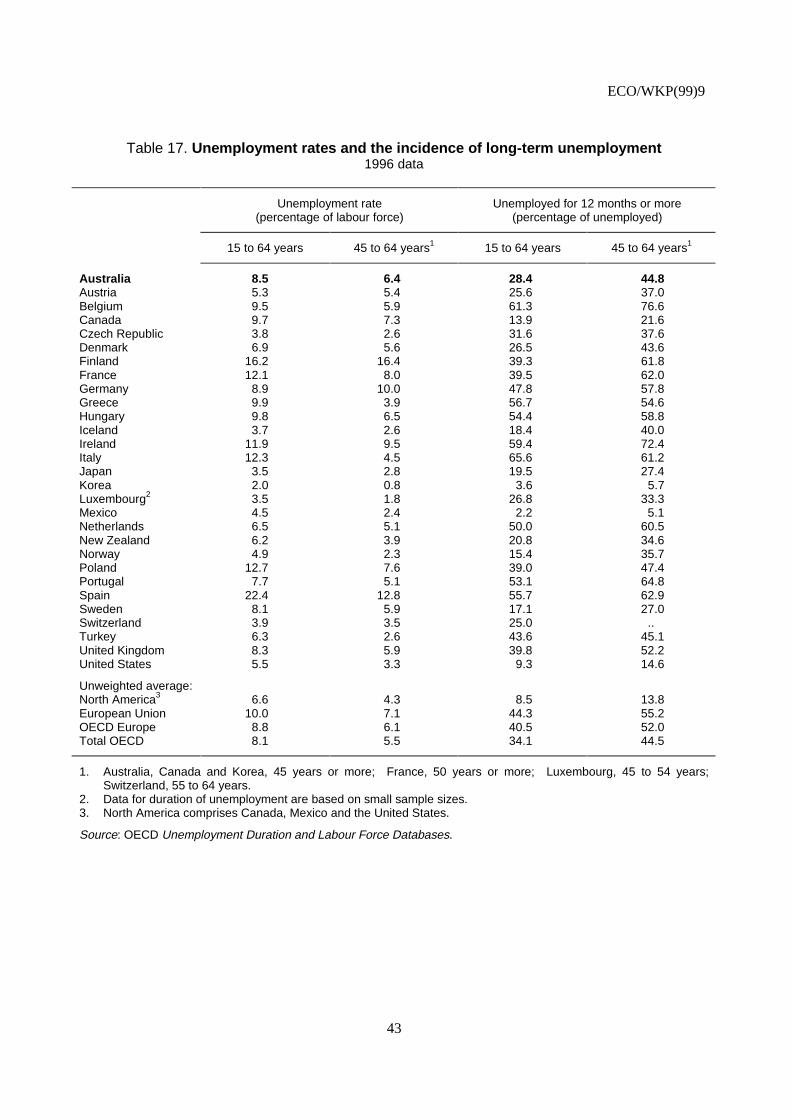
ECO/WKP(99)9
43
Table 17. Unemployment rates and the incidence of long-term unemployment1996 data
Unemployment rate(percentage of labour force)
Unemployed for 12 months or more(percentage of unemployed)
15 to 64 years 45 to 64 years1 15 to 64 years 45 to 64 years1
Australia 8.5 6.4 28.4 44.8Austria 5.3 5.4 25.6 37.0Belgium 9.5 5.9 61.3 76.6Canada 9.7 7.3 13.9 21.6Czech Republic 3.8 2.6 31.6 37.6Denmark 6.9 5.6 26.5 43.6Finland 16.2 16.4 39.3 61.8France 12.1 8.0 39.5 62.0Germany 8.9 10.0 47.8 57.8Greece 9.9 3.9 56.7 54.6Hungary 9.8 6.5 54.4 58.8Iceland 3.7 2.6 18.4 40.0Ireland 11.9 9.5 59.4 72.4Italy 12.3 4.5 65.6 61.2Japan 3.5 2.8 19.5 27.4Korea 2.0 0.8 3.6 5.7Luxembourg2 3.5 1.8 26.8 33.3Mexico 4.5 2.4 2.2 5.1Netherlands 6.5 5.1 50.0 60.5New Zealand 6.2 3.9 20.8 34.6Norway 4.9 2.3 15.4 35.7Poland 12.7 7.6 39.0 47.4Portugal 7.7 5.1 53.1 64.8Spain 22.4 12.8 55.7 62.9Sweden 8.1 5.9 17.1 27.0Switzerland 3.9 3.5 25.0 ..Turkey 6.3 2.6 43.6 45.1United Kingdom 8.3 5.9 39.8 52.2United States 5.5 3.3 9.3 14.6
Unweighted average:North America3 6.6 4.3 8.5 13.8European Union 10.0 7.1 44.3 55.2OECD Europe 8.8 6.1 40.5 52.0Total OECD 8.1 5.5 34.1 44.5
1. Australia, Canada and Korea, 45 years or more; France, 50 years or more; Luxembourg, 45 to 54 years;Switzerland, 55 to 64 years.
2. Data for duration of unemployment are based on small sample sizes.3. North America comprises Canada, Mexico and the United States.
Source: OECD Unemployment Duration and Labour Force Databases.
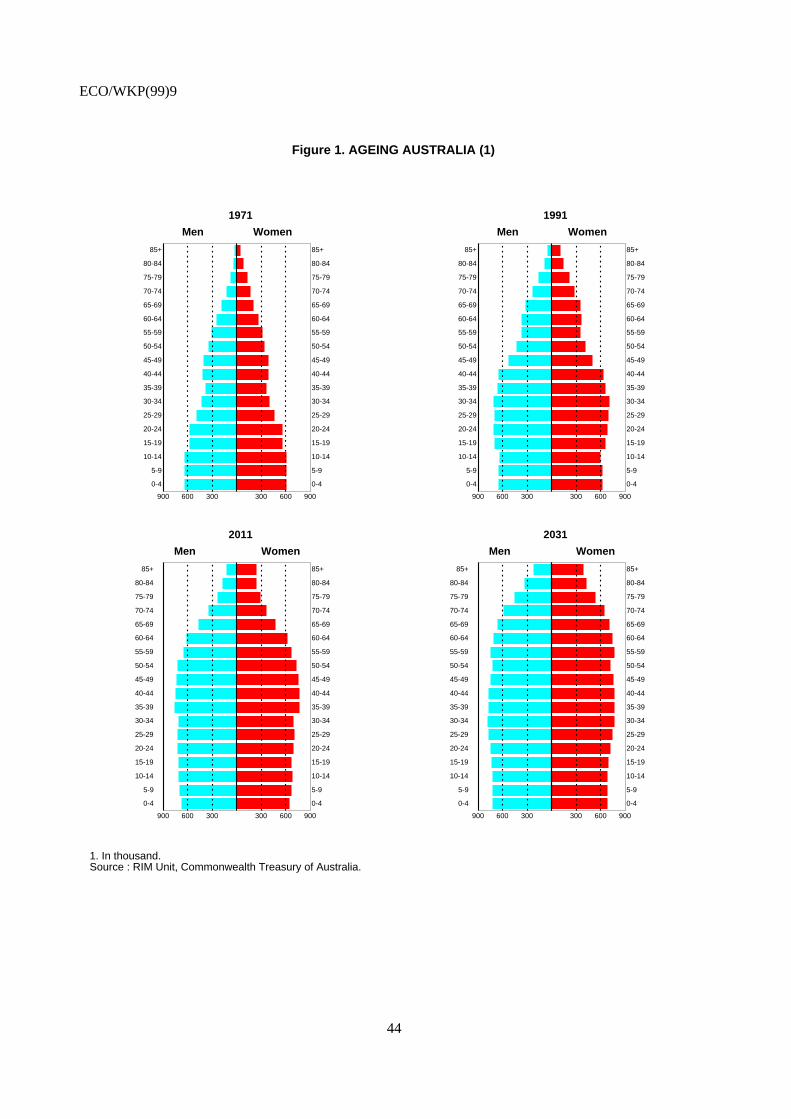
ECO/WKP(99)9
44
Figure 1. AGEING AUSTRALIA (1)
1. In thousand.Source : RIM Unit, Commonwealth Treasury of Australia.
900 600 300
85+
80-84
75-79
70-74
65-69
60-64
55-59
50-54
45-49
40-44
35-39
30-34
25-29
20-24
15-19
10-14
5-9
0-4
Men
1971
300 600 900
85+
80-84
75-79
70-74
65-69
60-64
55-59
50-54
45-49
40-44
35-39
30-34
25-29
20-24
15-19
10-14
5-9
0-4
Women
900 600 300
85+
80-84
75-79
70-74
65-69
60-64
55-59
50-54
45-49
40-44
35-39
30-34
25-29
20-24
15-19
10-14
5-9
0-4
1991
Men
300 600 900
85+
80-84
75-79
70-74
65-69
60-64
55-59
50-54
45-49
40-44
35-39
30-34
25-29
20-24
15-19
10-14
5-9
0-4
Women
900 600 300
85+
80-84
75-79
70-74
65-69
60-64
55-59
50-54
45-49
40-44
35-39
30-34
25-29
20-24
15-19
10-14
5-9
0-4
2011
Men
300 600 900
85+
80-84
75-79
70-74
65-69
60-64
55-59
50-54
45-49
40-44
35-39
30-34
25-29
20-24
15-19
10-14
5-9
0-4
Women
900 600 300
85+
80-84
75-79
70-74
65-69
60-64
55-59
50-54
45-49
40-44
35-39
30-34
25-29
20-24
15-19
10-14
5-9
0-4
2031
Men
300 600 900
85+
80-84
75-79
70-74
65-69
60-64
55-59
50-54
45-49
40-44
35-39
30-34
25-29
20-24
15-19
10-14
5-9
0-4
Women

ECO/WKP(99)9
45
Figure 2. DEMOGRAPHIC PROJECTIONS, BY AGE SUB-GROUPPer cent of total population
Source : RIM Unit, Commonwealth Treasury of Australia.
1980 1985 1990 1995 2000 2005 2010 2015 2020 2025 2030 2035 2040 2045 2050 20550
10
20
30
40
50
60
70
Per cent
0
10
20
30
40
50
60
70
Per cent
Population aged 18-64
Population aged 0-18
Population aged 65 + Population aged 75 +
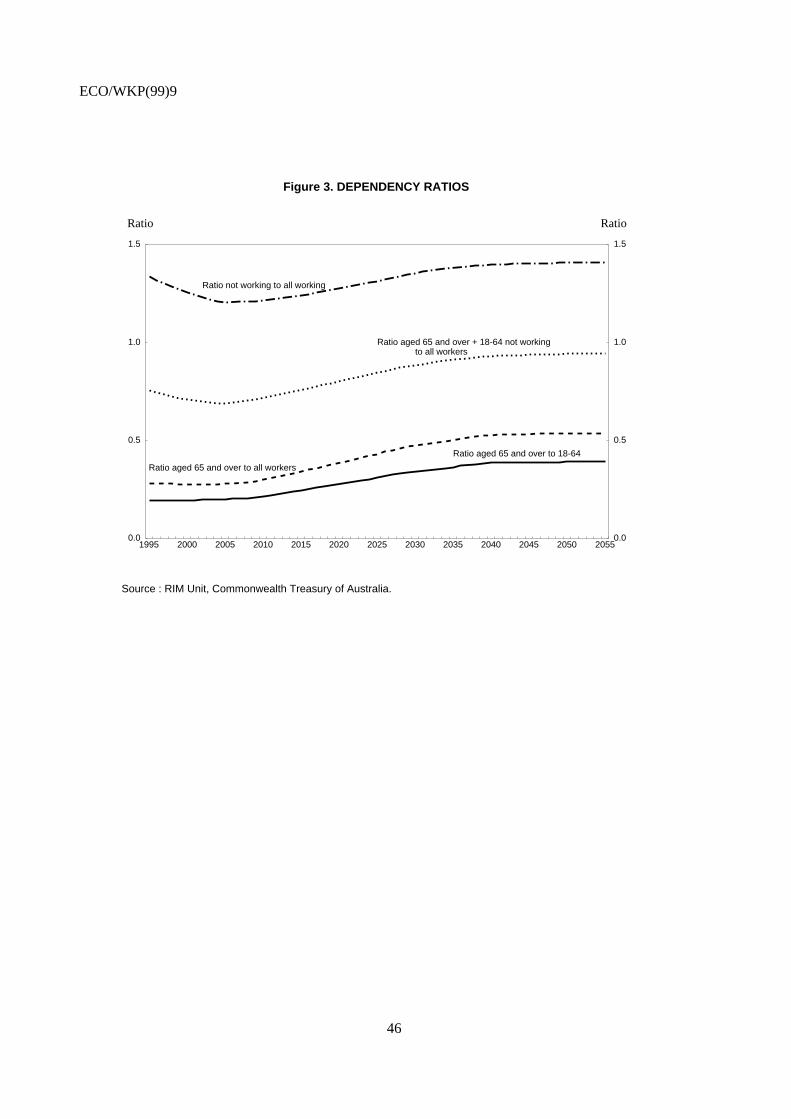
ECO/WKP(99)9
46
Figure 3. DEPENDENCY RATIOS
Source : RIM Unit, Commonwealth Treasury of Australia.
1995 2000 2005 2010 2015 2020 2025 2030 2035 2040 2045 2050 20550.0
0.5
1.0
1.5
Ratio
0.0
0.5
1.0
1.5
Ratio
Ratio not working to all working
Ratio aged 65 and over + 18-64 not workingto all workers
Ratio aged 65 and over to all workers
Ratio aged 65 and over to 18-64
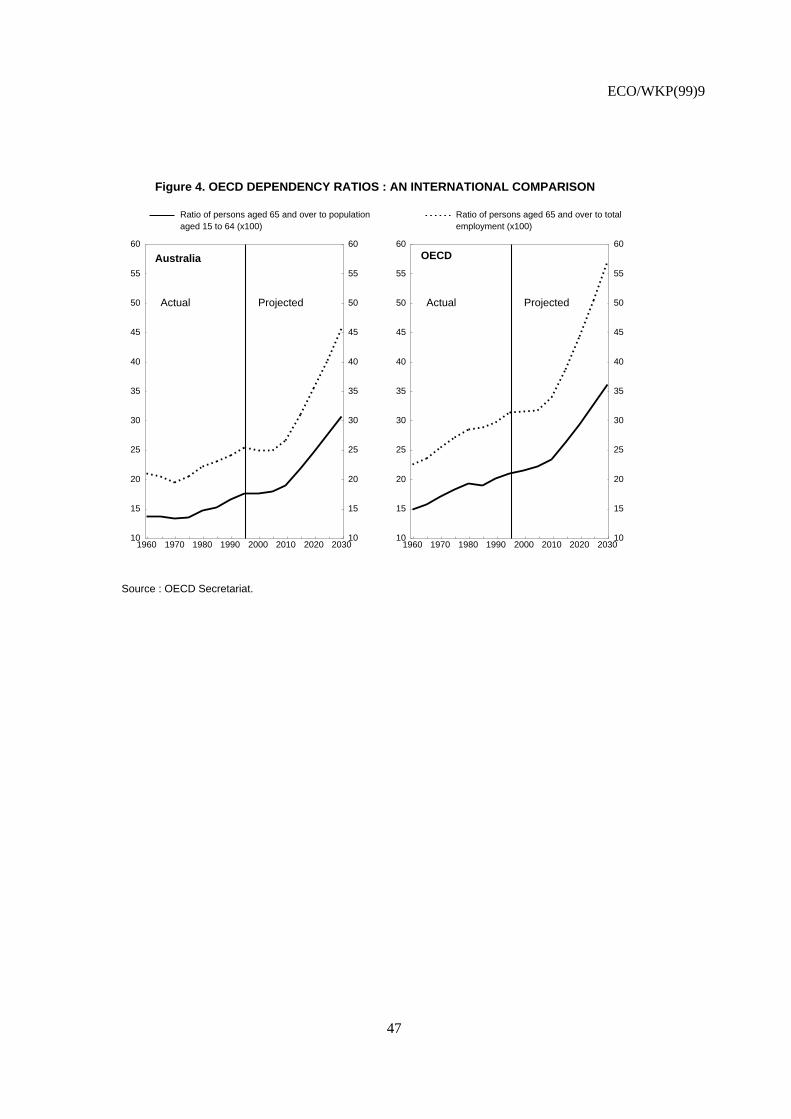
ECO/WKP(99)9
47
Figure 4. OECD DEPENDENCY RATIOS : AN INTERNATIONAL COMPARISON
Source : OECD Secretariat.
1960 1970 1980 1990 2000 2010 2020 203010
15
20
25
30
35
40
45
50
55
60
10
15
20
25
30
35
40
45
50
55
60
Ratio of persons aged 65 and over to populationaged 15 to 64 (x100)
Ratio of persons aged 65 and over to totalemployment (x100)
Australia
Actual Projected
1960 1970 1980 1990 2000 2010 2020 203010
15
20
25
30
35
40
45
50
55
60
10
15
20
25
30
35
40
45
50
55
60OECD
Actual Projected
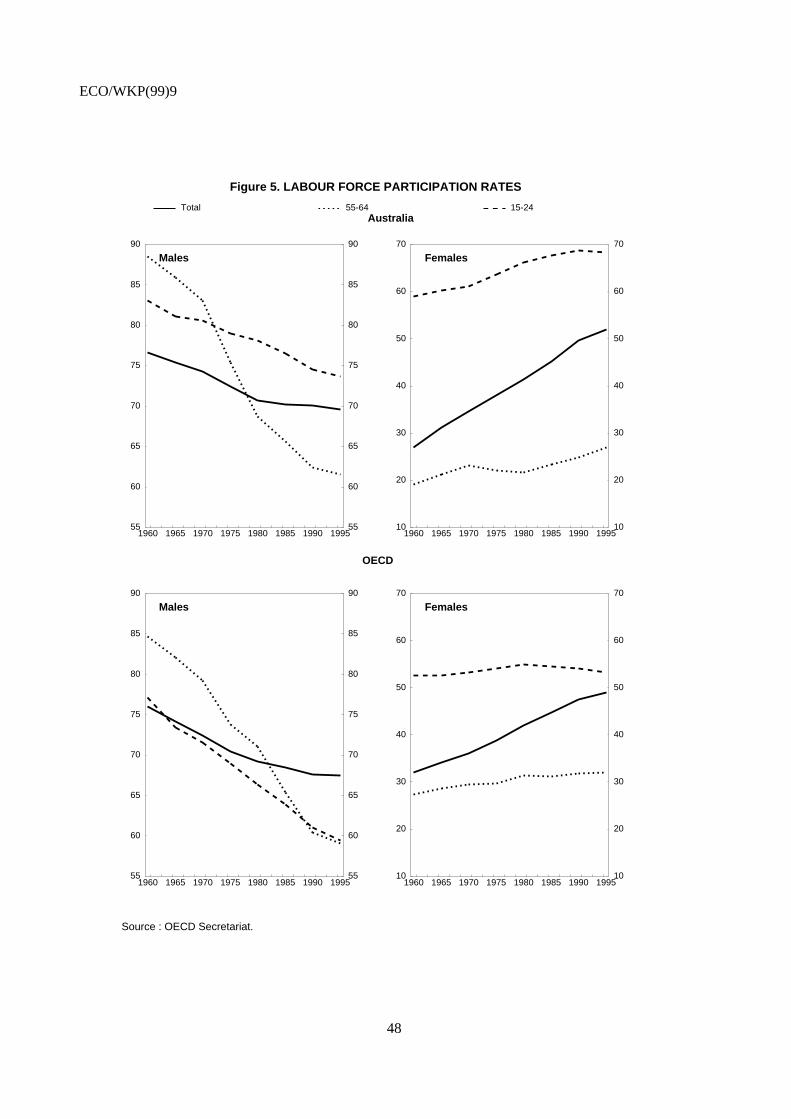
ECO/WKP(99)9
48
Figure 5. LABOUR FORCE PARTICIPATION RATES
Source : OECD Secretariat.
1960 1965 1970 1975 1980 1985 1990 199555
60
65
70
75
80
85
90
55
60
65
70
75
80
85
90
Total 55-64 15-24Australia
Males
1960 1965 1970 1975 1980 1985 1990 199510
20
30
40
50
60
70
10
20
30
40
50
60
70
Females
1960 1965 1970 1975 1980 1985 1990 199555
60
65
70
75
80
85
90
55
60
65
70
75
80
85
90
OECD
Males
1960 1965 1970 1975 1980 1985 1990 199510
20
30
40
50
60
70
10
20
30
40
50
60
70
Females
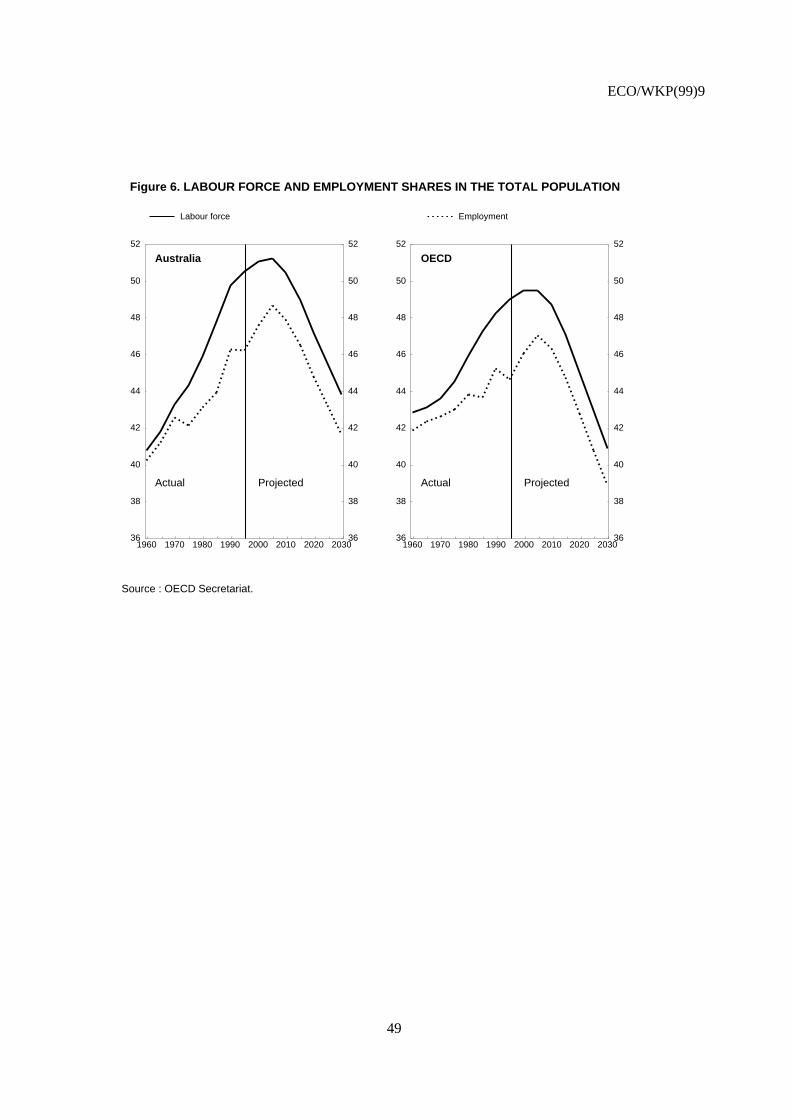
ECO/WKP(99)9
49
Figure 6. LABOUR FORCE AND EMPLOYMENT SHARES IN THE TOTAL POPULATION
Source : OECD Secretariat.
1960 1970 1980 1990 2000 2010 2020 203036
38
40
42
44
46
48
50
52
36
38
40
42
44
46
48
50
52
Labour force Employment
Australia
Actual Projected
1960 1970 1980 1990 2000 2010 2020 203036
38
40
42
44
46
48
50
52
36
38
40
42
44
46
48
50
52
OECD
Actual Projected
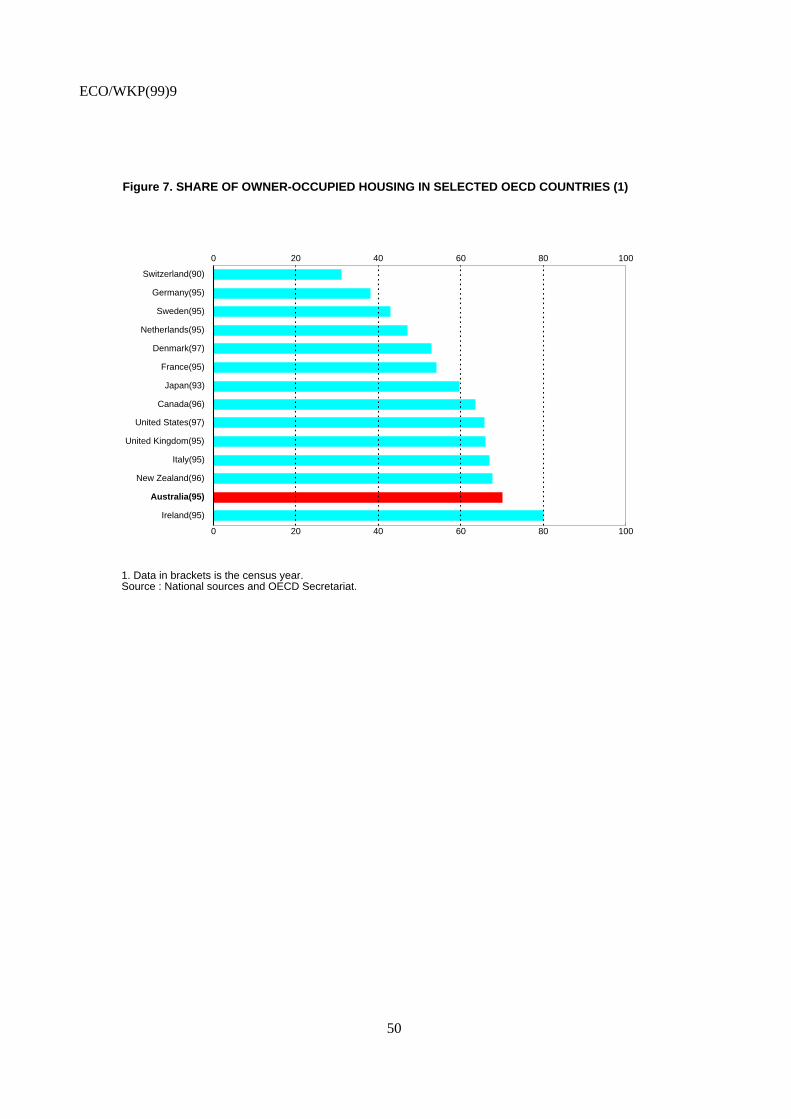
ECO/WKP(99)9
50
Figure 7. SHARE OF OWNER-OCCUPIED HOUSING IN SELECTED OECD COUNTRIES (1)
1. Data in brackets is the census year.Source : National sources and OECD Secretariat.
0 20 40 60 80 100
0 20 40 60 80 100
Switzerland(90)
Germany(95)
Sweden(95)
Netherlands(95)
Denmark(97)
France(95)
Japan(93)
Canada(96)
United States(97)
United Kingdom(95)
Italy(95)
New Zealand(96)
Australia(95)
Ireland(95)
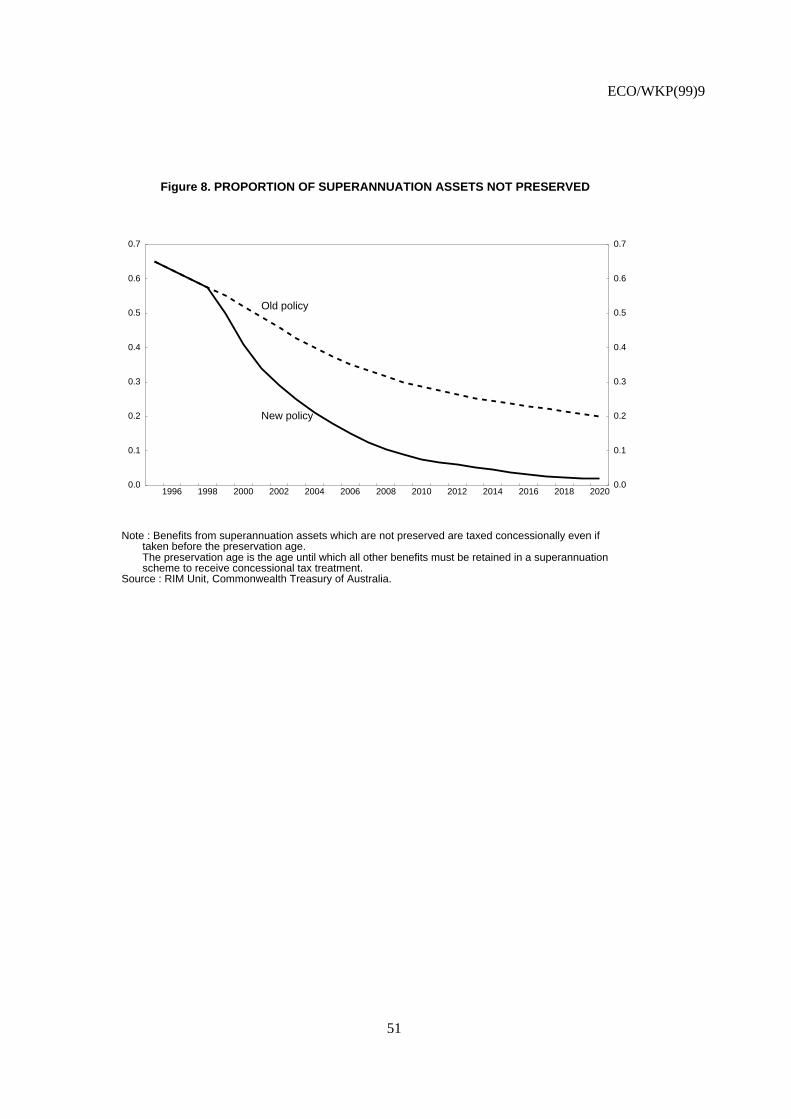
ECO/WKP(99)9
51
Figure 8. PROPORTION OF SUPERANNUATION ASSETS NOT PRESERVED
Note : Benefits from superannuation assets which are not preserved are taxed concessionally even if taken before the preservation age. The preservation age is the age until which all other benefits must be retained in a superannuation scheme to receive concessional tax treatment.Source : RIM Unit, Commonwealth Treasury of Australia.
1996 1998 2000 2002 2004 2006 2008 2010 2012 2014 2016 2018 20200.0
0.1
0.2
0.3
0.4
0.5
0.6
0.7
0.0
0.1
0.2
0.3
0.4
0.5
0.6
0.7
New policy
Old policy
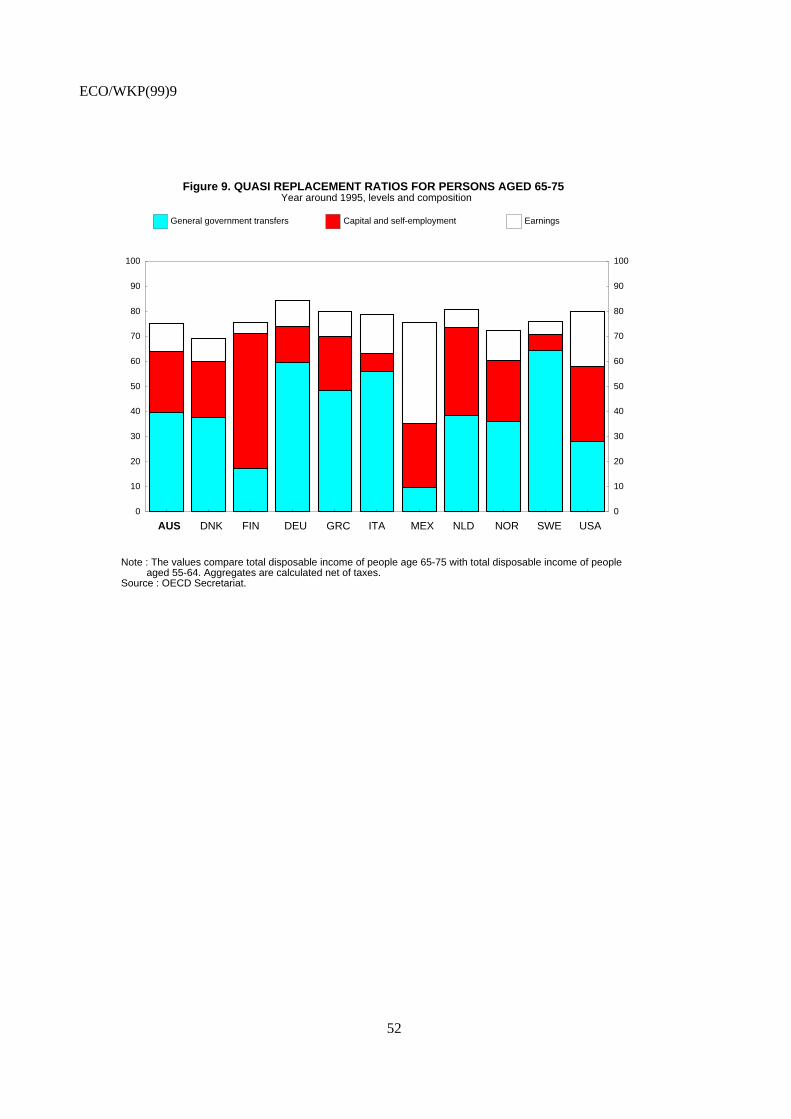
ECO/WKP(99)9
52
Figure 9. QUASI REPLACEMENT RATIOS FOR PERSONS AGED 65-75 Year around 1995, levels and composition
Note : The values compare total disposable income of people age 65-75 with total disposable income of people aged 55-64. Aggregates are calculated net of taxes.Source : OECD Secretariat.
0
10
20
30
40
50
60
70
80
90
100
0
10
20
30
40
50
60
70
80
90
100
AUS DNK FIN DEU GRC ITA MEX NLD NOR SWE USA
EarningsCapital and self-employmentGeneral government transfers
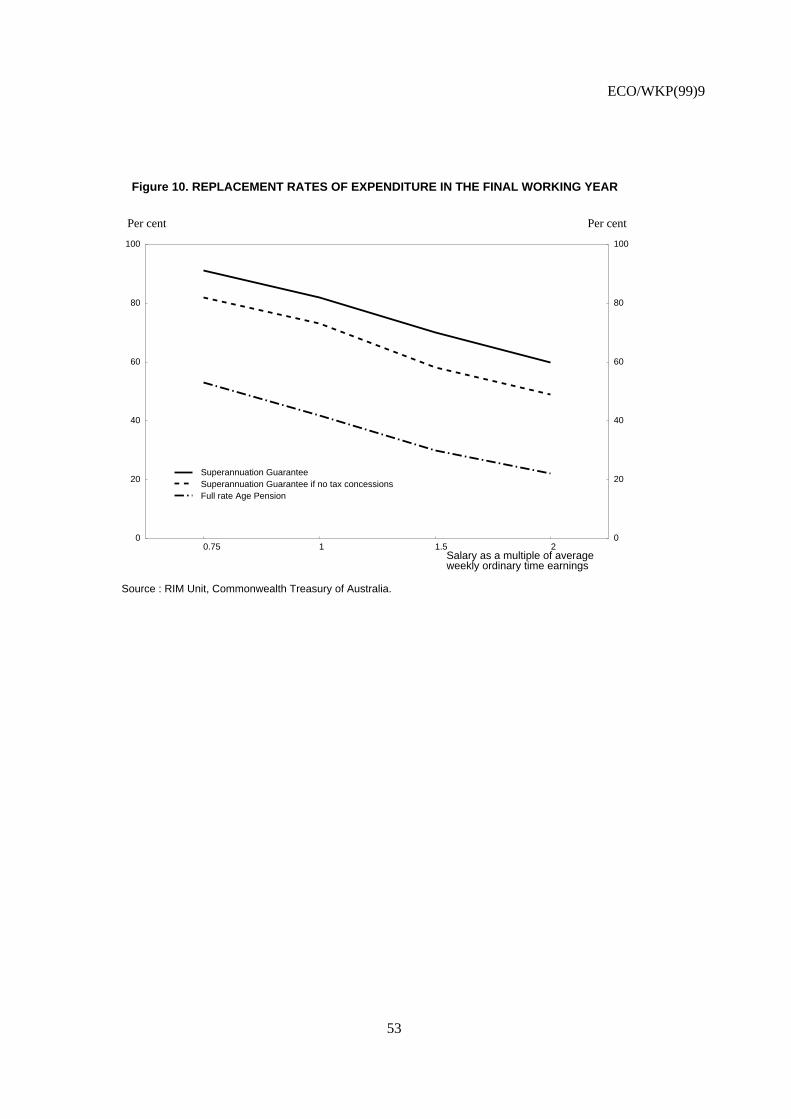
ECO/WKP(99)9
53
Figure 10. REPLACEMENT RATES OF EXPENDITURE IN THE FINAL WORKING YEAR
Source : RIM Unit, Commonwealth Treasury of Australia.
0
20
40
60
80
100
Per cent
0
20
40
60
80
100
Per cent
0.75 1 1.5 2Salary as a multiple of averageweekly ordinary time earnings
Superannuation GuaranteeSuperannuation Guarantee if no tax concessionsFull rate Age Pension
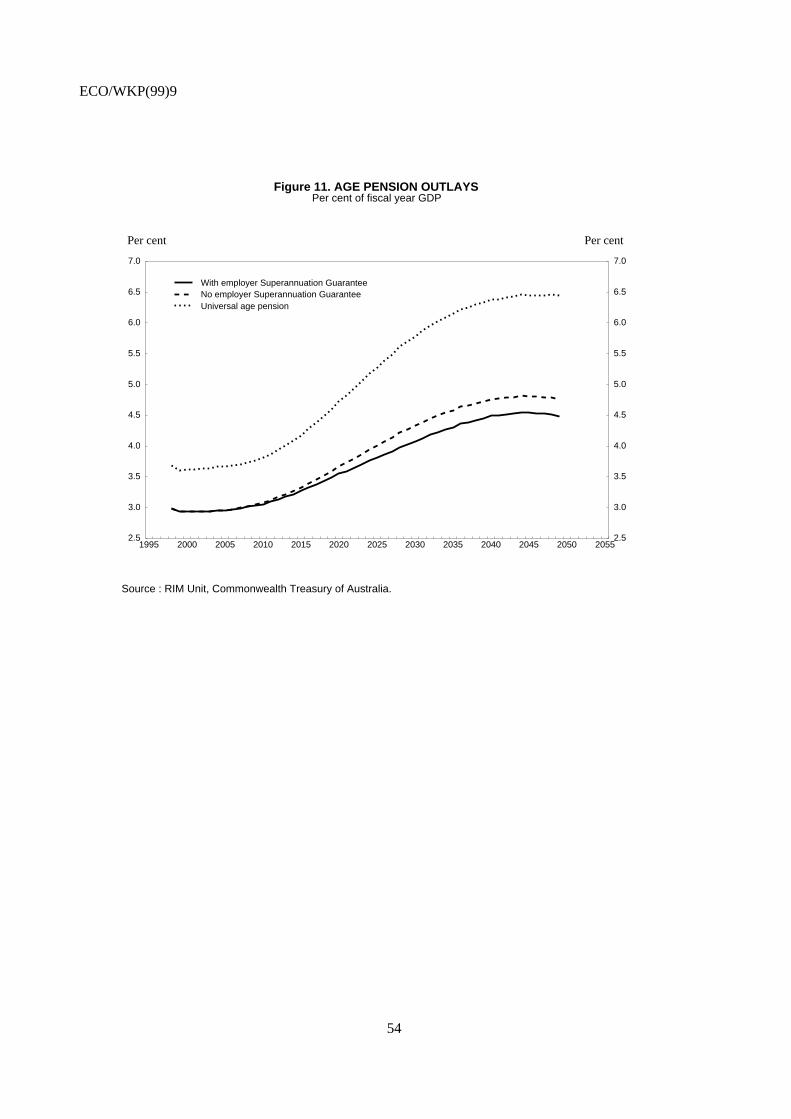
ECO/WKP(99)9
54
Figure 11. AGE PENSION OUTLAYSPer cent of fiscal year GDP
Source : RIM Unit, Commonwealth Treasury of Australia.
1995 2000 2005 2010 2015 2020 2025 2030 2035 2040 2045 2050 20552.5
3.0
3.5
4.0
4.5
5.0
5.5
6.0
6.5
7.0
Per cent
2.5
3.0
3.5
4.0
4.5
5.0
5.5
6.0
6.5
7.0
Per cent
With employer Superannuation GuaranteeNo employer Superannuation GuaranteeUniversal age pension
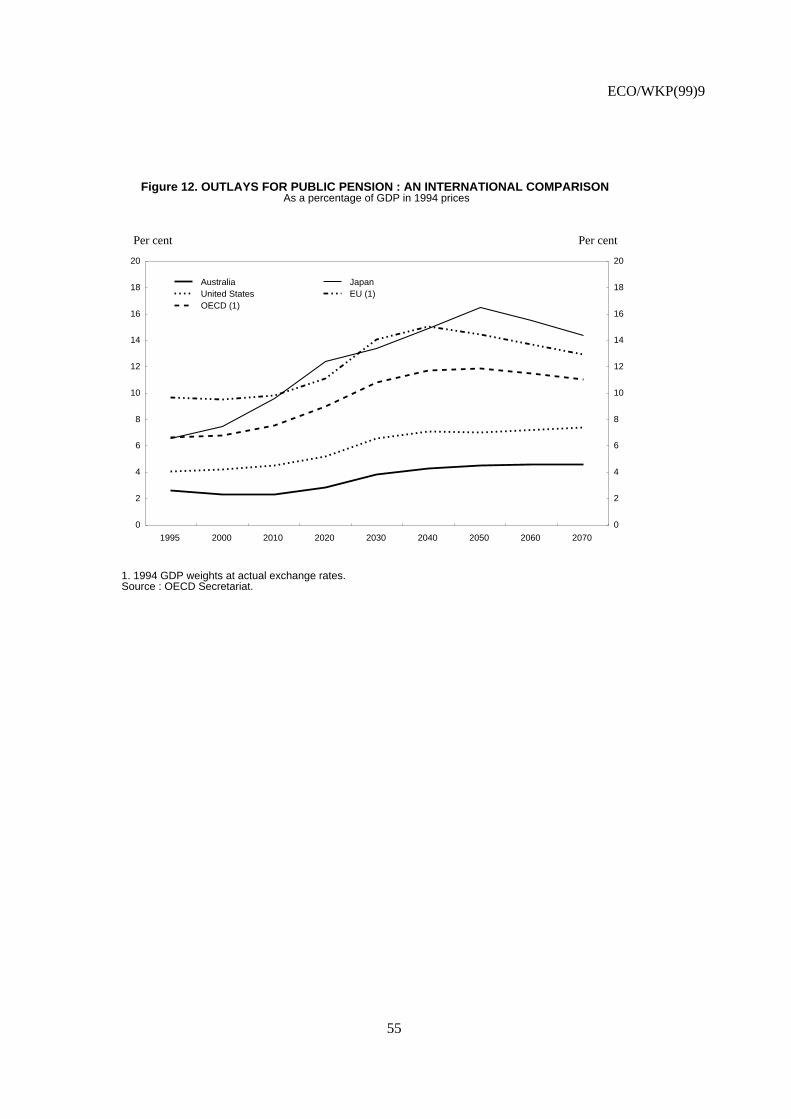
ECO/WKP(99)9
55
Figure 12. OUTLAYS FOR PUBLIC PENSION : AN INTERNATIONAL COMPARISONAs a percentage of GDP in 1994 prices
1. 1994 GDP weights at actual exchange rates.Source : OECD Secretariat.
0
2
4
6
8
10
12
14
16
18
20
Per cent
0
2
4
6
8
10
12
14
16
18
20
Per cent
1995 2000 2010 2020 2030 2040 2050 2060 2070
AustraliaUnited StatesOECD (1)
JapanEU (1)
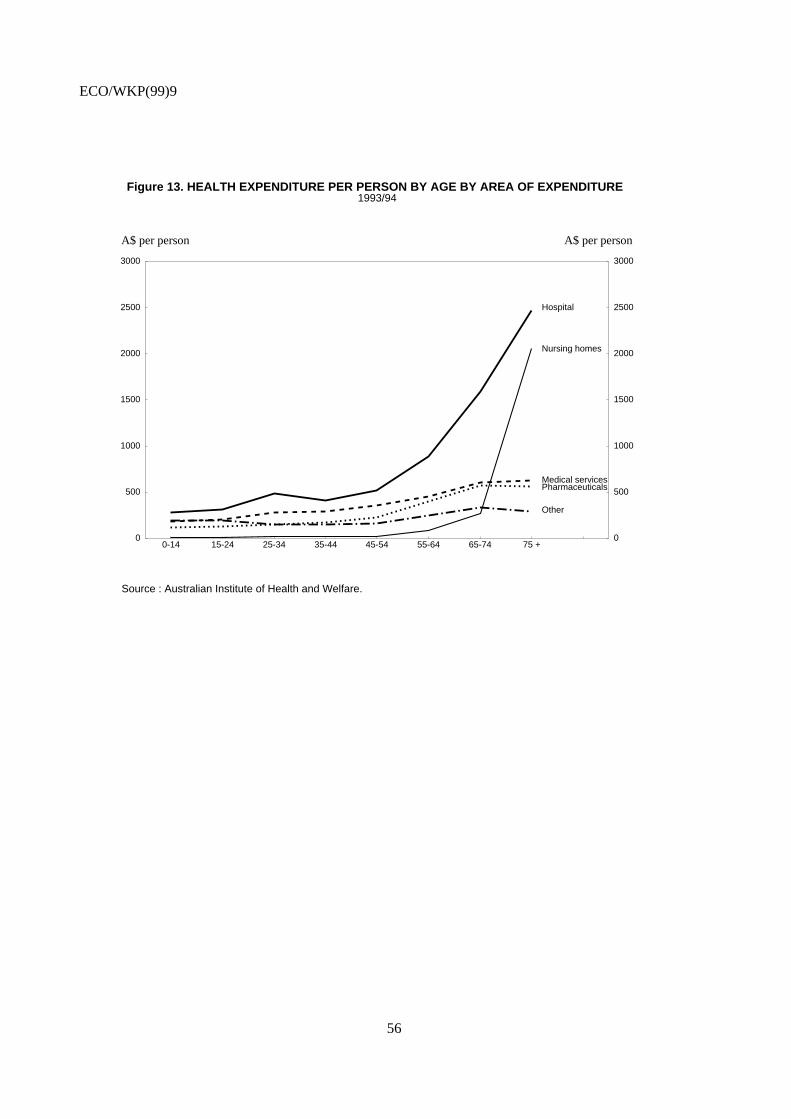
ECO/WKP(99)9
56
Figure 13. HEALTH EXPENDITURE PER PERSON BY AGE BY AREA OF EXPENDITURE1993/94
Source : Australian Institute of Health and Welfare.
0-14 15-24 25-34 35-44 45-54 55-64 65-74 75 + 0
500
1000
1500
2000
2500
3000
A$ per person
0
500
1000
1500
2000
2500
3000
A$ per person
Hospital
Nursing homes
Other
PharmaceuticalsMedical services
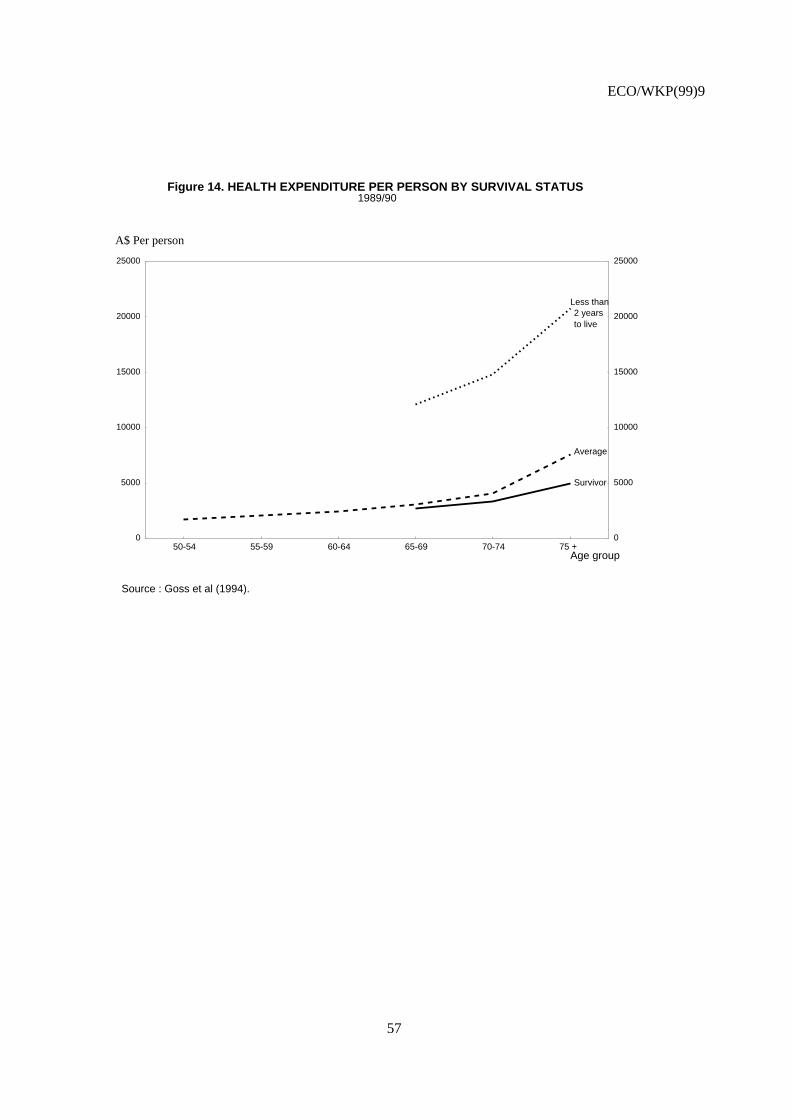
ECO/WKP(99)9
57
Figure 14. HEALTH EXPENDITURE PER PERSON BY SURVIVAL STATUS1989/90
Source : Goss et al (1994).
0
5000
10000
15000
20000
25000
A$ Per person
0
5000
10000
15000
20000
25000
Less than2 yearsto live
Average
Survivor
Age group50-54 55-59 60-64 65-69 70-74 75 +
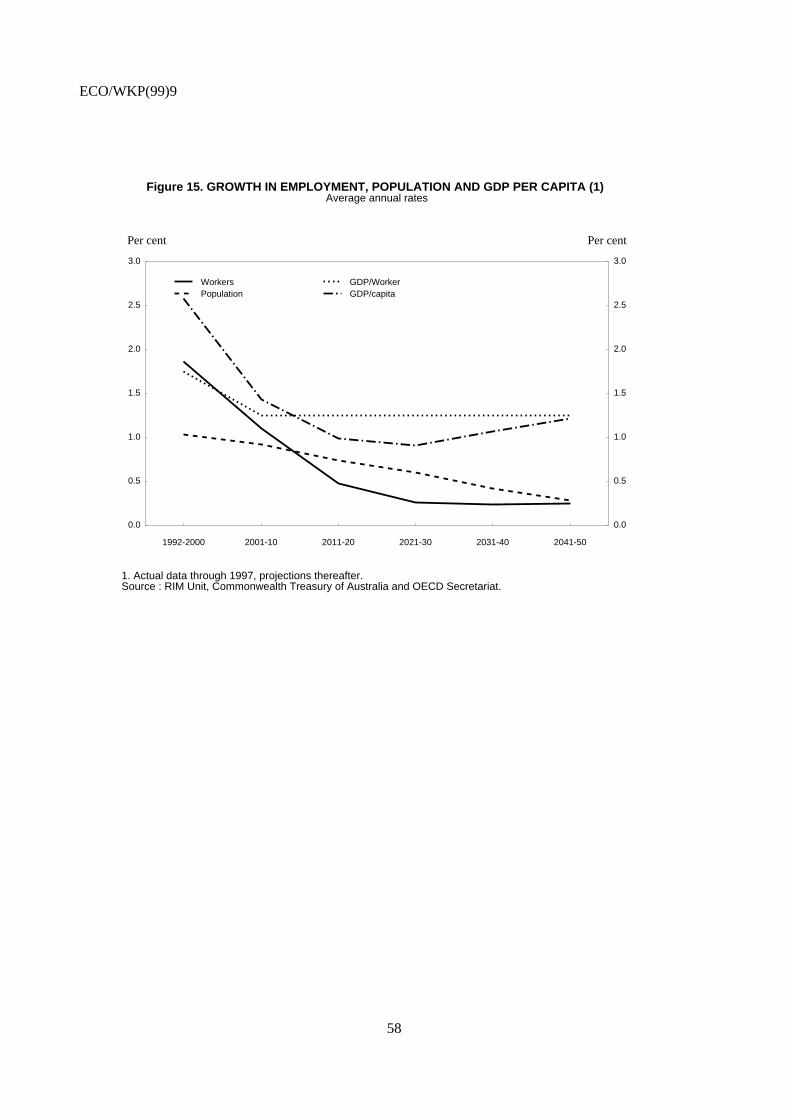
ECO/WKP(99)9
58
Figure 15. GROWTH IN EMPLOYMENT, POPULATION AND GDP PER CAPITA (1)Average annual rates
1. Actual data through 1997, projections thereafter.Source : RIM Unit, Commonwealth Treasury of Australia and OECD Secretariat.
0.0
0.5
1.0
1.5
2.0
2.5
3.0
Per cent
0.0
0.5
1.0
1.5
2.0
2.5
3.0
Per cent
1992-2000 2001-10 2011-20 2021-30 2031-40 2041-50
WorkersPopulation
GDP/WorkerGDP/capita
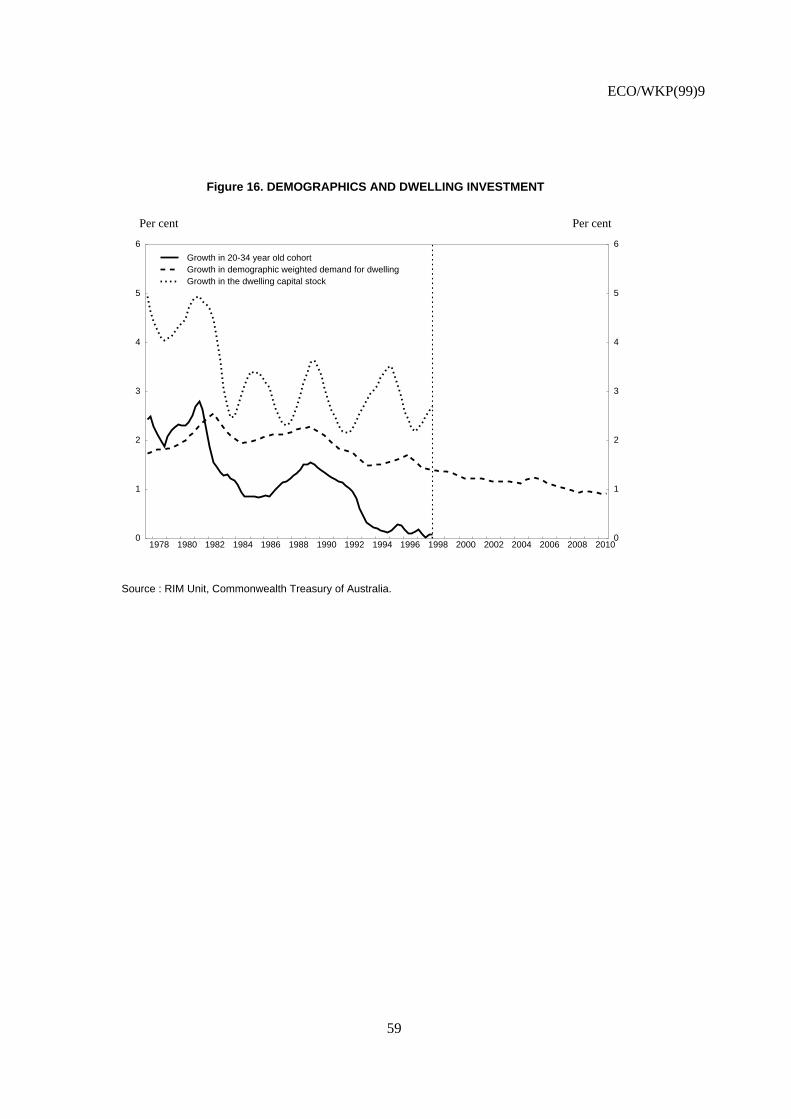
ECO/WKP(99)9
59
Figure 16. DEMOGRAPHICS AND DWELLING INVESTMENT
Source : RIM Unit, Commonwealth Treasury of Australia.
1978 1980 1982 1984 1986 1988 1990 1992 1994 1996 1998 2000 2002 2004 2006 2008 20100
1
2
3
4
5
6
Per cent
0
1
2
3
4
5
6
Per cent
Growth in 20-34 year old cohortGrowth in demographic weighted demand for dwellingGrowth in the dwelling capital stock
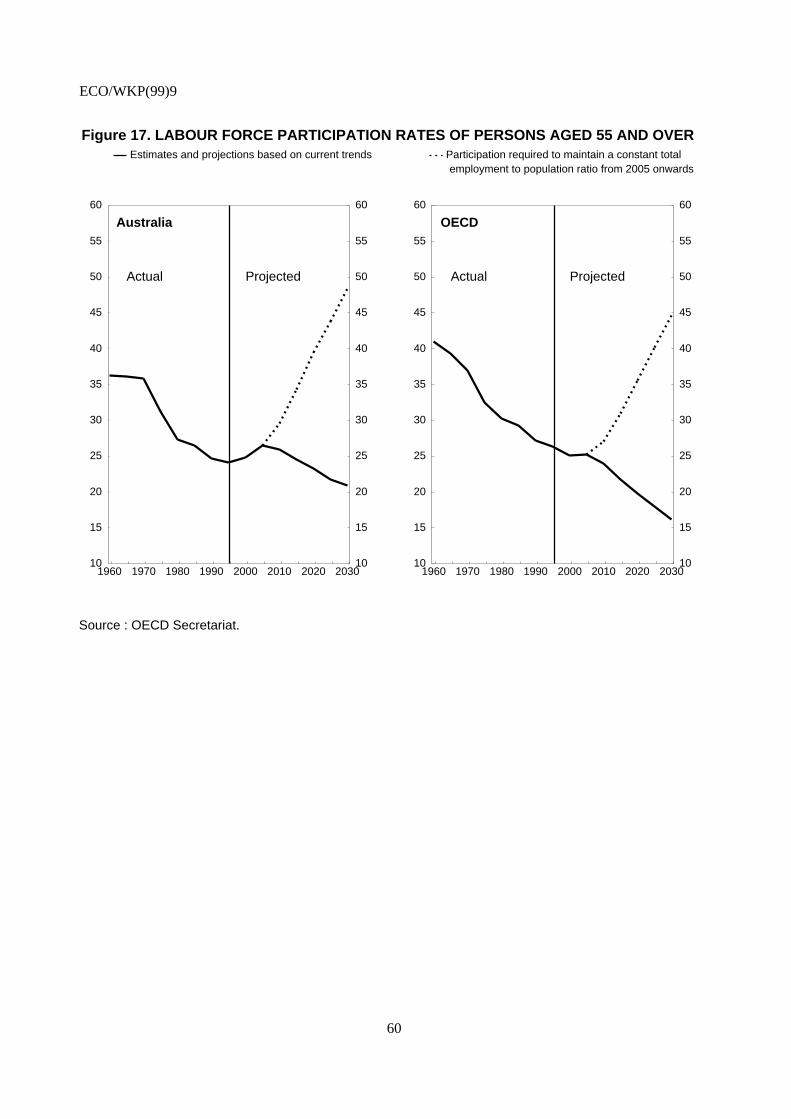
ECO/WKP(99)9
60
Figure 17. LABOUR FORCE PARTICIPATION RATES OF PERSONS AGED 55 AND OVER
Source : OECD Secretariat.
1960 1970 1980 1990 2000 2010 2020 203010
15
20
25
30
35
40
45
50
55
60
10
15
20
25
30
35
40
45
50
55
60
Estimates and projections based on current trends Participation required to maintain a constant totalemployment to population ratio from 2005 onwards
Australia
Actual Projected
1960 1970 1980 1990 2000 2010 2020 203010
15
20
25
30
35
40
45
50
55
60
10
15
20
25
30
35
40
45
50
55
60
OECD
Actual Projected
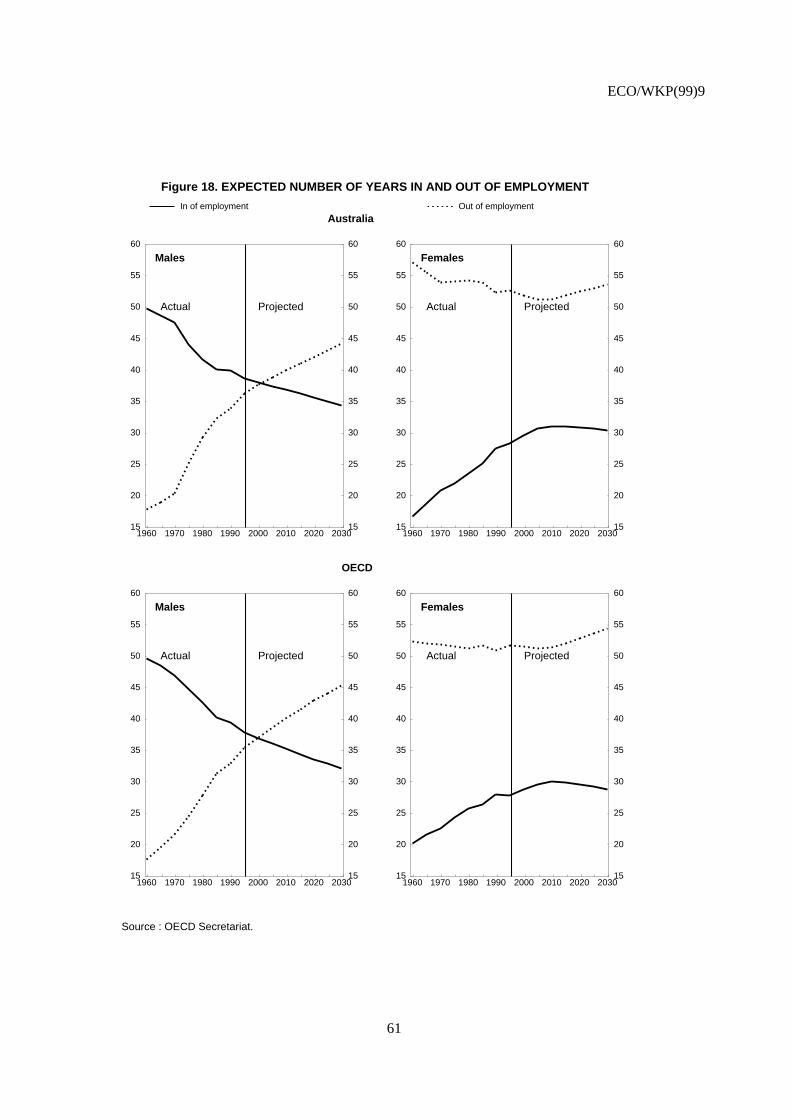
ECO/WKP(99)9
61
Figure 18. EXPECTED NUMBER OF YEARS IN AND OUT OF EMPLOYMENT
Source : OECD Secretariat.
1960 1970 1980 1990 2000 2010 2020 203015
20
25
30
35
40
45
50
55
60
15
20
25
30
35
40
45
50
55
60
In of employment Out of employment
Australia
Males
Actual Projected
1960 1970 1980 1990 2000 2010 2020 203015
20
25
30
35
40
45
50
55
60
15
20
25
30
35
40
45
50
55
60
Females
Actual Projected
1960 1970 1980 1990 2000 2010 2020 203015
20
25
30
35
40
45
50
55
60
15
20
25
30
35
40
45
50
55
60
OECD
Males
Actual Projected
1960 1970 1980 1990 2000 2010 2020 203015
20
25
30
35
40
45
50
55
60
15
20
25
30
35
40
45
50
55
60
Females
Actual Projected
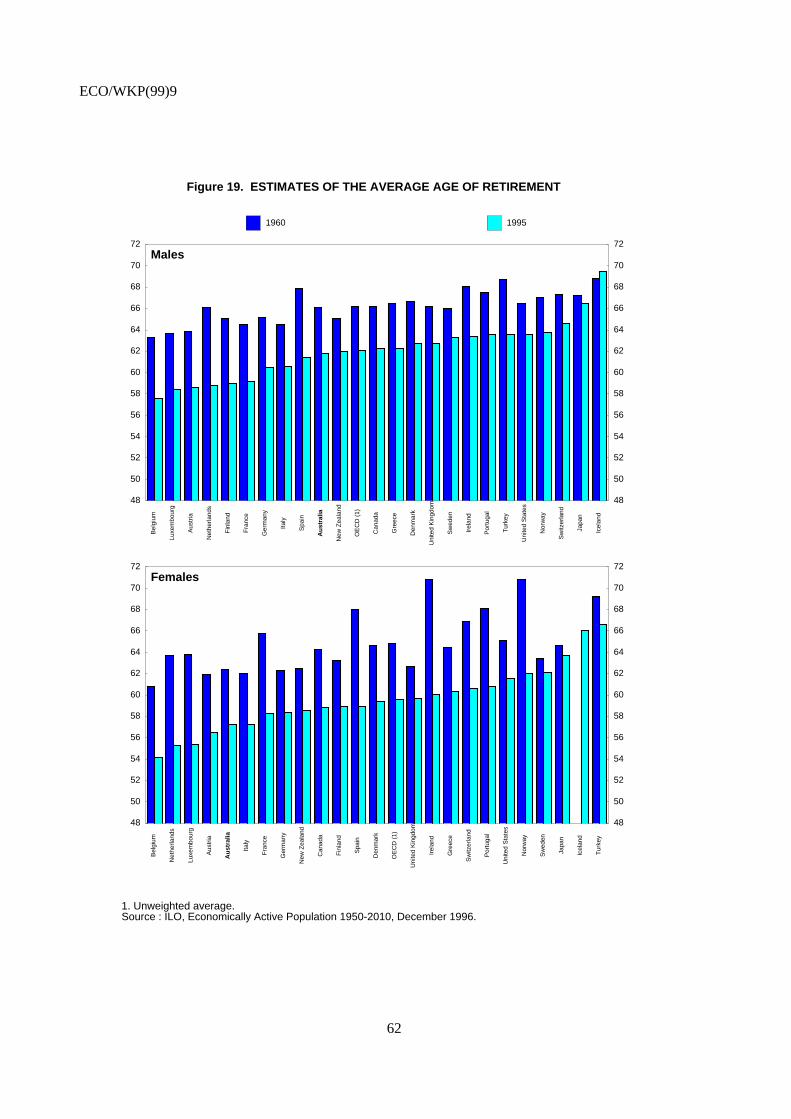
ECO/WKP(99)9
62
Figure 19. ESTIMATES OF THE AVERAGE AGE OF RETIREMENT
1. Unweighted average.Source : ILO, Economically Active Population 1950-2010, December 1996.
48
50
52
54
56
58
60
62
64
66
68
70
72
48
50
52
54
56
58
60
62
64
66
68
70
72
Bel
gium
Luxe
mbo
urg
Aus
tria
Net
herla
nds
Fin
land
Fra
nce
Ger
man
y
Italy
Spa
in
Aus
tral
ia
New
Zea
land
OE
CD
(1)
Can
ada
Gre
ece
Den
mar
k
Uni
ted
Kin
gdom
Sw
eden
Irel
and
Por
tuga
l
Tur
key
Uni
ted
Sta
tes
Nor
way
Sw
itzer
land
Japa
n
Icel
and
Males
1960 1995
48
50
52
54
56
58
60
62
64
66
68
70
72
48
50
52
54
56
58
60
62
64
66
68
70
72
Bel
gium
Net
herla
nds
Luxe
mbo
urg
Aus
tria
Aus
tral
ia
Italy
Fra
nce
Ger
man
y
New
Zea
land
Can
ada
Fin
land
Spa
in
Den
mar
k
OE
CD
(1)
Uni
ted
Kin
gdom
Irel
and
Gre
ece
Sw
itzer
land
Por
tuga
l
Uni
ted
Sta
tes
Nor
way
Sw
eden
Japa
n
Icel
and
Tur
key
Females
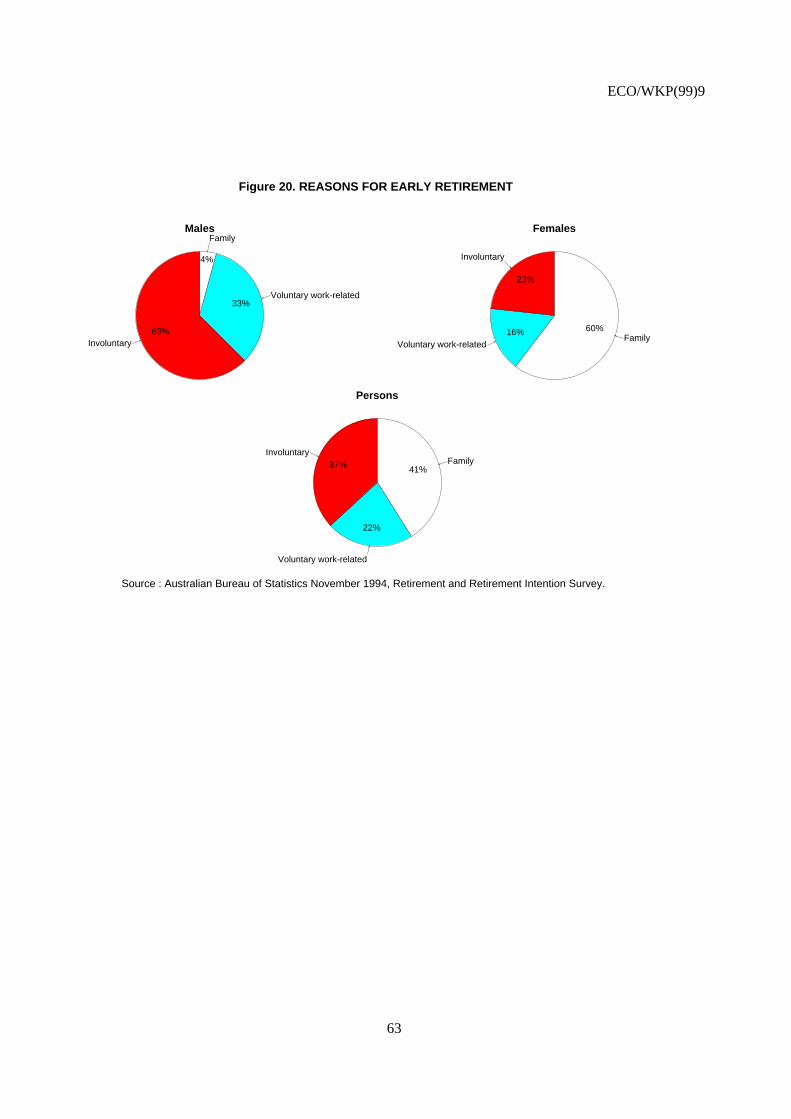
ECO/WKP(99)9
63
Figure 20. REASONS FOR EARLY RETIREMENT
Source : Australian Bureau of Statistics November 1994, Retirement and Retirement Intention Survey.
4%
Family
33%Voluntary work-related
63%Involuntary
Males
60%Family
16%Voluntary work-related
23%
Involuntary
Females
41%Family
22%
Voluntary work-related
37%Involuntary
Persons
ECO/WKP(99)9
64
BIBLIOGRAPHY
ABS (1994), Retirement and retirement intentions, survey.
Bacon, B. And P. Gallagher, ‘‘Early retirees – trends and their use of superannuation benefits and socialsecurity payments’’, Department of Social Security Seminar on Early Retirement, Conference Paper95/6, RIM Unit.
Bateman, H. and J. Piggott (1997), ‘‘Private pensions in OECD countries, Australia’’, OECD/GD(97)136.
Bone, M.R., A.C. Bebbington, C. Jagger, K. Morgan and G. Nicolaas (1995), Independent LifeExpectancy, HMSO.
Brückner, G. (1997), Health Expectancy in Germany.
Crimmins, E.M., Y. Saito, D. Ingegneri (1997) Population and Development Review, 23, 3, pp. 555-572.
Gallagher, P. (1995), ‘‘The policy use of the products of the retirement income modelling task force’’,paper to the Third Annual Colloquium of Superannuation Researchers, University of Melbourne.
Goss, J., S. Eckermann, M. Pinyopusarerk and X. Wen (1998), Economic perspective on the health impactof the ageing of the Australian population, National Conference of the Australian PopulationAssociation at the Australian National University, Canberra.
Grotvedt, L. and G. Viksand (1994), ‘‘Life expectancy without diseases and disability’’, in Mathers, C., J.McCallum,
J.M. Robine (eds), Advances in Health Expectancies, Australian Institute of Health and Welfare, AGPS,Canberra.
Inoue, T., T. Shigematsu, Z. Nanjo (1997), ‘‘Health life tables in Japan 1990, a quality of the longest lifeexpectancy in the world, Minzoku Eisei, 63, 4, pp. 226-240.
Mathers, C. (1996), ‘‘Trends in health expectancies in Australia 1981-1993’’, Journal of the AustralianPopulation Association, 13, 1.
Meredith, G. (1995), ‘‘Demographic change and household saving in Japan’’, in Saving Behavior and theAsset Price Bubble in Japan, U. Baumgartner and G. Meridith (eds), IMF Occasional Paper No. 124.
OECD (1996), Ageing in OECD Countries, A Critical Policy Challenge, Social Policy Studies No. 20.
OECD (1998a), Economic Outlook 63, June.
OECD (1998b), Employment Outlook.

ECO/WKP(99)9
65
OECD (1998c), Maintaining Prosperity in an Ageing Society.
Perenboom R.J.M, H. Boshuizen, H.P.A. van der Water (1993), ‘‘Trends in health expectancies in theNetherlands, 1981-1990’’, in Calculation of Health Expectancies, John Libbey, Eurotext.
Robine, J.M. and P. Momiche (1993), ‘‘L’espérance de vie sans incapacité augmentée’’, INSEE Première.
Rothman, G.P. (1998), ‘‘Projections of key aggregates for Australia’s aged – government outlays, financialassets and incomes’’, Conference Paper 98/2 for the sixth colloquium of superannuation researchers,University of Melbourne, RIM Unit.
ECO/WKP(99)9
66
ECONOMICS DEPARTMENT
WORKING PAPERS
216. Estimating Prudent Budgetary Margins for 11 EU Countries : A Simulated SVAR Model Approach(July 1999) Thomas Dalsgaard and Alain de Serres
215. The Problems and Prospects Faced by Pay-As-You-Go Pension Systems : A Case Study of Greece(June 1999) Paul Mylonas and Christine de la Maisonneuve
214. Greek Public Enterprises : Challenges for Reform( May 1999) Paul Mylonas and Isabelle Joumard
213. The Levels and Cyclical Behaviour of Mark-Ups Across Countries and Market Structures(May 1999) Joaquim Oliveira Martins and Stefano Scarpetta
212. Poverty Dynamics in Four OECD Countries(April 1999) Pablo Antolín, Thai-Thanh Dang and Howard OxleyAssisted by Ross Finnie and Roger Sceviour
211. The Recent Experience with Capital Flows to Emerging Market Economies(February 1999) Sveinbjörn Blöndal and Hans Christiansen
210. Foreign Portfolio Investors Before and During a Crisis(February 1999) Woochan Kim and Shang-Jin Wei
209. Towards More Efficient Government : Reforming Federal Fiscal Relations in Germany(February 1999) Eckhard Wurzel
208. Stock Market Fluctuations and Consumption Behaviour : Some Recent Evidence(December 1998) Laurence Boone, Claude Giorno and Pete Richardson
207. Microeconometric analysis of the retirement decision: The Netherlands(June 1998) Maarten Lindeboom
206. Microeconometric analysis of the retirement decision: United Kingdom(June 1998) Raffaele Miniaci and Elena Stancanelli
205. Microeconometric analysis of the retirement decision: Italy(June 1998) Raffaele Miniaci
204. Microeconometric analysis of the retirement decision: Germany(June 1998) Pablo Antolin and Stefano Scarpetta
203. Microeconometric analysis of the retirement decision: United States(June 1998) Joseph Quinn, Richard Burkhauser, Kevin Cahill and Robert Weathers
202. The retirement decision in OECD countries(June 1998) Sveinbjörn Blöndal and Stefano Scarpetta
201. The macroeconomic effects of pension reforms in the context of ageing populations:overlapping generations model simulations for seven OECD countries(June 1998) Ketil Hviding and Marcel Mérette
ECO/WKP(99)9
67
200. The macroeconomics of ageing, pensions and savings: a survey(June 1998) Richard Kohl and Paul O’Brien
199. Marginal Effective Tax Rates on Physical, Human and R&D Capital(May 1998) Kathryn Gordon and Harry Tchilinguirian
198. The Norwegian Health Care System(May 1998) Paul van den Noord, Terje Hagen and Tor Iversen
197. APEC Trade Liberalisation : Its Implications(May 1998) Seunghee Han and Inkyo Cheong
196. The OECD Jobs Strategy : Progress Report on Implementation of Country Specific Recommendations(May 1998)
196 La Strategie de l’OCDE pour l’emploi : rapport sur l’état d’avancement de la mise en oeuvre des recommandations par pays(May 1998)
195. Trends in OECD Countries’ International Competitiveness(April 1998) Martine Durand, Christophe Madashi and Flavia Terribile
194. The European Union’s Trade Policies and their Economic Effects(April 1998) Peter Hoeller, Nathalie Girouard and Alessandra Colecchia
193. The Macroeconomic Implications of Ageing in a Global Context(March 1998) Dave Turner, Claude Giorno, Alain De Serres, Ann Vourc’h and Pete Richardson
192. Efficiency and Distribution in Computable Models of Carbon Emission Abatement(March 1998) Joaquim Oliveira Martins and Peter Sturm
191. Monetary Policy when Inflation is Low(March 1998) Charles Pigott and Hans Christiansen
190. Submission by the OECD to the G8 Growth, Employability and Inclusion Conference(March 1998)
189. Income Distribution and Poverty in Selected OECD Countries(March 1998) Jean-Marc Burniaux, Thai-Thanh Dang, Douglas Fore, Michael Förster,Marco Mira d’Ercole and Howard Oxley
188. Asset Prices and Monetary Policy(February 1998) Mike Kennedy, Angel Palerm, Charles Pigott and Flavia Terribile
187. NAIRU: Incomes Policy and Inflation(January 1998) Silvia Fabiani, Alberto Locarno, Gian Paolo Oneto and Paolo Sestito
186. OECD Submission to the Irish National Minimum Wage Commission(December 1997)
185. OECD Submission to the UK Low Pay Commission(December 1997)


