Ecotoxicology of Antimicrobial Pharmaceutical and … · Ecotoxicology of Antimicrobial...
83
Ecotoxicology of Antimicrobial Pharmaceutical and Personal Care Products in Illinois Rivers and Streams John Kelly Loyola University Chicago
Transcript of Ecotoxicology of Antimicrobial Pharmaceutical and … · Ecotoxicology of Antimicrobial...
Ecotoxicology of Antimicrobial Pharmaceutical and Personal Care
Products in Illinois Rivers and Streams
John Kelly Loyola University Chicago

Acknowledgements
Collaborators • Emma Rosi-Marshall
– The Cary Institute of Ecosystem Studies • John Scott
– Illinois Sustainable Technology Center • Teresa Chow
– Illinois Sustainable Technology Center • Monte Wilcoxon
– Illinois Sustainable Technology Center
Funding • Illinois Sustainable Technology Center
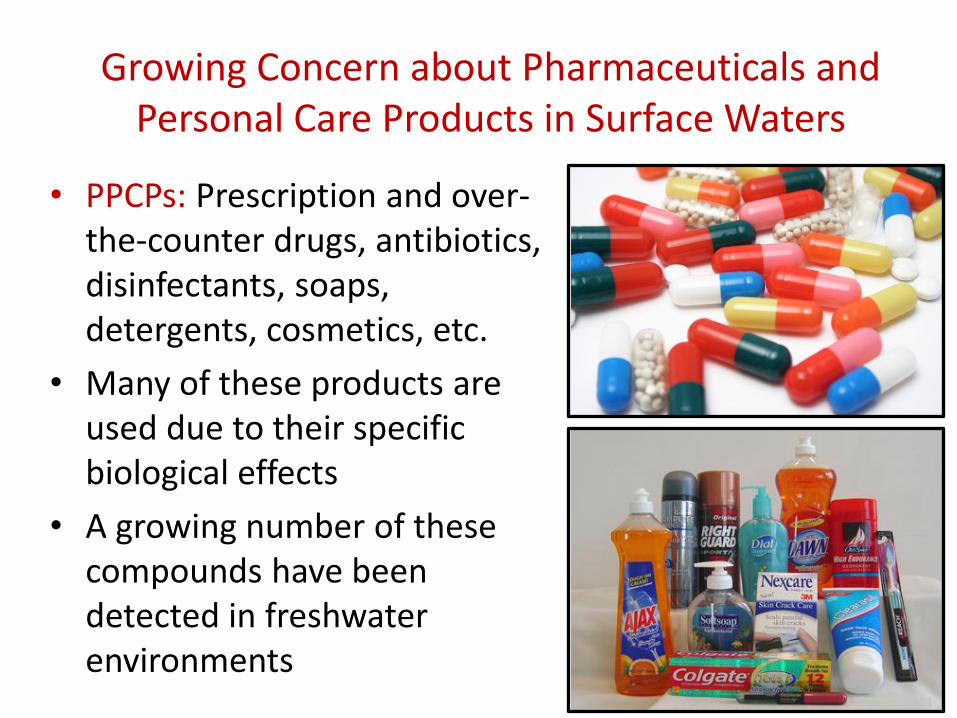
Growing Concern about Pharmaceuticals and Personal Care Products in Surface Waters
• PPCPs: Prescription and over-the-counter drugs, antibiotics, disinfectants, soaps, detergents, cosmetics, etc.
• Many of these products are used due to their specific biological effects
• A growing number of these compounds have been detected in freshwater environments
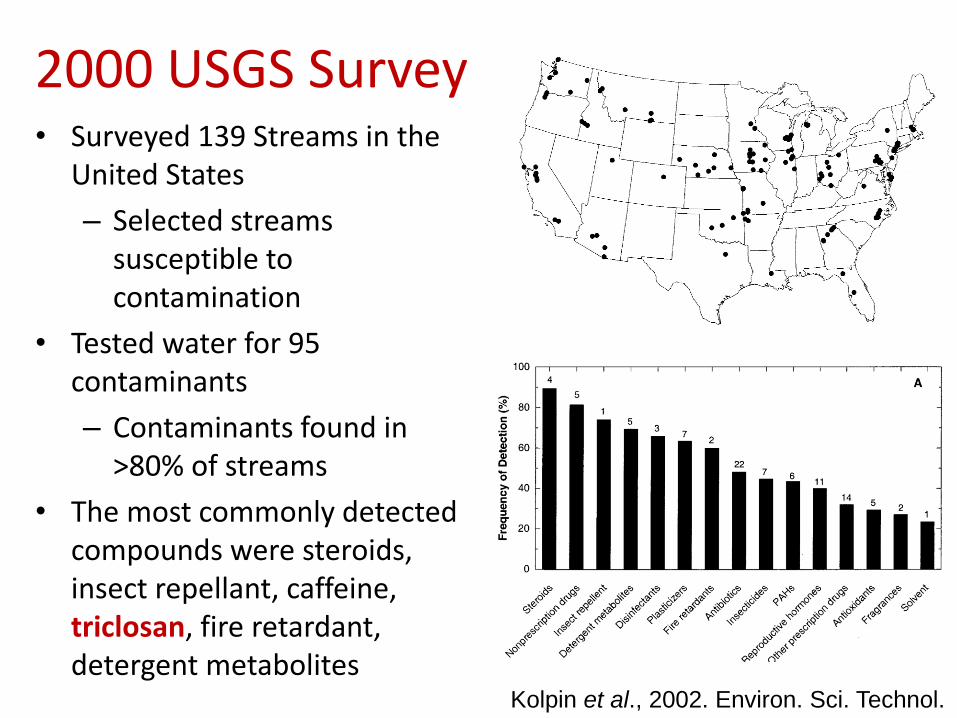
2000 USGS Survey • Surveyed 139 Streams in the
United States
– Selected streams susceptible to contamination
• Tested water for 95 contaminants
– Contaminants found in >80% of streams
• The most commonly detected compounds were steroids, insect repellant, caffeine, triclosan, fire retardant, detergent metabolites
Kolpin et al., 2002. Environ. Sci. Technol.
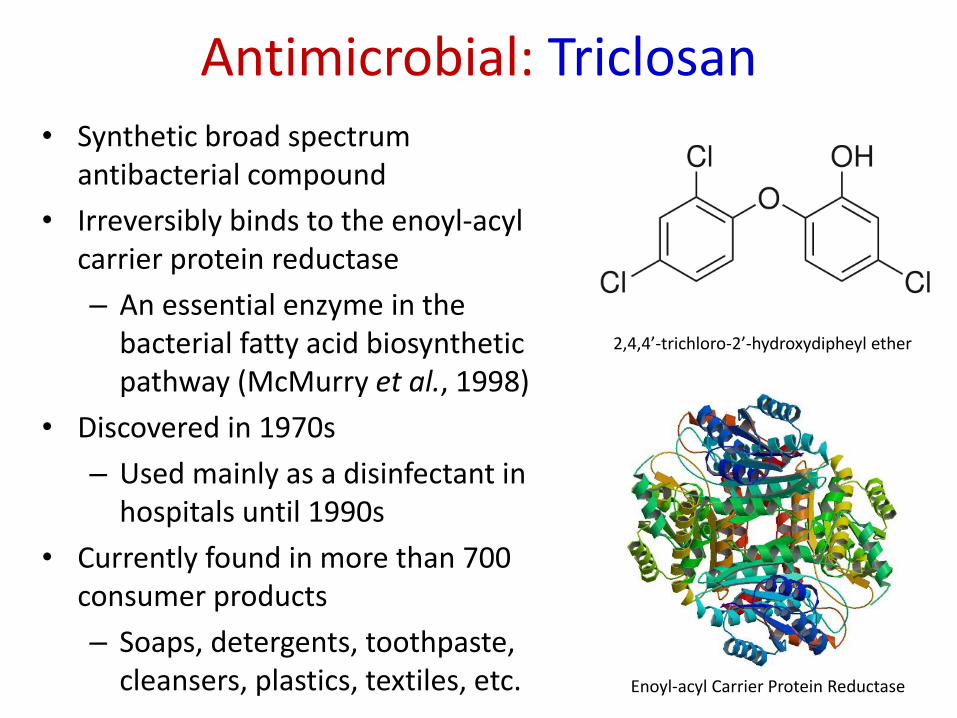
Antimicrobial: Triclosan • Synthetic broad spectrum
antibacterial compound
• Irreversibly binds to the enoyl-acyl carrier protein reductase
– An essential enzyme in the bacterial fatty acid biosynthetic pathway (McMurry et al., 1998)
• Discovered in 1970s
– Used mainly as a disinfectant in hospitals until 1990s
• Currently found in more than 700 consumer products
– Soaps, detergents, toothpaste, cleansers, plastics, textiles, etc.
2,4,4’-trichloro-2’-hydroxydipheyl ether
Enoyl-acyl Carrier Protein Reductase
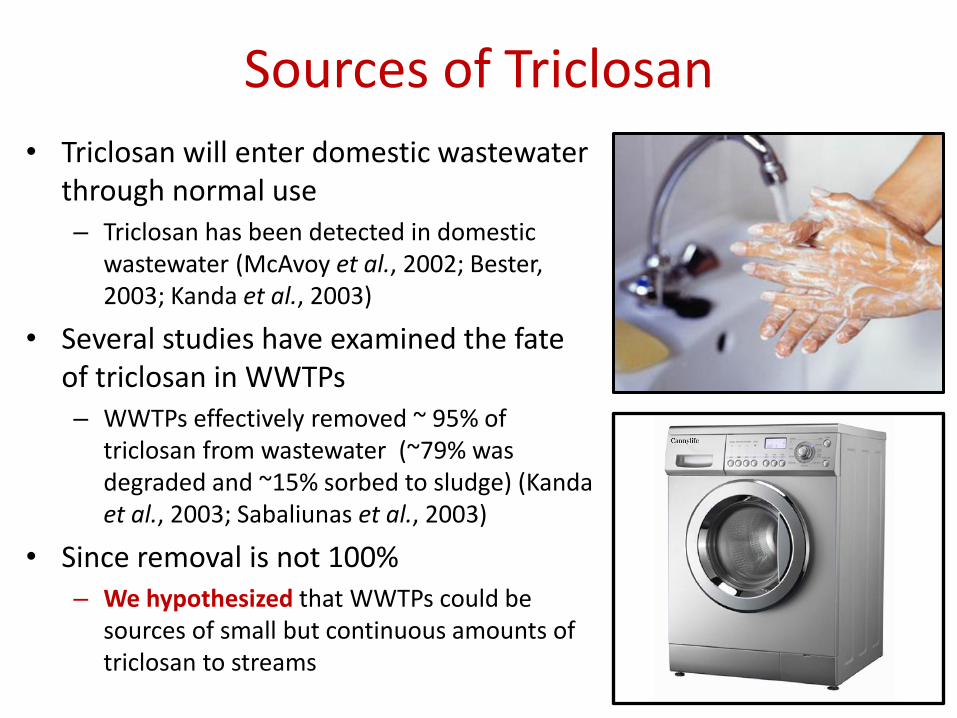
Sources of Triclosan
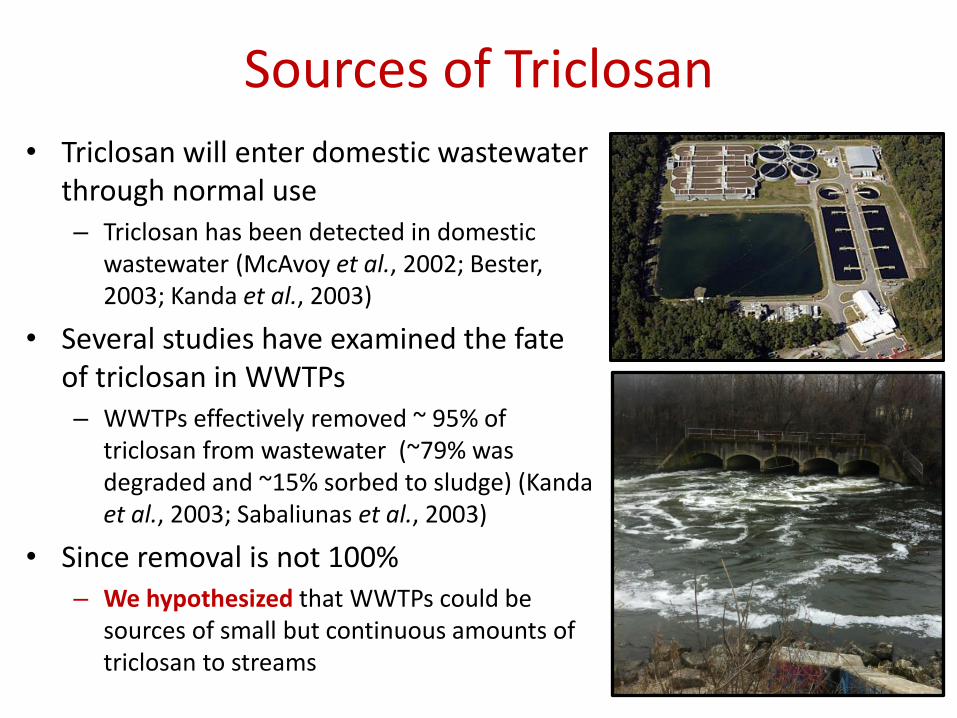
• Triclosan will enter domestic wastewater through normal use – Triclosan has been detected in domestic
wastewater (McAvoy et al., 2002; Bester, 2003; Kanda et al., 2003)
• Several studies have examined the fate of triclosan in WWTPs – WWTPs effectively removed ~ 95% of
triclosan from wastewater (~79% was degraded and ~15% sorbed to sludge) (Kanda et al., 2003; Sabaliunas et al., 2003)
• Since removal is not 100% – We hypothesized that WWTPs could be
sources of small but continuous amounts of triclosan to streams
Sources of Triclosan
• Triclosan will enter domestic wastewater through normal use – Triclosan has been detected in domestic
wastewater (McAvoy et al., 2002; Bester, 2003; Kanda et al., 2003)
• Several studies have examined the fate of triclosan in WWTPs – WWTPs effectively removed ~ 95% of
triclosan from wastewater (~79% was degraded and ~15% sorbed to sludge) (Kanda et al., 2003; Sabaliunas et al., 2003)
• Since removal is not 100% – We hypothesized that WWTPs could be
sources of small but continuous amounts of triclosan to streams
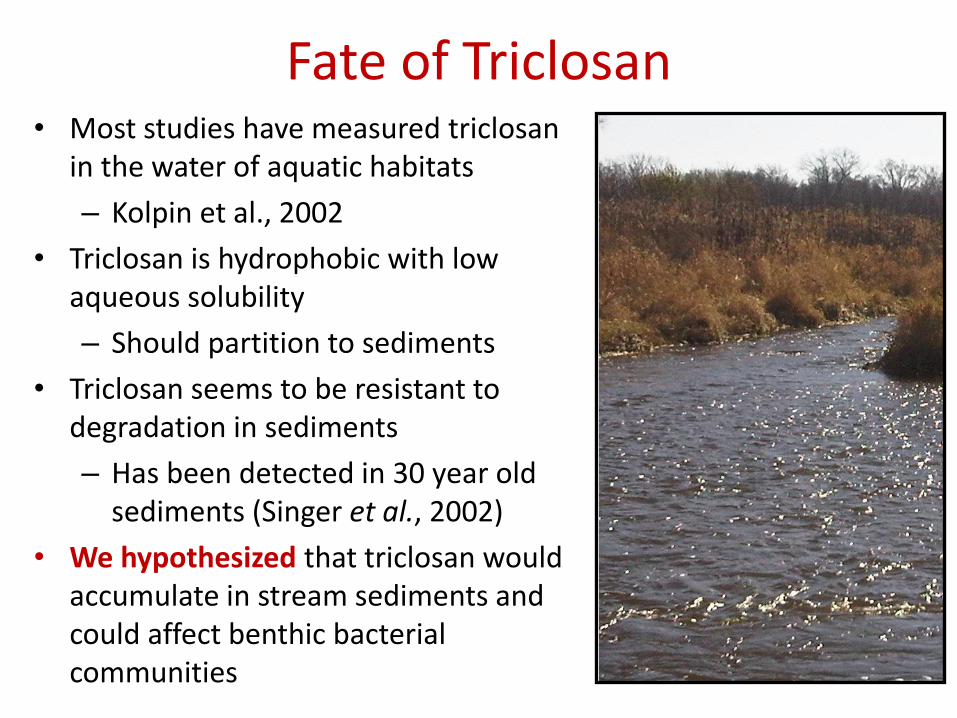
Fate of Triclosan • Most studies have measured triclosan
in the water of aquatic habitats
– Kolpin et al., 2002
• Triclosan is hydrophobic with low aqueous solubility
– Should partition to sediments
• Triclosan seems to be resistant to degradation in sediments
– Has been detected in 30 year old sediments (Singer et al., 2002)
• We hypothesized that triclosan would accumulate in stream sediments and could affect benthic bacterial communities
Benthic Microbial Communities These communities are important components
of stream ecosystems
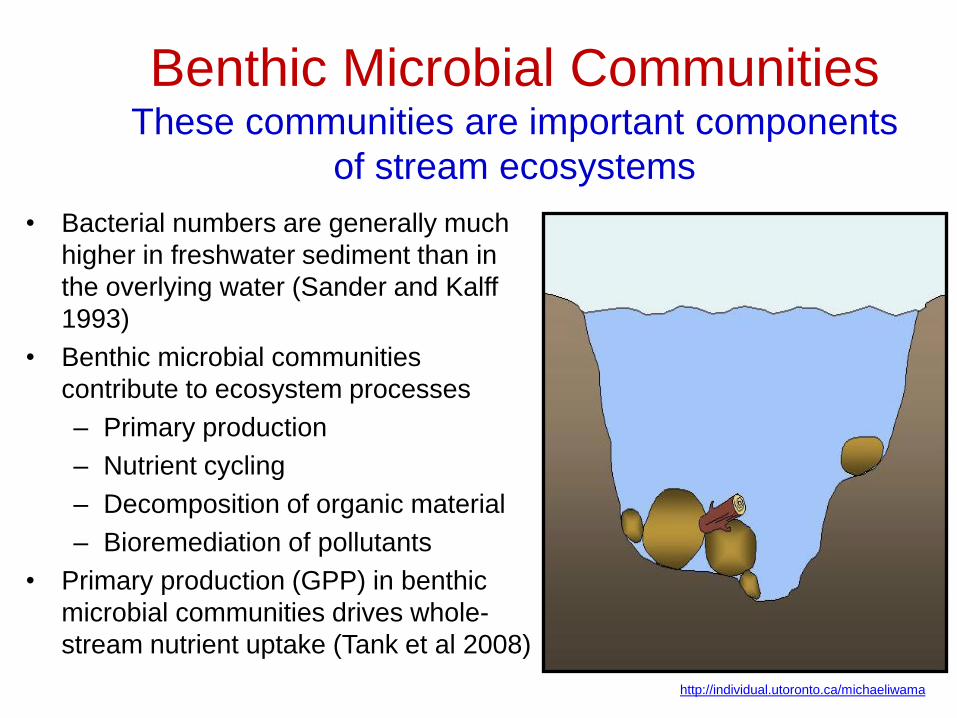
• Bacterial numbers are generally much
higher in freshwater sediment than in
the overlying water (Sander and Kalff
1993)
• Benthic microbial communities
contribute to ecosystem processes
– Primary production
– Nutrient cycling
– Decomposition of organic material
– Bioremediation of pollutants
• Primary production (GPP) in benthic
microbial communities drives whole-
stream nutrient uptake (Tank et al 2008)
http://individual.utoronto.ca/michaeliwama
Effects of Triclosan on Bacteria
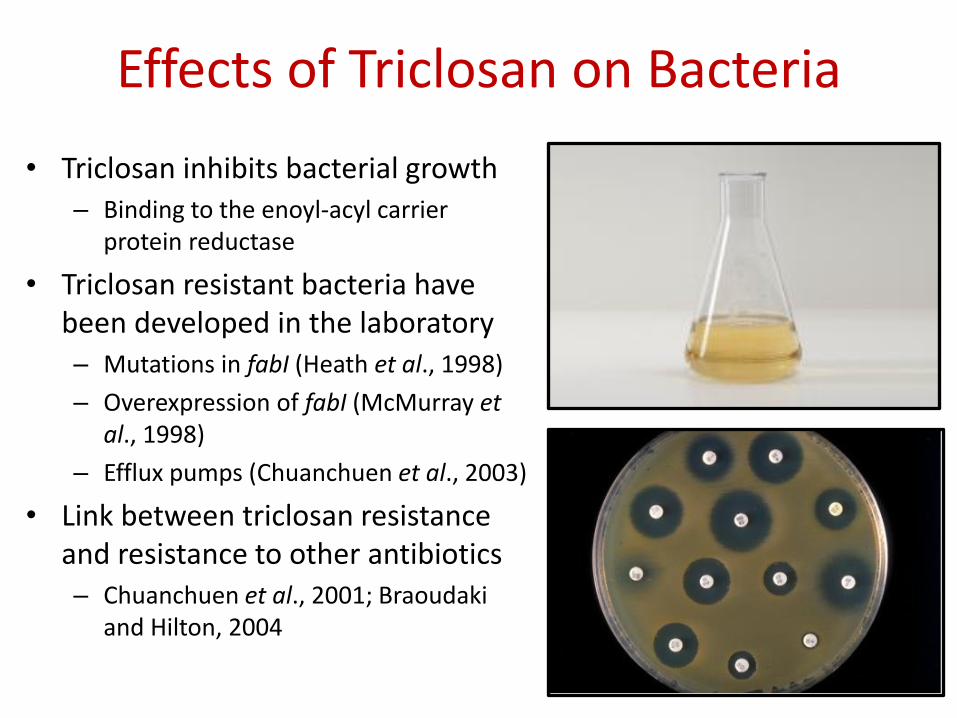
• Triclosan inhibits bacterial growth – Binding to the enoyl-acyl carrier
protein reductase
• Triclosan resistant bacteria have been developed in the laboratory – Mutations in fabI (Heath et al., 1998)
– Overexpression of fabI (McMurray et al., 1998)
– Efflux pumps (Chuanchuen et al., 2003)
• Link between triclosan resistance and resistance to other antibiotics – Chuanchuen et al., 2001; Braoudaki
and Hilton, 2004
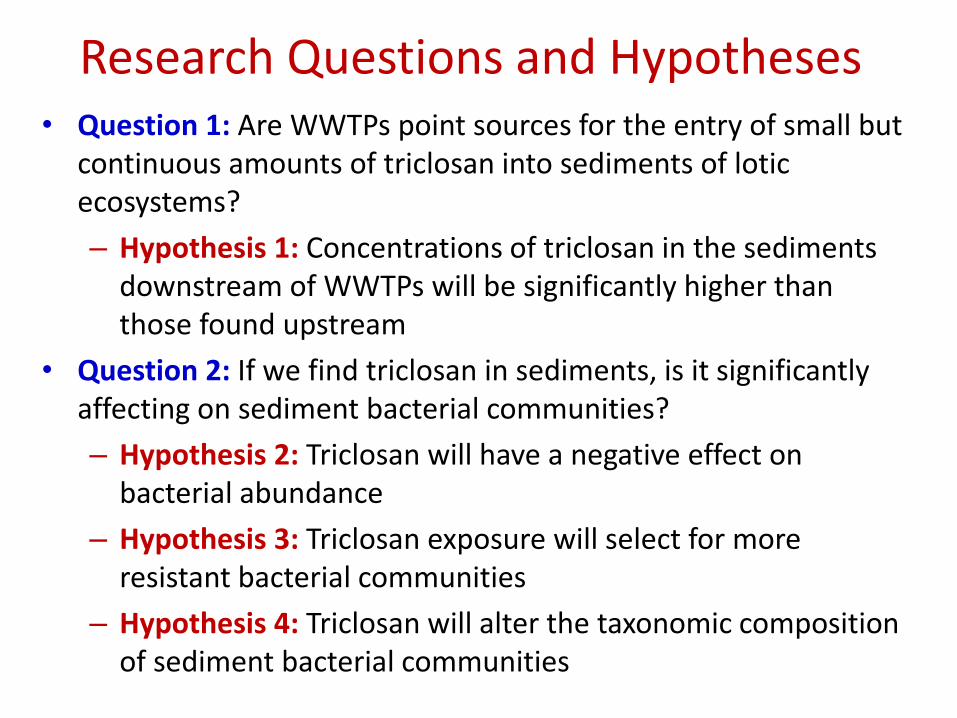
Research Questions and Hypotheses • Question 1: Are WWTPs point sources for the entry of small but
continuous amounts of triclosan into sediments of lotic ecosystems?
– Hypothesis 1: Concentrations of triclosan in the sediments downstream of WWTPs will be significantly higher than those found upstream
• Question 2: If we find triclosan in sediments, is it significantly affecting on sediment bacterial communities?
– Hypothesis 2: Triclosan will have a negative effect on bacterial abundance
– Hypothesis 3: Triclosan exposure will select for more resistant bacterial communities
– Hypothesis 4: Triclosan will alter the taxonomic composition of sediment bacterial communities
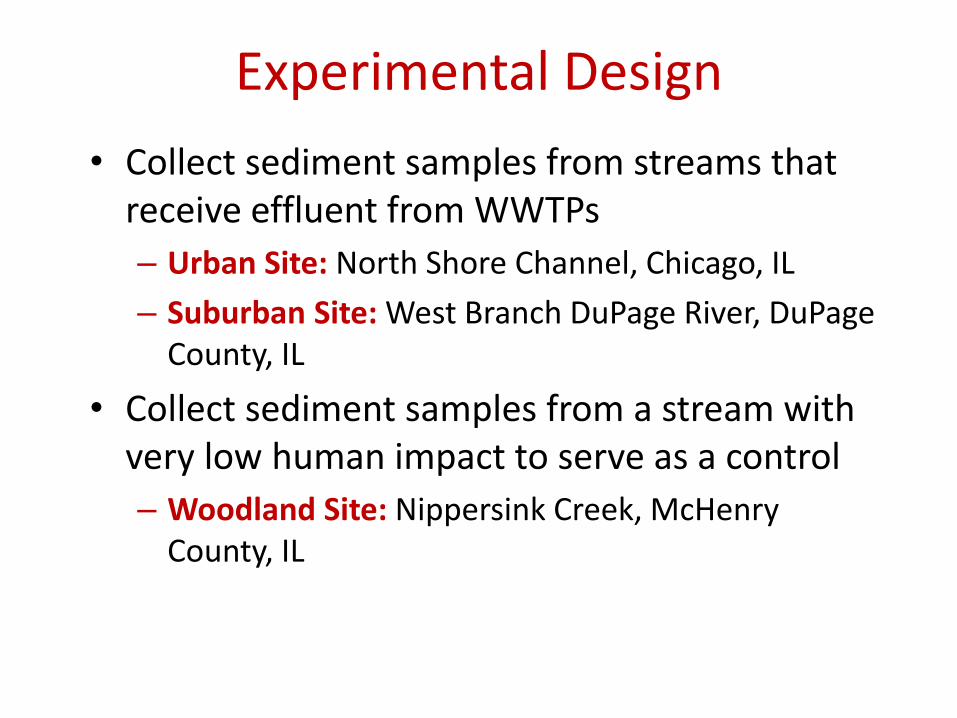
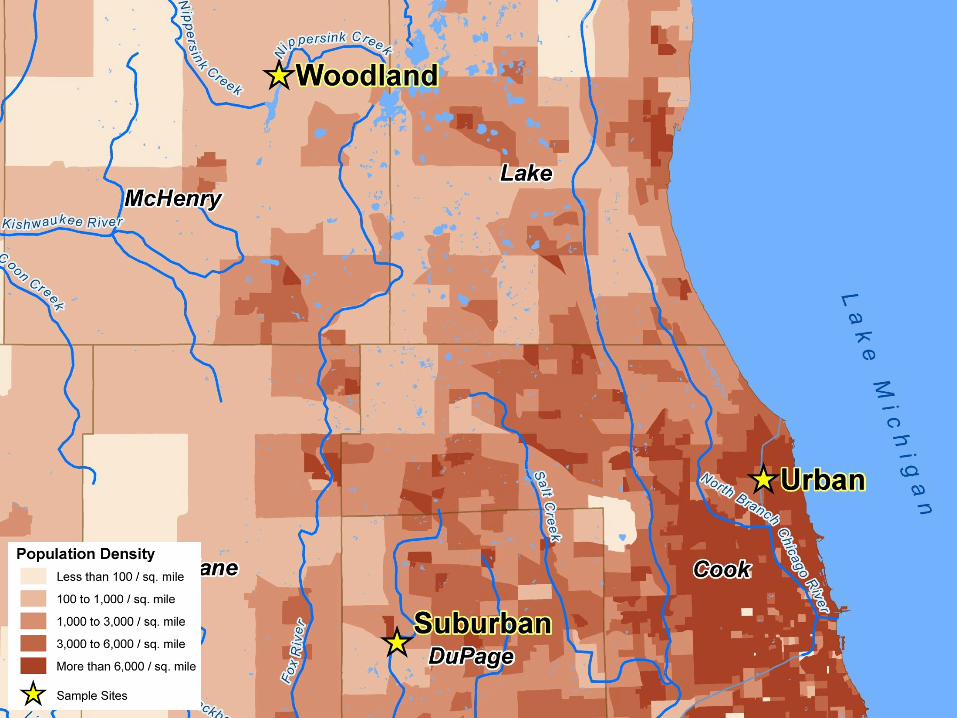
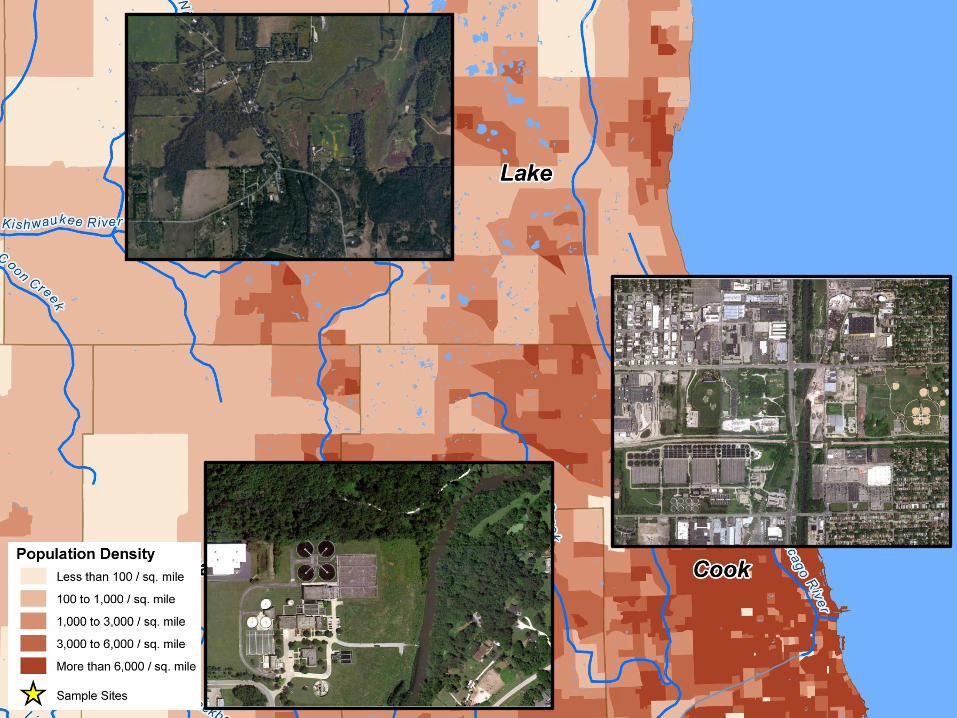
Experimental Design
• Collect sediment samples from streams that receive effluent from WWTPs
– Urban Site: North Shore Channel, Chicago, IL
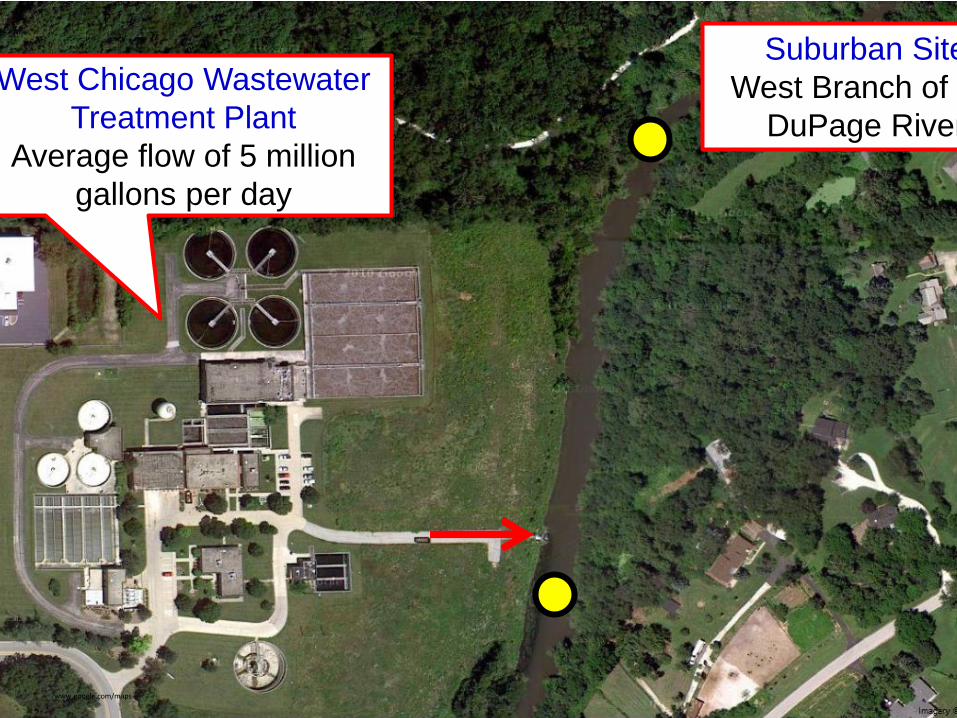
– Suburban Site: West Branch DuPage River, DuPage County, IL
• Collect sediment samples from a stream with very low human impact to serve as a control
– Woodland Site: Nippersink Creek, McHenry County, IL
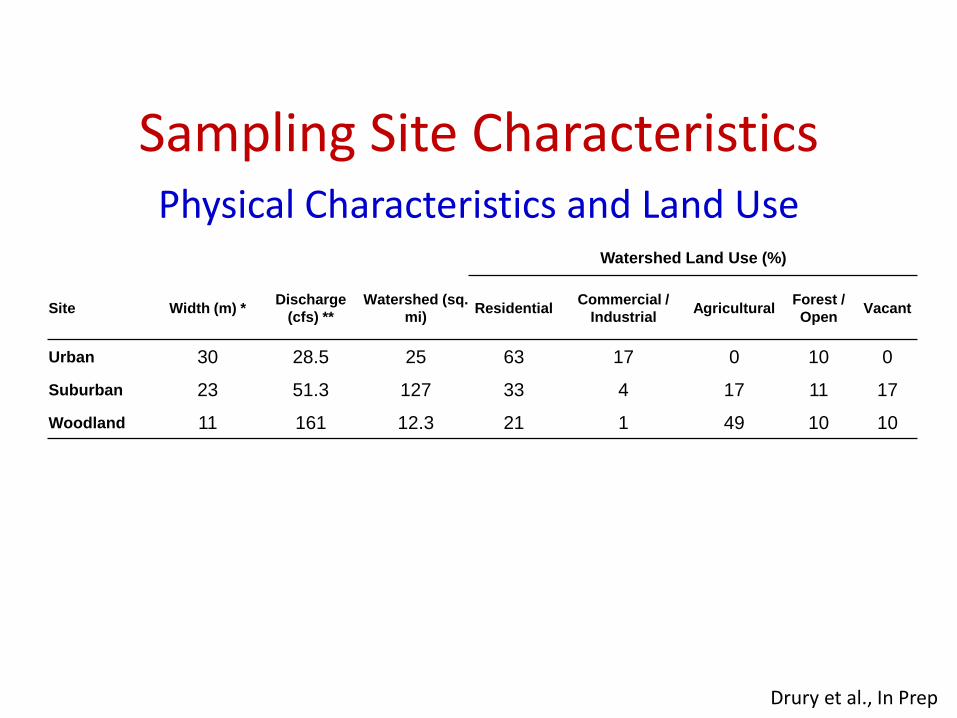
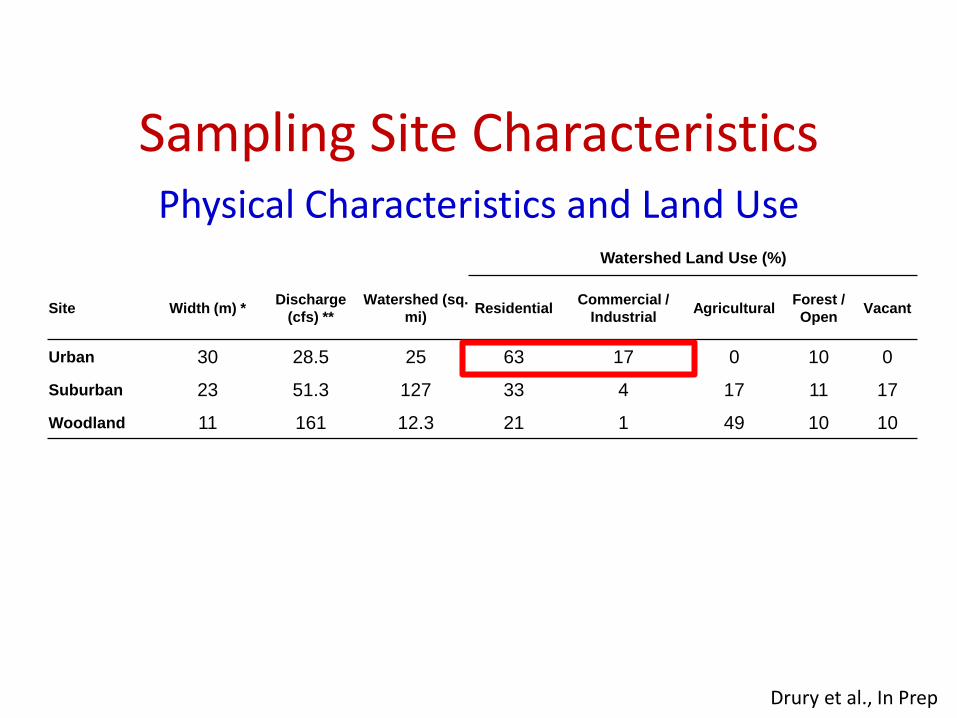
Sampling Site Characteristics
Watershed Land Use (%)
Site Width (m) * Discharge
(cfs) **
Watershed (sq.
mi) Residential
Commercial /
Industrial Agricultural
Forest /
Open Vacant
Urban 30 28.5 25 63 17 0 10 0
Suburban 23 51.3 127 33 4 17 11 17
Woodland 11 161 12.3 21 1 49 10 10
Physical Characteristics and Land Use
Drury et al., In Prep
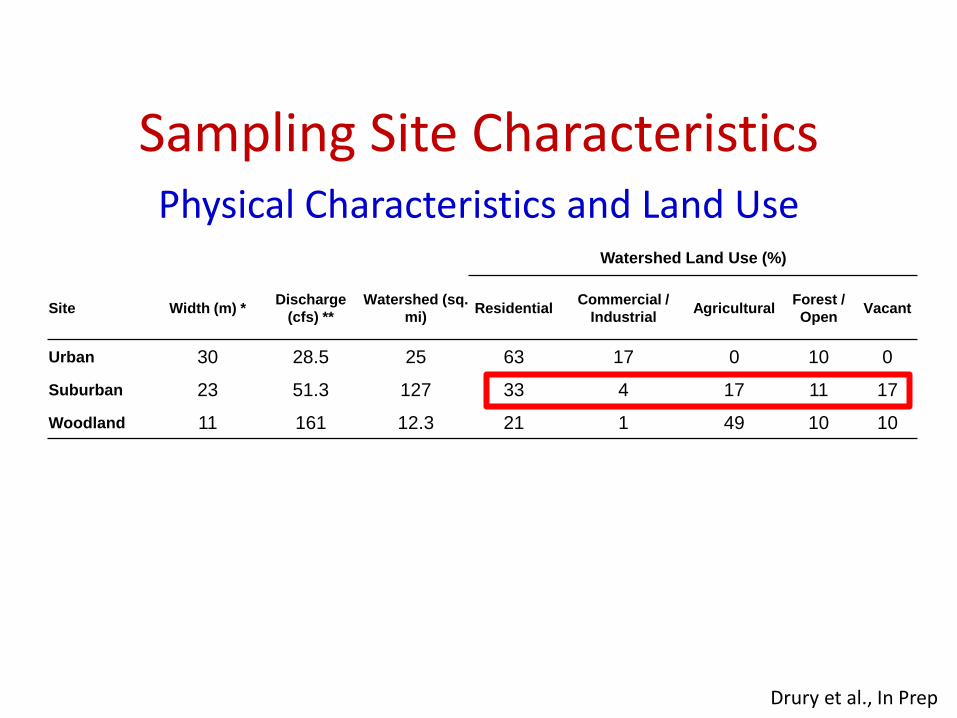
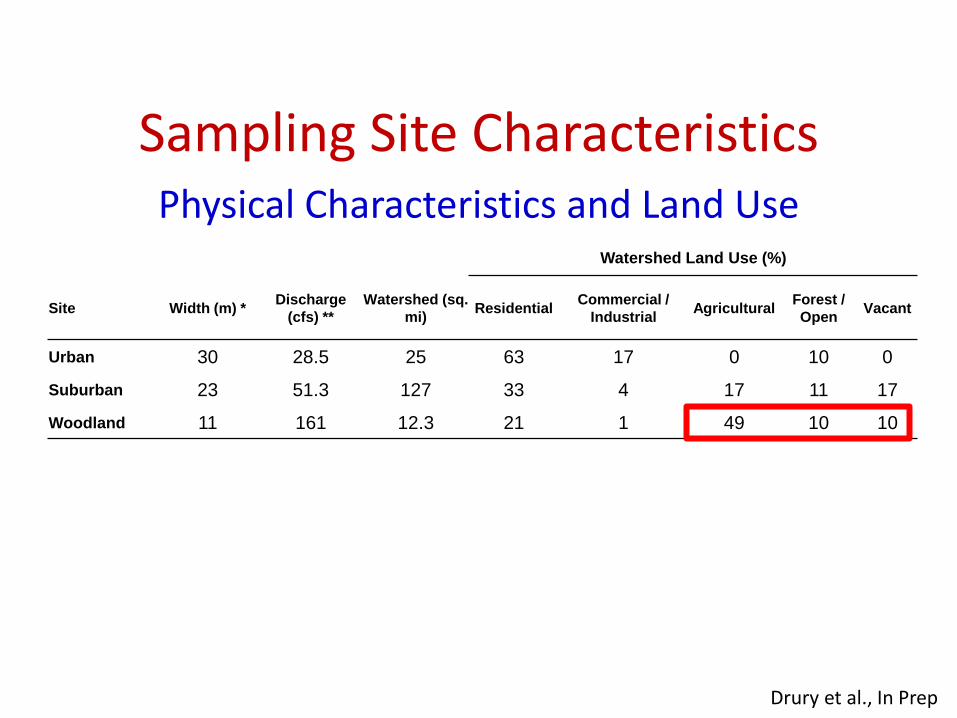
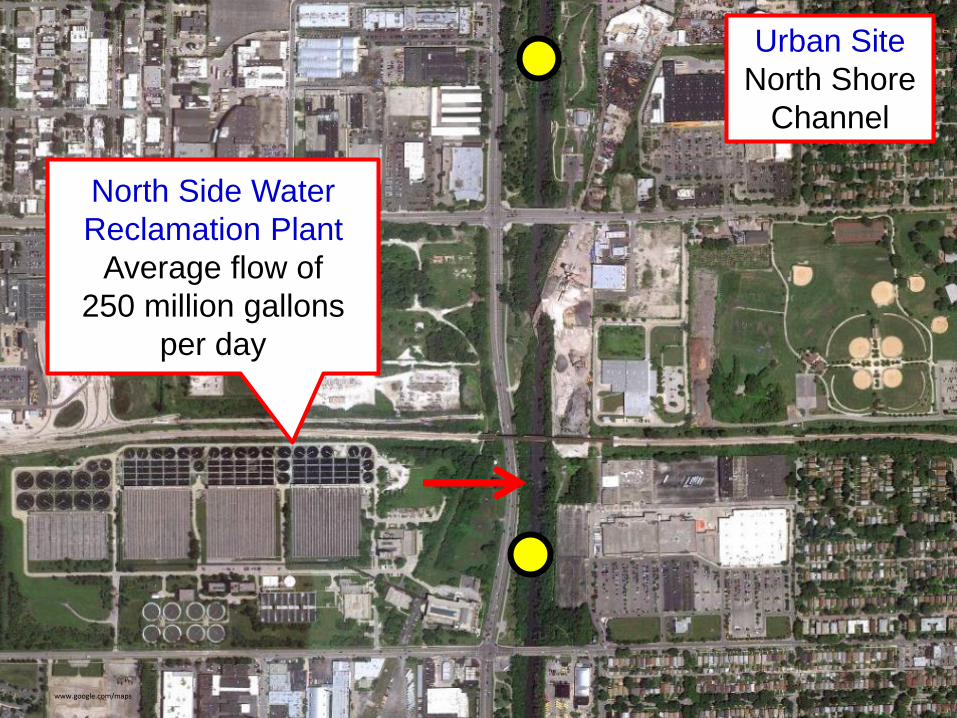
www.google.com/maps
Urban Site
North Shore
Channel
North Side Water
Reclamation Plant
Average flow of
250 million gallons
per day
www.google.com/maps
West Chicago Wastewater
Treatment Plant
Average flow of 5 million
gallons per day
Suburban Site
West Branch of the
DuPage River
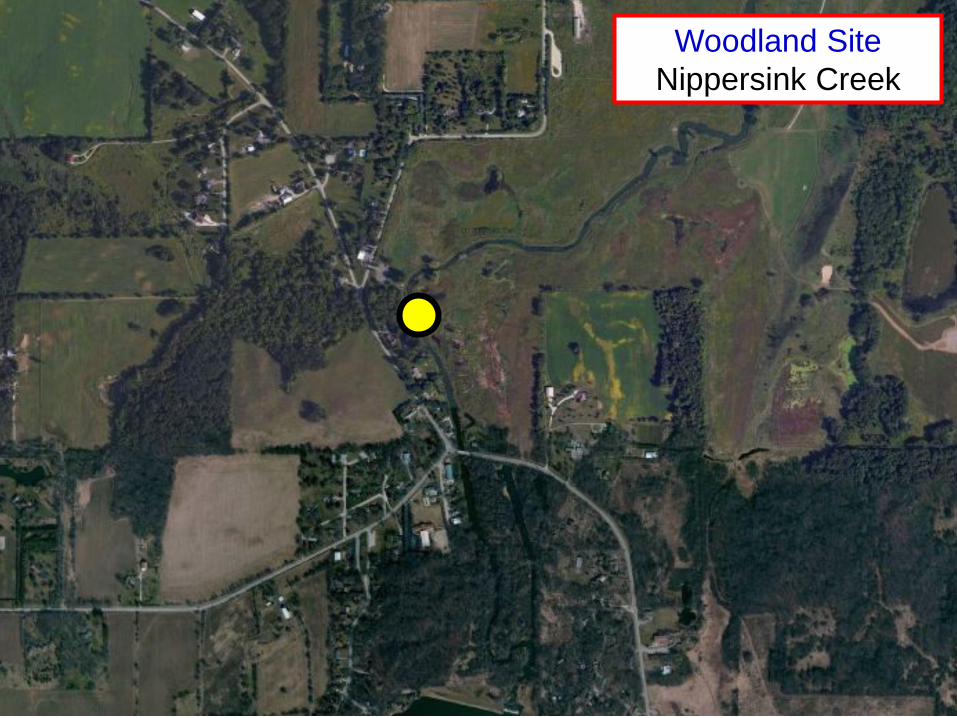
Woodland Site
Nippersink Creek
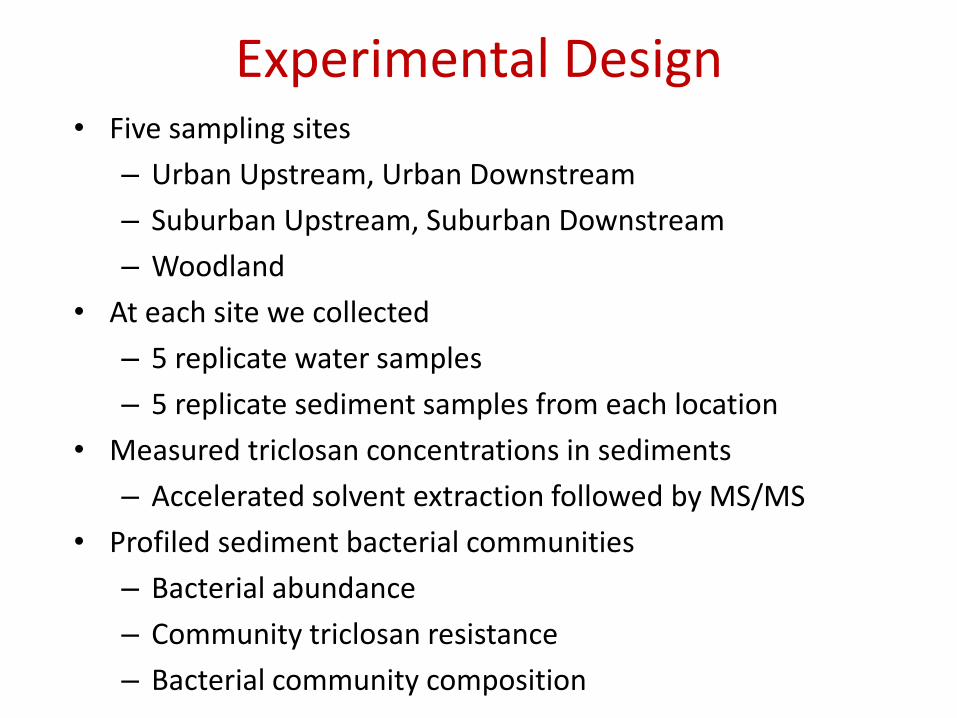
Experimental Design • Five sampling sites
– Urban Upstream, Urban Downstream
– Suburban Upstream, Suburban Downstream
– Woodland
• At each site we collected
– 5 replicate water samples
– 5 replicate sediment samples from each location
• Measured triclosan concentrations in sediments
– Accelerated solvent extraction followed by MS/MS
• Profiled sediment bacterial communities
– Bacterial abundance
– Community triclosan resistance
– Bacterial community composition
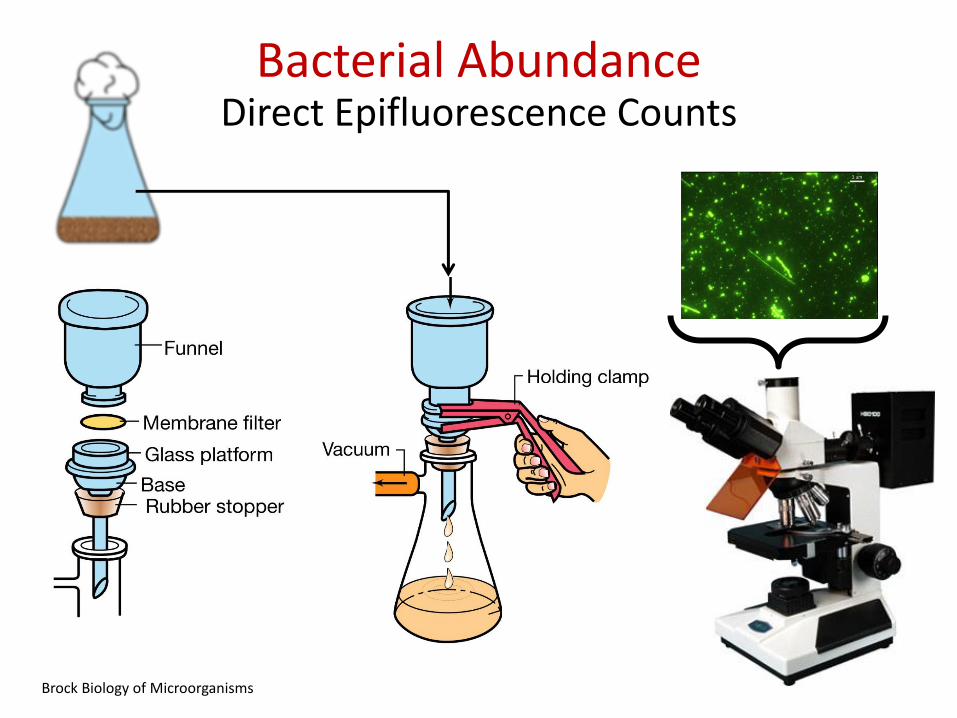
Brock Biology of Microorganisms
Bacterial Abundance Direct Epifluorescence Counts
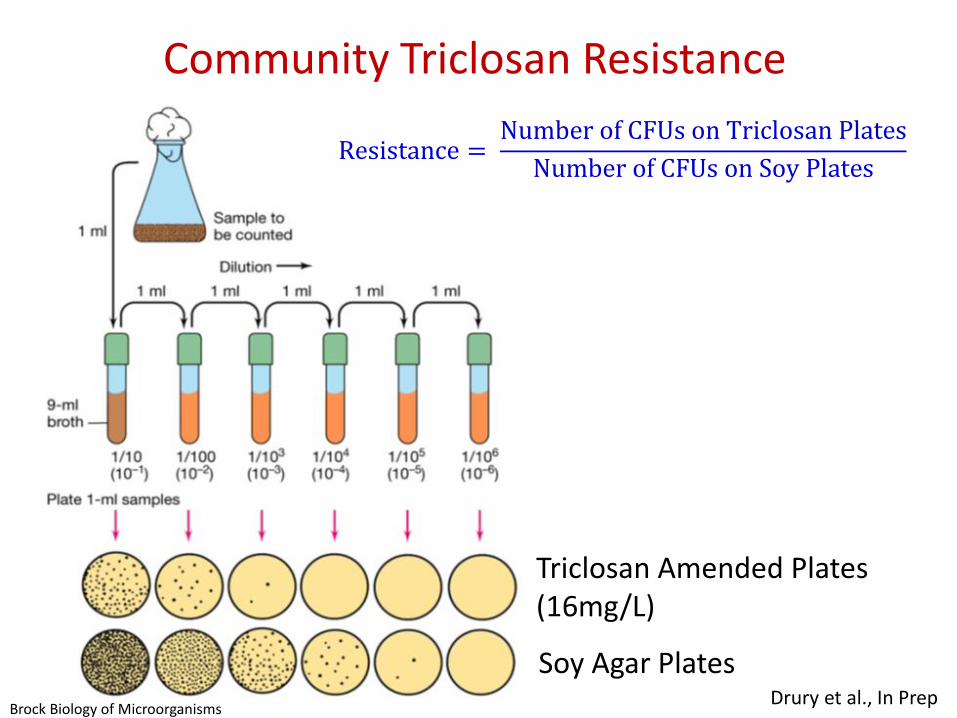
Soy Agar Plates
Triclosan Amended Plates (16mg/L)
Brock Biology of Microorganisms
Resistance = Number of CFUs on Triclosan Plates
Number of CFUs on Soy Plates
Community Triclosan Resistance
Drury et al., In Prep
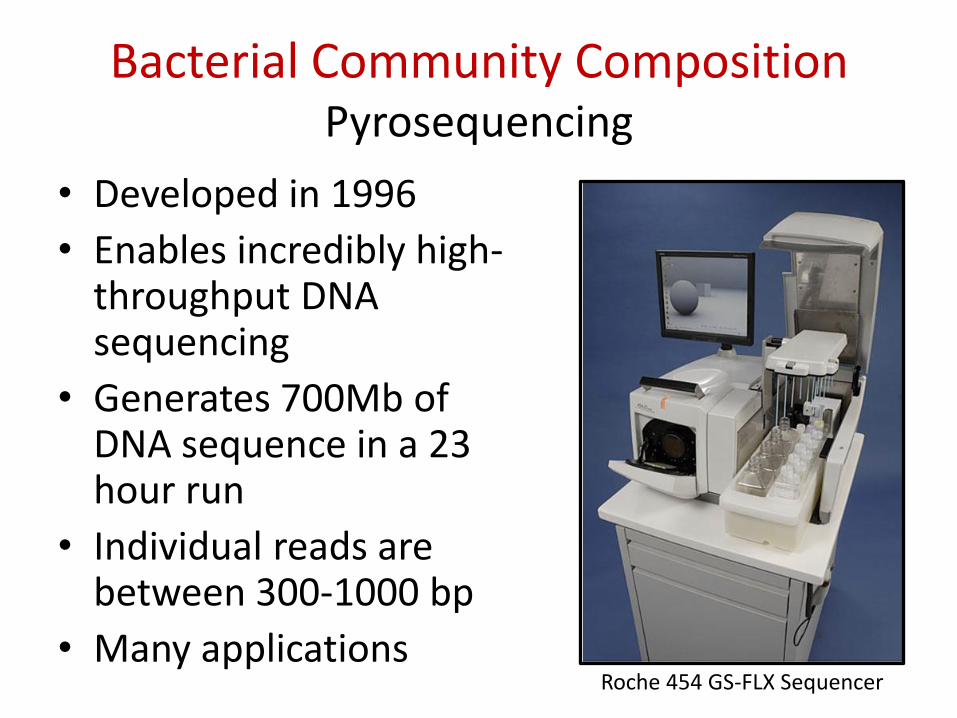
Bacterial Community Composition Pyrosequencing
• Developed in 1996
• Enables incredibly high-throughput DNA sequencing
• Generates 700Mb of DNA sequence in a 23 hour run
• Individual reads are between 300-1000 bp
• Many applications
Roche 454 GS-FLX Sequencer
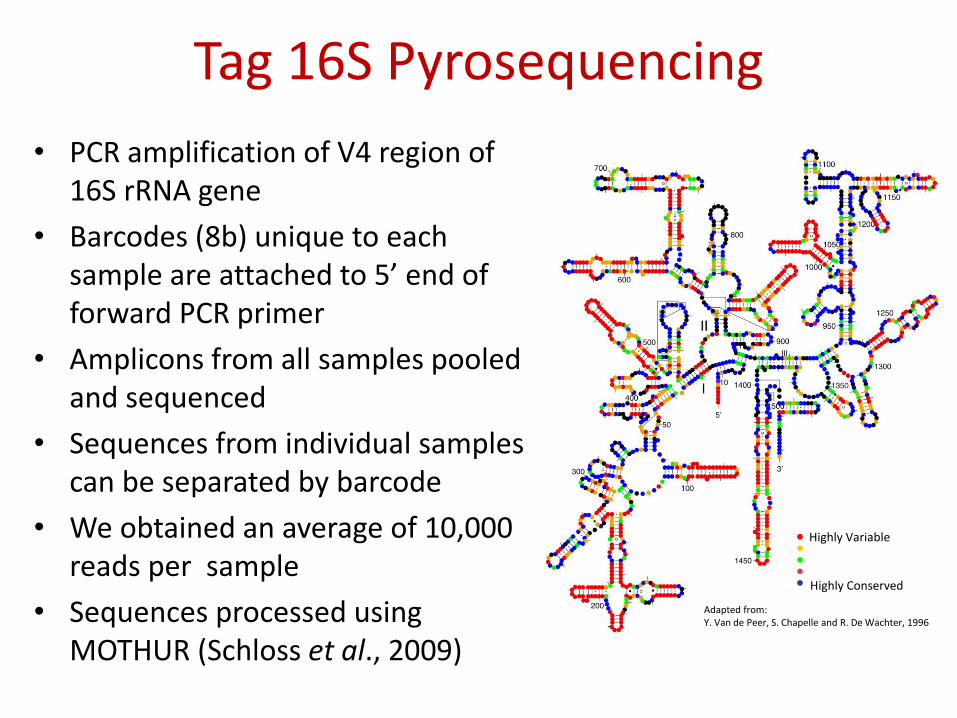
Tag 16S Pyrosequencing
• PCR amplification of V4 region of 16S rRNA gene
• Barcodes (8b) unique to each sample are attached to 5’ end of forward PCR primer
• Amplicons from all samples pooled and sequenced
• Sequences from individual samples can be separated by barcode
• We obtained an average of 10,000 reads per sample
• Sequences processed using MOTHUR (Schloss et al., 2009)
Adapted from: Y. Van de Peer, S. Chapelle and R. De Wachter, 1996
Highly Variable
Highly Conserved
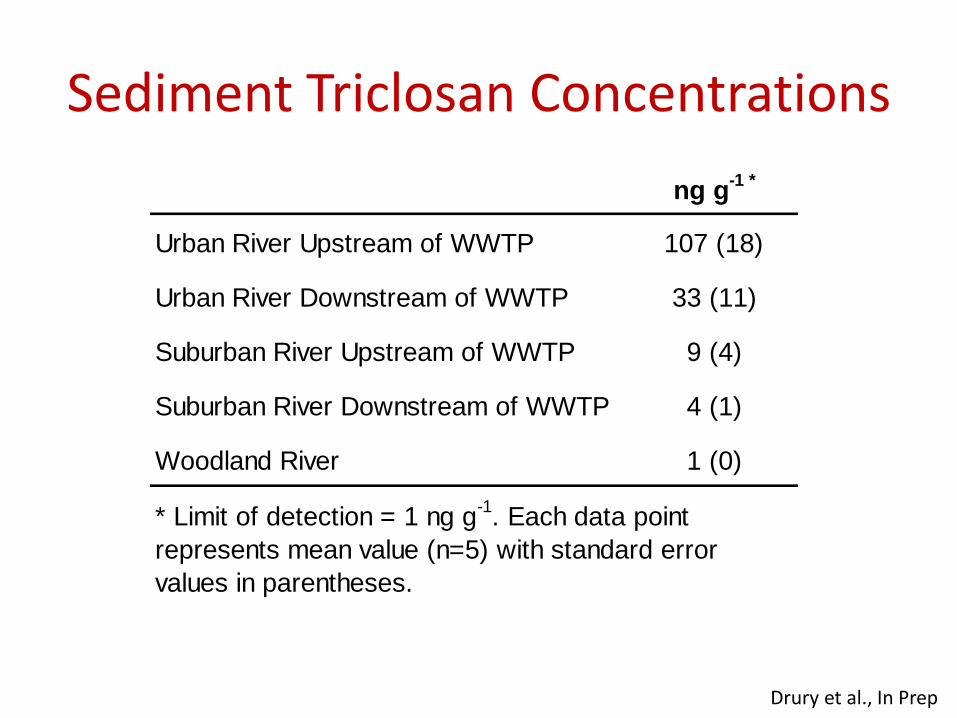
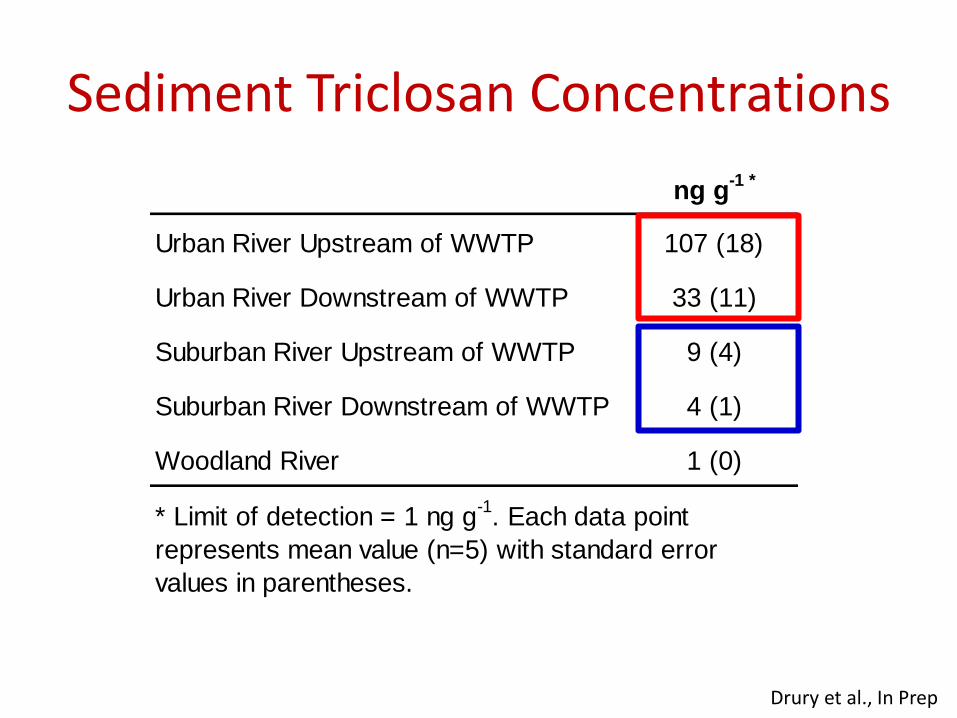
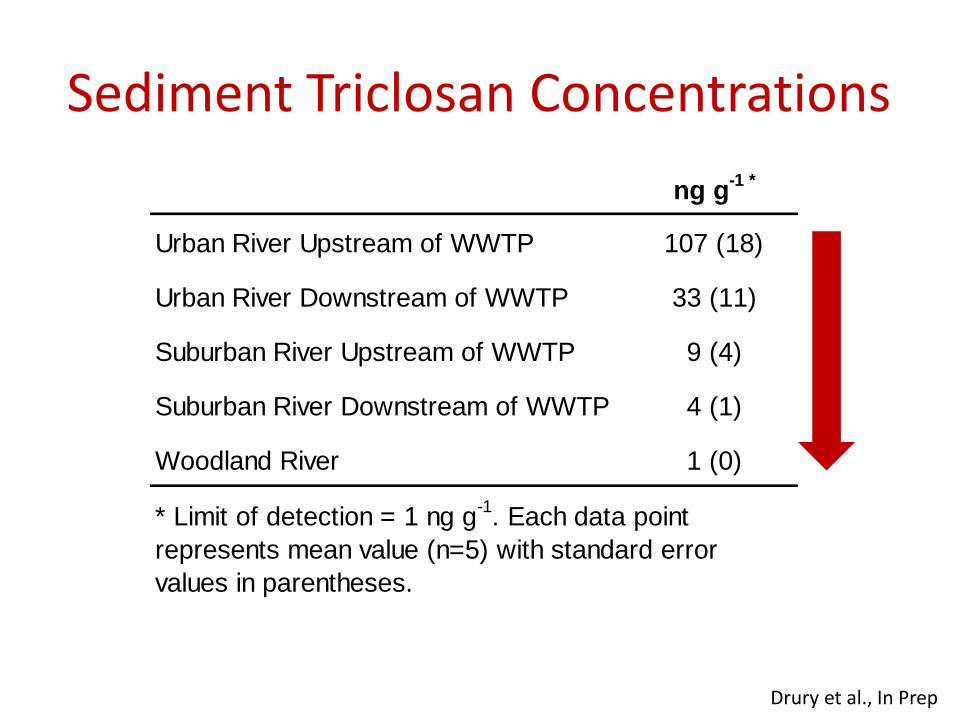
Sediment Triclosan Concentrations
ng g-1 *
Urban River Upstream of WWTP 107 (18)
Urban River Downstream of WWTP 33 (11)
Suburban River Upstream of WWTP 9 (4)
Suburban River Downstream of WWTP 4 (1)
Woodland River 1 (0)
* Limit of detection = 1 ng g-1. Each data point
represents mean value (n=5) with standard error
values in parentheses.
Drury et al., In Prep
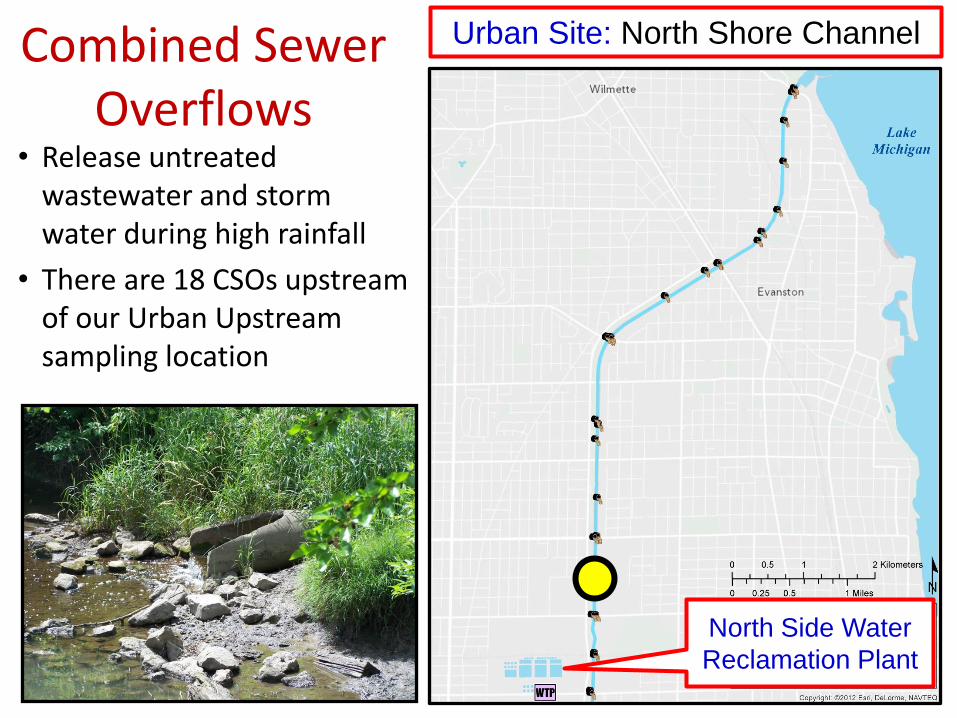
Combined Sewer Overflows
• Release untreated wastewater and storm water during high rainfall
• There are 18 CSOs upstream of our Urban Upstream sampling location
North Side Water
Reclamation Plant
Urban Site: North Shore Channel
Sediment Triclosan Concentrations
ng g-1 *
Urban River Upstream of WWTP 107 (18)
Urban River Downstream of WWTP 33 (11)
Suburban River Upstream of WWTP 9 (4)
Suburban River Downstream of WWTP 4 (1)
Woodland River 1 (0)
* Limit of detection = 1 ng g-1. Each data point
represents mean value (n=5) with standard error
values in parentheses.
Drury et al., In Prep
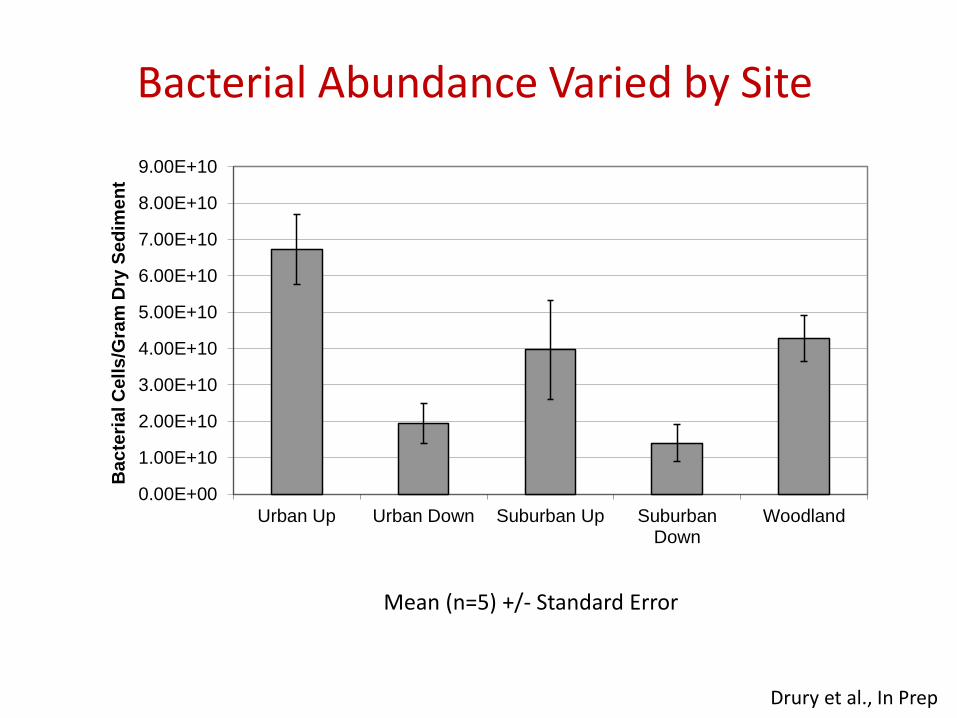
Bacterial Abundance Varied by Site
Mean (n=5) +/- Standard Error
Drury et al., In Prep
0.00E+00
1.00E+10
2.00E+10
3.00E+10
4.00E+10
5.00E+10
6.00E+10
7.00E+10
8.00E+10
9.00E+10
Urban Up Urban Down Suburban Up SuburbanDown
Woodland
Bac
teri
al C
ell
s/G
ram
Dry
Se
dim
en
t
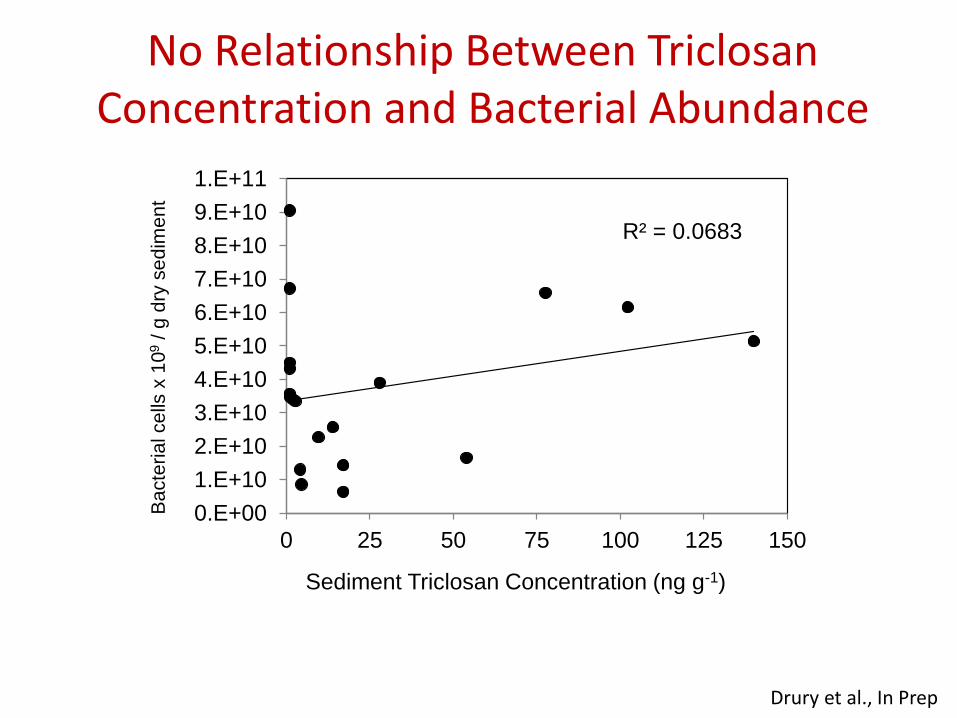
No Relationship Between Triclosan Concentration and Bacterial Abundance
Drury et al., In Prep
R² = 0.0683
0.E+00
1.E+10
2.E+10
3.E+10
4.E+10
5.E+10
6.E+10
7.E+10
8.E+10
9.E+10
1.E+11
0 25 50 75 100 125 150
Ba
cte
rial ce
lls x
10
9/ g d
ry s
ed
ime
nt
Sediment Triclosan Concentration (ng g-1)
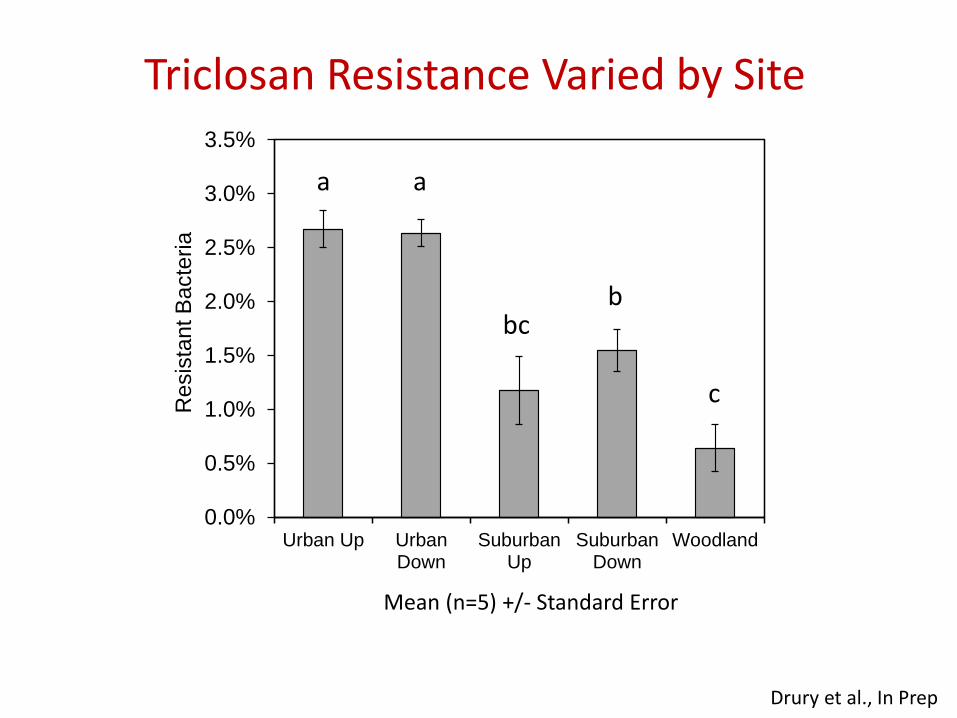
Triclosan Resistance Varied by Site
Mean (n=5) +/- Standard Error
Drury et al., In Prep
0.0%
0.5%
1.0%
1.5%
2.0%
2.5%
3.0%
3.5%
Urban Up UrbanDown
SuburbanUp
SuburbanDown
Woodland
Re
sis
tan
t B
acte
ria
a a
bcb
c
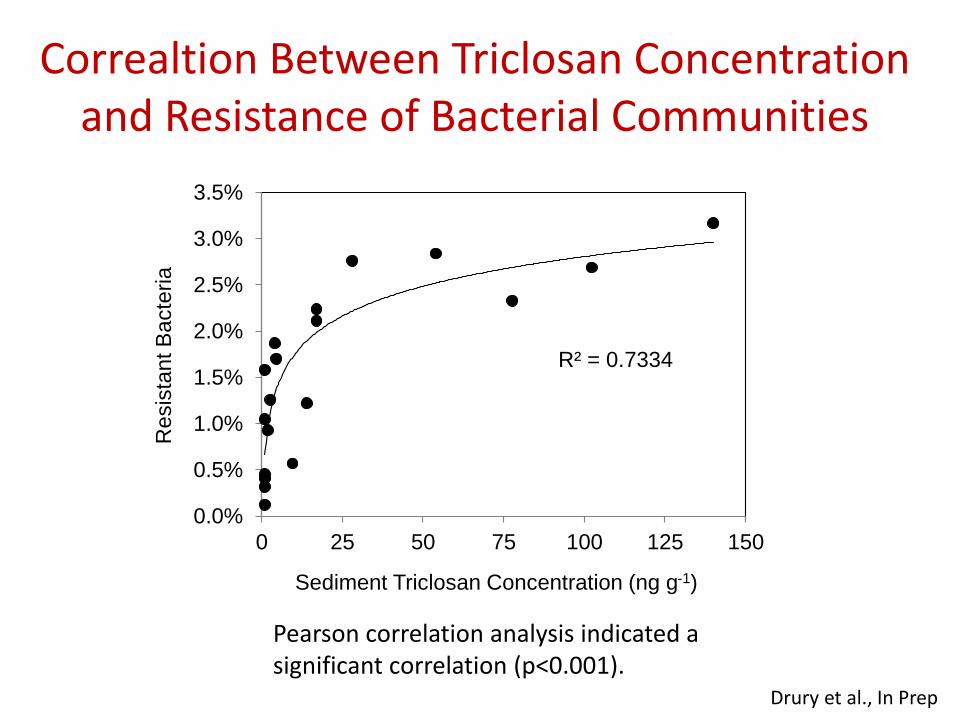
Correaltion Between Triclosan Concentration and Resistance of Bacterial Communities
Drury et al., In Prep
R² = 0.7334
0.0%
0.5%
1.0%
1.5%
2.0%
2.5%
3.0%
3.5%
0 25 50 75 100 125 150
Re
sis
tan
t B
acte
ria
Sediment Triclosan Concentration (ng g-1)
Pearson correlation analysis indicated a significant correlation (p<0.001).
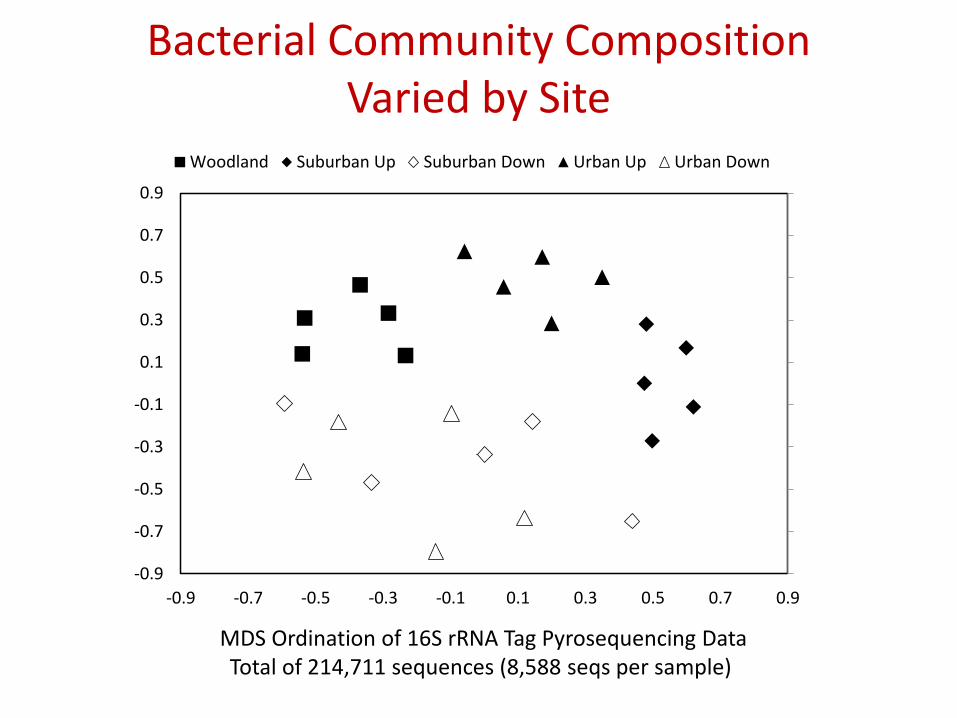
Bacterial Community Composition Varied by Site
MDS Ordination of 16S rRNA Tag Pyrosequencing Data Total of 214,711 sequences (8,588 seqs per sample)
-0.9
-0.7
-0.5
-0.3
-0.1
0.1
0.3
0.5
0.7
0.9
-0.9 -0.7 -0.5 -0.3 -0.1 0.1 0.3 0.5 0.7 0.9
Woodland Suburban Up Suburban Down Urban Up Urban Down
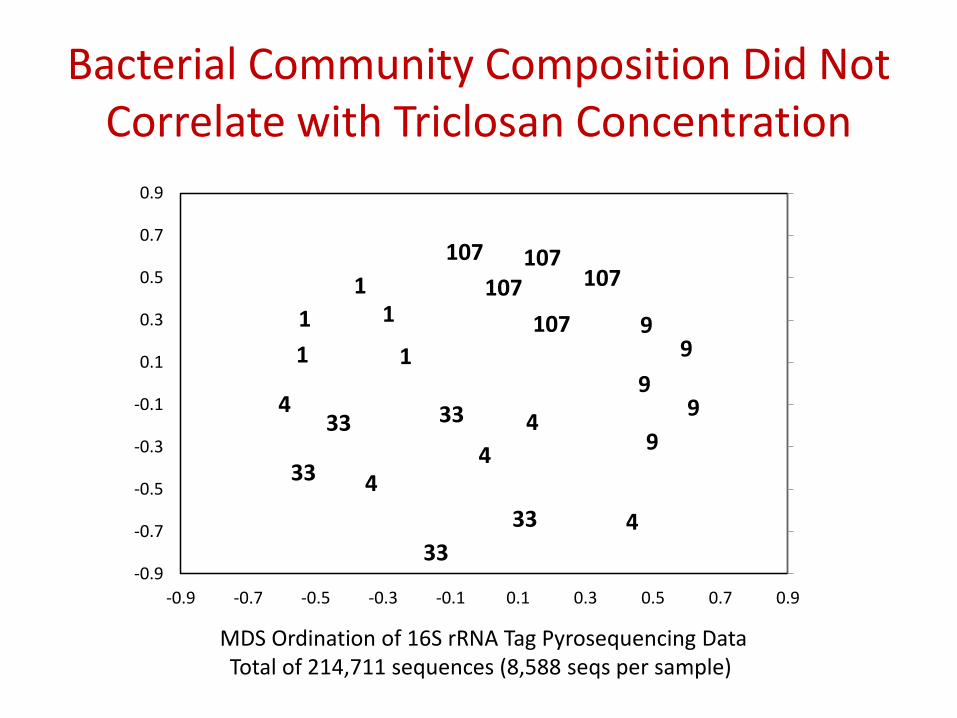
MDS Ordination of 16S rRNA Tag Pyrosequencing Data Total of 214,711 sequences (8,588 seqs per sample)
Bacterial Community Composition Did Not Correlate with Triclosan Concentration
1 1
11
1
99
9
9
94
4
4
44
107
107
107 107107
33
33
33
33
33
-0.9
-0.7
-0.5
-0.3
-0.1
0.1
0.3
0.5
0.7
0.9
-0.9 -0.7 -0.5 -0.3 -0.1 0.1 0.3 0.5 0.7 0.9
1 9 4 107 33
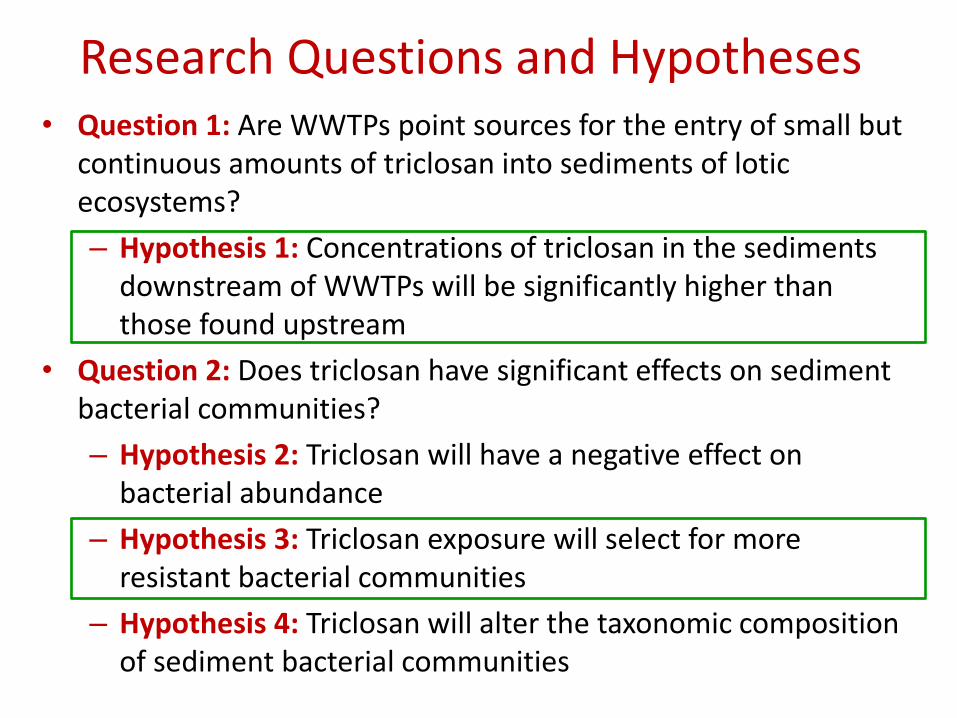
Research Questions and Hypotheses • Question 1: Are WWTPs point sources for the entry of small but
continuous amounts of triclosan into sediments of lotic ecosystems?
– Hypothesis 1: Concentrations of triclosan in the sediments downstream of WWTPs will be significantly higher than those found upstream
• Question 2: Does triclosan have significant effects on sediment bacterial communities?
– Hypothesis 2: Triclosan will have a negative effect on bacterial abundance
– Hypothesis 3: Triclosan exposure will select for more resistant bacterial communities
– Hypothesis 4: Triclosan will alter the taxonomic composition of sediment bacterial communities
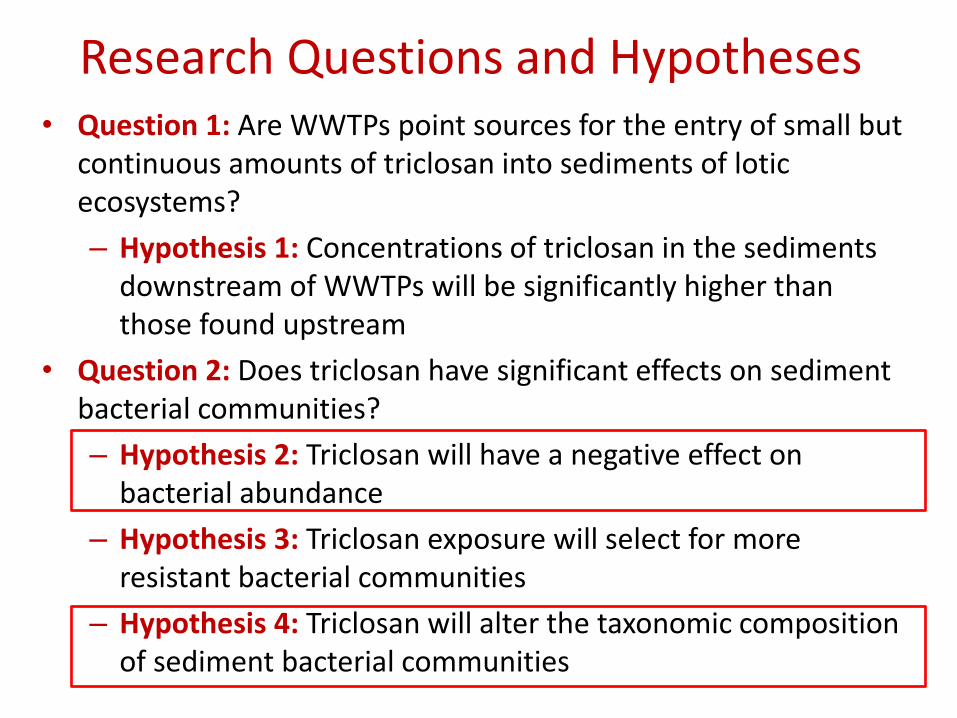
Research Questions and Hypotheses
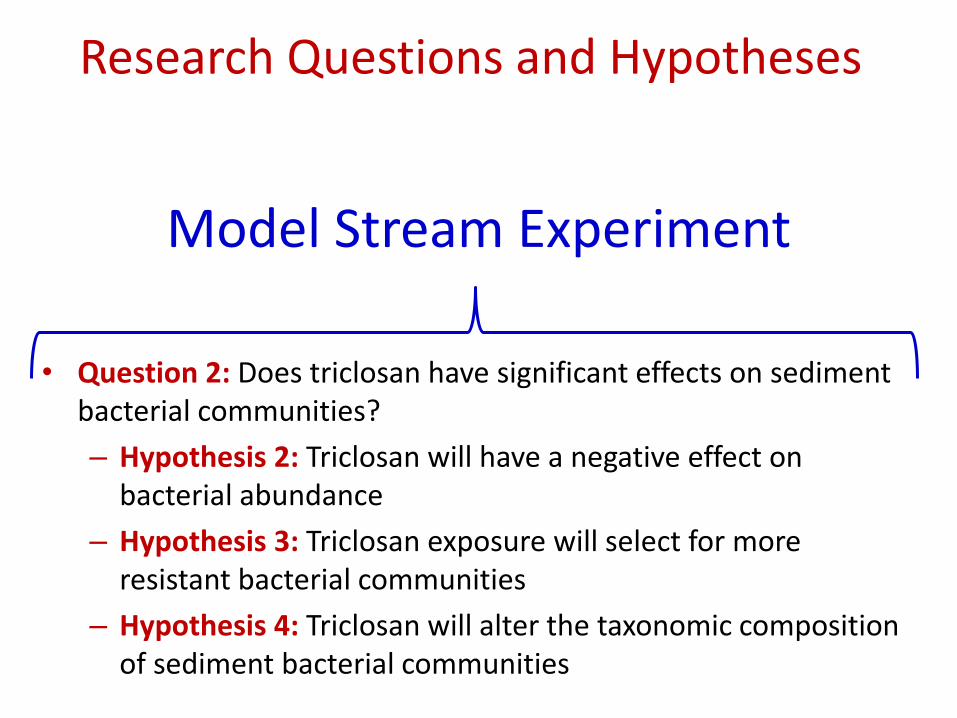
• Question 2: Does triclosan have significant effects on sediment bacterial communities?
– Hypothesis 2: Triclosan will have a negative effect on bacterial abundance
– Hypothesis 3: Triclosan exposure will select for more resistant bacterial communities
– Hypothesis 4: Triclosan will alter the taxonomic composition of sediment bacterial communities
Model Stream Experiment
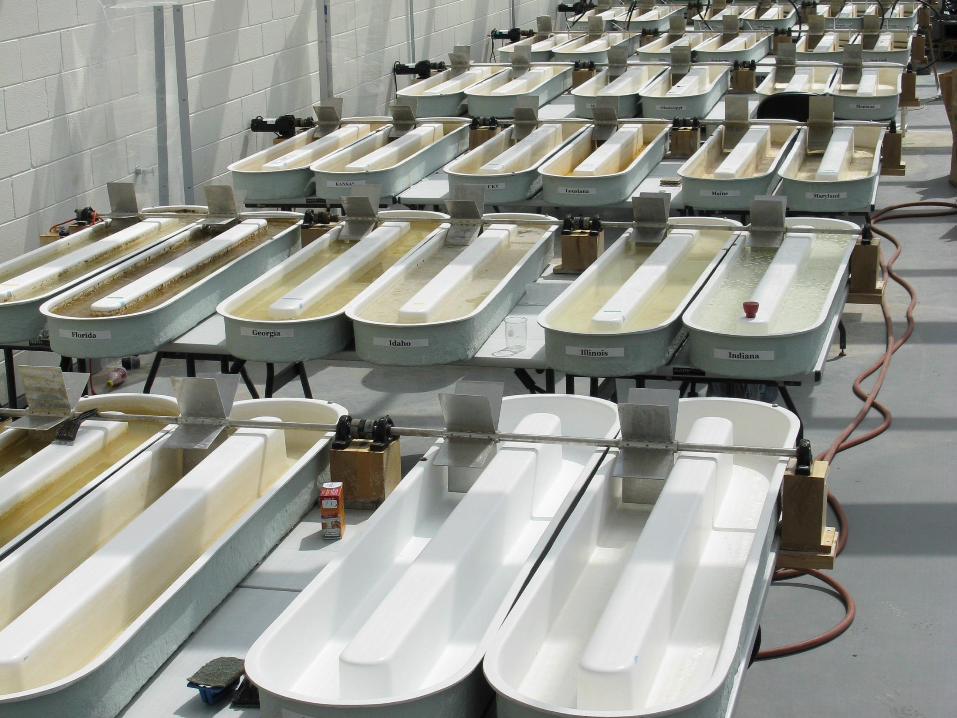
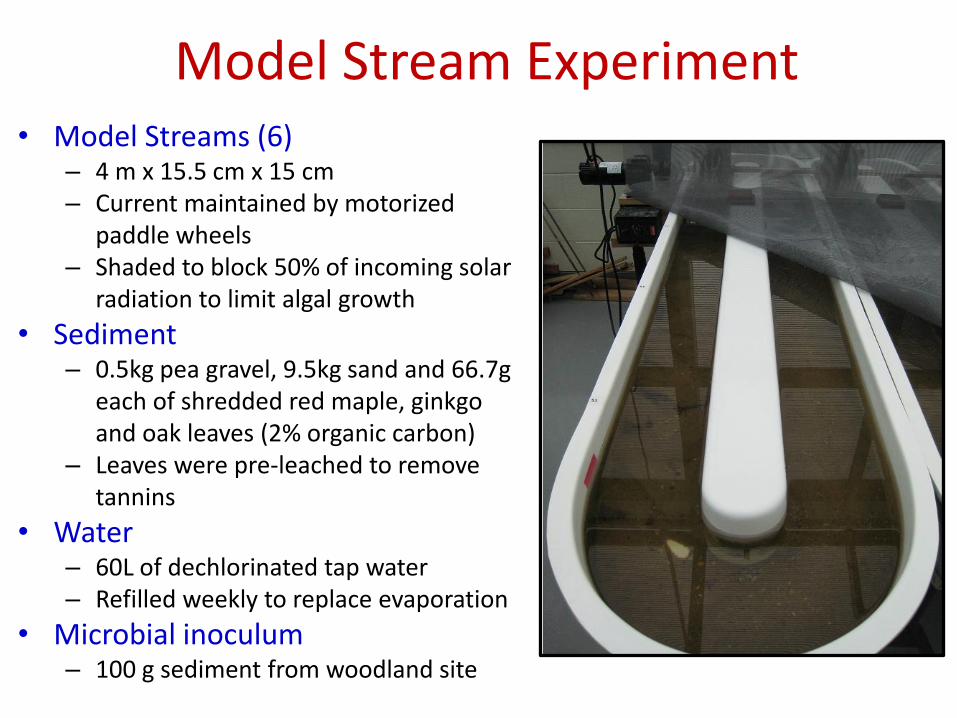
Model Stream Experiment • Model Streams (6)
– 4 m x 15.5 cm x 15 cm – Current maintained by motorized
paddle wheels – Shaded to block 50% of incoming solar
radiation to limit algal growth
• Sediment – 0.5kg pea gravel, 9.5kg sand and 66.7g
each of shredded red maple, ginkgo and oak leaves (2% organic carbon)
– Leaves were pre-leached to remove tannins
• Water – 60L of dechlorinated tap water – Refilled weekly to replace evaporation
• Microbial inoculum – 100 g sediment from woodland site
Model Stream Experiment
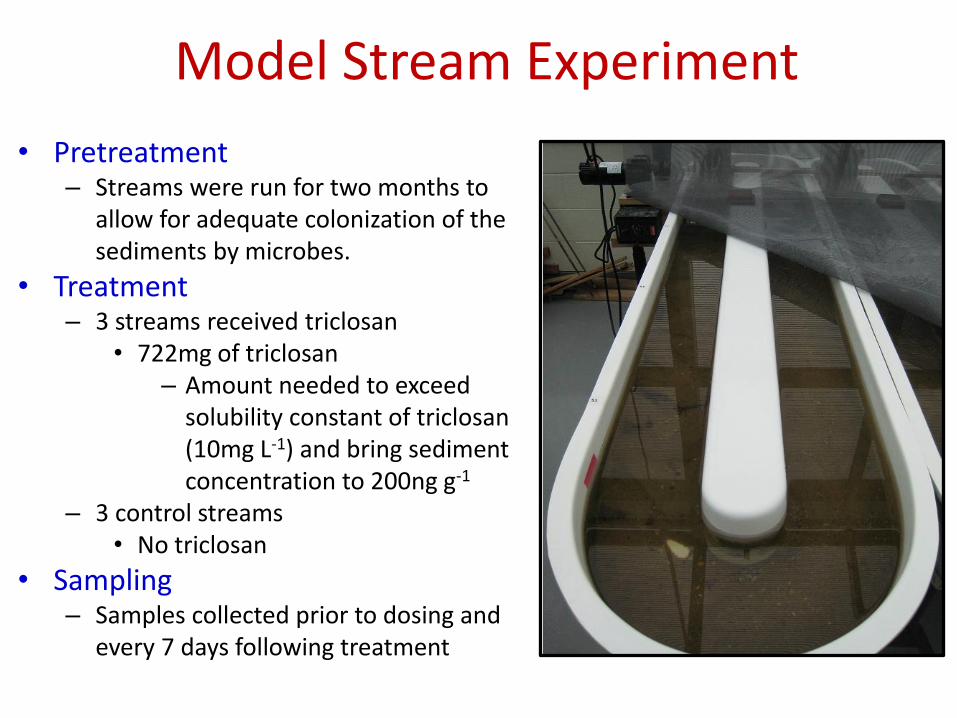
• Pretreatment – Streams were run for two months to
allow for adequate colonization of the sediments by microbes.
• Treatment – 3 streams received triclosan
• 722mg of triclosan – Amount needed to exceed
solubility constant of triclosan (10mg L-1) and bring sediment concentration to 200ng g-1
– 3 control streams • No triclosan
• Sampling – Samples collected prior to dosing and
every 7 days following treatment
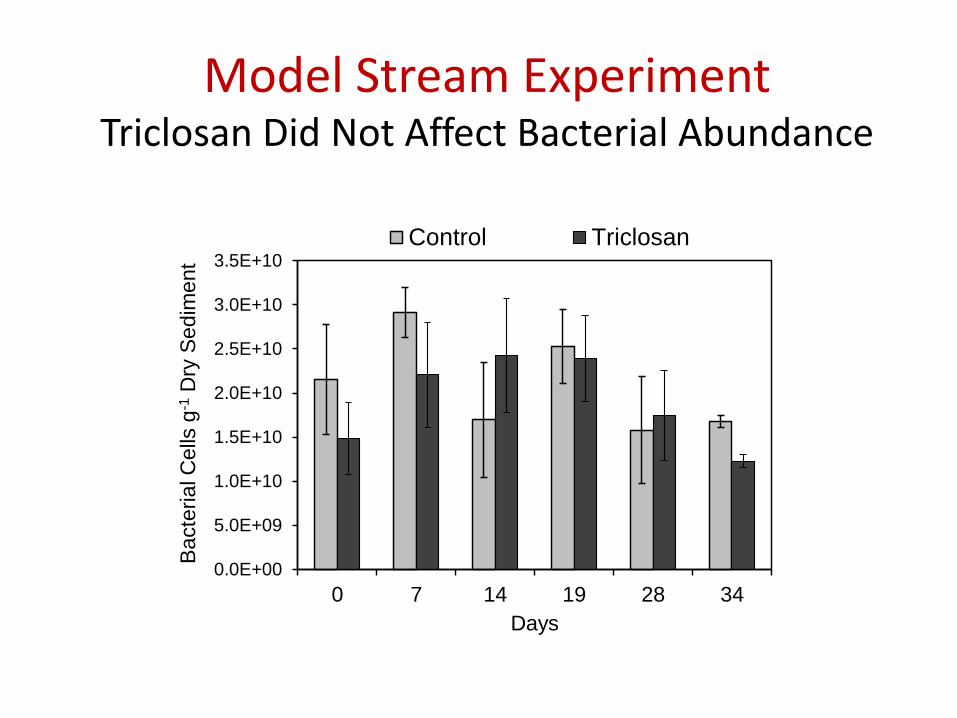
Model Stream Experiment Triclosan Did Not Affect Bacterial Abundance
0.0E+00
5.0E+09
1.0E+10
1.5E+10
2.0E+10
2.5E+10
3.0E+10
3.5E+10
0 7 14 19 28 34
Bacte
rial C
ells
g-1
Dry
Sedim
ent
Days
Control Triclosan
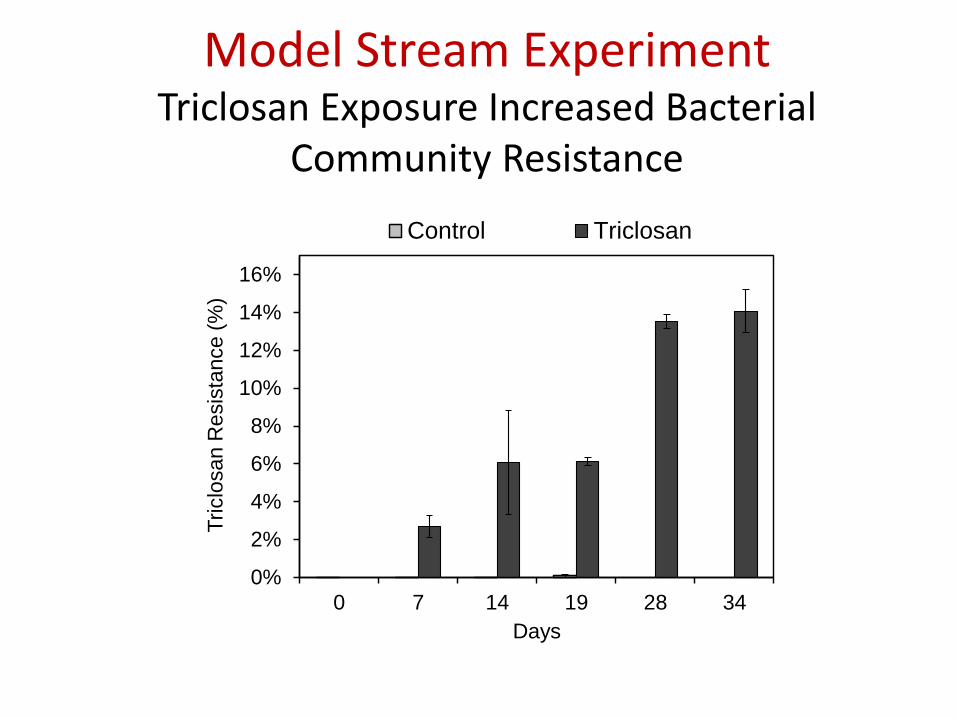
Model Stream Experiment Triclosan Exposure Increased Bacterial
Community Resistance
0%
2%
4%
6%
8%
10%
12%
14%
16%
0 7 14 19 28 34
Triclo
san R
esis
tance (
%)
Days
Control Triclosan
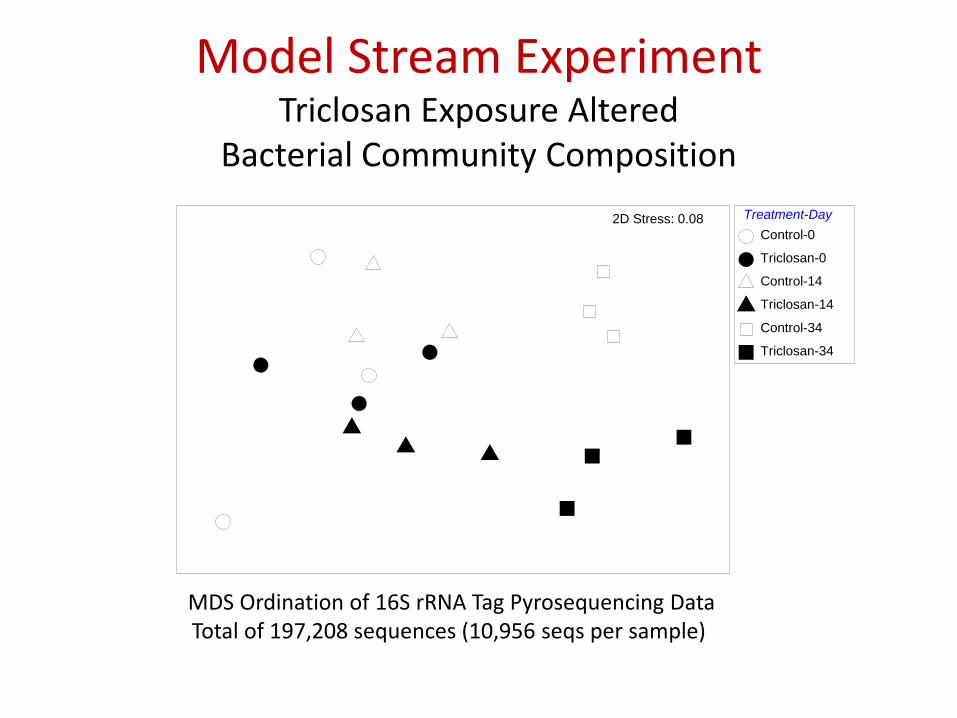
Model Stream Experiment Triclosan Exposure Altered
Bacterial Community Composition
Treatment-Day
Control-0
Triclosan-0
Control-14
Triclosan-14
Control-34
Triclosan-34
2D Stress: 0.08
MDS Ordination of 16S rRNA Tag Pyrosequencing Data Total of 197,208 sequences (10,956 seqs per sample)
Treatment-Day
Control-0
Triclosan-0
Control-14
Triclosan-14
Control-34
Triclosan-34
2D Stress: 0.08
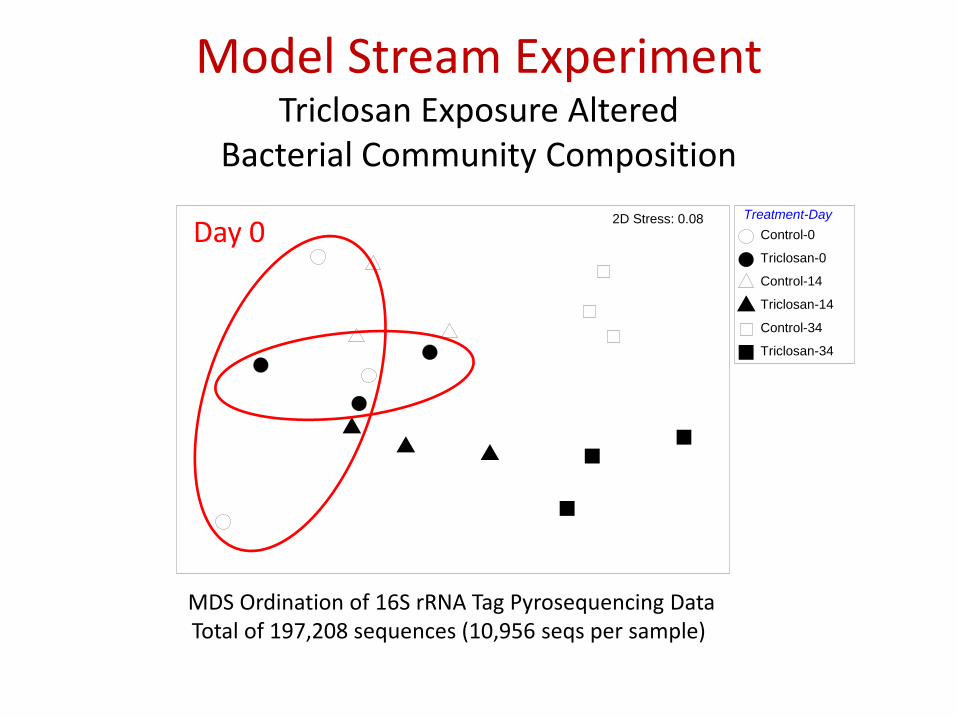
Day 0
MDS Ordination of 16S rRNA Tag Pyrosequencing Data Total of 197,208 sequences (10,956 seqs per sample)
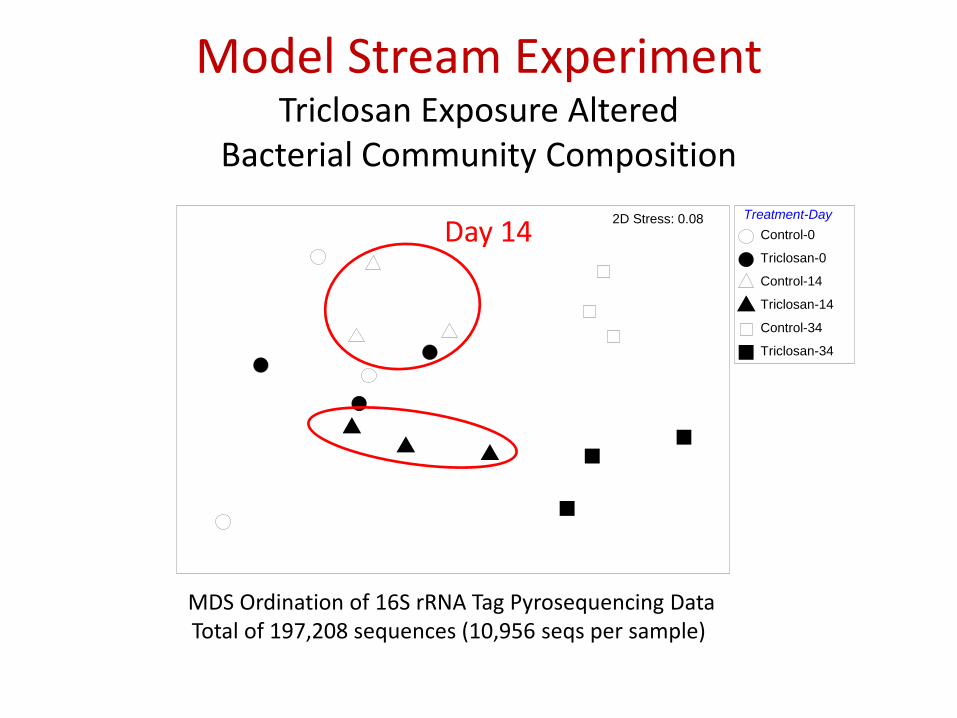
Model Stream Experiment Triclosan Exposure Altered
Bacterial Community Composition
Treatment-Day
Control-0
Triclosan-0
Control-14
Triclosan-14
Control-34
Triclosan-34
2D Stress: 0.08
Day 14
MDS Ordination of 16S rRNA Tag Pyrosequencing Data Total of 197,208 sequences (10,956 seqs per sample)
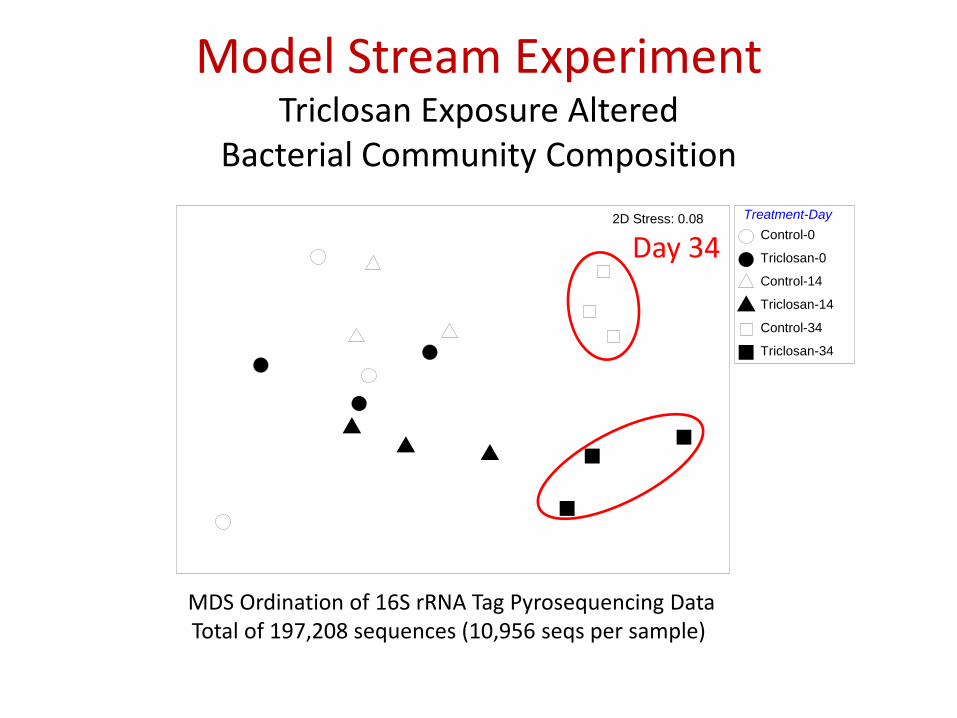
Model Stream Experiment Triclosan Exposure Altered
Bacterial Community Composition
Treatment-Day
Control-0
Triclosan-0
Control-14
Triclosan-14
Control-34
Triclosan-34
2D Stress: 0.08
Day 34
MDS Ordination of 16S rRNA Tag Pyrosequencing Data Total of 197,208 sequences (10,956 seqs per sample)
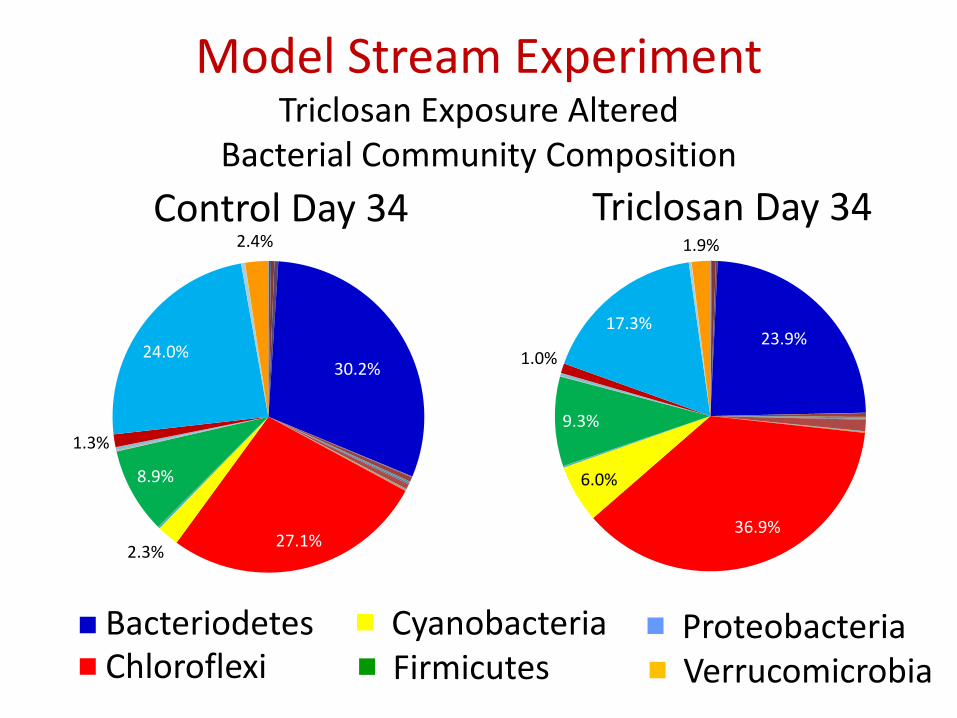
Model Stream Experiment Triclosan Exposure Altered
Bacterial Community Composition
30.2%
27.1%2.3%
8.9%
1.3%
24.0%
2.4%
23.9%
36.9%
6.0%
9.3%
1.0%
17.3%
1.9%
Control Day 34 Triclosan Day 34
Bacteriodetes Chloroflexi
Cyanobacteria Firmicutes
Proteobacteria Verrucomicrobia
Model Stream Experiment Triclosan Exposure Altered
Bacterial Community Composition
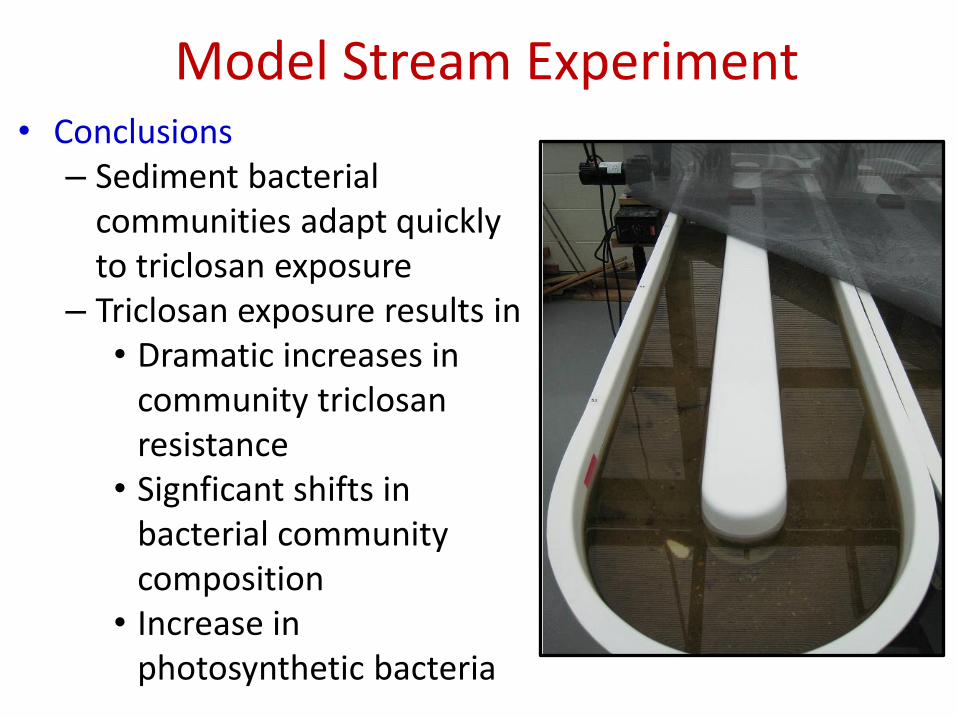
Model Stream Experiment • Conclusions
– Sediment bacterial communities adapt quickly to triclosan exposure
– Triclosan exposure results in • Dramatic increases in
community triclosan resistance
• Signficant shifts in bacterial community composition
• Increase in photosynthetic bacteria
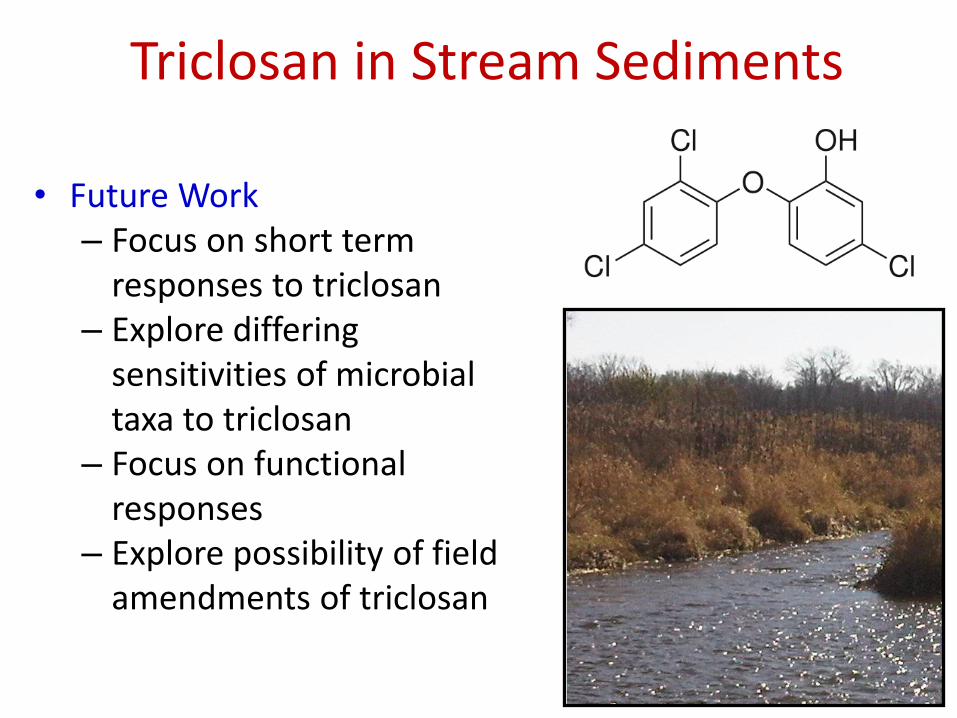
Triclosan in Stream Sediments
• Future Work – Focus on short term
responses to triclosan – Explore differing
sensitivities of microbial taxa to triclosan
– Focus on functional responses
– Explore possibility of field amendments of triclosan
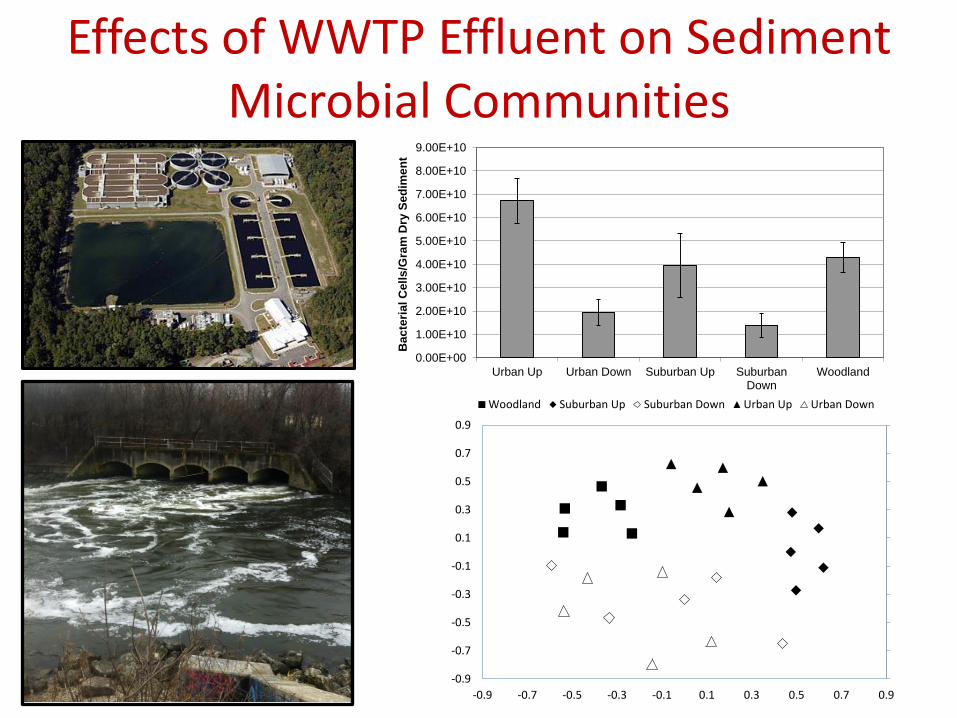
Effects of WWTP Effluent on Sediment Microbial Communities
0.00E+00
1.00E+10
2.00E+10
3.00E+10
4.00E+10
5.00E+10
6.00E+10
7.00E+10
8.00E+10
9.00E+10
Urban Up Urban Down Suburban Up SuburbanDown
Woodland
Bac
teri
al C
ell
s/G
ram
Dry
Se
dim
en
t
-0.9
-0.7
-0.5
-0.3
-0.1
0.1
0.3
0.5
0.7
0.9
-0.9 -0.7 -0.5 -0.3 -0.1 0.1 0.3 0.5 0.7 0.9
Woodland Suburban Up Suburban Down Urban Up Urban Down
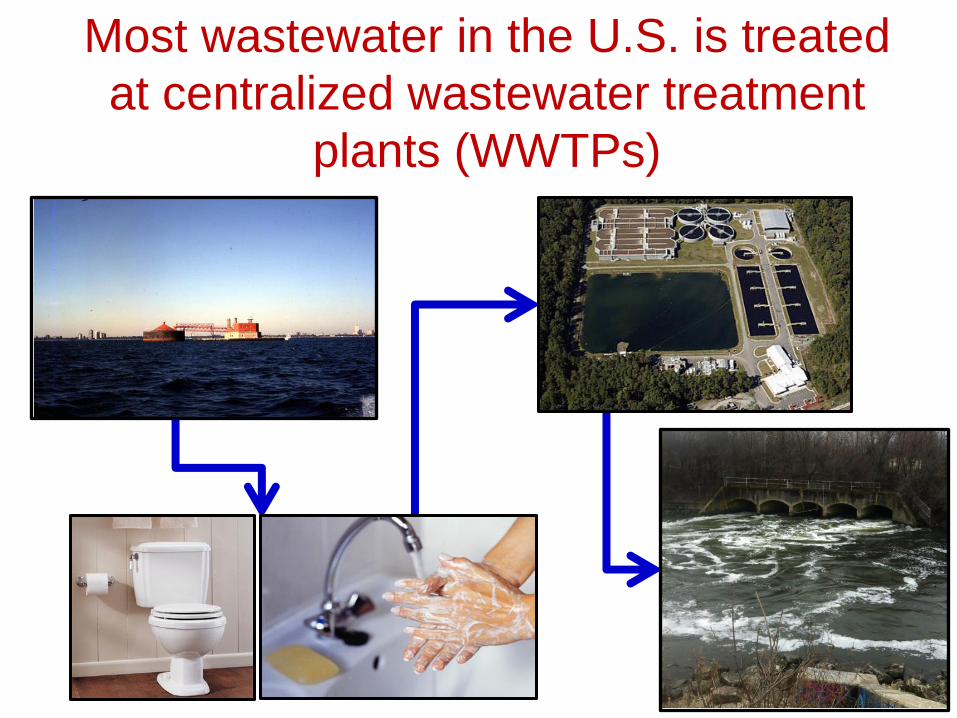
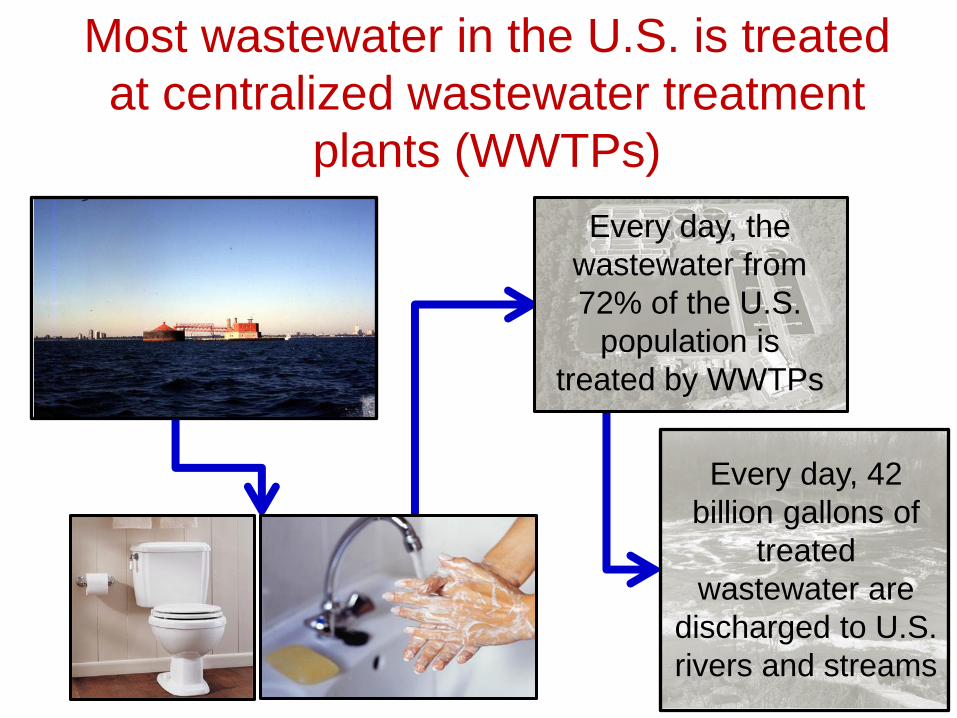
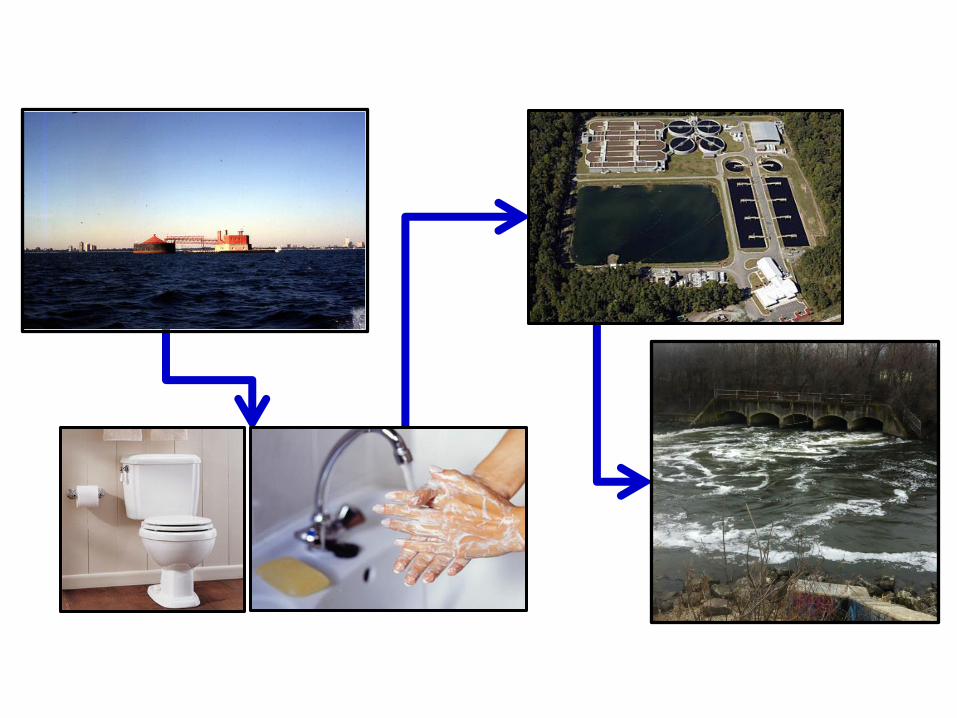
Most wastewater in the U.S. is treated
at centralized wastewater treatment
plants (WWTPs)
Most wastewater in the U.S. is treated
at centralized wastewater treatment
plants (WWTPs)
Every day, the
wastewater from
72% of the U.S.
population is
treated by WWTPs
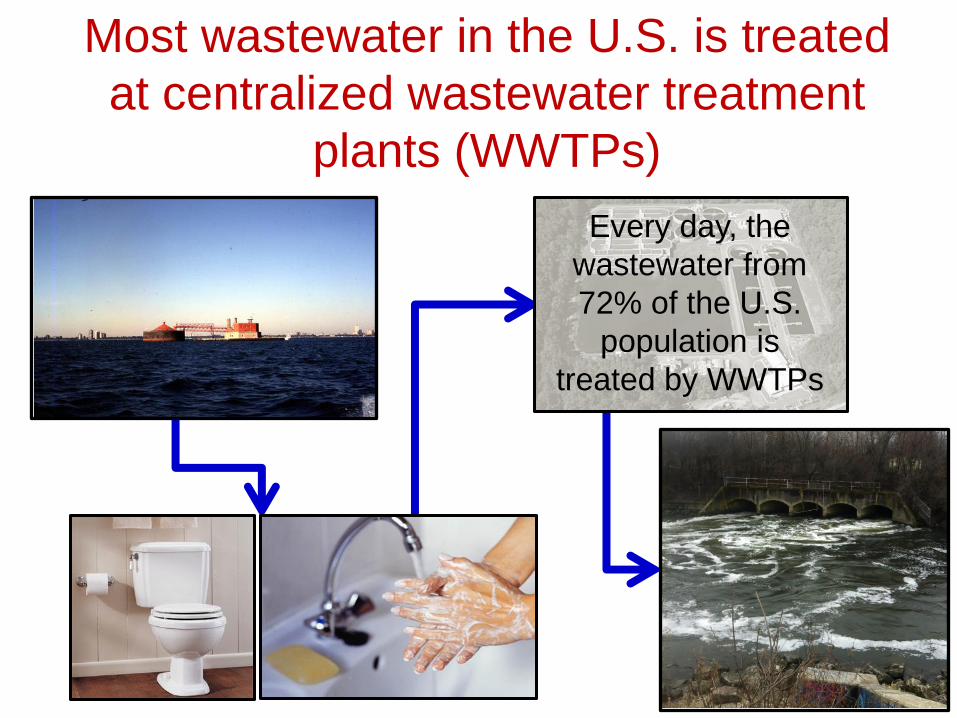
Most wastewater in the U.S. is treated
at centralized wastewater treatment
plants (WWTPs)
Every day, the
wastewater from
72% of the U.S.
population is
treated by WWTPs
Every day, 42
billion gallons of
treated
wastewater are
discharged to U.S.
rivers and streams
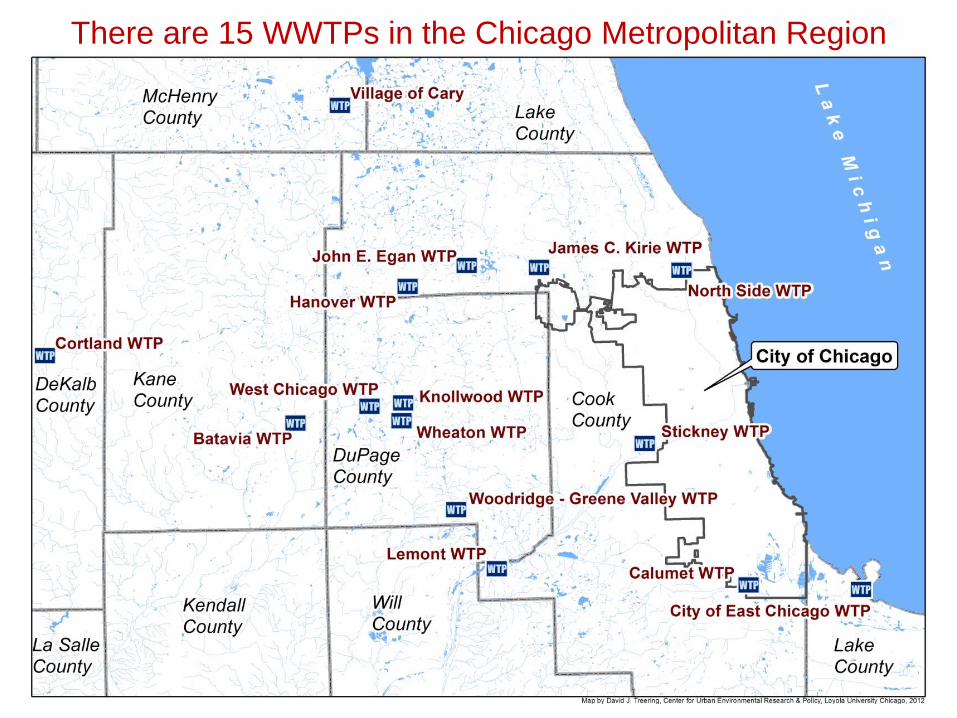
There are 15 WWTPs in the Chicago Metropolitan Region
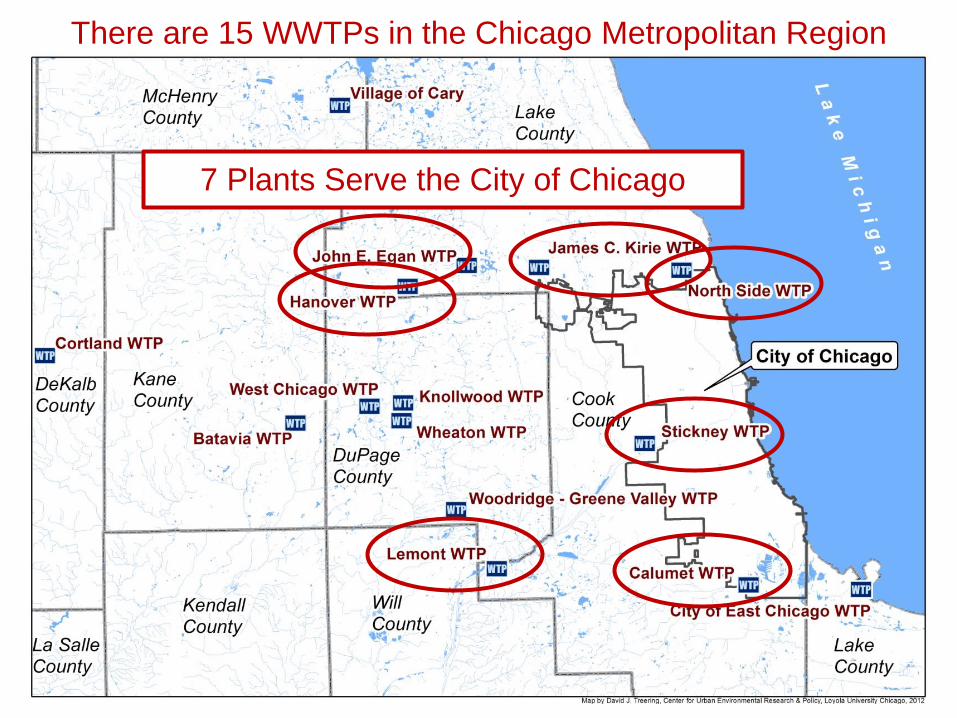
There are 15 WWTPs in the Chicago Metropolitan Region
7 Plants Serve the City of Chicago
www.mwrd.org
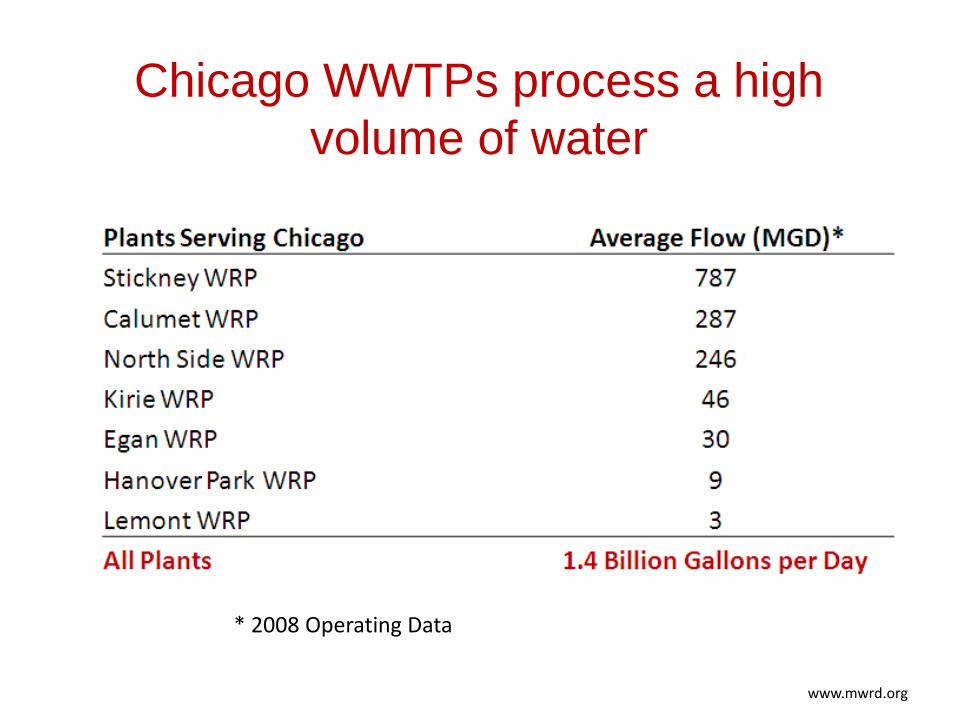
* 2008 Operating Data
Chicago WWTPs process a high
volume of water
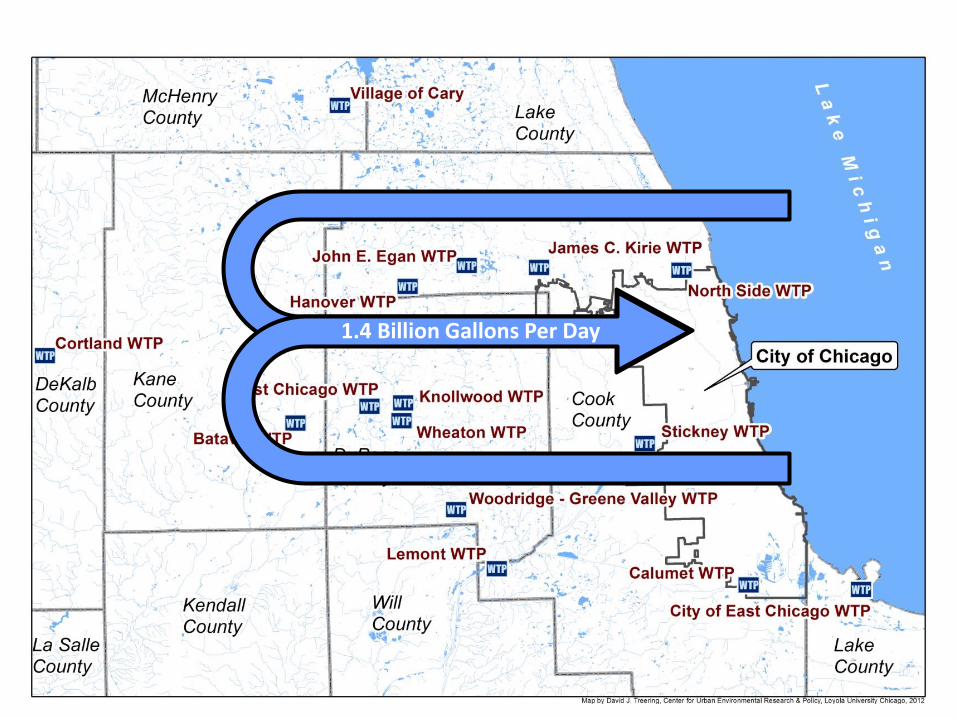
1.4 Billion Gallons Per Day
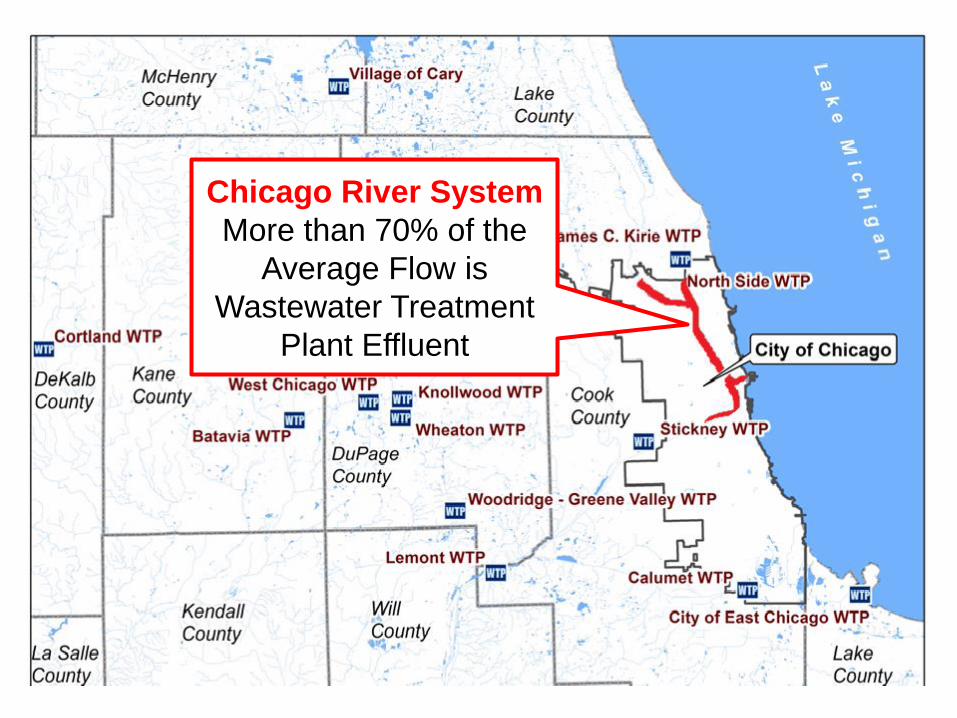
Chicago River System
More than 70% of the
Average Flow is
Wastewater Treatment
Plant Effluent
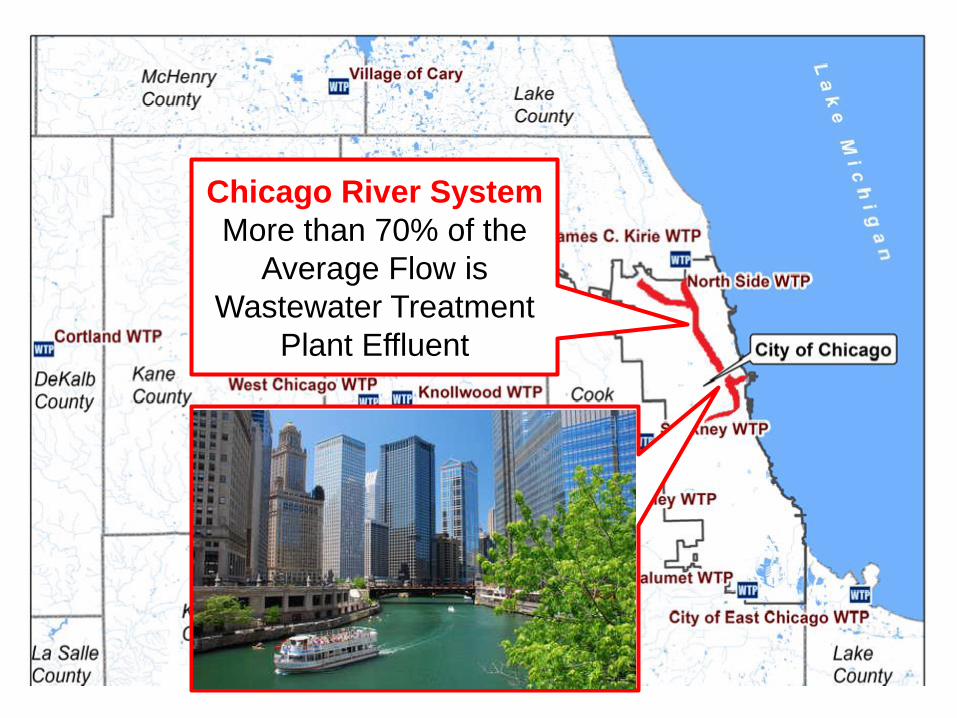
Chicago River System
More than 70% of the
Average Flow is
Wastewater Treatment
Plant Effluent
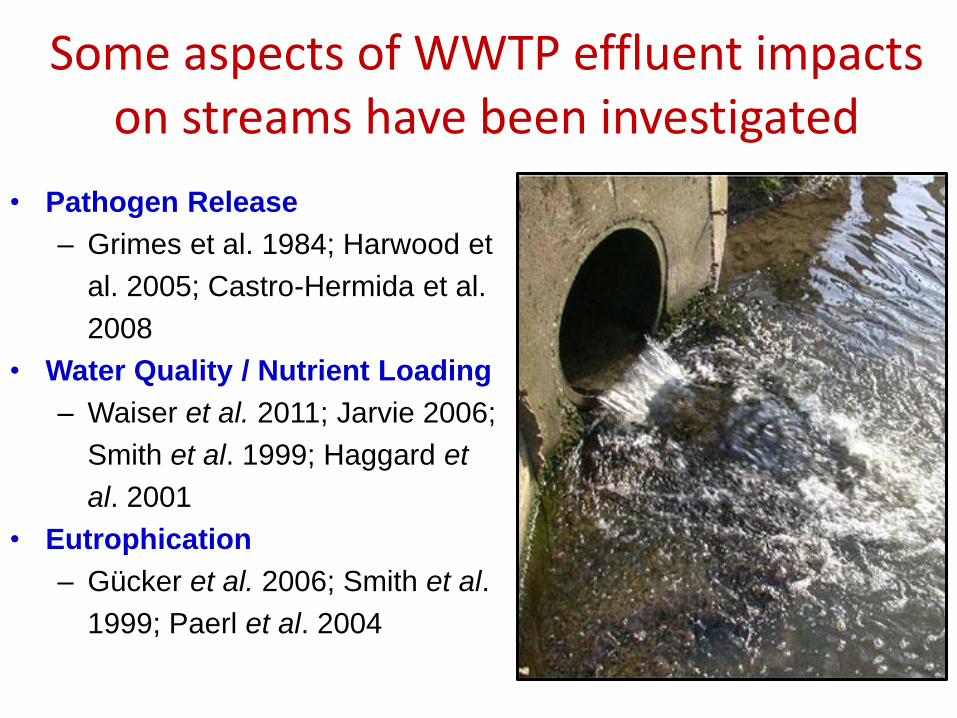
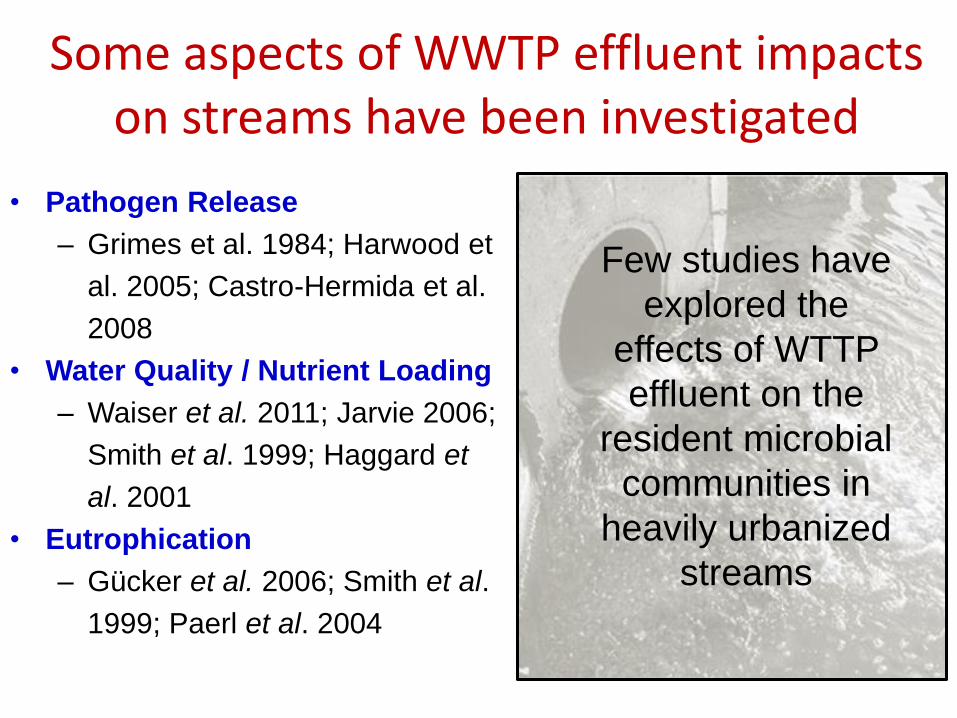
Some aspects of WWTP effluent impacts on streams have been investigated
• Pathogen Release
– Grimes et al. 1984; Harwood et
al. 2005; Castro-Hermida et al.
2008
• Water Quality / Nutrient Loading
– Waiser et al. 2011; Jarvie 2006;
Smith et al. 1999; Haggard et
al. 2001
• Eutrophication
– Gücker et al. 2006; Smith et al.
1999; Paerl et al. 2004
Few studies have
explored the
effects of WTTP
effluent on the
resident microbial
communities in
heavily urbanized
streams
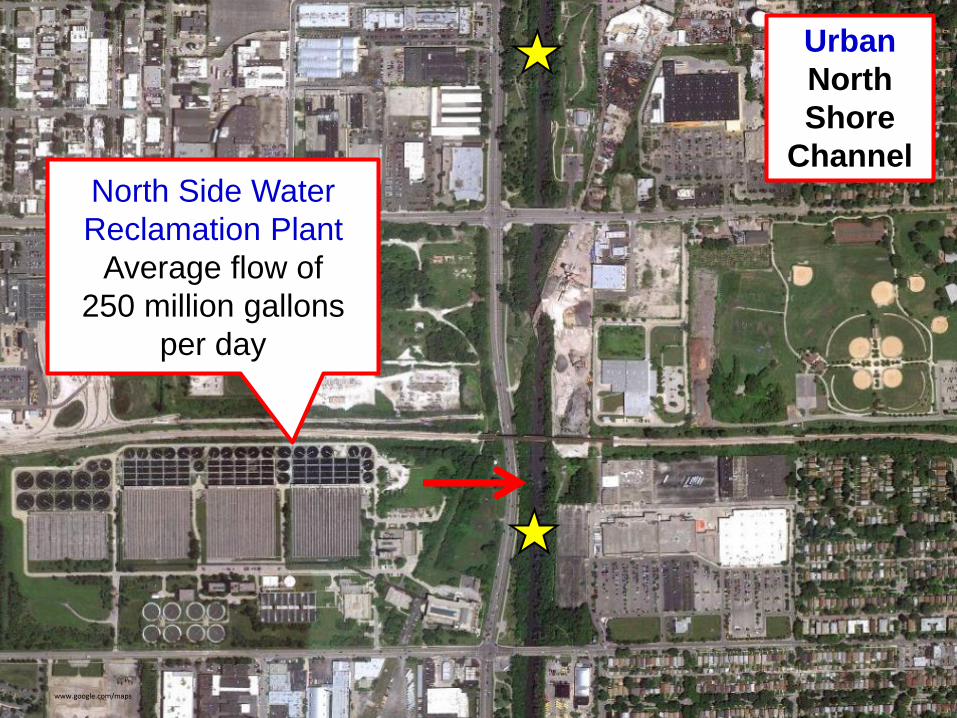
www.google.com/maps
Urban
North
Shore
Channel North Side Water
Reclamation Plant
Average flow of
250 million gallons
per day
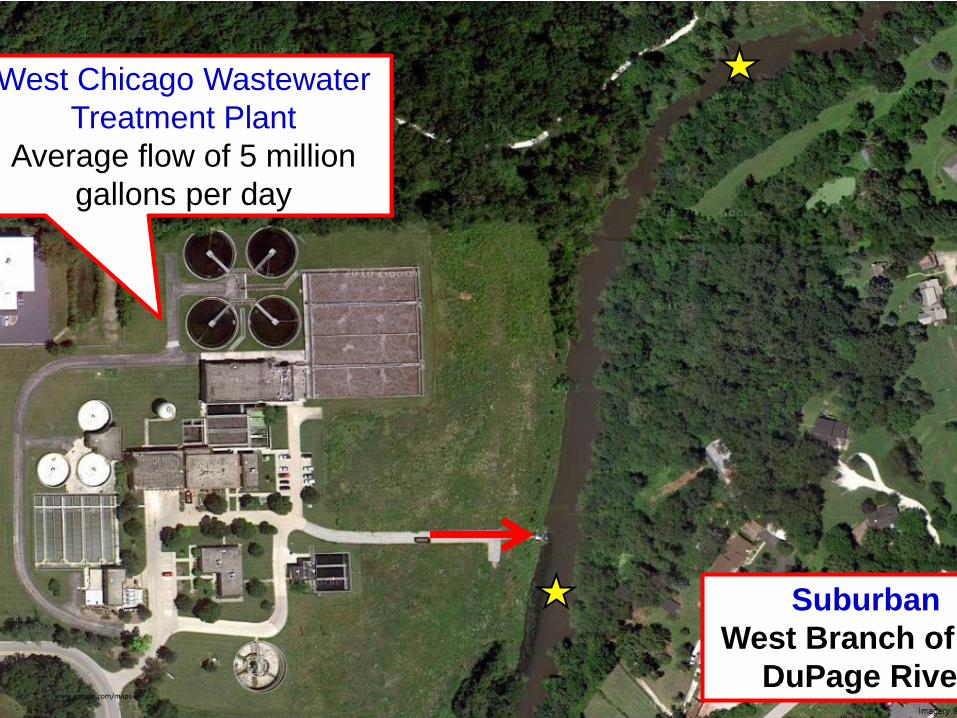
www.google.com/maps
West Chicago Wastewater
Treatment Plant
Average flow of 5 million
gallons per day
Suburban
West Branch of the
DuPage River
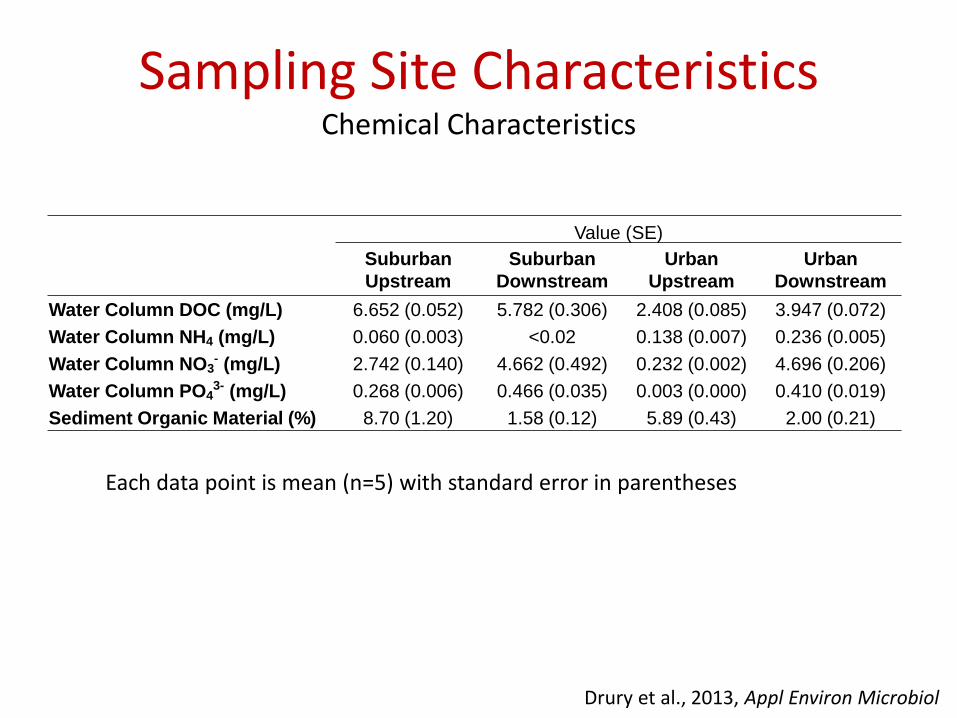
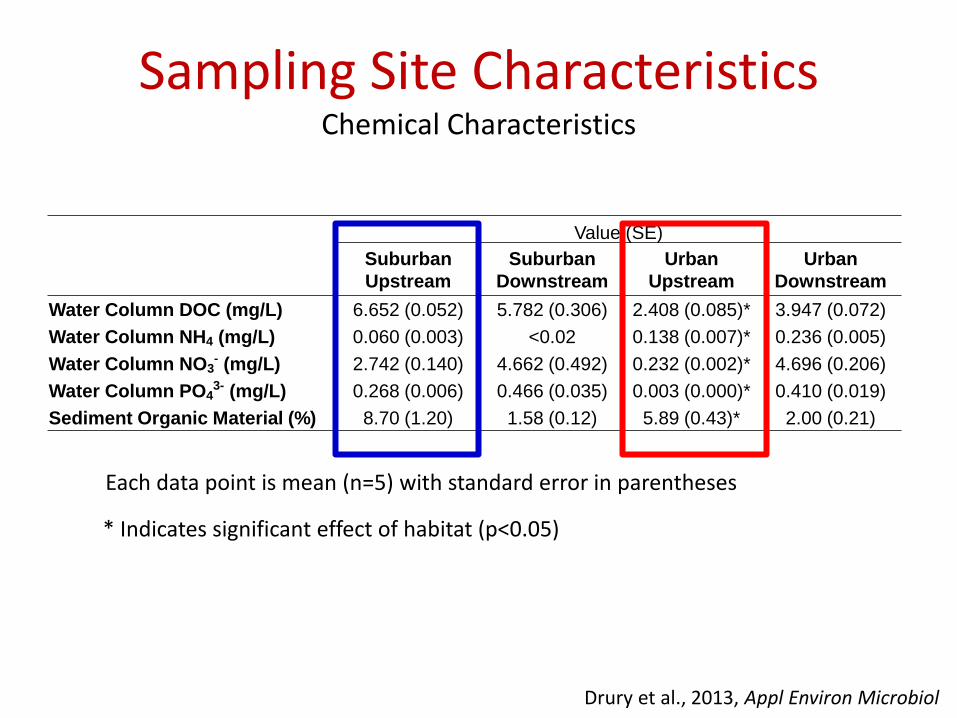
Value (SE)
Suburban
Upstream
Suburban
Downstream
Urban
Upstream
Urban
Downstream
Water Column DOC (mg/L) 6.652 (0.052) 5.782 (0.306) 2.408 (0.085) 3.947 (0.072)
Water Column NH4 (mg/L) 0.060 (0.003) <0.02 0.138 (0.007) 0.236 (0.005)
Water Column NO3- (mg/L) 2.742 (0.140) 4.662 (0.492) 0.232 (0.002) 4.696 (0.206)
Water Column PO43- (mg/L) 0.268 (0.006) 0.466 (0.035) 0.003 (0.000) 0.410 (0.019)
Sediment Organic Material (%) 8.70 (1.20) 1.58 (0.12) 5.89 (0.43) 2.00 (0.21)
Sampling Site Characteristics Chemical Characteristics
Each data point is mean (n=5) with standard error in parentheses
Drury et al., 2013, Appl Environ Microbiol
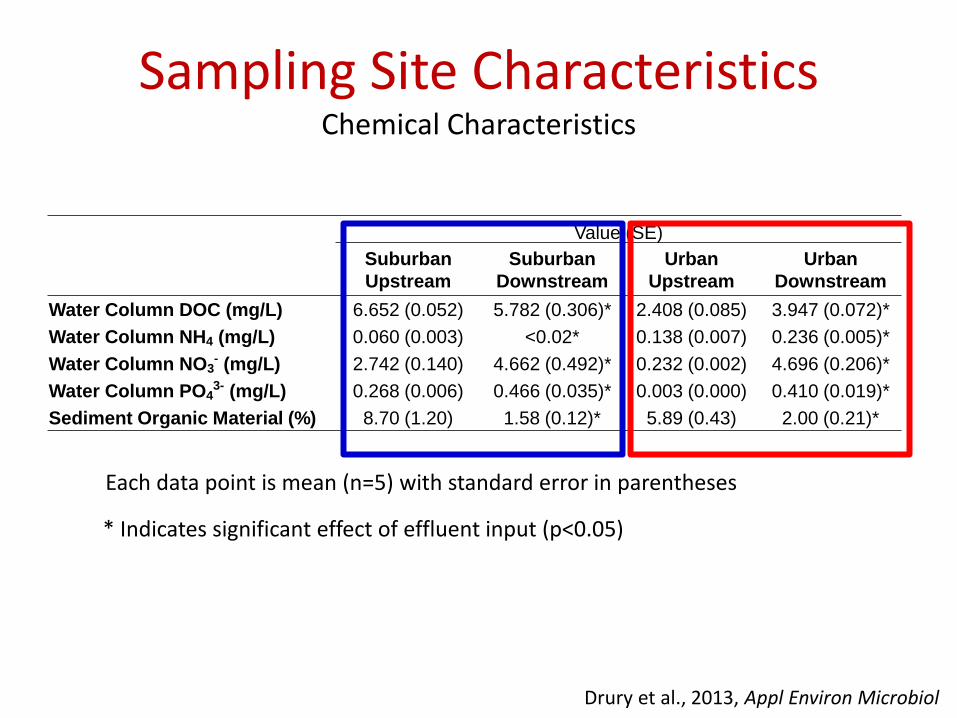
Value (SE)
Suburban
Upstream
Suburban
Downstream
Urban
Upstream
Urban
Downstream
Water Column DOC (mg/L) 6.652 (0.052) 5.782 (0.306) 2.408 (0.085)* 3.947 (0.072)
Water Column NH4 (mg/L) 0.060 (0.003) <0.02 0.138 (0.007)* 0.236 (0.005)
Water Column NO3- (mg/L) 2.742 (0.140) 4.662 (0.492) 0.232 (0.002)* 4.696 (0.206)
Water Column PO43- (mg/L) 0.268 (0.006) 0.466 (0.035) 0.003 (0.000)* 0.410 (0.019)
Sediment Organic Material (%) 8.70 (1.20) 1.58 (0.12) 5.89 (0.43)* 2.00 (0.21)
Each data point is mean (n=5) with standard error in parentheses
Sampling Site Characteristics Chemical Characteristics
* Indicates significant effect of habitat (p<0.05)
Drury et al., 2013, Appl Environ Microbiol
Value (SE)
Suburban
Upstream
Suburban
Downstream
Urban
Upstream
Urban
Downstream
Water Column DOC (mg/L) 6.652 (0.052) 5.782 (0.306)* 2.408 (0.085) 3.947 (0.072)*
Water Column NH4 (mg/L) 0.060 (0.003) <0.02* 0.138 (0.007) 0.236 (0.005)*
Water Column NO3- (mg/L) 2.742 (0.140) 4.662 (0.492)* 0.232 (0.002) 4.696 (0.206)*
Water Column PO43- (mg/L) 0.268 (0.006) 0.466 (0.035)* 0.003 (0.000) 0.410 (0.019)*
Sediment Organic Material (%) 8.70 (1.20) 1.58 (0.12)* 5.89 (0.43) 2.00 (0.21)*
Sampling Site Characteristics Chemical Characteristics
* Indicates significant effect of effluent input (p<0.05)
Each data point is mean (n=5) with standard error in parentheses
Drury et al., 2013, Appl Environ Microbiol
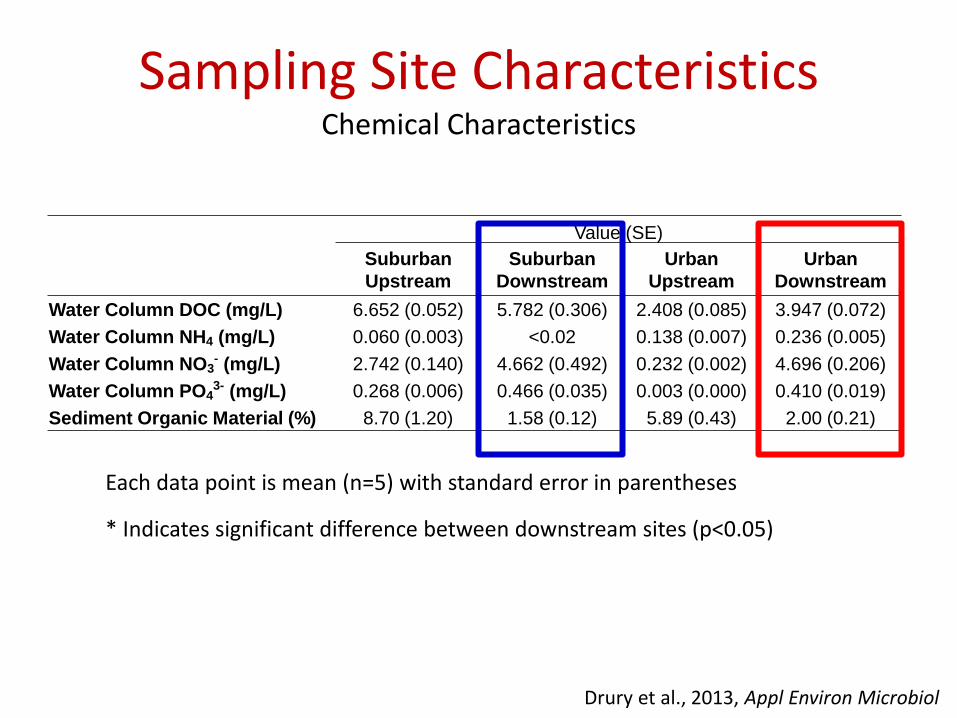
Value (SE)
Suburban
Upstream
Suburban
Downstream
Urban
Upstream
Urban
Downstream
Water Column DOC (mg/L) 6.652 (0.052) 5.782 (0.306) 2.408 (0.085) 3.947 (0.072)
Water Column NH4 (mg/L) 0.060 (0.003) <0.02 0.138 (0.007) 0.236 (0.005)
Water Column NO3- (mg/L) 2.742 (0.140) 4.662 (0.492) 0.232 (0.002) 4.696 (0.206)
Water Column PO43- (mg/L) 0.268 (0.006) 0.466 (0.035) 0.003 (0.000) 0.410 (0.019)
Sediment Organic Material (%) 8.70 (1.20) 1.58 (0.12) 5.89 (0.43) 2.00 (0.21)
Sampling Site Characteristics Chemical Characteristics
Each data point is mean (n=5) with standard error in parentheses
* Indicates significant difference between downstream sites (p<0.05)
Drury et al., 2013, Appl Environ Microbiol
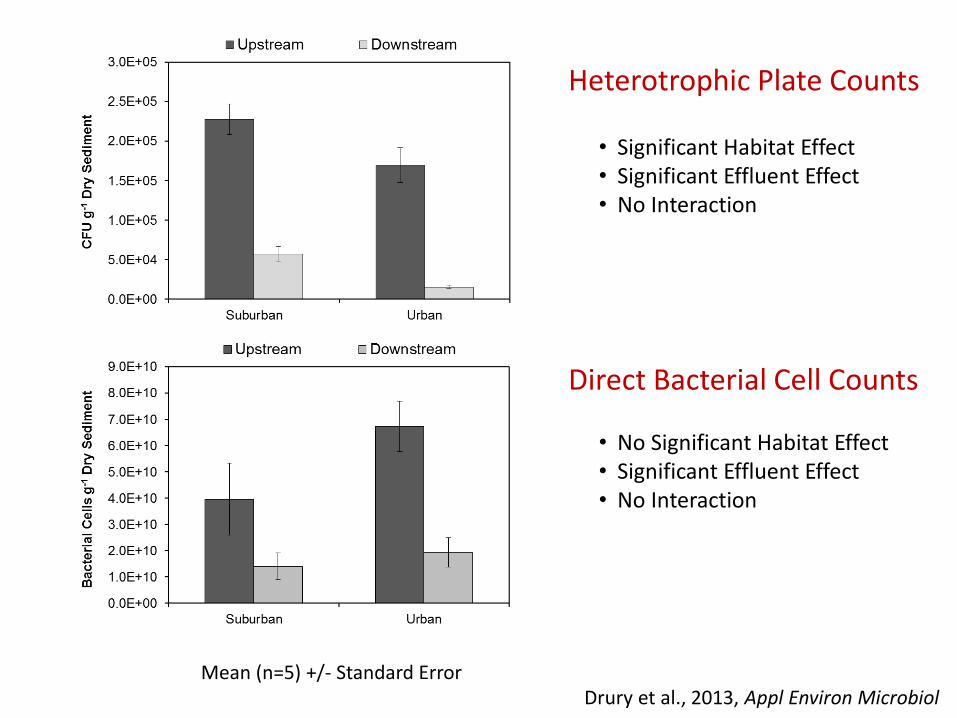
Heterotrophic Plate Counts
• Significant Habitat Effect • Significant Effluent Effect • No Interaction
Direct Bacterial Cell Counts
• No Significant Habitat Effect • Significant Effluent Effect • No Interaction
Drury et al., 2013, Appl Environ Microbiol Mean (n=5) +/- Standard Error
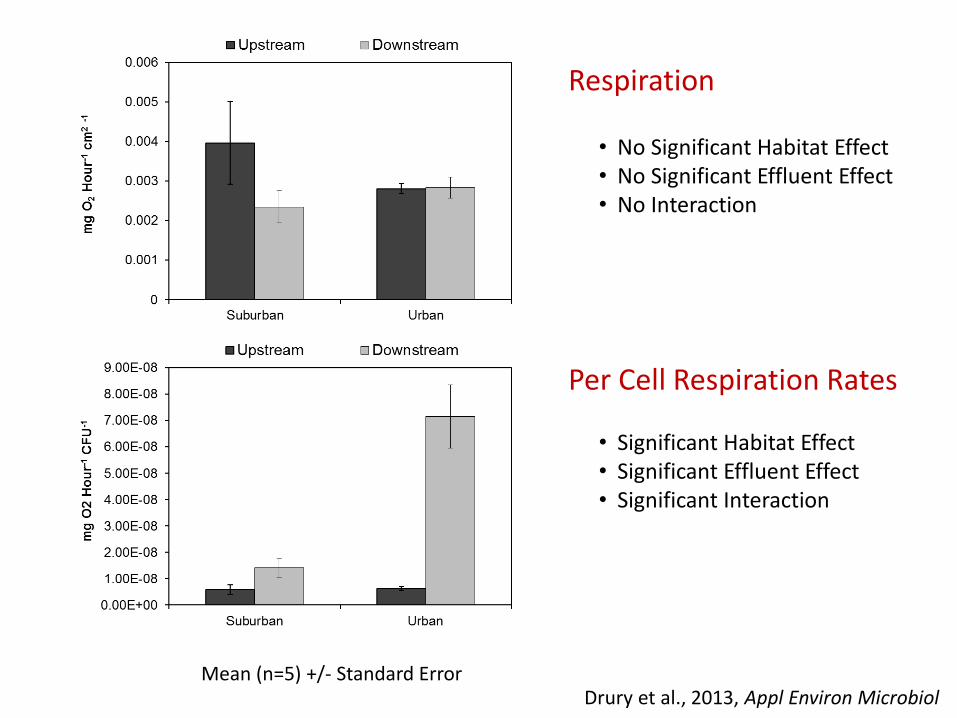
Respiration
• No Significant Habitat Effect • No Significant Effluent Effect • No Interaction
Per Cell Respiration Rates
• Significant Habitat Effect • Significant Effluent Effect • Significant Interaction
Drury et al., 2013, Appl Environ Microbiol Mean (n=5) +/- Standard Error
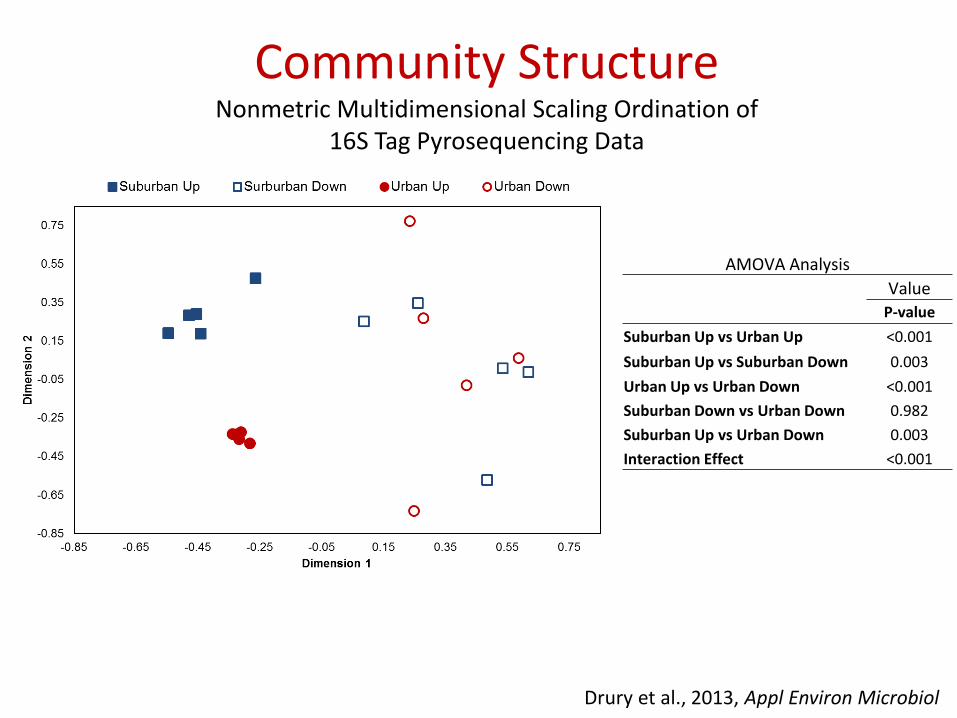
Community Structure Nonmetric Multidimensional Scaling Ordination of
16S Tag Pyrosequencing Data
Drury et al., 2013, Appl Environ Microbiol
AMOVA Analysis
ValueP-value
Suburban Up vs Urban Up <0.001
Suburban Up vs Suburban Down 0.003
Urban Up vs Urban Down <0.001
Suburban Down vs Urban Down 0.982
Suburban Up vs Urban Down 0.003
Interaction Effect <0.001
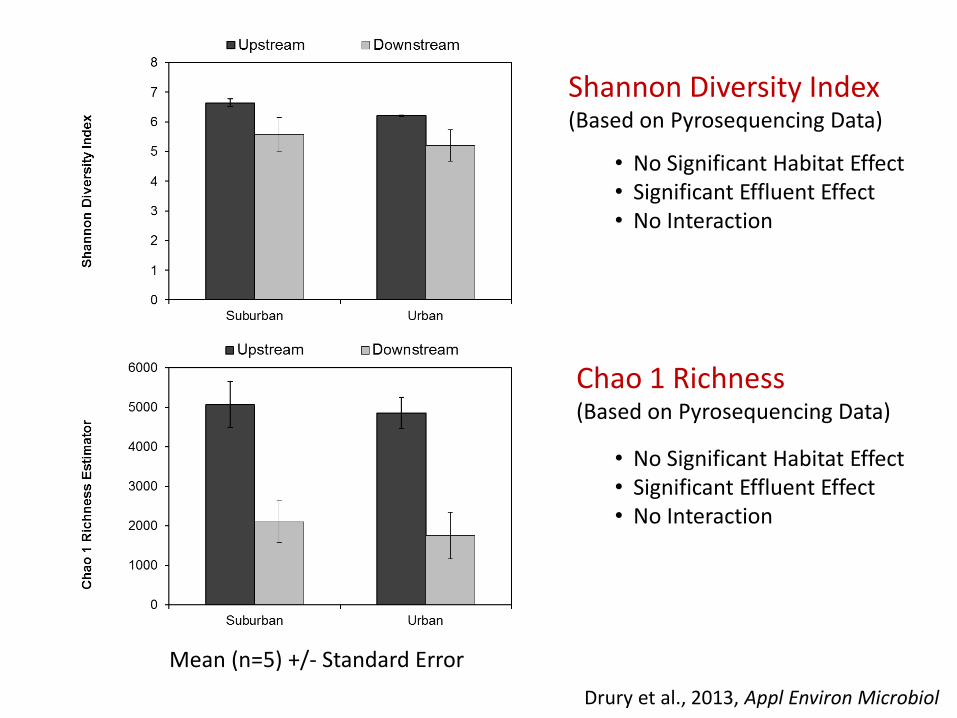
Mean (n=5) +/- Standard Error
Shannon Diversity Index (Based on Pyrosequencing Data)
Chao 1 Richness (Based on Pyrosequencing Data)
• No Significant Habitat Effect • Significant Effluent Effect • No Interaction
• No Significant Habitat Effect • Significant Effluent Effect • No Interaction
Drury et al., 2013, Appl Environ Microbiol
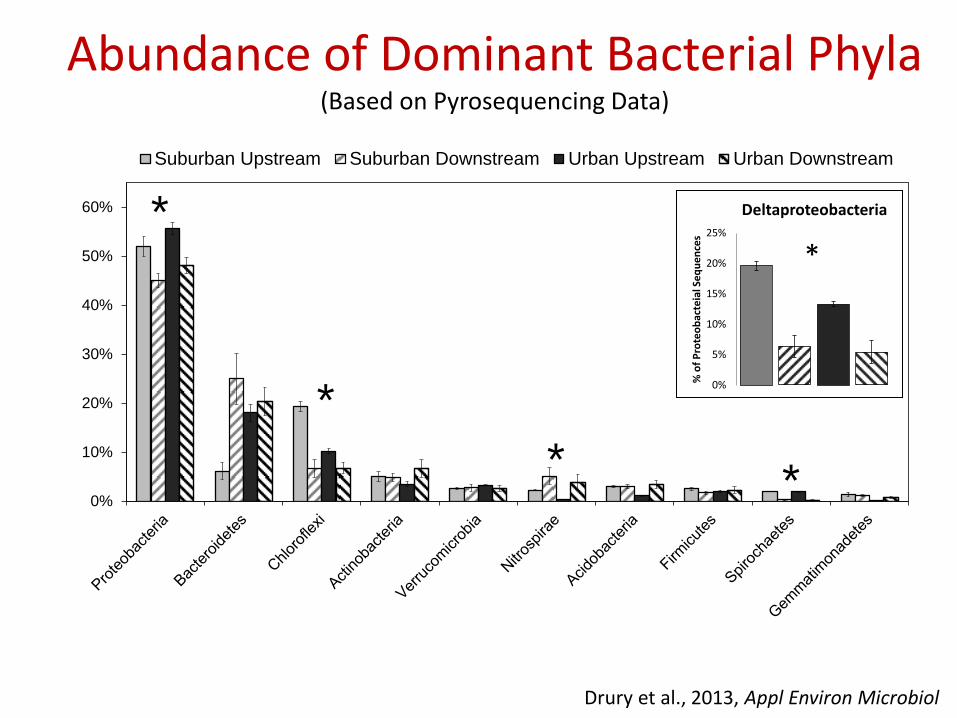
Abundance of Dominant Bacterial Phyla (Based on Pyrosequencing Data)
Drury et al., 2013, Appl Environ Microbiol
0%
10%
20%
30%
40%
50%
60%
Suburban Upstream Suburban Downstream Urban Upstream Urban Downstream
*
*
* *
0%
5%
10%
15%
20%
25%
% o
f P
rote
ob
acte
ial S
eq
ue
nce
s
Deltaproteobacteria
*
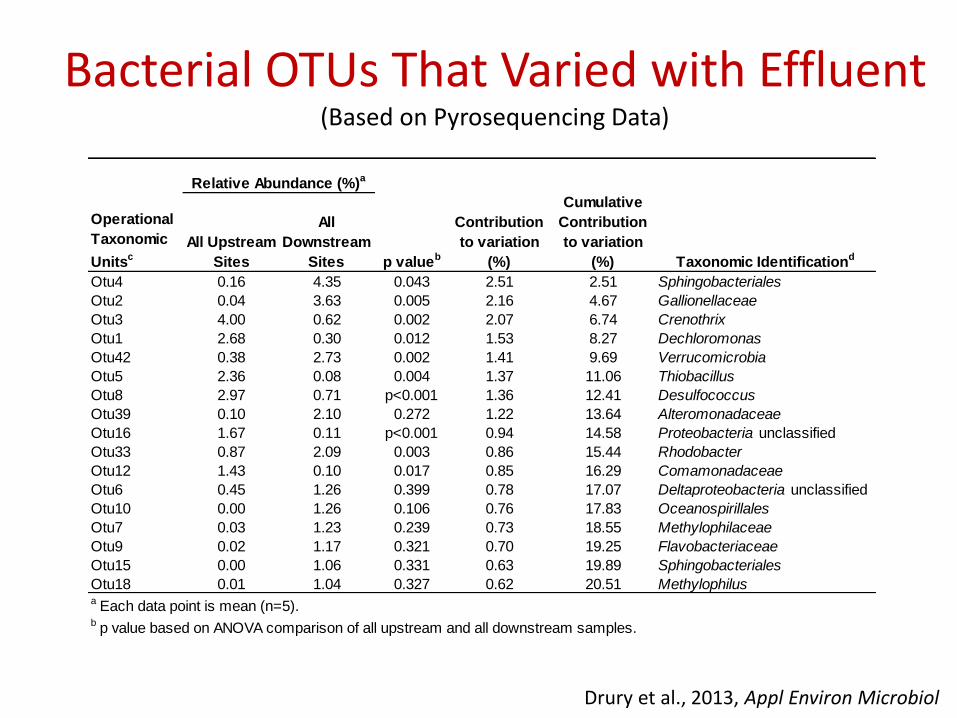
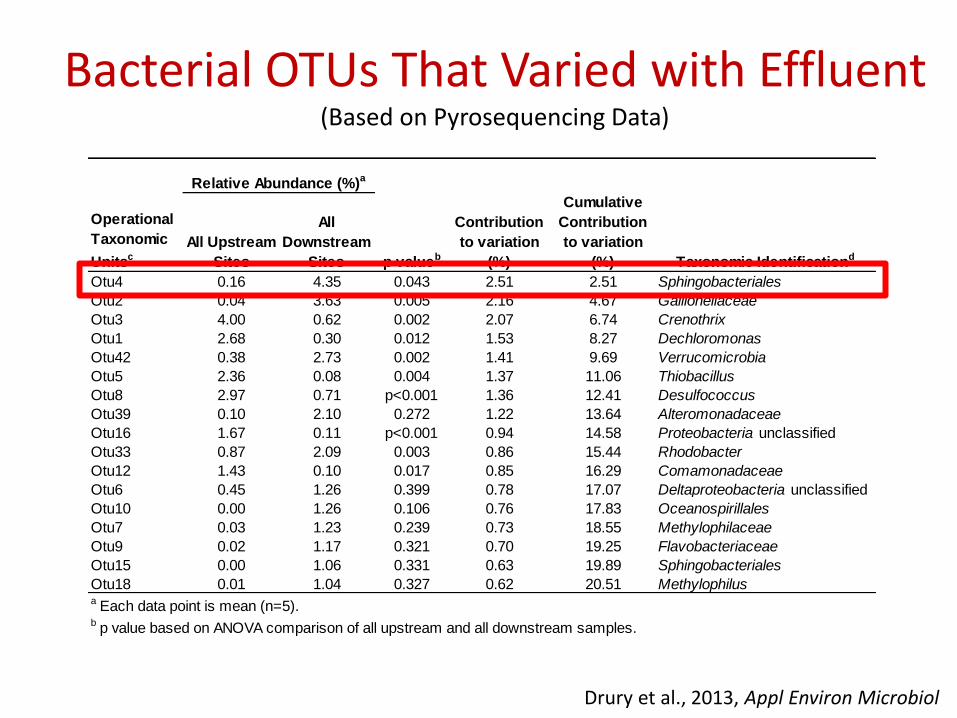
Bacterial OTUs That Varied with Effluent (Based on Pyrosequencing Data)
Drury et al., 2013, Appl Environ Microbiol
Operational
Taxonomic
Unitsc
All Upstream
Sites
All
Downstream
Sites p valueb
Contribution
to variation
(%)
Cumulative
Contribution
to variation
(%) Taxonomic Identificationd
Otu4 0.16 4.35 0.043 2.51 2.51 Sphingobacteriales
Otu2 0.04 3.63 0.005 2.16 4.67 Gallionellaceae
Otu3 4.00 0.62 0.002 2.07 6.74 Crenothrix
Otu1 2.68 0.30 0.012 1.53 8.27 Dechloromonas
Otu42 0.38 2.73 0.002 1.41 9.69 Verrucomicrobia
Otu5 2.36 0.08 0.004 1.37 11.06 Thiobacillus
Otu8 2.97 0.71 p<0.001 1.36 12.41 Desulfococcus
Otu39 0.10 2.10 0.272 1.22 13.64 Alteromonadaceae
Otu16 1.67 0.11 p<0.001 0.94 14.58 Proteobacteria unclassified
Otu33 0.87 2.09 0.003 0.86 15.44 Rhodobacter
Otu12 1.43 0.10 0.017 0.85 16.29 Comamonadaceae
Otu6 0.45 1.26 0.399 0.78 17.07 Deltaproteobacteria unclassified
Otu10 0.00 1.26 0.106 0.76 17.83 Oceanospirillales
Otu7 0.03 1.23 0.239 0.73 18.55 Methylophilaceae
Otu9 0.02 1.17 0.321 0.70 19.25 Flavobacteriaceae
Otu15 0.00 1.06 0.331 0.63 19.89 Sphingobacteriales
Otu18 0.01 1.04 0.327 0.62 20.51 Methylophilusa Each data point is mean (n=5).b p value based on ANOVA comparison of all upstream and all downstream samples.
Relative Abundance (%)a
Points of Interest from Effluent Study
1. Biotic Homogenization (BH) – A complex process whereby formerly distinct biota at different
locations become more similar in composition over time.
– BH can be driven by natural processes, including geological disturbances.
– Human activities are currently driving BH on an unprecedented scale.
– Urbanization has been recognized as a significant driver of BH.
– Recent work suggests that BH is widespread in aquatic and terrestrial systems, in taxonomic groups ranging from plants to birds and fish.
– BH is a concern because of the potential for decreases in global biological diversity and ecosystem resilience.
– BH has become an important research agenda in population and community ecology.
– No studies have linked the concept of BH to bacterial communities.

Community Structure Nonmetric Multidimensional Scaling Ordination of
16S Tag Pyrosequencing Data
Drury et al., 2013, Appl Environ Microbiol
AMOVA Analysis
ValueP-value
Suburban Up vs Urban Up <0.001
Suburban Up vs Suburban Down 0.003
Urban Up vs Urban Down <0.001
Suburban Down vs Urban Down 0.982
Suburban Up vs Urban Down 0.003
Interaction Effect <0.001
Points of Interest from Effluent Study 2. Negative Impacts of WWTP Effluent
– At both the urban and suburban sites WWTP effluent resulted in increased inorganic nutrients (NO3
- and PO43-)
– Previous work by others has demonstrated that increased concentrations of N and P associated with WWTP effluent:
• Stimulates planktonic bacterial growth (Garnier et al., 1992; Goñi-Urriza et al., 1999)
• Increases abundance and diversity of benthic bacteria (Wakelin et al., 2008)
– Yet in our study WWTP effluent resulted in
• Decreased numbers of bacterial cells
• Decreased bacterial diversity
• Increased per cell respiration rates
Does WWTP effluent contain compounds with antimicrobial properties?
Bacterial OTUs That Varied with Effluent (Based on Pyrosequencing Data)
Drury et al., 2013, Appl Environ Microbiol
Operational
Taxonomic
Unitsc
All Upstream
Sites
All
Downstream
Sites p valueb
Contribution
to variation
(%)
Cumulative
Contribution
to variation
(%) Taxonomic Identificationd
Otu4 0.16 4.35 0.043 2.51 2.51 Sphingobacteriales
Otu2 0.04 3.63 0.005 2.16 4.67 Gallionellaceae
Otu3 4.00 0.62 0.002 2.07 6.74 Crenothrix
Otu1 2.68 0.30 0.012 1.53 8.27 Dechloromonas
Otu42 0.38 2.73 0.002 1.41 9.69 Verrucomicrobia
Otu5 2.36 0.08 0.004 1.37 11.06 Thiobacillus
Otu8 2.97 0.71 p<0.001 1.36 12.41 Desulfococcus
Otu39 0.10 2.10 0.272 1.22 13.64 Alteromonadaceae
Otu16 1.67 0.11 p<0.001 0.94 14.58 Proteobacteria unclassified
Otu33 0.87 2.09 0.003 0.86 15.44 Rhodobacter
Otu12 1.43 0.10 0.017 0.85 16.29 Comamonadaceae
Otu6 0.45 1.26 0.399 0.78 17.07 Deltaproteobacteria unclassified
Otu10 0.00 1.26 0.106 0.76 17.83 Oceanospirillales
Otu7 0.03 1.23 0.239 0.73 18.55 Methylophilaceae
Otu9 0.02 1.17 0.321 0.70 19.25 Flavobacteriaceae
Otu15 0.00 1.06 0.331 0.63 19.89 Sphingobacteriales
Otu18 0.01 1.04 0.327 0.62 20.51 Methylophilusa Each data point is mean (n=5).b p value based on ANOVA comparison of all upstream and all downstream samples.
Relative Abundance (%)a

Acknowledgements
Collaborators • Emma Rosi-Marshall
– The Cary Institute of Ecosystem Studies • John Scott
– Illinois Sustainable Technology Center • Teresa Chow
– Illinois Sustainable Technology Center • Monte Wilcoxon
– Illinois Sustainable Technology Center
Funding • Illinois Sustainable Technology Center