Ecosystems Protecting In frastruct ure and … · Avalanches and debris flows lead to a reduction...
37
Case Ecosyst e study Ch Alejandro 2 Instituto A CCT‐CO tems Prot hile: Quan of for SLF Informing o Castelle 1 WSL Instit Flüelast Argentino de ONICET‐Men tecting In ntifying a ests agai F Progress g period: er 1, 2 , Tho tute for Snow trasse 11, 72 e Nivología, G ndoza. Av. R nfrastruct EPIC nd impro nst snow s Scientif May 201 mas Häfe w and Avala 260 Davos Do Glaciología y uiz Leal s/n, ture and C oving the avalanch fic Report 13 to Apri elfinger 1 a nche Resear orf, Switzerl y Ciencias Am 5500 Mend Commun protectiv hes t il 2016 and Peter rch, SLF. land mbientales I doza, Argent ities ve capacit r Bebi 1 ANIGLA, ina ty
Transcript of Ecosystems Protecting In frastruct ure and … · Avalanches and debris flows lead to a reduction...

Case
Ecosyst
e study Ch
Alejandro
2 Instituto ACCT‐CO
tems Prot
hile: Quanof for
SLF
Informing
o Castelle1 WSL Instit
Flüelast
Argentino deONICET‐Men
tecting In
ntifying aests agai
F Progress
g period:
er1, 2, Tho
tute for Snowtrasse 11, 72
e Nivología, Gndoza. Av. R
nfrastruct
EPIC
nd impronst snow
s Scientif
May 201
mas Häfe
w and Avala260 Davos Do
Glaciología yuiz Leal s/n,
ture and C
oving the avalanch
fic Report
13 to Apri
elfinger1 a
nche Researorf, Switzerl
y Ciencias Am5500 Mend
Commun
protectivhes
t
il 2016
and Peter
rch, SLF. land
mbientales Idoza, Argent
ities
ve capacit
r Bebi1
ANIGLA, ina
ty

TABLE OF CONTENTS
Abstract 1
Resumen 3
1 Introduction 5
2 Study area 6
3 Material and methods
3. 1 Remote sensing analysis 9
3. 2 Fieldwork 10
3. 3 Dendrochronological analyses 11
3. 4 Avalanche simulations 12
4 Results
4. 1 Natural disturbances in the study area 15
4. 2 Forest structure in disturbed and control plots 17
4. 3 Results of dendrochronological analysis
4. 3. 1 Age distribution 20
4. 3. 2 Disturbance history 22
4. 3. 3 Runout distances 26
5 Outlook 31
References 32
1
Abstract
This study is part of a broader project entitled “Ecosystems protecting infrastructures and communities” (EPIC), carried out in six countries, in which ecosystem services are recognised, promoted and conserved as an integral part of disaster risk reduction (DDR) policy, planning and programming. The primary goal of EPIC Chile project is to study the interaction between snow avalanches and mountain forests, so as to quantify and improve forests’ protective capacity. The study was conducted in the region of Nevados de Chillán, which is located within the Biosphere Reserve Nevados de Chillán ‐ Laguna del Laja, Bío‐Bío Region, Chile. The results shown in this technical report are partly based on the master thesis of Thomas Häfelfinger, which was framed within the EPIC Chile project.
The region of Nevados de Chillán has experienced in the past decades a booming in infrastructure expansion due to growing tourism. Tourists are principally attracted in winter by snow activities at the ski resort Nevados de Chillán, and all year long by thermal springs. Both leisure activities take place at the foothills of the Nevados de Chillán volcano, categorized as one of the volcanoes with the highest damage potential in Chile. To access the main touristic area, located at the upper part of the valley, only one road exists which is exposed to natural hazards such us snow avalanches, landslides, rockfalls and debris flows. The region is covered by native forests represented almost exclusively by the genus Nothofagus. Here we evaluate the role of forests as a measure for eco‐DRR. For this purpose, the first part of our study was to reconstruct the disturbance history in a region where documentary evidence of past events is largely missing, as it is the case in general along the southern Andes. Tree‐ring methods were applied in combination with different forest structure analyses so as to elaborate a tree‐ring based archive of past disturbance events, as a complement to the few available written records, and to map using GIS the different disturbance events in the sectors of the biosphere reserve where people and/or infrastructure are most exposed. This information was combined with avalanche simulations to define release areas of avalanches. Avalanches return periods of 10 and 100 years were simulated with the new forest module of the avalanche simulation software RAMMS to quantify the protective effect of forests against avalanches. Avalanches are the most frequent and nowadays spatially most important disturbance regime in the study area. Avalanches and debris flows lead to a reduction of canopy density and age of the forest. However, no such influence could be detected with regard to tree diameters. Tree heights are reduced in avalanche disturbed forests significantly, but increased in forests disturbed by debris flow compared to not disturbed forests. Avalanche and debris flow events occurred most intensively in 1995 and 2000 with detected avalanches and debris flows in many tracks. The combination of avalanche simulations with dendrogeomorphic information can provide valuable information on

2
potential release areas for avalanches. Simulation scenarios without forests showed that forests reduce considerably the impact pressure on the road as well as the spatial extent of the runout. Scenarios with additional afforestations suggest that such measures would contribute to lower maximum impact pressures and reduced avalanche frequencies, but cannot avoid that avalanches reach the road. In areas where information about past avalanches is missing, the combination of avalanche simulations with dendrochronological methods is helpful for risk assessment.
In the final project report, we will include examples of RAMMS avalanches simulations coupled with tree‐ring data and use these results to discuss possibilities of forest management aiming at improving forests' protective function and the next steps for the production of local hazard maps.
3
Resumen
El presente estudio es parte de un proyecto más amplio titulado “Ecosistemas para la protección de Infraestructura y Comunidades” (EPIC), ejecutado en seis países, en el cual servicios ecosistémicos son reconocidos, promovidos y conservados como parte integral de políticas, planeamiento y programación de reducción de riesgo de desastres (DDR). El objetivo primario del proyecto EPIC Chile es estudiar la interacción entre las avalanchas de nieve y el bosque de montaña, con el objetivo de cuantificar y mejorar la capacidad protectora del bosque. El estudio fue realizado en la región de Nevados de Chillán, la cual se encuentra ubicada dentro de la Reserva de la Biosfera Nevados de Chillán ‐ Laguna del Laja, Región del Bío‐Bío, Chile. Los resultados mostrados en este informe técnico están parcialmente basados en la tesis de maestría de Thomas Häfelfinger, la cual se enmarcó en el proyecto EPIC Chile.
La región de los Nevados de Chillán ha experimentado en las últimas décadas una gran expansión de infraestructura debida al creciente turismo. Los turistas son principalmente atraídos en invierno por actividades relacionadas a la nieve en el centro de esquí Nevados de Chillán, y a lo largo del año por aguas termales. Ambas actividades de esparcimiento tienen lugar a los pies del volcán Nevados de Chillán, el cual es categorizado como uno de los volcanes con el mayor potencial de daño en Chile. Para acceder al área turística principal, localizada en la porción superior del valle, existe sólo una ruta que se encuentra expuesta a peligros naturales como avalanchas de nieve, deslizamientos de ladera, caídas de rocas y flujos de detritos. La región se encuentra cubierta por bosques nativos representados casi exclusivamente por el género Nothofagus. Aquí evaluamos el rol de los bosques como medida para eco‐DRR. Con este propósito, la primera parte de nuestro estudio fue reconstruir la historia de disturbios en una región en que la evidencia documentada de eventos pasados es muy escasa, como lo es de manera generalizada a lo largo de los Andes del Sur. Métodos dendrocronológicos fueron empleados en combinación con distintos análisis de estructura boscosa con el fin de elaborar un archivo de eventos de disturbio pasados en base a anillos de árboles, como complemento de los limitados registros históricos disponibles, y para el mapeo a través de SIG de los diversos eventos de disturbio en sectores de la reserva de biosfera en que personas y/o infraestructura se ven más expuestas. Esta información fue combinada con simulaciones de avalanchas para poder determinar sus zonas de inicio. Avalanchas con periodos de retorno de 10 y 100 años fueron simuladas con el nuevo módulo de bosque del programa de simulación RAMMS con el fin de cuantificar el efecto protector de los bosques contra las avalanchas. Las avalanchas representan actualmente el régimen de disturbio de mayor frecuencia y mayor cobertura espacial en el área de estudio. Las avalanchas y los flujos de detritos conllevan a una reducción tanto de la densidad del dosel como de la edad del
4
bosque. Sin embargo, esta tendencia no se detectó en cuanto al diámetro de los árboles. Las alturas de los árboles son significantemente menores en bosques con disturbios por avalanchas, aunque mayores en bosques afectados por flujos de detritos, en comparación con bosques sin disturbios. Eventos de avalanchas y flujos de detritos ocurrieron con gran intensidad en 1995 y 2000, mostrando actividad en gran parte de los senderos de avalanchas y canales de flujos de detritos estudiados. La combinación de simulaciones de avalanchas con información dendrocronológica puede proveer valiosa información sobre las potenciales zonas de inicio de las avalanchas. Escenarios de simulación sin considerar bosques mostraron que éste reduce considerablemente la presión de impacto de las avalanchas en la carretera, como así también la extensión de su recorrido en la zona de frenado. Por su parte escenarios considerando forestaciones adicionales sugieren que este tipo de medidas contribuiría a reducir tanto las presiones máximas de impacto como las frecuencias, si bien no impedirían que las avalanchas alcancen la carretera. En regiones en que la información sobre eventos pasados de avalanchas es escasa, la combinación de simulaciones de avalanchas con métodos dendrocronológicos es de gran utilidad para la evaluación del riesgo.
En el informe final del proyecto, se incluirán ejemplos de simulaciones de avalanchas con RAMMS en conjunto con datos dendrocronológicos y se utilizarán estos resultados y para discutir posibilidades de manejo forestal tendientes a mejorar la capacidad protectora del bosque y los próximos pasos para la producción de mapas locales de peligrosidad.

5
1 Introduction In mountain areas, human settlements and infrastructure are commonly endangered by natural disturbances like avalanches, debris flows, rockfalls and landslides. These disturbances are poorly documented in many areas of the world and no data about historic events is available. Information about the spatio‐temporal pattern of disturbances is necessary for the reconstruction of historic events. The documentation of geomorphic processes and their related natural disasters is important for risk assessments (Stoffel and Huggel, 2012). The same holds true for the present study in Nevados de Chillán, Chile, where broadleaved forest represent an effective measure for risk reduction and protection for local communities against natural hazards, in particular snow avalanches.
An important function of forests in mountainous regions is to protect infrastructure and people against natural hazards (Brang et al., 2006). Forests have an important protective function in particular against avalanches. Yet for large avalanches (> 60000 m3), which start far above the treeline, forests have only a marginal influence on the kinetic energy and runout extent of the avalanche (Bartelt and Stöckli, 2001). In the case of small (5000‐25000 m3) to medium‐sized (25000‐60000 m3) avalanches, forests can extract snow from the avalanche flow through deposition of snow behind trees. The breaking of trees results in turn in a reduction of kinetic energy. These processes reduce the speed of avalanches and contribute to shortening their runout extent (Feistl et al., 2015). Forest parameters, such as stand composition, structure, stem density, wooden debris and ground vegetation influence the spatial extent of small and medium‐sized avalanches (Teich et al., 2012). Apart from slowing down and stopping avalanches, forests stabilize the snowpack in potential release areas and thus help to prevent avalanche initiation (Bebi et al., 2009). For the protection of infrastructure and settlements against avalanches, forests are a cost‐efficient protection measure (Olschewski et al., 2012). Besides this protective function, trees are a natural archive of past events and provide valuable information about the spatial and temporal extent of past geomorphic processes.
Dendrogeomorphology is the research of geomorphic processes through growth anomalies in trees (Alestalo, 1971). Dendrogeomorphology is a widely accepted approach to describe the historical occurrence of geomorphic processes (Stoffel et al., 2013). This approach has already been used in the Patagonian Andes for several tree‐ring studies to detect past avalanche activity. Studies focusing on broadleaved species, like in our study area, became more popular over the last years (e.g. Mundo et al., 2007; Casteller et al., 2008; Arbellay et al., 2010; Casteller et al., 2011). A “process‐event‐response” concept is the basis of this research (Shroder, 1978). The formation of reaction wood typically leads to an eccentric growth, which allows dating disturbance events. The elimination of neighboring trees by a disturbance can result in a growth release of surviving trees, which

6
profit of less light competition and more available resources like water and nutrients (e.g. Bollschweiler and Stoffel 2010, Corona et al., 2012). These responses of trees to disturbances can also be caused by processes like browsing, anthropogenic or climate disturbances. Therefore, to be sure that these responses are caused exclusively by geomorphic processes, the study site has to be carefully analyzed (Stoffel and Corona, 2014).
In this study we aimed for a better understanding and quantification of interactions between forest ecosystems and natural hazards at a selected site in Nevados de Chillán (Chile) and evaluated possibilities to optimize the protective effect of forests in the future. For this purpose, we firstly analyzed the event history of avalanches and debris flows that can reach the street and human settlements in Nevados de Chillán. According to our observations, these are the two main geomorphic processes (besides volcanic activity, which is not addressed in this study) in the area representing a threat for local communities. In this and other studies (Casteller et al., 2008) these dendrochronological investigations were combined with numerical models to reconstruct avalanche events. The used simulation software RAMMS (Rapid Mass Movements) calculates mass movements in a three‐dimensional terrain (Christen et al., 2010). In earlier times, the effect of forests in avalanche simulations was taken into account through increasing friction parameters (Bartelt and Stöckli, 2001). Nowadays, the new RAMMS version with the forest module considers also (i) the detrainment of snow, (ii) avalanche power reduction through tree destruction, and (iii) variable friction parameters of different forest types (Feistl, 2015). In the study area, as well as in many other parts of the southern Andes, there is a lack of information about input parameters for avalanche simulations, such as snow heights and precise location and size of release areas. To overcome these restrictions, different avalanche simulations were done and adapted to define appropriate release areas. The results of avalanche simulations were combined with dendrogeomorphic information; for this, maximum pressures had to be defined for trees responding to avalanches. Tiri (2009) showed that broken and uprooted trees were exposed to impact pressures up to 400 kPa. With large tree diameters at breast height, the chance to break or uproot trees is smaller.
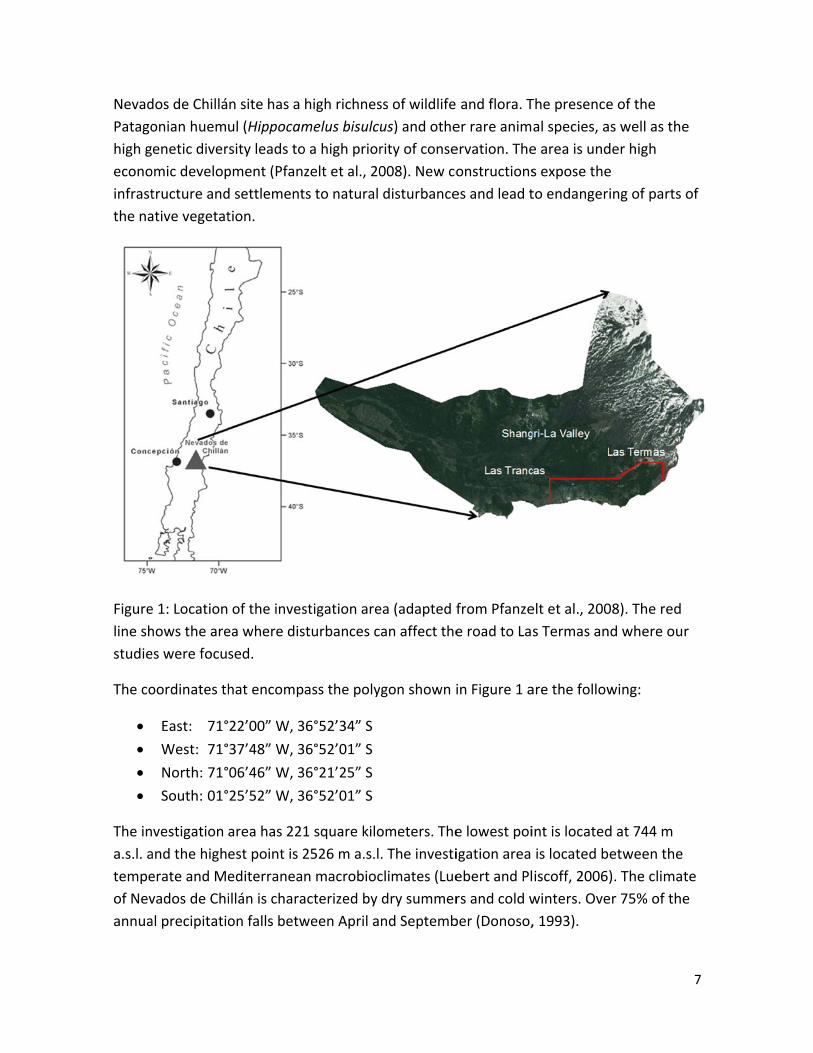
2 Study area The study area is located in the Bío‐Bío Region (VIII Region) of Chile and belongs to the northern part of Patagonia in the Central Chilean zone (Fig.1; Cordero et al., 2014). It is part of the Nevados de Chillán volcanic complex, which is located in the so‐called "transition zone" of the Biosphere Reserve Nevados de Chillán – Laguna del Laja. The
NevadPatagohigh geconoinfrastthe na
Figureline shstudie
The co
• • • •
The ina.s.l. atempeof Nevannua
dos de Chilláonian huemenetic diveromic developtructure andative vegetat
e 1: Locationhows the arees were focu
oordinates th
East: 71°West: 71°North: 71°South: 01°
vestigation and the higherate and Mevados de Chial precipitatio
n site has a ul (Hippocamrsity leads topment (Pfand settlementtion.
of the invesea where dissed.
hat encomp
22’00” W, 337’48” W, 306’46” W, 325’52” W, 3
area has 221est point is 2editerraneaillán is charaon falls betw
high richnesmelus bisulcuo a high priorzelt et al., 20ts to natural
stigation aresturbances c
ass the poly
36°52’34” S36°52’01” S36°21’25” S36°52’01” S
1 square kilo2526 m a.s.ln macrobiocacterized by ween April a
ss of wildlifeus) and otherity of conse008). New codisturbance
ea (adapted fan affect the
gon shown i
ometers. The. The investiclimates (Luedry summernd Septemb
and flora. Ter rare animervation. Theonstructionses and lead t
from Pfanzee road to La
in Figure 1 a
e lowest poiigation area ebert and Plrs and cold wber (Donoso,
The presenceal species, ae area is unds expose theto endanger
elt et al., 200s Termas an
are the follow
int is locatedis located biscoff, 2006winters. Ove, 1993).
e of the as well as theder high e ing of parts
08). The rednd where ou
wing:
d at 744 m etween the ). The climater 75% of the
7
e
of
r
te e

Climatpreciptime psnowf
Figure
In the causedBlancothere The mtouristwith tgeologincept
The hial. (20area, wvegetadombestandsNothof
te data frompitation betwperiod was 1fall events ar
e 2: Weather
investigatiod by a high vo and Las Teare currentl
most recent st facilities, thhe highest dgical substratisols and are
gh diversity 008) describewhere the station units weyi (Mirb.) Os with Nothoofagus obliqu
m a weather sween 1998 a13.2 degreesre for the stu
r data from a
on area we cavolcanic activrmas sub‐coy 17 cones. Tsmall eruptiohe Nevados damage poteates, characte developed
of geologicae 11 differentudied avalawere found: Oerst. forestsofagus dombua (Mirb.) O
station locatnd 2012 was (Figure 2). Sudy area larg
a meteorolo
an find a higvity. The Neomplex, whicThe first recons occurredde Chillán vential in Chilteristic soils ad out of thes
al substratesnt vegetationnche and declose to the s is found; thbeyi, Nothofaerst. The no
ted in Las Trs 1007 mm. Specific datagely missing
gical station
gh diversity ovados de Chch were formcognized erud in 2003 andolcano is cate (Dixon et aare formed. e volcanic p
s leads to difn units in theebris flow trariverbed in he other parfagus pumilion‐afforested
rancas show The mean aa about snowg.
n located at
of geologicahillán volcanmed about 3uption was ad 2008. Duetegorized asal., 1999). O These soils roducts (Fre
fferent vegee region. In tacks are locahumid localrts of the foro (Poepp. & d part belon
that mean aannual tempw heights an
Las Trancas.
l substrates,o consists of37000 years bout 640000e to the expos one of the ut of these mare classifieeiberg, 1984
etation unitsthe main invated, the follities, Nothofrest are mixeEndl.) Krassgs to Chusqu
annual perature in thnd extreme
.
, which is f the Cerro ago. In total0 years ago.osure of volcanoes multivariateed as ).
. Pflanzelt evestigation llowing fagus ed forest ser and uea culeou‐
8
his
l
e
t
9
Coirones assemblages with the dominant representative species Chusquea culeou Desvaux. On the ridge, some Nothofagus pumillio krummholz‐type vegetation exists.
3 Material and methods
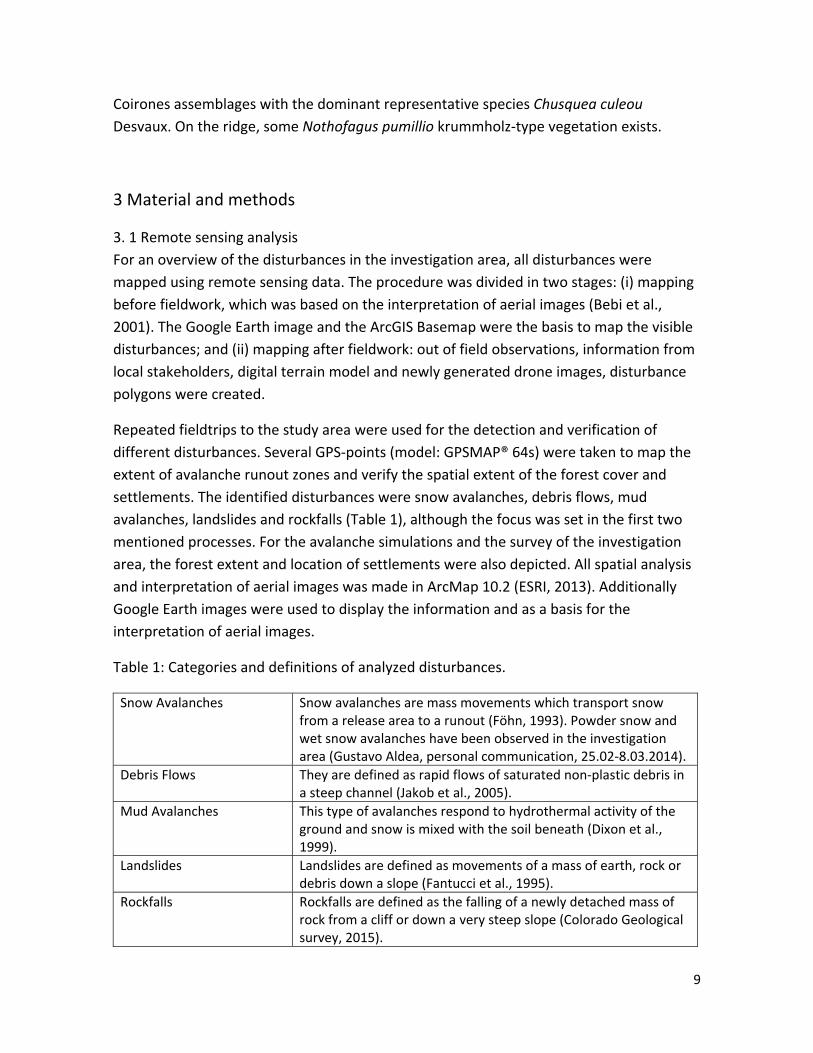
3. 1 Remote sensing analysis For an overview of the disturbances in the investigation area, all disturbances were mapped using remote sensing data. The procedure was divided in two stages: (i) mapping before fieldwork, which was based on the interpretation of aerial images (Bebi et al., 2001). The Google Earth image and the ArcGIS Basemap were the basis to map the visible disturbances; and (ii) mapping after fieldwork: out of field observations, information from local stakeholders, digital terrain model and newly generated drone images, disturbance polygons were created.
Repeated fieldtrips to the study area were used for the detection and verification of different disturbances. Several GPS‐points (model: GPSMAP® 64s) were taken to map the extent of avalanche runout zones and verify the spatial extent of the forest cover and settlements. The identified disturbances were snow avalanches, debris flows, mud avalanches, landslides and rockfalls (Table 1), although the focus was set in the first two mentioned processes. For the avalanche simulations and the survey of the investigation area, the forest extent and location of settlements were also depicted. All spatial analysis and interpretation of aerial images was made in ArcMap 10.2 (ESRI, 2013). Additionally Google Earth images were used to display the information and as a basis for the interpretation of aerial images.
Table 1: Categories and definitions of analyzed disturbances.
Snow Avalanches Snow avalanches are mass movements which transport snow from a release area to a runout (Föhn, 1993). Powder snow and wet snow avalanches have been observed in the investigation area (Gustavo Aldea, personal communication, 25.02‐8.03.2014).
Debris Flows They are defined as rapid flows of saturated non‐plastic debris in a steep channel (Jakob et al., 2005).
Mud Avalanches This type of avalanches respond to hydrothermal activity of the ground and snow is mixed with the soil beneath (Dixon et al., 1999).
Landslides Landslides are defined as movements of a mass of earth, rock or debris down a slope (Fantucci et al., 1995).
Rockfalls Rockfalls are defined as the falling of a newly detached mass of rock from a cliff or down a very steep slope (Colorado Geological survey, 2015).

3. 2 FiThe firdisturbstakehthe fodendr
The mforest were d2). Thedisturbdisturbthe foage of
Figurefaciliti
eldwork rst fieldtrip tbances affecholders madcus was set ochronologi
most recent fstructure andone. The foese plots webance patchbances withrest structurf the stands.
e 3: Locationes are locate
to the study cting local coe. A further on samplingcal methods
ieldtrip tooknd a collectiorest age andere preselecth where foreout signs of re paramete
of forest ploed between
area was coommunities fieldtrip wag the main avs.
k place in Feon of informd structure wted before tst occurs andisturbanceers, at least 5
ots and distuavalanche t
onducted in were identifs conductedvalanche tra
bruary 2015mation aboutwere evaluahe fieldtrip ind also in eaces, a forest p5 trees were
urbance tractrack 16 (av1
November 2fied and firsd in Februaryacks located
5, during wht former andted in specifin a specific ch forest staplot was detee cored in ea
cks. The mai16) and avala
2013, in whist contacts wy‐March 201in the study
ich an analyd present disfic plots (Figtarget desigand betweenermined. Adach plot to d
in settlemenanche tack 1
ch the mainwith local 14, in which y area using
sis of the sturbances gure 3; Tablegn: in each n two dditionally toetermine th
nt and touris18 (av18).
10
e
o e
st
11
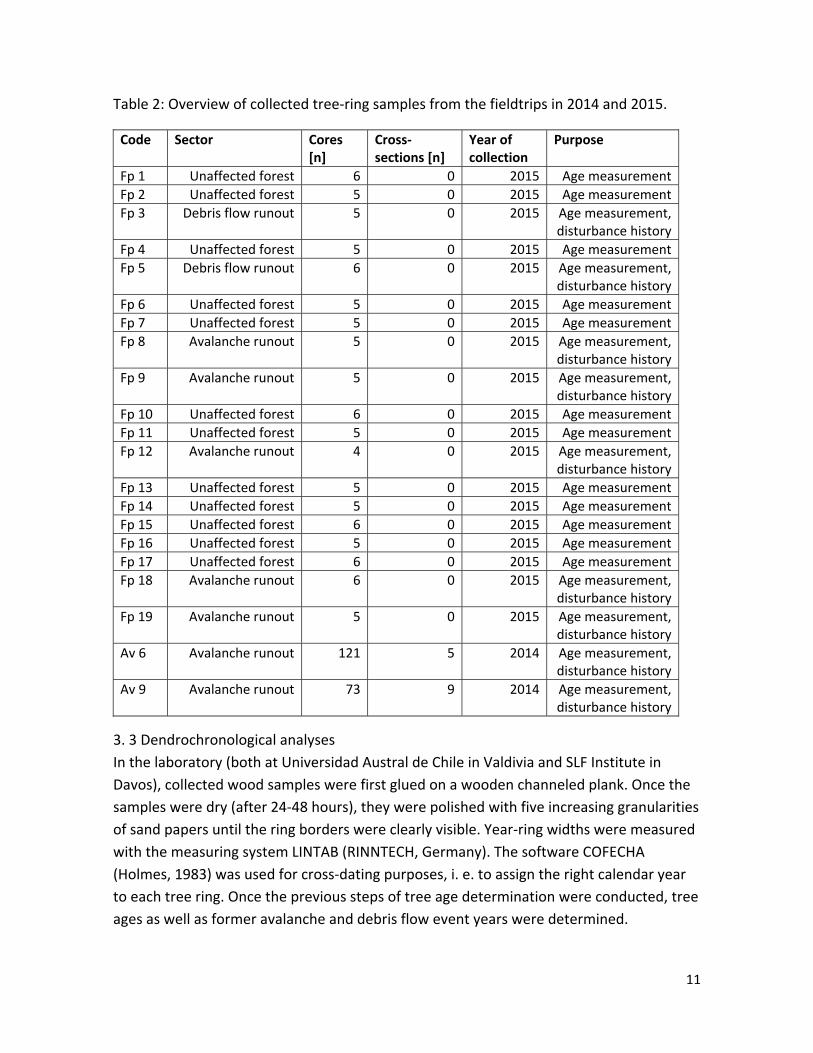
Table 2: Overview of collected tree‐ring samples from the fieldtrips in 2014 and 2015.
Code Sector Cores [n]
Cross‐sections [n]
Year of collection
Purpose
Fp 1 Unaffected forest 6 0 2015 Age measurementFp 2 Unaffected forest 5 0 2015 Age measurementFp 3 Debris flow runout 5 0 2015 Age measurement,
disturbance historyFp 4 Unaffected forest 5 0 2015 Age measurementFp 5 Debris flow runout 6 0 2015 Age measurement,
disturbance historyFp 6 Unaffected forest 5 0 2015 Age measurementFp 7 Unaffected forest 5 0 2015 Age measurementFp 8 Avalanche runout 5 0 2015 Age measurement,
disturbance historyFp 9 Avalanche runout 5 0 2015 Age measurement,
disturbance historyFp 10 Unaffected forest 6 0 2015 Age measurementFp 11 Unaffected forest 5 0 2015 Age measurementFp 12 Avalanche runout 4 0 2015 Age measurement,
disturbance historyFp 13 Unaffected forest 5 0 2015 Age measurementFp 14 Unaffected forest 5 0 2015 Age measurementFp 15 Unaffected forest 6 0 2015 Age measurementFp 16 Unaffected forest 5 0 2015 Age measurementFp 17 Unaffected forest 6 0 2015 Age measurementFp 18 Avalanche runout 6 0 2015 Age measurement,
disturbance historyFp 19 Avalanche runout 5 0 2015 Age measurement,
disturbance historyAv 6 Avalanche runout 121 5 2014 Age measurement,
disturbance historyAv 9 Avalanche runout 73 9 2014 Age measurement,
disturbance history
3. 3 Dendrochronological analyses In the laboratory (both at Universidad Austral de Chile in Valdivia and SLF Institute in Davos), collected wood samples were first glued on a wooden channeled plank. Once the samples were dry (after 24‐48 hours), they were polished with five increasing granularities of sand papers until the ring borders were clearly visible. Year‐ring widths were measured with the measuring system LINTAB (RINNTECH, Germany). The software COFECHA (Holmes, 1983) was used for cross‐dating purposes, i. e. to assign the right calendar year to each tree ring. Once the previous steps of tree age determination were conducted, tree ages as well as former avalanche and debris flow event years were determined.

12
Scars, growth releases and growth decreases were used for the tree‐ring reconstruction of events. In this procedure, all cores were checked visually from pith to bark with the binocular to identify scars and abrupt growth changes. Growth reactions were grouped in three different categories, including class A: abrupt change in radial growth, strong impact in which at least 5 rings are affected; class B: abrupt change in radial growth, strong impact in which one ring is affected; and class C: abrupt change in radial growth, weak impact in which only one tree ring is affected. All years were compared with the previous and subsequent three to five years. An abrupt growth change was defined if the variation was larger than 50%.
The so‐called "expert approach" was used for the reconstruction of snow avalanche and debris flow events using tree‐rings; this is a semi‐quantitative analysis based on a careful site selection (Stoffel and Corona, 2014). The selection of past events requires trees in the same spatial area, which show growth disturbances simultaneously. No fixed threshold of reacting trees is defined using this approach. The different cores are compared to each other and late event responses are considered. In the expert approach, the comparison of scars and growth responses of trees in one plot and across all plots with the same disturbance allows to detect past disturbance events. We complementary applied the so‐called "indices approach", in which an index value is calculated on the base of the ratio between reacting and sampled trees (Butler and Sawyer, 2008). In this case, all years with an index value higher than a fixed threshold are identified as event years.
To make sure that growth responses were caused by geomorphic disturbances and not by anthropogenic or climatic causes, the cores of the disturbance plots were compared with cores of unaffected forest plots (plot 10 and 11 used as a master chronology).
3. 4 Avalanche simulations We used the simulation software RAMMS, which is a two‐dimensional software to calculate mass movement dynamics in a three‐dimensional terrain (Christen et al., 2010). In practice, this tool is often used to predict the speed and mass of geophysical mass movements (Bartelt et al., 2013). Avalanches were calculated with the RAMMS avalanche module (RAMMS: AVALANCHE version 1.6.25 ©WSL/SLF) and the new forest applications.
Different input parameters had to be defined and adapted for the simulations. To specify the forest type, different parameters are necessary (Table 3). This information was obtained from the forest plot survey. In case of the non existence of a forest plot nearby the track, the average of the 2 closest forest plots was calculated.

13
Table 3: Necessary information used to specify the forest structure in each track. Avalanche track 1 has two different forest types. In all tracks the forest type is deciduous and beech trees are growing (DBH: Diameter at Breast Height in cm).
Track number Crown coverage Roughness K‐value code DBH
1 0.6 2 N 211 0.7 2 N 502 0.5 2 N 213 0.9 2 J 394 0.2 2 Q 175 0.6 3 M 276 0.5 2 N 217 0.3 2 O 248 0.4 2 N 219 0.7 2 N 2010 0.6 2 N 2011 0.7 2 N 1812 0.8 2 K 1813 0.8 2 K 1814 0.8 2 K 1715 0.8 2 K 2116 0.8 2 K 2417 0.8 2 K 2418 0.3 1 R 2519 0.3 1 R 25
The detrainment coefficient K [kg m−1 s−2] was calculated out of the forest type, crown coverage and roughness in the area. It represents the breaking power that a forest exerts on the avalanche flow (Feistl, 2015). The different values belong to a code which is implemented in RAMMS. Information about snow height, snow density and erosion of avalanches is not available for the study area. Due to this lack of information, several input parameters had to be adapted and tested in several simulations. Release areas are an important input parameter for avalanche simulations. In places with a lack of information about historic release areas, as it was in our case, a GIS‐analysis with topographic parameters (i.e. slope, aspect, confinement and distance to the next ridge) can be a valuable aid to define release areas (Maggioni and Gruber, 2003). In our study, the definition of the potential release areas was based on the interpretation of remote sensing data with the help of topographic parameters. From previous investigations, it is known that avalanches release in a terrain with slope angles between 30° and 60° (Salm,

14
1982; Munter, 1999). In our case, slope angle and aspect were the most important topographical parameters to define potential release areas, which represent the basis for the avalanche calculation in RAMMS. To cover extreme scenarios, the largest possible release areas were drawn. Several simulations with 10 and 100‐year return periods were conducted. In addition, the friction value depends also on the return period, avalanche volume (determined by release area and release height), and ground roughness. In the used RAMMS version also the forest is taken into account. In different scenarios the avalanche volume and return period were adapted. Due to the lack of information about wind data, the wind load was set to zero. Out of this information, different friction values were calculated for open, channeled, gully and flat area slopes and also for forested areas. To have the same conditions in all tracks, the following parameters were not adapted and set as follows:
• Friction parameters Mu and Xi: these values have been calibrated in the Swiss Alps and are automatically computed in RAMMS. Due to the similar altitude range of the study area compared to the Swiss Alps, the standard elevation limits of 1500 and 1000 m a.s.l. were used.
• In all simulations, numerical, random energy and miscellaneous parameters were placed at standard settings. Due to missing information, no erosion layers were used in the simulations.
• The snow density was set to 300 [kg/m3]. • The erosion value was set to zero. • The stopping threshold was defined at 7% of the total momentum. Simulations
with different thresholds show that a value of 7% gives the most appropriate results.
In avalanche tracks 6 and 9 (named av6 and av9, respectively), specific information about runout distances from past events was available out of a more extensive tree‐ring sampling. Trees reacting to disturbances in the same year were linked in order to define runout zones, and specific spatial patterns of different avalanche years were drawn. The aim was to couple the runout information extracted from tree‐ring data with runouts from avalanche simulations.
Two different approaches were tested to prove how strong the avalanche impact pressure has to be for trees to show responses in the wood: 30 kPa‐pressure approach, in which trees respond to avalanches with flow pressures larger than 30 kPa; and tree destruction approach, in which the new RAMMS version is calculating areas where trees break due to the high pressure. These calculations are based on the maximum pressure in a specific
15
area, on tree species and on their DBH (Feistl, 2015). Here the assumption is that trees only respond in areas where tree breakage is possible.
To link together these different approaches with the runouts, simulations with different sizes of release areas and release heights were conducted. In avalanche tracks without information about the extent of the runout, other methods were necessary. For that, in several simulations the extent and orientation of the release area was adapted until the avalanche flowed in the "right track" and no forest without signs of disturbance was affected. All these simulations were made for 10‐year return periods as, according to local expert knowledge, all these events occur frequently. Larger release areas were drawn to consider the possibility of occurrence of 100‐year events, in which large portions of forests would be affected; simulations with different release heights were conducted.
To show the effect of forests on avalanches, different simulations with and without considering the existence of mountain forest were also conducted. The different runout distances and extents from different scenarios were compared to each other. Also the pressure and flow height on the road or walking path were compared. According to studies conducted in the Alps (Bebi et al., 2001), afforestations and specific forest management practices can prevent avalanche release and/or reduce avalanche energy, which can result in a reduced hazard for local mountain communities. It is foreseen in this study to investigate and evaluate such practices so as to locally promote eco‐DRR (Disaster Risk Reduction) measures in Nevados de Chillán.
4 Results
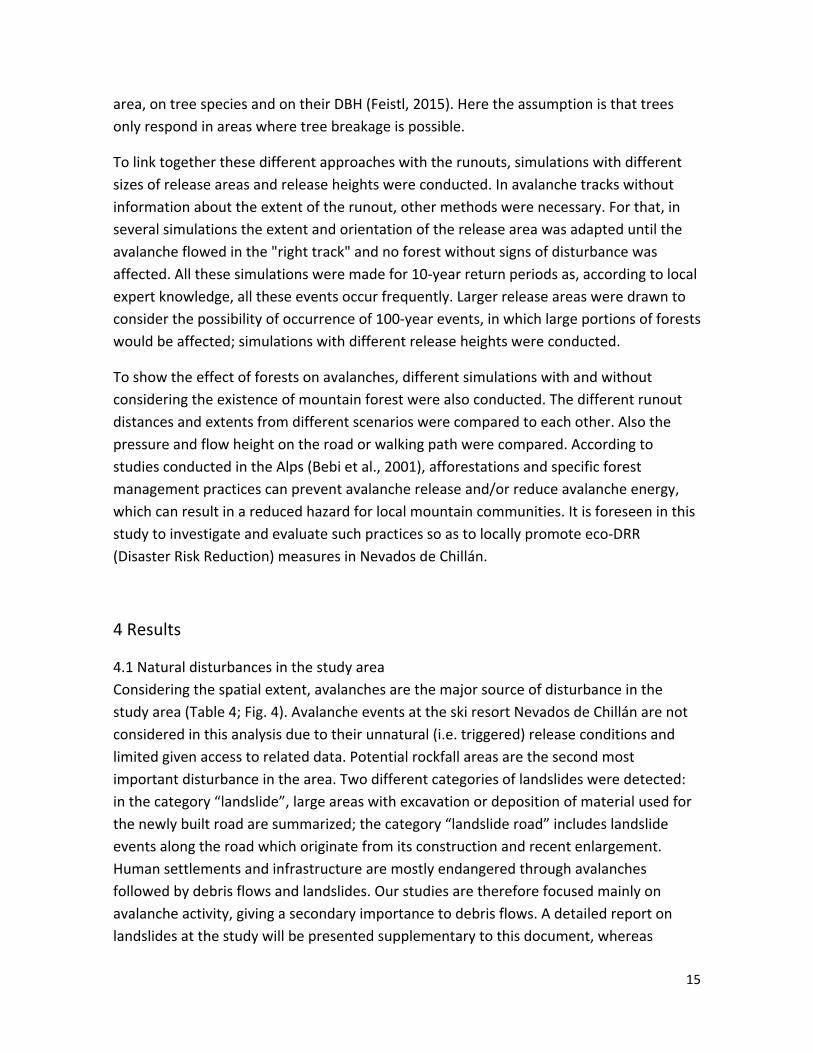
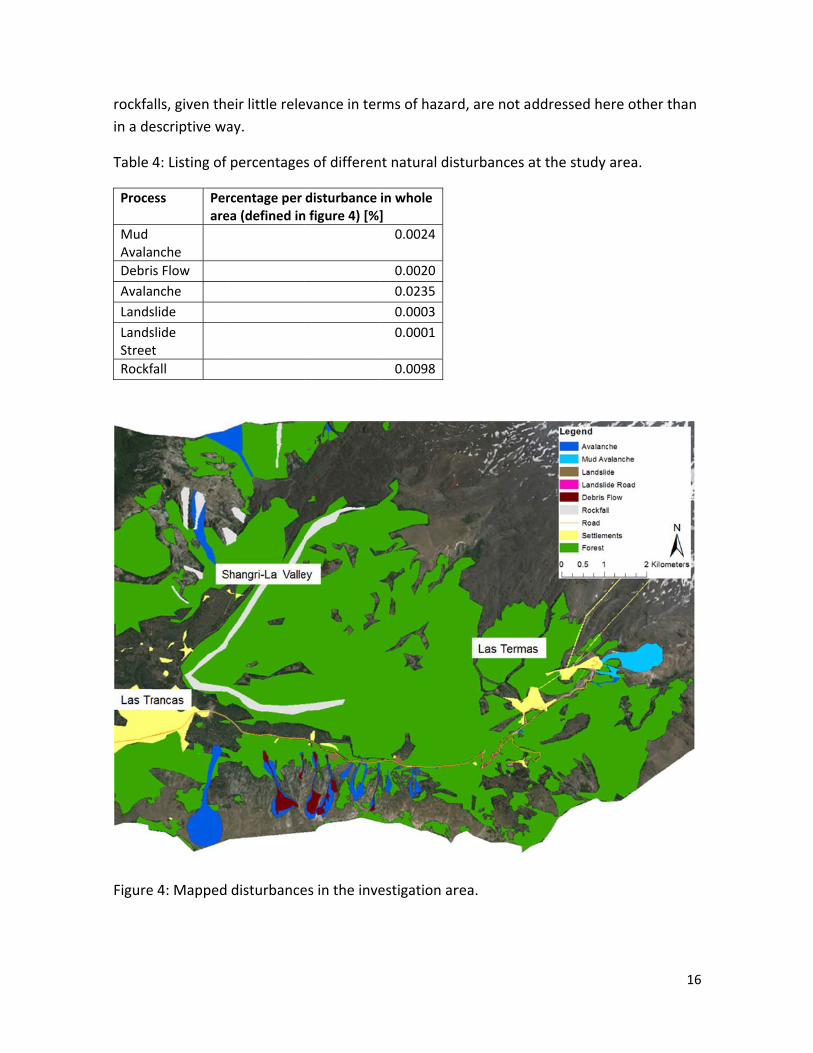
4.1 Natural disturbances in the study area Considering the spatial extent, avalanches are the major source of disturbance in the study area (Table 4; Fig. 4). Avalanche events at the ski resort Nevados de Chillán are not considered in this analysis due to their unnatural (i.e. triggered) release conditions and limited given access to related data. Potential rockfall areas are the second most important disturbance in the area. Two different categories of landslides were detected: in the category “landslide”, large areas with excavation or deposition of material used for the newly built road are summarized; the category “landslide road” includes landslide events along the road which originate from its construction and recent enlargement. Human settlements and infrastructure are mostly endangered through avalanches followed by debris flows and landslides. Our studies are therefore focused mainly on avalanche activity, giving a secondary importance to debris flows. A detailed report on landslides at the study will be presented supplementary to this document, whereas
rockfain a de
Table
Proce
Mud AvalaDebriAvalaLandsLandsStreetRockf
Figure
alls, given theescriptive wa
4: Listing of
ess Perare
nche s Flow nche slide slide t fall
e 4: Mapped
eir little releay.
percentages
rcentage per ea (defined in
disturbance
evance in ter
s of differen
disturbance n figure 4) [%]
es in the inve
rms of hazar
nt natural dis
in whole ]
0.0024
0.00200.02350.00030.0001
0.0098
estigation ar
rd, are not ad
sturbances a
rea.
ddressed he
at the study
ere other tha
area.
16
an
17
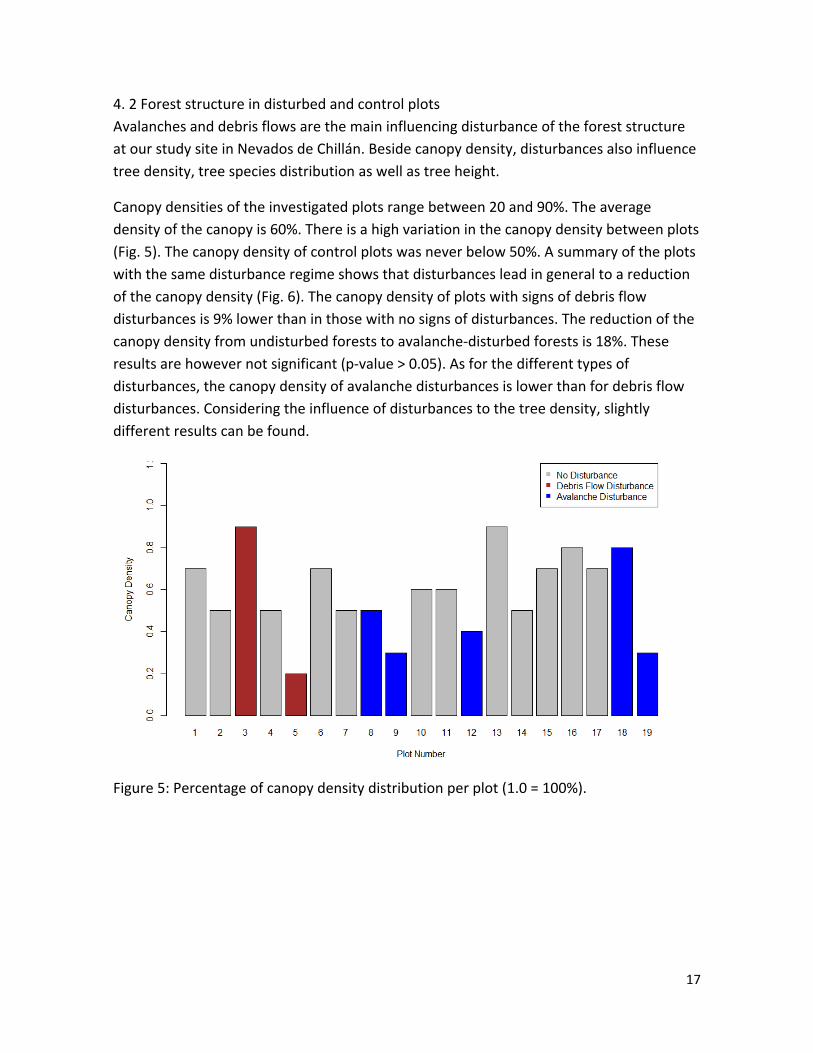
4. 2 Forest structure in disturbed and control plots Avalanches and debris flows are the main influencing disturbance of the forest structure at our study site in Nevados de Chillán. Beside canopy density, disturbances also influence tree density, tree species distribution as well as tree height.
Canopy densities of the investigated plots range between 20 and 90%. The average density of the canopy is 60%. There is a high variation in the canopy density between plots (Fig. 5). The canopy density of control plots was never below 50%. A summary of the plots with the same disturbance regime shows that disturbances lead in general to a reduction of the canopy density (Fig. 6). The canopy density of plots with signs of debris flow disturbances is 9% lower than in those with no signs of disturbances. The reduction of the canopy density from undisturbed forests to avalanche‐disturbed forests is 18%. These results are however not significant (p‐value > 0.05). As for the different types of disturbances, the canopy density of avalanche disturbances is lower than for debris flow disturbances. Considering the influence of disturbances to the tree density, slightly different results can be found.
Figure 5: Percentage of canopy density distribution per plot (1.0 = 100%).

18
Figure 6: Percentage of canopy density distribution grouping plots per disturbance (1.0 = 100%).
The most common tree species in the study areas is Nothofagus obliqua (Fig. 7). In the first three plots, Nothofagus dombeyi is the most frequent species. There are two species which only occur in one plot: Adesmia microphylla is only growing in plot number 2 (3 individuals), whereas in plot number 19 we can only find Nothofagus pumilio.
Figure 7: Tree species distribution per plot (1.0 = 100%).

19
Nothofagus obliqua is the most common species in all disturbance classes (87.3%, 65.5% and 75%; Fig. 8). The highest percentage of Nothofagus dombeyi can be found in debris flow tracks (34.52%). Except for plot 19, only Nothofagus obliqua trees are growing in avalanche tracks. In the shrub layer, only bamboo is considered. In the majority of the plots where no disturbances occur, bamboo is growing (83%). Also in 75% of the avalanche plots, bamboo is the main shrub species. In all debris flow tracks bamboo is not found in the shrub layer.
Figure 8: Tree species distribution grouping plots per disturbance (1.0 = 100%).
The mean height of trees per plot varied between 6 and 20 meters (Fig. 9). Plots number 1 and 3 showed the highest average tree height with 19 and 20 meters, respectively. Tree height in areas where avalanche disturbances occurred is significantly smaller (p‐value=0.04) than for trees in debris flow tracks and forest plots without disturbances (Fig 10). The height of the bamboo shrub layer varied between one and three meters. Between the plots where no disturbances occur and plots with avalanche or debris flow disturbances, no differences in the shrub height are visible.

20
Figure 9: Tree height distribution per plot.
Figure 10: Tree height distribution grouping plots per disturbance.
4. 3 Results of dendrochronological analysis
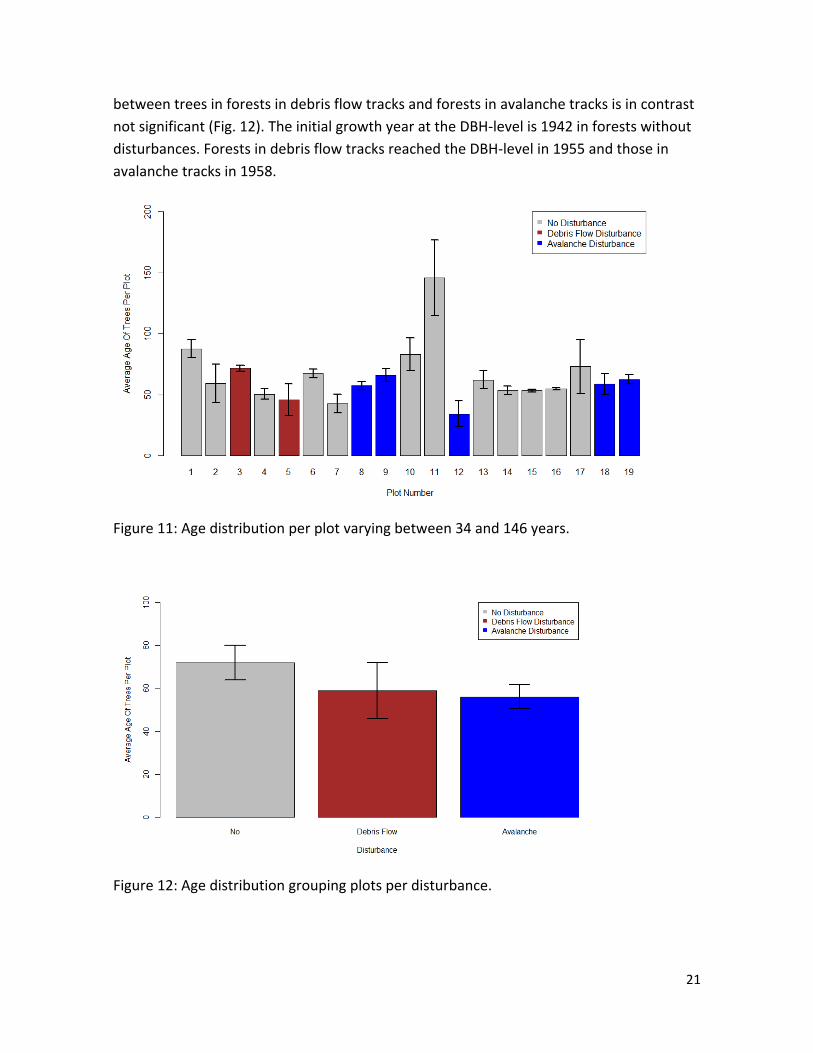
4. 3. 1 Age distribution The age of trees varied between 34 and 146 years (Fig. 11). Only in plot number 11 the average tree age exceeded 100 years. Trees in plot number 11 reached the DBH‐height in the year 1868. Our studies show that, in average, trees in forests without disturbances are older than trees in forest with debris flow and avalanche disturbances. The age difference
21
between trees in forests in debris flow tracks and forests in avalanche tracks is in contrast not significant (Fig. 12). The initial growth year at the DBH‐level is 1942 in forests without disturbances. Forests in debris flow tracks reached the DBH‐level in 1955 and those in avalanche tracks in 1958.
Figure 11: Age distribution per plot varying between 34 and 146 years.
Figure 12: Age distribution grouping plots per disturbance.
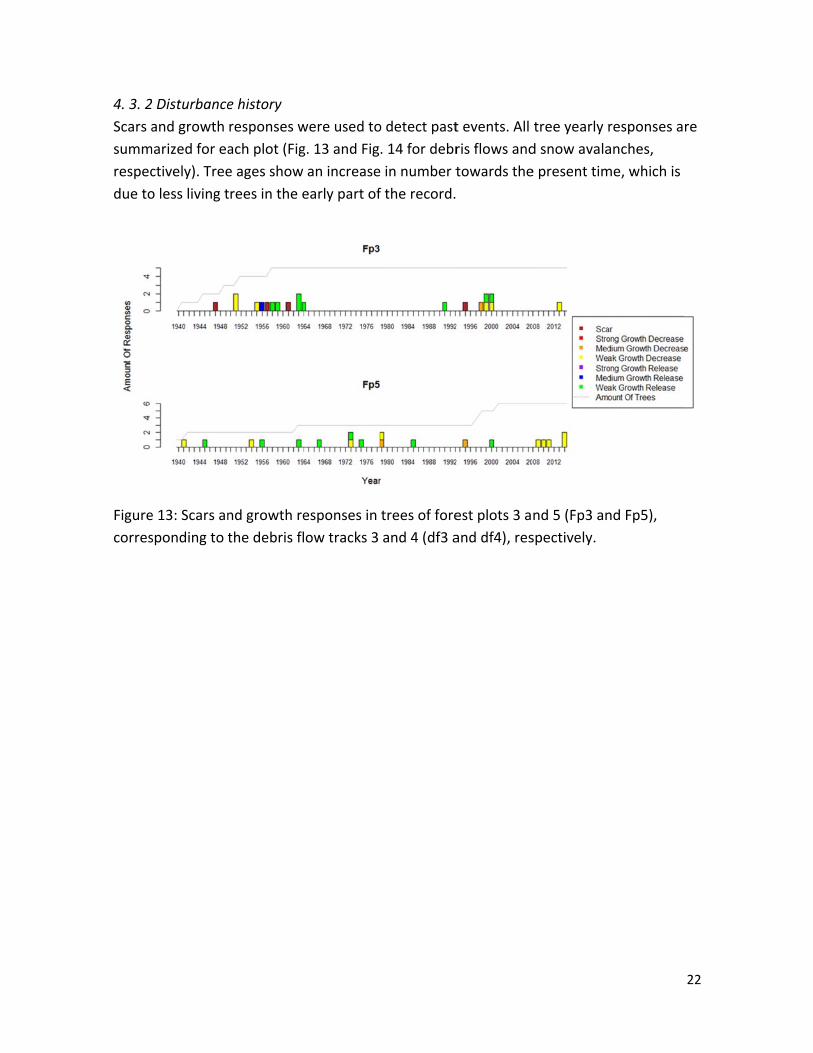
4. 3. 2Scars asummrespecdue to
Figurecorres
Disturbanceand growth
marized for eactively). Treeo less living t
e 13: Scars ansponding to t
e history responses wach plot (Fige ages show trees in the e
nd growth rethe debris fl
were used tog. 13 and Figan increaseearly part of
esponses in ow tracks 3
o detect past. 14 for debr in number tf the record.
trees of foreand 4 (df3 a
t events. All ris flows andtowards the
est plots 3 aand df4), res
tree yearly rd snow avalae present tim
nd 5 (Fp3 anspectively.
responses aanches, me, which is
nd Fp5),
22
re
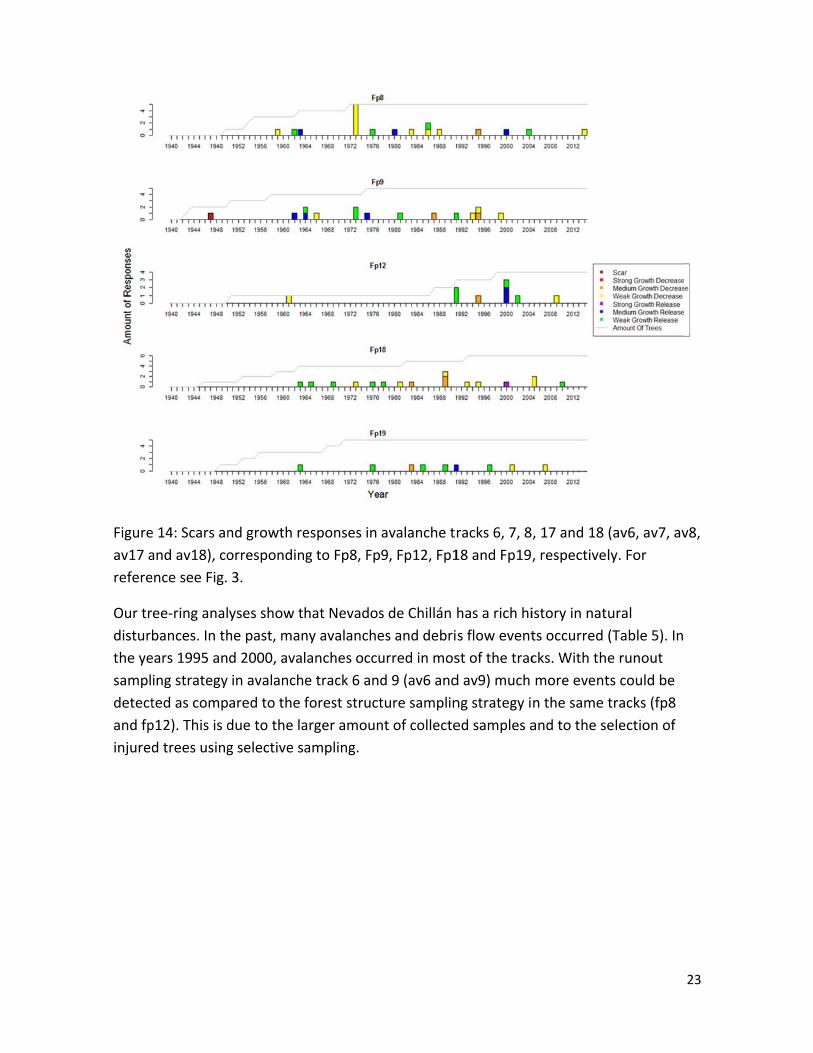
Figureav17 arefere
Our trdisturbthe yesampldetectand fpinjured
e 14: Scars anand av18), coence see Fig.
ee‐ring analbances. In thears 1995 aning strategy ted as compp12). This is dd trees using
nd growth reorrespondin3.
yses show the past, mand 2000, avalin avalanchared to the due to the lag selective s
esponses in g to Fp8, Fp
hat Nevadosny avalanchelanches occue track 6 anforest structarger amounampling.
avalanche t9, Fp12, Fp1
s de Chillán es and debriurred in mosd 9 (av6 andture samplinnt of collecte
racks 6, 7, 818 and Fp19,
has a rich his flow eventst of the tracd av9) much ng strategy ied samples a
, 17 and 18 , respectivel
istory in natuts occurred (cks. With themore eventn the same tand to the se
(av6, av7, avly. For
ural (Table 5). In e runout ts could be tracks (fp8 election of
23
v8,

24
Table 5: List with all detected past events in the investigation area. Fp3 and Fp5 show event years in the debris flow tracks (df3 and df4). Fp8, Av6, Fp9, Fp12, Av9, Fp18 and Fp19 show historic avalanche events in different avalanche tracks (av6, av6, av7, av8, av9, av17 and av18, respectively).
Avalanche/Debris flow years Fp3 Fp5 Fp8 Av6 Fp9 Fp12 Av9 Fp18 Fp19
2014 x 2012 x x 2011 x x 2010 x x 2005 x x 2002 x 2000 x x x x 1995 x x x x x x x 1992 x 1991 x x x 1989 x x x 1986 x x x 1984 x 1983 x x x 1982 x 1980 x 1977 x 1975 x 1974 x 1972 x 1968 x 1964 x 1962 x 1961 x 1957 x 1954 x 1951 x x 1947 x 1945 x 1942 x
In avalanche track 9 (av9), the history of past events is for comparison evaluated using also the indices approach (see point 3. 3 for reference). Historic avalanche years were considered as such with at least three responding trees (Fig. 15 A) and with an Index value

I > 10%were a
Figureet al., threshpercenshows
We caexpert(i.e. 20
A
B
C
% (Fig. 15 B)avalanche ye
e 15: Event‐r2012). Graphold of threentage of resps the reconst
an see that mt approach (002 and 201
. This approaears (Fig. 15
esponse histph A shows te respondingponding treetructed avala
most reconsti.e. 1983, 1910) were only
ach indicateC).
togram fromhe total numg trees. Grapes to an eveanche years
tructed even991, 1995, 20y detected u
es that 1983,
m avalanche mber of growph B displaysnt with a thr using this a
nt years are t000, 2011 anusing the exp
, 1991, 1995
track 9 (av9wth disturbas the index vreshold valupproach.
the same usnd 2012), wpert approac
5, 2000, 2011
9) (adapted fances (GD) wvalue I with tue I of 10%, a
sing the indichereas two ch.
1 and 2012
from Coronawith a the and graph C
ces and event years
25
a

26
4. 3. 3 Runout distances The combination of trees showing growth responses in the same year allowed the reconstruction of event runout distances at avalanche tracks 6 and 9. It was not possible to do this type of analysis for the other avalanche tracks due to the different sampling strategy applied.
For a better overview, the runouts of avalanche track 6 (av6) are subdivided in runouts which cross the road or not (Fig. 16 and 17, respectively; Table 6). The avalanche runouts from 1962, 1975 and 1991 also go to the right side of the track (as seen in the image). Trees below the road show a large amount of past avalanche disturbances. As all these trees stand close together, there is no spatial differentiation possible between the runouts below the road. Our analyses also show that there are three different avalanche runouts located above road (Fig. 17); from these, the avalanche from 2011 shows the shortest runout, i.e. with a shorter distance to the corresponding release zone.

Figure(av6). imagebeforeseen i
e 16: Tree‐rinTree numbe corresponde reaching thn this image
ng reconstruers refer to Tds to the upphe road locae besides the
uction of twoTable 6. For gper portion oted in the upe road.
o avalanche geographicaof the track, pper portion
runouts croal reference:though whin of the imag
ssing the ro: the lower pch avalanchge. The river
ad at track 6part of the es flow r bed is also
27
6

28
Table 6: Tree‐ring reconstruction of avalanche years at the different runouts of avalanche track 6 (av6). Information from each sampled is shown here.
Tree number Avalanche years Tree
number Avalanche years
1 1972, 1982, 1986, 1992, 1995, 2000, 2012 26 1942, 1945, 1954, 1972, 1992
2 1991 27 2012 3 1942, 1992 28 1930, 1945, 1954, 1972, 1992 4 1974, 1984, 1992, 1995 29 1995 5 1977, 1984, 1995 30 2000 6 1975, 1991, 2000 31 1977, 1995, 2000 7 1983, 1995, 2010, 2012 32 1962, 1974, 2000, 2012 8 1974, 1977, 1983, 1995, 2000 33 1974, 1983, 1992, 2000 9 1989, 2000 34 1962, 1975, 1991 10 1930 35 1951, 1962 11 1989 36 1995 12 2005 37 1983 13 1995, 2012 38 2000 14 1995 39 1951, 1984, 2000 15 1992, 2000, 2005 40 1974, 2000 16 1974, 1982, 2005 41 2000 17 1962, 1975 42 1942, 1962 18 1974 43 1980, 2000 19 1945, 1951, 1982, 1986, 1991, 1995 44 1974, 1995, 2000 20 2000 45 1954, 2000
21 1968, 1982, 1986, 1991, 1995, 2000, 2005, 2011 46
1968, 1974, 1980, 1982, 1989, 2000, 2011
22 1968, 1983, 1986, 1991, 1995, 2000, 2011 47 1962, 1974, 1989, 2000
23 2000 48 1989 24 1983, 1991, 1995, 2000 49 1954, 1991, 2011 25 1995, 1986, 2000
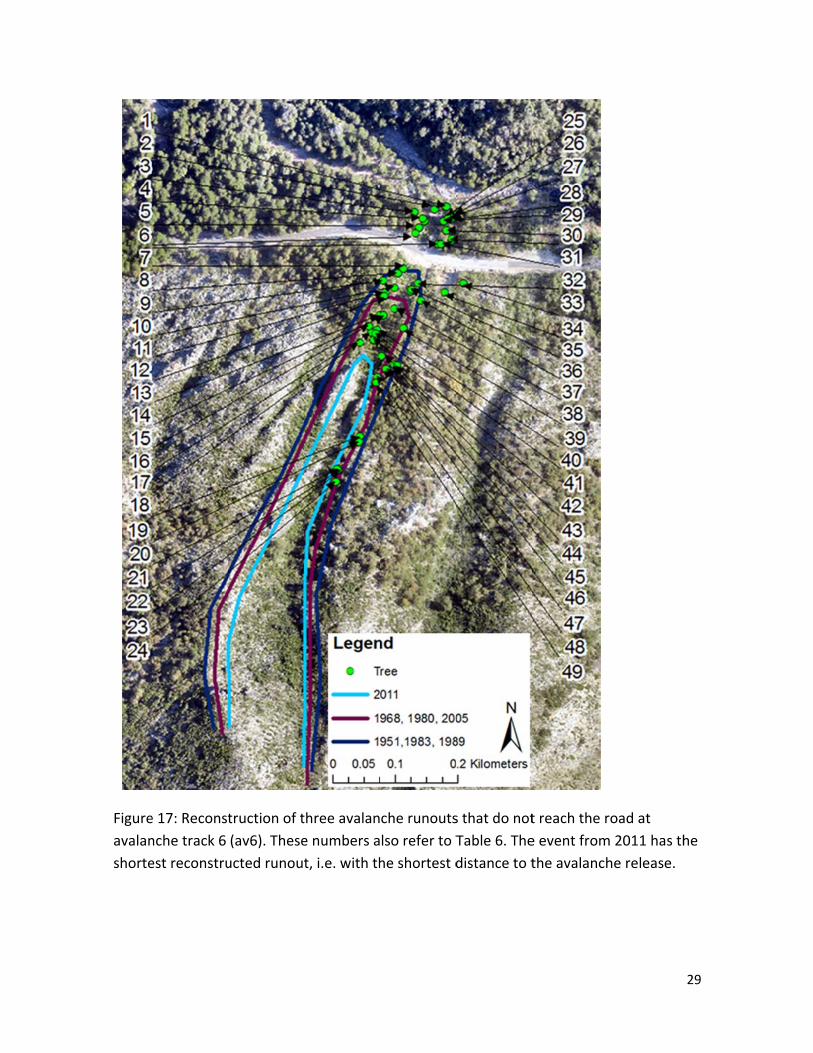
Figureavalanshorte
e 17: Reconstnche track 6 est reconstru
truction of t(av6). Theseucted runout
three avalane numbers at, i.e. with th
che runoutslso refer to The shortest d
s that do notTable 6. Thedistance to t
t reach the re event fromthe avalanch
road at m 2011 has thhe release.
29
he
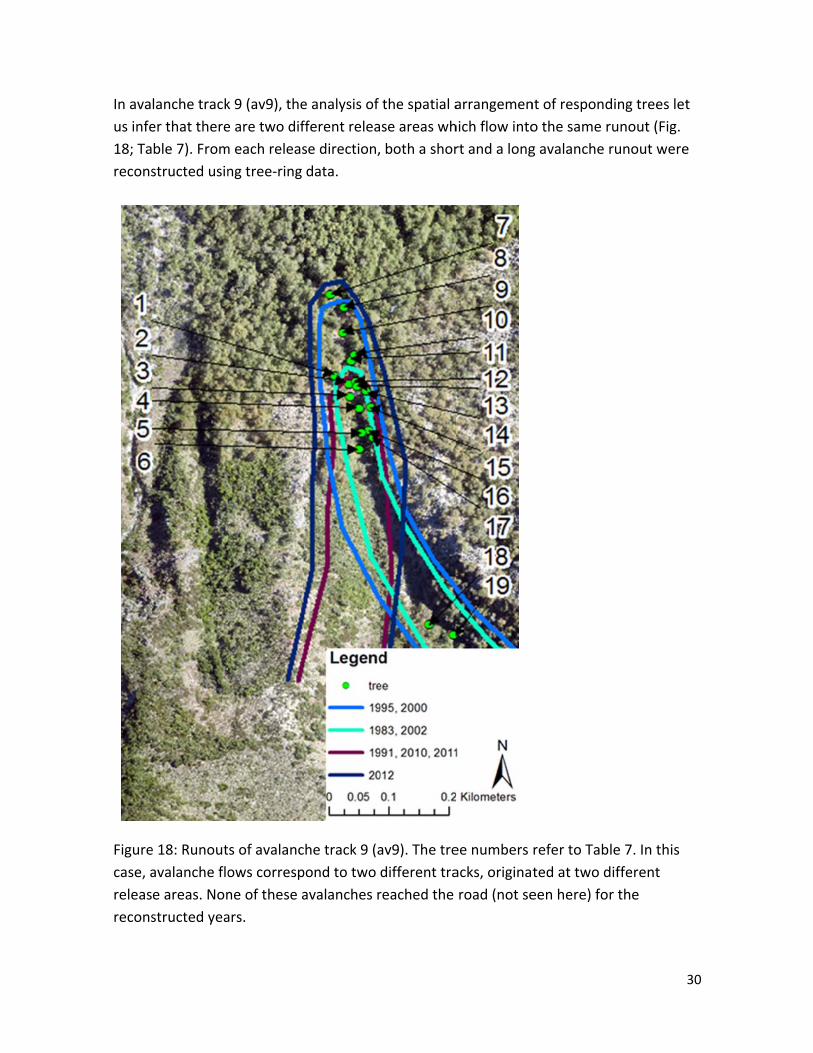
In avaus infe18; Tarecons
Figurecase, areleasrecons
lanche tracker that thereble 7). Fromstructed usin
e 18: Runoutavalanche floe areas. Nonstructed yea
k 9 (av9), thee are two difm each releasng tree‐ring
s of avalancows correspne of these aars.
e analysis of fferent release direction,data.
he track 9 (apond to two avalanches r
the spatial ase areas wh both a shor
av9). The tredifferent trareached the
arrangemenhich flow intort and a long
ee numbers acks, originaroad (not se
nt of respondo the same rg avalanche
refer to Tabted at two deen here) fo
ding trees lerunout (Fig. runout were
le 7. In this different r the
30
t
e
31
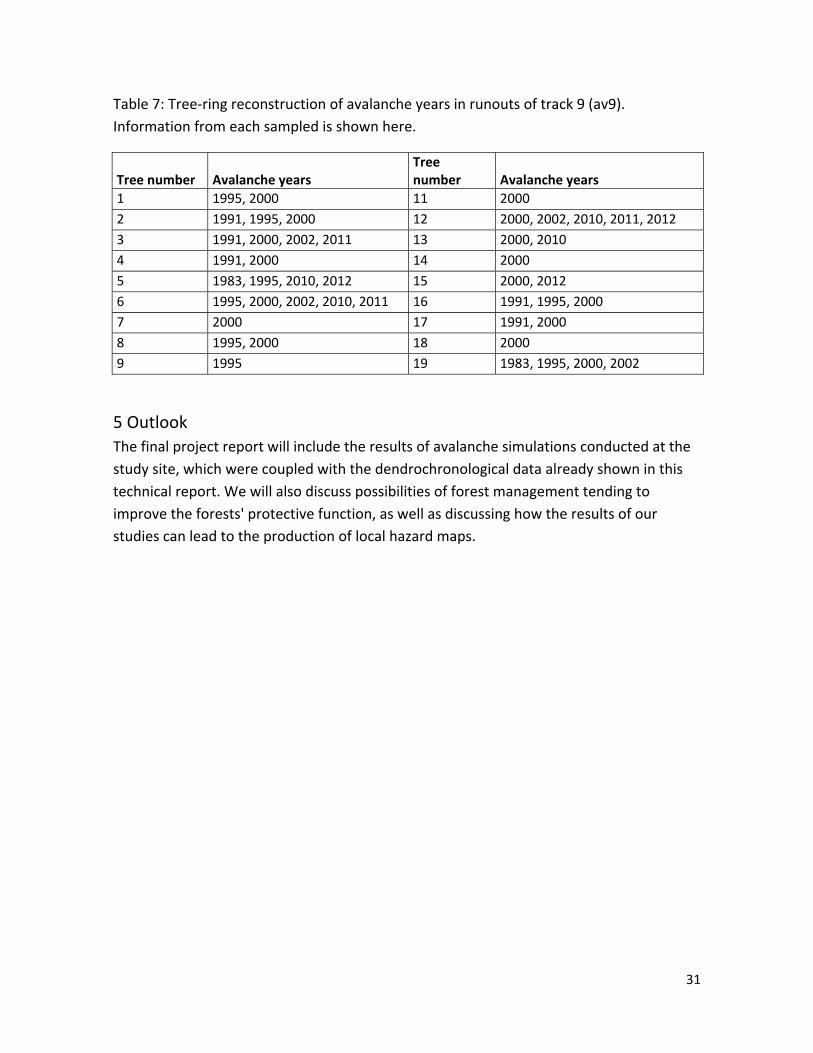
Table 7: Tree‐ring reconstruction of avalanche years in runouts of track 9 (av9). Information from each sampled is shown here.
Tree number Avalanche years Tree number Avalanche years
1 1995, 2000 11 2000 2 1991, 1995, 2000 12 2000, 2002, 2010, 2011, 2012 3 1991, 2000, 2002, 2011 13 2000, 2010 4 1991, 2000 14 2000 5 1983, 1995, 2010, 2012 15 2000, 2012 6 1995, 2000, 2002, 2010, 2011 16 1991, 1995, 2000 7 2000 17 1991, 2000 8 1995, 2000 18 2000 9 1995 19 1983, 1995, 2000, 2002
5 Outlook The final project report will include the results of avalanche simulations conducted at the study site, which were coupled with the dendrochronological data already shown in this technical report. We will also discuss possibilities of forest management tending to improve the forests' protective function, as well as discussing how the results of our studies can lead to the production of local hazard maps.

32
References Alestalo, J. 1971. Dendrochronological interpretation of geomorphic processes. Fennia
105: 1‐139.
Arbellay, E., Stoffel, M. and Bollschweiler, M. 2010. Wood anatomical analysis of Alnus incana and Betula pendula injured by a debris‐flow event. Tree Physiology 30 (10): 1290‐1298.
Bartelt, P. and Stöckli, V. 2001. The influence of tree and branch fracture, overturning and debris entrainment on snow avalanche flow. Annals of Glaciology 32(1): 209‐216.
Bartelt, P., Bühler, Y., Christen, M., Deubelbeiss, Y., Salz, M., Schneider, M. and Schumacher, L. 2013. User Manual v1.5 Avalanche. Davos WSL Institute for Snow and Avalanche Research SLF, 110 pp.
Bebi, P., Kienast, F. and Schönenberger, W. 2001. Assessing structures in mountain forests as a basis for investigating the forests’ dynamics and protective function. Forest Ecology and Management 145 (1): 3‐14.
Bebi, P., Kulakowski, D. and Rixen, C. 2009. Snow avalanche disturbances in forest ecosystems—State of research and implications for management. Forest Ecology and Management 257 (9): 1883‐1892.
Bollschweiler, M. and Stoffel, M. 2010. Tree rings and debris flows: recent developments, future directions. Progress in Physical Geography.
Brang, P., Schönenberger, W., Frehner, M., Schwitter, R., Thormann, J. J. and Wasser, B. 2006. Management of protection forests in the European Alps: an overview. Forest Snow and Landscape Research 80 (1): 23‐44.
Butler, D. and Sawyer, C. 2008. Dendrogeomorphology and high‐magnitude snow avalanches: a review and case study. Natural Hazards and Earth System Science 8 (2): 303‐309.
Casteller, A., Christen, M., Villalba, R., Martinez, H., Stöckli, V., Leiva, J. and Bartelt, P. 2008. Validating numerical simulations of snow avalanches using dendrochronology: the Cerro Ventana event in Northern Patagonia, Argentina. Natural Hazards and Earth System Science 8 (3): 433‐443.
Casteller, A., Villalba, R., Araneo, D. and Stöckli, V. 2011. Reconstructing temporal patterns of snow avalanches at Lago del Desierto, southern Patagonian Andes. Cold Regions Science and Technology 67 (1): 68‐78.
33
Christen, M., Kowalski, J. and Bartelt, P. 2010. RAMMS: Numerical simulation of dense snow avalanches in three‐dimensional terrain. Cold Regions Science and Technology 63 (1): 1‐14.
Colorado Geological Survey. 2015. Access 3.07.2015, http://coloradogeologicalsurvey.org/geologic‐hazards/rockfall/definition/
Cordero, D., Casteller, A., Podvin, K., Buchholz, A. and Jiménez, M.C. 2014. Ecosystems Protecting Infrastructure and Communities (EPIC): Chile Baseline Report, 36 pp.
Corona, C., Sáez, J. L., Stoffel, M., Bonnefoy, M., Richard, D., Astrade, L. and Berger, F. 2012. How much of the real avalanche activity can be captured with tree rings? An evaluation of classic dendrogeomorphic approaches and comparison with historical archives. Cold Regions Science and Technology 74: 31‐42.
Dixon, H. J., Murphy, M. D., Sparks, S. J., Chavez, R., Naranjo, J. A., Dunkley, P. N., Young, S. R., Gilbert, J. S. and Pringle, M. R. 1999. The geology of Nevados de Chillán volcano, Chile. Revista geológica de Chile 26 (2): 227‐253.
Donoso, C. 1993. Bosques templados de Chile y Argentina. Variación, estructura y dinámica. Ecología forestal. Santiago, Editorial Univesritaria.
ESRI (Environmental Systems Research Institute). 2013: ArcGIS 10.2, Redlands, California (1995–2013).
Fantucci, R. and McCord, A. 1995. Reconstruction of landslide dynamic with dendrochronological methods. Dendrochronologia 13, 43–58.
Feistl, T. 2015. Vegetation effects on avalanche dynamics. Dissertation, Technische Universität (TU), München.
Föhn, P. 1993. Lawinen ‐ kurzfristige Gefahrenbeurteilung (Prognose). In: Naturgefahren, Forum für Wissen, WSL, 1993.
Freiberg, H. M. 1984. Entwicklung von Böden und Vegetation an südchilenischen Vulkanen. Biogeographica 19: 211‐222.
Holmes, R. L. COFECHA – Computer‐assisted quality control in tree‐ring dating and measurement, Version 6.06 (1983) Tree Ring Bull 43: 69‐78.
Jakob, M., Hungr, O. and Jakob, D. M. 2005. Debris‐flow hazards and related phenomena. Berlin, Springer, 411‐443.

34
Luebert, F. and Pliscoff, P. 2006. Sinopsis bioclimática y vegetacional de Chile, Editorial Universitaria.
Maggioni, M. and Gruber, U. 2003. The influence of topographic parameters on avalanche release dimension and frequency. Cold Regions Science and Technology 37 (3): 407‐419.
Mundo, I. A., Barrera, M. D. and Roig, F. A. 2007. Testing the utility of Nothofagus pumilio for dating a snow avalanche in Tierra del Fuego, Argentina. Dendrochronologia 25 (1): 19‐28.
Munter, W. 1999. 3x3 Lawinen: Entscheiden in kritischen Situationen. Agentur Pohl and Schellhamer, Garmisch‐Partenkirchen. ISBN 3‐00‐002060‐8.
Olschewski, R., Bebi, P., Teich, M., Hayek, U.W. and Grêt‐Regamey, A. 2012. Avalanche protection by forests—A choice experiment in the Swiss Alps. Forest policy and Economics 17: 19‐24.
Pfanzelt, S., Grau, J. and Rodríguez, R. 2008. A vegetation map of Nevados de Chillán Volcanic Complex, Bío‐Bío Region, Chile. Cartografía de vegetación del Complejo Volcánico Nevados de Chillán, Región del Bío‐Bío, Chile. Gayana Bot 65 (2): 209‐219.
Salm, B. 1982. Lawinenkunde für den Praktiker: eine allgemeinverständliche, auf wissenschaftlicher Basis beruhende Einführung für Tourenfahrer, Tourenleiter, Verantwortliche von Sicherheitsdiensten und allgemein Interessierte. Verlag Schweizer Alpen‐Club.
Shroder, J. F. 1978. Dendrogeomorphological analysis of mass movement on Table Cliffs Plateau, Utah. Quaternary Research 9 (2): 168‐185.
Stoffel, M. and Huggel, C. 2012. Effects of climate change on mass movements in mountain environments. Progress in Physical Geography 36 (3): 421‐439.
Stoffel, M., Butler, D. R. and Corona, C. 2013. Mass movements and tree rings: A guide to dendrogeomorphic field sampling and dating. Geomorphology 200: 106‐120.
Stoffel, M. and Corona, C. 2014. Dendroecological dating of geomorphic disturbance in trees. Tree‐ring research 70 (1): 3‐20.
Teich, M., Bartelt, P., Grêt‐Regamey, A. and Bebi, P. 2012. Snow avalanches in forested terrain: Influence of forest parameters, topography, and avalanche characteristics on runout distance. Arctic, Antarctic, and Alpine Research 44 (4): 509‐519.

35
Tiri, R. 2009. Interaktionen zwischen verschiedenen Baumeigenschaften und Lawinen. Master thesis, unpublished.