Ecosystem Responses to Mountain Pine Beetle & …wwa.colorado.edu/events/workshops/docs/9 Ecosystem...
25
Ecosystem Responses to Mountain Pine Beetle & Management in Colorado Forests Chuck Rhoades, Kelly Elder & Rob Hubbard USFS Rocky Mountain Research Station Fort Collins, CO Western Water Assessment Beetle-Water Workshop Salt Lake City, UT 1 December 2011 (aka: Hydrologic Implications of Beetle-Related Management and Composition of Post- Infestation Forests)
Transcript of Ecosystem Responses to Mountain Pine Beetle & …wwa.colorado.edu/events/workshops/docs/9 Ecosystem...

Ecosystem Responses to Mountain Pine Beetle & Management in Colorado Forests
Chuck Rhoades, Kelly Elder & Rob Hubbard USFS Rocky Mountain Research Station Fort Collins, CO
Western Water Assessment Beetle-Water Workshop Salt Lake City, UT 1 December 2011
(aka: Hydrologic Implications of Beetle-Related Management and Composition of Post-Infestation Forests)

Watershed Change
Responses Regulated by Change in Canopy interception & Snowpack accumulation Water uptake & Soil nutrient use
Complicating Factors Responses may lag, difficult to detect, prolonged Complex spatial & temporal patterns
Timing
Mag
nit
ud
e
Harvest MPB Mortality

Photo: Bill Romme
Yellowstone Area ‘60 & ‘70s About 40-70% of the overstory trees died
Surviving trees increased growth by 2-3 fold for two decades
Romme et al. 1986
Stem Volume
Increment
Previous Outbreak Forest Growth Response

Overstory Mortality in Colorado
Pine losses 80-90% of basal area
Residual live trees 15-35% of stand BA
24 pine-dominated stands Trees >10 cm DBH
Yampa RD, MBR NFBlacktail Project
Bas
al A
rea
(m2
ha-1
)
0
10
20
30
Sulphur RD, AR NFUpper Fraser Project
Bas
al A
rea
(m2
ha-1
)
0
10
20
30
LodgepoleAspen Fir
Spruce
Colorado State ForestCuster/Big Meadows
0
10
20
30
MPB-KilledLodgepole
Parks RD, MBR NFWillow Crk Project
0
10
20
30
LodgepoleAspen Fir
Spruce

Overstory 310 t/ha (126 t/acre) 71% LPP; 17% AS; 7% SF
Understory Trees
445 t/ha (180 t/Ac) 68% LPP; 12% AS; 15% SF
New Recruits
1820 t/ha (736 t/Ac) 54% LPP; 19% AS; 25% SF
*Stocking Levels 370 t/ha (150 t/Ac)
Growing Stock in MPB Forests Residual Live & New Trees
Den
sity
(ste
ms
ha-1
)
0
200
400
600
800
LodgepoleAspen Fir
Spruce
Den
sity
(ste
ms
ha-1
)
0
400
800
1200
1600
Live UnderstoryLive Overstory
New Seedlings
Live UnderstoryLive Overstory

35% of trees grew > 25% faster since the infestation
16% of trees grew faster than ever.
Unrelated to precipitation
Decline in basal area explained 10-20% of response
*Assessed 123 cores in 4 basins
Lodgepole Pine
0
1000
2000
3000
Englemann Spruce
Rin
g W
idth
(µm
)
0
1000
2000
3000
1900 1920 1940 1960 1980 20000
1000
2000
3000Post-Harvest
Release
Post-MPBRelease
Overstory Growth Response

Annual height growth of Fir & Pine has doubled since infestation beneath the dead overstory, but neither has responded in cuts.
Subalpine Fir
Understory Growth

Engelmann Spruce
0
10
20
30
40
Subalpine Fir
2007 Height Growth (cm)0 10 20 30 40
0
10
20
30
40
Lodgepole Pine
2010
Heig
ht G
rowt
h (cm
)
0
10
20
30
40
Reduction in Basal Area (%)0 20 40 60 80 100
Heig
ht In
crem
ent (
cm)
0
10
20
30
40
40% of trees added > 2X more height in ‘10 as in ’07. Proportionally, fir was most likely to double height; spruce was least likely. Loss of basal area explains 13 - 23% of height increment. Pine most sensitive to BA; spruce least sensitive.
Understory Growth

Understory Trees May Reduce Transpiration Loss
100 yrs 10 yrs
Understory tree growth & water use increase after overstory mortality Young trees use more water for a given amount of needles than old trees.

Month
2 4 6 8 10 12
Sta
nd T
rans
pira
tion
(mm
)
0
5
10
15
20
25
30
35
Pre MPBPost MPBPost MPB with Understory Release
2) Water use by understory returns 20% of savings
Pre MPB
Post MPB
How Will MPB Influence Stream Flow? Understory may Change Outcome
Transpiration savings from dead LPP
1) Reduced Annual transpiration by 60%
R. Hubbard, unpublished

Part 2 - Management Implications
CO State Forest Willow Ck, Parks RD Gore Pass, Yampa RD Fraser Expt Forest
Harvest vs. Retain?
Specific harvesting practices

1910
- 191
9
1920
- 192
9
1930
- 193
9
1940
- 194
9
1950
- 195
9
1960
- 196
9
1970
- 197
9
1980
- 198
9
1990
- 199
9
2000
- 200
9
Hec
tare
s
0
1000
2000
3000
4000
Single Tree/Group Selection
Shelterwood/Seed Tree
Clearcut
Management Response to MPB
Arapaho-Roosevelt NF, Colorado Most harvesting since 1970s Greatest extent of clear cutting
However: <50% of infested area is treatable;
of that < 30% will be cut 90% of infested area will be untreated

Post-Harvest Recruitment Are there concerns about seedling colonization after harvest of MPB stands? Since the outbreak, pine recruitment has been at least equal to previous decades > 90% of units meet minimum stocking requirements
(Collins et al. 2010a)
Pre-Outbreak Outbreak
Seed
ling
Rec
ruits
(tre
es h
a-1)
0
5000
10000
15000
(1980s) (2000s)
Compared USFS stocking surveys in pre- and post-outbreak harvest units. n = 30 stands; 3rd yr surveys ; AR NF; Sulphur RD

Species Composition of Recruits
Harvesting stimulates new pine seedlings and aspen sprouts. 5 times more pine, aspen compared to uncut stands Fir recruitment is promoted in uncut stands
*Cut stands meet minimum stocking requirements (i.e., > 150 t/acre) *8 paired sites at Fraser
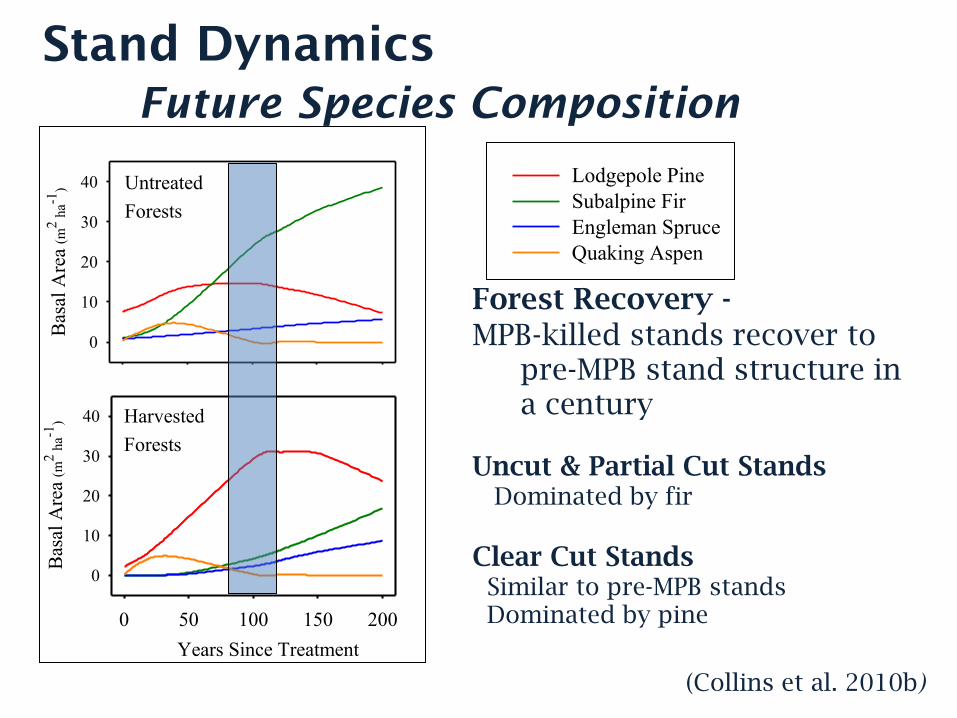
(Collins et al. 2010b)
Years Since Treatment0 50 100 150 200
Bas
al A
rea
(m2 h
a-1)
0
10
20
30
40
Bas
al A
rea
(m2 h
a-1)
0
10
20
30
40
Lodgepole PineSubalpine FirEngleman SpruceQuaking Aspen
UntreatedForests
HarvestedForests
Forest Recovery - MPB-killed stands recover to
pre-MPB stand structure in a century
Uncut & Partial Cut Stands Dominated by fir Clear Cut Stands Similar to pre-MPB stands Dominated by pine
Years Since Treatment0 50 100 150 200
Bas
al A
rea
(m2 h
a-1)
0
10
20
30
40
Bas
al A
rea
(m2 h
a-1)
0
10
20
30
40
Lodgepole PineSubalpine FirEngleman SpruceQuaking Aspen
UntreatedForests
HarvestedForests
(Collins et al. 2010b)
Stand Dynamics Future Species Composition

Harvesting adds ~4X fine fuels (1 + 10 hr) ~3X total surface fuels The increase in surface fuels may result in greater flame lengths (i.e., under extreme weather conditions: 2.3 vs 1.7 m compared to 5m). 1.2 m - halt direct-attack 2.5 m - halt dozers Windthrow will increase the surface load in uncut areas ~1.4x higher than cut areas
1 Hr10 Hr
100 Hr1000 Hr
Total Woody
Post Windthrow
Fuel
Loa
ding
(Mg
ha-1
)
0
20
40
60
80 Uncut Cut
Response to Management Surface Fuels

Recovery of the forest canopy determines fire behavior Risk of crown fire is low and will differ little between treated & uncut stands until crown develops (~20 yrs). More fir in uncut stands = increases canopy BD, crown base height and flame length. Green Stands – Greater risk, intensity of crown fire: *6m total flame length *Crowing Index 55 km/hr (34 mph – moderate risk)
CanopyBulk Density
Bul
k D
ensi
ty (k
g m
-3)
0.00
0.05
0.10
0.15
0.20
0.25
UncutCut
CrowningIndex
Years0 20 40 60 80 100
Win
d S
peed
(km
hr-
1 )
0
30
60
90
120
150
TotalFlame Length
Flam
e Le
ngth
(m)
0
5
10
15
UntreatedHarvested
*
*
*
Response to Management Fire Behavior
(Collins et al. under review)

Previous MPB Outbreak White River NF 1980s
Recovery in uncut stands depends on pre-outbreak composition Lodgepole Stands
62% aspen, 27% fir, 7% lodgepole Mixed Conifer Stands
87% fir, 7% spruce, 3% aspen, 3% lodgepole
Downed Wood 70 Mg/ha in affected stands
Mostly large diameter Highly variable (0.5 to 314Mg/ha)
(Pelz, 2011 MS Thesis)

No Action Untreated Beetle-Killed Stands
Management Alternatives on MPB Acres
Water Delivery Lop and Scatter Slash Retention
Fuel Reduction Whole Tree Harvest
Forest Regeneration Mechanical Scarification Site Prep

Uncut
Lop S
catte
r
Who
le Tr
ee
Scarif
yUnc
ut
Lop S
catte
r
Who
le Tr
ee
Scarif
yUnc
ut
Lop S
catte
r
Who
le Tr
ee
Scarif
y
Gra
vim
etri
c M
oist
ure
(%)
5
10
15
20
25
30
35
40Spring Fall
p < 0.1
Summer
p < 0.05
Soil moisture was highest in slash retention treatment
Scarification
driest cut option
Response to Management Options Soil Moisture

Uncut
Lop S
catte
r
Who
le Tr
ee
Scarif
yUnc
ut
Lop S
catte
r
Who
le Tr
ee
Scarif
yUnc
ut
Lop S
catte
r
Who
le Tr
ee
Scarif
y
Ext
ract
able
N (m
g/kg
)
0
2
4
6
8
10
12Spring FallSummer
p < 0.05NH4+
NO3- p < 0.01
p < 0.05NH4
+p < 0.1NH4
+
Soil N was highest in slash retention treatment
Ammonium (NH4)
35% to 2.5X > uncut 20 - 30% > Whole Tree
Nitrate (NO3) 1.3 to 5.2 fold > uncut
Cut vs Uncut
3 to 6 fold increase *Extractable Soil N (0-15 cm mineral
soil)
Response to Management Options Soil Nitrogen Fertility
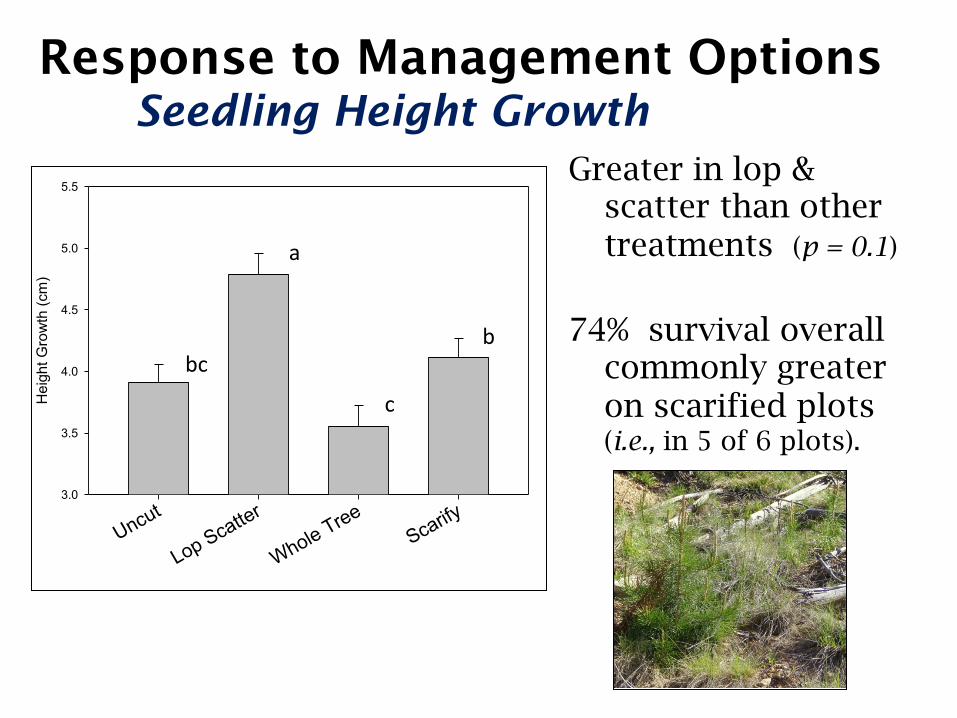
Greater in lop & scatter than other treatments (p = 0.1)
74% survival overall commonly greater on scarified plots (i.e., in 5 of 6 plots).
Uncut
Lop Scatter
Whole TreeScarify
Hei
ght G
row
th (c
m)
3.0
3.5
4.0
4.5
5.0
5.5
a
bc
c
b
Response to Management Options Seedling Height Growth

Seedling Occurrence Whole Tree 58% of plots
Scarification 50%
Lop and Scatter 33%
Uncut 42%
Harvested areas were dominated by pine seedlings and aspen sprouts (i.e., 80-100% of recruits)
Uncut stands were dominated by fir and spruce
Seedling density: 9 – 18 k seedlings/ha Adequately stocked units require 370 trees/ha
Response to Management Options Seedling Establishment

Take Home Messages
1. Tree regeneration is abundant in beetle-infested stands 2. Growth of residual overstory & understory trees are responding to loss of lodgepole 3. Harvesting leads to development of different stand types - with likely implications on future fire potential and effects 4. Slash Retention (Lop and Scatter) has positive effect on soil resources and seedling growth; Reduced colonization of new seedlings

Passive Crown Fire
Active/Conditional Crown Fire
Active/Conditional Crown Fire
Passive Crown Fire
Harvested
Years0 20 40 60 80 100
Fire
Typ
eUntreated
0 20 40 60 80 100
Fire
Typ
e
Surface Fire
Surface Fire
Percentile Weather
Years
Can
opy
Bul
k D
ensi
ty (k
g m
-3)
0.00
0.05
0.10
0.15
0.20
Can
opy
Bul
k D
ensi
ty (k
g m
-3)
0.00
0.05
0.10
0.15
0.20
CBD
97th90th80th50th