Ecosystem monitoring inside and outside proposed Sanctuary ...
36
Encounter baseline survey TAFI Internal Report Page 1 Ecosystem monitoring inside and outside proposed Sanctuary Zones within the Encounter Marine Park - 2005 baseline surveys Graham Edgar, Neville Barrett, James Brook, Bryan McDonald and Ali Bloomfield Tasmanian Aquaculture and Fisheries Institute
Transcript of Ecosystem monitoring inside and outside proposed Sanctuary ...

Encounter baseline survey
TAFI Internal Report Page 1
Ecosystem monitoring inside and outside proposed Sanctuary Zones within the Encounter Marine Park
- 2005 baseline surveys
Graham Edgar, Neville Barrett, James Brook, Bryan McDonald and Ali Bloomfield
Tasmanian Aquaculture and Fisheries Institute

Encounter baseline survey
TAFI Internal Report Page 2
Summary
Densities of fishes, macroinvertebrates and plants on subtidal rocky reefs within the Encounter Marine Park (EMP) were surveyed at 32 sites in March 2005. At the time of survey, a draft zoning plan for the EMP had just been released for consultation. Data obtained during 2005 thus represents baseline conditions, although the zones in which the surveyed sites are situated may change following public consultation. Any such change in boundaries is expected to be relatively minor, with little effect on the overall distribution of sites inside and outside Sanctuary zones.
Monitoring surveys utilised the same underwater visual census techniques as used in monitoring programmes operating concurrently in Tasmania, New South Wales, Victoria and Western Australia, as well as previously in South Australia (Investigator Strait in 2004), forming part of a continental-scale study of the effectiveness of marine protected areas (MPAs).
Because a wide range of species have been examined, ecosystem shifts as well as changes in the abundance of targeted fishery species will be detectable following the protection of areas from fishing. The selection of 16 sites within each management zone type provides sufficient replication to detect biologically meaningful change for common species and species richness indicators.
Once fishing restrictions pertaining to different management zones are adequately enforced, surveys should be repeated on an annual basis until differences between zones stabilise. Such a monitoring scheme would not only provide time-series information on trends in the abundance of species of interest in different zones, but also information on indirect impacts of rock lobster, abalone fishing and general recreational and commercial fishing on ecosystems; and regional change associated with such factors as climate change. If insufficient funding is available for annual monitoring, then we recommend that surveys be undertaken every two years.

Encounter baseline survey
TAFI Internal Report Page 3
1. Introduction
Partly as a consequence of widespread losses in inshore biodiversity and declining confidence with traditional single-species approaches to fisheries management, a growing number of fully protected or “no-take” marine protected areas (MPAs) are being proclaimed worldwide (Roberts and Hawkins, 2000). In Australia, a core component of marine conservation planning during the past decade has been the development of a national representative system of marine protected areas (ANZECC, 1999). The ecology and taxonomy of marine species are poorly known compared to terrestrial species, hence single species management is arguably more difficult and habitat protection more desirable when dealing with communities in the marine realm (Fairweather and McNeill, 1993; Roberts and Polunin, 1993; Sobel 1993).
MPAs are also increasingly proposed for fishery enhancement, fishery insurance and fishery research purposes (Davis, 1981; Roberts and Polunin, 1991; Dugan and Davis, 1993). Most government agencies now recognise that ecologically-sustainable development requires management of ecosystems as well as individual species, because the removal of a resource will have flow-on effects on other species (Zann, 1995; Jennings and Kaiser, 1998).
Concurrent with the implementation of the national representative system of MPAs comes the need for effective monitoring programs to assess the ability of MPAs to achieve management aims. While the current focus of MPA planning and implementation is the conservation of biodiversity, MPA’s potentially provide a wide range of important functions. These include acting as baseline reference areas for assessing the success of current conservation and fisheries management strategies in coastal ecosystems, and assisting fisheries management through protection of spawner biomass, conservation of critical habitats, and acting as research areas, including for studies not possible elsewhere. Only by empirically investigating changes that occur in MPAs following protection can we assess the true value of MPAs.
In order to properly determine whether changes observed within MPAs are the result of protection rather than natural variation in space and time, scientifically-credible baseline surveys within and adjacent to proposed MPAs are needed prior to protection from fishing, with subsequent surveys at biologically meaningful time intervals. Ideally, baseline surveys should be conducted over several years to assess the scale of inter-annual variability before the MPA is declared.
In the present report, we describe results of surveys in the proposed Encounter Marine Park (EMP) in March 2005. These surveys describe baseline conditions in the EMP. A draft zoning plan for the EMP was released for a three month consultation period at the time that the surveys were performed, but the final boundaries of the internal zones have yet to be finalised prior to legal gazettal.
The EMP surveys comprise one component of a larger investigation of effects of protection from fishing in temperate Australian MPAs. The larger project, coordinated by the Tasmanian Aquaculture and Fisheries Institute, has so far involved baseline and MPA

Encounter baseline survey
TAFI Internal Report Page 4
surveys in Jervis Bay (NSW), Wilsons Promontory (Vic), Port Phillip Heads (Vic), Investigator Strait (SA), Jurien Bay (WA), Maria Island (Tas), Tinderbox (Tas), Kent Group (Tas), Port Davey (Tas), Bicheno (Tas) and Ninepin Point (Tas). All surveys have involved fished reference sites and utilised similar methodology, allowing direct comparison of results between differing locations, designs and management strategies. This information will be pivotal for planning to ensure MPAs fulfil their desired roles effectively.
The area of the EMP and surrounding waters surveyed extends from Granite Island in Encounter Bay around the Fleurieu Peninsula to a point just south of Myponga, as well as the eastern coast of Kangaroo Island. Approximately half of the 32 sites are located within five of the 16 proposed highly protected Sanctuary Zones in which fishing is prohibited. The remainder of sites lie within Habitat Protection Zones, Special Purpose Area Zones or outside the EMP, where recreational fishing, and most or all forms of commercial fishing, are allowed.
Underwater visual censuses of fish, large mobile invertebrates and macroalgae were undertaken at these sites. The survey methodology covers these major groups to provide as much quantitative information on as many species as possible in the limited dive time available. This methodology is aimed at not only detecting changes in heavily exploited species, but also any cascading ecosystem effects of fishing on other ecosystem components, as well as patterns of long-term regional change.
2. Methods
2.1 Sites
Five categories of management zone provide different levels of protection in the EMP (DEH 2005):
Restricted Access Zones
Objective: To provide protection and conservation for unique and biologically significant habitats within a marine park, by restricting access.
Sanctuary Zones
Objective: To provide protection and conservation for habitats and biodiversity within a marine park, where the removal or harm of plants, animals or marine products is prohibited.
Habitat Protection Zones
Objective: To provide protection for species and habitats within a marine park, whilst allowing activities and uses that do not harm habitats or the functioning of ecosystems.
General Managed Use
Objective: To provide protection for species and habitats within a marine park, whilst allowing ecologically sustainable use.
Special Purpose Areas
Objective: To provide for specific activities or uses within a marine park.

Encounter baseline survey
TAFI Internal Report Page 5
For the purpose of this study, two different categories were used to partition the sampling regime:
Inside: areas within Sanctuary Zones or Restricted Access Zones. Fishing will be prohibited within these areas
Outside: areas within the other three zone types or outside the EMP. Recreational and most or all forms of commercial fishing will be allowed within these areas.
A total of 28 locations were investigated during an 11 day period from 8th to 18th March 2005 (Fig. 1, Table 1). Four locations were surveyed at two depths, which are here considered separate ‘sites’ because differences between biotic communities at the two depths within a site were generally of comparable magnitude or greater than differences between locations sampled at the same depth. Sites examined were in three general regions within the EMP:
• moderately sheltered reefs at 5 m depth within Gulf St Vincent (GSV)
• moderately sheltered reefs at 5 m and 10 m depth on the north coast of Kangaroo Island (KI)
• reefs exposed to oceanic swell at 5 m and 10 m depth on the south coast of Fleurieu Peninsula, in and near Encounter Bay (EB)
Sites were selected to provide a balance between the Inside and Outside area categories defined above as determined from the draft zoning plan released at the beginning of the study. Site locations were chosen with the constraint that they needed to contain reef habitat of sufficient size for placement of a 200 m length transect. Sixteen sites were surveyed in each of the Inside and Outside area categories.

Encounter baseline survey
TAFI Internal Report Page 6
Fig. 1. (a) Encounter MP monitoring area.

Encounter baseline survey
TAFI Internal Report Page 7
Fig. 1. (b) Location of sites surveyed within the Encounter MP.

Encounter baseline survey
TAFI Internal Report Page 8
Table 1. Site details for locations surveyed in Encounter, with underwater visibility at time of survey.
Site No Location Name Depth
(m) Latitude Longitude DEH Zone Reg-ion Category Date Vis
(m) 1 Carrickalinga Toilet 4-5m 35.42445 138.31901 Habitat GSV Outside 8/03/2005 7 2 Haycock Point 5m 35.41574 138.3279 Sanctuary GSV Inside 8/03/2005 3 Carrickalinga Head 5m 35.398 138.33591 Sanctuary GSV Inside 8/03/2005 4 Rapid Head Cliffs 5m Sanctuary GSV Inside 9/03/2005 10
5 Rapid Head South 5m 35.53145 138.1519 Sanctuary GSV Inside 9/03/2005 10 6 Sunset Cove South 5m 35.50467 138.22924 Habitat GSV Outside 9/03/2005 12 7 Myponga South 5m 35.38821 138.34923 Out of Park GSV Outside 11/03/2005 8 8 Myponga Point 5m 35.37988 138.36068 Out of Park GSV Outside 11/03/2005 10 9 Dodd's Beach 5m 35.40416 138.33043 Sanctuary GSV Inside 11/03/2005 10
10 Seal Is 5m 35.57618 138.64429 Habitat EB Outside 12/03/2005 5 11 Outside Granite Island 5m 35.56754 138.63158 Habitat EB Outside 12/03/2005 6 12 West Island Outer 10m 35.61029 138.59289 Sanctuary EB Inside 12/03/2005 5 13 Kings Head 5m 35.60551 138.58308 Sanctuary EB Inside 12/03/2005 6 14 Newland Head 5m 35.64094 138.52662 Sanctuary EB Inside 13/03/2005 7 15 Flat Irons 5-7m 35.61781 138.55721 Habitat EB Outside 13/03/2005 8 16 Kings Head North 5m 35.60676 138.57594 Sanctuary EB Inside 13/03/2005 7 17 The Bluff 5m 35.58996 138.60645 Habitat EB Outside 13/03/2005 6 18 Morgans 5m 35.58845 138.10838 Habitat GSV Outside 14/03/2005 9 19 Hoggs Point 10m,
5m 35.71974 137.96448 Special KI Outside 14/03/2005 9
20 Snapper North 10m, 5m
35.74983 138.05538 Sanctuary KI Inside 15/03/2005 8
21 Cable Hut 10m, 5m
35.73268 138.0191 Sanctuary KI Inside 15/03/2005 7
22 Kangaroo Point 10m, 5m
35.71667 137.9071 Habitat KI Outside 16/03/2005 8
23 Penneshaw East 10m 35.72509 138.00006 Habitat KI Outside 16/03/2005 6 24 Ripple Rock 5m 35.38386 138.3559 Out of Park GSV Outside 17/03/2005 12 25 Cock-up Rocks 5m Sanctuary GSV Inside 17/03/2005 10
26 Second Valley 5m 35.50594 138.21446 Habitat GSV Outside 17/03/2005 12 27 Rapid Head North 5m 35.51922 138.17416 Sanctuary GSV Inside 18/03/2005 14 28 Rapid Head Windmill 5m 35.53085 138.15289 Sanctuary GSV Inside 18/03/2005 12

Encounter baseline survey
TAFI Internal Report Page 9
2.2 Reef monitoring protocol and its rationale
The creation of a mosaic of management zones in the seascape through the declaration of marine protected areas (MPAs) represents an ecological human exclusion experiment at a vast spatial scale (Walters & Holling 1990). The EMP monitoring method described below was developed to capitalise on this experiment (Edgar & Barrett 1999). It involves underwater visual census of densities of fishes, invertebrates and plants along 200 m transects at replicate sites to quantify biological changes in different management zones.
We consider that visual census techniques provide the most effective technique for monitoring species at shallow-water sites in MPAs because they are non-destructive and permit the collection of large amounts of data on a broad range of species within a short dive period. MPA monitoring programs need to cover a range of taxa because, in addition to heavily-exploited species that are predicted to recover in new MPAs, significant secondary effects of fishing may occur that would otherwise go undetected.
Sites investigated are fixed between surveys, with sampling repeated in the same month in different years to minimise seasonal effects. The 200 m transect distance is subdivided into four contiguous 50 m long blocks, each of which is 10 m wide in censuses for mobile fishes, 1 m wide for censuses of mobile macro-invertebrates and cryptic fishes, and comprised five positions set at 10 m intervals for plants and sessile invertebrates.
This ‘extended-transect’ sampling design was selected to maximise the amount of information gathered at each site by three divers, each with a single tank of air. Three sites can be surveyed per day, weather conditions permitting. Pilot trials indicated that if divers reduced the amount of information collected per site, for example by surveying two rather than four 100 m long blocks, then site coverage would not have increased greatly because of the lengthy time required to move between sites (pull anchor, gear up for diving, set transect lines). Collection of additional information at each site would require either more dive personnel or reduced site coverage.
The overriding consideration when planning the monitoring design was that temporal change in protected zones provided the primary focus of study. Consequently, spatial variation at the site level that interferes within the detection of the temporal signal was minimised as much as possible. This was done by censusing fixed sites through time, surveying species along set depth contours, sampling in the same season in different years, and aggregating data over a long distance (200 m) per site to smooth fine scale variation.
The collection of data from four 50 m long blocks is best viewed as an approach to increase the precision of estimates of mean values for a 50 m block at a site. Information on spatial substructure within sites – in the form of data from the four contiguous 50 m-long transects – was not obtained to assess variance within sites. Rather the 200 m transect was subdivided into four blocks because:
1. Data are more easily compared with results of other investigators, who often use transect lengths of 50 m.

Encounter baseline survey
TAFI Internal Report Page 10
2. Different divers can collect information in different 50 m sections of the 200 m length, allowing equitable distribution of dive time regardless of number of divers, and permitting analysis of between-diver effects.
3. If greater precision at a site is required, for example if rock lobster numbers are highly spatially-variable but are of great interest, then extra 50-m blocks can be added. Similarly, the number of 50-m blocks can be reduced if dive time is limited, such as when surveying deep sites. In both cases, data at the 50-m block scale remain directly comparable with data for other sites.
4. Site data can be partitioned to allow inter-site comparisons of particular habitat types. For example, if a sea urchin barren extends for the first 70 m of a transect followed by 130 m of Sargassum, then the first 50 m block provides data on species assemblages in sea urchin barrens, the second 50 m block data on ecotonal zones, and the third and fourth blocks data on fucoid algal habitats. Differences in effects of MPA protection in urchin barrens versus algal habitat can be assessed using these data.
The extended-transect design represents a compromise between power and generality, lying intermediate along the spectrum from more general site studies that involve random replicate transects at each site, and more powerful studies with a single fixed-transect permanently attached to the seabed.
The extended-transect design is considerably more powerful than a random-transect design, but with less generality in associated statistical tests. Although an understanding of within-site variation can be critical for studies with other aims, individual sites had no intrinsic importance in this MPA study. Our interest was focused on within- and between-zone effects, with sites providing replicate information for analyses. Advantages of random-transect methods over our method are: (i) sites encompass a greater total area of seabed because a range of depths are surveyed at each site rather than a single depth contour, increasing generality, and (ii) information is gathered on spatial variance within sites. However, for a study of MPA effects, we considered that these advantages were outweighed by disadvantages. These include: (i) spatial noise associated with randomised placement of transects that obscures the fundamental temporal signal, (ii) lost diving time during periods when divers move to the start of different replicate transects, resulting in reduced data collection per site, (iii) difficulties in truly randomising transect placement, and spatial biases associated with haphazard placement, and (iv) confounding with depth as a consequence of some sites being relatively flat with little depth range, and others being steeply-sloping and encompassing a large depth range. Depth is better included as an explicit variable within analyses rather than contributing to spatial noise between replicates.
A design involving transects that are permanently attached to the seabed would be more powerful at detecting temporal effects than our design, but at some minor cost in generality and at considerable extra cost in dive time. The cost in generality for a physically-fixed transect design relates to the fact that our transects were relocated on each sampling event within a band that extended ca. 1 m in depth (due in large part to different tidal heights at the time of each survey) and ca. 20 m in horizontal extent (due to imprecision in site relocation). Thus, some spatial ‘noise’ is added to the temporal ‘signal’

Encounter baseline survey
TAFI Internal Report Page 11
in our design, reducing power but also reducing the possibility that overall conclusions are affected by anomalous siting of a transect.
The major reasons for not utilising a physically-fixed transect were twofold. Firstly, we recognised aesthetic values associated with diving in MPAs, and considered that 200 m long ropes or chains permanently attached to the seabed in sanctuary zones, or permanent star picket markers, would represent a visual intrusion to recreational divers. The presence of a permanent transect line, including wave-induced movement that abrades plants, could also potentially affect the habitat and thus the ecosystem components censused along the transect.
Secondly, despite the theoretical increase in power to detect temporal signal for physically-fixed transect designs, power is adversely affected in a practical sense by reduced replication. Considerable dive time is required initially to set up permanent transect lines and seabed markers. If transect lines are left attached between surveys, then they need maintenance, perhaps with replacement after two or three years. If lines are strung on each survey between permanent markers such as star pickets, then dive time is reduced by the extra time required to set the line after locating markers, some of which may disappear between annual surveys.
2.3 Census methodology
At each reef site the abundance and size structure of large fishes, the abundance of cryptic fishes and benthic invertebrates, and the percent cover of macroalgae, corals and other cover-forming invertebrates, were each censused separately along four 50 m long transects (Edgar & Barrett, 1999; Barrett & Buxton, 2002). The transect lines were laid end to end along a fixed depth contour.
For fish transects, the density and estimated size-class of fish within 5 m of each side of the line were recorded on waterproof paper, with the diver swimming up the offshore side of the line and then back along the inshore side while at the centre of a 5 m wide lane. Size-classes of total fish length used in the study were 25, 50, 75, 100, 125, 150, 200, 250, 300, 350, 375, 400, 500, 625, 750, 875 and 1000+ mm. Lengths of fish >1 m length were individually estimated.
Double counting of individual fish sometimes occurred when the diver returned along the inshore side of the transect line. Nevertheless, such double counts have little importance if the inshore and offshore 50 m x 5 m blocks are considered as two separate (albeit non-independent) estimates for the 50 m transect length. The reason that fish were counted on the return leg regardless of whether they were recognised as having been counted on the initial leg was that if this had not been done then return counts would be lower than initial counts, and mean total density estimates not comparable with 50 m x 5 m density estimates of workers elsewhere. Return counts were undertaken to allow greater precision of site estimates with little extra underwater time – transect lines already having been set.
Fish census data clearly are affected by a range of biases, including observer error and variation in behavioural responses of fish to divers (DeMartini & Roberts 1982; Thompson & Mapstone 1997; Kulbicki & Sarramega 1999). Such biases were investigated in part and discussed for the transect methods used here by Edgar et al.

Encounter baseline survey
TAFI Internal Report Page 12
(2004a). Despite the existence of census biases, we consider them to be largely systematic and not greatly confound interpretation of patterns because data will be used for relative comparisons between different management zones only. Care was taken to ensure that sampling effort for each diver was equitably distributed between the different management zone types.
Cryptic fishes and megafaunal invertebrates (large molluscs, echinoderms and crustaceans) were counted along the transect lines used for the fish survey by recording animals within 1 m of one side of the line (a total of four 1 m x 50 m transects). During transects, measurements were taken using vernier callipers of the maximum shell diameter of all abalone encountered and the carapace length of all rock lobsters that could be captured by hand.
The area covered by different macroalgal, coral, sponge and other attached invertebrate species was quantified by placing a 0.25 m2 quadrat at 10 m intervals along the transect line and assessing the percent cover of the various plant species. Cover was determined by counting the number of times each species occurred directly under the 50 positions on the quadrat at which perpendicularly placed wires crossed each other (a total of 1.25 m2 for each of the 50 m sections of transect line).
The position of each site was recorded using a hand held GPS (Scoutmaster) based on the WGS84 Datum System, with position recorded in degrees and decimal minutes. Site positions and site details are listed in Table 1. All data were entered onto an Excel spreadsheet and checked for errors.
2.4 Statistical analyses
The monitoring design can be considered as a replicated Before-After-Control-Impact (BACI) design (Green 1979) that can be analysed using repeated-measures ANOVA, with management zone (and in future studies, the year) as a fixed factor. Ideally, such a design is balanced with the same number of sites inside and outside each of the different management zones investigated (Underwood 2000). Nevertheless, much information on variation within and between zones is lost with an ANOVA approach because sites in all zones of the same type are considered equal. Variation between sites in biological response to protection from fishing (resulting from factors such as distance from the reserve boundary, or level of pre-existing fishing pressure) possesses intrinsic interest and should be recognised, rather than adding to noise between replicates. An additional disadvantage of ANOVA designs for long-term monitoring programs is that time components need to be blocked in some way.
We suggest that ANOVA is most useful as a statistical tool in the early stages of monitoring programs when little time series data are available post MPA declaration. ANOVA also provides the only practical method for assessing power in pilot studies, other than in the rare situation where the response variate to be examined can be predictively modelled.
Data are analysed here using one-way ANOVA to assess whether sites investigated within sanctuary zones are significantly different to sites outside before protection from fishing. Given that larger differences were generally found between biological assemblages at 5 m

Encounter baseline survey
TAFI Internal Report Page 13
and 10 m depth within a site compared to differences between nearby sites at the same depth, we considered the 5 m and 10 m transects to be independent; hence 32 ‘sites’ are incorporated into ANOVAs.
Once several years of post MPA declaration data are available, curvilinear modelling techniques should comprise the most useful of available methods for investigating MPAs. Using non-linear regression, for example, one can quantify relationships between biological response to protection and variables such as time since MPA declaration, management zone size, distance from MPA boundary, reef habitat complexity, and fishing pressure prior to declaration of the MPA. Effect size is readily estimated as the difference between the value of a variable at any point in time and the mean of baseline values for that variable at the same site prior to MPA declaration.
Relative differences between the plant and animal communities at different sites were here examined graphically using non-metric multidimensional scaling (MDS). Data input to matrices for multivariate analyses were square root transformed to reduce the influence of the most abundant species, and converted to a symmetric matrix of biotic similarity between pairs of sites using the Bray-Curtis similarity index, which is relatively insensitive to data sets with many zero values. The usefulness of the two dimensional MDS display of biotic relationships is indicated by the stress statistic, which signifies a good depiction of relationships when <0.1 and poor depiction when >0.2 (Clarke, 1993).

Encounter baseline survey
TAFI Internal Report Page 14
3. Results and discussion
3.1 Biotic similarities between sites
Given that the primary aim of the monitoring program is to identify differences in fished areas versus protected areas, the range of floral and faunal communities in sanctuary areas ideally should encompass the range of communities at the fished sites investigated. If not then trends through time may be confounded because the different community types in fished and unfished zones may track different environmental factors, and hence diverge into the future for reasons unrelated to effects of fishing.
Overall biotic community differences between sites for fishes are depicted using MDS in Fig. 2, while densities of each fish species at different sites are listed in Appendix 1. Sites with high levels of biotic similarity lie adjacent to each other in Fig. 2, while sites with few similarities are positioned at distance.
Fig. 2. Results of MDS showing relationships between sites for fish assemblages in 2005. Sites are coded by numbers listed in Table 1 and the depth. In the figure, the filled circles represent the “outside” control sites, and the squares represent sites “inside” Sanctuary Zones. The stress statistic is 0.12, indicating a good depiction of relationships between sites. The dashed lines partition the sites into the three general regions surveyed, apart from the 10 m survey at site 22, from Kangaroo Island (circled).
Gulf St Vincent
Encounter Bay
Kangaroo Island

Encounter baseline survey
TAFI Internal Report Page 15
Patterns of biotic similarity between sites for invertebrates and plant and sessile animals were generally comparable to those for fishes (Figs 3 and 4). In general, “inside” and “outside” sites are well interspersed within these plots, indicating that sites monitored within sanctuary zones have similar biotic assemblages to external reference sites before MPA protection. Assemblages surveyed at Kings Head, a site with very little relief (sites 13 and 16), and the deep site at Kangaroo Head (site 22), which lay along the reef margin, were the most anomalous.
Fig. 3. Results of MDS showing relationships between sites for invertebrate assemblages in 2005. The stress statistic is 0.15. Sites are coded by numbers listed in Table 1 and the depth. In the figure, the filled circles represent “outside” control sites, and the squares represent sites “inside” Sanctuary Zones. The dashed lines partition the sites into the three general regions surveyed.
Gulf St Vincent
Encounter Bay
Kangaroo Island

Encounter baseline survey
TAFI Internal Report Page 16
Fig. 4. Results of MDS showing relationships between sites for plant and sessile invertebrate assemblages in 2005. The stress statistic is 0.15. Sites are coded by numbers listed in Table 1 and the depth. In the figure, the filled circles represent “outside” control sites, and the squares represent sites “inside” Sanctuary Zones. The dashed lines partition the sites into the three general regions surveyed, apart from the 10 m survey at site 22, from Kangaroo Island (circled).
Kangaroo Island
Gulf St Vincent
Encounter Bay

Encounter baseline survey
TAFI Internal Report Page 17
3.2 Patterns of species richness
Patterns of biodiversity at the site scale have been assessed using total number of species recorded in four 50 m transects. For fish, mobile macro-invertebrates and algae, results were highly consistent between management zones, with an average of ≈25 fish (Fig. 5), ≈15 macro-invertebrate (Fig. 6) and ≈27 plant species (Fig. 7) recorded at each site.
No significant differences in species richness between zones were evident when data were analysed using a single factor ANOVA (Table 2).
Fig. 5. Mean number of fish species per site (± SE) in different management zones.
Fig. 6. Mean number of mobile invertebrate species per site (± SE) in different management zones.
0
5
10
15
20
2005
Inve
rteb
rate
sp
ecie
s
Inside
Outside
0
5
10
15
20
25
30
2005
Fis
h s
pec
ies
Inside
Outside

Encounter baseline survey
TAFI Internal Report Page 18
Fig. 7. Mean number (± SE) of plant and sessile invertebrate taxa per site in different management zones.
Table 2. Results of one-way ANOVA (fixed factor zone) using data on number of species per 50 m transect for the 32 sites. The critical value of F for p<0.05 is 4.17.
Source of Variation SS df MS F P-value
Fish
Between Groups 21.1 1 21.1 0.34 0.57
Within Groups 1884.4 30 62.8
Invertebrates Between Groups 0.78 1 0.78 0.05 0.83
Within Groups 508.19 30 16.94
Algae Between Groups 66.1 1 66.1 0.94 0.34
Within Groups 2105.9 30 70.2
Given the low variance between sites and non-significant differences in species richness between zones for all three major taxonomic categories examined, future analyses should detect as significant relatively slight changes in “Inside” versus “Outside” zones.
0
5
10
15
20
25
30
35
2005
Pla
nt
taxa Inside
Outside
Encounter baseline survey
TAFI Internal Report Page 19
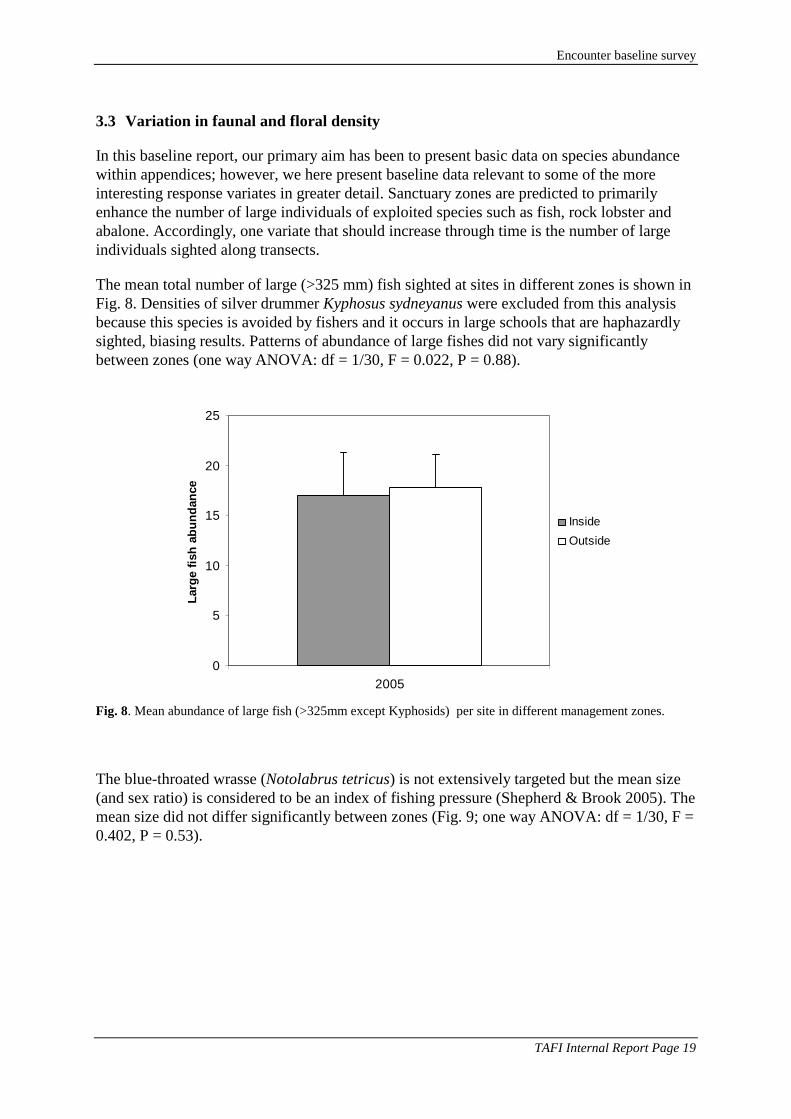
3.3 Variation in faunal and floral density
In this baseline report, our primary aim has been to present basic data on species abundance within appendices; however, we here present baseline data relevant to some of the more interesting response variates in greater detail. Sanctuary zones are predicted to primarily enhance the number of large individuals of exploited species such as fish, rock lobster and abalone. Accordingly, one variate that should increase through time is the number of large individuals sighted along transects.
The mean total number of large (>325 mm) fish sighted at sites in different zones is shown in Fig. 8. Densities of silver drummer Kyphosus sydneyanus were excluded from this analysis because this species is avoided by fishers and it occurs in large schools that are haphazardly sighted, biasing results. Patterns of abundance of large fishes did not vary significantly between zones (one way ANOVA: df = 1/30, F = 0.022, P = 0.88).
Fig. 8. Mean abundance of large fish (>325mm except Kyphosids) per site in different management zones.
The blue-throated wrasse (Notolabrus tetricus) is not extensively targeted but the mean size (and sex ratio) is considered to be an index of fishing pressure (Shepherd & Brook 2005). The mean size did not differ significantly between zones (Fig. 9; one way ANOVA: df = 1/30, F = 0.402, P = 0.53).
0
5
10
15
20
25
2005
Lar
ge
fish
ab
un
dan
ce
Inside
Outside

Encounter baseline survey
TAFI Internal Report Page 20
0
20
40
60
80
100
120
140
160
180
200
2005
Blu
e T
hro
at W
rass
e M
ean
Siz
e (m
m)
Inside
Outside
Fig. 9. Average mean length of blue-throated wrasse per site in different management zones.
One reef species often targeted is the sweep (genus Scorpis), for which there is a size limit of 240 mm. No significant difference was found between zones for the abundance of sweep in size classes 250 mm and above (Fig. 10; one way ANOVA: df = 1/30, F = 0.662, P = 0.42).
Fig. 10. Mean abundance of sweep above legal size per site in different management zones.
0
5
10
15
20
25
2005
Lar
ge
swee
p a
bu
nd
ance
Inside
Outside

Encounter baseline survey
TAFI Internal Report Page 21
Blacklip abalone (Haliotis rubra) are fished by recreational divers and commercial abalone licence holders. No significant differences were found between the zones for this species (Fig. 11; one way ANOVA: data square root transformed, df = 1/30, F = 0.342, P = 0.56).
Fig. 11. Mean abundance of Blacklip abalone per site in different management zones.
Relative to other temperate water sites surveyed in Tasmania, Victoria and Western Australia, few (26) rock lobsters were recorded on transects during the entire study (Fig. 12). No statistical test was undertaken for this species because of the low numbers.
Fig.12. Mean abundance (± SE) of rock lobsters per site in different management zones.
0
0.5
1
1.5
2
2005
Ro
ck l
ob
ster
ab
un
dan
ce
Inside
Outside
0
5
10
15
20
25
2005
Bla
ckli
p a
bal
on
e ab
un
dan
ce
Inside
Outside

Encounter baseline survey
TAFI Internal Report Page 22
Amongst the most important habitat variables at any site is cover of foliose algae, because differences in algal cover affect a variety of ecosystem processes and composition of associated fishes and invertebrates (Edgar et al., 2004b). No variation between zones was found when total cover of foliose plants was examined (Fig. 13; one way ANOVA: df = 1/30, F = 1.62, P = 0.21).
Fig. 13. Mean total cover (± SE) of foliose plants per site in different management zones.
4. Conclusion
Surveys of sites in the proposed Encounter Marine Park in 2005 provided a quantitative regional description of resident reef fishes, mobile and sessile invertebrates, and dominant plants on shallow inshore reefs. While examination of deeper outer reefs would have been desirable, these habitats were not included in the experimental design because of logistic inefficiencies involving diver bottom time, and because fishing impacts are most intense on the shallower reefs. Regardless, baseline surveys of deep reefs, seagrass beds and soft-sediment habitats inside and outside proposed sanctuary zones using non-destructive sampling techniques such as unbaited and baited video would prove very useful for assessing changes through the long term.
Examination of patterns of inter-site variation of the dominant species suggest that assemblages vary considerably between sites within the major protection categories, but that sites in sanctuary zones and fished zone types have broadly overlapping characteristics. Thus, future comparisons between categories should be valid using the current sites and experimental design.
0
20
40
60
80
100
120
140
2005
Pla
nt
cove
r (%
)
Inside
Outside

Encounter baseline survey
TAFI Internal Report Page 23
Investigation of 14 different locations within each treatment, including two surveyed at two depths, should be sufficient to detect biologically meaningful change for common species. From the results of the Tasmanian MPA study (Edgar and Barrett 1999) and a workshop examining MPA monitoring techniques (Barrett & Buxton 2002), it appears that where the abundance of each species is adequately described at each site, six sites in each treatment would be an acceptable number of replicates per treatment for an effective monitoring program. The level of replication was almost three times greater than this, allowing differences between the three major regions to be tracked. By surveying a wide range of species the experimental design should also have sufficient power to detect ecosystem shifts as well as changes in the abundance of target species following MPA declaration.
Ideally the surveys should be repeated at least once prior to the gazettal of fishing regulations, then annually following the declaration of the MPA until patterns in sanctuary zones have stabilised relative to patterns in open fishing zones. The stabilisation process could take over 20 years. The time-series of data generated would then allow population trends in species affected by the MPA to be identified, and the efficacy of the MPA for biodiversity conservation to be appropriately assessed. Such a long-term multi-species data set would also prove invaluable for analysis of the impacts of introduced species and climate change on regional biota.
Nevertheless, we recognise that, despite the importance of MPA monitoring, funding is limited and trade-offs are generally required to maximise cost-effectiveness. If insufficient funding is available, then we recommend that surveys be repeated every two years rather than annually. Such a change in survey frequency should not greatly affect assessment of MPA efficacy, given that biological changes associated with protection from fishing typically take many years to manifest. The major loss would be associated with the use of MPA data to assess changes to reef communities in anomalously hot and cold years, important information when predicting impacts of climate change.
5. Acknowledgments
We would particularly like to thank staff of the Department for Environment and Heritage (Coast and Marine Conservation Branch) for logistical and technical assistance, Hugh Kirkman for help and advice in the field, and the Australian Research Council for partial funding.

Encounter baseline survey
TAFI Internal Report Page 24
6. References
ANZECC, 1999. Strategic plan of action for the national representative system of marine protected areas. A guide for action by Australian Governments. Australian and New Zealand Environment and Conservation Council Task Force on Marine Protected Areas, Environment Australia, Canberra, 80 pp.
Barrett, N.S., Buxton, C., 2002. Examining underwater visual census techniques for the assessment of population structure and biodiversity in temperate coastal marine protected areas. Tasmanian Aquaculture and Fisheries Technical Report Series 11, 1-114.
Clarke, K.R., 1993. Non-parametric multivariate analyses of changes in community structure. Aust. J. Ecol. 18, 117-143.
Davis, G.E., 1981. On the role of underwater parks and sanctuaries in the management of coastal resources in the southeastern United States. Env. Conserv. 8, 67-70.
DeMartini E.E., Roberts D., 1982. An empirical test of biases in the rapid visual technique for species-time censuses of reef fish assemblages. Mar. Biology 70: 129-134.
DEH, 2005. Basis for Zoning. South Australian Department for Environment & Heritage, Adelaide, 31 pp.
Dugan, J.E., Davis, G.E., 1993. Introduction to the International Symposium on Marine Harvest Refugia. Can. J. Fish. Aquat. Sci. 50, 1991-1992.
Edgar, G.J., Barrett, N.S., 1999. Effects of the declaration of marine reserves on Tasmanian reef fishes, invertebrates and plants. J. Exp. Mar. Biol. Ecol. 242, 107-144.
Edgar, G.J., Barrett, N.S., Morton, A.J., 2004a. Biases associated with the use of underwater visual census techniques to quantify fish density and size-structure. J. Exp. Mar. Biol. Ecol. 308, 269-290.
Edgar, G.J., Barrett, N.S, Morton, A.J., Samson, C.R. 2004b. Effects of algal canopy clearance on plant, fish and macroinvertebrate communities on eastern Tasmanian reefs. J. Exp. Mar. Biol. Ecol. 312, 67-87.
Fairweather, P.G., McNeill, S.E., 1993. Ecological and other scientific imperatives for marine and estuarine conservation. In: Ivanovici, A.M., Tarte, D., Olsen, M. (Eds.), Protection of marine and estuarine areas: a challenge for Australians. Occasional Paper No. 4, Australian Committee for IUCN, Sydney, pp. 39-48.
Green, R. H., 1979. Sampling design and statistical methods for environmental biologists. Wiley, Chichester, UK.
Jennings, S., Kaiser, M.J., 1998. The effects of fishing on marine ecosystems. Adv. Mar. Biol. 34, 201-352.
Kulbicki, M. & Sarramega, S., 1999. Comparison of density estimates derived from strip transect and distance sampling for underwater visual censuses: a case study of Chaetodontidae and Pomacanthidae. Aquat. Living Resources 12, 315-325.
Roberts, C.M., Polunin, N.V.C., 1991. Are marine reserves effective in management of reef fisheries? Rev. Fish Biol. Fish. 1, 65-91.
Roberts, C.M., Polunin, N.V.C., 1993. Marine reserves: Simple solutions to managing complex fisheries? Ambio 22, 363-368.
Roberts, C.M., Hawkins, J.P., 2000. Fully-protected marine reserves: a guide. WWF, Washington.

Encounter baseline survey
TAFI Internal Report Page 25
Shepherd, S.A. & Brook, J.B., 2005. Distribution and abundance of the blue-throated wrasse on South Australian reefs: use of mean size as an indicator of fishing intensity. Unpublished manuscript.
Sobel, J., 1993. Conserving marine diversity through marine protected areas. Oceanus 36, 19-26.
Thompson, A.A., Mapstone, B.D., 1997. Observer effects and training in underwater visual surveys of reef fishes. Mar. Ecol Prog. Ser. 154, 53-63.
Underwood, A.J., 2000. Importance of experimental design in detecting and measuring stresses in Mar. populations. J. Aquat. Ecosys. Stress Recov. 7, 3-24.
Walters C.J. & Holling C.S., 1990. Large-scale management experiments and learning by doing. Ecology 71: 2060-2068.
Zann, L.P., 1995. Our sea, our future. Major findings of the state of the marine environment report for Australia. Great Barrier Reef Marine Park Authority, Townsville, Queensland.

Encounter baseline survey
TAFI Internal Report Page 26
Appendix 1. Total abundance of fishes recorded in four 50 m x 10 m transects surveyed at different sites in 2005.
1 2 3 4 5 6 7 8 9 10 11 12 13 14 15 16 17 18 19 19 20 20 21 21 22 22 23 24 25 26 27 285 5 5 5 5 5 5 5 5 5 5 10 5 5 5 5 5 5 5 10 5 10 5 10 5 10 10 5 5 5 5 5
Acanthaluteres brownii 22 34 2 17 1 37 13 8 3 4 21 31 39 77Acanthaluteres vittiger 12 4 1 1 48 1 1 2 1 1 1 1 2 31 2 1 3 2Achoerodus gouldii 1 4 2 5 3 1 10 17 4 8 8 4 16 4 5 1Aetapcus maculatus 1Anoplocapros amygdaloides 1 1Anoplocapros lenticularis 1Aplodactylus arctidens 3 1 2 1 1Aracana aurita 1Arripis spp. 20Austrolabrus maculatus 6 19 12 9 44 34 24 21 3 1 3 9 48 14 16 13 4 3 4Brachaluteres jacksonianus 2Caesioperca rasor 47 12 9 48 1Cheilodactylus nigripes 6 10 16 12 13 6 25 17 13 10 1 26 10 21 3 9 4 27 32 11 26 15 9 29 5 21 25 16 9 5 10Cheilodactylus spectabilis 1 2 1Chelmonops curiosus 12 3 7 1 2 4 11 2 9 2 1 1 5 1 8 9 3 3 5 15 6 15 2Dactylophora nigricans 7 3 5 1 1 6 8 3 3 6 1 2 1 1 2 1 8Dinolestes lewini 9 3 30 1 2 115 100 9 15 94 2 24 2Dotalabrus aurantiacus 3 3 2 3 5 3 6 11 13 1 2 1 2 9 8 2 4 5 6 7 3 1 3 3 4Enoplosus armatus 6 31 13 69 16 1 11 1 2 30 8 99 2 5 32 38 22 52 49 13Eubalichthys gunnii 2 1 1Eubalichthys mosaicus 2 1Eupetrichthys angustipes 4 2 2 3 2 1 1 1 3Girella tricuspidata 1 1Girella zebra 47 14 3 12 60 1 3 1 1 3 8 1 8 46 87 8 12 11 6 42 7 16 16 35Helcogramma decurrens 3Hypoplectrodes nigrorubrum 1 2 3 1 1Kyphosus sydneyanus 48 104 18 14 6 1 5 6 13 2 7 11 9 13 5 8 3 5 8 25 2Meuschenia flavolineata 14 1 10 9 4 1 1 1 7 2 1 9 12 18 18 6 16 3 4 20 3 1 4Meuschenia freycineti 1 1Meuschenia galii 10 2 5 10 1 1 1 1 1 1 5 10 7 2 1Meuschenia hippocrepis 30 31 8 85 15 11 22 11 20 9 12 5 12 16 9 7 3 4 5 43 2 44 37 27 9 18Muraenichthys australis 1Myliobatis australis 1Neatypus obliquus 2 8 4Nemadactylus valenciennesi 3 3 1Neoodax balteatus 4 7 2Neosebastes scorpaenoides 1Notolabrus parilus 4 4 4 1 4 6 9 2 1 1 5 6 2 1 1
Species
Site/Depth

Encounter baseline survey
TAFI Internal Report Page 27
Appendix 1 (cont.). Total abundance of fishes recorded in four 50 m x 10 m transects surveyed at different sites in 2005.
1 2 3 4 5 6 7 8 9 10 11 12 13 14 15 16 17 18 19 19 20 20 21 21 22 22 23 24 25 26 27 285 5 5 5 5 5 5 5 5 5 5 10 5 5 5 5 5 5 5 10 5 10 5 10 5 10 10 5 5 5 5 5
Odax acroptilus 4 1 6 1 1 1 1 1 2 1 1 2 2 2 4 4 5 2Odax cyanomelas 14 10 18 1 1 14 27 31 23 65 10 24 15 7 11 18 4 24 4 2 2 7 12 1Omegophora armilla 1 1Othos dentex 2 2 4 1 3 1 1 1Paraplesiops meleagris 1 1 1 2 17 8 1 2 2Parapriacanthus elongatus 17 297 200 900 335 35 1060 210 900 4700 258 272 22 8717 810 530Parequula melbournensis 1 2 6 8 7 4 32 1 4 2 1Parma victoriae 4 4 12 7 8 4 2 12 7 13 18 21 3 5 11 16 5 13 8 17 16 7 2 8 11 2 7Pempheris klunzingeri 80 2 12 2 20 5 6 115 5 76 27 165Pempheris multiradiata 124 1 13 14 3 2 5 4 36 1 69 138 29 127 161 44 178 231 111 99 181 124 25Pempheris sp. (Orange-lined) 8 1 59 9Pentaceropsis recurvirostris 1 3 1 4 17 2Pictilabrus laticlavius 4 15 5 28 37 29 6 14 15 2 4 1 10 12 12 5 15 33 69 7 22 7 12 32 55 14 14 8 4 21 35Platycephalus speculator 1Pseudocaranx dentex 1Scobinichthys granulatus 1 3 3 1Scorpis aequipinnis 5 62 37 22 39 17 19 36 87 79 135 117 5 35 20 41 66 24 45 59 65 43 33 33 95 10 31 27Scorpis georgiana 1Sepia apama 1 2 28 2 1 1 3Sepioteuthis australis 1 9 42 14 4Siphamia cephalotes 1349 144 13 263 26 20 121 159 2 8 31 14 8 4 9 39 377 112 1 61Siphonognathus attenuatus 1 6 1 1 1 1Siphonognathus beddomei 8 12 10 58 4 5 22 11 3 5 4 9 4 8 4 180 386 97 167 77 3 68 13 26 24 8Siphonognathus caninus 3 1Siphonognathus radiatus 2 1Siphonognathus tanyourus 5 1 2 3Sphyraena novaehollandiae 1 13 1Tilodon sexfasciatus 12 8 7 12 25 32 31 11 17 9 2 3 4 2 3 4 9 27 29 3 13 55 7 15 10 22 21 11 25Trachichthys australis 2 1Trachinops noarlungae 2978 2095 865 603 70 2276 1390 6 960 62 899 3 76 3895 3 35 190 2435 5945 1980 190Unidentified fish 500Upeneichthys vlaminghii 2 1 5 28 16 9 24 17 11 4 1 1 1 15 5 4 5 7 28 5 10 3 7 8 10Urolophus gigas 1
Species
Site/Depth

Encounter baseline survey
TAFI Internal Report Page 28
Appendix 2. Total abundance of mobile macro-invertebrates recorded in four 50 m x 1 m transects surveyed at different sites in 2005.
1 2 3 4 5 6 7 8 9 10 11 12 13 14 15 16 17 18 19 19 20 20 21 21 22 22 23 24 25 26 27 285 5 5 5 5 5 5 5 5 5 5 10 5 5 5 5 5 5 5 10 5 10 5 10 5 10 10 5 5 5 5 5
EchinodermsAmblypneustes ovum 1 1 2 2 3 1 2Anthaster valvulatus 1Astroboa ernae 1 2Cenolia tasmaniae 1 2 5Cenolia trichoptera 1 126 2 2 4 1 100 29 144 27 27 33 2 130 2 22 52 110 50 76 60 13 3 15 4 1 4Centrostephanus tenuispinus 1Conocladus australis 3 3Echinaster arcystatus 1 1 1 1Echinaster glomeratus 1Fromia polypora 1Goniocidaris tubaria 2 1Heliocidaris erythrogramma 1 1 1 4 29 2 21 1 3 3 3 3 42 2 7 6 2 9 2Holopneustes porosissimus 1 1 1 22 3 2 1 2Holopneustes sp_ 1Nectria macrobranchia 6 2 6 1Nectria multispina 1 3 1Nectria ocellata 1 1 1 1 2 2 2 5Nectria saoria 2 4 10 9 15 1Nepanthia troughtoni 7 12 1 1 2 1 1Patiriella brevispina 2 2 1 3 1 3 2 37Patiriella calcar 103 197Pentagonaster dubeni 7 3 3 2 8 2 1 1 2 1 2 2 3 2 1 4 3 7 3Petricia vernicina 1 12 2 2 1 2 3 3 5 10 2 10 1 2 2 3 6 3 5 5 4 4 4 4 1 4Phyllacanthus irregularis 4 1 5 1 1 1 1 1 2 3 7Plectaster decanus 1 1Stichopus ludwigi 1Stichopus mollis 2 1 2 2 1 10 2 3 2 12 2 7 1 1 1 1Tosia australis 1 5 4 4 1 1 2 1 1 4 2 17 10 3 4 4 1 11 1 2 10 1 2 1 3 5Uniophora granifera 2 2 1
Species
Site/Depth

Encounter baseline survey
TAFI Internal Report Page 29
Appendix 2 (cont). Total abundance of mobile macro-invertebrates recorded in four 50 m x 1 m transects surveyed at different sites in 2005.
1 2 3 4 5 6 7 8 9 10 11 12 13 14 15 16 17 18 19 19 20 20 21 21 22 22 23 24 25 26 27 285 5 5 5 5 5 5 5 5 5 5 10 5 5 5 5 5 5 5 10 5 10 5 10 5 10 10 5 5 5 5 5
MolluscsAustrocochlea odontis 71Cabestana tabulata 1 1Ceratosoma brevicaudatum 1 1Conus anemone 1 1 1 1Dicathais orbita 11 5 1 6 29 10 9 64 3 1 1 1 21 2 14Fusinus australis 1 1Haliotis cyclobates 7Haliotis laevigata 1 1 2 1 2 2 2Haliotis roei 3Haliotis rubra 10 4 38 28 8 45 13 114 30 11 14 5 2 3 1 1 7 1 6 1 3 1Mitra glabra 1Neodoris chrysoderma 2Penion mandarinus 1 1 1Phasianella australis 5 12 3 1 72 15 3Phasianella ventricosa 40 40 1 6 6 29 11 8 2 3 1 2 11 1 1 45 24Phasianotrochus eximius 1 2Pleuroploca australasia 2 2 27 5 1 3 17 4 11 1 11 3 1 2 2 4 8 29 4 1 4Pterynotus triformis 1 2 1 1 1Scutus antipodes 2 1Sepia apama 2 2 2 2Turbo torquatus 2 4 8 2 4 1Turbo undulatus 401 24 45 99 58 35 181 69 8 493 701
CrustaceansJasus edwardsii 1 5 2 1 1 5 2 3 1 1 2 1 1Leptomithrax gaimardii 1 12Nectocarcinus integrifrons 1Nectocarcinus tuberculatus 2 1 1 3 1 1Pagurid u/i 1 17 4 1 3 1 2 1 2 4 1 4 3 4 3 1Paguristes frontalis 1 1 8 1Petrocheles australiensis 1Plagusia chabrus 1 1 2 2 4 9 3 9 2 2 3 13 1 3 1 2 2 1 2Trizopagurus strigimanus 1
Species
Site/Depth

Encounter baseline survey
TAFI Internal Report Page 30
Appendix 3. Total abundance of cryptic fish recorded in four 50 m x 1 m transects surveyed at different sites in 2005.
1 2 3 4 5 6 7 8 9 10 11 12 13 14 15 16 17 18 19 19 20 20 21 21 22 22 23 24 25 26 27 285 5 5 5 5 5 5 5 5 5 5 10 5 5 5 5 5 5 5 10 5 10 5 10 5 10 10 5 5 5 5 5
Aetapcus maculatus 1 1 1 1 1 1Blennidae sp. 1Brachaluteres jacksonianus 2Chelmonops curiosus 1Cochleoceps bicolor 9Diodon nichthemerus 1Foetorepus calauropomus 1Gnathanacanthus goetzii 1 1Heteroclinus johnstoni 1Heteroclinus tristis 2Neosebastes scorpaenoides 1 1Othos dentex 1 1 3 5 1 1 1Paraplesiops meleagris 1 4 2 4 9 1 11 2 1Parascyllium variolatum 1Pempheris sp. (Orange-lined) 1Scorpaena papillosa 1 1Sepia apama 2 2 2 2Thysanophrys cirronasus 1 1Tilodon sexfasciatus 1Trachichthys australis 1Tripterygiid spp. 1 4 55 47 17 1 1 1 1 24 4 30 23
Species
Site/Depth

Encounter baseline survey
TAFI Internal Report Page 31
Appendix 4. Mean cover (%) of brown algae recorded in 20 0.25 m2 quadrats surveyed at different sites in 2005.
1 2 3 4 5 6 7 8 9 10 11 12 13 14 15 16 17 18 19 19 20 20 21 21 22 22 23 24 25 26 27 285 5 5 5 5 5 5 5 5 5 5 10 5 5 5 5 5 5 5 10 5 10 5 10 5 10 10 5 5 5 5 5
Acrocarpia paniculata 0.3 15.5 27.0 53.8 43.9 34.6 18.0 11.2 0.9 7.7 0.9 7.5 2.0 3.1Carpomitra costata 1.5Caulocystis cephalornithos 7.3 2.6 15.7 3.0 0.9 2.0 7.7Caulocystis uvifera 4.4Chlanidophora microphylla 1.2 4.2 10.2Cladosiphon filum 0.7Cladostephus spongiosus 0.2Colpomenia spp. 0.4 0.2 0.3Cystophora ?siliquosa 0.8Cystophora brownii 0.2 0.2 0.5 5.9 7.7 3.2 6.1 0.4Cystophora expansa 14.4 24.0 2.6 14.5 15.6 10.8 10.9 19.0 27.2 0.3 2.5 30.0 3.0 33.0Cystophora intermedia 0.7Cystophora monilifera 3.2 5.2 1.0 4.0 0.8 0.8 0.9 4.8 13.3 3.5 15.0 8.5 3.1 3.3 3.4 13.1 9.6 16.4 0.8 3.1 1.4 22.9 2.4Cystophora moniliformis 3.3 1.7 4.8 4.2 6.9 10.0 0.6 21.0 4.2 2.0 4.7 4.7 1.9 2.3 2.5 0.9 1.6 0.4 4.5 2.4 5.0Cystophora racemosa 17.8 8.6 3.3Cystophora retroflexa 1.8 12.5 0.2 0.6 17.0 0.3 1.8 0.1Cystophora spp. 0.3Cystophora subfarcinata 18.2 13.5 3.9 1.4 5.0 22.0 3.7 9.3 0.4 0.7 17.4 16.1Dictyopteris muelleri 0.1 0.2Dictyota spp. 0.5 1.1 0.2 0.1 0.7 0.3 0.3 0.2 0.2Distromium flabellatum 4.2 1.1Distromium multifidum 0.3 0.9Ecklonia radiata 44.6 33.6 40.2 27.2 0.6 0.4 0.7 12.6 63.1 52.4 68.0 12.4 0.9 41.9 36.0 17.2 48.3 50.5 32.6 41.5 18.9 1.1 17.3 8.0 46.9 24.6 19.5 2.3Encrusting brown algae 4.6 0.4Filamentous browns 31.1 7.8 8.0 10.7 7.7Halopteris spp. 0.2 0.5 0.3 0.4 5.2 0.6 1.1 4.4 0.6 0.1Homeostrichus olsenii 0.3 0.6 3.3 3.0Homeostrichus sinclairii 1.0 3.5Lobophora variegata 7.2 3.0 0.8 0.9 6.8 19.6 7.9 10.5 2.0 0.9 0.2 7.7 12.7 0.7 11.3 5.6 1.8Lobospira bicuspidata 1.9 1.2 2.9 0.7 2.9 1.0 5.7 2.1 0.9 6.9 1.1Pachydictyon paniculatum 2.8 0.3Perithalia cordata 0.1 1.9 2.5 0.2 0.6
Species
Site/Depth

Encounter baseline survey
TAFI Internal Report Page 32
Appendix 4 (cont.). Mean cover (%) of brown algae recorded in 20 0.25 m2 quadrats surveyed at different sites in 2005.
1 2 3 4 5 6 7 8 9 10 11 12 13 14 15 16 17 18 19 19 20 20 21 21 22 22 23 24 25 26 27 285 5 5 5 5 5 5 5 5 5 5 10 5 5 5 5 5 5 5 10 5 10 5 10 5 10 10 5 5 5 5 5
Sargassum ?lacerifolium 4.2Sargassum decipiens 4.9 3.7 14.9 9.0 0.6 0.6 0.6 1.1 3.1 15.3 11.2Sargassum fallax 0.4 1.0 2.3 4.1Sargassum heteromorphum 0.2 2.1 0.1 0.1 0.9Sargassum linearifolium 0.4 16.2Sargassum sonderi 1.2 0.6Sargassum spinuligerum 9.9 12.8 15.3Sargassum spp. 22.2 37.3 15.8 35.7 45.7 50.2 22.7 51.1 14.2 0.2 0.4 1.0 4.5 1.1 7.9 17.3 1.5 5.4 1.7 7.5 16.0 21.5 7.6 5.7 8.9 21.6 23.6 28.5Sargassum varians 0.9 17.0 7.4 3.6 4.5 0.4 8.8 11.9 15.9 16.3Sargassum verruculosum 0.2 17.5 4.0 5.6 1.0 2.6 2.0 2.5 0.5 0.4 0.2 1.0 0.5Sargassum vestitum 0.2 0.6 0.2 0.6Scaberia agardhii 0.2 10.4 0.4 1.9 4.6 0.1 1.5Scytothalia dorycarpa 0.3 0.3 12.9 1.2 57.6 23.9 14.5 46.0 45.2 16.2 9.6 17.3 10.1 8.1Seirococcus axillaris 10.0 6.3 1.9 45.2 4.9 23.8 4.4 22.2 5.7 17.6 1.3Sporochnus sp. 0.2 1.0 3.6Xiphophora chondrophylla 0.4 0.8Zonaria angustata 1.5 1.1 1.7 2.2 18.7 11.2 23.7 10.6 7.5 0.4 3.2 5.4 7.2 1.1 2.4 1.9 0.2 1.6 0.5 1.4 2.3 1.2Zonaria sp. 0.2 0.3 2.7 3.3 1.3 0.1 0.1 0.2 0.1 0.2 1.2 0.6Zonaria spiralis 1.7 0.1 1.6 2.1 0.7 0.4 0.1 1.3 4.2Zonaria turneriana 0.4
Species
Site/Depth

Encounter baseline survey
TAFI Internal Report Page 33
Appendix 5. Mean cover (%) of green algae recorded in 20 0.25 m2 quadrats surveyed at different sites in 2005.
1 2 3 4 5 6 7 8 9 10 11 12 13 14 15 16 17 18 19 19 20 20 21 21 22 22 23 24 25 26 27 285 5 5 5 5 5 5 5 5 5 5 10 5 5 5 5 5 5 5 10 5 10 5 10 5 10 10 5 5 5 5 5
Caulerpa brownii 0.2 0.2 0.9 0.2 2.1 0.1 0.8 0.4Caulerpa cactoides 0.1 0.1Caulerpa flexilis 0.1 0.5 0.2 4.6 0.3 4.8 0.2Caulerpa flexilis var. muelleri 2.9Caulerpa geminata 0.4Caulerpa hodgkinsoniae 0.2 0.1Caulerpa papillosa 0.2Caulerpa scalpelliformis 0.1Caulerpa trifaria 0.4 0.2 0.6 0.4Caulerpa vesiculifera 0.2 0.1Codium spp. 0.1 0.6 0.1Dictyosphaeria sericea 0.4 0.7 0.7 0.2 0.1Ulva spp. 0.1
Species
Site/Depth

Encounter baseline survey
TAFI Internal Report Page 34
Appendix 6. Mean cover (%) of red algae recorded in 20 0.25 m2 quadrats surveyed at different sites in 2005.
1 2 3 4 5 6 7 8 9 10 11 12 13 14 15 16 17 18 19 19 20 20 21 21 22 22 23 24 25 26 27 285 5 5 5 5 5 5 5 5 5 5 10 5 5 5 5 5 5 5 10 5 10 5 10 5 10 10 5 5 5 5 5
Amphiroa anceps 0.3 0.7 0.9 1.1 0.3 4.3 1.1 0.2 0.3 0.3Areschougia congesta 0.4 0.5 0.3Areschougia spp. 1.0 1.5 1.3Asparagopsis armata 1.2Ballia callitricha 0.7 3.4 2.3 0.1 1.2Botryocladia obovata 1.0 0.2 0.2 0.4 0.5Botryocladia sonderi 0.5 0.3Callophyllis lambertii 0.1Callophyllis rangiferinus 0.4 0.5 0.3 1.7Carpopeltis phyllophora 29.8Cheilosporum sagittatum 1.2 2.9 11.7 8.2Corallina officinalis 0.5 0.3 3.1 0.4 1.3 1.6Crustose coralline algae 30.6 5.3 30.4 4.7 0.9 0.2 0.2 0.3 3.9 43.8 38.1 16.5 13.8 6.8 21.9 32.0 0.6 22.3 5.1 41.9 11.8 16.0 13.8 6.5 0.1 3.0 7.2 58.7 10.2 8.5 1.9Delisea spp. 0.7 0.2 0.1Dictyomenia tridens 0.1Echinothamnion hystrix 2.5 0.3 2.1Euptilota articulata 1.6 2.5Filamentous red algae 2.5 0.3 2.8 5.5 0.5 1.3 4.1 9.0 26.9 10.5Gelidium australe 0.2Gelidium glandulaefolium 0.3 0.8 1.2 0.8Gelidium sp. 5.5 5.7Geniculate corraline turf 2.1Geniculate corralines 0.6 0.5 8.6 5.8 1.5 0.2 2.0Gigartina crassicaulis 0.1Gloiosaccion brownii 1.4 0.4 0.3Gracilaria sp. 0.1Haliptilon roseum 0.8 2.3 21.9 16.8 2.6 3.0 11.5 0.7 4.0 0.7 2.2 0.3 2.5 0.7 0.2 0.8 0.2 2.0Haloplegma preissii 0.4 0.7Halymenia plana 0.2Hildenbrandia sp. 0.2 0.4Hypnea sp. 0.2 0.4 0.3Jania pulchella 0.2Jania spp. 0.1
Species
Site/Depth

Encounter baseline survey
TAFI Internal Report Page 35
Appendix 6 (cont.). Mean cover (%) of red algae recorded in 20 0.25 m2 quadrats surveyed at different sites in 2005.
1 2 3 4 5 6 7 8 9 10 11 12 13 14 15 16 17 18 19 19 20 20 21 21 22 22 23 24 25 26 27 285 5 5 5 5 5 5 5 5 5 5 10 5 5 5 5 5 5 5 10 5 10 5 10 5 10 10 5 5 5 5 5
Laurencia spp. 0.2 0.6 0.2 0.4 0.4Lenormandia smithiae 0.5 0.3 3.4Lophurella periclados 0.8Melanthalia abscissa 0.4 2.0 1.0 0.2Melanthalia concinna 0.2 0.1Melanthalia obtusata 0.7Melanthalia sp. 0.5 1.5 1.1 1.0 0.3Metagoniolithon radiatum 0.6 0.2 4.6 0.2 3.1 2.4 0.4 0.1 1.0 0.9Metagoniolithon stelliferum 1.1Metamastophora flabellata 0.1 2.1Osmundaria prolifera 0.1Osmundaria spiralis 5.4 0.5Peltasta australis 1.3 0.3Peyssonnelia novaehollandiae 4.0 0.8 0.5Peyssonnelia sp. 0.7 0.1 1.1 0.7 0.5 0.5Peyssonnelia spp. (encrusting) 1.1 0.4 0.2 0.4 0.5 10.7 28.6 18.6 4.9 5.8 3.1 0.8 15.9 4.5 0.1 4.8 1.8 0.5 1.3 0.3 0.4 2.4 1.5Phacelocarpus alatus 0.9 1.2 0.4Phacelocarpus apodus 2.2 2.6 0.3 0.5Phacelocarpus peperocarpus 5.1 3.4 6.3 1.2 3.6 7.0Plocamium angustum 3.5 0.3 0.9 0.3 3.6 0.9 0.4 0.4 0.7 0.6 0.5Plocamium cartilagineum 0.2 0.3 0.2Plocamium costatum 0.2Plocamium dilatatum 0.2 0.7 7.4 1.2Plocamium mertensii 1.1 6.1 1.8 1.7 2.2 1.5Plocamium patagiatum 0.8Plocamium preissianum 1.8 0.3 0.8 1.7Pterocladia capillacea 0.3 0.2 1.5 0.5Pterocladia lucida 4.4 0.8 13.1 3.1 0.4 1.2 1.2 0.3 0.3 0.6 0.8 1.2Rhodopeltis australis 0.1 0.2Rhodymenia spp. 1.1 0.6 6.9 0.9 0.2 0.2 1.9 0.2 0.7Sonderopelta coriacea 0.4Thamnoclonium dichotomum 0.3 0.5Turfing red 0.9 7.3 1.2 0.4 0.5 5.2 0.6 2.0 3.8 4.7 5.0 0.5 0.3Unidentified Foliose reds 0.7 2.5 5.5 5.3 1.2 10.6 0.5 0.1 2.6 4.2 0.9 1.0 1.9 11.2 0.7 3.8
Species
Site/Depth

Encounter baseline survey
TAFI Internal Report Page 36
Appendix 7. Mean cover (%) of seagrass and sessile invertebrates recorded in 20 0.25 m2 quadrats surveyed at different sites in 2005.
1 2 3 4 5 6 7 8 9 10 11 12 13 14 15 16 17 18 19 19 20 20 21 21 22 22 23 24 25 26 27 285 5 5 5 5 5 5 5 5 5 5 10 5 5 5 5 5 5 5 10 5 10 5 10 5 10 10 5 5 5 5 5
SeagrassesAmphibolis antarctica 2.4Amphibolis griffithi 5Heterozostera tasmanica 0.5
InvertebratesAscidians 0.9 0.2 0.4 1 0.1 0.2 1.9 0.2 0.5 0.1 0.3 0.7 0.4 3.1 1.4 0.3 0.3 0.4 0.3 1 1.1 0.2Botrylloides magnicoecum 0.4Bryozoans 0.1 1.9 2.3 0.5 0.1 2.2 0.1 6.4 2.7 7.1 17.6 8.1 9.2 0.7 0.2 3.4Capnella sp_ 0.7 1.2Cnemidocarpa pedata 1Erythropodium hicksoni 0.3 1.2Herdmania momus 0.3 2.9 0.5 0.2 0.2 0.2 1.6 1.4 3.1 0.5 0.4Hydroids 1.5 0.6Mopsea sp_ 0.1Other sponges 2.7 1.1 1.4 1.1 1.8Phallusia obesa 0.2Pyura gibbosa 0.1Sponge (encrusting) 5 4.9 2 0.4 0.1 3.4 1.5 1.2 1.1 0.7 1.1 5.4 1.2 2.6 0.9 2.7 1.4 2.5 1.9 0.1Sponges (erect) 2.2 4.6 2.6 3.7 3.5 1.7 0.7 1.8 2 4.5 1.5 9 1.9 8.5 1 0.7 2.7 3.1 5.4 9 3.4 4.1 7.7 6.9 3.6 7.7 11.8 4.9 1.7 1 2.1 1.1Zoanthid sp_ 0.5
Species
Site/Depth