ECOSYSTEM GAP ANALYSIS - Oklahoma WorksThe Agriculture and Biosciences Ecosystem is the only...
45
FEBRUARY 2017 ECOSYSTEM GAP ANALYSIS OKLAHOMA OFFICE OF WORKFORCE DEVELOPMENT
Transcript of ECOSYSTEM GAP ANALYSIS - Oklahoma WorksThe Agriculture and Biosciences Ecosystem is the only...

FEBRUARY 2017
ECOSYSTEM GAP ANALYSISOKLAHOMA OFFICE OF WORKFORCE DEVELOPMENT

Policy, Research & Economic Analysis www.oklahomaworks.gov
This page intentionally left blank.

i
Policy, Research & Economic Analysis www.oklahomaworks.gov
Table of Contents
Key Findings ...................................................................................................................................... 1
Purpose ............................................................................................................................................. 5
Methodology and Limitations ........................................................................................................... 5
Educational Attainment of Oklahomans versus the Nation ............................................................... 8
Cost of Living Comparison – Six States Contiguous to Oklahoma ....................................................... 9
Oklahoma Statewide Skills Gap ....................................................................................................... 10
Aerospace and Defense Ecosystem ................................................................................................. 11
Agriculture and Biosciences Ecosystem ........................................................................................... 17
Energy Ecosystem ........................................................................................................................... 22
Information and Finance Ecosystem ................................................................................................ 28
Transportation and Distribution Ecosystem .................................................................................... 33
Conclusion ...................................................................................................................................... 39

ii
Policy, Research & Economic Analysis www.oklahomaworks.gov
This page intentionally left blank.
iii
Policy, Research & Economic Analysis www.oklahomaworks.gov
List of Tables and Charts
Table 1: Top 10 Growth Occupations in the Aerospace and Defense Ecosystem ............................. 13
Table 2: Top 10 Growth Occupations in the Agriculture and Biosciences Ecosystem ....................... 19
Table 3: Top 10 Growth Occupations in the Energy Ecosystem ....................................................... 24
Table 4: Aging Workforce Stress on the Energy Ecosystem ............................................................. 26
Table 5: Top 10 Growth Occupations in the Information and Finance Ecosystem ............................ 30
Table 6: Top 10 Growth Occupations in the Transportation and Distribution Ecosystem ................ 35
Chart 1: Educational Attainment, Oklahoma Versus the Nation ...................................................... 8
Chart 2: Cost of Living Comparison; 6 States Contiguous to Oklahoma ............................................ 9
Chart 3: Oklahoma’s Workforce Gap ............................................................................................. 10
Chart 4: Oklahoma’s Workforce Gap – Aerospace and Defense Ecosystem ................................... 12
Chart 5: Software Developers, Applications Median Hourly Earnings Comparison ........................ 15
Chart 6: Oklahoma’s Workforce Gap – Agriculture and Biosciences Ecosystem ............................. 18
Chart 7: Oklahoma’s Workforce Gap – Energy Ecosystem ............................................................. 23
Chart 8: Earnings and Cost of Living Differentials Compared to Oklahoma for the Energy
Ecosystem ....................................................................................................................... 27
Chart 9: Oklahoma’s Workforce Gap – Information and Finance Ecosystem .................................. 29
Chart 10: Earnings and Cost of Living Differentials Compared to Oklahoma –
Information and Finance.................................................................................................. 31
Chart 11: Oklahoma’s Workforce Gap – Transportation and Distribution Ecosystem ...................... 34

iv
Policy, Research & Economic Analysis www.oklahomaworks.gov
This page intentionally left blank.

1
Policy, Research & Economic Analysis www.oklahomaworks.gov
Key Findings
This study examines selected occupations employed in Oklahoma’s five key demand industry
sectors, or economic systems, known as “ecosystems.” Ecosystems provide Oklahoma with a
competitive advantage in a global economy. They exhibit significant potential for employment
growth and provide wealth generating employment opportunities. The five key ecosystems’
demand industries produce or provide similar goods and services and therefore have similar needs
in workforce, infrastructure, and economic development policy. These ecosystems include
Aerospace and Defense, Agriculture and Biosciences, Energy, Information and Finance, and
Transportation and Distribution. The analyses focused on identifying and quantifying 1) the gap
between the educational attainment of the current workforce and the educational attainment
needs of a projected 2025 workforce; 2) stress in the educational pipeline intended to provide
graduates to fill newly created jobs in the top 10 growth occupations for each ecosystem; and, 3)
any additional factors found to impact the ability to meet industry needs in filling high growth
occupations.
These analyses resulted in the following findings.
Ecosystem Comparisons
No two ecosystems exhibit the same characteristics and face the same economic
challenges regarding the projected needs of a 2025 workforce. The strengths and
challenges identified, within the scope of this study, for the industries within each
ecosystem are unique and varied.
Anticipated workforce skills gaps within an ecosystem range from 7% to 35%. The skills
gap is greatest in those ecosystems employing a large percentage of highly technical
workers – Aerospace and Defense, and Information and Finance. The skills gap is smallest
in the Transportation and Distribution Ecosystem, an ecosystem that continues to rely
upon a large number of occupations which value the ability to perform physical labor over
the attainment of higher education.
The top 10 growth occupations identified for each ecosystem account for 40.4% (17,748) of
all new ecosystem jobs projected to be created by 2025.
Most job classifications are utilized by a variety of employers; therefore, industries
within the five ecosystems must compete for qualified workers, not only among
themselves, but with other employers outside of the five ecosystems.
Industrial Machinery Mechanics job classification appears on the top 10 growth lists for
four of the five key ecosystems. Other growth occupations across ecosystems include
General and Operations Managers; Sales Representatives, Wholesale and Manufacturing,
Except Technical and Scientific Products; and a variety of computer‐related occupations
such as computer support specialists, software developers and analysts.

2
Policy, Research & Economic Analysis www.oklahomaworks.gov
Occupations in two of the five ecosystems – Aerospace and Defense, and Agriculture and
Biosciences – experience signs of potential educational pipeline stress. Educational
pipeline stress is characterized by an insufficient supply of appropriately trained workers
available to fill expected job openings.
Aerospace and Defense
Total employment in industries within the Aerospace and Defense Ecosystem is projected
to increase 6.1% by 2025, creating nearly 8,000 new jobs.
For newly created jobs in Aerospace and Defense, 89% will require a postsecondary
degree or credential above a high school diploma or its equivalency. Over 52% will
require a Bachelor’s Degree or more. Without intervention, Oklahoma faces a 35% skills
gap in meeting the educational attainment needs of Aerospace and Defense Ecosystem
industries in less than 10 years.
Three of the top 10 growth occupations in the Aerospace and Defense Ecosystem exhibit
characteristics of educational pipeline stress.
Agriculture and Biosciences
The Agriculture and Biosciences Ecosystem is the only ecosystem projected to decline in
employment between 2016 and 2025. Overall, the ecosystem is anticipated to experience
a net loss of nearly 1,000 jobs.
The educational requirements for occupations in the Agriculture and Biosciences
Ecosystem are centered predominantly in the classifications of high school diploma plus
experience, Career and Technology (CareerTech) Certificate, or Associate Degree. These
qualifications are sufficient for 44% of all newly created jobs by 2025.
Despite the comparatively lower educational requirements to meet the needs of new
jobs in the Agriculture and Biosciences Ecosystem, Oklahoma will face a 23% skills gap in
those industries by 2025 if no intervention occurs.
Four of the top 10 growth occupations in the Agriculture and Biosciences Ecosystem show
symptoms of educational pipeline stress.
Energy
Despite a softening in the Oklahoma energy industry within the recent year, employment
in the Energy Ecosystem is predicted to grow 16% by 2025, the largest anticipated growth
of any ecosystem. This growth will add nearly 16,000 new positions.
The Energy Ecosystem is trending toward increased requirements for higher levels of
education. Currently, however, occupations in Energy Ecosystem industries are centered
predominantly on the possession of either a CareerTech Certificate or an Associate Degree.
This education level is sufficient to meet the minimum education requirements for 62% of
all newly created jobs. Twenty percent of those new jobs require a Bachelor’s Degree.

3
Policy, Research & Economic Analysis www.oklahomaworks.gov
Without intervention, Oklahoma is projected to face a 26% skills gap in meeting the
educational attainment needs of Energy Ecosystem industries by 2025.
The Energy Ecosystem, more so than any of the other ecosystems, is experiencing stress
due to an aging workforce. In five of the top 10 growth occupations, the percentage of
the workforce over the age of 55 is 23% or higher. At the same time, new participants
entering the workforce only account for between 2.5% and 7.8% in these same
occupations.
Information and Finance
Information and Finance Ecosystem industries employ 5.9% of Oklahoma’s workforce in
2016 and is projected to grow 5.9% by 2025. More than 7,700 new jobs will be created.
The entry level education requirements for jobs within the Information and Finance
Ecosystem are expected to significantly shift toward the need for college degrees within
the next nine years. By 2025, 46% of all jobs and 71% of all newly created jobs will
require a Bachelor’s Degree or higher.
Without intervention, Oklahoma is projected to face a 31% skills gap in meeting the
educational attainment needs of industries in the Information and Finance Ecosystem.
Based upon the data analyzed, the greatest threat to the ability to fill the top 10 growth
jobs in the Information and Finance Ecosystem is competition from surrounding states,
which report median hourly wages up to 60% higher than those found in Oklahoma.
Transportation and Distribution
The Transportation and Distribution Ecosystem employs 6.7% of Oklahoma’s total
workforce and is projected to grow 4.8% by the year 2025. Nearly 7,600 new jobs will be
created, 29% of which will be centered in the top 10 growth jobs for the industry.
Within the Transportation and Distribution Ecosystem, there is a shift toward a greater
need for CareerTech Certifications or Associate Degrees. By 2025, 47% of all jobs and
37% of newly created jobs in the ecosystem will require these credentials.
Many positions within the Transportation and Distribution Ecosystem require physical
labor. This results in the attainment of a high school diploma or less still qualifying job
seekers for 46% of newly created jobs.
Overall, without intervention, Transportation and Distribution Ecosystem industries will
face a 7% skills gap in meeting educational attainment needs by 2025.
The top 10 growth occupations in the Transportation and Distribution Ecosystem will
account for 49% (3,755) of anticipated new job creation. Included on the list of top 10
growth occupations are positions critical to the success of the ecosystem, yet still maintain
low educational requirements and relatively low median hourly earnings.

4
Policy, Research & Economic Analysis www.oklahomaworks.gov
Wage disparities pose a challenge for the top 10 growth occupations in the
Transportation and Distribution Ecosystem. Median hourly earnings for these positions
are reported to be as much as 73% higher in surrounding states compared with
Oklahoma.

5
Policy, Research & Economic Analysis www.oklahomaworks.gov
Purpose
Oklahoma has identified five key, in demand, industry sectors known as “ecosystems” which
provide the state with a competitive advantage in a global economy. The ecosystems exhibit
significant potential for employment growth and provide wealth generating employment
opportunities in the state. These five ecosystems include Aerospace & Defense; Agriculture and
Biosciences; Energy; Information and Financial Services; and, Transportation and Distribution.
Four additional regional or complementary ecosystems including Health, Education, Construction
and Manufacturing have been identified within the state; however, only the five key ecosystems
have been included in this study.
The purpose of this study is to identify and quantify 1) the gap between the educational
attainment of the current workforce and the educational attainment needs of a projected 2025
workforce; 2) stress in the educational pipeline intended to provide graduates to fill newly created
jobs in the top 10 growth occupations for each ecosystem; and 3) any additional factors found to
impact the ability to meet industry needs in filling high growth occupations. To accomplish these
goals, two unique but complementary methodologies were applied to data for each ecosystem: a
skills gap analysis and an educational pipeline analysis.
Methodology, Data Limitations, and Sources
1) Skills Gap Analysis. Initially, data representing the current educational attainment levels
of Oklahoma’s working‐age population – those individuals who are between the ages of 18
and 64, was examined. Educational attainment classifications are standardized by the U.S.
Census Bureau and can range from “Less than 9th Grade” completion up to the achievement
of a “Graduate Degree or Higher.” These data were then compared to the expected entry
level of education required for job projections in each ecosystem in 2025 to identify skills
gaps. Skills gaps are characterized as a disparity between the two data sets at one or more
educational attainment levels.
One significant data limitation poses a hurdle to the accomplishment of this analysis.
Specifically, the U.S. Census Bureau does not collect data regarding the number of
individuals who have completed a Career and Technology Center Certification or achieved a
professional license without a college degree. The only intermediary classification
between the attainment of a high school diploma and the achievement of an Associate
Degree is termed by the Bureau as “Some College.” Conversely, for occupational
projections, many jobs require significant levels of training or work experience beyond the
completion of a high school diploma, but less than an Associate Degree or no college
coursework at all, assigning the requirements of these occupations to a unique category
non‐existent in Census Bureau data.
In order to overcome these classification issues, a three‐step methodology was employed.
First, occupational projections mandating substantial training above the achievement of a

6
Policy, Research & Economic Analysis www.oklahomaworks.gov
high school diploma but below a Bachelor’s Degree were isolated and determined, in best
practice, to require the completion of a certificate or other appropriate non‐degree
industry‐validated credential such as a professional license. This group was temporarily
designated as requiring “Certification/Credential” attainment. Next, to achieve a
comparable level of education based on the Census Bureau classifications, the categories of
“Some College” and “Associate Degree” were combined. Finally, these two categories were
aggregated under the nomenclature of “Associate/Certificate/Credential.” This unique
educational attainment category was utilized for all applicable analyses.
2) Educational Pipeline Analysis. This second analysis attempted to answer the question of,
“Do regional education institutions produce sufficient graduates to meet the need of the
growing demand for skilled workers in this occupation?” To accomplish this analysis, the
top 10 growth occupations in each ecosystem as measured by new job creation between
2016 and 2025 were identified. An examination was then made of the educational
“pipeline” – educational program graduates – qualified and available to fill those positions.
This methodology results in the identification of possible pipeline “stress” or bottlenecks.
Educational pipeline stress is characterized by an insufficient supply of appropriately
trained workers available to fill expected job openings. The topic of Oklahoma’s education
and training facility “capacity,” or the ability to produce greater numbers of graduates, fell
outside the scope of this analysis and is not addressed.
Two data limitations include:
Data regarding the estimated annual number of job openings as well as education
completions are available only at the occupational level, not narrowed by
ecosystem. Estimates for these two variables must be extrapolated from the
statewide data. This presents a conflict for occupations critical to more than one
ecosystem. For example, of the 2,576 Civil Engineers employed statewide in 2016,
899 (35%) are employed in the Aerospace and Defense Ecosystem while 861 (33%)
are employed in the Agriculture and Biosciences Ecosystem; the remainder are
employed in other ecosystems or non‐ecosystem industries. It is not possible to
predict in which industry a new civil engineering graduate will find employment. As
a result, for the purposes of this analysis, the assumption is made that each
ecosystem will mirror the state employment model as a whole. That is, the
Aerospace and Defense Ecosystem, with 35% of civil engineers employed, will then
attract and hire 35% of graduates. Likewise, Agriculture and Biosciences, with 33%
of civil engineers employed, will attract and hire 33% of graduates, etc.
The model utilized fails to address the issue of migration. With the exception of
certain occupations that require licensure within the state of Oklahoma, the ability
to quantify the permanent relocation of workers into and out of the state for the
purpose of employment, based upon existing readily‐available datasets, is limited.
As a result, the analysis model represents a “closed system,” assuming most

7
Policy, Research & Economic Analysis www.oklahomaworks.gov
graduates of state programs will remain in Oklahoma and few graduates from
outside the state will migrate into the state for employment.
3) Labor Market Data Limitations. Labor market analyses rely upon a large amount of data
gathered from a variety of federal and state government, as well as private, sources. Based
upon staggered reporting cycles, there are often delays in obtaining and synthesizing this
data. The data provided for this analysis are the most recent available and the only basis
upon which to model projections for the future.
4) Data Sources. Except when otherwise cited, the data utilized for these analyses are
extracted from the Economic Modeling Specialist International (EMSI) database software.
EMSI aggregates data from over 90 publicly‐available or proprietary data sources including
a variety of data from the U.S. Census Bureau, the Bureau of Labor Statistics, the Bureau of
Economic Analysis and the National Center for Education Statistics (NCES), among others.
Examples of datasets incorporated into the EMSI software include:
Quarterly Workforce Indicators (QWI);
Local Area Personal Income (LAPI);
Current Employment Statistics (CES);
Non‐Employer Statistics (NES);
Quarterly Census of Employment and Wages (QCEW);
Occupational Employment Statistics (OES);
National Industry‐Occupation Employment Matrix (NIOEM);
Occupational Information Network (O*Net); and,
Integrated Postsecondary Education Data System (IPEDS).
The methodologies summarized here and the associated data are intended to provide a general
overview of the educational gap in the state of Oklahoma as applied to ecosystem industries. A
broad range of variables affect the labor market, thus, additional research is recommended for
further understanding.

8
Policy, Research & Economic Analysis www.oklahomaworks.gov
Educational Attainment of Oklahomans Versus the Nation
The American Community Survey (ACS), conducted by the U.S. Census Bureau, provides annual
estimates of a variety of demographics for the total population of the United States. These data
are used to establish the baseline for the educational gap analysis. As of 2016, 46% of Oklahoma
residents have earned a high school diploma or less, compared with 42% nationally. There is a six
percentage point differential between Oklahoma residents and the nation with regard to
individuals who have attained an Associate Degree or higher – 31% in Oklahoma compared with
37% nationally. At the highest level of education, “Graduate Degree or Higher,” only 8% of
Oklahomans are represented compared to 11% nationally.
Source: EMSI 2017.1
6%8%
32%
23%
7%
16%
8%7% 7%
28%
21%
8%
18%
11%
0%
5%
10%
15%
20%
25%
30%
35%
Less than 9thGrade
9th Grade to12th Grade
High SchoolDiploma
Some College Associate'sDegree
Bachelor'sDegree
GraduateDegree orHigher
Educational AttainmentOklahoma versus National
Oklahoma National

9
Policy, Research & Economic Analysis www.oklahomaworks.gov
Cost of Living Comparison – Six States Contiguous to Oklahoma
The educational pipeline analysis methodology evaluates the supply and demand for workers in a
particular occupational classification within each of the five key ecosystems. However, it is not only
possible, but likely, that
many Oklahoma graduates
will be enticed to leave the
state for employment. One
of the primary factors
driving this migration of
graduates is the possible
wage differentials in
Oklahoma versus the
surrounding states.
Although salaries may be
higher in contiguous
states, the cost of living in
those locales must be
weighed against the salary
increase. The cost of living
comparison for the six
states contiguous to
Oklahoma are provided in
the map.
Note: Cost of Living statistics are averages for the state cited. Individual cities may experience a higher or lower cost of living differential than provided.
Source: Salaryexpert.com

10
Policy, Research & Economic Analysis www.oklahomaworks.gov
Oklahoma Statewide Skills Gap
In 2016, employers reported 1,797,132 jobs in nearly 800 job classifications. By 2025, this figure is
expected to grow to over 1,931,000; a growth rate of 7% resulting in the creation of nearly
134,000 new jobs. While 46% of Oklahomans possess a high school diploma or less, it is projected
this education level will only be sufficient to meet the educational requirements of 23% of newly
created jobs by 2025. Without intervention, Oklahoma faces a 23% skills gap in meeting the needs
of employers statewide by 2025.
Source: EMSI 2015.2
29%
23%
46%
50%
54%
30%
17%
19%
16%
4%
5%
8%
0% 10% 20% 30% 40% 50% 60% 70% 80% 90% 100%
2025 Total Jobs
2025 New Jobs
2016 Attainment
Oklahoma's Workforce Gap
High School or Less Associate/Certificate/Credential Bachelor's Degree Graduate Degree

11
Policy, Research & Economic Analysis www.oklahomaworks.gov
AEROSPACE AND DEFENSE ECOSYSTEM
Gap Analysis
In 2016, over 107,200 jobs, approximately 6% of Oklahoma’s total workforce, were associated with
industries in the Aerospace and Defense Ecosystem. By 2025, total employment is expected to
increase 6.1% to nearly 114,000.
As industry needs evolve, several occupations within the ecosystem will experience a decline in
demand, resulting in an associated loss of jobs. By 2025, it is anticipated 52 job classifications will
experience the loss of between one and 422 positions each, resulting in an estimated overall total
loss of 1,478 jobs. However, at the same time, growth in other occupations is expected to rise,
with some jobs experiencing as much as a 45% increase. Overall, it is anticipated that nearly 8,000
new jobs will be created between 2016 and 2025.
As the occupational needs of the ecosystem’s industries change, so too do the educational
requirements of the individuals employed. Industries within the Aerospace and Defense
Ecosystem require employees with advanced technical skills. By 2025, it is anticipated that over
40% of all jobs in these industries will require a Bachelor’s Degree or higher. At the same time, a
high school diploma or less will only provide the necessary skill set for 11% of jobs.
Of the 8,000 new jobs created in the next decade, 89% will require some type of credential above a
high school diploma. Over 52% will require a Bachelor’s Degree or higher. These projections
indicate that without intervention, Oklahoma will face a 35% skills gap in meeting the needs of
Aerospace and Defense Ecosystem industries in less than a decade.

12
Policy, Research & Economic Analysis www.oklahomaworks.gov
Source: EMSI 2017.1
Educational Pipeline Analysis
The top 10 growth occupations in the Aerospace and Defense Ecosystem are predicted to generate
2,757 new jobs by 2025 – approximately 35% of the anticipated new job growth among the
ecosystem industries. They account for over 12% of the total jobs in the ecosystem industries and
boast high median hourly earnings, between $18 and $38 per hour. The top 10 growth
occupations and several key demographics of those positions are presented in Table 1.
11%
11%
46%
47%
37%
30%
37%
51%
16%
4%
1%
8%
0% 10% 20% 30% 40% 50% 60% 70% 80% 90% 100%
2025 Total Jobs
2025 New Jobs
2016 Attainment
Oklahoma's Workforce Gap ‐ Aerospace and Defense Ecosystem
High School or Less Associate/Certificate/Credential Bachelor's Degree Graduate Degree

13
Policy, Research & Economic Analysis www.oklahomaworks.gov
Table 1: Top 10 Growth Occupations in the Aerospace and Defense Ecosystem
Description
Number of Jobs 2016
Projected Number of Jobs 2025
New Jobs
Created 2016‐2025
Percent of Occupation Currently Employed
Statewide by this
Ecosystem
Statewide Annual Job Openings (2015)1
Estimated Annual Job Openings2
Oklahoma Median Hourly Earnings
National Median Hourly Earnings
Typical Entry Level Education
Annual Educational Completions3
Total Completions
Estimated Completions Available for
This Ecosystem
Software Developers, Applications
1,755 2,209 454 41.19% 141 58 $36.21 $47.68 Bachelor’s Degree 591 243
Machinists 2,148 2,477 329 40.97% 266 109 $18.72 $19.63 High school diploma or
Equivalent with Long‐term On‐The‐Job Training
208 85
Computer Systems Analysts
959 1,270 311 29.18% 124 36 $34.50 $41.41 Bachelor’s Degree 970 283
Computer User Support Specialists
1,283 1,580 297 16.36% 183 30 $19.95 $23.80 Some college, no degree 800 131
General and Operations Managers
1,850 2,112 262 6.93% 1,006 70 $38.35 $48.04 Bachelor’s Degree plus 5 year’s work experience
4,254 295
Management Analysts 1,910 2,171 261 32.47% 152 49 $30.82 $38.10 Bachelor’s Degree with Less than 5 year’s work
experience 4,016 1,304
Software Developers, Systems Software
1,079 1,333 254 50.39% 67 34 $33.96 $51.08 Bachelor’s Degree 619 312
Industrial Machinery Mechanics
798 1,003 205 19.13% 235 45 $22.95 $24.11 High school diploma or
Equivalent with Long‐term On‐The‐Job Training
0 0
Web Developers 504 698 194 38.15% 60 23 $22.80 $29.68 Associate Degree 1,563 596
Computer‐Controlled Machine Tool Operators, Metal and Plastic
831 1,021 190 40.64% 125 51 $18.00 $18.08 High school diploma or
Equivalent with Moderate On‐The‐Job Training
127 52
Source: EMSI 2017.1
1 “Annual Job Openings” is defined as all positions in this category that become vacant. This includes both newly created jobs as well as positions left vacant through turnover.
2 Estimated Annual Job Openings: Calculated as “Statewide Annual Job Openings (2015)” multiplied by “Percent of Occupation Statewide Employed by this Ecosystem.”
3 Annual Education Completions: “Total Completions” represent the number of graduates of all state educational programs providing training applicable to the occupation. Estimated Completions Available for This Ecosystem” represents the estimated number of graduates that may seek employment specifically in Aerospace and Defense Ecosystem industries. Assuming that graduates are equally distributed among all industries that utilize a particular occupation, “Completions Available for This Ecosystem” is calculated as “Total Completions” multiplied by “Percent of Occupation Statewide Employed by this Ecosystem.”

14
Policy, Research & Economic Analysis www.oklahomaworks.gov
As indicated previously, educational pipeline stress is characterized by an insufficient number of
graduates available to fill job openings. Three of the top 10 growth occupations in the Aerospace
and Defense Ecosystem exhibit characteristics of educational pipeline stress. While each of these
positions only require a high school diploma, they also require significant on‐the job training (OJT),
elevating them into a category best addressed by the completion of a certificate in the field. These
three occupations, accounting for 724 newly created jobs by 2025, are:
Machinists: There are 109 anticipated job openings in this ecosystem annually with only an
estimated 85 graduates available to fill them. Two programs, both available exclusively at
Career and Technology Centers, exist to provide graduates for this occupation:
o Machine Tool Technology Machinist program, offered by 19 centers; and,
o Machine Shop Technology Assistant program, offered by 13 centers.
Industrial Machinery Mechanics: There are 45 anticipated annual job openings for this
position in the ecosystem of Aerospace and Defense, while no program graduates were
available to fill those positions in the latest year reported. Only one program is available
to train students for this occupation:
o Industrial Mechanics and Maintenance Technology program, offered by six Career
and Technology Centers statewide.
Computer‐Controlled Machine Tool Operators, Metal and Plastic: An estimated 51 job
openings occur annually within the ecosystem. At the same time, 52 completions are
available to fill those openings. Two programs, both available exclusively at Career and
Technology Centers, are available to provide graduates for this occupation:
o Machine Shop Technology Assistant program, offered by 13 centers; and,
o Computer Numerically Controlled (CNC) Machinist Technology/CNC Machinist
program offered by four centers.
It should be noted that the position of Industrial Machinery Mechanics appears on the top 10
growth occupations lists was well as the educational pipeline stress lists for four of the five key
ecosystems including Aerospace and Defense, Agriculture and Biosciences, Energy, and
Transportation and Distribution. Employers within these four ecosystems are all competing for a
limited number of individuals in the labor market with these specialized skills. As a result,
employers must develop creative strategies to entice these skilled workers to select their job
opportunities over those of their competitors. Further discussion of this position will be included
with each ecosystem section of this report, citing the appropriate data and circumstances specific
to that ecosystem as appropriate.
Additional observations regarding the educational pipelines for the top ten growth occupations in
the Aerospace and Defense Ecosystem:
An additional factor indirectly impacting the pipeline for two of the three classifications
experiencing educational pipeline stress – Machinists and Industrial Machinery Mechanics
– is the age distribution of those individuals in Oklahoma currently employed in these

15
Policy, Research & Economic Analysis www.oklahomaworks.gov
positions. Over 25% of the workforce in these two occupations are currently 55 years of
age or over, and are within a decade of traditional retirement age.
In comparison, for the job classification of Machinist, new workers under the age of 25
comprise only 6.5% of the workforce, while only 5.2% of Industrial Machinery Mechanics
fall into this age category. In the long‐term, as the workforce for these two occupations
ages out, a greater number of staff must be educated or trained to step into those roles.
The occupation of Management Analyst experiences an even higher percentage of an aging
workforce, with 29.6% of those age 55 or older. Since this occupation requires the
completion of a Bachelor’s Degree, individuals entering the workforce will be at a slightly
higher age. Examining the next higher occupational age category, consisting of those
employed who are under the age of 34, reveals that only 24% of the workforce are
represented.
While the position of Software Developers, Applications was not identified as experiencing
pipeline stress with 243 available completions to fill 58 annual job openings, the
occupation is at risk of losing many of those graduates to migration. All six surrounding
states – Arkansas, Colorado,
Kansas, Missouri, New Mexico,
and Texas – offer higher wages
than Oklahoma, possibly
enticing Oklahoma graduates
to relocate. Median hourly
earnings for this position in
Oklahoma are $36.21. Median
hourly earnings across the six
competing states range from a
high of $49.13 in Colorado to a
low of $37.30 in New Mexico.
For Colorado, this salary
differential equates to a 35.7%
increase over Oklahoma. With
the cost of living in Colorado
only 18.8% higher, job
openings in that state may
very well attract applicants
from Oklahoma’s graduate
pool.
The position of Web Developers, while experiencing a 38% growth in demand within the
Aerospace and Defense Ecosystem, is over‐saturated. Statewide, programs graduate 1,563
Web Developers annually; 596 positions are estimated to be available for placement in this
Oklahoma, $36.21
New Mexico, $37.30
Arkansas, $38.43
Kansas, $43.58
Missouri, $43.90
National, $47.68
Texas, $47.76
Colorado, $49.13
Software Developers, ApplicationsMedian Hourly Earnings Comparison

16
Policy, Research & Economic Analysis www.oklahomaworks.gov
ecosystem alone. Unfortunately, only 23 positions are open annually for this occupation in
Aerospace and Defense.
For three of the top ten growth positions, Oklahoma is outclassed by five of six surrounding
states with regard to median hourly earnings. Again, this provides incentive for Oklahoma
graduates to leave the state in favor of better wages. Only Arkansas offers lower wages for
Computer User Support Specialists ($25.49/hour in Colorado), General and Operations
Managers ($50.46/hour in Texas), and Software Developers, Systems Software
($52.06/hour in Colorado).
17
Policy, Research & Economic Analysis www.oklahomaworks.gov
AGRICULTURE AND BIOSCIENCES ECOSYSTEM
Gap Analysis
Over 84,300 jobs were associated with industries in the Agriculture and Biosciences Ecosystem in
2016. This figure represents 4.7% of Oklahoma’s total workforce. By 2025, the total employment
in this ecosystem is expected to decrease to 83,400. Agriculture and Biosciences is the only
ecosystem projected to experience a loss in total employment.
While 4,700 new jobs will be created in 231 occupation classifications, over 5,600 will be lost,
predominantly in the job classification of Farmers, Ranchers, and Other Agricultural Managers
which is expected to experience a 49% decreased demand. Slaughterers and Meat Packers (‐19%);
Helpers – Production Workers (‐11%); and, Farmworkers, Farm, Ranch, and Aquacultural Animals (‐
10%) will also contribute to decreased demand resulting in significant job loss.
As the occupational needs of the ecosystem’s industries change, so too do the educational
requirements of the individuals employed. The educational requirements for Agriculture and
Biosciences Ecosystem industries is anticipated to slowly move toward requiring higher
credentials, but is still centered predominantly on either a(n) 1) high school diploma plus
experience, 2) Career and Technology Center Certificate, or 3) Associate Degree. These
qualifications are sufficient for 37% of all jobs and 44% of all newly created jobs by 2025. At the
same time, approximately 33% of all jobs in Agriculture and Biosciences Ecosystem industries will
require a Bachelor’s Degree or higher while a high school diploma or less will only provide the
necessary skill set for 23% of the jobs.
These projections indicate that, without intervention, Oklahoma will face a 23% skills gap in
meeting the needs of Agriculture and Biosciences Ecosystem industries in less than a decade.

18
Policy, Research & Economic Analysis www.oklahomaworks.gov
Source: EMSI 2017.1
Educational Pipeline Analysis
The top 10 growth occupations in the Agriculture and Biosciences Ecosystem are predicted to
generate 1,405 new jobs by 2025 – approximately 30% of the anticipated new job growth among
the ecosystem’s industries. In 2016, these occupations accounted for just over 8% of the total
number of ecosystem jobs and boasted moderate to high median hourly earnings, between $14
and $35 per hour. The top 10 growth occupations and several key demographics of those positions
are presented in Table 2.
43%
23%
46%
37%
44%
30%
18%
30%
16%
2%
3%
8%
0% 10% 20% 30% 40% 50% 60% 70% 80% 90% 100%
2025 Total Jobs
2025 New Jobs
2016 Attainment
Oklahoma's Workforce Gap ‐ Agriculture and Biosciences Ecosystem
High School or Less Associate/Certificate/Credential Bachelor's Degree Graduate Degree

19
Policy, Research & Economic Analysis www.oklahomaworks.gov
Table 2: Top 10 Growth Occupations in the Agriculture and Biosciences Ecosystem
Description
Number of Jobs 2016
Projected Number of Jobs 2025
New Jobs
Created 2016‐2025
Percent of Occupation Currently Employed Statewide by this
Ecosystem
Statewide Annual Job
Openings (2015)1
Estimated Annual Job Openings2
Oklahoma Median Hourly Earnings
National Median Hourly Earnings
Typical Entry Level Education
Annual Educational Completions3
Total Completions
Estimated Completions Available for
This Ecosystem
Veterinary Technologists and Technicians
835 1,070 235 93.66% 37 35 $15.90 $15.77 Associate Degree 373 349
Veterinary Assistants and Laboratory Animal Caretakers
1,193 1,366 173 88.09% 52 46 $11.07 $12.14 High school diploma or Equivalent with Short‐
term On‐The‐Job Training 373 329
Sales Representative, Wholesale and Manufacturing, Except Technical and Scientific Products
1,651 1,816 165 15.40% 395 61 $23.99 $26.60 High school diploma or
Equivalent with Moderate‐term On‐The‐Job Training
141 22
Civil Engineers 861 1,011 150 33.44% 120 40 $35.54 $39.95 Bachelor’s Degree 108 36
Phlebotomists 346 485 139 27.51% 72 20 $14.18 $15.39 Postsecondary Non‐degree
Award 16 4
Medical and Clinical Laboratory Technicians
423 545 122 18.64% 103 19 $15.01 $19.07 Associate Degree 390 73
Medical and Clinical Laboratory Technologists
342 457 115 16.62% 89 15 $26.81 $29.69 Bachelor’s Degree 298 50
Industrial Machinery Mechanics
519 624 105 12.44% 235 29 $22.95 $24.11 High school diploma or
Equivalent with Long‐term On‐The‐Job Training
0 0
Market Research Analysts and Marketing Specialists
343 444 101 10.81% 120 13 $25.02 $30.50 Bachelor’s Degree 599 65
Photographers 307 407 100 26.36% 37 10 $14.01 $15.36 High school diploma or
Equivalent with Long‐term On‐The‐Job Training
245 65
Source: EMSI 2017.1
1 “Annual Job Openings” is defined as all positions in this category that become vacant. This includes both newly created jobs as well as positions left vacant through turnover.
2 Estimated Annual Job Openings: Calculated as “Statewide Annual Job Openings (2015)” multiplied by “Percent of Occupation Statewide Employed by this Ecosystem.”
3 Annual Education Completions: “Total Completions” represent the number of graduates of all state educational programs providing training applicable to the occupation. Estimated Completions Available for This Ecosystem” represents the estimated number of graduates that may seek employment specifically in Agriculture and Biosciences Ecosystem industries. Assuming that graduates are equally distributed among all industries that utilize a particular occupation, “Completions Available for This Ecosystem” is calculated as “Total Completions” multiplied by “Percent of Occupation Statewide Employed by this Ecosystem.”
20
Policy, Research & Economic Analysis www.oklahomaworks.gov
Four of the top 10 growth occupations in this ecosystem exhibit characteristics of educational
pipeline stress. These include:
Sales Representative, Wholesale and Manufacturing, Except Technical and Scientific
Products, with 22 completions and 61 annual job openings;
Civil Engineers, with 36 completions and 40 annual job openings;
Phlebotomists, with 4 completions and 20 annual job openings; and,
Industrial Machinery Mechanics, with 0 completions and 29 annual job openings in this
ecosystem.
Overall, these four occupations account for 559 newly created positions over the next decade.
Two of the four occupations require a high school diploma or equivalent in conjunction with some
level of on‐the‐job‐training (OJT). One occupation requires a Postsecondary Non‐degree Award
(Certificate or License). The remaining occupation – Civil Engineer – requires a Bachelor’s Degree.
The programs available to train potential job seekers for these occupations include:
Sales Representative, Wholesale and Manufacturing, Except Technical and Scientific
Products, requires a high school diploma or equivalent with moderate‐term OJT. There are
four general sales‐oriented programs available state‐wide to train students at the skill‐
level necessary for entry into this occupation.
o Business, Management, Marketing and Related Support Services, Other; offered by
four Career and Technology Centers;
o Special Products Marketing Operations; offered by one Career and Technology
Center;
o General Merchandising, Sales and Related Marketing Operations, Other; offered by
four Career and Technology Centers and one regional university; and,
o Sales, Distribution, and Marketing Operations General; offered by three Career and
Technology Centers.
Civil Engineer: One program is offered – Civil Engineering, General – at two major
universities in the state. While not required at the entry level for this occupation, these
two universities offer not only a Bachelor’s Degree in this field, but also degrees at the
Master’s and Doctoral levels;
Phlebotomist requires a Postsecondary Non‐degree Award; one program is offered –
Phlebotomy Technician/Phlebotomist – at four Career and Technology Centers and one
regional university; and,
Industrial Machinery Mechanics: high school/equivalent with Long‐term OJT; one program
is available – Industrial Mechanics and Maintenance Technology – which is offered by six
Career and Technology Centers.

21
Policy, Research & Economic Analysis www.oklahomaworks.gov
Additional observations regarding the educational pipelines for the top ten growth occupations in
the Agriculture and Biosciences Ecosystem:
An additional factor indirectly impacting the pipeline for three of these positions – Sales
Representatives, Wholesale and Manufacturing, Except Technical and Scientific Products;
Civil Engineers; and Industrial Machinery Mechanics – is the age distribution of those
individuals in Oklahoma currently employed in these positions. Over 25% of the workforce
in these three occupations are currently 55 years of age or over; within a decade of
traditional retirement. The occupational classification of Civil Engineers ranks highest
among the top 10 growth occupations with the greatest percentage of age 55 and over at
29.5%. Sales Representatives rank second at 26.9% while Industrial Machinery Mechanics
are third at 25.6%. As this workforce ages out, a greater number of staff must be prepared
to step into those positions. Phlebotomists, although considered an educational pipeline
stressed occupation, exhibits one of the lowest percentages of over‐55 workers at 13.0%
compared with 43.7% under the age of 34.
Agriculture and Biosciences Ecosystem industries employ 94% and 88% respectively of
individuals in the occupations of Veterinary Technologists and Technicians; and Veterinary
Assistants and Laboratory Animal Caretakers. This means there are few opportunities for
employment in these job classifications outside the ecosystem. Programs providing
training for these classifications are producing graduates at a rate of 10:1 for
Technology/Technician positions and 7:1 for Assistants/Animal Caretakers. In addition to
this over‐saturation in the field, salary ranges for these positions are relatively low.
Median hourly salaries for Assistants/Animal Caretakers range from $10 to $12 per hour.
Salaries for Technologists/Technicians are marginally higher, ranging from $12 to $17 per
hour.
For one position on the top 10 growth list, Market Research Analysts and Marketing
Specialists, the completions‐to‐openings ratio is nearly 5:1, indicating no educational
pipeline stress. However, competing salaries in the region may increase the chance that
Oklahoma graduates will migrate out of state for higher wages. Five of the six states
contiguous to Oklahoma offer up to 28% higher median hourly earnings for this job
classification.
Only 26% of Photographers work in the Agriculture and Biosciences Ecosystem. Given that
there are an estimated 65 annual graduates to fill 10 anticipated annual job openings,
there is no sign of pipeline stress within this occupation. However, it is important to note
that many photographers are self‐employed or employed in other industries focused on
specialties such as portrait or wedding photography. Employers of photographers in
Agriculture and Bioscience industries must ensure they develop strategies to attract
sufficient graduates to meet their needs.

22
Policy, Research & Economic Analysis www.oklahomaworks.gov
ENERGY ECOSYSTEM
Gap Analysis
As Oklahoma citizens are aware, the energy industry has experienced a softening in recent years,
resulting in job loss and business closures, predominantly in oil‐ and gas‐producing organizations.
Approximately 16,000 jobs were lost in the last year alone; however, oil price gains from the fourth
quarter of 2016 as well as a steady increase in active oil rig counts may be signaling an upward
trend.
In 2016, over 97,900 jobs were associated with industries in the Energy Ecosystem. This figure
represents 5.4% of Oklahoma’s total workforce. Based upon data currently available, this figure is
predicted to grow by 15,900 jobs in the next nine years, reflecting a 16% growth rate, the highest
of any of the five key ecosystems. Only 27 occupational classifications are expected to decrease in
the number of jobs – a total loss of only 163 positions. The position of Managers, All Other
accounts for 54 of those lost positions, a decline of 11% in the employment in that occupational
code. Power Plant Operators ranks second with an overall estimated job loss of 18, a decline of 6%
in that occupational code. In contrast, the highest ranking job growth position is that of Welders,
Cutters, Solderers and Brazers, an occupational classification that is expected to grow 23% by 2025,
adding 832 jobs to the industries represented in the Energy Ecosystem.
As the occupational needs of the ecosystem’s industries change, so too do the educational
requirements of the individuals employed. The educational requirements for Energy Ecosystem
industries is anticipated to slowly move toward requiring higher credentials, but is still centered
predominantly on either 1) a Career and Technology Center Certificate, or 2) an Associate Degree.
These qualifications are sufficient for 59% of all jobs and 62% of all newly created jobs by 2025. At
the same time, approximately 20% of all jobs in Energy Ecosystem industries will require a
Bachelor’s Degree or higher while a high school diploma or less will only provide the necessary skill
set for 20% of the jobs. Interestingly within this ecosystem in 2025, of more than 113,700 total
jobs, only 316 (0.28%) maintain entry level educational requirements at the graduate degree or
higher level. Only the Transportation and Distribution Ecosystem experiences a comparable
graduate degree requirement rate of less than one percent.
Overall, these projections indicate that, without intervention, Oklahoma will face a 26% skills gap
in meeting the needs of Energy Ecosystem industries in less than a decade.

23
Policy, Research & Economic Analysis www.oklahomaworks.gov
Source: EMSI 2017.1
Educational Pipeline Analysis
The top 10 growth occupations in the Energy Ecosystem are predicted to generate 5,509 new jobs
by 2025 – approximately 35% of the anticipated new job growth among the ecosystem’s industries.
In 2016, these occupations accounted for over 26% of the total number of ecosystem jobs and
provided a wide range of median hourly earnings, between $13 and $56 per hour. The top 10
growth occupations and several key demographics of those positions are presented in Table 3.
20%
20%
46%
59%
62%
30%
20%
18%
16% 8%
0% 10% 20% 30% 40% 50% 60% 70% 80% 90% 100%
2025 Total Jobs
2025 New Jobs
2016 Attainment
Oklahoma's Workforce Gap ‐ Energy Ecosystem
High School or Less Associate/Certificate/Credential Bachelor's Degree Graduate Degree

24
Policy, Research & Economic Analysis www.oklahomaworks.gov
Table 3: Top 10 Growth Occupations in the Energy Ecosystem
Description
Number of Jobs 2016
Projected Number of Jobs 2025
New Jobs
Created 2016‐2025
Percent of Occupation Currently Employed
Statewide by this Ecosystem
Statewide Annual Job
Openings (2015)1
Estimated Annual Job
Openings2
Oklahoma Median Hourly Earnings
National Median Hourly Earnings Typical Entry Level Education
Annual Educational Completions3
Total Completions
Estimated Completions Available for
This Ecosystem
Welders, Cutters, Solderers, and Brazers
3,623 4,455 832 37.18% 444 165 $18.17 $18.68 High school diploma or Equivalent with Moderate‐term On‐The‐Job Training
1,474 548
Construction Laborers 2,116 2,858 742 10.98% 724 79 $13.41 $15.56 No Formal Educational Credential with
Short‐term On‐The‐Job Training 11 1
Roustabouts, Oil and Gas 4,411 5,169 758 94.70% 214 203 $17.62 $17.93 No Formal Educational Credential with Moderate‐term On‐The‐Job Training
0 0
First‐Line Supervisors of Construction Trades and Extraction Workers
2,428 2,930 502 23.85% 238 57 $26.09 $28.31 High school diploma or Equivalent with
5 years or more experience 678 162
Heavy and Tractor‐Trailer Truck Drivers
2,569 3,074 505 9.63% 708 68 $18.91 $19.32 Postsecondary Non‐degree Award with
Short‐term On‐The‐Job Training 237 23
Rotary Drill Operators, Oil and Gas
2,151 2,616 465 99.16% 151 150 $25.13 $26.26 No Formal Educational Credential with Moderate‐term On‐The‐Job Training
0 0
Operating Engineers and Other Construction Equipment Operators
1,427 1,877 450 21.84% 225 49 $17.79 $22.60 High school diploma or Equivalent with Moderate‐term On‐The‐Job Training
51 11
Service Unit Operators, Oil, Gas, and Mining
3,200 3,647 447 96.92% 194 188 $20.70 $22.04 No Formal Educational Credential with Moderate‐term On‐The‐Job Training
0 0
Petroleum Engineers 2,644 3,056 412 86.81% 152 132 $56.67 $63.94 Bachelor’s Degree 252 219
Industrial Machinery Mechanics
1,359 1,755 396 32.58% 235 77 $22.95 $24.11 High school diploma or Equivalent with
Long‐term On‐The‐Job Training 0 0
Source: EMSI 2017.1
1 “Annual Job Openings” is defined as all positions in this category that become vacant. This includes both newly created jobs as well as positions left vacant through turnover.
2 Estimated Annual Job Openings: Calculated as “Statewide Annual Job Openings (2015)” multiplied by “Percent of Occupation Statewide Employed by this Ecosystem.”
3 Annual Education Completions: “Total Completions” represent the number of graduates of all state educational programs providing training applicable to the occupation. Estimated Completions Available for This Ecosystem” represents the estimated number of graduates that may seek employment specifically in Energy Ecosystem industries. Assuming that graduates are equally distributed among all industries that utilize a particular occupation, “Completions Available for This Ecosystem” is calculated as “Total Completions” multiplied by “Percent of Occupation Statewide Employed by this Ecosystem.”

25
Policy, Research & Economic Analysis www.oklahomaworks.gov
Three occupations in the top 10 growth list for the Energy Ecosystem meet the criteria for
experiencing educational pipeline stress. These include:
Heavy and Tractor‐Trailer Truck Drivers. This occupation requires a Postsecondary Degree
Award as well as short‐term on‐the‐job training. Only 9.6% of truck drivers in this category
are employed within the Energy Ecosystem; most program graduates will be employed in
industries within another key ecosystem or in an industry outside of the defined
ecosystems. Approximately 23 of the 237 statewide graduates would be anticipated to
choose to work in energy‐related industries. Conversely, an estimated 68 of the 700
annual openings statewide would provide employment for those graduates. This results in
a ratio of graduates to job openings of nearly 1:3.
Operating Engineers and Other Construction Equipment Operators. Two training programs
are available to meet the training needs for this profession: 1) Construction/Heavy
Equipment/Earthmoving Equipment Operation, and 2) Construction Trades, General. These
two programs are offered at nine different state Career and Technology Centers. It is
anticipated that there would be approximately 49 openings for this career in the Energy
Ecosystem annually while only 11 completions should be available to fill those jobs.
Industrial Machinery Mechanics. As indicated previously, this job classification is found on
the top 10 growth list as well as the educational pipeline stress list in four of the five key
ecosystems. There is one program available to train for this position, but no graduates
were reported in the last year. Seventy‐seven annual openings are expected for this job
classification within the Energy Ecosystem.
The application of the educational pipeline stress analysis methodology has revealed one unique
characteristic of the Energy Ecosystem. Four of the 10 growth occupations – representing 2,412
positions and 43.8% of all newly created jobs – require no formal educational credential. These
include Roustabouts, Oil and Gas; Rotary Drill Operators, Oil and Gas; Construction Laborers; and
Service Unit Operators, Oil, Gas, and Mining. The demand for each of these occupations is
expected to grow between 14% and 35% by 2025.
For three of these four job classifications, no training programs are available to enhance the skill
levels of workers and better prepare them for their career. Only the classification of Construction
Laborers has an applicable program – titled “Construction Trades, Other” available at ten Career
and Technology Centers and one regional university branch – to train prospective employees in
this field. In 2015, the latest year for which data is available, eleven graduates were reported from
2 Career and Technology Centers; one of those graduates would be anticipated to join the
workforce in the Energy Ecosystem. It must also be noted that, while the training delivered by this
program may provide graduates with an advantage in the hiring process for this position, the
achievement of certification is not required to qualify for employment.
Additional observations regarding the educational pipelines for the top 10 growth occupations in
the Energy Ecosystem:
Four of the 10 are experiencing some level of stress due to an aging workforce. For
example, the classification of Heavy and Tractor‐Trailer Truck Drivers has 30.1% of the

26
Policy, Research & Economic Analysis www.oklahomaworks.gov
workforce over the age of 55 and 57.9% of the workforce over the age of 45. At the same
time, those individuals entering the workforce in this position (age 19‐24) only constitute
3.9% of the workforce. The job classifications of First Line Supervisors of Construction
Trades and Extraction Workers; Operating Engineers and Other Construction Equipment
Operators; and Industrial Machinery Mechanics are all experiencing similar aging workforce
dynamics.
The retirement/entry age breakdown for these occupations is available in Table 4. Since
these positions do not require extended periods of time to complete advanced education,
the comparison is made to individuals in the 19‐24 age range.
Table 4: Aging Workforce Stress on the Energy Ecosystem
Job Classification
Percentage of workforce that is 55 years of age or older
Percentage of workforce that is 45 years of age or older
Percentage of workforce age 19‐24 entering the occupation
Heavy and Tractor‐Trailer Truck Drivers
30.1% 57.9% 3.9%
First‐Line Supervisors of Construction Trades and Extraction Workers
26.7% 54.4% 2.5%
Operating Engineers and Other Construction Equipment Operators
25.8% 53.0% 6.1%
Industrial Machinery Mechanics 25.6% 53.8% 4.9%
Source: EMSI 2017.1
For the top 10 growth occupations in the Energy Ecosystem, there remains competition for
Oklahoma graduates based upon salary. Colorado median wages are higher for all 10 of
the growth occupations; Texas wages are higher than Oklahoma’s on 7 out of 10. Five of
the 10 occupations experience salary differentials in excess of 15%. For each of these
occupations, the increase in wage exceeds the cost of living differential for the applicable
state:
o Operating Engineers and Other Construction Equipment Operators – 35% increase in
salary in the state of Missouri when compared with Oklahoma. The increased cost
of living in Missouri is only projected statewide at 5.5% making relocation to
Missouri attractive to qualified job applicants.

27
Policy, Research & Economic Analysis www.oklahomaworks.gov
o Construction Laborers – 33% increase in median wages in Missouri at $17.93 per
hour.
o Petroleum Engineers – 24% increase in salary in Texas, with median wages of
$70.26 per hour.
o Welders, Cutters, Solderers, and Brazers – 18.9% increase in salary in New Mexico,
with median wages of $21.60.
o First‐Line Supervisors of Construction trades and Extraction Workers – 18.8%
increase in salary in Colorado.
18.8%
6.9%
2.8%
5.5%
5.5%
18.8%
18.9%
24.0%
33.0%
35.0%
First Line Supervisors of ConstructionTrades and Extraction Workers
Welders, Cutters, Solderers,and Brazers
Petroleum Engineers
Construction Laborers
Operating Engineers andOther Construction Equipment
Operators
Earnings and Cost of Living DifferentialsCompared to Oklahoma for the Energy Ecosystem
Median Hourly Earnings Differential Cost of Living Differential
Missouri
Missouri
Texas
New Mexico
Colorado
28
Policy, Research & Economic Analysis www.oklahomaworks.gov
INFORMATION AND FINANCE ECOSYSTEM
Gap Analysis
Over 105,200 jobs were associated with industries in the Information and Finance Ecosystem in
2016. This figure represents 5.9% of Oklahoma’s total workforce. By 2025, this figure is expected
to grow by a net 6,200 jobs to 111,484, reflecting a 5.9% growth rate. More than 7,700 new jobs
will be created. Thirty‐seven occupational classifications will experience a decrease in the number
of jobs available – a total loss of 1,485 positions. The position of Claims Adjusters, Examiners, and
Investigators accounts for 268 of those lost positions, a decline of 17% in the employment in that
occupational code within the ecosystem. Likewise, the number of Electronics Engineers positions
is projected to diminish by 29%, a loss of 141 jobs overall. In contrast, the highest ranking job
growth position is that of Accountants and Auditors, an occupational classification that is expected
to grow 19% by 2025, adding 1,527 jobs to the industries represented in the Information and
Finance Ecosystem.
As the occupational needs of the ecosystem’s industries change, so too do the educational
requirements of the individuals employed. The minimum educational requirements for jobs within
Information and Finance Ecosystem industries are anticipated to shift drastically toward the need
for college degrees over the next nine years. By 2025, 46% of all jobs and 71% of all newly created
jobs within the ecosystem will require a Bachelor’s Degree. A high school diploma will only qualify
an applicant for 15% of newly created jobs and an Associate Degree or Career and Technology
Certificate will only meet the minimum qualifications for 14% of the same job pool. For all jobs in
2025, 71% will require some level of certification or degree above a high school diploma. These
projections indicate that, without intervention, Oklahoma will face a 31% skills gap in meeting the
needs of Information and Finance Ecosystem industries in less than a decade.

29
Policy, Research & Economic Analysis www.oklahomaworks.gov
Source: EMSI 2017.1
Educational Pipeline Analysis
Four of the top 10 growth occupations in the Information and Finance Ecosystem specialize in
financial functions: 1) Accountants and Auditors; 2) Loan Officers; 3) Loan Interviewers and Clerks;
and, 4) Financial Managers. The remaining six job classifications are computer‐oriented, including
a variety of software developers, information systems managers, and computer support specialists.
These top 10 growth occupations are predicted to generate 4,322 new jobs by 2025 – 56% of the
anticipated new job growth among the ecosystem’s industries. In 2016, these occupations
accounted for nearly 26% of the total number of individuals employed within the ecosystem.
Overall, salaries for this set of occupations are high. Only two occupations – Loan Interviewers and
Clerks, and Computer User Support Specialists – exhibit salaries below $20 per hour median
earnings. Incumbents in five of the ten occupations earn a median hourly wage of over $30 per
hour and up to $46 per hour. The Information and Finance Ecosystem list of top 10 growth
occupations and several key demographics of those positions are presented in the following Table
5.
29%
15%
46%
24%
14%
30%
46%
71%
16%
1%
8%
0% 10% 20% 30% 40% 50% 60% 70% 80% 90% 100%
2025 Total Jobs
2025 New Jobs
2016 Attainment
Oklahoma's Workforce Gap ‐ Information and Finance Ecosystem
High School or Less Associates/Certificate/Credential Bachelor's Degree Graduate Degree

30
Policy, Research & Economic Analysis www.oklahomaworks.gov
Table 5: Top 10 Growth Occupations in the Information and Finance Ecosystem
Description
Number of Jobs 2016
Projected Number of Jobs 2025
New Jobs Created 2016‐2025
Percent of Occupation Currently Employed
Statewide by this
Ecosystem
Statewide Annual Job Openings (2015)1
Estimated Annual Job Openings2
Oklahoma Median Hourly Earnings
National Median Hourly Earnings
Typical Entry Level Education
Annual Educational Completions3
Total Completions
Estimated Completions Available for
This Ecosystem
Accountants and Auditors 7,852 9,379 1,527 47.35% 742 351 $27.43 $32.40 Bachelor’s Degree 857 406
Software Developers, Applications
2,447 2,940 493 57.43% 141 81 $36.44 $47.68 Bachelor’s Degree 591 339
Loan Officers 3,918 4,386 468 89.37% 136 122 $27.55 $31.32 Bachelor’s Degree with Moderate On‐The‐Job
Training 574 513
Loan Interviewers and Clerks 3,236 3,613 377 89.96% 105 94 $14.85 $18.48 High school diploma or Equivalent with Short‐
term On‐The‐Job Training 3 3
Computer Systems Analysts 1,441 1,791 350 43.85% 124 54 $34.50 $41.41 Bachelor’s Degree 970 425
Web Developers 650 893 243 49.14% 60 29 $22.80 $29.68 Associate Degree 1,563 768
Computer User Support Specialists
2,361 2,602 241 30.10% 183 55 $19.95 $23.80 Some College, No Degree 800 241
Computer and Information Systems Manager
1,227 1,444 217 40.03% 81 32 $46.02 $63.28 Bachelor’s Degree with 5 years or more experience
873 349
Financial Managers 2,921 3,127 206 45.55% 226 103 $41.06 $57.13 Bachelor’s Degree with 5 years or more experience
621 283
Software Developers, Systems Software
1,138 1,338 200 53.13% 67 36 $33.96 $51.08 Bachelor’s Degree 619 329
Source: EMSI 2017.1
1 “Annual Job Openings” is defined as all positions in this category that become vacant. This includes both newly created jobs as well as positions left vacant through turnover.
2 Estimated Annual Job Openings: Calculated as “Statewide Annual Job Openings (2015)” multiplied by “Percent of Occupation Statewide Employed by this Ecosystem.”
3 Annual Education Completions: “Total Completions” represent the number of graduates of all state educational programs providing training applicable to the occupation. Estimated Completions Available for This Ecosystem” represents the estimated number of graduates that may seek employment specifically in Information and Finance Ecosystem industries. Assuming that graduates are equally distributed among all industries that utilize a particular occupation, “Completions Available for This Ecosystem” is calculated as “Total Completions” multiplied by “Percent of Occupation Statewide Employed by this Ecosystem.”

31
Policy, Research & Economic Analysis www.oklahomaworks.gov
There are no occupations in the Information and Finance Ecosystem that clearly meet the criteria
to be considered as stressed with regard to the educational pipeline. One occupation, Loan
Interviewers and Clerks, is noted as offering an estimated 94 job openings with only 3 program
graduates. That said, however, the minimum entry level education for Loan Interviewers and
Clerks is the possession of a high school diploma or the equivalent and subsequent short‐term on‐
the‐job training. As a result, postsecondary education is not mandatory to obtain the job. While
the program offered by several Career and Technology Centers in Oklahoma – called “Banking and
Financial Support Services” – may provide additional advantage to graduates as they are
considered for hire, the higher educational level is not required and therefore cannot be
considered an educational pipeline stress point.
Based solely upon the data examined for this analysis, the greatest threat to the ability to fill most
of the top 10 growth jobs in Information and Finance Ecosystem industries is rooted in wage
disparity. According to the Bureau of Labor Statistics:
Oklahoma offers the lowest wage for four of the top 10 growth occupations in the region.
o Accountants and Auditors: Oklahoma median hourly salary is $27.43. Texas offers
the highest median hourly salary at $33.38 per hour, an increase of 22%. The cost
of living increase in Texas as compared with Oklahoma is only 2.8%.
o Software Developers, Applications: Oklahoma median hourly salary for this position
is $36.44. Of the six comparison states, Colorado offers the highest median hourly
wage at $49.13 per hour, an increase of 35%. The cost of living increase in
Colorado as compared with Oklahoma is 18.8%.
o Web Developers: Oklahoma median hourly wage is $23.39. The highest median
hourly wage in
the region is
paid in Texas at
$31.65 per
hour. This is
an increase of
35%. While
there is a
tremendous
disparity in
wages for this
position
between
Oklahoma and
Texas, possibly enticing Oklahoma graduates to move out of state, the job
classification of Web Developers is oversaturated with 1,563 graduates available to
fill 60 positions annually statewide. For the Information and Finance Ecosystem,
there are estimated to be 768 graduates available to fill 29 positions annually; a
ratio of over 26 graduates for each job opening.
2.8%
18.8%
2.8%
18.8%
22.0%
35.0%
35.0%
54.0%
Accounts and Auditors
Software Developers,Applications
Web Developers
Computer and Information Systems Managers
Earnings and Cost of Living DifferentialsCompared to Oklahoma ‐ Information and Finance
Median Hourly Earnings Differential Cost of Living Differential
Colorado
Colorado
Texas
Texas

32
Policy, Research & Economic Analysis www.oklahomaworks.gov
o Computer and Information Systems Managers: The Oklahoma median hourly salary
is $45.79. The highest median hourly wage offered for this position in the region is
available in Colorado at $70.42 per hour. This is an increase of 54%.
For five of the remaining occupational classifications, only one state offers lower median
hourly wages than Oklahoma. The Oklahoma wage for the final occupation in the list of top
10 growth jobs is lower than four of the six contiguous states.
With regard to the age distribution of individuals in occupations identified as the top 10 growth
jobs in the Information and Finance Ecosystem, none exhibit inordinately high levels of anticipated
retirements. Two occupations, Accountants and Auditors, and Financial Managers, average over
20% in the “Over 55 Years of Age” group at 28.7% and 24.1% respectively. At the same time,
however, a relatively equal percentage of individuals in these two job classifications are under the
age of 34, providing assurances that successors to the potential retirees are already in the pipeline.

33
Policy, Research & Economic Analysis www.oklahomaworks.gov
TRANSPORTATION AND DISTRIBUTION ECOSYSTEM
Gap Analysis
In 2016, industries included in the Transportation and Distribution Ecosystem reported 121,258
jobs; more than any other ecosystem. This figure represents 6.7% of Oklahoma’s total workforce.
By 2025, this figure is expected to grow by a net 5,778 jobs to 127,036, reflecting a 4.8% growth
rate. Nearly 7,600 new jobs will be created. Seventy‐one occupational classifications will
experience a decrease in the number of jobs available – a total loss of 1,817 positions. For the
most part, these job losses will occur in occupations that are not critical to the continuation of the
industry. As an example, the classification of Engine and Other Machine Assemblers is expected to
experience a decrease of 13% ‐‐ a loss of 19 jobs overall – but that classification only represents
0.1% of all jobs in the ecosystem. Likewise, the classification of Fiberglass Laminators and
Fabricators will lose 18% (7 jobs overall) but represents 0.0% of all jobs. Conversely, Laborers and
Freight, Stock, and Material Movers, Hand, a position representing 7.4% of all jobs in the
ecosystem, will increase by 10%, adding 865 newly created positions by 2025.
As the occupational needs of the ecosystem’s industries change, so too do the educational
requirements of the individuals employed. The minimum educational requirements for jobs within
Transportation and Distribution Ecosystem industries are anticipated to shift toward a greater
need for CareerTech Certifications and/or Associate Degrees. By 2025, 47% of all jobs and 37% of
all newly created jobs within the ecosystem will require these credentials. Since many of the
positions within this ecosystem remain physical‐labor oriented, a high school diploma will still
qualify an applicant for 46% of newly created jobs. For all jobs in 2025, 63% will require some level
of certification or degree above a high school diploma. The requirement for a graduate degree or
higher is only required for 109 of the 127,036 projected jobs in 2025 – the least of any of the
ecosystems.
These projections indicate that, without intervention, Oklahoma will face a 7% skills gap in meeting
the needs of Transportation and Distribution Ecosystem industries in less than a decade.

34
Policy, Research & Economic Analysis www.oklahomaworks.gov
Source: EMSI 2017.1
Educational Pipeline Analysis
The top 10 growth occupations in this ecosystem are predicted to generate 3,755 new jobs by 2025
– 49% of the anticipated new job growth among the ecosystem’s industries. In 2016, these
occupations accounted for over 29% of the total number of individuals employed within the
ecosystem. Unfortunately, while these job classifications are often critical to the industry, they
also require low levels of education/training and earn lower median wages. The position of
Laborers and Freight, Stock, and Material Movers, Hand is such an example. The classification
composes 7.4% of all jobs in the industry, but requires no formal educational credential with some
short‐term on‐the‐job training and earns a median hourly wage of $12.47. Six of the 10
occupations earn median wages of $15 per hour or less. Only two of the 10 require a Bachelor’s
Degree. Three job classifications require high school diplomas while four can be obtained with no
formal educational credential. These figures emphasize the human physical‐labor orientation of
many of the occupations within the Transportation and Distribution Ecosystem.
37%
46%
46%
47%
37%
30%
15%
18%
16% 8%
0% 10% 20% 30% 40% 50% 60% 70% 80% 90% 100%
2025 Total Jobs
2025 New Jobs
2016 Attainment
Oklahoma's Workforce Gap ‐ Transporation and Distribution Ecosystem
High School or Less Associate/Certificate/Credential Bachelor's Degree Graduate Degree
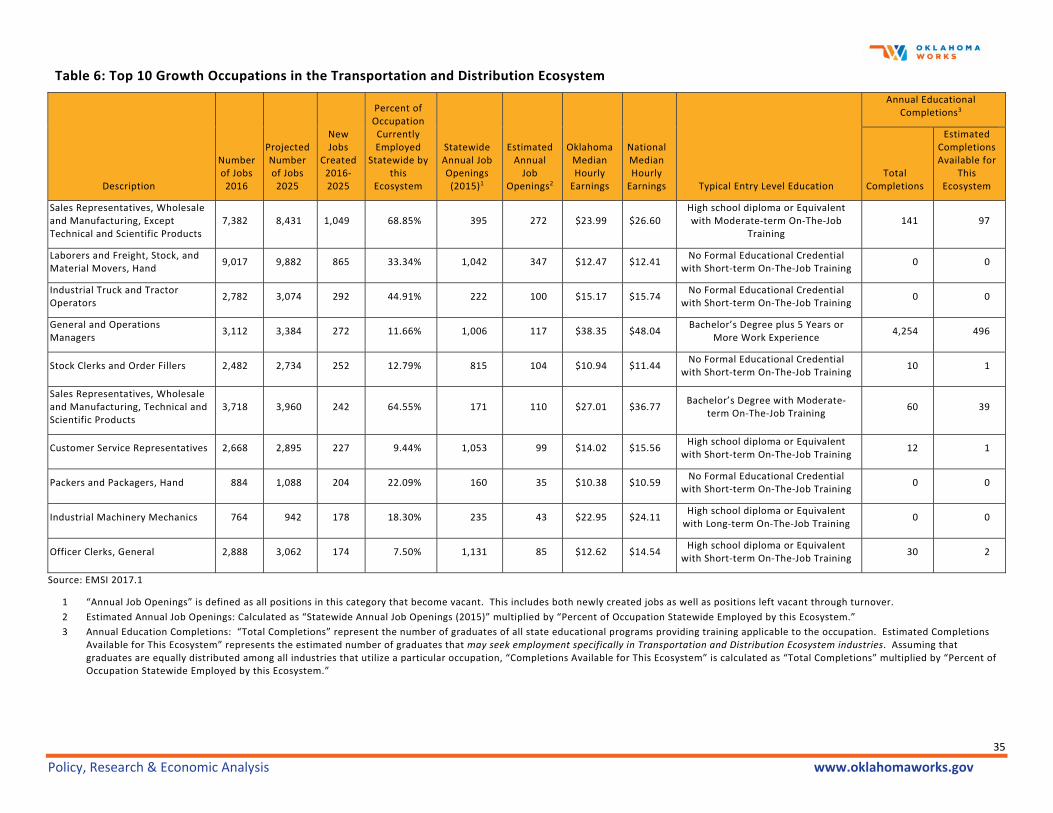
35
Policy, Research & Economic Analysis www.oklahomaworks.gov
Table 6: Top 10 Growth Occupations in the Transportation and Distribution Ecosystem
Description
Number of Jobs 2016
Projected Number of Jobs 2025
New Jobs
Created 2016‐2025
Percent of Occupation Currently Employed
Statewide by this
Ecosystem
Statewide Annual Job Openings (2015)1
Estimated Annual Job
Openings2
Oklahoma Median Hourly Earnings
National Median Hourly Earnings Typical Entry Level Education
Annual Educational Completions3
Total Completions
Estimated Completions Available for
This Ecosystem
Sales Representatives, Wholesale and Manufacturing, Except Technical and Scientific Products
7,382 8,431 1,049 68.85% 395 272 $23.99 $26.60 High school diploma or Equivalent with Moderate‐term On‐The‐Job
Training 141 97
Laborers and Freight, Stock, and Material Movers, Hand
9,017 9,882 865 33.34% 1,042 347 $12.47 $12.41 No Formal Educational Credential
with Short‐term On‐The‐Job Training 0 0
Industrial Truck and Tractor Operators
2,782 3,074 292 44.91% 222 100 $15.17 $15.74 No Formal Educational Credential
with Short‐term On‐The‐Job Training 0 0
General and Operations Managers
3,112 3,384 272 11.66% 1,006 117 $38.35 $48.04 Bachelor’s Degree plus 5 Years or
More Work Experience 4,254 496
Stock Clerks and Order Fillers 2,482 2,734 252 12.79% 815 104 $10.94 $11.44 No Formal Educational Credential
with Short‐term On‐The‐Job Training 10 1
Sales Representatives, Wholesale and Manufacturing, Technical and Scientific Products
3,718 3,960 242 64.55% 171 110 $27.01 $36.77 Bachelor’s Degree with Moderate‐
term On‐The‐Job Training 60 39
Customer Service Representatives 2,668 2,895 227 9.44% 1,053 99 $14.02 $15.56 High school diploma or Equivalent
with Short‐term On‐The‐Job Training 12 1
Packers and Packagers, Hand 884 1,088 204 22.09% 160 35 $10.38 $10.59 No Formal Educational Credential
with Short‐term On‐The‐Job Training 0 0
Industrial Machinery Mechanics 764 942 178 18.30% 235 43 $22.95 $24.11 High school diploma or Equivalent with Long‐term On‐The‐Job Training
0 0
Officer Clerks, General 2,888 3,062 174 7.50% 1,131 85 $12.62 $14.54 High school diploma or Equivalent
with Short‐term On‐The‐Job Training 30 2
Source: EMSI 2017.1
1 “Annual Job Openings” is defined as all positions in this category that become vacant. This includes both newly created jobs as well as positions left vacant through turnover.
2 Estimated Annual Job Openings: Calculated as “Statewide Annual Job Openings (2015)” multiplied by “Percent of Occupation Statewide Employed by this Ecosystem.”
3 Annual Education Completions: “Total Completions” represent the number of graduates of all state educational programs providing training applicable to the occupation. Estimated Completions Available for This Ecosystem” represents the estimated number of graduates that may seek employment specifically in Transportation and Distribution Ecosystem industries. Assuming that graduates are equally distributed among all industries that utilize a particular occupation, “Completions Available for This Ecosystem” is calculated as “Total Completions” multiplied by “Percent of Occupation Statewide Employed by this Ecosystem.”

36
Policy, Research & Economic Analysis www.oklahomaworks.gov
Four of the top 10 growth jobs in the Transportation and Distribution Ecosystem require no formal
educational credential, relying on on‐the‐job training to prepare employees to perform their
duties. These include: 1) Laborers and Freight, Stock, and Material Movers, Hand; 2) Industrial
Truck and Tractor Operators; 3) Stock Clerks and Order Fillers; and 4) Packers and Packagers, Hand.
As a result of these low entry‐level requirements, only one of the four (Stock Clerks and Order
Fillers) has an associated post‐secondary program in the state of Oklahoma producing 10 graduates
per year. Since these positions can be filled from the general population with little to no
educational background, there is no applicable educational pipeline.
Two positions, those of Customer Service Representative and Office Clerks, General, require a high
school diploma, though both rely upon short‐term on‐the‐job training for developing staff to fulfill
their duties. There is one educational program for each of these job classifications that can
produce graduates more highly skilled than the entry level expectation. For the customer service
position, this program is called Customer Service Support/Call Center/Teleservice Operation and is
offered only at Francis Tuttle Technology Center located in Oklahoma City. The educational
program applicable to the office clerk position is called General Office Occupations and Clerical
Services. This program is available at four Career and Technology Centers and three regional
colleges statewide. While these programs, in combination, produce fewer graduates than
necessary to fill anticipated job openings, the educational level they provide is not required to
meet minimum requirements for jobs in these two classifications. As a result, there is no stress on
the educational pipeline.
Three of the top 10 growth jobs do show characteristics of educational pipeline stress. These
include the following:
Sales Representatives, Wholesale and Manufacturing, Except Technical and Scientific
Products;
Sales Representatives, Wholesale and Manufacturing, Technical and Scientific Products;
and,
Industrial Machinery Mechanics.
Sales representatives, both those who market technical or scientific products and those who
market non‐technical/scientific products, earn relatively high median hourly wages. For those
marketing non‐technical items, the median wage in Oklahoma is $23.99 per hour. If an individual
markets technical products, the median wage rises to $27.01. This increase in wage reflects the
higher educational requirement of a Bachelor’s Degree for the marketing of technical products
versus a high school diploma for the marketing of non‐technical items.
Six programs are available to train individuals who wish to be a sales representative of non‐
technical products in this ecosystem:
Business Management, Marketing, and Related Support Services, Other;
Apparel and Accessories Marketing Operations;
Fashion Merchandising;
Special Products Marketing Operations;

37
Policy, Research & Economic Analysis www.oklahomaworks.gov
General Merchandising, Sales, and Related Marketing Operations; and,
Sales, Distribution, and Marketing Operations, General.
These six programs, available at Career and Technology Centers and regional universities state‐
wide, produce an estimated 97 graduates annually available to fill 272 job openings in this job
classification in the Transportation and Distribution Ecosystem.
Only two programs are available to train individuals for the position of sales representatives
marketing technical or scientific products. These include 1) Business, Management, Marketing,
and Related Support Services, Other, and 2) Selling Skills and Sales Operations. Since the entry
level educational requirements for this position are possession of a Bachelor’s Degree, only six
institutions provide this training state‐wide. A lower level of training in these two subjects is
available at numerous Career and Technology Centers as well as regional universities in Oklahoma
offering either Certification or an Associate Degree, but it is presumed that the graduates from
these courses would not be qualified for this particular position. As a result, only 39 graduates are
produced annually to fill an expected 110 job vacancies.
The position of Industrial Machinery Mechanic has been addressed in this report in relation to
three other ecosystems which employ individuals in this same job classification. Over 18% of all
Industrial Machine Mechanics are employed in the Transportation and Distribution Ecosystem.
There is one program available to contribute graduates to filling this job – Industrial Mechanics
and Maintenance Technology, offered by six Career and Technology Centers statewide – but the
program produced no graduates in the last year reported (2015) and only one graduate in 2014.
With an anticipated 43 annual job openings, this occupation is experiencing educational pipeline
stress.
Additional observations regarding the positions on the top 10 growth jobs in the Transportation
and Distribution Ecosystem:
Sales Representatives, Wholesale and Manufacturing, Technical and Scientific Products, in
addition to experiencing educational pipeline stress, is further challenged by comparatively
low wages in Oklahoma versus the region. The median hourly earnings for this position
range from $27.01 in Oklahoma to $46.82 per hour in Colorado. While the cost of living in
Colorado is 18.8% higher than in Oklahoma, the wage disparity is over 73%, making it
attractive for these individuals to relocate to that state. Of the six contiguous states
utilized for wage comparison in this study, the increase in wage over that earned in
Oklahoma, is sufficient to overcome the difference in cost of living for all states except
New Mexico.
Only Arkansas and New Mexico consistently offer lower wages for the top 10 growth
positions in the ecosystem as compared with Oklahoma. Colorado, Kansas and Missouri
offer higher median hourly wages for nine out of the 10 positions. Texas offers higher
wages for seven of the 10.
In five of the 10 positions, approximately 25% of the workforce is age 55 or over. These
positions include Sales Representatives (both for technical/scientific products and non‐
technical/scientific products); General and Operations Managers; Industrial Machinery

38
Policy, Research & Economic Analysis www.oklahomaworks.gov
Mechanics; and Office Clerks, General. These figures would normally be examined as
indicators of an aging workforce; however, to counter this concern, the age distributions
for occupations in this ecosystem appear relatively level. For example, for sales
representatives (non‐technical/scientific), the percentage of individuals 55 years of age or
over is 26.9%. However, 20.9% are between 25 and 34 years of age; 23.3% are between
the ages of 35 and 44; and 24.5% are between 45 and 54 years old. This consistency
mitigates concern regarding vacancies left by an aging workforce anticipated to retire
within the next decade.

39
Policy, Research & Economic Analysis www.oklahomaworks.gov
Conclusion
The state of Oklahoma has identified five key, in demand, industry sectors, called “ecosystems”
which provide the state with a competitive advantage in a global economy. The ecosystems are
characterized by a potential for employment growth and the ability to provide wealth generating
employment opportunities. These five key ecosystems include Aerospace & Defense; Agriculture
and Biosciences; Energy; Information and Financial Services; and Transportation and Distribution.
This analysis sought to examine the occupations central to each of these ecosystems and to
quantify any identified gaps that may develop between the current 2016 and the anticipated 2025
workforces. To accomplish this analysis, two unique but complementary methodologies were
applied to data for each ecosystem: a skills gap analysis and an educational pipeline analysis.
Additional analyses regarding wages and workforce age distribution were applied as needed.
Within the narrow scope of this study, a number of varied and unique challenges have been
identified for the industries within each ecosystem. The Aerospace and Defense Ecosystem and
the Information and Finance Ecosystem both face significant gaps, at 35% and 31% respectively, in
meeting the educational attainment requirements necessary for new jobs in 2025. Total
employment in the Agriculture and Biosciences Ecosystem is expected to decline by nearly 1,000
jobs during the same period. The workforce associated with the Energy Ecosystem is rapidly aging,
with more than 50% of workers in critical positions over the age of 45. And while the
Transportation and Distribution Ecosystem faces little challenge in obtaining qualified workers, the
competition for wages from other states has significant potential to impact the ability to fill
positions in those industries. Further consideration of these challenges, and additional studies to
identify new concerns, may lead to strategic solutions, enhancing Oklahoma’s success in building
wealth generating employment opportunities for all of its citizens.
This analysis was developed by the Oklahoma Office of Workforce Development Labor Market Analyst. For questions
regarding the analysis or for additional information, please contact Sandi Wright, 405‐945‐9198 or