Economy at a glance: Calgary’s advantages · Economy at a glance: Calgary’s advantages ......
58
August 2013 Slide 1 Economy at a glance: Calgary’s advantages August 2013
Transcript of Economy at a glance: Calgary’s advantages · Economy at a glance: Calgary’s advantages ......
August 2013
Slide 1
Economy at a glance: Calgary’s advantages
August 2013
August 2013
Slide 2
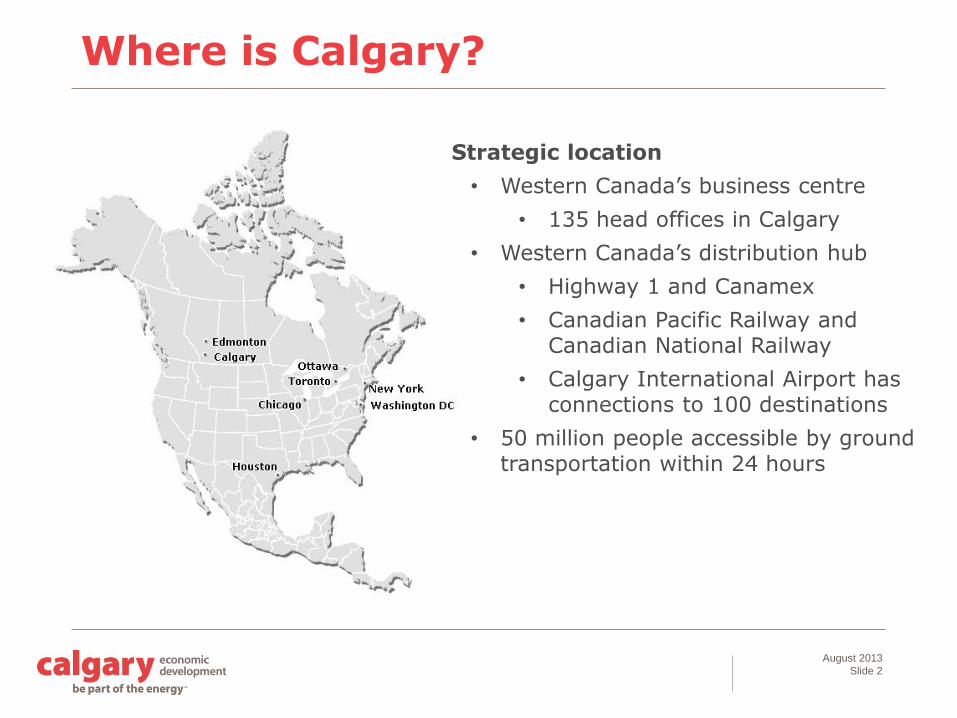
Where is Calgary?
Strategic location
• Western Canada’s business centre
• 135 head offices in Calgary
• Western Canada’s distribution hub
• Highway 1 and Canamex
• Canadian Pacific Railway and Canadian National Railway
• Calgary International Airport has connections to 100 destinations
• 50 million people accessible by ground transportation within 24 hours
August 2013
Slide 3
About Calgary Economic Development
• Promotional agency
• Lead economic development agency
• Non-profit organization
• Arms length to City of Calgary; Funded via grant from council
• Mandated to support / connect business
• Business expansion, investment and attraction
• Trade development
• Workforce development
• Research and information

August 2013
Slide 4
10-year Economic Development Strategy
A strategy to make a global city – competitive, successful and unique
Focus on People and Community
• Educate and exchange
• Remove barriers to meaningful employment
• Enhance the city’s sense of place and experience
Focus on Business and Enterprise
• Strategically develop Calgary’s economy
• Provide smart infrastructure
• Create an environment for smart ideas and innovation
Focus on International Reach
• Promote the Calgary brand and identity
• Diversify tourism and convention activity
• Enhance international business development and connections
August 2013
Slide 5
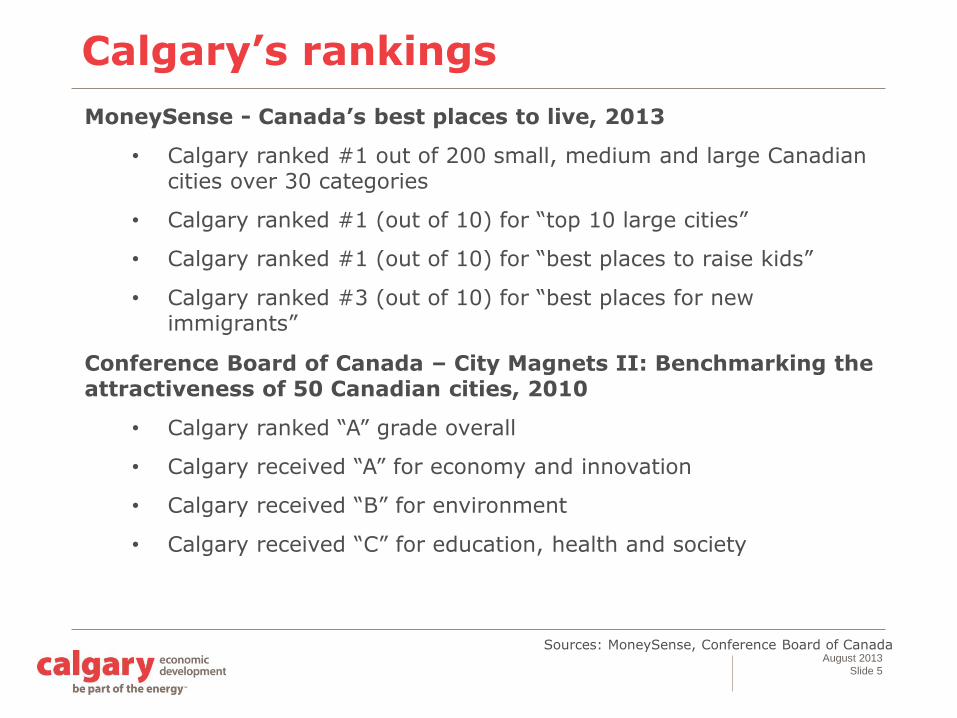
Sources: MoneySense, Conference Board of Canada
Calgary’s rankings
MoneySense - Canada’s best places to live, 2013
• Calgary ranked #1 out of 200 small, medium and large Canadian cities over 30 categories
• Calgary ranked #1 (out of 10) for “top 10 large cities”
• Calgary ranked #1 (out of 10) for “best places to raise kids”
• Calgary ranked #3 (out of 10) for “best places for new immigrants”
Conference Board of Canada – City Magnets II: Benchmarking the attractiveness of 50 Canadian cities, 2010
• Calgary ranked “A” grade overall
• Calgary received “A” for economy and innovation
• Calgary received “B” for environment
• Calgary received “C” for education, health and society
August 2013
Slide 6
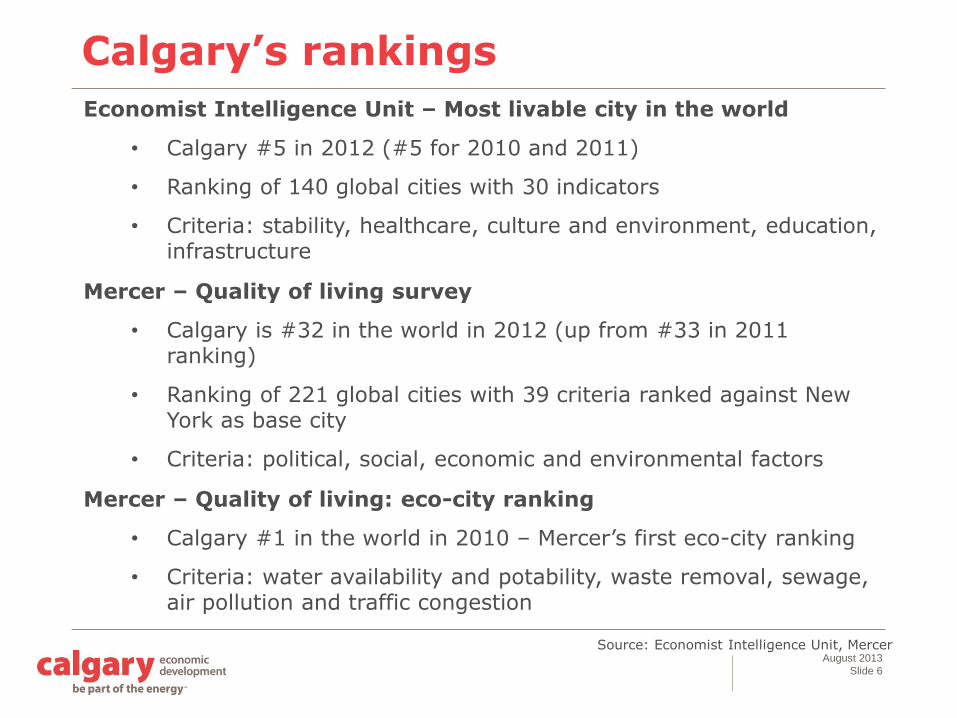
Source: Economist Intelligence Unit, Mercer
Calgary’s rankings
Economist Intelligence Unit – Most livable city in the world
• Calgary #5 in 2012 (#5 for 2010 and 2011)
• Ranking of 140 global cities with 30 indicators
• Criteria: stability, healthcare, culture and environment, education, infrastructure
Mercer – Quality of living survey
• Calgary is #32 in the world in 2012 (up from #33 in 2011 ranking)
• Ranking of 221 global cities with 39 criteria ranked against New York as base city
• Criteria: political, social, economic and environmental factors
Mercer – Quality of living: eco-city ranking
• Calgary #1 in the world in 2010 – Mercer’s first eco-city ranking
• Criteria: water availability and potability, waste removal, sewage, air pollution and traffic congestion
August 2013
Slide 7
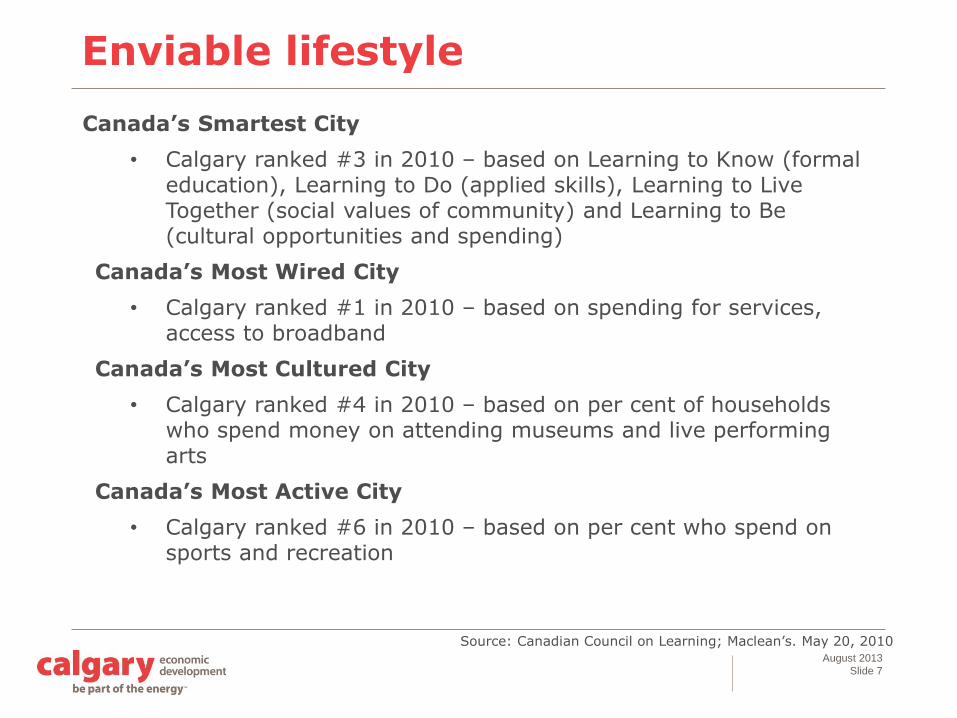
Source: Canadian Council on Learning; Maclean’s. May 20, 2010
Enviable lifestyle
Canada’s Smartest City
• Calgary ranked #3 in 2010 – based on Learning to Know (formal education), Learning to Do (applied skills), Learning to Live Together (social values of community) and Learning to Be (cultural opportunities and spending)
Canada’s Most Wired City
• Calgary ranked #1 in 2010 – based on spending for services, access to broadband
Canada’s Most Cultured City
• Calgary ranked #4 in 2010 – based on per cent of households who spend money on attending museums and live performing arts
Canada’s Most Active City
• Calgary ranked #6 in 2010 – based on per cent who spend on sports and recreation
August 2013
Slide 8
Enviable lifestyle
A focus on family and a sense of community
• Calgary schools consistently top performers in Alberta
• Boasts one of the most successful transit systems in the world (ridership of 94.4 million; 4,205 route kilometres)
• 55 per cent of Albertans volunteer -- higher than the national average of 47 per cent (2010)
• Calgary had second highest median charitable donation for 2011 among Canadian CMAs at $400
August 2013
Slide 9
Enviable lifestyle
Active and healthy lifestyle
• An hour’s drive to spectacular Banff and the Rocky Mountains
• The most extensive urban pathway and bikeway system in North America (700 km along rivers; 290 km on-street bikeways)
• World-class attractions and sporting amenities, including: Calgary Stampede, Calgary Zoo, WinSport Canada’s Canada Olympic Park, National Sports Hall of Fame, Telus Spark
• Abundant green space and parks (3,000 sites)
• A community rich in the arts, culture, entertainment and leisure activities and venues

August 2013
Slide 10
Source: “World Capitals of the Future”, Forbes, September 3, 2009
Rankings
World Capitals of the Future / World’s Fastest Growing Cities
• Forbes Magazine listed Calgary as one of the “world capitals of the future” – one of the “emerging global cities” (2009)
• Forbes Magazine ranked Calgary as one of North America’s fastest-growing cities (2010)
• Reasons:
• Calgary is center of Canada’s powerful energy industry
• Calgary has lower taxes and less stringent regulations
• Calgary has room to grow
• Calgary has better housing price-to-income ratio than many Canadian cities
August 2013
Slide 11
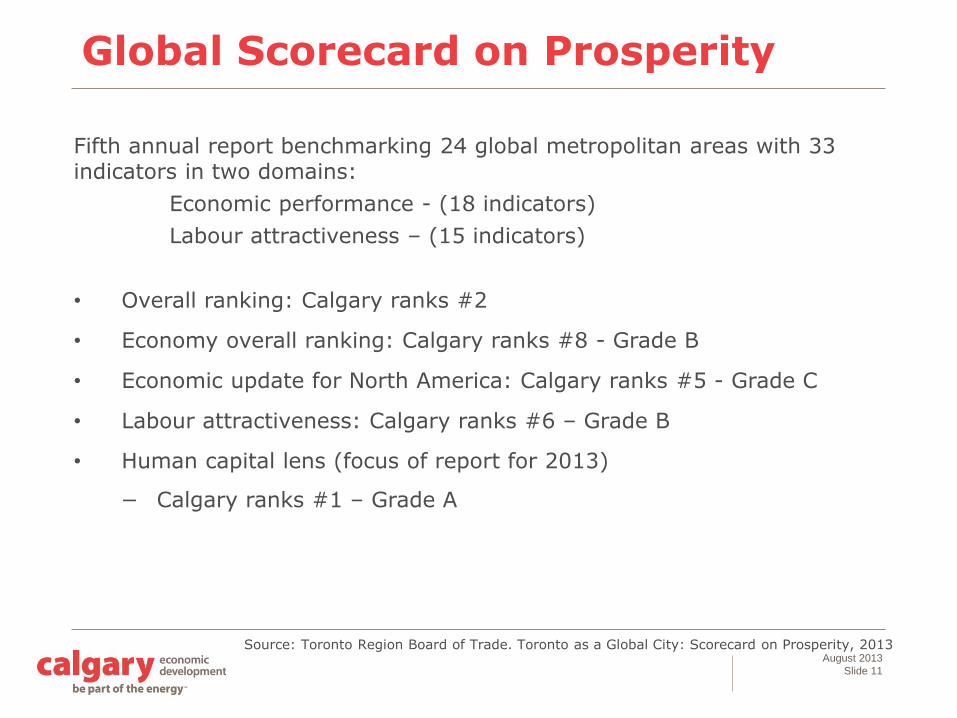
Global Scorecard on Prosperity
Fifth annual report benchmarking 24 global metropolitan areas with 33 indicators in two domains:
Economic performance - (18 indicators)
Labour attractiveness – (15 indicators)
• Overall ranking: Calgary ranks #2
• Economy overall ranking: Calgary ranks #8 - Grade B
• Economic update for North America: Calgary ranks #5 - Grade C
• Labour attractiveness: Calgary ranks #6 – Grade B
• Human capital lens (focus of report for 2013)
− Calgary ranks #1 – Grade A
Source: Toronto Region Board of Trade. Toronto as a Global City: Scorecard on Prosperity, 2013
August 2013
Slide 12
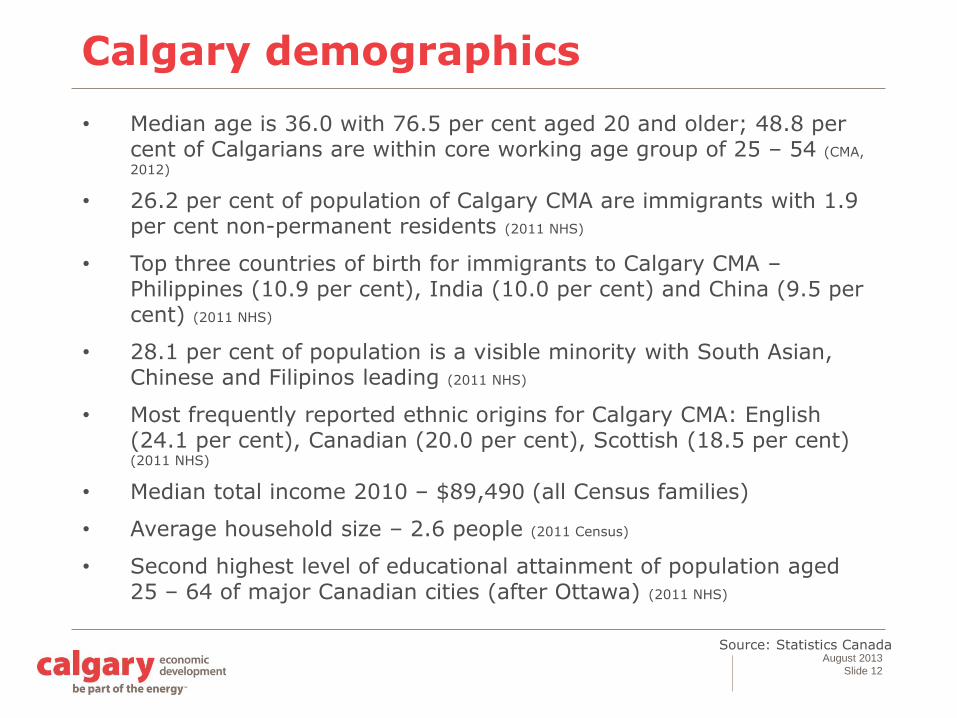
Calgary demographics
• Median age is 36.0 with 76.5 per cent aged 20 and older; 48.8 per cent of Calgarians are within core working age group of 25 – 54 (CMA,
2012)
• 26.2 per cent of population of Calgary CMA are immigrants with 1.9 per cent non-permanent residents (2011 NHS)
• Top three countries of birth for immigrants to Calgary CMA –Philippines (10.9 per cent), India (10.0 per cent) and China (9.5 per cent) (2011 NHS)
• 28.1 per cent of population is a visible minority with South Asian, Chinese and Filipinos leading (2011 NHS)
• Most frequently reported ethnic origins for Calgary CMA: English (24.1 per cent), Canadian (20.0 per cent), Scottish (18.5 per cent) (2011 NHS)
• Median total income 2010 – $89,490 (all Census families)
• Average household size – 2.6 people (2011 Census)
• Second highest level of educational attainment of population aged 25 – 64 of major Canadian cities (after Ottawa) (2011 NHS)
Source: Statistics Canada
August 2013
Slide 13
Source: Statistics Canada, Conference Board of Canada
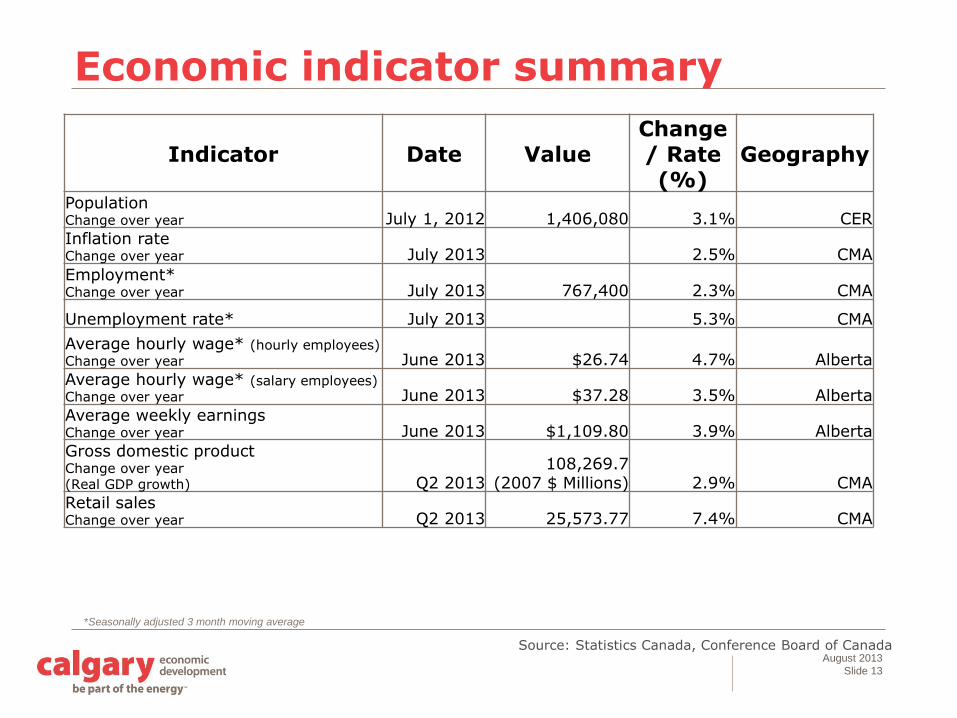
Economic indicator summary
*Seasonally adjusted 3 month moving average
Indicator Date ValueChange / Rate (%)
Geography
PopulationChange over year July 1, 2012 1,406,080 3.1% CER
Inflation rate Change over year July 2013 2.5% CMA
Employment*Change over year July 2013 767,400 2.3% CMA
Unemployment rate* July 2013 5.3% CMA
Average hourly wage* (hourly employees)
Change over year June 2013 $26.74 4.7% Alberta
Average hourly wage* (salary employees)
Change over year June 2013 $37.28 3.5% Alberta
Average weekly earningsChange over year June 2013 $1,109.80 3.9% Alberta
Gross domestic productChange over year (Real GDP growth) Q2 2013
108,269.7(2007 $ Millions) 2.9% CMA
Retail sales Change over year Q2 2013 25,573.77 7.4% CMA
August 2013
Slide 14
Source: Statistics Canada, Alberta Advanced Education and Technology
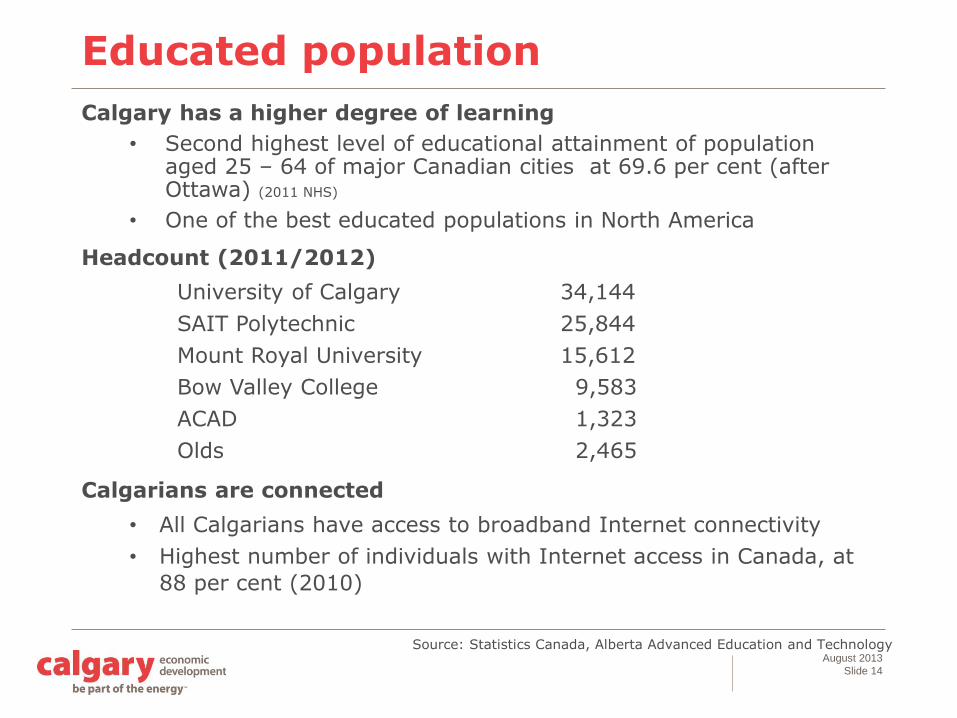
Educated population
Calgary has a higher degree of learning
• Second highest level of educational attainment of population aged 25 – 64 of major Canadian cities at 69.6 per cent (after Ottawa) (2011 NHS)
• One of the best educated populations in North America
Headcount (2011/2012)
University of Calgary 34,144
SAIT Polytechnic 25,844
Mount Royal University 15,612
Bow Valley College 9,583
ACAD 1,323
Olds 2,465
Calgarians are connected
• All Calgarians have access to broadband Internet connectivity
• Highest number of individuals with Internet access in Canada, at
88 per cent (2010)
August 2013
Slide 15
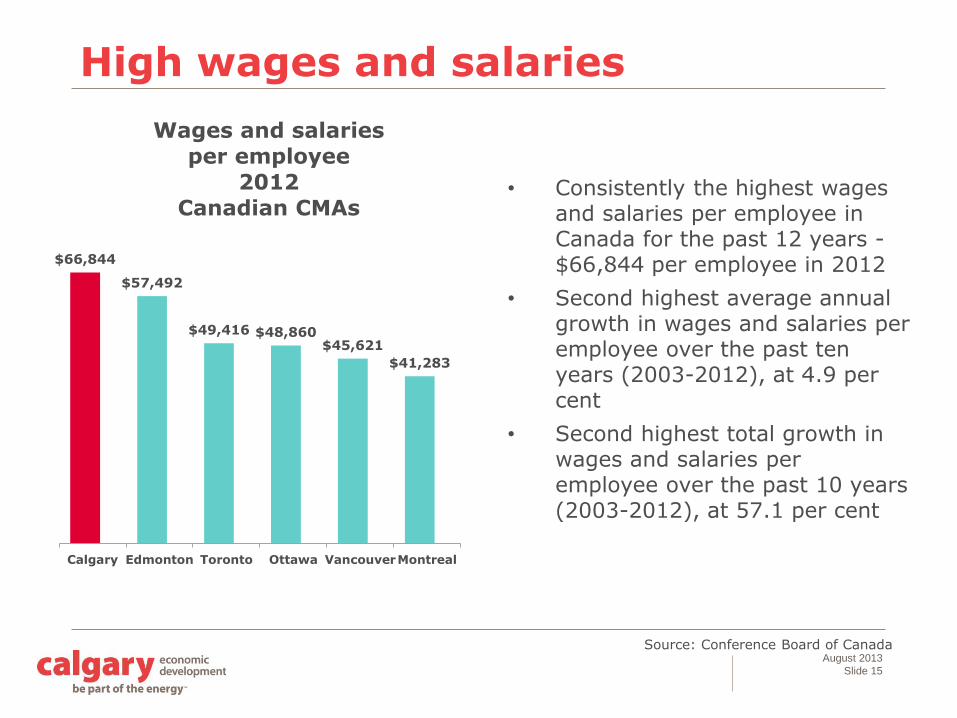
High wages and salaries
$66,844
$57,492
$49,416 $48,860$45,621
$41,283
Calgary Edmonton Toronto Ottawa VancouverMontreal
Wages and salaries
per employee
2012
Canadian CMAs• Consistently the highest wages
and salaries per employee in Canada for the past 12 years -$66,844 per employee in 2012
• Second highest average annual growth in wages and salaries per employee over the past ten years (2003-2012), at 4.9 per cent
• Second highest total growth in wages and salaries per employee over the past 10 years (2003-2012), at 57.1 per cent
Source: Conference Board of Canada
August 2013
Slide 16
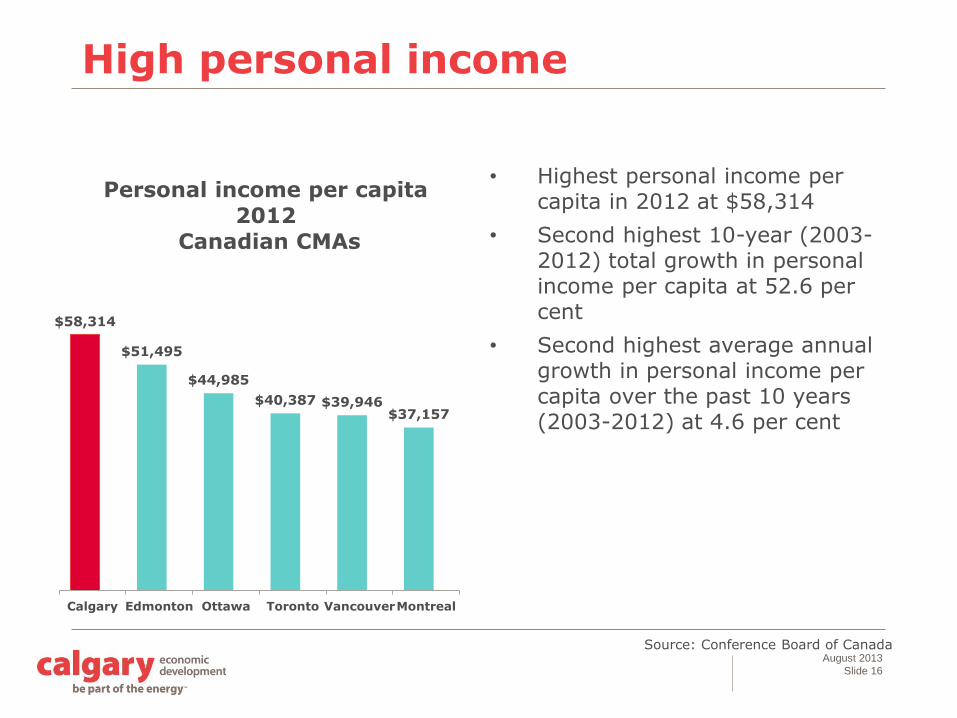
High personal income
$58,314
$51,495
$44,985
$40,387 $39,946$37,157
Calgary Edmonton Ottawa Toronto VancouverMontreal
Personal income per capita
2012
Canadian CMAs
• Highest personal income per capita in 2012 at $58,314
• Second highest 10-year (2003-2012) total growth in personal income per capita at 52.6 per cent
• Second highest average annual growth in personal income per capita over the past 10 years (2003-2012) at 4.6 per cent
Source: Conference Board of Canada
August 2013
Slide 17
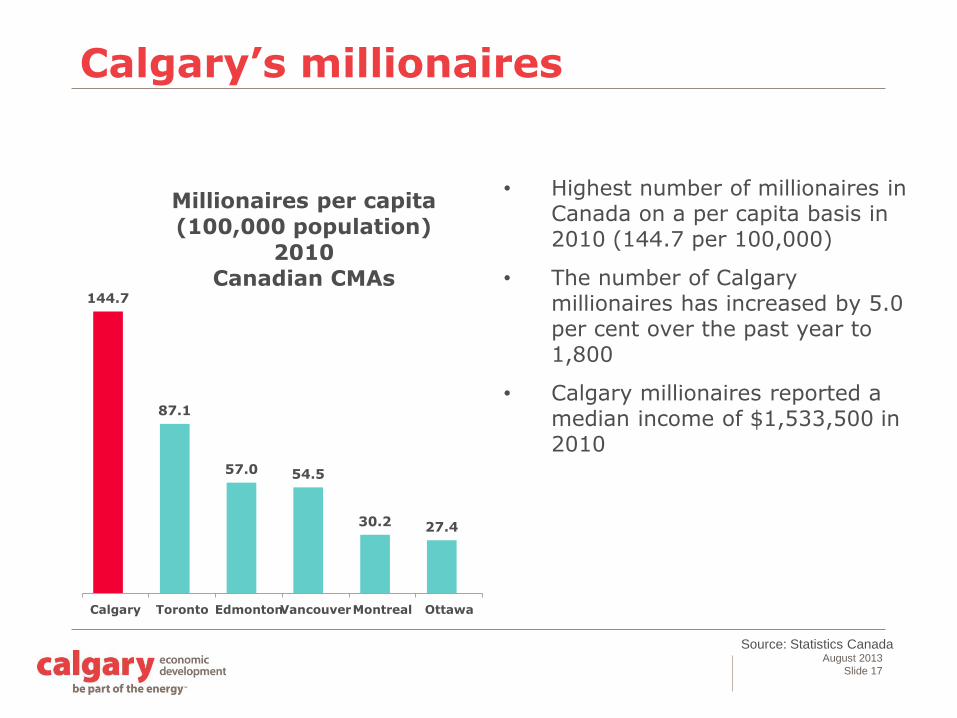
Calgary’s millionaires
144.7
87.1
57.0 54.5
30.2 27.4
Calgary Toronto EdmontonVancouverMontreal Ottawa
Millionaires per capita
(100,000 population)
2010
Canadian CMAs
• Highest number of millionaires in Canada on a per capita basis in 2010 (144.7 per 100,000)
• The number of Calgary millionaires has increased by 5.0 per cent over the past year to 1,800
• Calgary millionaires reported a median income of $1,533,500 in 2010
Source: Statistics Canada

August 2013
Slide 18
Calgary and region population
Source: City of Calgary Civic Census, Statistics Canada
1,042,8921,065,455
1,071,515
1,090,9361,120,225
1,149,5521,188,5951,222,491
1,244,2071,268,704
1,309,2211,278,273
1,314,711 1,338,859
1,364,172 1,406,080
0
200,000
400,000
600,000
800,000
1,000,000
1,200,000
1,400,000
1,600,000
2008 2009 2010 2011 2012 2013
Calgary’s population
City of
Calgary
Calgary
CMA
Calgary
EconomicRegion
• City of Calgary population is forecast to be 1.239 million in 2017 (City of Calgary Corporate Economics, Fall
2012)
• Calgary CMA is forecast to have a population of 1.443 million in 2017 (Conference Board of Canada)
• Calgary Economic Region is forecast to have a population of 1.544 million in 2017 (City of Calgary
Corporate Economics, Fall 2012)

August 2013
Slide 19
Population growth
12,920
-4,154
9,563
19,658 19,067
9,643
10,214
9,858
9,361 10,260
-10,000
-5,000
0
5,000
10,000
15,000
20,000
25,000
30,000
35,000
2009 2010 2011 2012 2013
Population growth
2009-2013
City of Calgary
Natural Increase
Net Migration
1.9%
-73.1%
220.5%
50.8% 0.1% Annual growthrate (%)
Source: City of Calgary Civic Census
August 2013
Slide 20
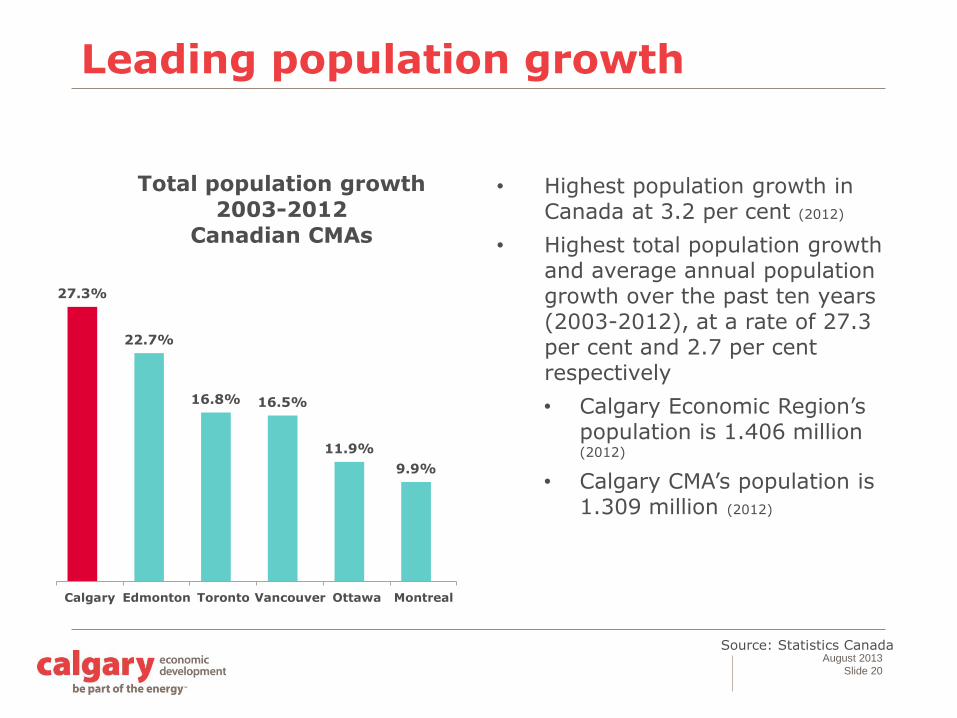
Leading population growth
27.3%
22.7%
16.8% 16.5%
11.9%
9.9%
Calgary Edmonton Toronto Vancouver Ottawa Montreal
Total population growth
2003-2012
Canadian CMAs
• Highest population growth in Canada at 3.2 per cent (2012)
• Highest total population growth and average annual population growth over the past ten years (2003-2012), at a rate of 27.3 per cent and 2.7 per cent respectively
• Calgary Economic Region’s population is 1.406 million (2012)
• Calgary CMA’s population is 1.309 million (2012)
Source: Statistics Canada
August 2013
Slide 21
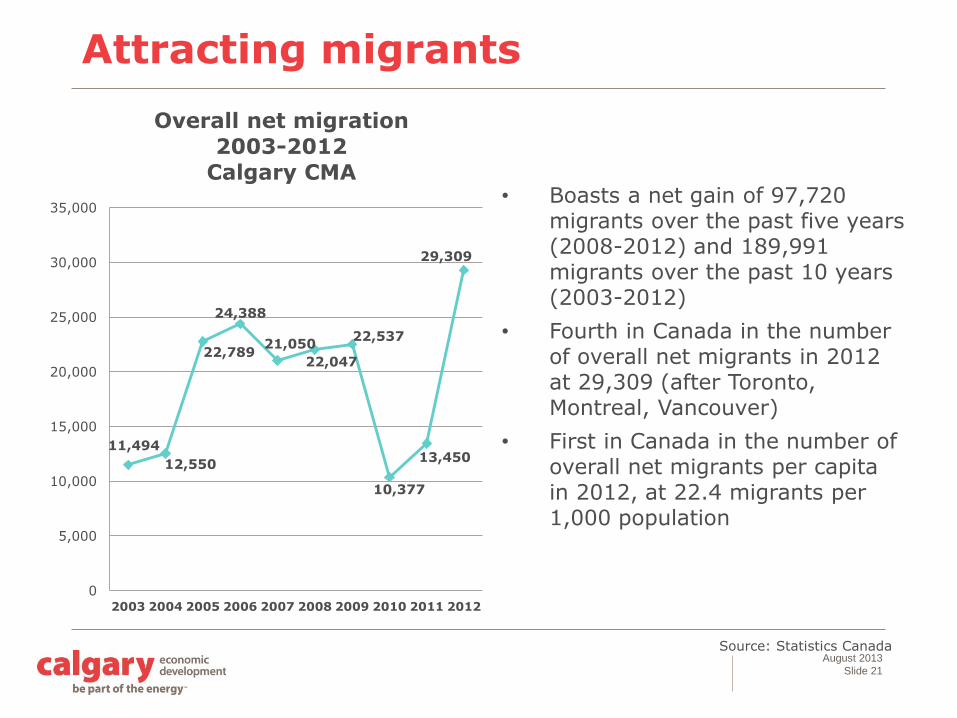
Attracting migrants
11,494
12,550
22,789
24,388
21,050
22,047
22,537
10,377
13,450
29,309
0
5,000
10,000
15,000
20,000
25,000
30,000
35,000
2003 2004 2005 2006 2007 2008 2009 2010 2011 2012
Overall net migration
2003-2012
Calgary CMA• Boasts a net gain of 97,720
migrants over the past five years (2008-2012) and 189,991 migrants over the past 10 years (2003-2012)
• Fourth in Canada in the number of overall net migrants in 2012 at 29,309 (after Toronto, Montreal, Vancouver)
• First in Canada in the number of overall net migrants per capita in 2012, at 22.4 migrants per 1,000 population
Source: Statistics Canada
August 2013
Slide 22
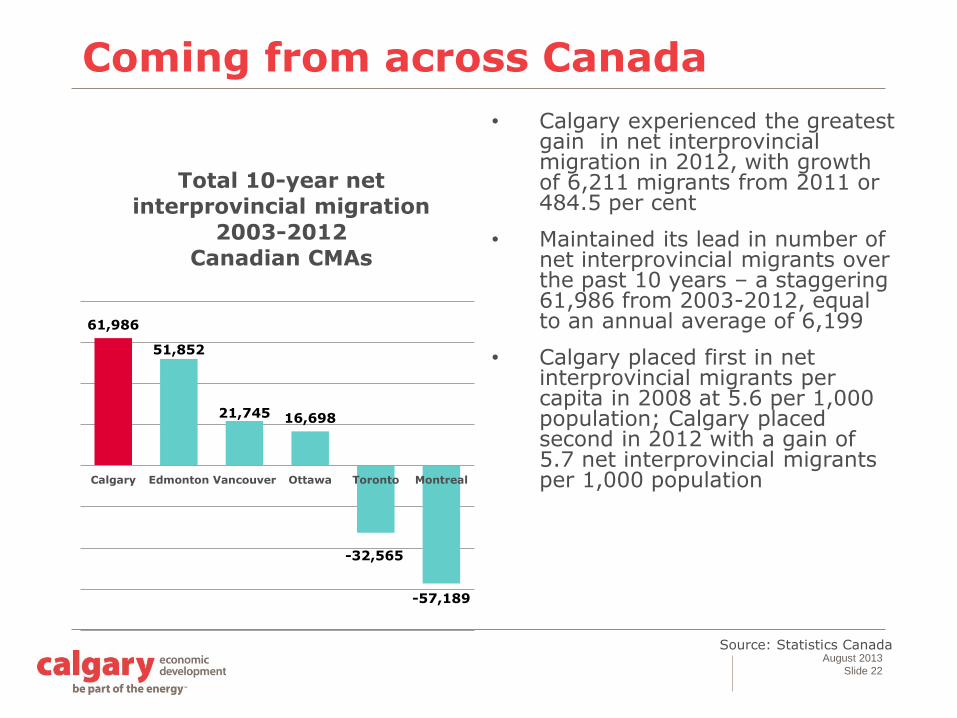
Coming from across Canada
61,986
51,852
21,745 16,698
-32,565
-57,189
Calgary Edmonton Vancouver Ottawa Toronto Montreal
Total 10-year net
interprovincial migration
2003-2012
Canadian CMAs
• Calgary experienced the greatest gain in net interprovincial migration in 2012, with growth of 6,211 migrants from 2011 or 484.5 per cent
• Maintained its lead in number of net interprovincial migrants over the past 10 years – a staggering 61,986 from 2003-2012, equal to an annual average of 6,199
• Calgary placed first in net interprovincial migrants per capita in 2008 at 5.6 per 1,000 population; Calgary placed second in 2012 with a gain of 5.7 net interprovincial migrants per 1,000 population
Source: Statistics Canada
August 2013
Slide 23
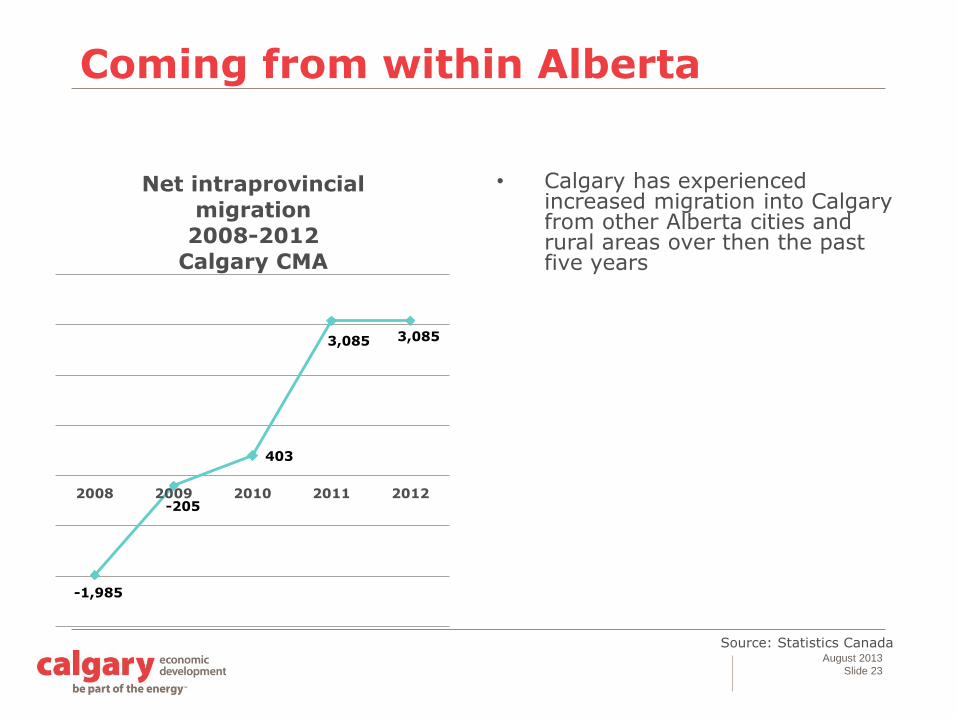
Coming from within Alberta
-1,985
-205
403
3,085 3,085
2008 2009 2010 2011 2012
Net intraprovincial
migration
2008-2012
Calgary CMA
• Calgary has experienced increased migration into Calgary from other Alberta cities and rural areas over then the past five years
Source: Statistics Canada
August 2013
Slide 24
Source: Statistics Canada
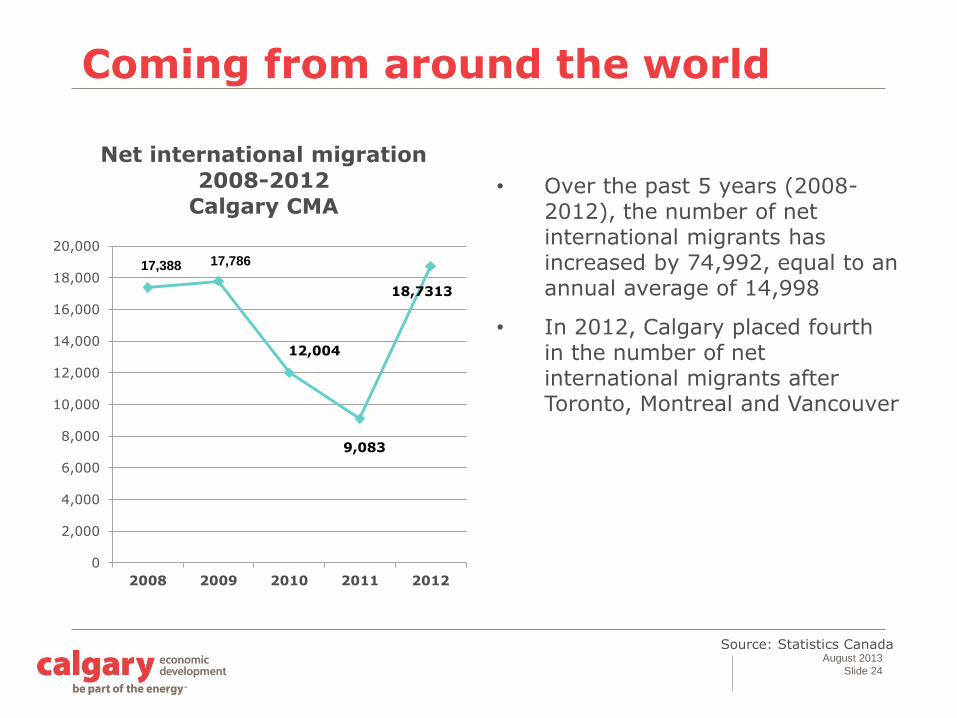
Coming from around the world
17,388 17,786
12,004
9,083
18,7313
0
2,000
4,000
6,000
8,000
10,000
12,000
14,000
16,000
18,000
20,000
2008 2009 2010 2011 2012
Net international migration
2008-2012
Calgary CMA• Over the past 5 years (2008-
2012), the number of net international migrants has increased by 74,992, equal to an annual average of 14,998
• In 2012, Calgary placed fourth in the number of net international migrants after Toronto, Montreal and Vancouver
August 2013
Slide 25
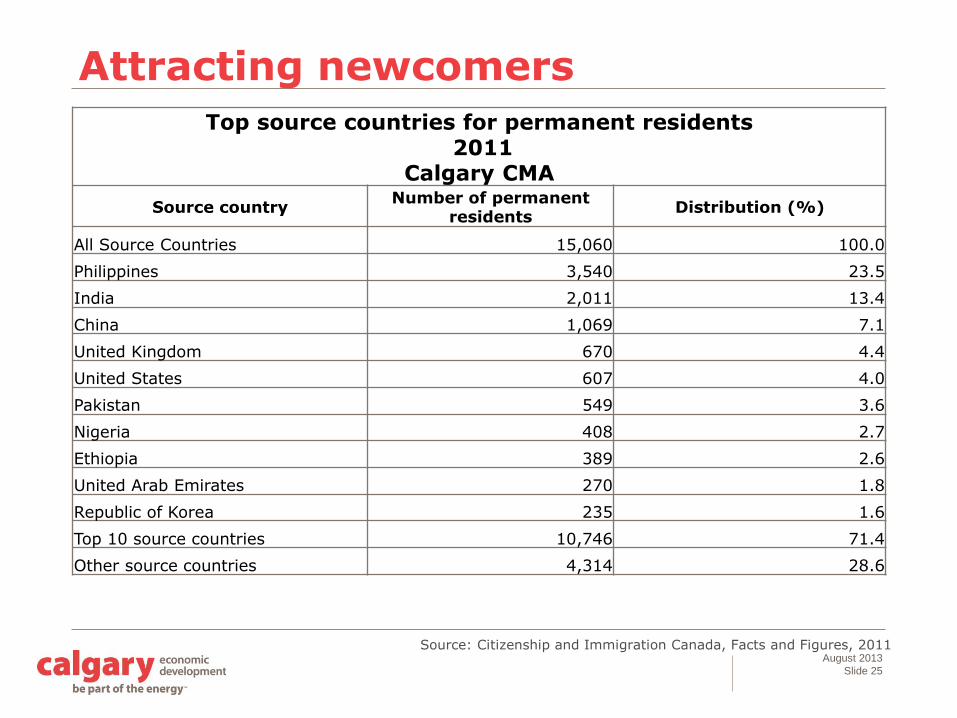
Attracting newcomers
Top source countries for permanent residents2011
Calgary CMA
Source countryNumber of permanent
residentsDistribution (%)
All Source Countries 15,060 100.0
Philippines 3,540 23.5
India 2,011 13.4
China 1,069 7.1
United Kingdom 670 4.4
United States 607 4.0
Pakistan 549 3.6
Nigeria 408 2.7
Ethiopia 389 2.6
United Arab Emirates 270 1.8
Republic of Korea 235 1.6
Top 10 source countries 10,746 71.4
Other source countries 4,314 28.6
Source: Citizenship and Immigration Canada, Facts and Figures, 2011
August 2013
Slide 26
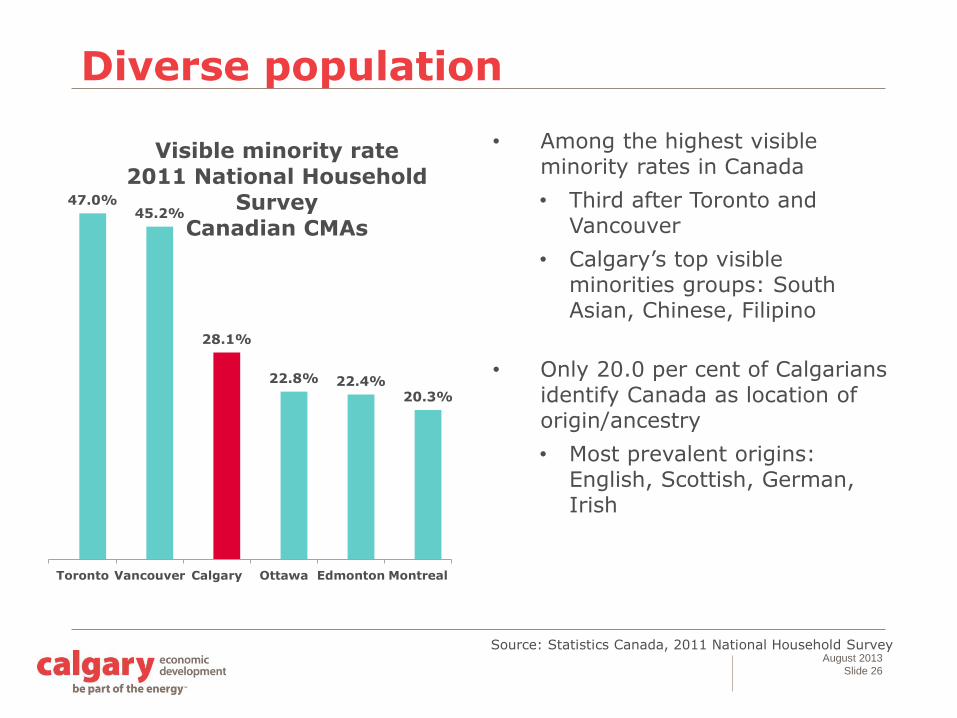
Diverse population
47.0%45.2%
28.1%
22.8% 22.4%20.3%
Toronto Vancouver Calgary Ottawa Edmonton Montreal
Visible minority rate
2011 National Household
Survey
Canadian CMAs
• Among the highest visible minority rates in Canada
• Third after Toronto and Vancouver
• Calgary’s top visible minorities groups: South Asian, Chinese, Filipino
• Only 20.0 per cent of Calgarians identify Canada as location of origin/ancestry
• Most prevalent origins: English, Scottish, German, Irish
Source: Statistics Canada, 2011 National Household Survey

August 2013
Slide 27
Labour force growth
27.0%26.5%
16.4% 16.1%15.0%
8.7%
Calgary Edmonton Ottawa Vancouver Toronto Montreal
Total labour force growth
2003-2012
Canadian CMAs
• Tied with Edmonton for second highest labour force growth in 2012 at 2.6 per cent (after Ottawa)
• Highest total labour force growth over the past 10 years (2003-2012) at 27.0 per cent
• Tied with Edmonton for highest average annual labour force growth over the past 10 years (2003-2012) at 2.7 per cent
Source: Statistics Canada
August 2013
Slide 28
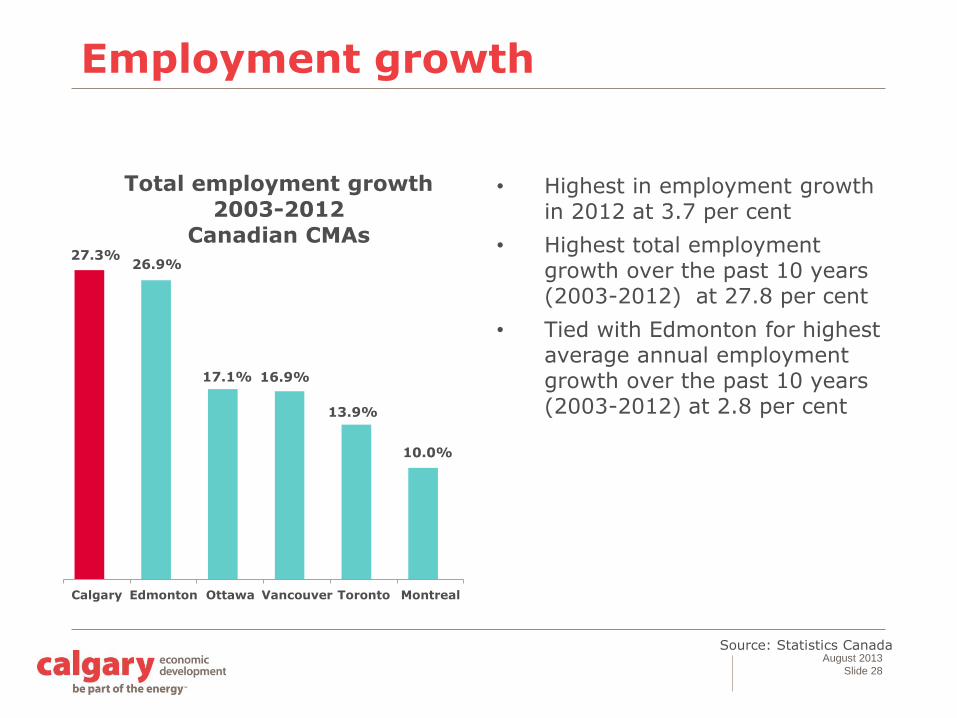
Employment growth
27.3%26.9%
17.1% 16.9%
13.9%
10.0%
Calgary Edmonton Ottawa Vancouver Toronto Montreal
Total employment growth
2003-2012
Canadian CMAs
• Highest in employment growth in 2012 at 3.7 per cent
• Highest total employment growth over the past 10 years (2003-2012) at 27.8 per cent
• Tied with Edmonton for highest average annual employment growth over the past 10 years (2003-2012) at 2.8 per cent
Source: Statistics Canada
August 2013
Slide 29
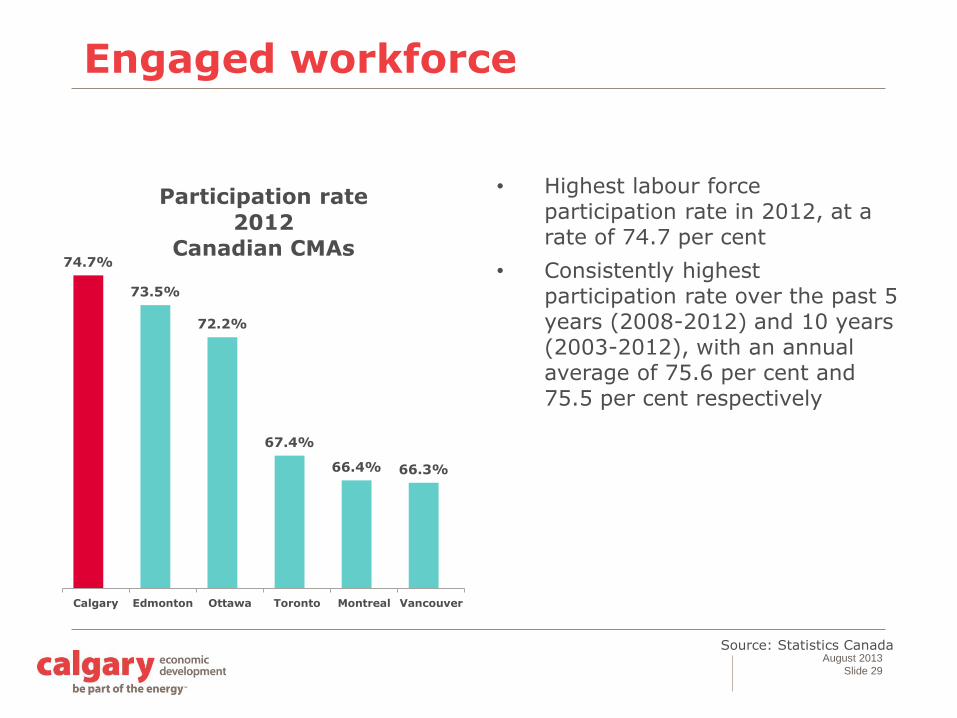
Engaged workforce
74.7%
73.5%
72.2%
67.4%
66.4% 66.3%
Calgary Edmonton Ottawa Toronto Montreal Vancouver
Participation rate
2012
Canadian CMAs
• Highest labour force participation rate in 2012, at a rate of 74.7 per cent
• Consistently highest participation rate over the past 5 years (2008-2012) and 10 years (2003-2012), with an annual average of 75.6 per cent and 75.5 per cent respectively
Source: Statistics Canada
August 2013
Slide 30
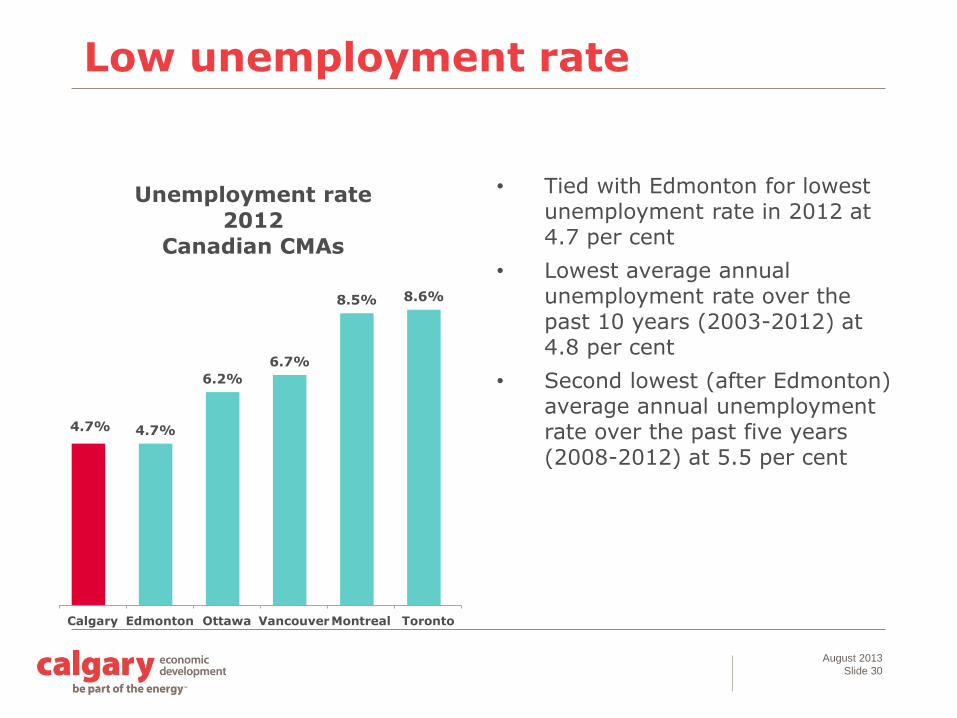
Low unemployment rate
4.7% 4.7%
6.2%
6.7%
8.5% 8.6%
Calgary Edmonton Ottawa VancouverMontreal Toronto
Unemployment rate
2012
Canadian CMAs
• Tied with Edmonton for lowest unemployment rate in 2012 at 4.7 per cent
• Lowest average annual unemployment rate over the past 10 years (2003-2012) at 4.8 per cent
• Second lowest (after Edmonton) average annual unemployment rate over the past five years (2008-2012) at 5.5 per cent
August 2013
Slide 31
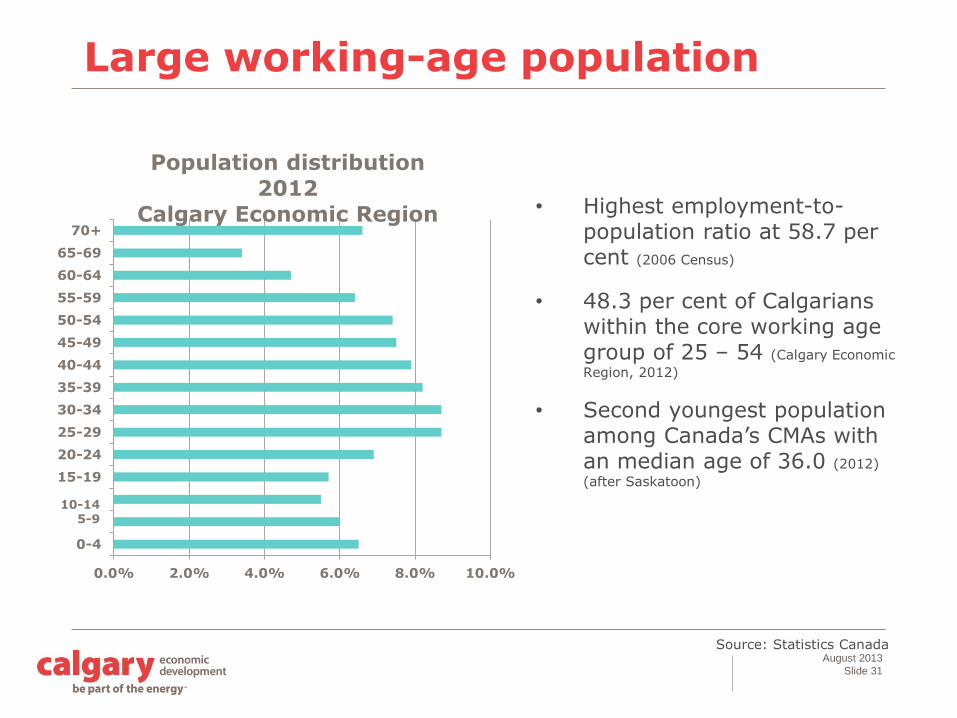
Large working-age population
• Highest employment-to-population ratio at 58.7 per cent (2006 Census)
• 48.3 per cent of Calgarians within the core working age group of 25 – 54 (Calgary Economic
Region, 2012)
• Second youngest population among Canada’s CMAs with an median age of 36.0 (2012)
(after Saskatoon)
Source: Statistics Canada
0.0% 2.0% 4.0% 6.0% 8.0% 10.0%
0-4
09-May
14-Oct
15-19
20-24
25-29
30-34
35-39
40-44
45-49
50-54
55-59
60-64
65-69
70+
Population distribution
2012
Calgary Economic Region
10-145-9
August 2013
Slide 32
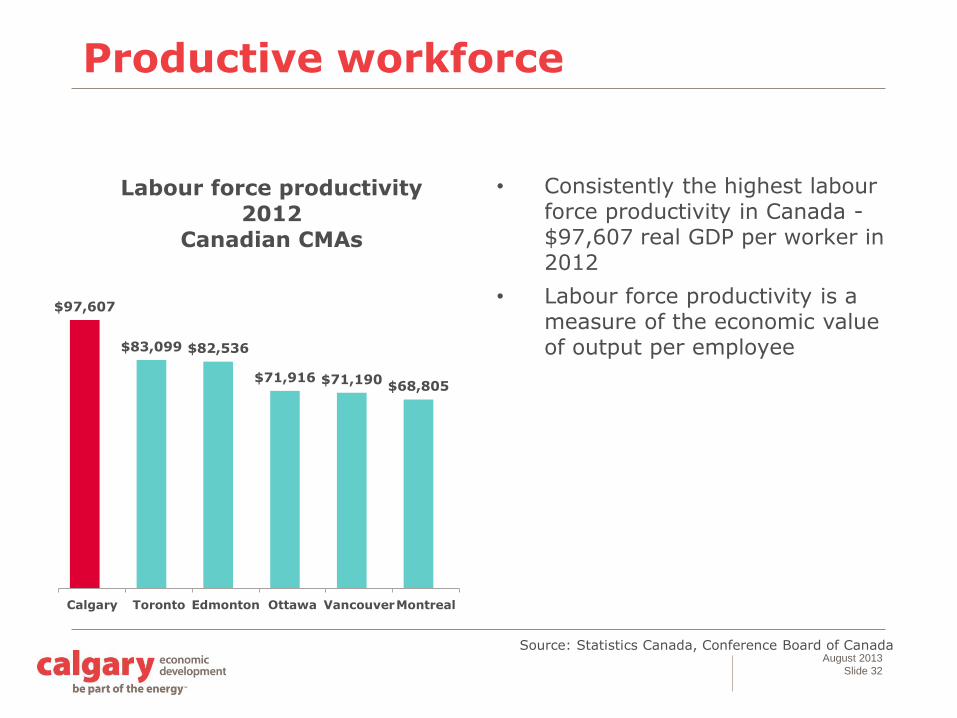
Productive workforce
$97,607
$83,099 $82,536
$71,916 $71,190$68,805
Calgary Toronto Edmonton Ottawa VancouverMontreal
Labour force productivity
2012
Canadian CMAs
• Consistently the highest labour force productivity in Canada -$97,607 real GDP per worker in 2012
• Labour force productivity is a measure of the economic value of output per employee
Source: Statistics Canada, Conference Board of Canada
August 2013
Slide 33
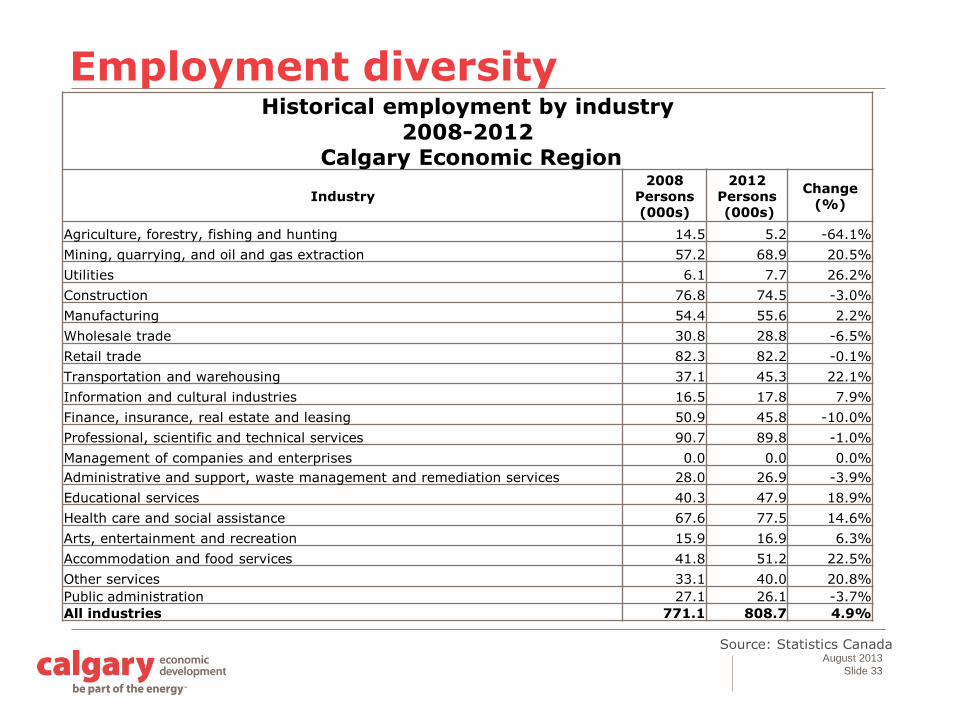
Source: Statistics Canada
Employment diversityHistorical employment by industry
2008-2012Calgary Economic Region
Industry2008
Persons (000s)
2012 Persons(000s)
Change (%)
Agriculture, forestry, fishing and hunting 14.5 5.2 -64.1%
Mining, quarrying, and oil and gas extraction 57.2 68.9 20.5%
Utilities 6.1 7.7 26.2%
Construction 76.8 74.5 -3.0%
Manufacturing 54.4 55.6 2.2%
Wholesale trade 30.8 28.8 -6.5%
Retail trade 82.3 82.2 -0.1%
Transportation and warehousing 37.1 45.3 22.1%
Information and cultural industries 16.5 17.8 7.9%
Finance, insurance, real estate and leasing 50.9 45.8 -10.0%
Professional, scientific and technical services 90.7 89.8 -1.0%
Management of companies and enterprises 0.0 0.0 0.0%
Administrative and support, waste management and remediation services 28.0 26.9 -3.9%
Educational services 40.3 47.9 18.9%
Health care and social assistance 67.6 77.5 14.6%
Arts, entertainment and recreation 15.9 16.9 6.3%
Accommodation and food services 41.8 51.2 22.5%
Other services 33.1 40.0 20.8%
Public administration 27.1 26.1 -3.7%
All industries 771.1 808.7 4.9%
August 2013
Slide 34
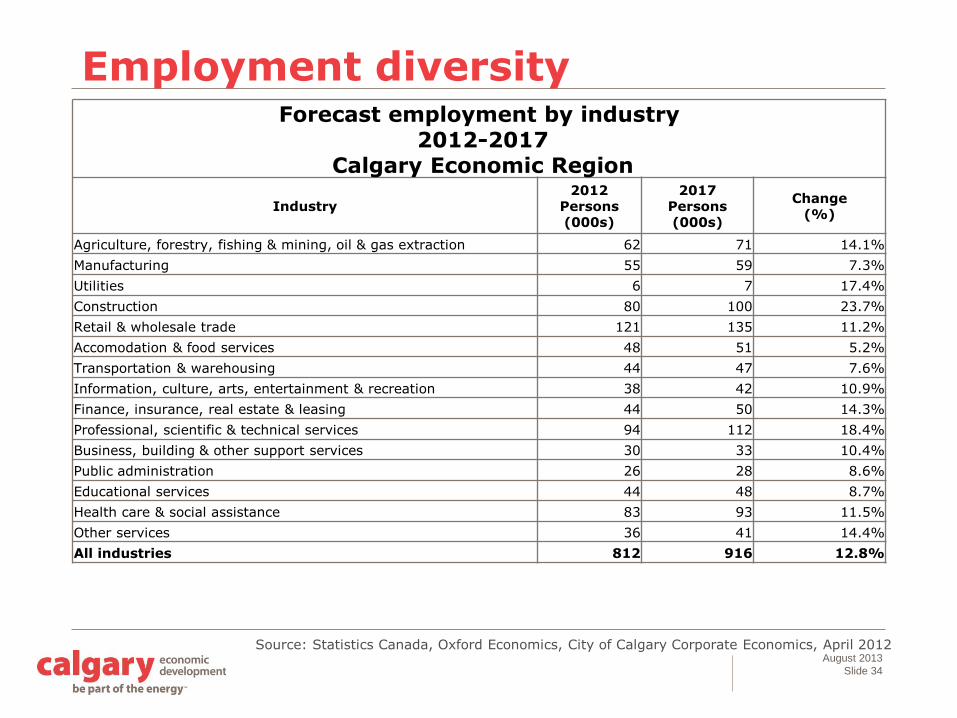
Source: Statistics Canada, Oxford Economics, City of Calgary Corporate Economics, April 2012
Employment diversityForecast employment by industry
2012-2017Calgary Economic Region
Industry2012
Persons (000s)
2017Persons (000s)
Change(%)
Agriculture, forestry, fishing & mining, oil & gas extraction 62 71 14.1%
Manufacturing 55 59 7.3%
Utilities 6 7 17.4%
Construction 80 100 23.7%
Retail & wholesale trade 121 135 11.2%
Accomodation & food services 48 51 5.2%
Transportation & warehousing 44 47 7.6%
Information, culture, arts, entertainment & recreation 38 42 10.9%
Finance, insurance, real estate & leasing 44 50 14.3%
Professional, scientific & technical services 94 112 18.4%
Business, building & other support services 30 33 10.4%
Public administration 26 28 8.6%
Educational services 44 48 8.7%
Health care & social assistance 83 93 11.5%
Other services 36 41 14.4%
All industries 812 916 12.8%
August 2013
Slide 35
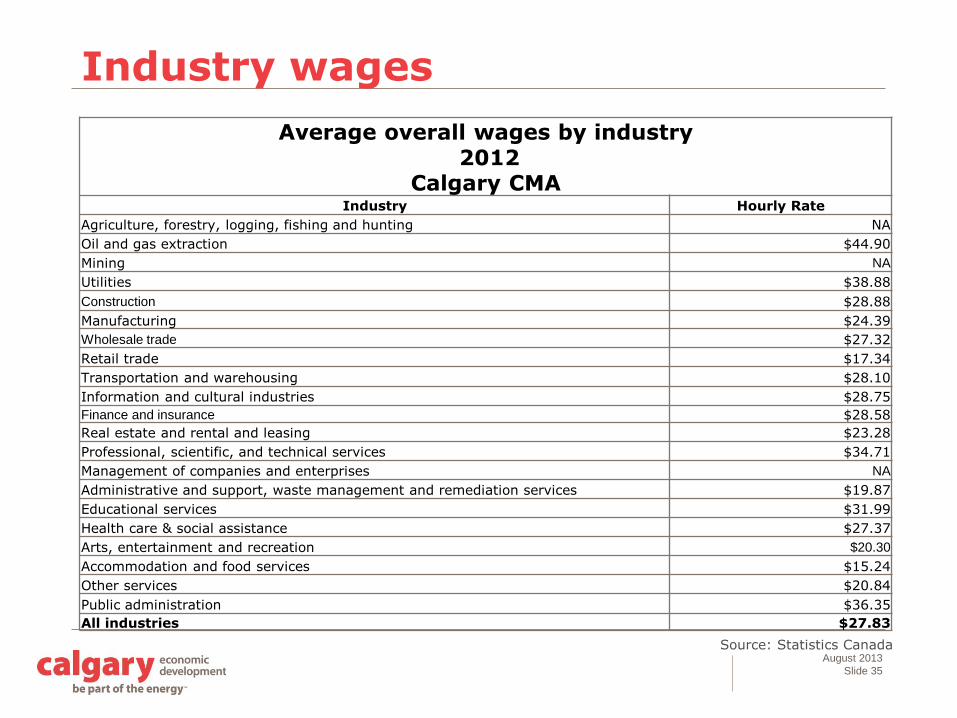
Source: Statistics Canada
Industry wages
Average overall wages by industry2012
Calgary CMAIndustry Hourly Rate
Agriculture, forestry, logging, fishing and hunting NA
Oil and gas extraction $44.90
Mining NA
Utilities $38.88
Construction $28.88
Manufacturing $24.39
Wholesale trade $27.32
Retail trade $17.34
Transportation and warehousing $28.10
Information and cultural industries $28.75
Finance and insurance $28.58
Real estate and rental and leasing $23.28
Professional, scientific, and technical services $34.71
Management of companies and enterprises NA
Administrative and support, waste management and remediation services $19.87
Educational services $31.99
Health care & social assistance $27.37
Arts, entertainment and recreation $20.30
Accommodation and food services $15.24
Other services $20.84
Public administration $36.35
All industries $27.83
August 2013
Slide 36
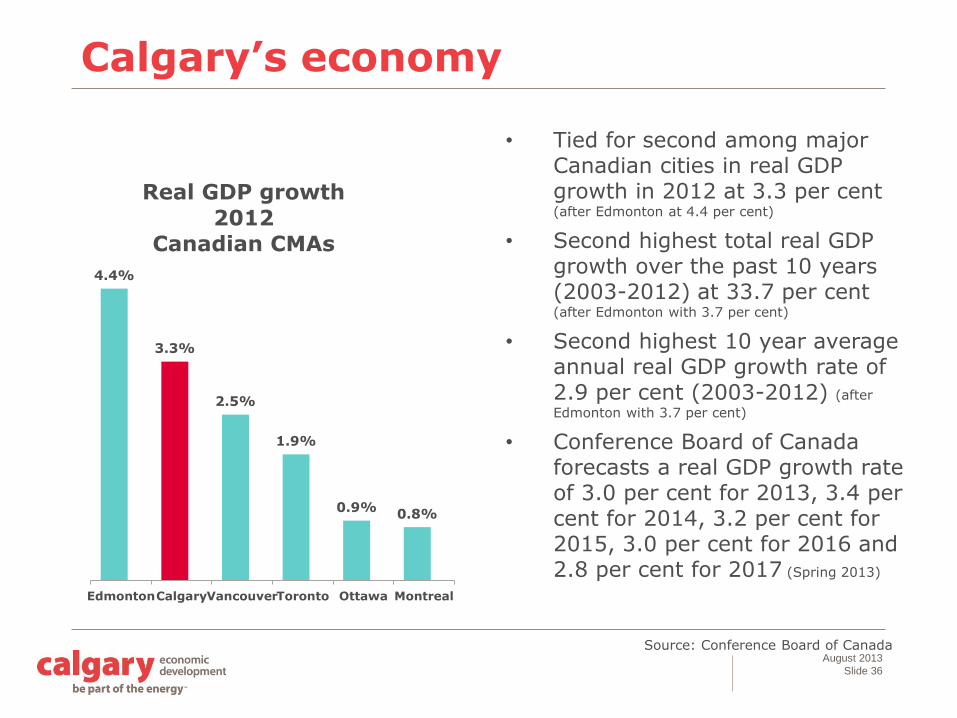
Calgary’s economy
4.4%
3.3%
2.5%
1.9%
0.9%0.8%
EdmontonCalgaryVancouverToronto Ottawa Montreal
Real GDP growth
2012
Canadian CMAs
• Tied for second among major Canadian cities in real GDP growth in 2012 at 3.3 per cent (after Edmonton at 4.4 per cent)
• Second highest total real GDP growth over the past 10 years (2003-2012) at 33.7 per cent (after Edmonton with 3.7 per cent)
• Second highest 10 year average annual real GDP growth rate of 2.9 per cent (2003-2012) (after
Edmonton with 3.7 per cent)
• Conference Board of Canada forecasts a real GDP growth rate of 3.0 per cent for 2013, 3.4 per cent for 2014, 3.2 per cent for 2015, 3.0 per cent for 2016 and 2.8 per cent for 2017 (Spring 2013)
Source: Conference Board of Canada
August 2013
Slide 37
Highest retail sales
77.2% 76.9%
39.9%
35.0% 33.5% 31.8%
Edmonton Calgary Ottawa Toronto Montreal Vancouver
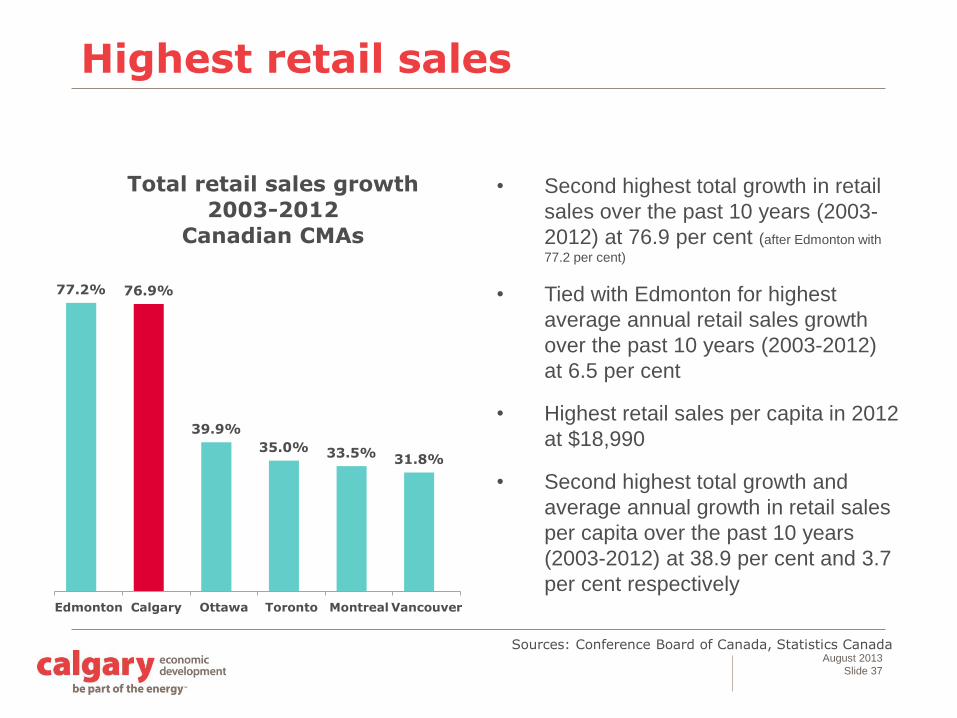
Total retail sales growth
2003-2012
Canadian CMAs
• Second highest total growth in retail
sales over the past 10 years (2003-
2012) at 76.9 per cent (after Edmonton with
77.2 per cent)
• Tied with Edmonton for highest
average annual retail sales growth
over the past 10 years (2003-2012)
at 6.5 per cent
• Highest retail sales per capita in 2012
at $18,990
• Second highest total growth and
average annual growth in retail sales
per capita over the past 10 years
(2003-2012) at 38.9 per cent and 3.7
per cent respectively
Sources: Conference Board of Canada, Statistics Canada
August 2013
Slide 38
Small business drives economy
38.536.6 36.5
30.9
27.525.7
Calgary Vancouver Edmonton Toronto Montreal Ottawa
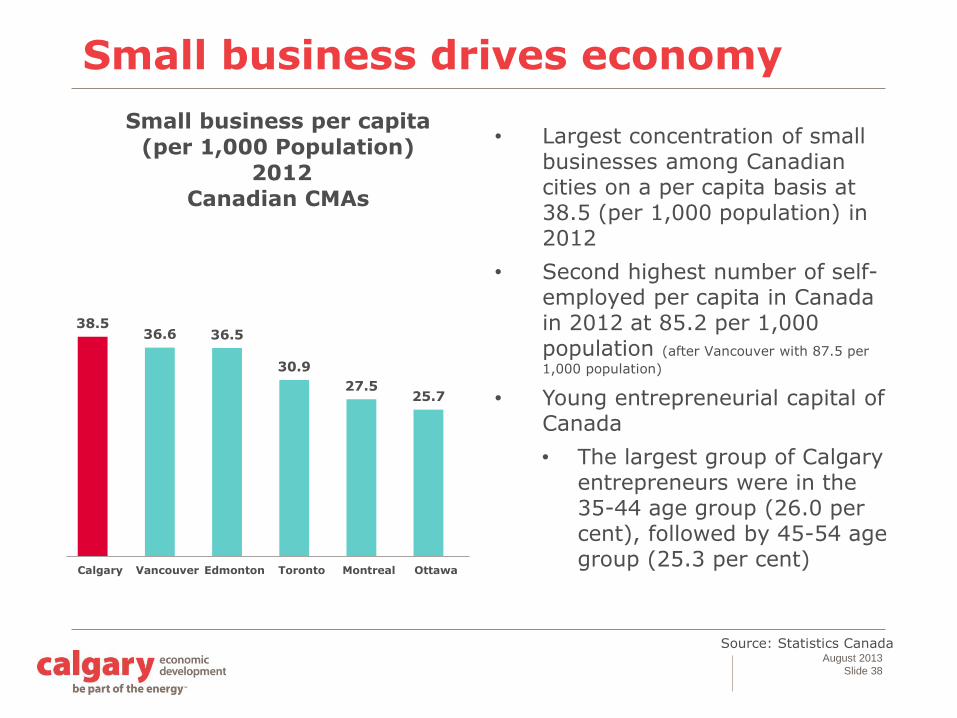
Small business per capita
(per 1,000 Population)
2012
Canadian CMAs
• Largest concentration of small businesses among Canadian cities on a per capita basis at 38.5 (per 1,000 population) in 2012
• Second highest number of self-employed per capita in Canada in 2012 at 85.2 per 1,000 population (after Vancouver with 87.5 per
1,000 population)
• Young entrepreneurial capital of Canada
• The largest group of Calgary entrepreneurs were in the 35-44 age group (26.0 per cent), followed by 45-54 age group (25.3 per cent)
Source: Statistics Canada
August 2013
Slide 39
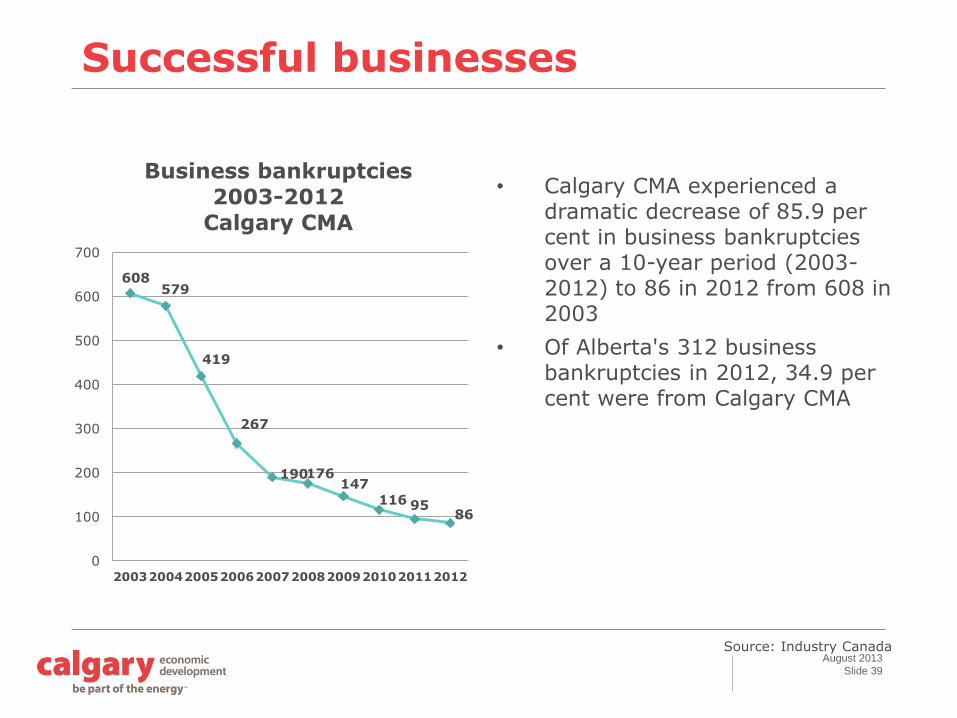
Successful businesses
• Calgary CMA experienced a dramatic decrease of 85.9 per cent in business bankruptcies over a 10-year period (2003-2012) to 86 in 2012 from 608 in 2003
• Of Alberta's 312 business bankruptcies in 2012, 34.9 per cent were from Calgary CMA
Source: Industry Canada
608579
419
267
190176147
116 9586
0
100
200
300
400
500
600
700
2003200420052006200720082009201020112012
Business bankruptcies
2003-2012
Calgary CMA
August 2013
Slide 40
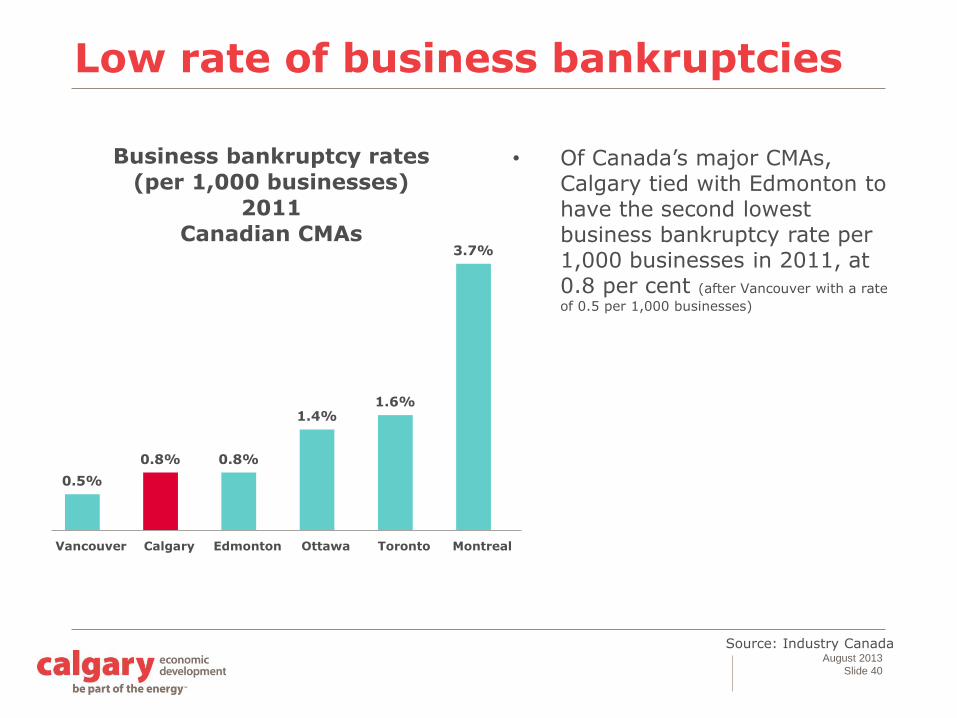
Low rate of business bankruptcies
• Of Canada’s major CMAs, Calgary tied with Edmonton to have the second lowest business bankruptcy rate per 1,000 businesses in 2011, at 0.8 per cent (after Vancouver with a rate
of 0.5 per 1,000 businesses)
Source: Industry Canada
0.5%
0.8% 0.8%
1.4%1.6%
3.7%
Vancouver Calgary Edmonton Ottawa Toronto Montreal
Business bankruptcy rates
(per 1,000 businesses)
2011
Canadian CMAs
August 2013
Slide 41
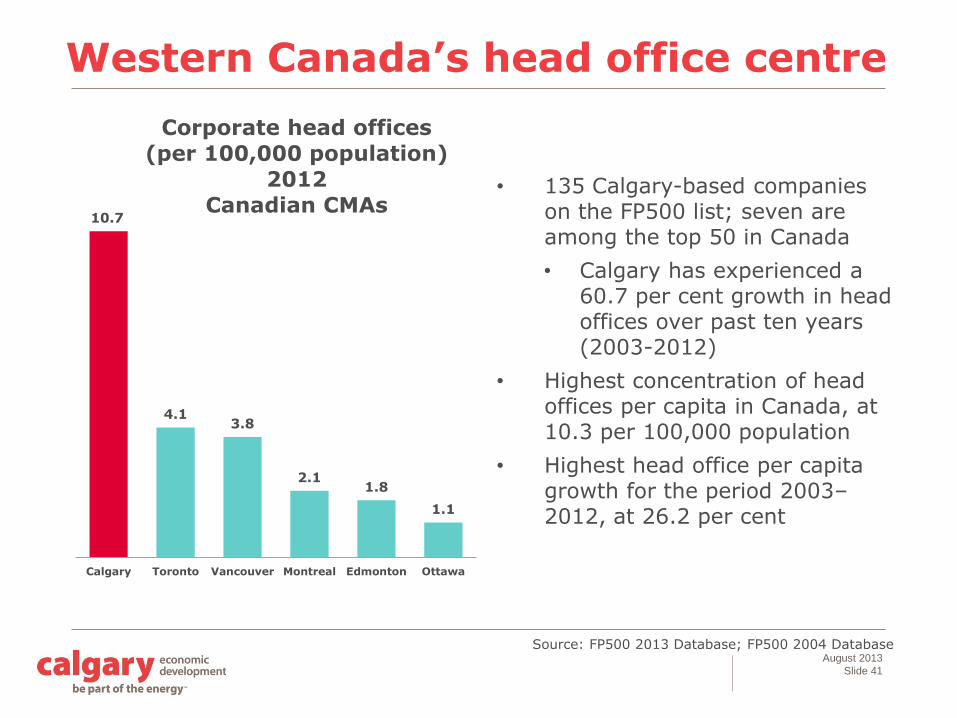
Western Canada’s head office centre
10.7
4.13.8
2.11.8
1.1
Calgary Toronto Vancouver Montreal Edmonton Ottawa
Corporate head offices
(per 100,000 population)
2012
Canadian CMAs• 135 Calgary-based companies
on the FP500 list; seven are among the top 50 in Canada
• Calgary has experienced a 60.7 per cent growth in head offices over past ten years (2003-2012)
• Highest concentration of head offices per capita in Canada, at 10.3 per 100,000 population
• Highest head office per capita growth for the period 2003–2012, at 26.2 per cent
Source: FP500 2013 Database; FP500 2004 Database
August 2013
Slide 42
Source: Statistics Canada
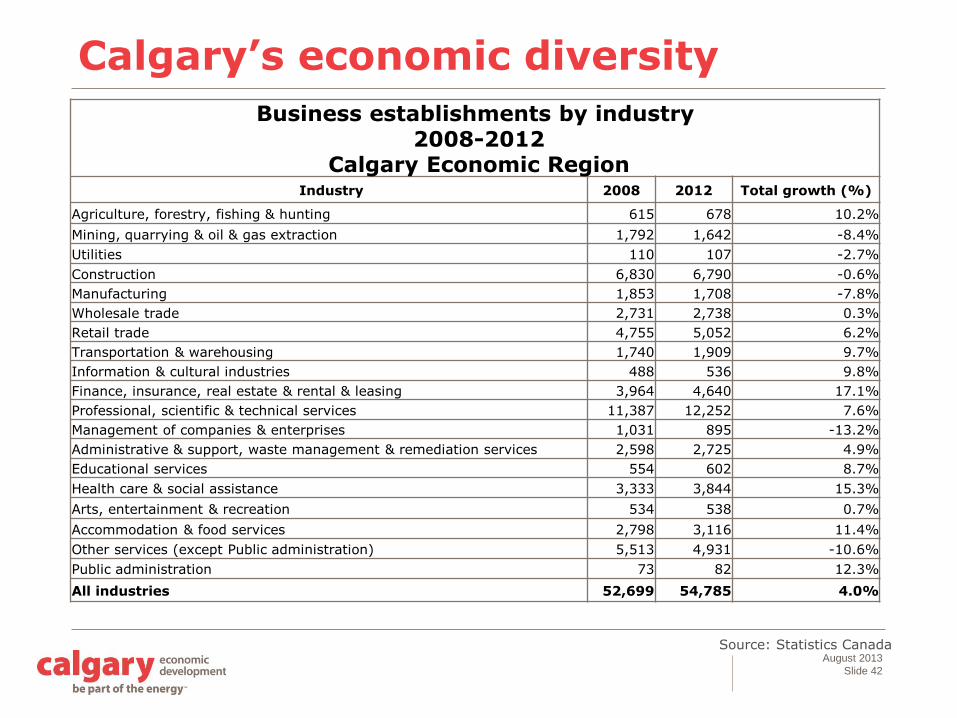
Calgary’s economic diversity
Business establishments by industry2008-2012
Calgary Economic RegionIndustry 2008 2012 Total growth (%)
Agriculture, forestry, fishing & hunting 615 678 10.2%
Mining, quarrying & oil & gas extraction 1,792 1,642 -8.4%
Utilities 110 107 -2.7%
Construction 6,830 6,790 -0.6%
Manufacturing 1,853 1,708 -7.8%
Wholesale trade 2,731 2,738 0.3%
Retail trade 4,755 5,052 6.2%
Transportation & warehousing 1,740 1,909 9.7%
Information & cultural industries 488 536 9.8%
Finance, insurance, real estate & rental & leasing 3,964 4,640 17.1%
Professional, scientific & technical services 11,387 12,252 7.6%
Management of companies & enterprises 1,031 895 -13.2%
Administrative & support, waste management & remediation services 2,598 2,725 4.9%
Educational services 554 602 8.7%
Health care & social assistance 3,333 3,844 15.3%
Arts, entertainment & recreation 534 538 0.7%
Accommodation & food services 2,798 3,116 11.4%
Other services (except Public administration) 5,513 4,931 -10.6%
Public administration 73 82 12.3%
All industries 52,699 54,785 4.0%

August 2013
Slide 43
Source: Conference Board of Canada
Calgary’s economic diversityHistorical GDP by industry
2008-2012Calgary CMA
Industry2008
(2007 $ Millions)2012
(2007 $ Millions)
Total Change 2008-2012
(%)
Goods-producing industries 45,383 49,696 9.5%
Manufacturing 6,496 7,338 13.0%
Construction 8,348 8,608 3.1%
Primary and utilities 30,539 33,750 10.5%
Services-producing industries 51,726 55,834 7.9%
Transportation and warehousing 4,145 4,510 8.8%
Information and cultural industries 2,889 3,237 12.0%
Wholesale and retail trade 7,802 8,641 10.8%
Finance, insurance and real estate and leasing 13,772 14,864 7.9%
Business services 9,711 9,604 -1.1%
Personal services 3,803 4,265 12.1%
Non-commercial services 6,618 7,556 14.2%
Public administration and defence 2,985 3,157 5.8%
All industries 97,109 105,530 8.7%
August 2013
Slide 44
Source: Conference Board of Canada
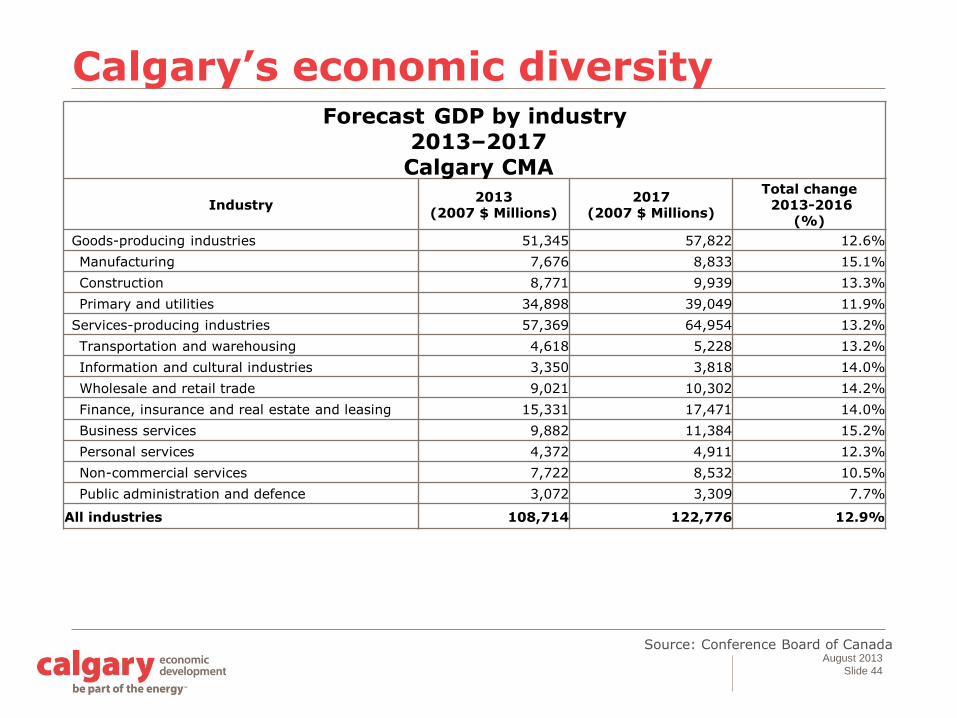
Calgary’s economic diversityForecast GDP by industry
2013–2017Calgary CMA
Industry2013
(2007 $ Millions)2017
(2007 $ Millions)
Total change2013-2016
(%)
Goods-producing industries 51,345 57,822 12.6%
Manufacturing 7,676 8,833 15.1%
Construction 8,771 9,939 13.3%
Primary and utilities 34,898 39,049 11.9%
Services-producing industries 57,369 64,954 13.2%
Transportation and warehousing 4,618 5,228 13.2%
Information and cultural industries 3,350 3,818 14.0%
Wholesale and retail trade 9,021 10,302 14.2%
Finance, insurance and real estate and leasing 15,331 17,471 14.0%
Business services 9,882 11,384 15.2%
Personal services 4,372 4,911 12.3%
Non-commercial services 7,722 8,532 10.5%
Public administration and defence 3,072 3,309 7.7%
All industries 108,714 122,776 12.9%
August 2013
Slide 45
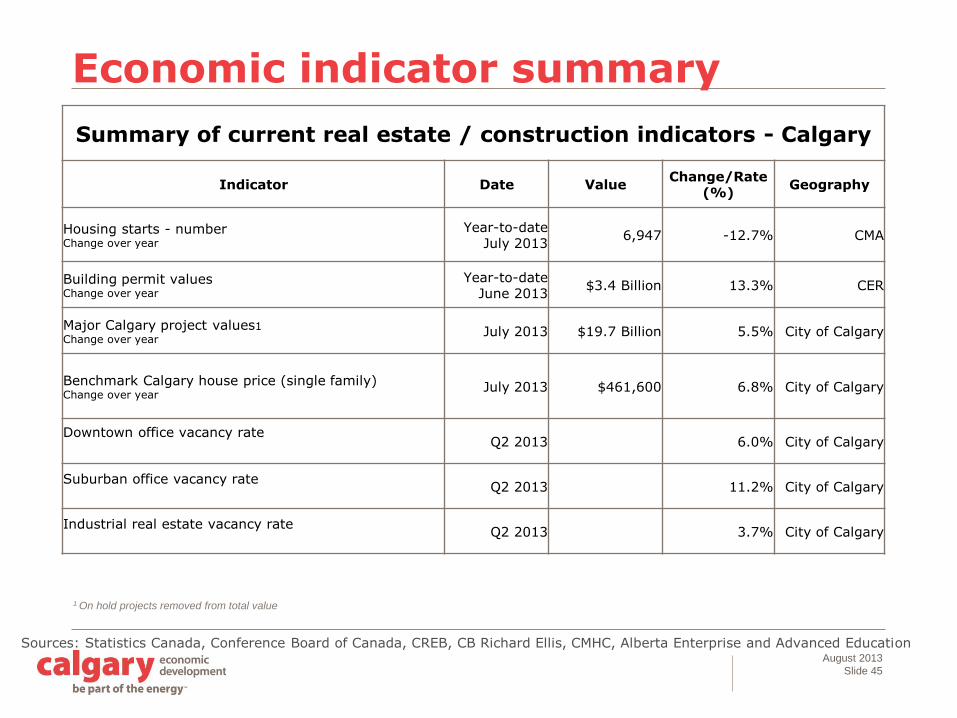
Economic indicator summary
Sources: Statistics Canada, Conference Board of Canada, CREB, CB Richard Ellis, CMHC, Alberta Enterprise and Advanced Education
Summary of current real estate / construction indicators - Calgary
Indicator Date ValueChange/Rate
(%)Geography
Housing starts - numberChange over year
Year-to-date July 2013
6,947 -12.7% CMA
Building permit values Change over year
Year-to-dateJune 2013
$3.4 Billion 13.3% CER
Major Calgary project values1
Change over year July 2013 $19.7 Billion 5.5% City of Calgary
Benchmark Calgary house price (single family)Change over year
July 2013 $461,600 6.8% City of Calgary
Downtown office vacancy rateQ2 2013 6.0% City of Calgary
Suburban office vacancy rateQ2 2013 11.2% City of Calgary
Industrial real estate vacancy rate Q2 2013 3.7% City of Calgary
1 On hold projects removed from total value
August 2013
Slide 46
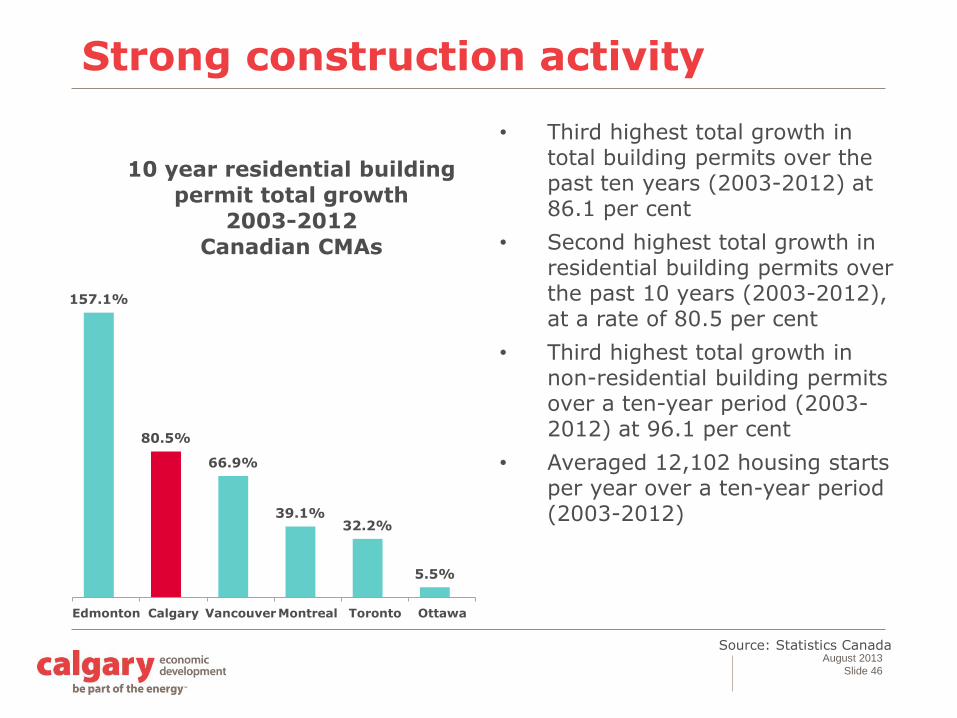
Strong construction activity
157.1%
80.5%
66.9%
39.1%32.2%
5.5%
Edmonton Calgary VancouverMontreal Toronto Ottawa
10 year residential building
permit total growth
2003-2012
Canadian CMAs
• Third highest total growth in total building permits over the past ten years (2003-2012) at 86.1 per cent
• Second highest total growth in residential building permits over the past 10 years (2003-2012), at a rate of 80.5 per cent
• Third highest total growth in non-residential building permits over a ten-year period (2003-2012) at 96.1 per cent
• Averaged 12,102 housing starts per year over a ten-year period (2003-2012)
Source: Statistics Canada
August 2013
Slide 47
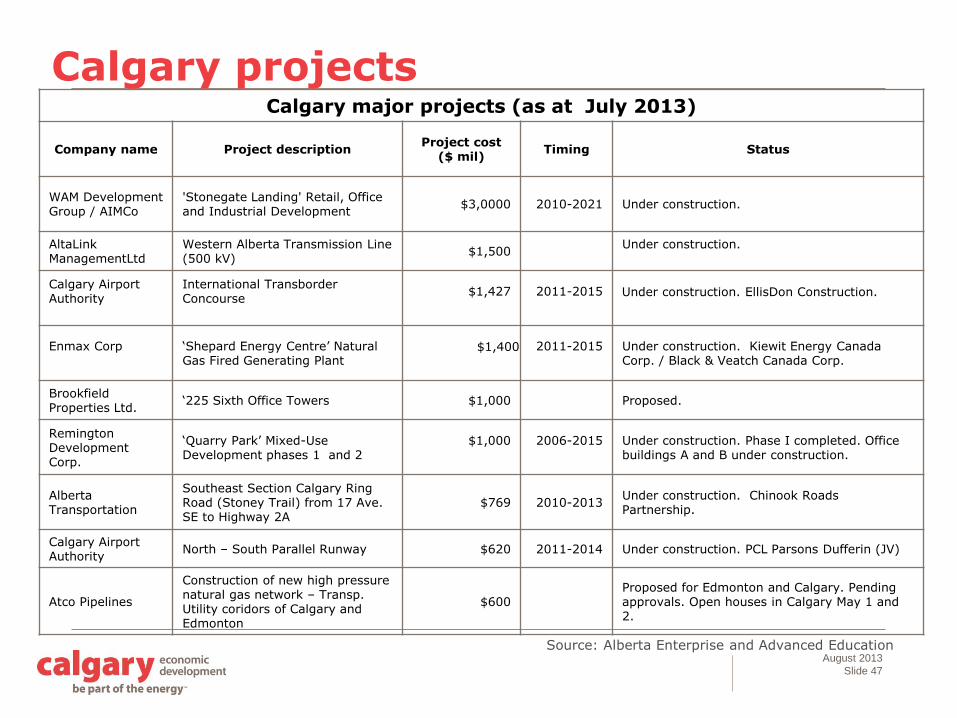
Source: Alberta Enterprise and Advanced Education
Calgary major projects (as at July 2013)
Company name Project descriptionProject cost
($ mil)Timing Status
WAM Development Group / AIMCo
'Stonegate Landing' Retail, Office and Industrial Development
$3,0000 2010-2021 Under construction.
AltaLinkManagementLtd
Western Alberta Transmission Line (500 kV)
$1,500Under construction.
Calgary Airport Authority
International TransborderConcourse
$1,427 2011-2015 Under construction. EllisDon Construction.
Enmax Corp ‘Shepard Energy Centre’ Natural Gas Fired Generating Plant
$1,400 2011-2015 Under construction. Kiewit Energy Canada Corp. / Black & Veatch Canada Corp.
Brookfield Properties Ltd.
‘225 Sixth Office Towers $1,000 Proposed.
Remington Development Corp.
‘Quarry Park’ Mixed-Use Development phases 1 and 2
$1,000 2006-2015 Under construction. Phase I completed. Office buildings A and B under construction.
Alberta Transportation
Southeast Section Calgary Ring Road (Stoney Trail) from 17 Ave. SE to Highway 2A
$769 2010-2013Under construction. Chinook Roads Partnership.
Calgary Airport Authority
North – South Parallel Runway $620 2011-2014 Under construction. PCL Parsons Dufferin (JV)
Atco Pipelines
Construction of new high pressure natural gas network – Transp. Utility coridors of Calgary and Edmonton
$600Proposed for Edmonton and Calgary. Pending approvals. Open houses in Calgary May 1 and 2.
Calgary projects
August 2013
Slide 48
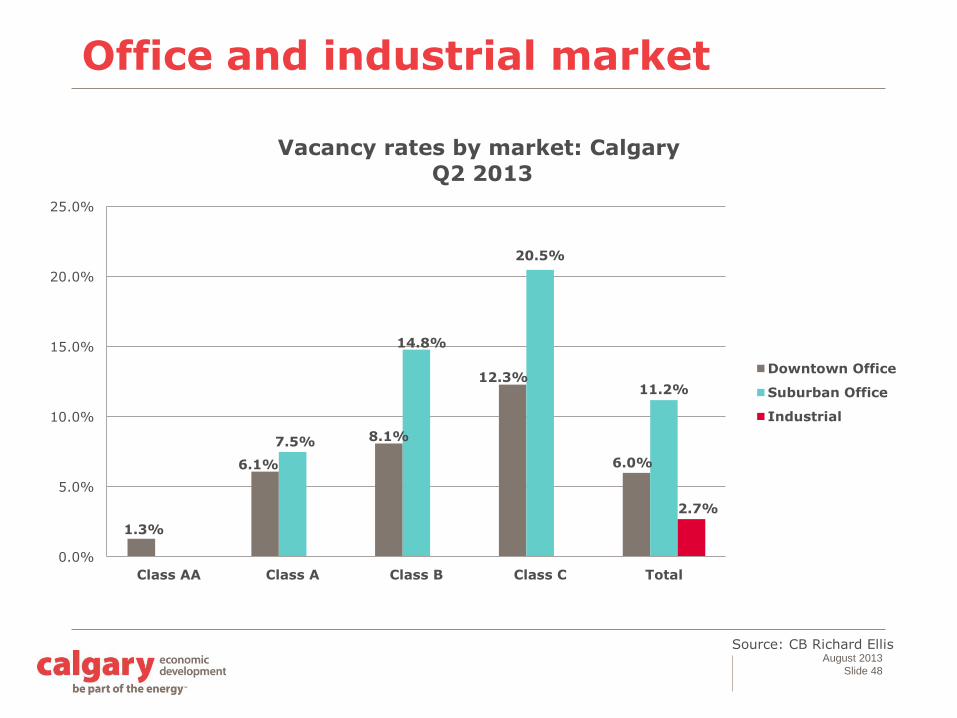
Source: CB Richard Ellis
Office and industrial market
1.3%
6.1%
8.1%
12.3%
6.0%
7.5%
14.8%
20.5%
11.2%
2.7%
0.0%
5.0%
10.0%
15.0%
20.0%
25.0%
Class AA Class A Class B Class C Total
Vacancy rates by market: Calgary
Q2 2013
Downtown Office
Suburban Office
Industrial
August 2013
Slide 49
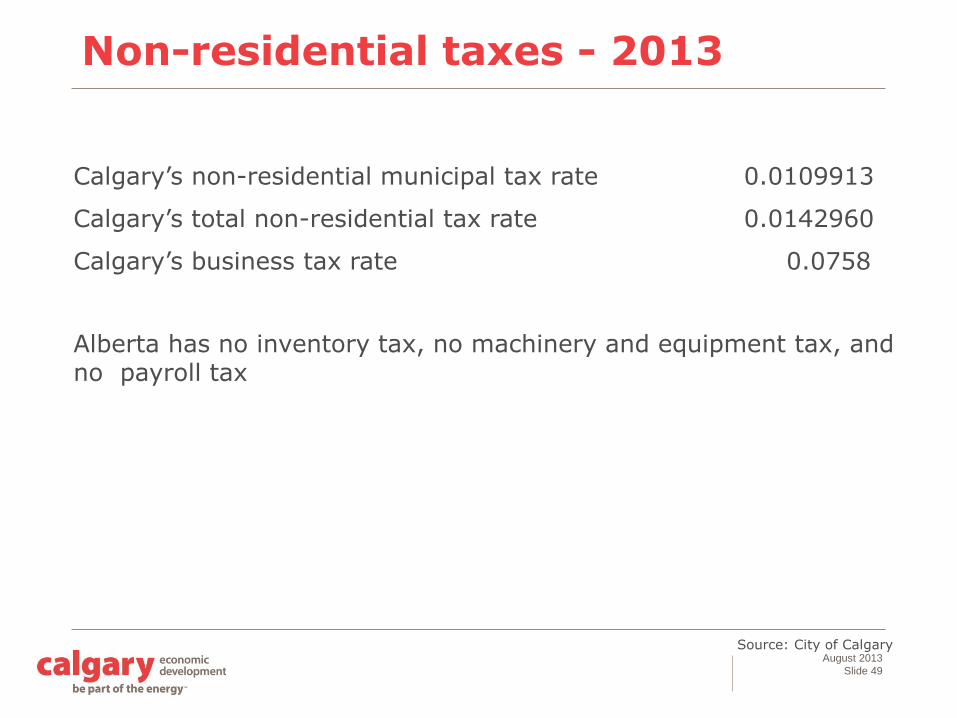
Source: City of Calgary
Non-residential taxes - 2013
Calgary’s non-residential municipal tax rate 0.0109913
Calgary’s total non-residential tax rate 0.0142960
Calgary’s business tax rate 0.0758
Alberta has no inventory tax, no machinery and equipment tax, and no payroll tax
August 2013
Slide 50
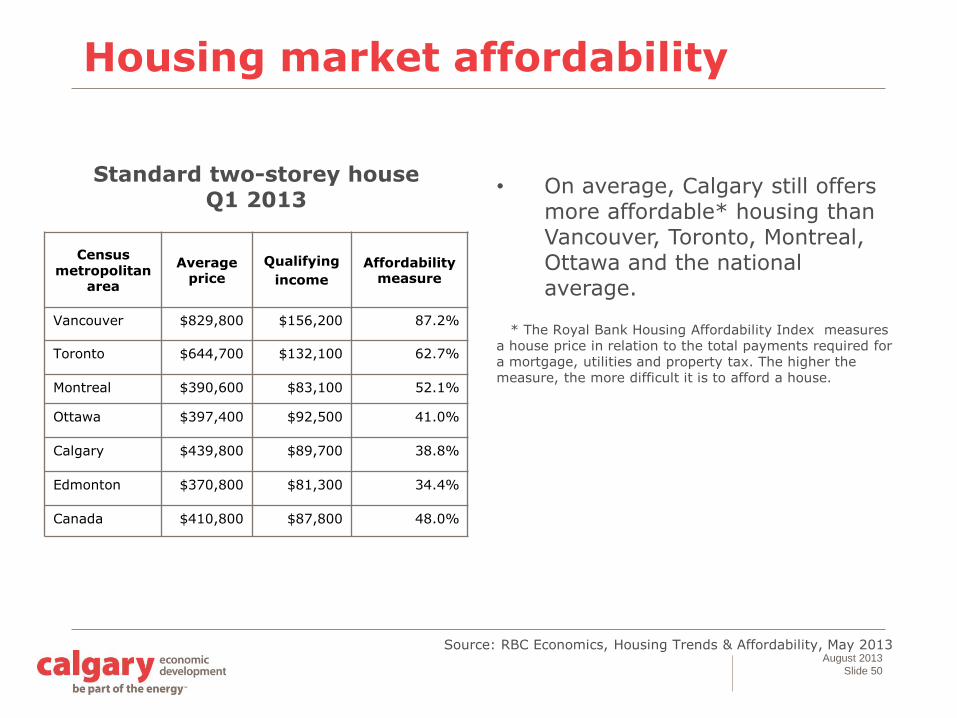
Housing market affordability
Census metropolitan
area
Average price
Qualifying
income
Affordability measure
Vancouver $829,800 $156,200 87.2%
Toronto $644,700 $132,100 62.7%
Montreal $390,600 $83,100 52.1%
Ottawa $397,400 $92,500 41.0%
Calgary $439,800 $89,700 38.8%
Edmonton $370,800 $81,300 34.4%
Canada $410,800 $87,800 48.0%
• On average, Calgary still offers more affordable* housing than Vancouver, Toronto, Montreal, Ottawa and the national average.
* The Royal Bank Housing Affordability Index measures a house price in relation to the total payments required for a mortgage, utilities and property tax. The higher the measure, the more difficult it is to afford a house.
Standard two-storey house Q1 2013
Source: RBC Economics, Housing Trends & Affordability, May 2013
August 2013
Slide 51
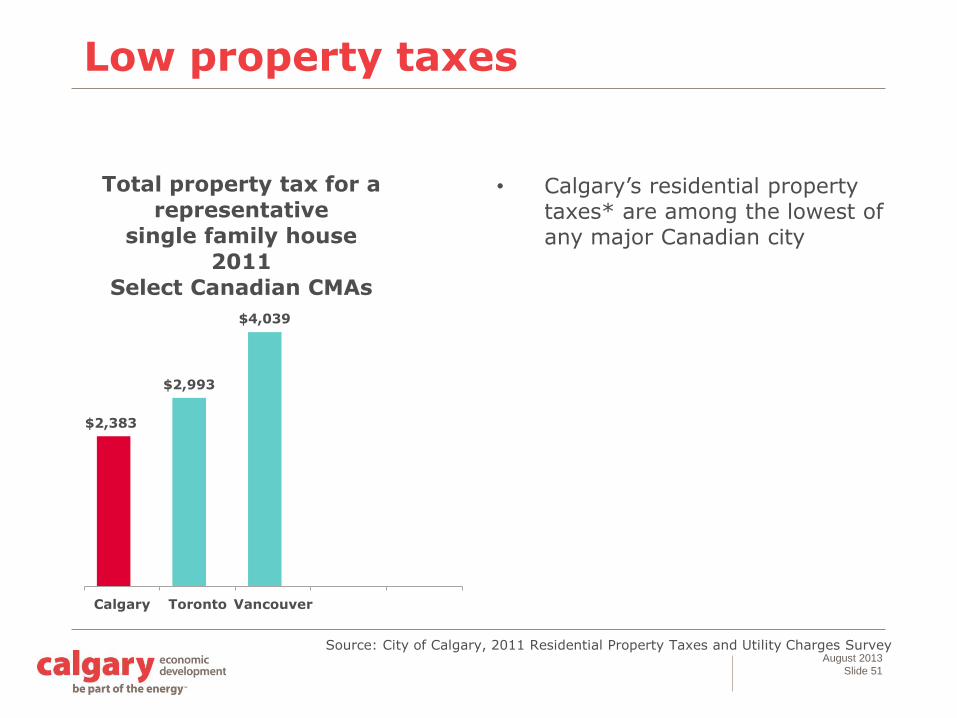
Low property taxes
$2,383
$2,993
$4,039
Calgary Toronto Vancouver
Total property tax for a
representative
single family house
2011
Select Canadian CMAs
• Calgary’s residential property taxes* are among the lowest of any major Canadian city
Source: City of Calgary, 2011 Residential Property Taxes and Utility Charges Survey
August 2013
Slide 52
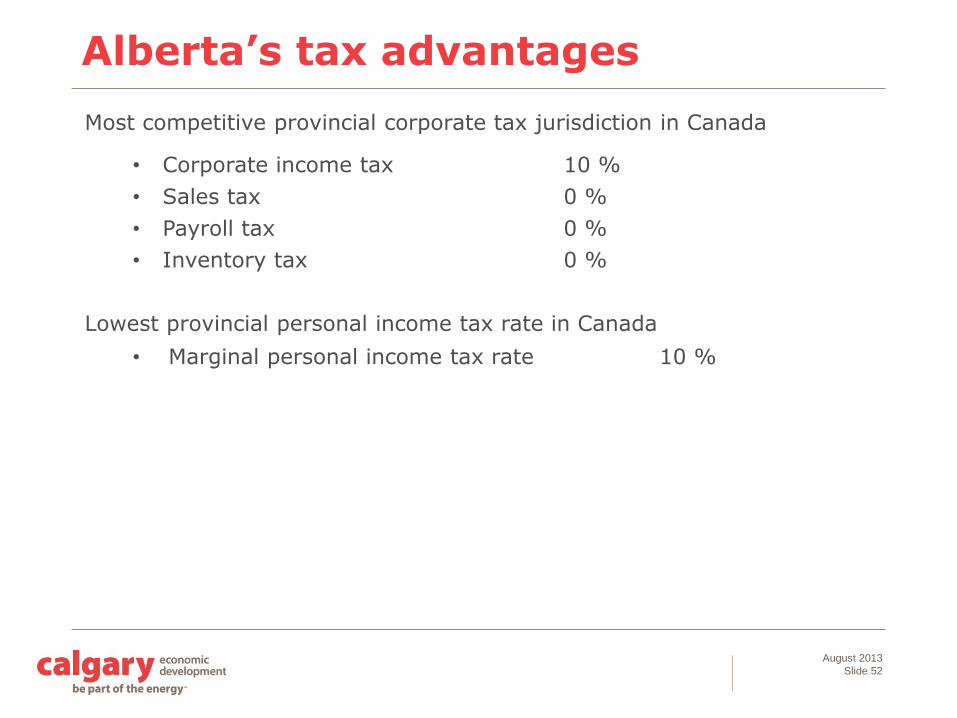
Alberta’s tax advantages
Most competitive provincial corporate tax jurisdiction in Canada
• Corporate income tax 10 %
• Sales tax 0 %
• Payroll tax 0 %
• Inventory tax 0 %
Lowest provincial personal income tax rate in Canada
• Marginal personal income tax rate 10 %
August 2013
Slide 53
Source: Alberta International and Intergovernmental Relations
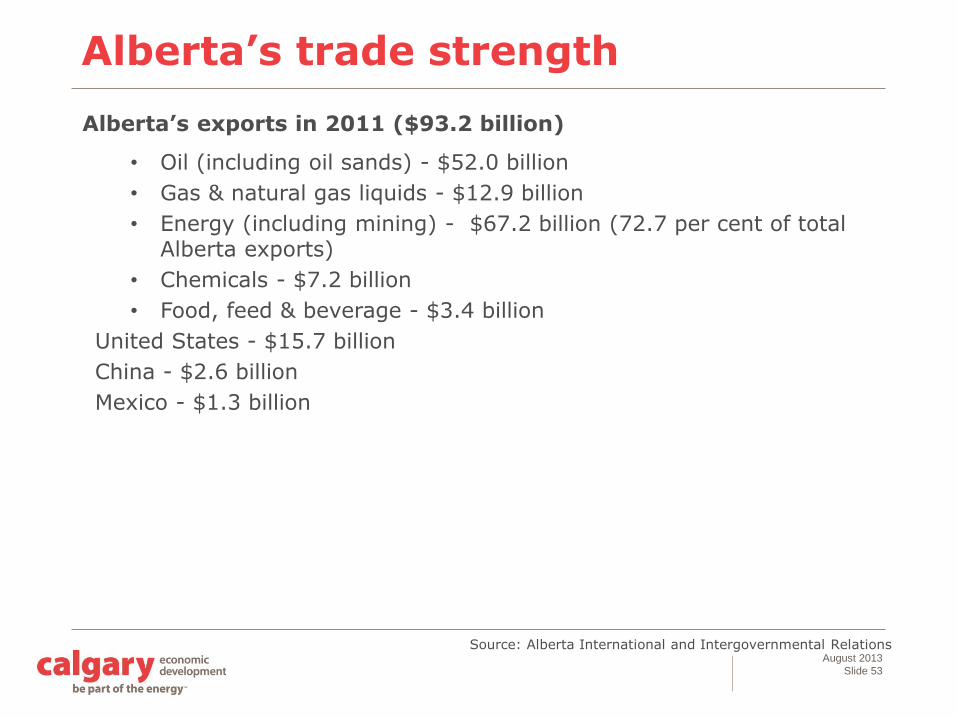
Alberta’s trade strength
Alberta’s exports in 2011 ($93.2 billion)
• Oil (including oil sands) - $52.0 billion
• Gas & natural gas liquids - $12.9 billion
• Energy (including mining) - $67.2 billion (72.7 per cent of total Alberta exports)
• Chemicals - $7.2 billion
• Food, feed & beverage - $3.4 billion
United States - $15.7 billion
China - $2.6 billion
Mexico - $1.3 billion
August 2013
Slide 54
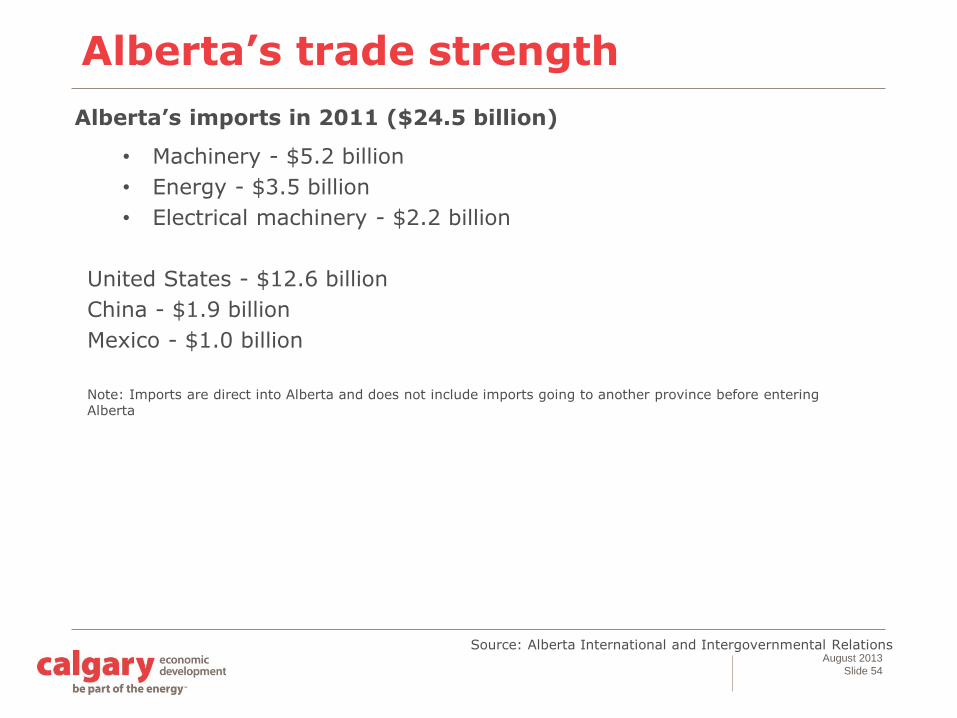
Source: Alberta International and Intergovernmental Relations
Alberta’s trade strength
Alberta’s imports in 2011 ($24.5 billion)
• Machinery - $5.2 billion
• Energy - $3.5 billion
• Electrical machinery - $2.2 billion
United States - $12.6 billion
China - $1.9 billion
Mexico - $1.0 billion
Note: Imports are direct into Alberta and does not include imports going to another province before entering Alberta
August 2013
Slide 55
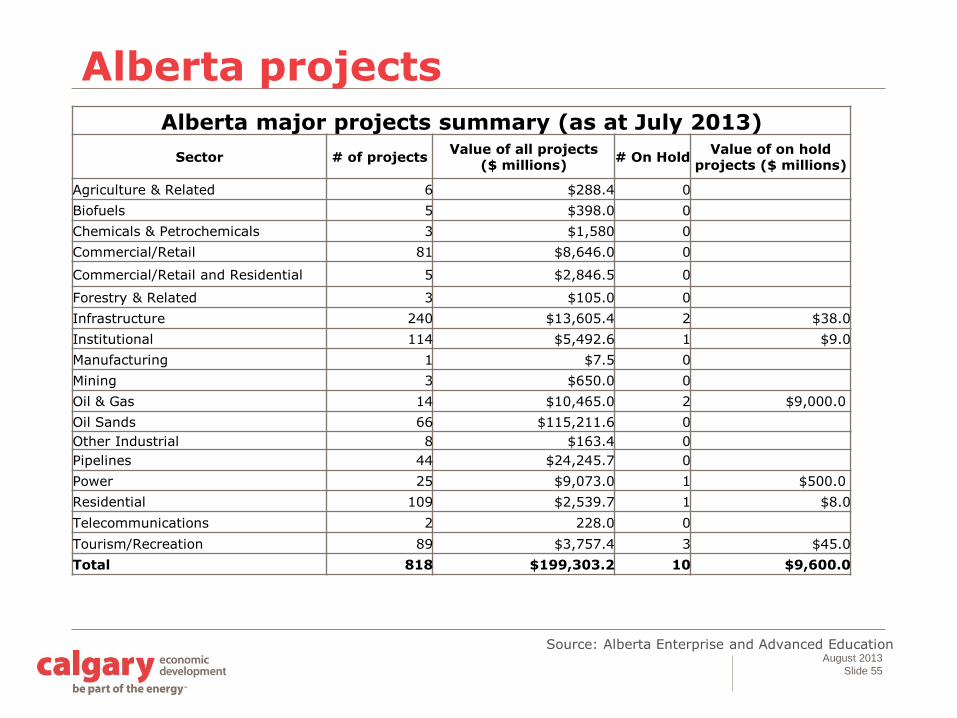
Source: Alberta Enterprise and Advanced Education
Alberta projects
Alberta major projects summary (as at July 2013)
Sector # of projectsValue of all projects
($ millions)# On Hold
Value of on hold projects ($ millions)
Agriculture & Related 6 $288.4 0
Biofuels 5 $398.0 0
Chemicals & Petrochemicals 3 $1,580 0
Commercial/Retail 81 $8,646.0 0
Commercial/Retail and Residential 5 $2,846.5 0
Forestry & Related 3 $105.0 0
Infrastructure 240 $13,605.4 2 $38.0
Institutional 114 $5,492.6 1 $9.0
Manufacturing 1 $7.5 0
Mining 3 $650.0 0
Oil & Gas 14 $10,465.0 2 $9,000.0
Oil Sands 66 $115,211.6 0
Other Industrial 8 $163.4 0
Pipelines 44 $24,245.7 0
Power 25 $9,073.0 1 $500.0
Residential 109 $2,539.7 1 $8.0
Telecommunications 2 228.0 0
Tourism/Recreation 89 $3,757.4 3 $45.0
Total 818 $199,303.2 10 $9,600.0
August 2013
Slide 56
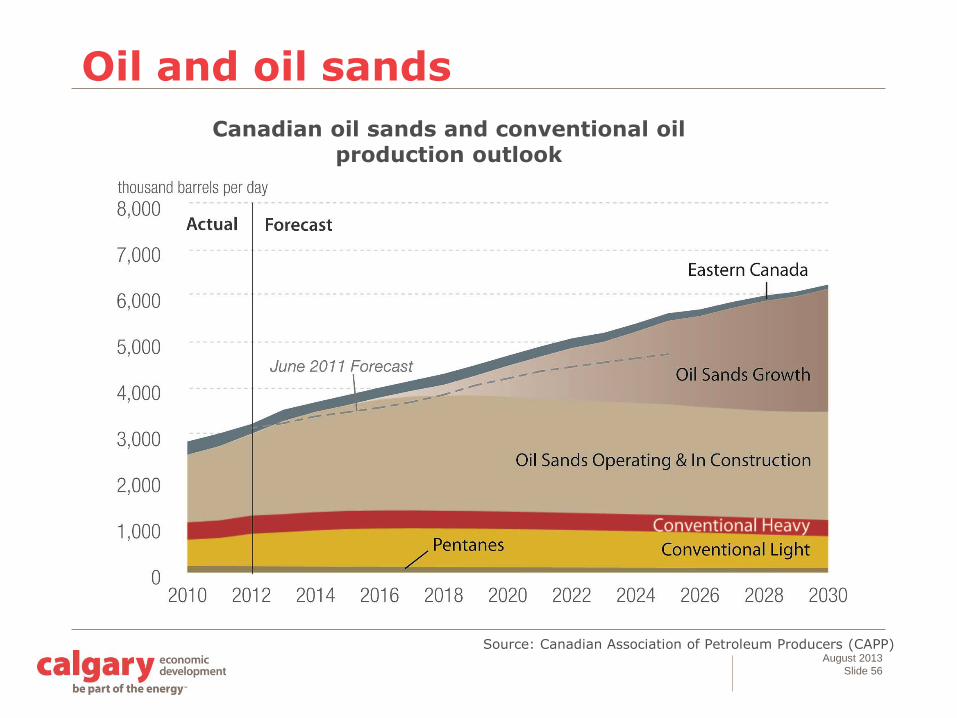
Source: Canadian Association of Petroleum Producers (CAPP)
Canadian oil sands and conventional oil production outlook
Oil and oil sands

August 2013
Slide 57
Source: Canadian Association of Petroleum Producers (CAPP)
Western Canadian oil sands and conventional oil production outlook
Oil sands in Western Canada

August 2013
Slide 58
Contact us
403-221-7831
www.calgaryeconomicdevelopment.com
Connect with us: @calgaryeconomic LinkedIn