
Economics of SMMEs - · PDF fileTHE ECONOMICS OF SMMES IN SOUTH AFRICA Al Berry, Magali von...
116
THE ECONOMICS OF SMMES IN SOUTH AFRICA Al Berry, Magali von Blottnitz, Rashad Cassim, Anna Kesper, Bala Rajaratnam and Dirk Ernst van Seventer December 2002
-
Upload
nguyennguyet -
Category
Documents
-
view
222 -
download
1
Transcript of Economics of SMMEs - · PDF fileTHE ECONOMICS OF SMMES IN SOUTH AFRICA Al Berry, Magali von...
THE ECONOMICS OF SMMES IN SOUTH AFRICA
Al Berry, Magali von Blottnitz, Rashad Cassim, Anna Kesper, Bala Rajaratnam and Dirk Ernst van Seventer
December 2002

ii
TABLE OF CONTENTS
LIST OF TABLES .......................................................................................................V
LIST OF FIGURES ....................................................................................................VI
BACKGROUND TO THE STUDY ..........................................................................1
OBJECTIVES OF THE STUDY.................................................................................1
OUTLINE OF THE STUDY ......................................................................................3
1 THE ECONOMIC RATIONALE FOR SMME PROMOTION .....................4
1.1 INTRODUCTION........................................................................................4 1.2 MAIN FUNCTIONS OF SMMES................................................................4 1.3 STRUCTURAL FEATURES OF THE SOUTH AFRICAN ECONOMY AND ITS IMPLICATIONS FOR SMME GROWTH..............................................5
1.3.1 The apartheid legacy .................................................................................5 1.3.2 International experience in dealing with such legacy ...................................6 1.3.3 Way forward for South Africa ..................................................................6
1.4 CAN SMMES RESOLVE THE UNEMPLOYMENT PROBLEM? – THEORETICAL CONSIDERATIONS ...................................................................7
1.4.1 Capital, productivity and demand for labour..............................................7 1.4.2 Labour markets, wage rates and productivity .............................................8 1.4.3 Role of the high productivity sector on labour markets ................................8 1.4.4 Role of the micro-enterprise and SME sectors ..........................................10
2 SIZE, PROFILE AND PERFORMANCE OF SOUTH AFRICA’S SMME ECONOMY.................................................................................................................12
2.1 INTRODUCTION......................................................................................12 2.2 NUMBER OF SMMES IN THE VARIOUS SIZE CATEGORIES ............13 2.3 Sectoral structure of South Africa’s SMMEs ...............................................14
2.3.1 Current sectoral profile...........................................................................14 2.3.2 Sectoral dynamics ...................................................................................16
2.4 ETHNIC STRUCTURE OF SOUTH AFRICA’S SMMES ........................19 2.4.1 “Black businesses” ..................................................................................19 2.4.2 Racial distribution by sectors ...................................................................20 2.4.3 Cross-racial partnerships ........................................................................21
2.5 GEOGRAPHIC LOCATION OF SOUTH AFRICA’S SMMES...............22 2.5.1 Rural and urban SMMEs.......................................................................22 Table 2.9: Distribution of SMMEs in 1996, according to type of location .................23 2.5.2 Evidence of untapped potential in rural areas ...........................................23
2.6 SMMES’ CONTRIBUTION TO THE ECONOMY ..................................25 2.6.1 SMMEs contribution to employment .......................................................25 2.6.2 Comments on the informal sector............................................................25 2.6.3 Data by industries (see Appendix A2) .....................................................26 2.6.4 Dynamic analysis: are SMEs employment generators? ..............................26 2.6.5 SMME contribution to the GDP.............................................................27

iii
2.6.6 Data by industries (see Appendix A2) .....................................................29 2.6.7 Dynamic analysis: is the share of SMEs growing?.....................................29 2.6.8 SMMEs’ contribution to Investment........................................................29
2.7 STATISTICAL DATA ON SMMES – CONCLUSIONS AND RECOMMENDATIONS ........................................................................................30
2.7.1 Directions for data collection...................................................................30 2.7.2 Directions for data presentation...............................................................31 2.7.3 Directions for data analysis .....................................................................32
3 THE SMME POLICY FRAMEWORK IN POST-APARTHEID SOUTH AFRICA ......................................................................................................................34
3.1 THE EVOLUTION OF THE SMME POLICY FRAMEWORK................34 3.2 THE DEVELOPMENT OF INSTITUTIONS TO FACILITATE SMME GROWTH ...............................................................................................................35 3.3 DESCRIPTION OF SOUTH AFRICA’S SMME SUPPORT NETWORK 36
3.3.1 Ntsika Enterprise Promotion Agency .......................................................36 3.3.2 Khula Enterprise Finance Ltd .................................................................36 3.3.3 DTI and its related institutions................................................................37 3.3.4 Provincial SMME Desks ........................................................................38
3.4 ASSESSING THE EFFECTIVENESS OF SOUTH AFRICA'S INSTITUTIONAL SUPPORT NETWORK ..........................................................39
3.4.1 No outreach to SMMEs .........................................................................39 3.4.2 Uneven distribution of services ................................................................39 3.4.3 High search costs of service provision.......................................................40 3.4.4 Cumbersome administration and discontinuity of programmes ..................40
3.5 SMME SUPPORT PROGRAMMES UNDER SCRUTINY .......................40 3.5.1 Awareness of support programmes ..........................................................43 3.5.2 Attempted usage of support programmes ..................................................43 3.5.3 Receiving assistance from support institutions...........................................43 3.5.4 Satisfaction with support programmes ......................................................43 3.5.5 Differential use of SMME support programmes .......................................44 3.5.6 General observations ..............................................................................46
3.6 CASE STUDIES: SOUTH AFRICA'S LBSC AND RFI PROGRAMMES46 Box 3.1: Case studies on South Africa's LBSC and RFI programmes .......................47 Box 3.2: New directions for South Africa's LBSC and RFI programmes...................48 Box 3.2: New directions for South Africa's LBSC and RFI programmes...................49
4 SMME RESEARCH AND ITS RELEVANCE TO POLICY – NEW INSIGHTS..................................................................................................................50
4.1 INTRODUCTION......................................................................................50 4.2 EMPLOYMENT, LABOUR REGULATION AND SKILLS......................51
4.2.1 Assessing the capacity of SMMEs to create sustainable employment..........51 4.2.2 Wage agreements and other labour regulation ..........................................55 4.2.3 The relative importance of wage rates on employment growth in SMMEs .57 4.2.3 Skill levels and training ...........................................................................61 4.2.4 Financial intermediation and SMMEs.....................................................65
4.3 FINANCIAL INTERMEDIATION – SOME THEORETICAL ISSUES ..66

iv
4.3.1 Access to finance: a multiple problem, and the role of creditworthiness ......69 4.3.2 The interest rate issue .............................................................................70 4.3.3 Looking for solutions...............................................................................72
4.4 ACCESS TO FINANCE IN SOUTH AFRICA .........................................74 4.4.1 Evidence from the supply side: The South African banking sector.............74 4.4.2 Non-bank lenders ...................................................................................75 4.4.3 Angel finance and venture capital ...........................................................76 4.4.4 Empirical evidence from the 1999 World Bank surveys............................77 4.4.5 Sources of capital ...................................................................................79
4.5 THE DEMAND SIDE AND PRODUCT MARKETS: THE GROWTH POTENTIAL OF SMMES IN THE CONTEXT OF LOW AGGREGATE DEMAND................................................................................................................85
4.5.1 Direct interventions in product markets ...................................................85 4.5.2 Indirect intervention in product markets...................................................87
5 CONCLUDING OBSERVATIONS ................................................................93
5.1 INTRODUCTION......................................................................................93 5.2 SMME POLICIES AS PART OF A WIDER FRAMEWORK ...................93
5.2.1 Macroeconomic policy and its impact on SMME growth ..........................93 5.3 THE LABOUR MARKET AND SMMES ..................................................94
5.3.1 Labour regulation and employment dynamics...........................................94 5.3.2 Flexibility of labour.................................................................................95 5.3.3 Future research on labour and SMMEs...................................................95
5.4 CAPITAL MARKETS AND FINANCIAL INTERMEDIATION............96 5.4.1 Some policy framework guidelines............................................................96 5.4.2 Further research needs............................................................................97
5.5 TRADE AND MARKET STRUCTURES..................................................98 5.6 CONCLUSIONS .........................................................................................99
APPENDIX A1: LABOUR MARKET REGULATION AND SMMES IN SOUTH AFRICA.....................................................................................................100
APPENDIX A2: STATISTICS ON SMMES, THEIR PROFILE AND THEIR CONTRIBUTION TO THE ECONOMY ............................................................102
REFERENCES ..........................................................................................................105

v
LIST OF TABLES
Table 2.1: Different indicators for the size of the SME sector .....................................13 Table 2.2: Ntsika statistics on the sectoral distribution of South Africa’s enterprises .15 Table 2.3: Primary, secondary and tertiary economy depending on enterprise size.....15 Table 2.4: Sectoral distribution of start-ups and new firms compared to the total
distribution of South Africa’s enterprises.............................................................17 Table 2.5: Registrations and de-registrations of CC’s and Pty’s by sector (1990-2000)
..............................................................................................................................17 Table 2.6: PDI share according to various studies .......................................................20 Table 2.7: Racial distribution of firm ownership by sector...........................................21 Table 2.8: Cross-racial partnerships among Johannesburg’s formal SMMEs, by sector
..............................................................................................................................22 Table 2.10: Distribution of SMMEs, according to location .........................................23 Table 2.11: Untapped potential of “opportunity entrepreneurship”............................24 Table 2.12: Contributions to employment by firm size - overview*.............................25 Table 2.13: Average number of employees in South African firms by size class, 1995
and 1997...............................................................................................................27 Table 2.14: Contributions to GDP by firm size – overview..........................................28 Table 2.15: SMEs contribution to nominal gross fixed capital formation 2000 (R
million).................................................................................................................30 Table 3.1: Functioning of SMME Programme Support ...............................................41 Table 3.2: The use of DTI programmes (n=792)........................................................42 Table 3.3: The use of Ntsika/Khula programmes (n=792) .........................................42 Table 3.4: Differential use of SMME promotion programmes by sector......................44 Table 3.5: Differential use of SMME promotion programmes by size class..................45 Table 3.6: Differential use of SMME promotion programmes by export status...........45 Table 3.7: Differential use of SMME promotion programmes by race .........................45 Table 4.1: Employment Growth in Existing SMMEs ...................................................53 Table 4.2: New entrants by size and sector..................................................................54 Table 4.3: Wage Elasticities for Black Formal Sector Employees ................................58 Table 4.4: Difficulty in finding skilled workers by sector .............................................63 Table 4.5: SMMEs that invested in any formal skills training, 1999 ...........................63 Table 4.6: Percentage of firms rating each training source as important.....................64 Table 4.7: Preliminary view on capital market situations (ignoring creditworthiness) 67 Table 4.8: The dysfunctional nature of capital markets, taking into account
creditworthiness ...................................................................................................68 Table 4.9: A rough estimation of the main banks’ SME book .....................................75 Table 4.10: Relative size of international private equity markets ................................76 Table 4.11: Firms’ applications for venture capital by firm size ...................................77 Table 4.12: Reasons for firms not undertaking planned investment in 1998, by
percentage ............................................................................................................79 Table 4.13: Use of formal loans in last five years by sub-groups of SMMEs (per cent)81 Table A1: The number of unions that SMMEs have to deal with by size (percent) .100 Table A2: The number of unions that SMMEs have to deal with by sector (percent)
............................................................................................................................100 Table A3: Level at which collective agreements are reached....................................100
vi
Table A4: Implicit costs of doing business with labour ..............................................101 Table A5: Impact of labour regulations on employment by sector............................101 Table A6: Reasons for subcontracting .......................................................................101 Table A7: Summary of model parameters and econometric statisticsError! Bookmark
not defined. Table A8: Size of firms by sector................................................................................102 Table A9: PDI Ownership by sector..........................................................................103 Table A10: Distribution of sectoral contribution to value added across size class, 2000
(formal sector only) ............................................................................................104 Table A11: Percentage contribution of SMMEs to employment in the main industrial
sectors (formal private sector only)....................................................................104
LIST OF FIGURES
Figure 1.1: Labour demand curve by size of enterprise ..................................................8 Figure 1.2: Effect of high productivity sector growth on labour demand.......................9 Figure 4.1: Total employment and growth by sector, 1997-1999 ................................52 Figure 4.2: Employment growth in existing firms by sector and race, 1997-99............53 Figure 4.3: Employment in firms that started in 1998..................................................54 Figure 4.4: Level of collective agreement for SMME firms..........................................59 Figure 4.5: Response to labour regulations, by firm size...............................................60 Figure 4.6: Reasons for hiring temporary workers........................................................61 Figure 4.7: Employment of skills by race, 1999 ............................................................62 Figure 4.8: Proportions and amounts SMMEs invest in formal skills training by sector,
1999......................................................................................................................64 Figure 4.9: Profile of the “investment expanding” SMMEs .........................................78 Figure 4.10: Sources of start up capital, 1999 ..............................................................80 Figure 4.11: Reasons for not using formal bank loans in the last 5 years .....................81 Figure 4.12: Effects of the 1998-interest rate increase on SMMEs, 1999 ....................84
1
BACKGROUND TO THE STUDY
Since 1994, South Africa has been faced with the challenges of re-integration into world markets as a global economy, while at the same time positioning itself to realise the high expectations of its populace regarding a successful transition towards a more democratic order. To achieve the objectives of economic growth through competitiveness on the one hand, and employment generation and income redistribution as a result of this growth on the other, South Africa’s small-, micro- and medium-sized enterprise (SMME) economy has been actively promoted since 1995. Despite voluminous research, however, there is still little clarity about the extent to which South Africa’s SMMEs contribute to poverty alleviation, economic growth, or international competitiveness. SMMEs encompass a very broad range of firms, from established traditional family businesses employing over a hundred people (medium-sized enterprises), down to the survivalist self-employed from the poorest layers of the population (informal micro-enterprises). While the upper end of the range is comparable to the small- and medium-sized enterprises (SME) population of developed countries, statistics reveal that an immense majority of SMMEs are concentrated on the very lowest end. These are primarily black survivalist firms.
OBJECTIVES OF THE STUDY
Against this background, the objectives of this study are twofold: the provision of a more comprehensive understanding of the challenges at stake in order to give future SMME policies a firm grounding; and an explanation of the lack of the impact of policy thus far. It also puts forward some new suggestions regarding the direction that government policy should take. In detail, this study attempts the following:
• Revisit the rationale of SMME policies While there is a general consensus on the importance of SMMEs in South Africa, their economic rationale to date has been neither well argued nor rigorously investigated. In particular, there is a lack of clarity on how SMMEs fit within the industrial policy framework and with regard to other objectives of government.
• Propose some goals for policy Optimising the SMMEs’ contribution to employment and economic development could be translated into the following broad objectives:
o Raising the rate of formation of new SMMEs with growth potential, since these SMMEs will contribute to investment, employment, and income generation;
2
o Encouraging new SMMEs arising from previously disadvantaged
backgrounds, since these start-ups can contribute to a redistribution of economic ownership and income, as well as a more participatory economy;
o Increasing the rate of graduation of micro-enterprises into the SME
categories, since only then will the legacy of apartheid be overcome;
o Raising performance of existing SMMEs with a view to increasing both their competitiveness and their ability to fulfil a role in society; and
o Decreasing the undesirable mortality rate of SMMEs that could be
viable undertakings.
• Main areas of intervention required
Achieving these broad objectives typically requires policies, which focus on:
o Increasing the supply of entrepreneurial talent and opening opportunities;
o Providing support to existing SMMEs – micro-enterprises in particular
– at no higher than its social opportunity costs;
o Providing incentives for formalisation of enterprises, including cultural bridging; and
o Assisting SMMEs (where necessary) to use resources as efficiently as
possible. Within the context of overall macro-economic performance, the ideal policy package for SMME support in South Africa should allow this sector to maximise its contribution to the economy's overall performance in terms of growth, employment and income distribution. This is likely to involve making more resources available to the sector as well as raising the efficiency with which it uses the resources already available to it. • Evaluation of policies to date With policy initiatives already under way, the study aims to disentangle the reasons for modest SMME growth, and why it has not made a more significant contribution to employment and overall economic growth in South Africa. By doing so, the study aims to assist the Department of Trade and Industry (DTI) in reconsidering its current SMME policy as an integral part of its industrial development strategies.

3
OUTLINE OF THE STUDY
The study is comprised of the following elements:
• A reflection on the rationale for SMME promotion and the economic role of the SMME sector (Chapters 1 and 2)
These sections are focused on how exactly the SMME sector contributes to economic growth, employment, and income distribution in the economy.
• A re-examination of South Africa’s SMME policy framework, and assessing current institutions and policy instruments (Chapter 3)
The report traces major policy developments in SMMEs since the birth of the democratic government. It looks at the specific policy framework and the kind of institutions that were set up to support these policies. An assessment is made of some of the key problems and limitations of both the policies and the institutions. This part is guided by two main concerns:
o Has DTI policy been in line with its institutional capacity?
o Are the policy instruments in use the best to foster the growth of SMMEs?
• An assessment of current research on South Africa’s SMMEs, and
highlighting the impact of specific “factor markets” on the performance of SMMEs (Chapter 4)
Chapter 4 represents the main contribution of the report: it harnesses existing research on SMMEs and draws on a range of new primary micro-works, such as the World Bank Gauteng Firm Survey by Chandra et al., (2001). This includes an analysis of labour markets, product markets, financial markets, as well as other relevant factors.
• Making some recommendations on how to establish a more enabling environment and identifying the need for further research (Chapter 5)
As a conclusion from the above, the last chapter highlights the main areas in which further research is required.

4
1 THE ECONOMIC RATIONALE FOR SMME PROMOTION
1.1 INTRODUCTION
This section begins with a general outline as to why a dynamic SMME sector is important to an economy. It attempts to provide a theoretical perspective as to how it can be specifically linked to the unemployment and productivity problem in South Africa. It aims, with a level of abstraction, to understand how an economy with typically South African characteristics functions, specifically with regard to productivity and unemployment. This chapter is organised into three sections. It first sketches the main functions of SMMEs and the theoretical conditions necessary for their attainment. It then describes the current state of the South African economy with regard to its structures, and the effect of economic reforms. It then specifically investigates the potential impact that SMMEs can have on employment, considering micro-enterprises on the one hand, and SMEs on the other.
1.2 MAIN FUNCTIONS OF SMMES
Firstly, SMMEs as enterprises have some economic roles to fulfil. They contribute to a country’s national product by either manufacturing goods of value, or through the provision of services to both consumers and/or other enterprises. This encompasses the provision of products, and to a lesser extent, services to foreign clients, thereby contributing to overall export performance. From an economic perspective, however, enterprises are not just suppliers, but also consumers, which have an important role to play if they are able to position themselves in a market with purchasing power: their demand for industrial or consumer goods will stimulate the activity of their suppliers, just as their own activity is stimulated by the demands of their clients. Demand in the form of investment plays a dual role, both from a demand-side (with regard to the suppliers of industrial goods) and on the supply-side (through the potential for new production arising from upgraded equipment). In addition, demand is important to income-generation potential of SMMEs, and their ability to stimulate the demand for both consumption and capital goods. Most importantly, and from a South African context, SMMEs have, at least in theory, the potential to generate employment and upgrade human capital. Economic historians have demonstrated the importance of this phenomenon in Europe’s industrialisation and the subsequent development of other emerging economies. As technological progress in agriculture liberated the agrarian labour force, this unskilled excess labour force was absorbed into small manufacturing industries and exposed to business experience, thereby encouraging a “learning-by-doing” effect. This combination of the employment of a vacant labour force, and improvement of their
5
skills through business exposure, strongly characterised the process of industrialisation and development. South Africa’s current economic situation is comparable to the above scenario: the excess labour force is “released,” not so much from the agricultural sector, but rather large enterprises in the secondary and tertiary sector. Generally, these enterprises are not necessarily facing economic recession, but rather are growing and transforming themselves in such a way that their demand for unskilled labour is decreasing. This results in an abundant pool of unskilled labour, which SMMEs can possibly employ and upgrade. From a different viewpoint, it has been suggested that, in cases of “jobless growth” and a mismatch between the demand and supply of unskilled labour, a shift in both the sectoral composition of the economy and the occurrence of growth in different categories of firms may be an important avenue for the generation of both employment opportunities and growth. The question here is whether a more robust SMME growth strategy in South Africa will bring about such changes. This in turn depends on whether SMMEs are more labour-intensive and therefore likely to employ unskilled labour, and whether they are able to provide a “skills upgrading process.” With these categories of functions defined from a theoretical perspective, the following section examines the structure of the South African economy to see whether SMMEs can, in their current position, fulfil these roles.
1.3 STRUCTURAL FEATURES OF THE SOUTH AFRICAN ECONOMY AND ITS IMPLICATIONS FOR SMME GROWTH
1.3.1 The apartheid legacy
In comparison with many other developing countries, the contribution of South Africa’s SMMEs to employment and economic growth is low. This relatively poor performance is often associated with the racial distortions in education, income and economic empowerment inherited from the previous regime. Nevertheless, there is a danger in ascribing all the responsibility for the underdevelopment of SMMEs to political disenfranchisement, since the corollary to this argument is that the new economic order provides a sufficient condition for the revitalisation of the SMME economy. The removal of apartheid, although necessary, has been insufficient in unravelling the full potential of the SMME economy, because the inherited structures contribute to the following:
• A highly dualistic economy not only characterised by a high productivity (modern) and a low productivity (informal) sector with little interaction between them, but also a division along racial lines;
• A transition phase marked by political uncertainty and considerable crime and
violence, both impacting negatively on local and foreign direct investment in the modern sector;

6
• A recent shift in industrial policy to liberalisation of trade and finance, and a rapid technological change reflecting a comparable process at the global level; and
• Low levels of education and training among the participants in the traditional
sector who have, in addition, suffered from the suppression of entrepreneurial activities.
1.3.2 International experience in dealing with such legacy
South Africa’s peculiar features imply that policy makers may only partly draw on international experience when looking for policy responses to promote economic and employment growth. There are other economies, such as Chile or Venezuela, for example, that have an historically strong mining base. Like South Africa, they suffered from high levels of unemployment and/or underemployment, resulting in income inequality, because public interventions and resources were focused on strengthening the mining industry, to the detriment of the more labour-intensive agricultural and manufacturing sectors. Chile, for example, solved the unemployment dilemma by creating a large public sector, while other governments protected their agriculture and manufacturing sectors so that the shrinkage in employment would not be so pronounced. For a country like South Africa, however, protectionism and increased state expenditure are contrary to the liberal philosophy adopted, as shown below. 1.3.3 Way forward for South Africa
South Africa has recently adopted a regime of trade liberalisation and fiscal prudence, thereby limiting the use of protectionism and public sector employment. This may partly explain why unemployment levels and income inequality have increased. Taking into account the characteristic dual economy, adequately remunerative employment could originate from:
• The high productivity sector increasing its level of employment, i.e. absorbing people previously located in the low productivity sector (or unemployed); and
• The low productivity sector increasing its income generating capacity through
investment, technological improvement and education and training. However, the success of each of these mechanisms is limited by the historical neglect of education and training for both employers and employees in the low productivity sector. Therefore the key challenge is identifying the best policy levers available to the government, given the problem of inequality and the overall thrust of an economic
7
reform strategy comprising fiscal prudence, trade liberalisation and deregulation of various economic sectors.
1.4 CAN SMMES RESOLVE THE UNEMPLOYMENT PROBLEM? – THEORETICAL CONSIDERATIONS
This section tries to highlight, from a theoretical standpoint, the requirements for using SMMEs as vehicles for employment creation. The interaction between capital, productivity and demand for labour are first explained, followed by a review of the conditions for equilibrium. 1.4.1 Capital, productivity and demand for labour
Economic production is defined as the combination of capital and labour to generate a “product.” The demand for labour can be understood as a function of the country’s national product, the availability and productivity of both capital and labour, and the ratio of substitution between capital and labour. More precisely, the productivity of one factor is boosted by the quality and abundance of the other factor, and this explains the difference in labour demand amongst enterprises and across countries. Countries with a broad capital base (typical of developed countries) exhibit high labour productivity, and because their national product is high, will be able to employ the majority of their labour force. By contrast, developing countries, South Africa included, are characterised by lower capital endowments and an abundance of low-skilled labour. Overall productivity in developing economies cannot be high as long as only a limited number of workers are needed to operate the fixed amount of capital. This results in a dearth of employment opportunities for unskilled labour. A similar distinction can be made between the various sizes of enterprises. This is done on the assumptions that the larger firms are more capital-intensive, and that the demand for labour is directly related to its marginal productivity. In large capital-intensive firms, the first few workers are highly productive, but as workers are added, their marginal productivity tapers off fast. Thus the demand curve for labour as a whole or for high-skilled labour starts high on the vertical axis of a typical demand – supply diagram for labour, but then falls sharply. In contrast, the labour demand of the micro-enterprise sector does not achieve high levels at any point. To begin with, much of the demand is imputed since the workers are self-employed. In addition, the marginal product of the labour employed is low because of the limited capital and simple technologies employed. The demand hence remains relatively flat (elastic), because of the low barriers to entry. The labour demand of the SMME sector lies between these two extremes. The first workers are relatively more productive than those in micro-enterprises, but less so than those in large firms. Productivity declines slower than in large firms as workers are added, but faster than in micro-enterprises. This is illustrated in Figure 1.1.

8
1.4.2 Labour markets, wage rates and productivity
The summation of the three labour demand curves described above constitutes the total demand curve, which in turn is a function of the wage. Its intersection with the supply curve of labour represents the equilibrium wage, which is applicable to all low-skilled workers in the absence of labour legislation or other institutions, which affect wages of various subgroups of the workers, found in this labour market segment. As Figure 1.1 illustrates, the demand curve is steep at the beginning, where most of the demand for labour originates from the high productivity sector, but flattens towards the bottom where it reflects the existence of the micro-enterprise sector. In other words, in a country with a large labour supply, the equilibrium wage for this category of relatively unskilled workers is defined by the marginal labour productivity in the micro sector. Figure 1.1: Labour demand curve by size of enterprise
labour demand (marginal productivity)
number of workers / wage
large enterprises
micro-enterprises
small and medium enterprises aggregated demand
1.4.3 Role of the high productivity sector on labour markets
A healthy high productivity sector directly contributes to employment creation. However, when capital is scarce, its main impact on employment is indirect, by means of technology spin-offs, subcontracting and transfers to the lower productivity sectors. The combination of an increase in the demand for labour in the high productivity sector, as well as the rest of the economy, produces a rightward shift of the labour demand curve. In South Africa’s case, however, technological upgrading seems to work in the opposite direction. The high productivity or modern sector seems to grow ‘vertically,’ i.e. with no transfer, technology spin-offs or other indirect benefits. As a result, wages in the high productivity sector rise, but fall in the other sectors. Such growth causes more income inequality, reinforced by the likely fall in wages of low-skilled micro-

9
enterprise employees because this segment of the labour market gets flooded (see Figure 1.2). Figure 1.2: Effect of high productivity sector growth on labour demand
l a b o u r d e m a n d
w a g e
h i g h - p r o d u c t i v i t y s e c t o r
l o w - p r o d u c t i v i t y s e c t o r
e f f e c t o f h i g h- p r o d u c t i v i t y s e c t o r g r o w t h w i t h s p i n - o f f s
a g g r e g a t e d d e m a n d
s u p p l y
l a b o u r d e m a n d
w a g e
h i g h - p r o d u c t i v i t y s e c t o r
l o w -p r o d u c t i v i t y s e c t o r
e f f e c t o f h i g h- p r o d u c t i v i t y s e c t o r g r o w t h w i t h o u t sp in -o f f s
a g g r e g a t e d d e m a n d
s u p p l y
International experience suggests that the direct (low) employment creation capacity of the high productivity sector does not vary much across developing countries, but that the extent of its positive impact on employment creation in the lower productivity sectors does. In the case of Latin America as a whole, for example, there has been virtually no net employment creation of this sort in the 1990s – even though a modest rate of overall economic growth was achieved. The Latin American experience suggests that the high productivity sector cannot be expected to provide the answer to a developing country’s employment needs in a world of liberalization, fiscal prudence and rapid technological change. Its employment growth is slow, and
10
unless productivity was raised in the other sectors, the equilibrium wage would stay low for a discouragingly long period. 1.4.4 Role of the micro-enterprise and SME sectors1
Returning to employment and wages in the low-skilled segment of the labour market, it is important to distinguish between the micro-enterprise sector and the SME sector. The micro-enterprise economy increases the average productivity of labour in the economy as a whole by ‘pulling into production’ unemployed low-skilled labour, whose skill levels are not sufficient to qualify for employment in larger firms. Although this probably does not raise the average labour productivity of the employed labour force, it makes the most productive use of the unemployed economically active population. This has the effect of raising total output in the economy at little or no opportunity costs. By means of support measures, the average labour productivity of those so employed could be enhanced. The marginal product of labour in the micro-enterprise sector determines the equilibrium wage for unskilled labour in the whole economy, although labour legislation and trade union power artificially push up wages in large-scale firms and part of the SME sectors, so that the actual wages tend to lie above those paid in the non-unionised micro-enterprise sector. Nevertheless, the social and economic importance of having policies that raise productivity in this micro sector must be viewed in light of the fact that its impact on earnings can go beyond the micro-enterprise itself. Their successful implementation raises not only the incomes of people employed therein, but of all other comparable workers in the economy whose incomes are not above the equilibrium due to ‘institutional distortions.’ Promoting the micro-enterprise sector with a micro-finance programme, for example, may raise the productivity of enough micro-enterprises (or induce the formation of dynamic ones to replace less productive micro-enterprises) so that the labour demand (labour productivity) curve of that sector will rise. Unfortunately, this cannot be the final resolution to the challenge of adequate employment, because the productivity levels of micro-enterprises have a relatively low ceiling. Hence, while effective policies impact positively on micro-enterprise productivity, they achieve poverty alleviation at the most, but not an expansion of the middle class. The SME sector, by contrast, is not just a desirable complement to growth in the high productivity sector and a multiplier of productivity increases in the micro sector, but holds in itself the main key to whether the country will succeed or fail in confronting its employment challenge. Labour productivity is sufficiently high in most of this sector so that its workers earn above the poverty line. Further productivity improvements raise average wage levels of this sub-sector. Even more helpful, however, is the horizontal expansion of this sector, through entry of new and growth in size of existing firms. This shift in the size distribution of firms can be explained by:
1 Please note that there is a distinction between SMMEs and SMEs. This is intentional, as medium-sized enterprises are often different from micro-enterprises.
11
• The redeployment of former lower skilled micro-enterprise employees to SME firms (or the ‘maturation’ of micro-enterprises into SMEs) until eventually only a few micro-enterprises are left; and
• The redeployment of high-skilled and less-skilled workers from the high
productivity sector, which tends to replace labour with capital. SMMEs therefore emerge not only from a productivity perspective, but also with an interest in income distribution, as the most promising section of South Africa’s economy. The country could have raised its average labour productivity by allocating a high share of capital to large firms, which yield scale economies, and/or firms using modern technologies. In this case, only a few high-skilled and well-paid workers would be needed to operate this capital, while the majority of the labour force produces with little capital, and hence low levels of productivity and remuneration. In this scenario, labour (as the abundant factor of production) is sub-optimally used and income distribution worsened, especially with regards to unskilled workers and labour entrants in particular. Since South Africa boasts a large pool of low-skilled workers, maximising average labour productivity of those who are employed seems to be the wrong path to follow at this time. Such a strategy would lead to a high rate of unemployment, and hence inequality in income distribution. While the micro-enterprise segment usually absorbs some of the unemployed, therefore slightly increasing the overall productivity of the economy, it is more desirable to have SMEs generate the bulk of employment, which is more productive, and hence able to pay higher wages. Admittedly, the correlation between firm size, labour intensity and labour productivity varies from country to country and industry to industry, but allows a first assessment of the potential of the SMME sector. If the theoretical assumptions above are accepted, and it acknowledged that the upgrading of skills in the labour force is pivotal to a prosperous SMME sector, it becomes equally clear that the overall economic success of a country like South Africa depends on the nature and effective implementation of its SMME support policies.

12
2 SIZE, PROFILE AND PERFORMANCE OF SOUTH AFRICA’S SMME ECONOMY
2.1 INTRODUCTION
Any policy decision concerning South African SMMEs requires accurate information about their size and structure, as well as the contribution of SMMEs to the economy. In particular, there is need to know the number and size of SMMEs, and where to find them. Because their needs vary strongly according to these two criteria, it is also important to know their distribution across age categories and across industries. Moreover, the potential of SMMEs for economic empowerment can only be estimated with a sense of the share of previously disadvantaged individuals (PDIs) in the ownership of SMMEs. Apart from these specific questions, more general information on the share of SMMEs to the economy can enlighten macro-economic policy on the impact of their actions on the sector. Unfortunately, accurate information is far from being available in South Africa, especially on the informal sector, which apparently represents at least two-thirds of the SMME population. Although the annual reviews of the State of Small Business in South Africa, published by Ntsika Enterprise Promotion Agency (Ntsika), represent an official source of data, they are not easily usable.2 This chapter aims to present an overview of available estimations on the SMME sector according to a variety of data sources. The diversity of statistics indicates just how difficult it is to undertake quantitative work on SMMEs in South Africa, and indicates the urgent need for complementary research.
2 In the last few years (1995-99), Ntsika tended to publish very comprehensive statistics based on fragmentary and sometimes outdated sources, which were compiled with a lot of extrapolation. For example, the combined data sources used for the 1997 review were the Registrar of Companies, the Receiver of Revenue, Unemployment Insurance Fund (UIF), National Population Census 1996 and Sectoral Censuses, as well as October Household Surveys from Statistics South Africa (SSA), Matrix Marketing databanks, Development Bank of Southern Africa employment series, the Reserve Bank and other commercial research agencies (Ntsika, 1999:76). This posed several potential problems, as economic SMME databases in South Africa are prone to inconsistency, national surveys and censuses are often published with a three to four year time lag and the extrapolating assumptions may be discretionary. Because the accuracy of the statistics was often questioned, Ntsika seems to have chosen, since 2000, to follow a more cautious line, with the result that that information stays very general and is no longer as comprehensive as it used to be. Most of the analyses make reference only to formal enterprises, and omit absolute numbers of establishments and employees.
13
2.2 NUMBER OF SMMES IN THE VARIOUS SIZE CATEGORIES
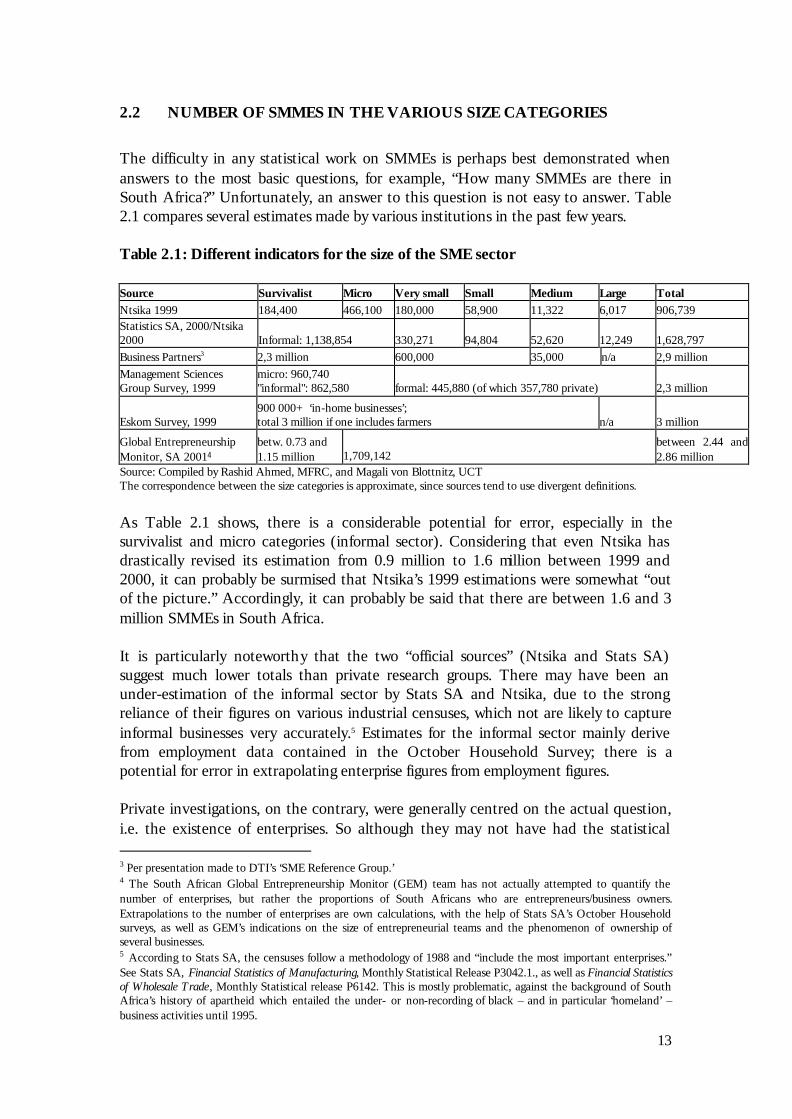
The difficulty in any statistical work on SMMEs is perhaps best demonstrated when answers to the most basic questions, for example, “How many SMMEs are there in South Africa?” Unfortunately, an answer to this question is not easy to answer. Table 2.1 compares several estimates made by various institutions in the past few years. Table 2.1: Different indicators for the size of the SME sector Source Survivalist Micro Very small Small Medium Large Total Ntsika 1999 184,400 466,100 180,000 58,900 11,322 6,017 906,739 Statistics SA, 2000/Ntsika 2000 Informal: 1,138,854 330,271 94,804 52,620 12,249 1,628,797 Business Partners3 2,3 million 600,000 35,000 n/a 2,9 million Management Sciences Group Survey, 1999
micro: 960,740 "informal": 862,580 formal: 445,880 (of which 357,780 private) 2,3 million
Eskom Survey, 1999 900 000+ ‘in-home businesses’; total 3 million if one includes farmers n/a 3 million
Global Entrepreneurship Monitor, SA 20014
betw. 0.73 and 1.15 million 1,709,142
between 2.44 and 2.86 million
Source: Compiled by Rashid Ahmed, MFRC, and Magali von Blottnitz, UCT The correspondence between the size categories is approximate, since sources tend to use divergent definitions.
As Table 2.1 shows, there is a considerable potential for error, especially in the survivalist and micro categories (informal sector). Considering that even Ntsika has drastically revised its estimation from 0.9 million to 1.6 million between 1999 and 2000, it can probably be surmised that Ntsika’s 1999 estimations were somewhat “out of the picture.” Accordingly, it can probably be said that there are between 1.6 and 3 million SMMEs in South Africa. It is particularly noteworthy that the two “official sources” (Ntsika and Stats SA) suggest much lower totals than private research groups. There may have been an under-estimation of the informal sector by Stats SA and Ntsika, due to the strong reliance of their figures on various industrial censuses, which not are likely to capture informal businesses very accurately.5 Estimates for the informal sector mainly derive from employment data contained in the October Household Survey; there is a potential for error in extrapolating enterprise figures from employment figures. Private investigations, on the contrary, were generally centred on the actual question, i.e. the existence of enterprises. So although they may not have had the statistical 3 Per presentation made to DTI’s ‘SME Reference Group.’ 4 The South African Global Entrepreneurship Monitor (GEM) team has not actually attempted to quantify the number of enterprises, but rather the proportions of South Africans who are entrepreneurs/business owners. Extrapolations to the number of enterprises are own calculations, with the help of Stats SA’s October Household surveys, as well as GEM’s indications on the size of entrepreneurial teams and the phenomenon of ownership of several businesses. 5 According to Stats SA, the censuses follow a methodology of 1988 and “include the most important enterprises.” See Stats SA, Financial Statistics of Manufacturing, Monthly Statistical Release P3042.1., as well as Financial Statistics of Wholesale Trade , Monthly Statistical release P6142. This is mostly problematic, against the background of South Africa’s history of apartheid which entailed the under- or non-recording of black – and in particular ‘homeland’ –business activities until 1995.
14
power of Stats SA (in terms of sample size), their data may have been closer to reality. For example, the Global Entrepreneurship Monitor 20016 found out that the “multiple ownership of businesses” was a frequent phenomenon (for example, almost 54% of “established business owners have started at least one other firm in the last 1.5 years”). This can explain why there may be more enterprises than there are self-employed. What this suggests is that the number of firms is likely to be higher than 1.6 million. A data and methodology problem is encountered in the consideration of size categories. Although the Small Business Act has provided an official definition of four size categories (micro, very small, small and medium), this is not followed by the official state agencies in that they either add new categories (“survivalist category”7 in 1995-99) or ignore some (“very small category,” Stats SA, Ntsika 2000), without explanations. Private studies are probably even less disciplined as far as their definition of size categories is concerned, also combining a legal criterion (formality) with a size criterion (micro-enterprises), which makes comparisons rather hazardous. It must be emphasised, however, that the weight of the smallest size categories (micro-enterprises) is overwhelming. Although their contribution to GDP is minor, they represent between 1.2 and 2.8 million businesses, i.e. between 69% and 80% of all SMMEs. In terms of dynamic evolution of the size classes, it is almost impossible to make accurate comments. While previous Ntsika publications may have suggested a decrease in the proportion of survivalist businesses (from 23% to 20%) and a significant increase in the micro- and very small category (from a combined 67% to 71%) between 1995 and 1997, the Management Services Group sees an increase in all categories, but mainly in the smallest informal size class (as well as in the public service) between 1998 and 1999.
2.3 SECTORAL STRUCTURE OF SOUTH AFRICA’S SMMES
The only sources giving comprehensive information on the numbers of firms by sectors are the data published by Ntsika (1997, 1999, 2000) for the years 1995, 1997 and 1999. This is problematic, since Ntsika may have overlooked a number of enterprises, which may or may not be concentrated in a few sectors. A summary of statistics is presented below. 2.3.1 Current sectoral profile
Table 2.2 shows a static picture of the SMME population by sectors for the last five years.
6 Conducted by the Graduate School of Business of the University of Cape Town 7 Essentially, Ntsika defines the “survivalist” enterprise as a business in which “the income generated is less than the minimum income standard. Annual turnover is typically less than R12,000.” (Annual Review 1999, p. 15).

15
Table 2.2: Ntsika statistics on the sectoral distribution of South Africa’s enterprises 1995 1997 2000* 1 Agriculture, Forestry etc. 92300 98,060 204,429
11.0% 10.8% 12.6% 3. Manufacturing 113555 106,019 163,343
13.6% 11.7% 10.0% 5. Construction 79974 88,516 147,830
9.6% 9.8% 9.1% 6. Trade; repairs; hotels and restaurants 351,183 365,980 699,106
42.0% 40.4% 43.0% 7. Transport, storage, communication 50007 58,796 85,360
6.0% 6.5% 5.2% 8. Financial and business services 65700 77,826 111,996
7.9% 8.6% 6.9% 9. Social and personal services 80400 107,013 179,837
9.6% 11.8% 11.1% 836850 906,690 1,626,459
Source: Own calculations based on Ntsika 1997, 1999 and 2000.8
Because of the statistical weakness of the estimates presented above, these figures should be seen as providing an order of magnitude, rather than very precise indications. Thus, the comparison between the three years may not be very reliable. Nevertheless, interesting findings emerge from these estimations. It is not surprising that the sectors SIC 2 and 4 (mining and quarrying, and electricity and water supply) are almost irrelevant to the SMME economy. More interesting is the distribution between primary, secondary and tertiary sectors. Table 2.3: Primary, secondary and tertiary economy depending on enterprise size Among informal / survivalist-
micro businesses Among large enterprises Among all enterprises
1995 1997 2000 1995 1997 2000 1995 1997 2000 Primary (SIC 1)
6.4% 8.4% 13.7% 24.6% 25.3% N/a 10.8% 10.8% 12.6%
Secondary (SIC 2-5)
22.7% 21.6% 20.7% 34.8% 32.2% N/a 23.6% 21.9% 19.4%
Tertiary (SIC 6-9)
70.9% 70% 63.6% 40.6% 42.6% N/a 65.4% 67.2% 66.2%
Source: Own calculations based on Ntsika 1997, 1999 and 2000.9
8 It is important to note that the 2000 estimations follow a different methodology than the previous years, and may therefore not be fully comparable. The statistics include large enterprises, because it was not possible to isolate them in the 2000 figures. However large enterprises have barely any impact on the overall sectoral distribution. The figures do not add up to 100% because some sectors which are less relevant for SMMEs (mining and quarrying, electricity, glass, and water supply), as well as “other activities not adequately defined,” have been left out of this table. 9 Figures for 2000 do not add up to 100% because the SIC 10 (“other activities not adequately defined”) has been excluded.
16
Table 2.3 reveals two interesting findings. First, a pronounced majority of the smallest of South Africa’s enterprises, which come mostly from the informal sector, are active in the tertiary sector, especially in trade. This is not surprising, as it is well known that primary and secondary activities require an amount of capital (land for the former, machinery and equipment for the latter), which is often not affordable to ‘emerging’ enterprises. However, the differences between the 1995-1997 estimations and the 2000 estimations in this regard are striking; the 2000 estimations (which capture almost twice as many informal businesses as the previous ones) seem to have identified a much higher proportion of those firms in the primary sector than the previous studies. This may be due to an effective change in land ownership or to a better count of emergent farmers in the previous homelands and other rural areas. Surprisingly, the 2000 estimations also suggest that secondary activities such as manufacturing and construction are even more dominant in the informal sector than in the formal economy. Again, it is difficult to separate the dynamic effects (decrease of the secondary sector within the last decade) from the impact of the change of methodology. 2.3.2 Sectoral dynamics
As mentioned before, any accurate comments on the sectoral evolution of the SMME population made on the basis of Ntsika statistics is perilous, given the margin of error suggested by the gaps between 1997 and 2000. More limited studies are probably helpful in examining the dynamics of the various sectors. In particular, GEM (2001) gives indications on the sectors in which start-ups were created in 2000-2001 and the sectors where new firms were present. A comparison of these figures with the overall distribution of enterprises as suggested by Stats SA 2000 may indicate dynamic sectors. The difficulty with this approach is that a sector with a high proportion of “start-ups and new firms” can be either a new, developing, or characterised by a very high firm turnover, i.e. there are many births and many deaths within each year. Despite its caveats10, a look at the registration and deregistration statistics of the Registrar of Companies can help support the interpretations of GEM’s results. These two sources, presented in Tables 2.4 and 2.5, enable the building of qualified presumptions on the following questions: In the last five years and in 2000, which sectors witnessed the most enterprise creation? In which sectors does entrepreneurship appear to be sustainable? 10 Firstly, the Registrar of Companies per definition cannot capture the informal sector. In addition, unfortunately, not every new registration signifies the creation of a truly trading company. Registrations may be driven by mergers, change in legal status or activity, or relocation; also, sometimes a dormant company is registered only for tax purposes. Similarly, take-overs and relocations can affect deregistrations.

17
Table 2.4: Sectoral distribution of start-ups and new firms compared to the total distribution of South Africa’s enterprises GEM 2001 Ntsika 2000
SIC Start-ups11 New firms Total
1 Agriculture, hunting, forestry and fishing 1.3% 2.6% 12.6%
3. Manufacturing 14.3% 19.1% 10.0%
5. Construction (including mining and quarrying) 3.7% 5.0% 9.1%
6. Trade; repairs; hotels and restaurants 46.8% 54.3% 43.0% 61+63 Of which wholesale, incl. fuel and vehicles 6.0% 6.5%
62+64 Of which retail, repair, hotels & restaurants 40.8% 47.9%
7. Transport, storage and communication 9.8% 1.7% 5.2%
8. Financial and business services 10.4% 13.1% 6.9%
9. Community, social and personal services 13.6% 4.2% 11.1% 100% 100% 100% Sources: Own calculations based on GEM 2001, Ntsika 2000.
Table 2.5: Registrations and de-registrations of CC’s and Pty’s by sector (1990-2000) 1990-1999 1999 2000
SIC Codes Registrations
Registr. / Ó formal
Registrations Deregistrati
on deregistr- / registr
Registrations
2000 / 1990-99
1 Agriculture/primary sector 14,988 38.8% 3,542 237 6.7% 3,775 25.2% 3. Manufacturing 43,013 111.6% 6,824 768 11.3% 7,357 17.1% 5. Construction 46,212 170.4% 6,983 680 9.7% 7,572 16.4%
6. Trade; repairs; hotels and restaurants 206,437 156.8% 35,047 3,377 9.6% 40,603 19.7%
7. Transport, storage & communication 21,632 54.2% 2,961 271 9.2% 3,237 15.0%
8. Financial & bus. Services 247,525 365.5% 37,374 4,061 10.9% 40,721 16.5%
9. Social & personal services 27,552 47.2% 4,813 394 8.2% 5,531 20.1% Totals 610,404 147.6% 98,041 9,846 10.0% 109,359 17.9% Source: Own calculations based on Registrar of Companies, as quoted by Ntsika, 1999-2000.
11 GEM defines “start-ups” as businesses that have not paid salaries for more than three months, while a “new firm” is a business “that has paid salaries for between three months and three-and-a-half years”.

18
• Sectors with high company creations in the last 5-10 years According to both sources, two sectors emerge as having had a strong creation activity, namely the financial and business services and trade/hotels and restaurants. This is not surprising as these are known to be popular start-up activities. In the former case, though, this dynamic creation activity seems to be compensated by a fairly high “attrition rate”12, almost 11% of new registrations in 1999. The manufacturing sector is fairly dynamic, as GEM results suggest (high share among new firms in particular). Nevertheless, according to registration statistics, the sector’s creation activity is rather ‘average’ relative to its size in the formal economy. What is more, the sector appears to have the highest attrition (11.3%).
• Sectors with high company creations in 2000 Looking at most recent creations (in 2000), the above-mentioned three sectors remain significant. In addition, the sector of “social and personal services” emerges both from GEM results (very high share of start-ups but not of new firms) and from the Registrar’s data as a sector where creations have accelerated in 2000.
• Contradictory results For three sectors, the two sources apparently yield contrary results. Apart from possible measuring weaknesses, other explanations are also sought for this discrepancy. Construction: The Registrar suggests that in the last 10 years, the construction sector has had the second-most vibrant registration activity, albeit with a slight slow-down in 1999, while the GEM findings suggest that there are rather few new firms in that sector. While its overall ‘attrition profile’ is average (9.7%), it is very dramatic among private companies (46.3%). This could possibly be attributed to a discrepancy between the formal and informal sector, a high “infant mortality” rate leading to a much smaller number of living young companies than were created, and/or the re-registration of proprietary companies (Ptys) as close corporations (CCs), and the phenomenon of dormant companies.13 Transport and communication: This sector consists of among others, activities such as “telecommunications” or “tour operators/ travel agencies,” which are known to be popular start-up activities – and also activities such as taxi driving. While GEM found a very high share of start-ups – though not of new firms in that sector – the registration activity seems to have slightly slowed down in 1999-2000, especially for CCs.
12 The ratio of deregistrations to registrations, which we call an “attrition rate,” should not be seen as a proxy for a “mortality rate,” which would be the ratio of deaths to the entire sector’s population which is typically much lower. 13 Examples of these are black economic empowerment companies, which are registered for the purpose of winning government tenders, while in reality they are merely fronts for older white-owned firms. This trend has received widespread publicity and criticism.

19
This may arise from a difference in the delimitation of the sectors14 or by the fact that while the communication and tourism sectors are beginning to be saturated, which shows up as a high infant mortality. This may have reduced the attractiveness of the sector for start-ups. Agriculture, fishing and hunting: The primary sector shows an intriguing pattern when comparing registrations in 2000 to the registration activity in 1990-99. Undoubtedly, there has been a great acceleration in the registrations of CCs in 1999-2000. However, GEM does not corroborate this, as they found very few new firms in that sector. The hypothesis of an “old sector” is also confirmed by the low rate of attrition. It is difficult to correctly interpret these results without a study of the structural changes in agriculture as a whole. This would require knowing what proportion of agricultural businesses is registered as CCs or private companies. In any case, the land reform process seems to be slowly generating some emerging farming businesses.
2.4 ETHNIC STRUCTURE OF SOUTH AFRICA’S SMMES
Given South Africa’s specific history of apartheid, which meant the exclusion of the majority of potential entrepreneurs from proper education and access to property and/or financial resources, it is important to know to what extent and in what forms PDIs are able to take their part in business. 2.4.1 “Black businesses”
The following statistics could be used: Ntsika estimated the share of PDI ownership at 50% in 1997; GEM suggests that in 2001, 76.8% of entrepreneurs are either black, coloured or Indian. While it is plausible that there has been an increase in the share of PDIs in the last four years, most of the difference is, however, believed to stem from Ntsika’s under-estimation of the informal sector. The share of “non-whites” is noticeably higher in the informal sector/survivalist firms than in the formal sector. The World Bank study on formal SMMEs in the Johannesburg area illustrates the very small significance of PDIs in the formal economy.
14 GEM follows international sector codes, while the Registrar classifies companies along the South African SIC system.

20
Table 2.6: PDI share according to various studies
Survivalist + Micro
Very Small "unspecified" Small Total
Ntsika 1997:
Number of PDI-owned firms 434,428 15,875 16,625 466,928 PDI-share within size category 65.9% 15.8% 35.9% 57.9% GEM 2001 Survivalist Declared firms15 Number of white-owned firms 28,525 392,220 420,745 Number of Indian-owned firms 4,989 90,650 95,639 Number of coloured-owned firms 42,633 186,658 229,290 Number of black-owned firms 653,405 1,039,615 1,693,020 Total number of PDI-owned firms 701,027 1,316,922 2,017,949 PDI-share within category 96.1% 77.1% 82.7%
Chandra 1999 (formal and urban) <20 employees
20-49 employees
Number of PDI-owned firms 110 35 PDI-share within size category 18.5% 18.0%
2.4.2 Racial distribution by sectors
Taking a look at the main sectors, it appears that the share of PDIs is highest in transport and communication, mining and quarrying, and construction and trade (Ntsika) as well as community services (GEM). In agriculture and financial and business services, the share is lower.
15 "Declared firms" are not necessarily formal businesses, but enterprises whose owners view themselves as owning a business, while "survivalist" firms are those whose owners are those whose owners do not know whether they can qualify themselves as business owners or not.

21
Table 2.7: Racial distribution of firm ownership by sector
2.4.3 Cross-racial partnerships
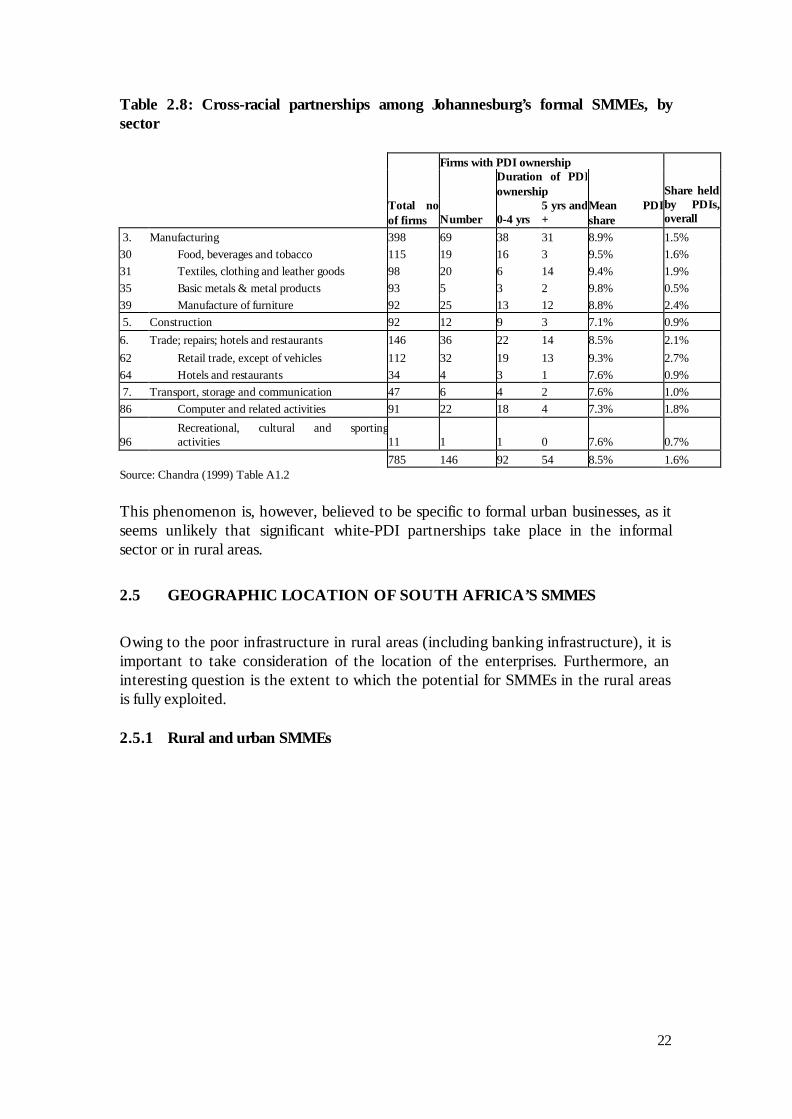
The socio-economic context of PDIs, in particular the lack of funds to start businesses on their own, as well as the rise of so-called “affirmative procurement” (preference given by the government or large corporations to black-owned firms in their tendering activities), have led to an increase of cross-racial partnerships in the establishment of firms. Recent data proves that these partnerships are very prevalent for urban formal SMMEs in the Johannesburg area. Chandra (1999) provides evidence that, among urban formal businesses, when PDIs are associated to a business they hold on average less than 10% of the firm (see Table 2.8), the remainder being presumably white South Africans (or possibly foreigners). There appears to be no significant sectoral differences in this regard. In general, it appears that almost two-thirds of these partnerships were only started in the last four years. The textile/clothing sector seems to be the only one that had significant PDI participation before that period.
NTSIKA 1997 GEM 2001
SIC Codes White PDI White Black Coloured Indian PDI
1 Agriculture, hunting, forestry 39,500 29,235 11,972 14,170 0 0 14,170 and fishing 57.5% 42.5% 45.8% 54.2% 0.0% 0.0% 54.2% 2. Mining and quarrying 2,895 7,090
29.0% 71.0% 3. Manufacturing 35,962 51,280 42,607 131,305 37,793 12,436 181,534
41.2% 58.8% 19.0% 58.6% 16.9% 5.5% 81.0% 4. Electricity, gas and water 4,998 3,570 Supply 58.3% 41.7% 5. Construction 24,808 57,720 30,283 14,170 25,339 0 39,508
30.1% 69.9% 43.4% 20.3% 36.3% 0.0% 56.6% 6. Trade; repairs; hotels and 107,106 198,330 121,484 524,274 101,139 49,743 675,157
Restaurants 35.1% 64.9% 15.2% 65.8% 12.7% 6.2% 84.8% 7. Transport, storage and 9,973 36,688 30,283 83,128 12,669 0 95,797 communication 21.4% 78.6% 24.0% 65.9% 10.0% 0.0% 76.0%
8. Financial services, insurance, 56,525 20,725 91,201 41,564 12,669 12,436 66,669
real estate & business services 73.2% 26.8% 57.8% 26.3% 8.0% 7.9% 42.2% 9. Community, social and 48,381 55,190 23,945 137,917 25,339 6,218 169,474 personal services 46.7% 53.3% 12.4% 71.3% 13.1% 3.2% 87.6% 338,981 466,928 351,774 946,527 214,948 80,833 1,242,308
42.1% 57.9% 22.1% 59.4% 13.5% 5.1% 77.9%
22
Table 2.8: Cross-racial partnerships among Johannesburg’s formal SMMEs, by sector Firms with PDI ownership
Duration of PDI ownership
Total no of firms Number 0-4 yrs
5 yrs and +
Mean PDI share
Share held by PDIs, overall
3. Manufacturing 398 69 38 31 8.9% 1.5% 30 Food, beverages and tobacco 115 19 16 3 9.5% 1.6% 31 Textiles, clothing and leather goods 98 20 6 14 9.4% 1.9% 35 Basic metals & metal products 93 5 3 2 9.8% 0.5% 39 Manufacture of furniture 92 25 13 12 8.8% 2.4% 5. Construction 92 12 9 3 7.1% 0.9%
6. Trade; repairs; hotels and restaurants 146 36 22 14 8.5% 2.1%
62 Retail trade, except of vehicles 112 32 19 13 9.3% 2.7% 64 Hotels and restaurants 34 4 3 1 7.6% 0.9% 7. Transport, storage and communication 47 6 4 2 7.6% 1.0% 86 Computer and related activities 91 22 18 4 7.3% 1.8%
96 Recreational, cultural and sporting activities 11 1 1 0 7.6% 0.7%
785 146 92 54 8.5% 1.6% Source: Chandra (1999) Table A1.2
This phenomenon is, however, believed to be specific to formal urban businesses, as it seems unlikely that significant white-PDI partnerships take place in the informal sector or in rural areas.
2.5 GEOGRAPHIC LOCATION OF SOUTH AFRICA’S SMMES
Owing to the poor infrastructure in rural areas (including banking infrastructure), it is important to take consideration of the location of the enterprises. Furthermore, an interesting question is the extent to which the potential for SMMEs in the rural areas is fully exploited. 2.5.1 Rural and urban SMMEs

23
Table 2.9: Distribution of SMMEs in 1996, according to type of location16
Ntsika 1997 Ntsika 2000
Survivalist & Micro
Very small & Small
Medium Total SMMEs Total SMMEs
Mainly urban provinces: Gauteng, Western Cape and KwaZulu-Natal 17 415,800 175,400 8,770 599,970 944,034
In % 63.9% 73.5% 77.5% 66.6% 57.9%
Mainly rural provinces (other 8 provinces) 234,900 63,400 2,552 300,752 685,622
In % 36.1% 26.5% 22.5% 33.4% 42.1%
Total number of enterprises 466 100 180 000 11 322 900,722 1,629,656
As Table 2.9 shows, Ntsika’s estimations in the last few years (until 1999) seem to have grossly under-estimated the number of enterprises in the most rural provinces, especially the Eastern Cape, Limpopo Province and Mpumalanga. In these provinces, SMMEs are – even more often than in urban areas – of an informal and survivalist nature. The new evaluation method used by Ntsika in 2000 suggests a much better balance between urban and rural areas than was until recently assumed. GEM’s results, on the other hand, suggest a much lower prominence of rural businesses, although in the survivalist economy almost a third of businesses come from rural areas (Table 2.10). Table 2.10: Distribution of SMMEs, according to location Survivalist Formal and semi-formal Total
Metro18 320,309 47.7% 1,081,043 64.8% 1,401,352 59.9%
Small Town 148,310 22.1% 251,509 15.1% 399,819 17.1% Rural 203,575 30.3% 335,898 20.1% 539,473 23.0% Total 672,194 1,668,450 2,340,644 Source: GEM 2001 combined with Stats SA/OHS 1999 (own calculations)
Note that it would seem that small enterprises are at a disadvantage in small towns, relative to rural areas. 2.5.2 Evidence of untapped potential in rural areas
From these divergent sources, it is difficult to establish precisely the number of SMMEs in rural areas. GEM suggests another approach to this conundrum, which is the comparison of existing entrepreneurs with the potential for further business creations.
16 Source: Ntsika, State of Small Business in South Africa, Annual Review, 1999, Table 6 p. 33. 17 Although they have significant rural areas, especially KwaZulu-Natal, three provinces (Gauteng, Western Cape and KwaZulu-Natal) are classified as “mainly urban,” while the other six provinces are termed “mainly rural.” 18 Calculation based on the assumption that approximately 9 million of people aged 16 and above reside in South Africa’s metropoles.

24
One limitation of the GEM methodology is that the business creation potential is self-assessed, i.e., respondents are asked whether they believe that there are opportunities and that they would have the skills necessary to start a business. However, the results are intriguing, and suggestive of a huge untapped business potential in rural areas – especially among black people. Table 2.11: Untapped potential of “opportunity entrepreneurship”
White Indian Coloured Black Metro* Small Town Rural Total
"Potential opportunity entrepreneurs"19 7.0% 6.2% 8.1% 5.8% 6.3% 5.4% 6.0% 6.1% Actual opportunity entrepreneurs
8.1% 6.2% 6.1% 2.6% 6.3% 3.8% 0.7% 3.7%
Untapped potential -1.1% 0.0% 2.0% 3.2% 0.0% 1.6% 5.3% 2.4%
No of adults -38,350 0 49,364 657,139 0 87,008 593,420 665,490 Source: GEM 2001, combined with OHS data. Note – all percentage figures are percentages of the adult
population within the category. Table 2.11 shows that among urban and white and Indian populations, there is little or no potential for more entrepreneurship opportunity; the figures even suggest a negative untapped potential among the whites, presumably because many entrepreneurs realise a posteriori that either they do not have the skills, or the market potential is insufficient. On the other hand, it seems that, with the appropriate support (including finance, infrastructure and mentoring), there could be a considerable increase in entrepreneurship in rural areas and among coloured and black people. This suggests that government policy should endeavour to stimulate small business activity among those population groups. The figures in Table 2.11 have two limitations, though. First, the “actual opportunity entrepreneurs index” of 0.7% for rural areas does not mean that there are a few entrepreneurs among rural populations. Rather, GEM indicates that 1.8% of the rural adult population is involved in entrepreneurial activities and 2.9% own established businesses. However, these rural businesspeople are mostly characterised as “necessity entrepreneurs.”20 The scarce job opportunities in rural areas possibly distort the distribution between “necessity” and “opportunity entrepreneurs,” leading to an exaggeration of the “untapped potential.” The second caveat is that the “potential opportunity entrepreneurs” are self-assessed. It is possible that, with their lack of exposure and business experience, rural and black South Africans over-estimate both the opportunities present on the market, and their own ability to start a business.
19 Defined as adults who believe that there are good business opportunities in the area they live in, that they have the skills to start a new business, and would not be prevented by fear of failure. 20 That is, engaged in business activities “primarily because they have no better chances for work”; by contrast, “opportunity entrepreneurs” are owner-managers of start-up or new firms “primarily to take advantage of a business opportunity.”
25
2.6 SMMES’ CONTRIBUTION TO THE ECONOMY
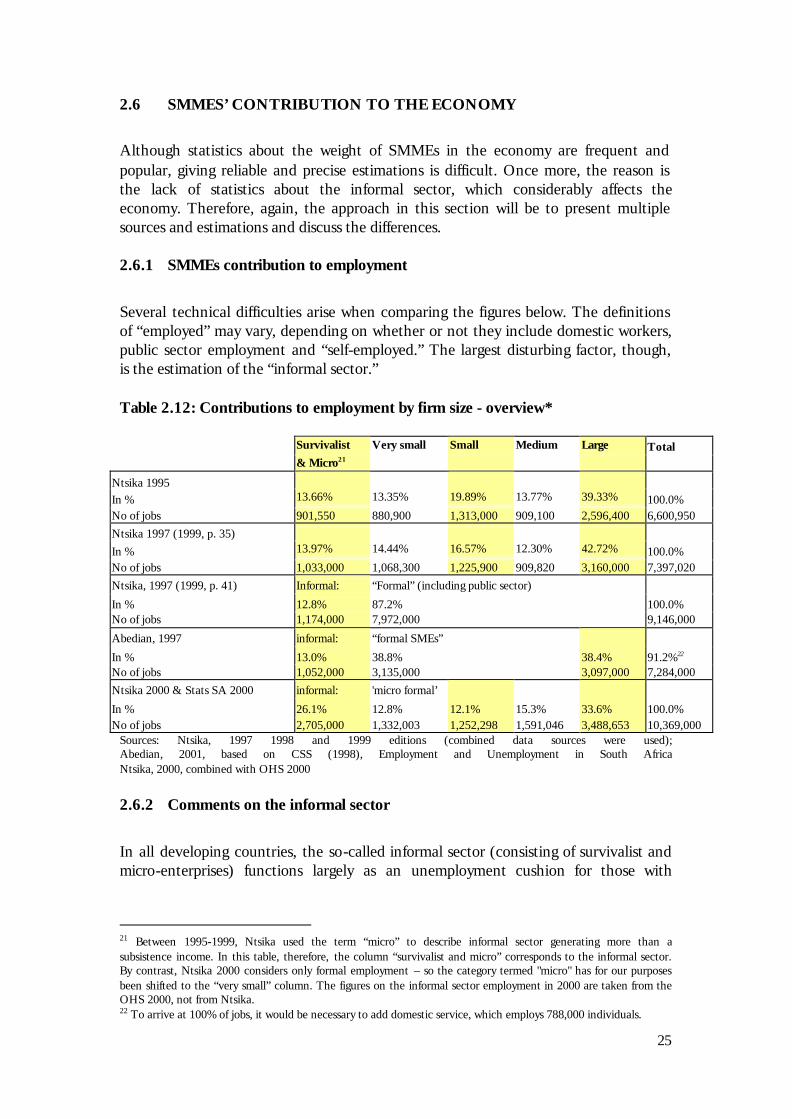
Although statistics about the weight of SMMEs in the economy are frequent and popular, giving reliable and precise estimations is difficult. Once more, the reason is the lack of statistics about the informal sector, which considerably affects the economy. Therefore, again, the approach in this section will be to present multiple sources and estimations and discuss the differences. 2.6.1 SMMEs contribution to employment
Several technical difficulties arise when comparing the figures below. The definitions of “employed” may vary, depending on whether or not they include domestic workers, public sector employment and “self-employed.” The largest disturbing factor, though, is the estimation of the “informal sector.” Table 2.12: Contributions to employment by firm size - overview*
Survivalist Very small Small Medium Large Total & Micro21
Ntsika 1995
In % 13.66% 13.35% 19.89% 13.77% 39.33% 100.0% No of jobs 901,550 880,900 1,313,000 909,100 2,596,400 6,600,950
Ntsika 1997 (1999, p. 35)
In % 13.97% 14.44% 16.57% 12.30% 42.72% 100.0% No of jobs 1,033,000 1,068,300 1,225,900 909,820 3,160,000 7,397,020
Ntsika, 1997 (1999, p. 41) Informal: “Formal” (including public sector)
In % 12.8% 87.2% 100.0% No of jobs 1,174,000 7,972,000 9,146,000
Abedian, 1997 informal: “formal SMEs”
In % 13.0% 38.8% 38.4% 91.2%22 No of jobs 1,052,000 3,135,000 3,097,000 7,284,000
Ntsika 2000 & Stats SA 2000 informal: 'micro formal’
In % 26.1% 12.8% 12.1% 15.3% 33.6% 100.0% No of jobs 2,705,000 1,332,003 1,252,298 1,591,046 3,488,653 10,369,000
Sources: Ntsika, 1997 1998 and 1999 editions (combined data sources were used); Abedian, 2001, based on CSS (1998), Employment and Unemployment in South Africa Ntsika, 2000, combined with OHS 2000
2.6.2 Comments on the informal sector
In all developing countries, the so-called informal sector (consisting of survivalist and micro-enterprises) functions largely as an unemployment cushion for those with
21 Between 1995-1999, Ntsika used the term “micro” to describe informal sector generating more than a subsistence income. In this table, therefore, the column “survivalist and micro” corresponds to the informal sector. By contrast, Ntsika 2000 considers only formal employment – so the category termed "micro" has for our purposes been shifted to the “very small” column. The figures on the informal sector employment in 2000 are taken from the OHS 2000, not from Ntsika. 22 To arrive at 100% of jobs, it would be necessary to add domestic service, which employs 788,000 individuals.

26
limited skills and young job seekers. Accordingly, the number of micro-enterprise activities typically rises during economic decline. Nevertheless, assessing the scale and performance of the informal sector, which, by definition, comprises statistically unrecorded activities (since recording is typically limited to the formal sector), has been a difficult task – more so in South Africa where the black population used to be prosecuted if involved in such activities. Apart from the difficulty in researching the hidden economy, different definitions of unemployment and full- or part-time self-employment lead to divergent observations. Indeed, the 1996 Population Census estimates the number of workers employed in the informal sector to be at least 1.4 million and the total employed labour force to amount to 9.1 million (Ntsika, 1999:35), while the distribution below only ascribes 382 400 employees (and 650 500 self-employed) to the informal sector (see second row of Table 2.1) with formal and informal employees not exceeding 7.4 million in 1997 (Ntsika, 1999:51). It is therefore likely that this distribution underestimates the extent of informal sector employment – by perhaps as much as about 1.7 million! Given the possible inaccuracy of the available data, the hypothesis of a numerically growing informal sector during times of economic decline can be neither contested nor totally confirmed, although its plausibility for South Africa is perhaps emphasised by the fact that it has been frequently observed in other countries. 2.6.3 Data by industries (see Appendix A2)
According to the latest estimations of Ntsika 2000, the sectors with the highest contributions to employment by very small (“formal micro”) and small enterprises were the services sector, with a combined 70.9% of employment in “community, social and personal services”, 59.5% in “trade, repairs, hotels and restaurants”, and 44.3% in business services. Meanwhile, medium-sized enterprises were significant in agriculture (52.3% of formal employment) and manufacturing (24.6%). These figures, however, could change significantly if the informal sector were included. 2.6.4 Dynamic analysis: are SMEs employment generators?
From Table 2.12, it is tempting to answer the question whether South African small firms are dynamic employment generators. When comparing changes in the distribution of employment over size classes between the successive estimations, it seems that this is the case – although the doubt remains whether the increase of estimated figures comes from a better capture of the informal and smallest activities, or from a real change. Assuming that there has been an actual increase in the demand for labour, the next question is whether this is explained by the growth of individual enterprises, or by the formation of new firms. Dividing the employment figures by the number of establishments can help answer that question. Due to the inconsistencies in data

27
collection, the available data sets only allow for a tentative development of either answer, in particular with regards to informal enterprises. Table 2.13: Average number of employees in South African firms by size class, 1995 and 1997 Average no. of employees
Survivalist Micro (all) Very Small Small Medium Large
In 1995 1 2 5 21 79 456 In 1997 1 2 6 21 80 525 Difference 0 0 +1 0 +1 +69 Source: Adapted from Ntsika (1997; 1999:50); note that combined data sources are used
Acknowledging the possible misrepresentation of actual trends by the available data and returning to the question of SMMEs as employment generators, it seems that micro-enterprise and very small firm formations, and not the expansion of existing SMMEs, accounted for the overall employment growth in the SMME sector between 1995 and 1997, while the bulk of private sector employment growth resulted largely from the expansion of large enterprises. 2.6.5 SMME contribution to the GDP
As mentioned before, discussing SMME contribution to the GDP is problematic, since the GDP typically records only formal activities, while most SMMEs are active in the informal sector. Therefore, in theory, two approaches are possible: either ignoring the informal sector entirely, which can only give a partial answer to the question of the economic significance of SMMEs; or attempting to quantify the value added generated by informal enterprises.
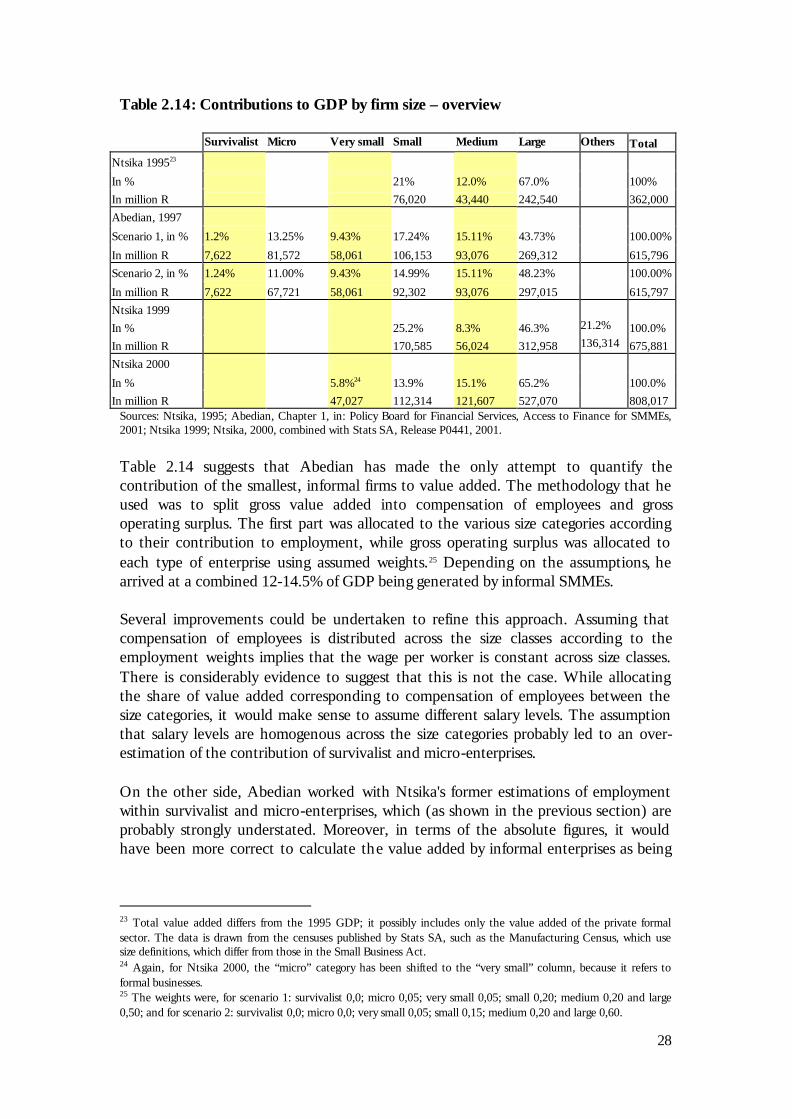
28
Table 2.14: Contributions to GDP by firm size – overview
Survivalist Micro Very small Small Medium Large Others Total
Ntsika 199523
In % 21% 12.0% 67.0% 100%
In million R 76,020 43,440 242,540 362,000
Abedian, 1997
Scenario 1, in % 1.2% 13.25% 9.43% 17.24% 15.11% 43.73% 100.00%
In million R 7,622 81,572 58,061 106,153 93,076 269,312 615,796
Scenario 2, in % 1.24% 11.00% 9.43% 14.99% 15.11% 48.23% 100.00%
In million R 7,622 67,721 58,061 92,302 93,076 297,015 615,797
Ntsika 1999
In % 25.2% 8.3% 46.3% 21.2% 100.0%
In million R 170,585 56,024 312,958 136,314 675,881
Ntsika 2000
In % 5.8%24 13.9% 15.1% 65.2% 100.0%
In million R 47,027 112,314 121,607 527,070 808,017 Sources: Ntsika, 1995; Abedian, Chapter 1, in: Policy Board for Financial Services, Access to Finance for SMMEs, 2001; Ntsika 1999; Ntsika, 2000, combined with Stats SA, Release P0441, 2001.
Table 2.14 suggests that Abedian has made the only attempt to quantify the contribution of the smallest, informal firms to value added. The methodology that he used was to split gross value added into compensation of employees and gross operating surplus. The first part was allocated to the various size categories according to their contribution to employment, while gross operating surplus was allocated to each type of enterprise using assumed weights.25 Depending on the assumptions, he arrived at a combined 12-14.5% of GDP being generated by informal SMMEs. Several improvements could be undertaken to refine this approach. Assuming that compensation of employees is distributed across the size classes according to the employment weights implies that the wage per worker is constant across size classes. There is considerably evidence to suggest that this is not the case. While allocating the share of value added corresponding to compensation of employees between the size categories, it would make sense to assume different salary levels. The assumption that salary levels are homogenous across the size categories probably led to an over-estimation of the contribution of survivalist and micro-enterprises. On the other side, Abedian worked with Ntsika's former estimations of employment within survivalist and micro-enterprises, which (as shown in the previous section) are probably strongly understated. Moreover, in terms of the absolute figures, it would have been more correct to calculate the value added by informal enterprises as being
23 Total value added differs from the 1995 GDP; it possibly includes only the value added of the private formal sector. The data is drawn from the censuses published by Stats SA, such as the Manufacturing Census, which use size definitions, which differ from those in the Small Business Act. 24 Again, for Ntsika 2000, the “micro” category has been shifted to the “very small” column, because it refers to formal businesses. 25 The weights were, for scenario 1: survivalist 0,0; micro 0,05; very small 0,05; small 0,20; medium 0,20 and large 0,50; and for scenario 2: survivalist 0,0; micro 0,0; very small 0,05; small 0,15; medium 0,20 and large 0,60.
29
“on top” of the official GDP of 615.8 billion Rand. Thus the value added by survivalist and micro-businesses would have been slightly higher.26 Nevertheless, Abedian’s estimates seem to be a good proxy of the orders of magnitude. 2.6.6 Data by industries (see Appendix A2)
In terms of the sectoral distribution, the broad lines are pretty similar to the comments made on the employment figures, with very small and small enterprises dominating in the services sector, and medium-sized enterprises strongly contributing to the agriculture and manufacturing sectors. It should be noted that these numbers ignore informal contributors due to lack of data. Significant differences between employment distribution and GDP distribution appear, however, in two sectors:
• The trade and hotel/restaurants sector, where micro/very small enterprises represent 35.8% of employment but only 3.1% of value added. This suggests that the smallest supermarkets, petrol stations and restaurants operate at very low surplus levels; and
• The services (especially finance and business services) sector, where large
enterprises contribute to 69.3% of GDP, supposedly referring to the (relatively) high margin business of South Africa’s large finance institutions.
2.6.7 Dynamic analysis: is the share of SMEs growing?
The data available barely enables intertemporal comparison. Indeed, both the size categories and the underlying GDP figures are inconsistent. From Ntsika’s explanations it is not clearly recognisable whether the “large enterprises’ GDP” includes the contribution of public and parastatal enterprises or even of government services. 2.6.8 SMMEs’ contribution to Investment
Another important dimension of the economic weight of SMMEs is their contribution to investment. While there is very little information on this question, Abedian (1998) has attempted to quantify this figure with a very rough approach.
26 To be exact, the value added by the informal sector would have been bln R 75.4 (scenario 1) or bln R 89.0 (scenario 2).

30
Table 2.15: SMEs contribution to nominal gross fixed capital formation 2000 (R million) Assumptions:
Sector SMEs Large SMEs Large enterprises Total
Agriculture 100% 0% 4,101 0 4,101 Mining 0% 100% 0 10,601 10,601 Manufacturing 40% 60% 12,202 18,304 30,506
Electricity 0% 100% 0 6,980 6,980 Construction 50% 50% 605 606 1,211 Wholesale, retail trade, catering and accommodation 70% 30% 6,091 2,611 8,702 Transport 20% 80% 3,870 15,480 19,350 Finance 20% 80% 6,370 25,481 31,851 Community services 100% 0% 0 17,018 17,018
Total 33,239 97,081 130,320 Percentage share of total 25.5% 74.5% 100,00 Source: Abedian, in: Policy Board Report on Access to Finance for SMMEs27
Although this estimation would need to be refined, it is interesting in that it suggests very low investment behaviour of SMMEs compared to their share in employment and production. A reason may be these enterprises’ difficulties in getting access to sufficient finance to undertake investments. This certainly requires further attention.
2.7 STATISTICAL DATA ON SMMES – CONCLUSIONS AND RECOMMENDATIONS
Any policy decision concerning SMMEs requires accurate information about the size and structure of South Africa’s SMME economy. Ntsika aims to facilitate such decision-making by publishing annual reviews on the State of Small Business in South Africa. Nevertheless, the data presented in the various editions of the above publication can be improved to meet the requirements of policy makers for a number of reasons. Ntsika can only encourage Statistical Agencies such as Statistics South Africa and private researchers to address the shortcomings with regard to correctness and coverage of the existing databanks, but it must request SMME data that: is more detailed (both by size-class and by industry instead of sectors); relies on more than just a single data source; and reflects changes over time by maintaining the same definitions. 2.7.1 Directions for data collection
Improvements to data collection need to be considered in the following areas:
27 Notes on methodology: The percentage allocation of nominal gross fixed capital formation to large enterprises and SMEs was assumed, as above.
31
• Better coverage of the smaller sized, and in particular, micro-sized establishments
The currently reported low contribution of micro-enterprises to total employment contradicts anecdotal evidence and is probably not an accurate reflection of reality. Given the complexity of the task, particularly on the informal sector, it is recommended to proceed with limited-scope samples and case studies rather than using a census-like methodology, which is likely to be too “massive” to capture the subtleties of the informal sector. Some initiatives such as the World Bank Firm Study on the Johannesburg area is likely to provide a number of new insights in this regard, but a similar job would be needed in rural areas. Stats SA’s recently established series of Labour Market Surveys could also be considered in this regard.
• Standardisation of data collection procedures This particularly applies to sampling methods and definitions, to allow for comparisons between data sources and various years.
2.7.2 Directions for data presentation
In certain cases, it is likely that the data are correctly collected but not appropriately presented. It is strongly recommended that Ntsika devote extreme attention to the following issues: Continuity: Even if improvements of the previous years’ methods and results are welcome, they should always be presented in such a way that comparison across the years is possible. Precision with regards to industry: Each of the nine main sectors consists of very diverse activities. Manufacturing alone comprises about 75 industries. While presenting detailed statistics on a triple-digit SIC basis would be too unwieldy, certain industries would need to be singled out, in particular:
• Manufacture of food products, beverages and tobacco products;
• Textiles, clothing and leather goods;
• Basic metal and metal products, machinery and office equipment
• Manufacture of furniture;
• Retail trade; • Sale, maintenance and repair of vehicles;
• Trade in fuel;

32
• Hotels and restaurants;
• Travel agencies and other supporting transport activities;
• Post and telecommunications;
• Computer and related activities;
• Business consulting and other business activities; and
• Recreational, cultural and sporting activities. Precision with regards to size: If, for a particular reason, the official size categories provided by the Small Business Act cannot be used, the underlying definitions should be explained. Disclosure of method and reference population: Tables and graphs should indicate clearly the population they refer to (e.g. is it only the formal sector, or formal and informal), the primary sources utilised for the data offered and, if it stems from own calculations, and the rough approach used. 2.7.3 Directions for data analysis
With more detailed information on SMMEs, data analysis can take a number of additional directions, such as:
• Verification of information obtained from Stats SA with household/labour market and enterprise surveys (and vice versa): Recent empirical work such as the 1999 World Bank Survey in Greater Johannesburg and the National Enterprise Survey are first attempts to generate information for representative samples. Nation-wide coverage and repetition of these surveys is to be encouraged.
• Refinement of estimations on the informal sector: E.g. its contribution to
employment and value added, based on the newest estimations on the number of firms in the informal sector.
• Generation of data on more precise performance indicators: Apart from the
(static) contribution to output and employment, SMMEs’ investment behaviour, wage levels and labour productivity inform about their performance.
• Generation of time-series data: The relative growth of the SMME sector and
its performance emerges over time. Indicators that require further investigation over time and by industries (and later size-class) are: ratio of employment growth in SMMEs to that of the overall economy; ratio of value added by

33
SMMEs to that of the overall economy; ratio of the number of SMMEs to that of all establishments; and capital/labour ratio of SMMEs (labour intensity).
Some of these analyses are already offered by the latest Ntsika publication on the state of SMMEs in South Africa, but as mentioned before, this has been limited to formal sector activities and appears to exclude those activities that are not recorded by Stats SA’s sectoral censuses.
34
3 THE SMME POLICY FRAMEWORK IN POST-APARTHEID SOUTH AFRICA
This chapter traces the evolution of the SMME sector and also outlines some key policy initiatives carried out by the new ANC government relating to SMMEs, before undertaking an assessment of their efficacy.
3.1 THE EVOLUTION OF THE SMME POLICY FRAMEWORK
During apartheid, South Africa's SMME economy was either largely neglected by policy-makers or, in the case of black-owned enterprises, actively discouraged by repressive measures. In line with the political disinterest, small enterprises were wiped off the research agenda of most business schools and university commerce departments. The establishment of the Small Business Development Corporation (SBDC) in the early 1980s was the first government initiative to support small firms, but only in the late 1980s did a racially unbiased political interest in the development of small business in South Africa begin to take root. This political shift provoked an upsurge of literature on small enterprises28, in particular black-run micro-enterprises. Indeed, most surveys of the early 1990s focused on black-run micro-enterprises and used cross-section surveys to identify their constraints.29 Nevertheless, the notion that it is the larger SMMEs that are more likely to contribute to employment creation and economic growth, gave impetus to a renewed (largely industry-specific) focus on established, albeit white-owned, SMEs in South Africa (for example, Bloch and Kesper, 2000a;b). The 1995 White Paper on National Strategy for the Development and Promotion of Small Business in South Africa has been the first major effort by the South African government to design a policy framework particularly targeting the entire spectrum of the small enterprise sector. This section summarises the key elements of the 1995 White Paper and highlights some of its shortcomings, which feed into the final part discussing policy options. The overall objective of the strategy was to create an enabling environment for SMME growth in the country as a way of addressing basic inequalities in the economy. The mechanisms for small business support outlined in the White Paper30 became constitutional through the National Small Business Act31, which also provides the first
28 See, for example, Liedholm and McPherson (1991); Horn et al. (1993), Riley (1993), TaskGro (1993), Eichler, (1994), Hirschowitz et a.l (1994a) and Ruiters et al. (1994). 29 As part of the GEMINI project (Growth and Equity through Micro-enterprise Investments and Institutions) Liedholm and McPherson, for example, captured data on 5000 ‘small enterprises’ with up to 50 employees in two (out of 100) South African townships in 1990 and interviewed 256 firms in a baseline study to identify constraints. The World Bank commissioned a cross-section survey of 632 micro-enterprises (142 in production, 355 in retail and 99 in other services) located in Johannesburg, Durban and Cape Town in 1992. 30 RSA, 1995: 40. 31 RSA, 1996.
35
comprehensive definition of SMMEs. The Act legalised the establishment of new institutions, affirmative procurement reform (see below), and the formation of an advisory board to review SMMEs’ legal and regulatory environment. In an attempt to overcome the historical definition of small enterprises as formal (which was due to apartheid legacy white-owned only) and informal (owned by the now so-called), the post-apartheid government put forward the first national and most comprehensive definition of SMMEs, which is manifested in the National Small Business Act. Three broad sets of enterprises were identified, namely:
• Survivalist enterprises (informal): Operated out of necessity to secure a minimal income with little capital and skills and with scant prospect for upward growth;
• Micro-enterprises: With growth potential that involves the owner and family
members or at the most four employees and whose turnover is below R 150 000,32 the threshold for VAT registration; and
• Formal small and medium-sized enterprises: With five to 100 and 100 to 200
employees respectively which are still owner-managed and fulfil all the trappings associated with formality. The White Paper distinguishes between PDI-owned SMMEs as emerging and formal white-owned SMEs as established.
3.2 THE DEVELOPMENT OF INSTITUTIONS TO FACILITATE SMME GROWTH
In response to the challenges set out in the White Paper, the Centre for Small Business Promotion (CSBP) of the DTI and the National Small Business Council (NSBC), as well as the Ntsika Enterprise Promotion Agency (in short Ntsika or NEPA) and Khula Enterprise Finance, were established to drive the National Small Business Strategy. While the NSBC had the task of ‘democratising’ the issue of small business development (although it was closed in late 1997 due to allegations of misuse of funds) and the CSBP was mandated to ‘co-ordinate, monitor and evaluate the implementation of the strategy,’ Ntsika and Khula are expected to build the technical and financial capacity of non-financial and financial retail service providers.33 The DTI, together with the IDC, have introduced a number of specific programmes aimed at increasing the competitiveness of formal SMME manufacturers. There are, however, indications that despite their good intentions, these policy measures suffer from sub-optimal implementation due to a general distrust of external agencies by SMMEs on the one hand, and the incapacity of support institutions to persuasively raise awareness about their existence and effectiveness on the other.34
32 This threshold has subsequently been raised to R300 000. 33 See, for example, RSA (1995), Ntsika (1997), DTI (1998) and Hirsch and Hanival (1998). 34 See, for example Bukula (1997), Levin (1997b), Kaplinsky and Morris (1999), Rogerson (1999), Bloch and Kesper (2000a;b), Kesper (2000c), and own interviews.

36
3.3 DESCRIPTION OF SOUTH AFRICA’S SMME SUPPORT NETWORK
3.3.1 Ntsika Enterprise Promotion Agency
Ntsika was initiated by the DTI to implement the national SMME strategy. It provides non-financial support to SMMEs via a range of programmes35 that are accessible through a network of retail service providers classified as:
• Local Business Service Centres (LBSCs): For assistance in business administration and general information. There are currently 106 LBSCs accredited and supported by Ntsika.36
• Tender Advice Centres (TACs): To provide assistance and training to
SMMEs on government tendering processes and inform about current tenders.
• Manufacturing Advice Centres (MACs): These are coordinated and monitored by the national NAMAC in collaboration with the Centre for Scientific and Industrial Research (CSIR) to provide industry-specific assessments and link SMEs to highly-specialised service providers. The Durban MAC (DUMAC) and Port Elisabeth MAC (PEMAC) are operating, while the Western Cape MAC has just been launched and the Gauteng MACs are still in planning.
Thirteen technical colleges were founded for the purpose of implementing the Technopreneur Programme for potential SMME entrepreneurs to improve their technical skills. Entrepreneurs are meant to apply these skills under supervision before they start their own businesses. In addition, LBSC and other NGO staff can receive Ntsika-funded training offered by eleven so-called Service Provider Development Programme Organisations. 3.3.2 Khula Enterprise Finance Ltd
Khula has initiated, since its establishment in 1996, a number of loan schemes to increase access to finance for SMMEs through Retail Financial Intermediaries (RFIs), which are SMME departments of commercial banks or accredited NGOs.37 RFIs apply their own minimum lending criteria (the most basic is the provision of a business plan)
35 Currently, 31 programmes exist in the following areas: Market Access and Business Linkages, Targeted Assistance (for women, disabled and the youth), Management and Entrepreneur Development and Business Development Services, Technology, and Policy, Research and Information. 36 Accreditation does, however, no longer guarantee funding from Ntsika, but access to Ntsika’s capacity building programme. 37 In October 2000, 36 RFIs (other than commercial banks) are accredited, but only 19 considered active as the others have failed to reach their performance targets and are therefore sanctioned by Khula. The former para-statal Small Business Development Corporation (SBDC) has been restructured and recently privatised, and operates now as Business Partners as one of the RFIs.
37
as the responsibility of risk assessment lies entirely with the RFIs. This might explain why only four out of every 300 applicants have been granted a loan so far (Khula Annual Website Report for 1999). The schemes currently existent can be grouped as follows:
• Business Loan Scheme: Out of the total of R400 million, loans to the value of R1 million to R100 million are forwarded to RFIs to capacitate them or increase their willingness to provide loans to SMMEs.
• Guarantee Schemes: Guarantees are underwritten by Khula to reduce the risk
of lending to SMMEs without sufficient collateral. The Emerging Entrepreneur Scheme, for example, targets existing SMMEs which need up to R75 000 of which Khula guarantees up to 80%, while the maximum amount covered by Khula under the Standard Scheme is R600 000. A special product called ‘Siza Bantu’ has been introduced in 1999 for micro-loans up to R10 000, which are 95% guaranteed by Khula. ‘Khula Start’ is a progressive loan guarantee scheme targeting an enterprise venture of groups in peri-urban or rural areas of up to ten individuals. Initially, between R300-600 are lent monthly and repayable in four months. After the successful completion of this phase, larger loans with longer repayment periods are granted.
• Equity Funds: Through the internet-based Emerging Enterprise Zone (EEZ) as
part of the Johannesburg Stock Exchange (JSE), SMMEs are expected to gain access to equity funding (up to R250 000, constituting less than 45% of total equity and to be re-capitalised within five years) from private investors with whom Khula might partner. This recent scheme has seen four (out of 36) successful applications. Unclear business plans or problems to determine the willingness or ability to repay have been two of the reasons for rejection (Khula Annual Website Report for 1999), while only a minority of SMMEs has access to the Internet (Ntsika, 1999b: 10).
In addition, Khula Institutional Support Services Ltd offers seed loans to organisations that aim to become RFIs. Khula also runs a capacity building programme for existing and potential RFI staff. 3.3.3 DTI and its related institutions
A number of DTI Incentive Schemes were designed exclusively for (registered) SMME industrialists and include (DTI, 1998):
• Standard Leased Factory Building Scheme, of the Industrial Development Corporation (IDC), which makes general purpose factory buildings available for lease to SMEs;
• Small/Medium Manufacturing Development Programme (SMEDP), which
consists of a tax-exempt establishment grant as a percentage of the investment for the first two years and a Skills Support Programme (SSP) if the business has
38
an approved training programme as outlined in the 1998 Skills Development Act;
• Economic Empowerment Scheme, for the expansion or establishment project
of PDI SMME entrepreneurs to which the IDC contributes the majority of capital outlay;
• Venture Capital Scheme, with which the IDC co-finances viable product
ventures;
• Normal Finance Scheme, which provides for low-interest IDC-administered finance during expansion;
• Import Finance Scheme, which consists of credit and guarantee facilities for
importing capital goods and services;
• Short-Term Export Finance Guarantee Facility, through which the Credit Guarantee Insurance Corporation (CGIC) can provide pre- and post-shipment export finance guarantees for SMMEs; and
• Export Marketing and Investment Assistance Scheme (EMIA), which
provides funding of primary market research, outward selling and inward buying trade missions and assistance to take part in exhibitions. Moreover, Ntsika has established the European Union Trade and Investment Programme under the auspices of the DTI to enable SMMEs through technical assistance to become exporters.
3.3.4 Provincial SMME Desks
The provincial SMME Desks were established to ensure provincial representation of SMME interests as well as contribute to implementation of the national strategy. Their main task is to link national or sectoral programmes with local or regional implementation bodies and establish a comprehensive SMME database on which national policy changes can be based. Nevertheless, the capacity of these Desks varies. In 1997, Mpumalanga’s SMME Desk had established a comprehensive SMME database and a synergistic network of SMME service providers, while the Northwest SMME Desk had undertaken no such action.38 In 2000, only two of the nine provinces organise annual Service Provider Forums.39 Besides these SMME-specific institutions and programmes, the (formal) SMME economy is surrounded by a rich body of sector and industry-specific institutions.40
38 Rogerson, 1997. 39 Bloch and Daze, 2000. 40 For more detailson this, the reader is referred to Harrison and Dunne (1998), Kaplinsky and Morris (1999) and Bloch and Kesper ( 2000a;b).
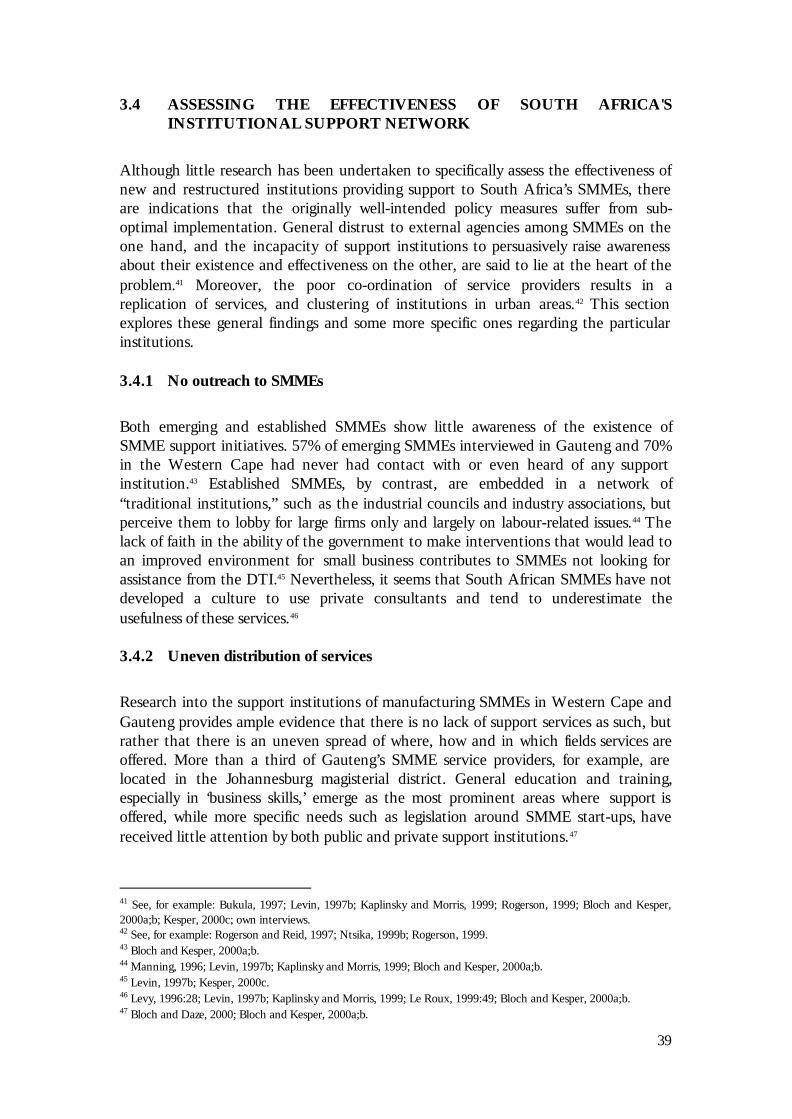
39
3.4 ASSESSING THE EFFECTIVENESS OF SOUTH AFRICA'S INSTITUTIONAL SUPPORT NETWORK
Although little research has been undertaken to specifically assess the effectiveness of new and restructured institutions providing support to South Africa’s SMMEs, there are indications that the originally well-intended policy measures suffer from sub-optimal implementation. General distrust to external agencies among SMMEs on the one hand, and the incapacity of support institutions to persuasively raise awareness about their existence and effectiveness on the other, are said to lie at the heart of the problem.41 Moreover, the poor co-ordination of service providers results in a replication of services, and clustering of institutions in urban areas.42 This section explores these general findings and some more specific ones regarding the particular institutions. 3.4.1 No outreach to SMMEs
Both emerging and established SMMEs show little awareness of the existence of SMME support initiatives. 57% of emerging SMMEs interviewed in Gauteng and 70% in the Western Cape had never had contact with or even heard of any support institution.43 Established SMMEs, by contrast, are embedded in a network of “traditional institutions,” such as the industrial councils and industry associations, but perceive them to lobby for large firms only and largely on labour-related issues.44 The lack of faith in the ability of the government to make interventions that would lead to an improved environment for small business contributes to SMMEs not looking for assistance from the DTI.45 Nevertheless, it seems that South African SMMEs have not developed a culture to use private consultants and tend to underestimate the usefulness of these services.46 3.4.2 Uneven distribution of services
Research into the support institutions of manufacturing SMMEs in Western Cape and Gauteng provides ample evidence that there is no lack of support services as such, but rather that there is an uneven spread of where, how and in which fields services are offered. More than a third of Gauteng’s SMME service providers, for example, are located in the Johannesburg magisterial district. General education and training, especially in ‘business skills,’ emerge as the most prominent areas where support is offered, while more specific needs such as legislation around SMME start-ups, have received little attention by both public and private support institutions.47
41 See, for example: Bukula, 1997; Levin, 1997b; Kaplinsky and Morris, 1999; Rogerson, 1999; Bloch and Kesper, 2000a;b; Kesper, 2000c; own interviews. 42 See, for example: Rogerson and Reid, 1997; Ntsika, 1999b; Rogerson, 1999. 43 Bloch and Kesper, 2000a;b. 44 Manning, 1996; Levin, 1997b; Kaplinsky and Morris, 1999; Bloch and Kesper, 2000a;b. 45 Levin, 1997b; Kesper, 2000c. 46 Levy, 1996:28; Levin, 1997b; Kaplinsky and Morris, 1999; Le Roux, 1999:49; Bloch and Kesper, 2000a;b. 47 Bloch and Daze, 2000; Bloch and Kesper, 2000a;b.

40
3.4.3 High search costs of service provision
The search costs to find an adequate service provider are prohibitive for SMME owner-managers whose time spent on non-productive activities has high opportunity costs. Contact details and recommendations of specific service providers are available neither from the Ntsika nor Khula Helplines, and referrals among local support institutions are rare. Likewise, the telephone directory, as the easiest accessible database of support institutions or directories prepared for the provincial SMME Desks (in Western Cape and Gauteng, for example), offers little specification of the services offered and the hourly rate charged. Once a potentially suitable service provider is identified, it is extremely difficult to get hold of the ‘right’ person at the first phone call made. Hence, the search for support is more than often given up before reaching its target due to the time and effort required.48 3.4.4 Cumbersome administration and discontinuity of programmes
Once again, the main reasons why the DTI incentive schemes targeting SMMEs have not been used extensively are lack of information about their existence, red tape accompanying applications, and discouragement by dismal experiences of other applicants.49 Indeed, in the particular case of the Competitiveness Fund, for example, firms are expected to identify their needs and provide a detailed analysis how their performance will improve in the event that their proposed investment might be funded. Moreover, the requirements to qualify for and the components of certain schemes such as the SMEDP (see above) have changed several times over the past years without proper communication, which frustrates SMME owner-managers applying for these schemes.
3.5 SMME SUPPORT PROGRAMMES UNDER SCRUTINY
The 1999 survey on SMMEs in Greater Johannesburg revealed that SMMEs attach great importance to government promotion programmes for their growth. In order to assess the relevance and effective implementation of the existing SMME support, it is useful to unpack its different stages: Design of programmes Marketing Implementation The DTI, Ntsika and Khula are involved in the design of SMME support programmes and administer their implementation, which relies on the respective local intermediaries. The 1999 SMME survey raised the following questions to assess the functioning of programme support at different levels:
48 Bloch and Kesper, 2000a;b. 49 Hirsch and Hanival, 1998; Kaplinsky and Morris, 1999; Kesper, 1999b; Ntsika, 1999b: 89; Bloch and Kesper, 2000a;b.

41
Table 3.1: Functioning of SMME Programme Support Questions Indicator to assess Awareness of programmes Marketing Attempted usage of programmes Design and Relevance for SMMEs Assistance received Administration or Description of Programmes Comments on quality and cost of service Relevance and evaluation of implementation
Table 3.2 and 3.3 provide information on the level of awareness and use of DTI and Ntsika/Khula programmes50 among SMMEs in Greater Johannesburg.
50 The respective programmes are described in Section 3.3
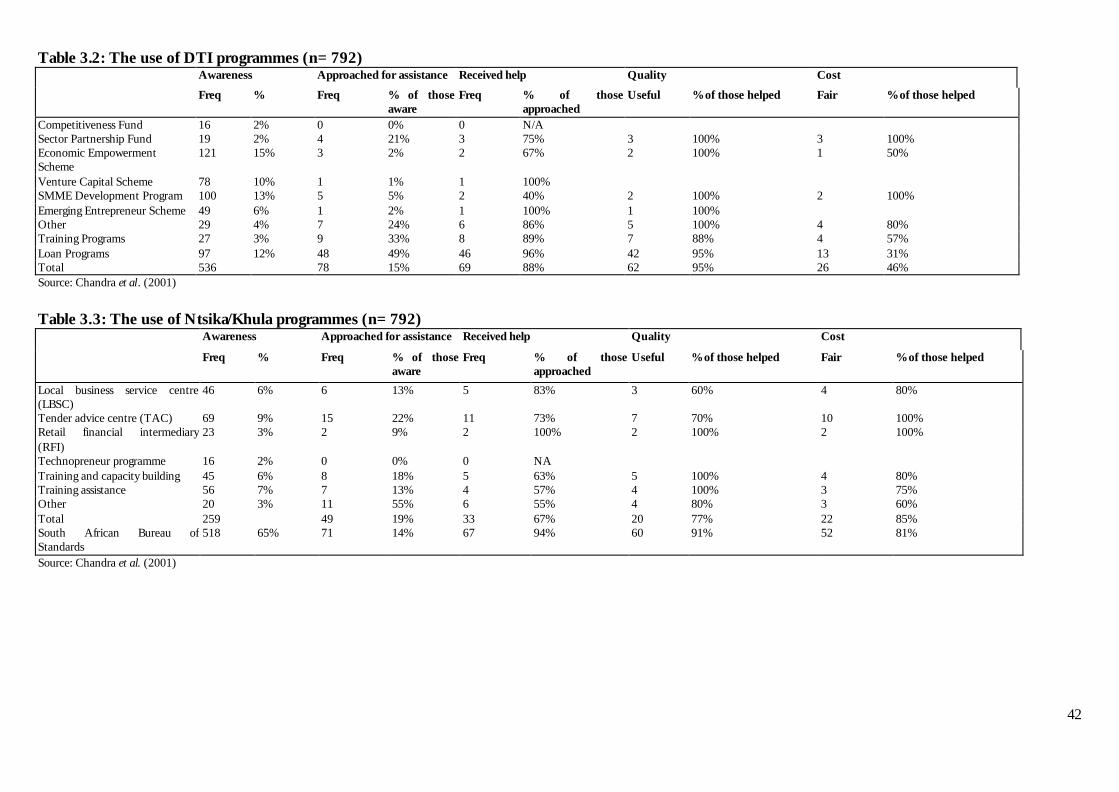
42
Table 3.2: The use of DTI programmes (n=792) Awareness Approached for assistance Received help Quality Cost
Freq % Freq % of those aware
Freq % of those approached
Useful % of those helped Fair % of those helped
Competitiveness Fund 16 2% 0 0% 0 N/A Sector Partnership Fund 19 2% 4 21% 3 75% 3 100% 3 100% Economic Empowerment Scheme
121 15% 3 2% 2 67% 2 100% 1 50%
Venture Capital Scheme 78 10% 1 1% 1 100% SMME Development Program 100 13% 5 5% 2 40% 2 100% 2 100% Emerging Entrepreneur Scheme 49 6% 1 2% 1 100% 1 100% Other 29 4% 7 24% 6 86% 5 100% 4 80% Training Programs 27 3% 9 33% 8 89% 7 88% 4 57% Loan Programs 97 12% 48 49% 46 96% 42 95% 13 31% Total 536 78 15% 69 88% 62 95% 26 46% Source: Chandra et al. (2001)
Table 3.3: The use of Ntsika/Khula programmes (n=792) Awareness Approached for assistance Received help Quality Cost
Freq % Freq % of those aware
Freq % of those approached
Useful % of those helped Fair % of those helped
Local business service centre (LBSC)
46 6% 6 13% 5 83% 3 60% 4 80%
Tender advice centre (TAC) 69 9% 15 22% 11 73% 7 70% 10 100% Retail financial intermediary (RFI)
23 3% 2 9% 2 100% 2 100% 2 100%
Technopreneur programme 16 2% 0 0% 0 NA Training and capacity building 45 6% 8 18% 5 63% 5 100% 4 80% Training assistance 56 7% 7 13% 4 57% 4 100% 3 75% Other 20 3% 11 55% 6 55% 4 80% 3 60% Total 259 49 19% 33 67% 20 77% 22 85% South African Bureau of Standards
518 65% 71 14% 67 94% 60 91% 52 81%
Source: Chandra et al. (2001)

43
The data in Tables 3.2 and 3.3 clearly indicate that only a very small percentage of SMMEs in Greater Johannesburg use support programmes. Indeed, besides the SABS and SBDC loan programmes, only about 7% of the 792 SMMEs received assistance from the respective institutions. Hence the criticism that these programmes are not effectively reaching their target groups is not unjustified. Nevertheless, the data in the tables allows for an in-depth analysis of where the source of the problem lies, i.e. whether it is in the design, the marketing or implementation at the micro-level. 3.5.1 Awareness of support programmes
Although all 792 SMMEs that participated in the 1999 survey were formal, only about two-thirds were aware of DTI programmes. Awareness of programmes administered by Ntsika and Khula was even lower. Indeed, only one-third of the sample SMMEs had on average heard about these programmes. These findings support the general perception that SMME support programmes need to be marketed more effectively. 3.5.2 Attempted usage of support programmes
Of those SMMEs that know about the DTI programmes, only 15% approached the DTI and its related institutions for assistance. In the extreme case of the Venture Capital Scheme, for example, only one SMME (out of the 78 that were aware of it) finally approached the IDC for assistance. The local intermediaries that implement Ntsika and Khula programmes were approached by 19% of those SMMEs that were aware of them. Overall, however, more than 80% of the SMMEs in the sample did not approach either institution for assistance despite being aware of their programmes. These findings suggest that the respective institutions need to work on establishing trust relationships with SMMEs. 3.5.3 Receiving assistance from support institutions
On average, two-thirds of the SMMEs that applied to Ntsika or Khula, and 88% of those approaching the DTI and its related institutions, received assistance. The remaining SMMEs apparently did not meet the requirements to qualify. This may indicate that the selection criteria are not made sufficiently clear to potential applicants. 3.5.4 Satisfaction with support programmes
Contrary to general perceptions, the vast majority of SMMEs that use support programmes appear to be satisfied with the assistance they obtain in terms of reception, quality and cost. Nevertheless, Ntsika’s ‘flagship’ LBSC programme was rated worst (40% of SMMEs did not find it useful), which confirms the findings from other surveys referred to above. Likewise, the costs of loans provided by the DTI and its related institutions were perceived as too high by 69% of the sample SMMEs. In sum, SMMEs in the Greater Johannesburg Metropolitan Area rate government promotion programmes as one of the leading factors to assist in their growth. Data from this section clearly indicates, however, that current SMME support programmes have ample room for

44
improvement. Stronger marketing efforts will help to increase the awareness among potential beneficiaries, but perceptions of institutions and selection criteria for programmes, decide whether usage follows awareness. Contrary to general assumptions, SMMEs that received assistance are generally satisfied with the quality and costs of services. 3.5.5 Differential use of SMME support programmes
Findings from the 1999 SMME survey in Greater Johannesburg suggest that certain segments of the SMME economy use particular programmes more frequently. The identification of those SMMEs that use particular support programmes may inform the refinement of such programmes to target only specific segments of the SMME economy. The findings are discussed in this subsection. 3.5.5.1 Sectoral differences
The use of support programmes differs from sector to sector. Differential use51 by sector and industries suggests that support programmes respond better to the needs of some industries than of others. The data in Table 3.4 reveals, for example, that almost 25% of the clothing industry use support programmes, as compared with about 8% in tourism and 5% in IT. Table 3.4: Differential use of SMME promotion programmes by sector Sector (p-value = 0.10) % Using
Clothing/garments 23%
Metal workers 11% Furniture 12%
Prepared food/beverage 9%
Tourism 8%
Construction 12%
Retail 11%
IT 5%
Source: Chandra et al. (2001)
3.5.5.2 Differential use by size
Overall, usage of SMME programmes is alarmingly low for SMMEs of all size classes. The data in Table 3.5 suggests that larger SMMEs are more likely to receive assistance than their smaller counterparts. The fact that only 6% of the micro-enterprises use SMME support programmes points to the poor reach or inadequate response to the needs of ‘emerging’ SMMEs.
51 In order to determine the differential use of supply-side measures, given the small number of firms actually using these, we denote a firm as a user of these programmes if it is currently using any of the DTI/Ntsika/Khula programmes.

45
Table 3.5: Differential use of SMME promotion programmes by size class Size (p-value = 0.035) % Not using % Using
Micro 93.56 6.44 Very Small 87.34 12.66
Small 86.15 13.85 Source: Chandra et al. (2001)
3.5.5.3 Stronger use by exporting SMMEs
Exporters make more use of SMME support programmes than non-exporting SMMEs. This does not only apply to support programmes to facilitate exports such as the EMIA, for example, but to the entire spectrum of programmes. These findings point in two directions. First, initial awareness and successful usage of one of the programmes is seemingly followed by further usage of other programmes. It is therefore critical to inform a particular SMME about the most applicable programme to stimulate its demand for other programmes. Second, if exports are identified as a potential source of growth, more attention to export promotion schemes may foster such growth. Table 3.6: Differential use of SMME promotion programmes by export status Exporting status (p = 0.12) 1- tail % Not using % Using
Non-exporting 89.25 10.75 Exporting 84.96 15.04
Source: Chandra et al. (2001)
3.5.5.4 Differential use by race
Finally, black entrepreneurs use SMME support programmes more than their white counterparts. The higher usage by PDI entrepreneurs indicates that supply-side measures indeed play a role in economic empowerment and reach their target group (at least in 'very small' and 'small' enterprises). These programmes have, however, not been able to channel more foreign direct investment into the SMME economy. Table 3.7: Differential use of SMME promotion programmes by race Race (p-value = 0.001) % Not using % Using Black 81.25 18.75 Coloured 85.71 14.29 Asian 89.86 10.14 White 93.38 6.62 South African – no race 79.03 20.97 Foreign - from other African country 100 0 Foreign - from country outside Africa 92.06 7.94 Source: Chandra et al. (2001)
3.5.5.5 Stronger use by growing or older SMMEs?
Further cross-tabulation not shown here reveals that there is no significant relationship between growth status or age and usage of SMME support programmes. While it is possible

46
that the latter’s gestation period is longer than a few years, these results may equally indicate that programmes are ill-designed to promote SMME growth, or that growing SMMEs are not using government support programmes. The available data does not allow for a clear answer in this regard. 3.5.6 General observations
It is generally agreed that the originally well-intended support programmes focus on the main SMME constraints, but suffer from sub-optimal implementation. Contrary to such perceptions, however, the incapacity of support institutions to persuasively raise awareness about their existence and effectiveness explains low usage of programmes better than their poor implementation. Except for the LBSC and loan programmes, SMME entrepreneurs are seemingly satisfied with the assistance received. Usage of programmes is higher among black-run, exporting and larger SMMEs. Stronger marketing efforts are needed to raise awareness among smaller black-run and non-exporting firms. Apart from these general findings, research evidence about the shortcomings of specific programmes is critical for their revision. Such an analysis could reveal, for example, whether the low usage of a specific SMME support programme is an indicator of its low relevance to SMMEs. The reasons why only few SMMEs approach support institutions despite being aware of them need to be explored.
3.6 CASE STUDIES: SOUTH AFRICA'S LBSC AND RFI PROGRAMMES
Not much research has been undertaken to specifically assess the effectiveness of new and restructured institutions providing support to South Africa’s SMME economy. Both Ntsika's LBSC programme and Khula's RFI programme have nevertheless been targets of strong public and stakeholder criticism. The following boxes summarise the concerns raised, and point out new directions for the LBSC and RFI networks.

47
Box 3.1: Case studies on South Africa's LBSC and RFI programmes Ntsika and its LBSC network In launching the implementation of several programmes, Ntsika seemingly over-estimated its capacity52 – and that of existing NGOs – to become involved in the highly ambitious set of SMME programmes to be implemented.53 The LBSC programme in particular, as ‘the key intervention in the promotion of SMMEs in the country,’54 is criticised for moving through numerous experimental phases in terms of the accreditation process (e.g. minimum requirements of core services)55 as well as funding and income generation, with the debilitating effects of losing credibility. In 2000, accredited LBSCs perceived access to Ntsika’s capacity building as the only benefit of accreditation, while direct access to funding (or higher credibility through being accredited), and access to tools and modules developed by the allegedly existing LBSC ‘network’ were not linked to accreditation.56 By contrast, most LBSCs lack secure funding commitments from local, provincial and donor sources or Ntsika, and hence spend much time on approaching potential funding sources. They also rely on service fees for at least 25% of revenue generation.57 As LBSCs need a large clientele to secure their income, a wide cross-section of SMMEs has to be served while financially weak survivalist and would-be entrepreneur clients are looked out for.58 The diversity of the client group together with the non-capacity to develop a needs assessment tool results in most LBSCs offering generic services in response to the immediate and requested needs of their surrounding clients. As after-care or post-training tests are not requested by clients and would hence only cause additional costs the LBSCs, impact assessment is limited to keeping records on quantity of clients and service delivery, which are required for the quarterly reports to Ntsika. The need for client retention as a source of income discourages referrals to LBSCs offering different services in the area or sharing ‘best practice,’ while a charge is raised for referrals to RFIs. In addition, the existing LBSCs have given themselves the mandate to service mainly PDI-run SMMEs, and are hence not equipped or skilled to cater for more established SMMEs.59
52 The institution is staffed with between 60 and 70 professionals (Bloch and Daze, 2000). 53 Hirsch and Hanival, 1998; Rogerson, 1999; Bloch and Daze, 2000; Bloch and Kesper, 2000a;b. 54 RSA, 1995:47; Bloch and Daze, 2000:2. 55 Only 32 LBSCs were accredited in 1998 and received funding from Ntsika, while for the currently 106 accredited LBSCs, accreditation does no longer imply guaranteed funding from Ntsika. 56 Bloch and Daze, 2000:16. 57 Ibid,14. 58 Ibid,10. 59 Levin, 1997b; Bloch and Kesper, 2000a;b.

48
Box 3.1 Cont’d Khula and its RFI network According to Khula60, the advancement of loans to SMMEs is to be based on ‘sound business principles.’ Commercial banks have channelled the bulk of the R138 million that has so far been advanced to the target market.61 ABSA Bank, for example, has introduced a cash bonus system for staff that advances loans to SMMEs and has forwarded 71.8% of the R50 million guarantees allocated in the financial year 1998/1999.62 Nevertheless, after public small enterprise hearings at parliament, the Minister of Trade and Industry, Alec Erwin, lamented that the banking sector had failed to provide finance to emerging small businesses.63 Moreover, until February 1999, only 2612 loans had been extended under the Individual Guarantees Scheme64, and the monthly reports from the RFIs to Khula reveal that micro-enterprises only constitute about 15% of their clients. The provision of finance to emerging SMMEs has been restrained by both banks and micro-entrepreneurs being unaware of the existence of Guarantee Schemes, which prompted Khula to initiate a communication and marketing campaign in 1999 that targeted banks only, although it has boosted Standard Bank’s lending to SMMEs, for example.65 Whether or not marketing campaigns are developed is left to the RFIs, and the training of RFIs’ Board members by Khula Institutional Support Services Ltd (see above) does not even touch upon marketing. On the contrary, if RFIs continuously fail to meet their monthly performance targets (number of loans advanced to number of clients per month), Khula withdraws accreditation and support For those micro-entrepreneurs who happen to learn about Khula or the RFIs, constraints such as the lack of management support accompanying a loan application remain. Most micro-enterprises are not able to pass the hurdle of providing a business plan, which is the minimum requirement of banks to qualify for a loan. Indeed, many micro-entrepreneurs do not know what a business plan is. Bankers, by contrast, are usually well informed, but often not willing (or able) to guide the potential client through the lending procedure.66 From an international perspective, South Africa’s banking system is unusually flexible as to what it accepts as collateral (even immovable property), but collateral demands of more than 100% of the loan from small firms are frequent.67 PDI entrepreneurs often lack the asset base to secure a loan.68 High transaction costs and the perceived high risk associated with lending to (young) SMMEs cannot be compensated for with banks charging higher interest rates because of the Usury Act69, and debt recovery mechanisms in case of continued wilful non-payment are weak.70 While the relaxation of the Usury Act may result in banks being accused of exploiting the poor, a Community Reinvestment Act could provide that banks are forced to disclose information about their lending to delineated communities and do so as a PR initiative.71 Moreover, banks have little to no experience in communicating with micro-entrepreneurs and to assess their operations72, and in some rural towns, SMME lending facilities are completely absent.73
60 Interview with Platon Manjome, 02.11.2000. 61 RFIs’ start-up capital requirement amounts to R100 000, which is seemingly a hurdle for many would-be intermediaries, especially those in rural areas (Ntsika, 1999b:137). 62 Khula Annual Website Report for 1999. 63 Cited in Business Day, 9 May 2000:3. 64 Ntsika, 1999a: 28. 65 Khula Annual Website Report 1999; interview with Platon Manjome, 02.11.2000. 66 Ntsika, 1999b; own interviews. 67 Levy, 1996:12. 68 Levy, 1996; Ntsika, 1999b. 69 In 1999, the Usury Act permits higher interest rates to be charged for loans below R10 000. Raising this threshold to R50 000 is perceived to increase lending to SMMEs by banks (Ntsika, 1999b). 70 Ntsika, 1999b: 40. 71 Ibid, 38. 72 Ibid. 73 Rogerson and Reid, 1997; Ntsika, 1999b.

49
Box 3.2: New directions for South Africa's LBSC and RFI programmes
Ntsika's LBSC and Khula's RFI networks have received a lot of public and research attention. This research evidence suggests that the coordination and communication between and within networks is poor. Moreover, both the marketing and implementation of the LBSC and RFI programmes seemingly leave room for improvement. Raising awareness about SMME support initiatives As early as in the beginning of the 1990s, the common thread running through research on South African SMMEs indicated that large segments of South Africa’s SMME economy share a history of official harassment, and therefore SMMEs are not looking for external assistance. Research evidence suggests that, even after six years of overt SMME promotion, SMMEs’ awareness of support programmes is generally low. Disappointment prevails among SMME entrepreneurs whose applications were turned down, and frustration about the discontinuity of specific schemes is high. With six years of SMME support programmes running and both SMME clients and donors questioning their effectiveness, the credibility of local service delivery networks and national support institutions as the competent source of SMME assistance needs to be reinstated. Nevertheless, a first prerequisite for SMME promotion to occur is awareness of such efforts. SMME support initiatives need to be marketed stronger and in various ways to their target groups. Local intermediaries are closest to SMME clients, but would require a ‘marketing’ budget or written material to inform about support programmes other than the LBSC network. Providing tools for effective service delivery by local intermediaries South Africa’s LBSC and RFI networks consist of a blend of organisations with varying human and financial capacities and experiences in service provision, and operating in peculiar localities. If these intermediaries were equipped with process and product tools, a defined standard of operations (other than presently meeting ‘core principals’) could be expected and assessed. As a consequence, the rather messy and ‘colourful’ patchwork of service providers with little affiliation could be turned into a more orderly grid that was envisaged in the 1995 White Paper. RFIs have the responsibility of risk assessment, while LBSCs are responsible for needs assessment of their potential clients. In many cases, however, intermediaries lack the capacity and financial resources to develop such a tool, which could be provided by distributing ‘exemplary best practice’ drawn from outstanding local intermediaries to the entire network. Such tools are already developed by some LBSCs for the implementation of non-financial services and for management systems whose re-distribution among LBSCs would increase the overall performance of the ‘network.’ RFIs and LBSCs are to submit regular performance records to Khula and Ntsika, and Khula in particular sanctions if performance targets (mostly as ‘number of clients serviced’) fail to be met. After-care or evaluation of learning transfer/effective use of borrowed capital are neither undertaken nor requested in performance records – although they are better indicators of the effectiveness of service delivery. Given the general financial and capacity constraints of many LBSCs and RFIs (other than commercial banks) and their need to meet performance targets, provision and training on evaluation and monitoring tools and financial incentives to involve in client after-care74, would both benefit the individual intermediary as well as overall service delivery. Strengthening the collaboration between service providers Accredited local service providers commonly experience pressure to meet performance targets and the need to generate income through their activities, which makes them fierce competitors rather than collaborative peers. SMMEs are hence not perceived beneficiaries of the support network as a whole, but clients of the individual intermediary. As capacities vary and non-financial is separated from financial support, stronger interference between intermediaries is needed to affect the delivery of ‘packaged’ support services to SMMEs. This would entail awareness of the existence of other service providers in the area and regular and interactive meetings amongst such service providers to build trust-relationships. Moreover, the cost of passing on information and referring a client (as a potential source of income which may be lost through the referral) needs to be shifted from the single intermediary onto the network (in whose interest such a referral occurs).75
74 SMME clients do generally not request any follow-up visits, and this market imperfection could be overcome by heavily subsidising such activities. 75 For example, this can take the form of a fixed fee for referrals, or a kind of royalty (fee) on all income derived from the referred client.
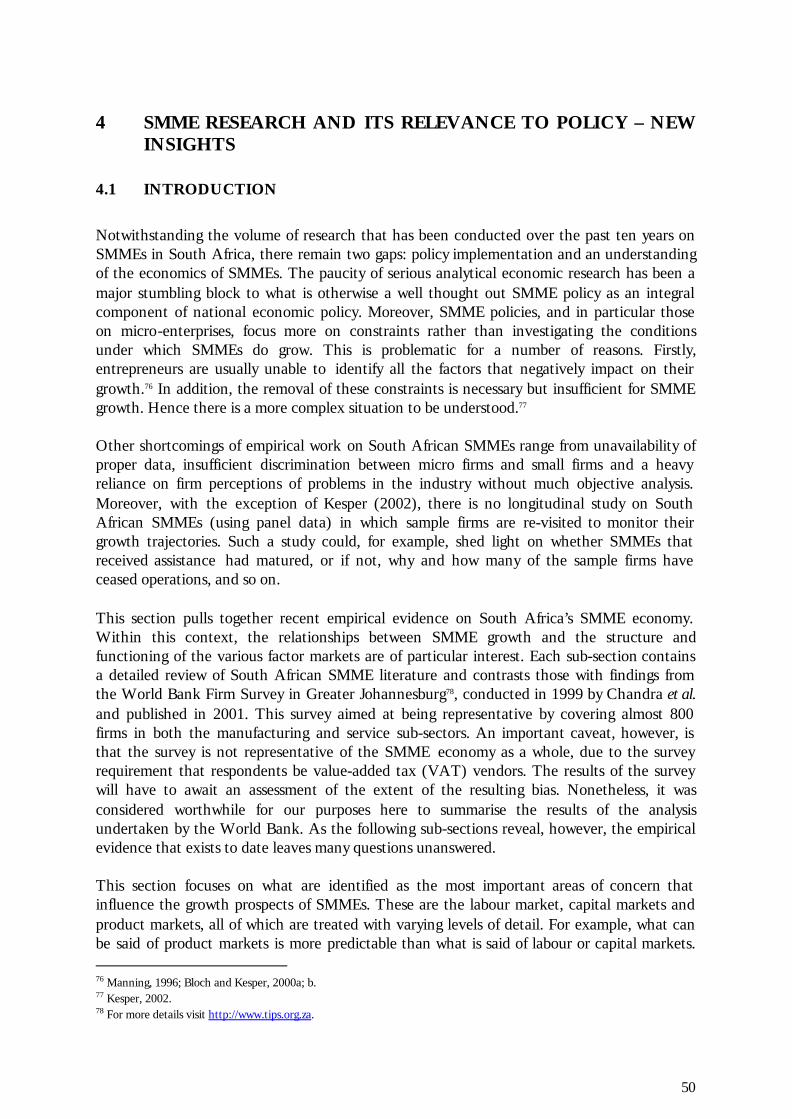
50
4 SMME RESEARCH AND ITS RELEVANCE TO POLICY – NEW INSIGHTS
4.1 INTRODUCTION
Notwithstanding the volume of research that has been conducted over the past ten years on SMMEs in South Africa, there remain two gaps: policy implementation and an understanding of the economics of SMMEs. The paucity of serious analytical economic research has been a major stumbling block to what is otherwise a well thought out SMME policy as an integral component of national economic policy. Moreover, SMME policies, and in particular those on micro-enterprises, focus more on constraints rather than investigating the conditions under which SMMEs do grow. This is problematic for a number of reasons. Firstly, entrepreneurs are usually unable to identify all the factors that negatively impact on their growth.76 In addition, the removal of these constraints is necessary but insufficient for SMME growth. Hence there is a more complex situation to be understood.77 Other shortcomings of empirical work on South African SMMEs range from unavailability of proper data, insufficient discrimination between micro firms and small firms and a heavy reliance on firm perceptions of problems in the industry without much objective analysis. Moreover, with the exception of Kesper (2002), there is no longitudinal study on South African SMMEs (using panel data) in which sample firms are re-visited to monitor their growth trajectories. Such a study could, for example, shed light on whether SMMEs that received assistance had matured, or if not, why and how many of the sample firms have ceased operations, and so on. This section pulls together recent empirical evidence on South Africa’s SMME economy. Within this context, the relationships between SMME growth and the structure and functioning of the various factor markets are of particular interest. Each sub-section contains a detailed review of South African SMME literature and contrasts those with findings from the World Bank Firm Survey in Greater Johannesburg78, conducted in 1999 by Chandra et al. and published in 2001. This survey aimed at being representative by covering almost 800 firms in both the manufacturing and service sub-sectors. An important caveat, however, is that the survey is not representative of the SMME economy as a whole, due to the survey requirement that respondents be value-added tax (VAT) vendors. The results of the survey will have to await an assessment of the extent of the resulting bias. Nonetheless, it was considered worthwhile for our purposes here to summarise the results of the analysis undertaken by the World Bank. As the following sub-sections reveal, however, the empirical evidence that exists to date leaves many questions unanswered. This section focuses on what are identified as the most important areas of concern that influence the growth prospects of SMMEs. These are the labour market, capital markets and product markets, all of which are treated with varying levels of detail. For example, what can be said of product markets is more predictable than what is said of labour or capital markets. 76 Manning, 1996; Bloch and Kesper, 2000a; b. 77 Kesper, 2002. 78 For more details visit http://www.tips.org.za.

51
Some areas that are left out include technological change and innovation activities among SMMEs – these are of great importance, but owing to the specialised nature of the subject matter, they fall outside the scope of the study. Indeed, the importance of entrepreneurial talent can hardly be gainsaid. The problem with researching entrepreneurship is that while it is a vital ingredient in the graduation of small enterprises (and more so in the larger ones), it is actually a composite term for the personal characteristics, attitudes, education and spontaneity of the entrepreneur. It is also important to bear in mind that the role government policy plays in the different areas differs quite considerably. For example, there may be more scope for effective interventions in the labour market or capital markets, but less so in product markets.
4.2 EMPLOYMENT, LABOUR REGULATION AND SKILLS
Several of the challenges faced by the SMME sector in South Africa involve the need to increase the level of human capital and to assure its effective allocation among potential uses. The role of labour, labour markets and skill level are probably the most important contributors to SMME growth. One of the key factors exacerbating the unemployment problem in South Africa is that the large presence of an unskilled labour force coincides with the following problems:
• Limited potential of the competitive tradeable sector to create jobs in the short-term;
• At a time when achieving export (and import competing) success in some of the more labour-intensive tradable sectors would have been especially beneficial (due to the process of globalisation and opening up), the entry of large very low wage countries such as India and China has made it increasingly difficult to compete in these products. This has limited the potential for easy job creation from rising trade;
• South Africa’s legacy of unequal access to human capital has created a large relatively
low-skilled component of the labour force at a time when demand is falling rapidly for that skill level; and
• Trade unions have considerable strength and would naturally be unwilling to accept
that, if the equilibrium wage is very low, it should be accepted. In this setting therefore, the challenge is to find the best possible compromise between the needs and desires of workers, the stance of the unions, and the capacity of SMMEs to generate productive and remunerative employment. 4.2.1 Assessing the capacity of SMMEs to create sustainable employment
SMMEs are generally associated with more labour-intensive production and are hence perceived to have a high labour-absorptive capacity. In South Africa, many researchers have observed, however, that most of the employment generated in the SMME economy does not

52
result from the expansion of more established and larger SMMEs, but from the formation of new micro- and survivalist enterprises.79 The World Bank SMME survey asked firms to list their total full-time employees for 1997, 1998 and 1999. In the 792 SMMEs in Greater Johannesburg, total employment grew by 23%, from 9400 jobs in 1997 to 11 600 jobs in 1999. Figure 4.1 portrays sectoral employment over the three years (the number below each sector group shows total percentage growth between 1997 and 1999). Figure 4.1: Total employment and growth by sector, 1997-1999
0
500
1000
1500
2000
Clothing etc. Metal workers Furniture Prep.food Tourism Construction Retail IT
Total
Emplo
ymen
t
1997 1998 1999 12% -3% 23% 54% 61% -12% 50% 53%
Source: Chandra et al. (2001). Note: the number below each sector group shows total percentage growth between 1997 and 1999 With the exception of the metal products and construction sectors, employment growth was significant across all sectors, with increases of 50% or higher occurring in three service sectors – tourism, IT and retail.80 At face value, these numbers seem to suggest that the SMME tier generated substantial new employment, especially at a time when larger manufacturing firms were shedding jobs. However, this conclusion rests on the critical issue whether these new income opportunities were generated by existing SMMEs that expanded and created new jobs, or through the emergence of new SMMEs. The source of new employment is so important because young SMMEs are prone to higher mortality rates and do therefore generate more secure employment opportunities. Looking at employment change in existing SMMEs, of the total sample, 582 SMMEs (73%) were founded prior to 1998. The employment dynamics in these ‘older’ SMMEs are illustrated
79 See, for example, Rogerson, 1999; Kesper, 2000d. 80 The survey does not track firms that have ceased production and thus omits an important potential source of job losses.

53
in Table 4.1 and Figure 4.2. The data in Table 4.1 suggests that total employment in existing SMMEs declined by 7% between 1997 and 1999 – from 9500 workers to 8800. Average employment per firm declined from 16 to 15 employees. Table 4.1: Employment Growth in Existing SMMEs
Net change in employment 1997-99 (%) All firms -7 Clothing and textiles -14 Metal products -18 Paper & furniture -1 Prep. Food & beverages -2 Tourism 9 Construction -28 Retail 10 IT 25 Black -3 Asian & Coloured 4 White -5 Foreign -17
Source: Chandra et al. (2001)
Existing firms in all four manufacturing sub-sectors and construction shed jobs, a trend consistent with the job losses recorded for the entire manufacturing sector in South Africa over the same period. The three emerging service sectors, by contrast, recorded employment gains of between 9 and 25%, albeit from relatively low 1997 base levels. The data in Figure 4.2 reveals that 27% of the ‘older’ sample SMMEs decreased employment, 41% of firms increased, and 32% of firms had no change in employment. Since overall employment declined, job losses in firms with decreasing employment more than offset employment gains in the firms that created jobs. Figure 4.2: Employment growth in existing firms by sector and race, 1997-99
-4 0 - 2 0 0 2 0 4 0 6 0
Clothing etc. Metal workers
Furniture Prep.Food/bev.
Tourism Construct ion
Retai l IT
Black Asian+Coloured
White Foreign
Percentage of f i rms
Percentag e o f f i rmswith increased employment
Percentage of f i rmswith decreased employment
Source: Chandra et al. (2001)
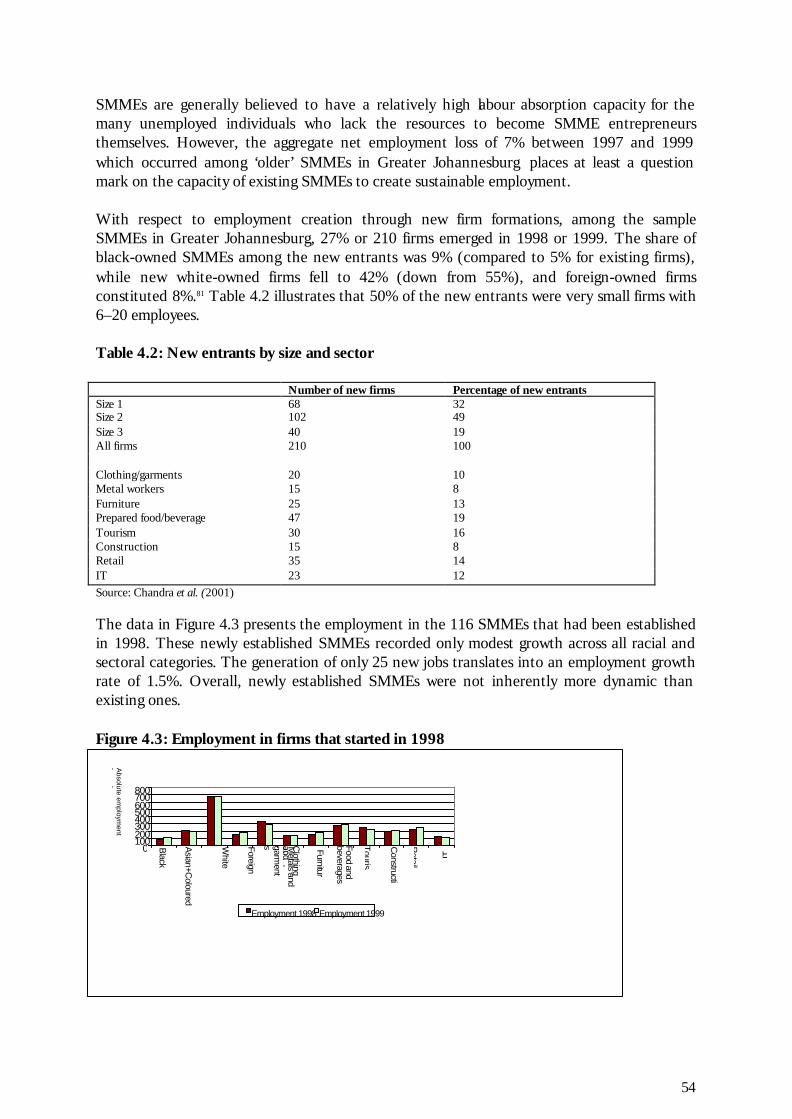
54
SMMEs are generally believed to have a relatively high labour absorption capacity for the many unemployed individuals who lack the resources to become SMME entrepreneurs themselves. However, the aggregate net employment loss of 7% between 1997 and 1999 which occurred among ‘older’ SMMEs in Greater Johannesburg places at least a question mark on the capacity of existing SMMEs to create sustainable employment. With respect to employment creation through new firm formations, among the sample SMMEs in Greater Johannesburg, 27% or 210 firms emerged in 1998 or 1999. The share of black-owned SMMEs among the new entrants was 9% (compared to 5% for existing firms), while new white-owned firms fell to 42% (down from 55%), and foreign-owned firms constituted 8%.81 Table 4.2 illustrates that 50% of the new entrants were very small firms with 6–20 employees. Table 4.2: New entrants by size and sector Number of new firms Percentage of new entrants Size 1 68 32 Size 2 102 49 Size 3 40 19 All firms 210 100 Clothing/garments 20 10 Metal workers 15 8 Furniture 25 13 Prepared food/beverage 47 19 Tourism 30 16 Construction 15 8 Retail 35 14 IT 23 12 Source: Chandra et al. (2001)
The data in Figure 4.3 presents the employment in the 116 SMMEs that had been established in 1998. These newly established SMMEs recorded only modest growth across all racial and sectoral categories. The generation of only 25 new jobs translates into an employment growth rate of 1.5%. Overall, newly established SMMEs were not inherently more dynamic than existing ones. Figure 4.3: Employment in firms that started in 1998
0100200300400500600700800
Black
Asian+C
oloured
White
Foreign
Clothing
and garm
ents M
etals and M
etal
Furniture
Food and beverages
Touris Constructi
Retail
IT
Absolute em
ployment
levels
Employment 1998 Employment 1999

55
Source: Chandra et al. (2001)
4.2.1.1 Key Considerations
The change in employment in any given category of firms reflects the employment created by new firms plus the net increase in employment of existing firms minus the employment loss through firm disappearance. As noted above, though the net employment growth in the set of firms sampled was considerable (23% over two years, or over 10% per year), all of this increase was due to the arrival of new firms in each year. The rate of new firm creation relative to the existing base is about 15%, which is quite high by international standards. Often high rates of creation go hand in hand with high rates of mortality, so it seems probable that this was the case here, especially in light of the macroeconomic stagnation at the time. This then leaves the possibility that total SMME employment in Greater Johannesburg may have been rising, but certainly by a figure much less than the average of 10% per year; for the firms in this sample, it may even have been falling. It would require reliable aggregate data to answer this question satisfactorily, especially on the rate of firm mortality and the levels of employment of the disappearing firms. On the optimistic side, international experience suggests that employment change in existing firms is much affected by the macroeconomic setting and by other deterrents like the level of crime, so it is highly probable that under more favourable circumstances this set of firms would have achieved positive employment growth and that net employment growth of the SMME sector would have been significant. The one important factor that could fundamentally influence employment growth is both wage behaviour and regulation in the labour market. It must be noted that the above tentative conclusions ignore the possible bias in the survey due to the requirement that respondents be paying VAT. At the bottom of the size range, the share of SMMEs paying VAT is presumably relatively small. Most new firms would hence not be doing so. The survey sample might therefore not be representative for newly founded SMMEs. Moreover, the SMME survey in Greater Johannesburg excluded medium-sized firms (as defined in the Small Business Act), which are reported to generate the bulk of formal SMME employment. By analysing the data of the World Bank’s large firm survey, their contribution to employment growth could be assessed.
4.2.2 Wage agreements and other labour regulation
A commonly perceived constraint of established SMMEs are the ‘Labour Laws,’ which are said to: raise the costs of employment, especially of lower-skilled employees; artificially prolong retrenchments or corrective action; and not allow for adequate flexibility, especially in wage settings and the arrangement of working time.82
81 The reminder of the firms did not report the identity of the owners. 82 Kesper, 1999a; Ntsika, 1999b: 68; Kesper, 2000c.
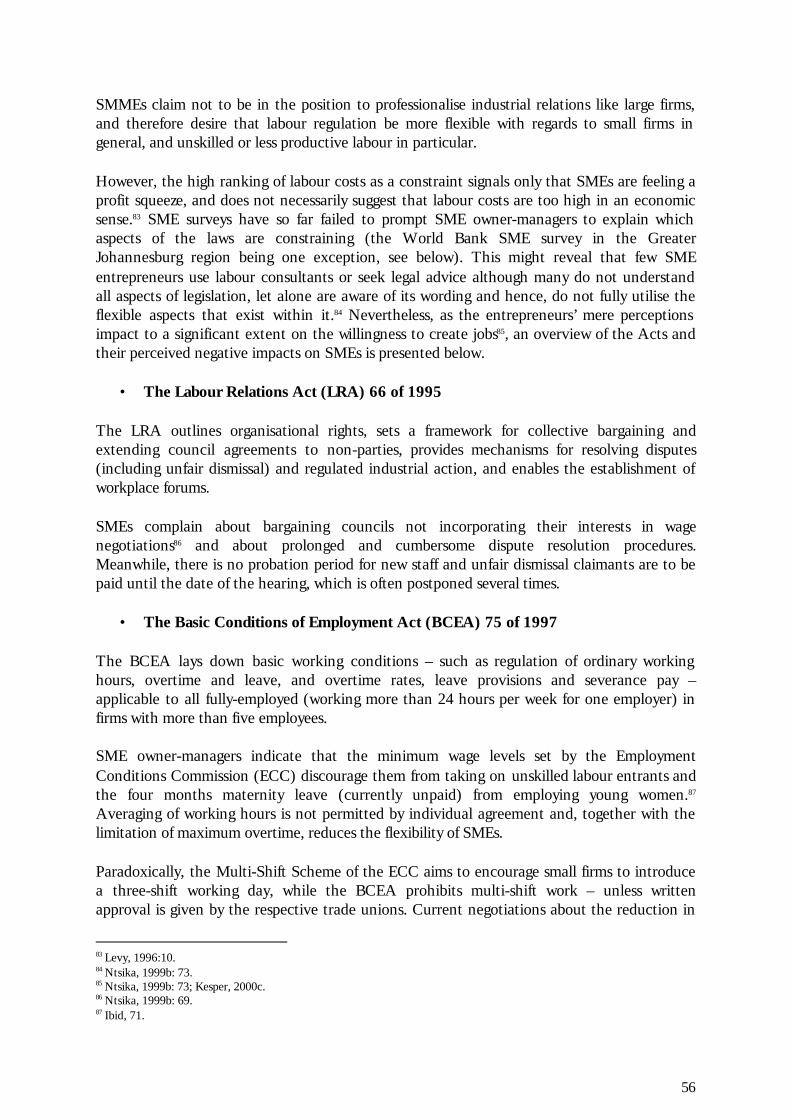
56
SMMEs claim not to be in the position to professionalise industrial relations like large firms, and therefore desire that labour regulation be more flexible with regards to small firms in general, and unskilled or less productive labour in particular. However, the high ranking of labour costs as a constraint signals only that SMEs are feeling a profit squeeze, and does not necessarily suggest that labour costs are too high in an economic sense.83 SME surveys have so far failed to prompt SME owner-managers to explain which aspects of the laws are constraining (the World Bank SME survey in the Greater Johannesburg region being one exception, see below). This might reveal that few SME entrepreneurs use labour consultants or seek legal advice although many do not understand all aspects of legislation, let alone are aware of its wording and hence, do not fully utilise the flexible aspects that exist within it.84 Nevertheless, as the entrepreneurs’ mere perceptions impact to a significant extent on the willingness to create jobs85, an overview of the Acts and their perceived negative impacts on SMEs is presented below.
• The Labour Relations Act (LRA) 66 of 1995 The LRA outlines organisational rights, sets a framework for collective bargaining and extending council agreements to non-parties, provides mechanisms for resolving disputes (including unfair dismissal) and regulated industrial action, and enables the establishment of workplace forums. SMEs complain about bargaining councils not incorporating their interests in wage negotiations86 and about prolonged and cumbersome dispute resolution procedures. Meanwhile, there is no probation period for new staff and unfair dismissal claimants are to be paid until the date of the hearing, which is often postponed several times.
• The Basic Conditions of Employment Act (BCEA) 75 of 1997 The BCEA lays down basic working conditions – such as regulation of ordinary working hours, overtime and leave, and overtime rates, leave provisions and severance pay – applicable to all fully-employed (working more than 24 hours per week for one employer) in firms with more than five employees. SME owner-managers indicate that the minimum wage levels set by the Employment Conditions Commission (ECC) discourage them from taking on unskilled labour entrants and the four months maternity leave (currently unpaid) from employing young women.87 Averaging of working hours is not permitted by individual agreement and, together with the limitation of maximum overtime, reduces the flexibility of SMEs. Paradoxically, the Multi-Shift Scheme of the ECC aims to encourage small firms to introduce a three-shift working day, while the BCEA prohibits multi-shift work – unless written approval is given by the respective trade unions. Current negotiations about the reduction in
83 Levy, 1996:10. 84 Ntsika, 1999b: 73. 85 Ntsika, 1999b: 73; Kesper, 2000c. 86 Ntsika, 1999b: 69. 87 Ibid, 71.
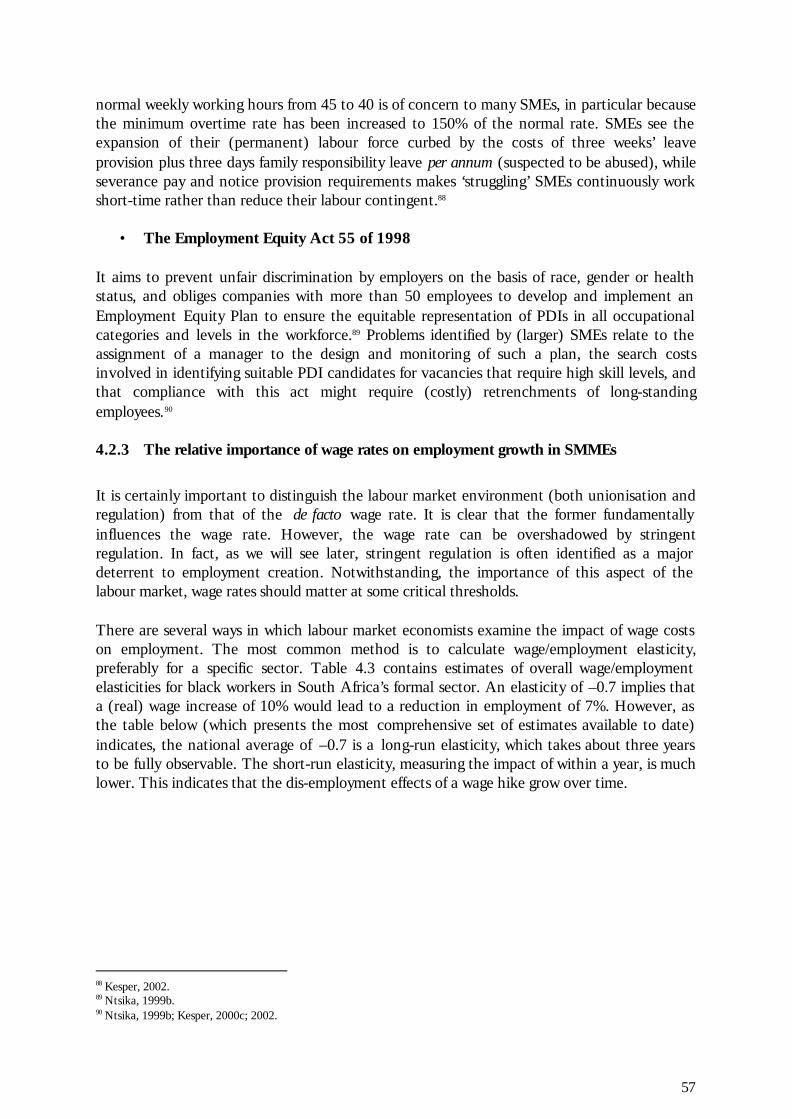
57
normal weekly working hours from 45 to 40 is of concern to many SMEs, in particular because the minimum overtime rate has been increased to 150% of the normal rate. SMEs see the expansion of their (permanent) labour force curbed by the costs of three weeks’ leave provision plus three days family responsibility leave per annum (suspected to be abused), while severance pay and notice provision requirements makes ‘struggling’ SMEs continuously work short-time rather than reduce their labour contingent.88
• The Employment Equity Act 55 of 1998 It aims to prevent unfair discrimination by employers on the basis of race, gender or health status, and obliges companies with more than 50 employees to develop and implement an Employment Equity Plan to ensure the equitable representation of PDIs in all occupational categories and levels in the workforce.89 Problems identified by (larger) SMEs relate to the assignment of a manager to the design and monitoring of such a plan, the search costs involved in identifying suitable PDI candidates for vacancies that require high skill levels, and that compliance with this act might require (costly) retrenchments of long-standing employees.90 4.2.3 The relative importance of wage rates on employment growth in SMMEs
It is certainly important to distinguish the labour market environment (both unionisation and regulation) from that of the de facto wage rate. It is clear that the former fundamentally influences the wage rate. However, the wage rate can be overshadowed by stringent regulation. In fact, as we will see later, stringent regulation is often identified as a major deterrent to employment creation. Notwithstanding, the importance of this aspect of the labour market, wage rates should matter at some critical thresholds. There are several ways in which labour market economists examine the impact of wage costs on employment. The most common method is to calculate wage/employment elasticity, preferably for a specific sector. Table 4.3 contains estimates of overall wage/employment elasticities for black workers in South Africa’s formal sector. An elasticity of –0.7 implies that a (real) wage increase of 10% would lead to a reduction in employment of 7%. However, as the table below (which presents the most comprehensive set of estimates available to date) indicates, the national average of –0.7 is a long-run elasticity, which takes about three years to be fully observable. The short-run elasticity, measuring the impact of within a year, is much lower. This indicates that the dis-employment effects of a wage hike grow over time.
88 Kesper, 2002. 89 Ntsika, 1999b. 90 Ntsika, 1999b; Kesper, 2000c; 2002.

58
Table 4.3: Wage Elasticities for Black Formal Sector Employees
Sector and industries
Long-Run Short-Run Sector and industries
Long-Run Short-Run
1 Beverages -0.184 -0.095 9 Non-met Minerals -2.929 -0.451 2 Tobacco -0.057 -0.018 10 Basic Metals -0.758 -0.166 3 Textiles -0.984 -0.346 11 Fabricated Metals -0.466 -0.175 4 Wearing Apparel -2.508 -0.709 12 Non-Electr. Mach. -0.632 -0.408 5 Wood Products -0.196 -0.603 13 Transport Equipment -0.440 -0.201 6 Furniture -0.364 -0.139 14 Mining -0.146 -0.118 7 Chemicals -1.166 -0.344 15 Construction -0.554 -0.360 8 Rubber and Plastic -0.243 -0.153 16 Services -0.948 -0.147 Weighted Mean -0.709 -0.156 Source: Fallon and Lucas, 1998
The above table further reveals that wage/employment elasticities vary quite widely by sector and industry, ranging from a low of –0.057 for the tobacco industry to a high of about –2.9 for non-metallic minerals. Surprisingly, for a highly unionised sector such as mining, a 10% wage rise is predicted to lead only to a 1.4% drop in employment. It must be noted that the extent to which capital is able to replace labour, and the speed with which replacement can take place, affects the level of these elasticities. It may be that, because such replacement takes a considerable length of time in mining, even the three-year horizon which defines the ‘long-run’ in these figures, is too short to reflect the full impact of wage hikes. The low figure for mining contrasts with the service sector’s estimated elasticity of 0.9, which implies that a 10% wage increase would be associated with a 9% decline in employment. Moreover, it is not clear what other exogenous variables have been controlled for and it may be that the impact on employment depends on a range of other unobserved factors. Nevertheless, as wage/employment elasticities vary by sectors and industries, it is highly likely that they also do so by firm size. Indeed, employment in industries with a very high SMME content such as ‘Wearing Apparel’ seems more sensitive than others to wage increases. As it is critical to understand the factors that impact on the employment dynamics of SMMEs and how they do so, it is suggested that the above sector-specific analysis is taken further to produce sector and size-specific elasticities. It is argued that the recently introduced labour regulation in general, and collective wage-setting agreements (and their extension to non-party members) in particular, burden South African firms as they try to find a competitive response to trade liberalisation. The findings from the World Bank’s Large Manufacturing Firm Survey reveal that firm managers are less concerned about the direct than the implicit costs of hiring labour. These implicit costs are a function of the number of unions a particular firm must work with, the number of disciplinary inquiries per annum, the number of strikes, the level of collective agreement, and so on. Overall, SMME employees appear to be less unionised than their large firm counterparts. Accordingly, the employees of 73% of the SMMEs had no union membership, while 23% of the sample SMMEs dealt with one union. Collective wage-setting agreements in South Africa limit a firm’s flexibility to respond to local market conditions. The data in Figure 4.4 indicates that the level of collective agreement declines with size. Indeed, 90% of the micro-enterprises, 72% of the very small and 42% of the small firms were not bound by any collective agreement. If manufacturing and

59
construction SMMEs have agreements, the bargaining council system, which is extended to non-party members, is most frequently encountered. IT and tourism SMMEs, by contrast, are in 80% of the cases not subject to any agreement. Figure 4.4: Level of collective agreement for SMME firms Source: Chandra et al. (2001)
No clear patterns emerge from the response to the various acts introduced. However, about 50% of the SMMEs reported being largely unaffected, while 20-22% noted these regulations were not applicable to them. Another 7-14% of firms were not familiar with the ‘Labour Laws,’ especially those introduced more recently. In the case of each regulation, firms with over 20 employees were significantly more affected than very small or micro-sized firms. While the majority of SMMEs reported that their employment levels were relatively unaffected by any specific labour market regulation, their responses to how they adjusted to all four regulations suggests a preference for more flexible labour arrangements. Figure 4.5 shows that between 10-15% of the sample SMMEs reduced employment. Moreover, those with more than 20 employees hired fewer workers (23-38%), substituted machinery for workers (11-23%), hired additional temporary workers (19-31%), and/or sub-contracted (18-24%). All of these actions adversely affect permanent job creation. More favourable outcomes (such as increased productivity or improved labour relations) were noted by not more than 12-15% of the larger SMMEs.
0 10 20 30 40 50 60 70 80 90 100
Clothing/garments Metal workers
Furnitur e Prepared food/beverage
Tourism Construction
Retail IT
Size 1 Size 2 Size 3
Percent of f irms
No agreement
Establishment/plant level Company level
Sector/industry level (bargaining council) Wage Determination Board Other
60
Figure 4.5: Response to labour regulations, by firm size Source: Chandra et al. (2001). Note: Size 1(2-5 employees); Size 2 (6-20 employees); Size 3(21-49 employees)
Relative to large manufacturing firms, SMMEs appear to be less affected by the unintended consequences of labour market regulations. However, when they show a response, SMMEs react to the restrictions in similar ways.91 Indeed, the unintended negative impact of the ‘Labour Laws’ on employment levels in SMMEs seems strongest in ‘small’ firms where the scope for job creation is more significant. Capital-labour substitution is not as feasible for SMMEs as for large firms and therefore not the most frequently reported response. Nevertheless, the casualisation (hiring temporary workers) or shedding of employees is a similarly undesirable outcome of labour market regulations. However, since SMMEs are not sufficiently familiar with the various Acts, there is no empirical evidence about the reasons for ‘hiring fewer workers.’ Temporary workers, by contrast, were employed by the sample SMMEs to respond flexibly to demand changes rather than to cut costs.
91 This finding is consistent with research undertaken by Ntsika (1998) that analyzed the impact of the BCEA on small enterprises. Ntsika found that there is a low degree of compliance among small enterprises and that emerging enterprises have more difficulty in complying. Low compliance is generally due to low awareness, rather than willful evasion, although new requirements related to employment termination are perceived as a hindrance.
0 5 10 15 20 25 30 35 40
Hire fewer workers
Substitute machinery for workers
Hire workers on a temporary basis
Rely on sub - contracting
L abo u r relations and/or productivity improve
Percent of firms Size 1 Size 2 Size 3

61
Figure 4.6: Reasons for hiring temporary workers
Source: Chandra et al. (2001)
Indeed, Figure 4.6 suggests that ‘flexibility to expand or contract’ is by far the most important reason for SMMEs to engage temporary staff, who are in turn vulnerable to changing conditions in aggregate demand and number of customers. Nevertheless, 40% of firms hire temporary workers because they are easier to lay-off and just over 20% do so because they are cheaper. As a general observation, it is highly unlikely that labour regulation has an impact on micro-enterprises. In general, it is presumed to have an impact on firms somewhere in the middle of the SMME size range. These firms were found to be most sensitive to both wage levels and labour legislation. Size 3 firms suggest a high degree of reaction, with nearly 40% indicating that they would hire fewer workers. Approximately 25% of firms would substitute away from labour towards machinery, while over 30% said that they would hire workers on a temporary basis. It would be important to carry this analysis further, especially for Size 2 and 3 firms, in order to try and decompose the net employment reduction as the responses constitute a combination of direct employment reduction (‘hire fewer workers’) and changes in the type (quality) of work (‘hire workers on a temporary basis’ and ‘rely on subcontracting’). 4.2.3 Skill levels and training
South Africa is characterised by a systematic under-investment in human capital for all but a privileged few, which has resulted in a labour force with a racially skewed distribution of craft skills, career opportunities and work-place experience.92 Consequently, manufacturing SMEs suffer relatively low access to skilled technicians and craftsmen,93 as well as foremen and mid-management, staff motivation and team building skills.94 SME owner-managers express high interest in receiving assistance in these fields. Indeed it was identified as the second priority
92 Ajam, 1994; Levy, 1996; Levin, 1997b). 93 Levy, 1996:13; Levin, 1997b; Harrison and Dunne, 1999. 94 Bloch and Kesper, 2000a;b.
0 10 20 30 40 50 60 70 80 90 100
Wages of temporary workers are lower
Non-wage costs of temporary workers are lower
Flexibility to expand or contract
Temporary workers are easier to lay-off
Percent of firms that employ temporary workers
62
after market development of SMEs in Western Cape and Gauteng.95 However, so far, little use of external employee or staff training has been made as their experience with the industry training boards was disappointing,96 as well as due to a lack of information about alternative training facilities. The Skills Development Act of 1997 addresses the problem of skill levels in the South African labour force. An amendment to this legislation in March 2000 stipulates that industrial training boards will be replaced by sector education and training authorities (SETAs). SETAs receive 80% of a payroll levy, currently set at 0.5% per annum, from those firms with total remuneration costs higher than R250 000, i.e., those with about 10 employees, paid to the National Skills Fund. With these funds, the development of a sector skills plan, approvals of workplace skill plans, and the promotion of ‘learnership’ contracts for would-be or current employees are financed. While the full impact of the Act cannot be assessed yet, SME entrepreneurs already express concern about the administration costs of recovering levies in the form of grants for training undertaken, the costs of designing a workplace training programme as an alternative to using external training institutions, and the relatively high charges by private training institutions after the closure of the former industrial training boards, which had been directly subsidised through levies from the industry.97 Data from the Large Manufacturing Firm Survey98 suggest that the primary factor constraining employment growth for larger firms in South Africa is the scarcity of skilled labour. The SMME survey sought to verify whether the same applied to firms with less than 50 employees (Figure 4.7). Figure 4.7: Employment of skills by race, 1999
Source: Chandra et al. (2001) 95 Bloch and Kesper, 2000a; b. 96 Altman, 1994; Harrison and Dunne, 1998; Kesper, 1999a. 97 Kesper, 2002. 98 See Chandra et al. (2001)
0 10
20 30
40 50
60
70 80 90
100
Skilled
Sem
i-skilled
Unskilled
Percent of em
ployment
Whites
Indians
Coloureds
Africans

63
Figure 4.6 presents the results with regard to employment of skills by race in 1999. Africans dominate both semi-skilled and unskilled occupations, while whites dominate skilled occupations in SMMEs. Nevertheless, in comparison to employment in the large firms, the SMME tier is characterized by a much higher percentage of Africans in the semi-skilled category.99 This suggests that it has been easier for semi-skilled Africans to find employment in SMMEs than in larger firms. The legacy of apartheid and its impact on skills development has resulted in a skills shortage in the entire South African economy. It is therefore little surprising that 30-45% of the sample SMMEs reported difficulty in finding skilled labour.100 Notably, SMMEs with over five employees faced more difficulty than micro firms with less than five employees. Table 4.4 lists the proportion of firms by sector that reported difficulty in finding skilled workers. Except for the retail sector, the skills constraint appears fairly uniform. With over 30-45% of firms reporting a skills shortage, it is important to determine how SMMEs in the Greater Johannesburg area respond to this perceived skills shortage through private provision of training. The SMME survey found that a fairly small proportion of SMMEs provide training for their workers (in comparison to 43% of the larger firms). Table 4.4: Difficulty in finding skilled workers by sector
Percentage of firms Furniture 56.5 Metal workers 48.4 Clothing/garments 39.8 Prepared food/beverage 35.7 Construction 44.6 IT 42.9 Tourism 42.4 Retail 20.7
Source: Chandra et al. (2001)
Table 4.5 lists the share of the different size groups that invested in formal skills training and the median investment per employee in 1999. Roughly 24-30% of firms with over five employees and less than 10% of firms with less than five employees undertook formal skills training in 1998.101 For those that trained, median spending per employee decreased as firm size increased, which is indicative of high fixed costs of organising external training. Table 4.5: SMMEs that invested in any formal skills training, 1999
Percentage of firms Rands per employee (median) Size 1 9.9 1667 Size 2 23.7 938 Size 3 30.1 400
Source: Chandra et al. (2001)
99 In the Large Firm Manufacturing Survey, the approximate share of Africans in semi-skilled categories is: 30% of clerical and service labor; 50% of craft and trade labor; and 80% of plant operators (Chandra et al. (2001)). 100 Both international and South African research on SMME development emphasizes the importance of improving both human capital and access to financial capital as ingredients for success. Inadequate training in the SMME sector has been noted by Rogerson (1998), Martins and Tustin (1999a), and Rwigema and Karungu (1998). 101 This question was also analysed to see whether firms that export also invest relatively more in skills provision. The sample data shows that 32% of exporting firms provide training compared to 17% for non-exporting firms. This result is consistent with the findings discussed in Tan and Batra (1995).
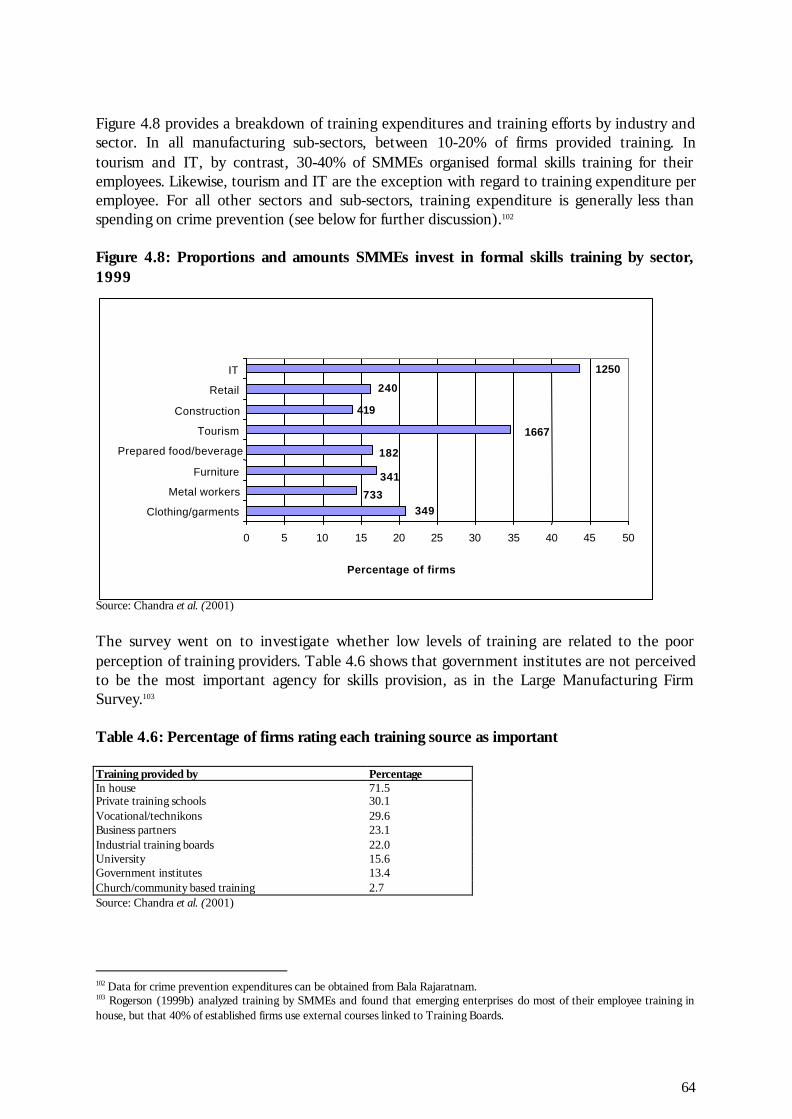
64
Figure 4.8 provides a breakdown of training expenditures and training efforts by industry and sector. In all manufacturing sub-sectors, between 10-20% of firms provided training. In tourism and IT, by contrast, 30-40% of SMMEs organised formal skills training for their employees. Likewise, tourism and IT are the exception with regard to training expenditure per employee. For all other sectors and sub-sectors, training expenditure is generally less than spending on crime prevention (see below for further discussion).102 Figure 4.8: Proportions and amounts SMMEs invest in formal skills training by sector, 1999
Source: Chandra et al. (2001)
The survey went on to investigate whether low levels of training are related to the poor perception of training providers. Table 4.6 shows that government institutes are not perceived to be the most important agency for skills provision, as in the Large Manufacturing Firm Survey.103 Table 4.6: Percentage of firms rating each training source as important Training provided by Percentage In house 71.5 Private training schools 30.1 Vocational/technikons 29.6 Business partners 23.1 Industrial training boards 22.0 University 15.6 Government institutes 13.4 Church/community based training 2.7 Source: Chandra et al. (2001)
102 Data for crime prevention expenditures can be obtained from Bala Rajaratnam. 103 Rogerson (1999b) analyzed training by SMMEs and found that emerging enterprises do most of their employee training in house, but that 40% of established firms use external courses linked to Training Boards.
0 5 10 15 20 25 30 35 40 45 50
Clothing/garments Metal workers
Furniture Prepared food/beverage
Tourism Construction
Retail IT
Percentage of firms
1250
419 240
1667 182
341 733
349
65
When asked about what national government could do to promote SMME growth, the provision of education and training was among the key factors identified by SMME entrepreneurs. Given the prevailing scarcity of skilled labour, it is natural for SMMEs to view the provision of training as a public good. Nevertheless, it is unclear whether SMMEs might want government to facilitate and promote private provision of skills training rather than to provide training itself. Government must determine: what role is most appropriate; how best to ensure that the gains from training efforts are realised quickly; and how to focus efforts in order to achieve faster growth in the SMME tier. Some preliminary observations about the skills problem can be made at this stage. It seems paradoxical that around 40% of SMMEs report difficulty in finding skilled labour and less than 25% engage in any form of training. The need for training in South Africa, especially among the previously disadvantaged black population is obvious, and reconfirmed by various types of information. Having a population with the wide variance of schooling, specifically with the prevalence of low schooling and limited skills, does not augur well for the country at a time when technological change and economic liberalisation both have placed a higher wage and productivity premium on skills than was previously the case. Recognition of the importance of skills development is one thing, but how to fine tune policy to achieve this is another. There are questions about where exactly to focus efforts, what kinds of skills are especially needed, what sorts of skills suppliers are and will be the most effective, and how the composition of skills needs will shift over time. Related to question of skills is the added problem of a series of labour market questions that need further work. First, a good grasp of what the structure of wages (by skill class) and of labour productivity by firm size and sector (and by insertion or not in international markets) is still lacking. In most developing countries with strong and growing SMME sectors, there is a considerable wage differential between small and large firms. Where a significant wage differential in favour of small firms (and usually also greater capacity to let workers go) does not exist, one might expect a smaller SME sector that contributes less to growth and employment creation. Preliminary evidence suggests that the wage gap in the size range from 50 workers up appears to be small by international standards.104 The productivity gap cited by Strycker et al. (2000) also appeared to be on the small side. It is also important to examine the wage gap by size within industries and how it has been evolving over time and the extent to which it proxies for a difference in wages by race. 4.2.4 Financial intermediation and SMMEs
The issue of access to finance is critically important, specifically for firms that show entrepreneurial talent and skills to grow. The question is how conducive is South Africa’s domestic financial architecture to SMME growth. The financial landscape includes banks, non-bank lenders, as well as public institutions. In an attempt to facilitate access to loan finance to SMMEs, Khula Finance Ltd was established as a ‘wholesale’ institution to support retail financial intermediaries (in their majority commercial banks) financially and/or by assuring guarantees of loan repayment.
104 Bhorat and Lundall, 2001: Table 6.

66
There is a frequent perception, however, that this policy initiative has not lived up to its expectations. It is believed that: many potential borrowers did not even apply for a loan (awareness problem); commercial banks did not use it (co-operation problems); and for those micro-entrepreneurs who happen to learn about the Khula schemes, lack of management support accompanying a loan application remains a constraint (mentorship is needed105). Furthermore, the extent of cannibalisation effect is unclear.106 One of the main reasons why a great deal of misunderstanding about the role of finance in SMMEs exists is that there are very few attempts to understand what financial intermediation in an economy means. The importance of finance to SMMEs remains a matter of debate in as far as what matters most – skills, entrepreneurship or finance. This section tries to deal with this paradox and to investigate the usefulness and the means of granting more or better financial support to SMMEs. “Financial support” is composed of three elements:
• The amount of finance that is available;
• The modalities of access (including the problem of exclusion of certain categories of firms); and
• The cost of finance (i.e. mainly the interest rates question).
The first part starts with some theoretical considerations on why finance is important and to what extent the “free forces” of financial markets can contribute to provide finance to SMMEs; availability, access and cost are considered. The concept of “creditworthiness” or “qualification for finance” is shown to be of great importance. In the second part, some empirical evidence is provided on South Africa’s situation, with regard to the provision of finance to SMMEs. Last, the results of the World Bank investigation are discussed under the light of the conceptual framework developed.
4.3 FINANCIAL INTERMEDIATION – SOME THEORETICAL ISSUES
As per its definition, a financial market creates a link between agents with money surpluses and agents with a need for money.107 Agents with a need for money, for example SMMEs, will have to pay a certain price to those who provide the capital. At first sight, if the market functions well, it should be able, at a particular interest rate, to allocate the entire supply (surpluses) of the economy and to accommodate the entire demand for money. An essential dimension to this problem is added, which is intuitively simple but practically complex, and resides in the distinction between “need” and “demand” for finance. In theoretical terms, “demand” implies both the expression of a need, and the agreement to get
105 A typical problem faced upfront is the skillful preparation of a business plan. 106 That is, it is unclear whether the Khula guaranteed loans went to businesses that could not have been financed otherwise, or whether they would have got a bank loan anyway. 107 The link can be either direct (e.g. investors on the securities exchange subscribe to a company’s bond), or intermediated (e.g. individuals deposit their savings onto a bank, which in turn will lend money to enterprises).

67
this need fulfilled at present market conditions. Unexpressed needs, just as needs that are expressed but where there is no ability to pay the market price, are not qualified demand.108 When the facility in question is finance, this brings us to the concept of “creditworthiness.” In theory, a loan application from a non-creditworthy firm (understood, at this stage, as a firm that cannot be expected to pay the price of the finance)109 can be ignored by the market in the process of matching supply and demand. Since “access to finance” is broader than pure credit (for example, equity finance), let us replace now the term “creditworthy” by the term “qualified.” To reformulate our understanding of the function of a market as mentioned above, we would then say that a well-functioning market should be able to provide a matching supply to the entire “qualified demand for finance,” while unsustainable businesses should be left out. With this understanding of the role of a financial market, we can now turn to the concept of market failure, which describes cases where there are dysfunctions in this allocation process. Leaving the creditworthiness issue aside for the moment, three failure situations are possible: Table 4.7: Preliminary view on capital market situations (ignoring creditworthiness)
All demand is met There is unmatched demand
All supply is allocated Well-functioning market Anomaly of type (2): demand > supply
There are some unallocated surpluses of capital
Anomaly of type (1): supply > demand
Anomaly of type (3): mismatch
The reasons for these anomalies are clearly different. The first one may occur in slow-growing economies as a result of insufficient entrepreneurship or too few investment opportunities, for example, due to a lack of markets for enterprises. The second one may result from an economy having a narrow financial base, e.g. low savings rates.110 The third situation, which at first seems the most paradoxical, is often explained as resulting from a lack of information and/or from transaction costs. The creditworthiness dimension is then added to this analysis. Without reviewing the multiple situations that can theoretically arise under such a framework, we see that the picture changes somewhat:
108 The following analogy may illustrate the concept: You may have a need for a pizza, but if your purse is empty, even if you shout your hunger, this need is purely “theoretical” and does not constitute a valid “demand.” 109 The difficulty about financing is that it is a bet on the future, i.e. the relevant criterion is not the firm's ability to pay at the moment of setting the application for finance, but at some future time when interest and/or principal are due. At this stage, however, we assume that creditworthiness exists as an objective measure of the ability of a firm to pay the price of its finance. 110 In fact, according to classical economic theory, the two former situations would be adjusted through the level of interest rates: a slow-growing economy would reduce its (real) interest rates to stimulate entrepreneurship; and a low-savings country would increase rates to induce more agents to save (i.e. provide their funds to other projects), and to attract foreign investments. When interest rates are not flexible, however, a disequilibrium can persist. This issue of interest rate regulation is revisited.
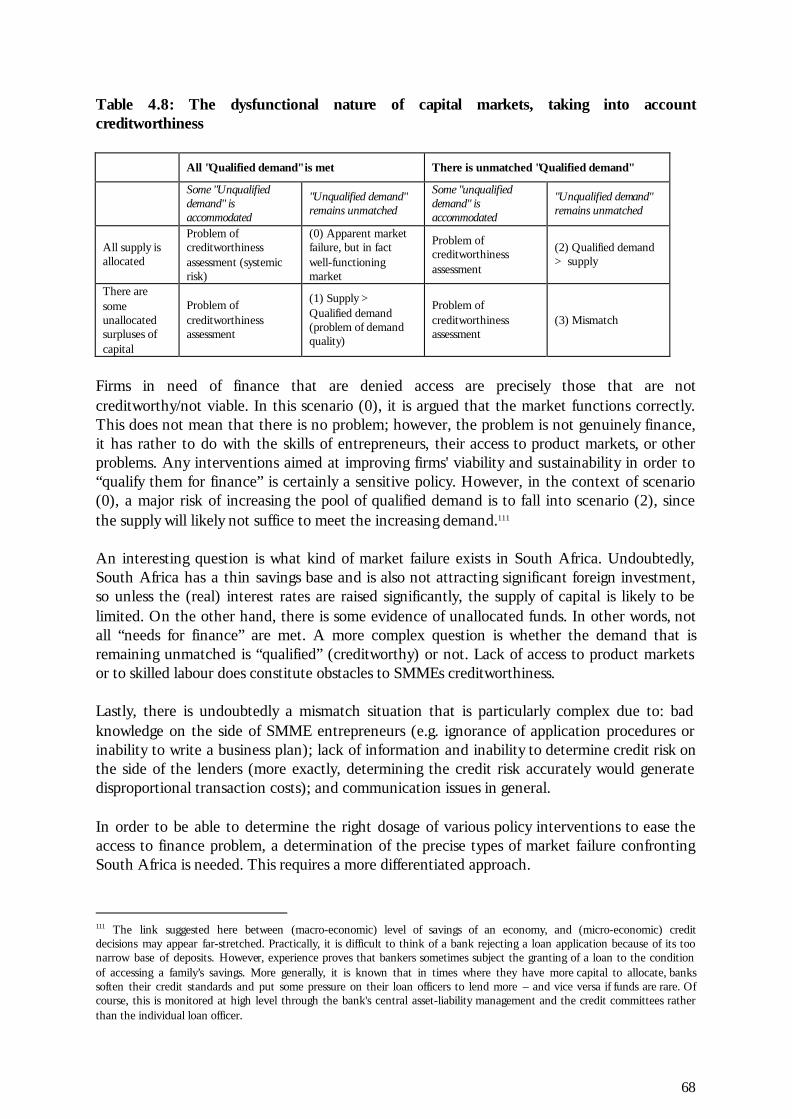
68
Table 4.8: The dysfunctional nature of capital markets, taking into account creditworthiness
All "Qualified demand" is met There is unmatched "Qualified demand"
Some "Unqualified demand" is accommodated
"Unqualified demand" remains unmatched
Some "unqualified demand" is accommodated
"Unqualified demand" remains unmatched
All supply is allocated
Problem of creditworthiness assessment (systemic risk)
(0) Apparent market failure, but in fact well-functioning market
Problem of creditworthiness assessment
(2) Qualified demand > supply
There are some unallocated surpluses of capital
Problem of creditworthiness assessment
(1) Supply > Qualified demand (problem of demand quality)
Problem of creditworthiness assessment
(3) Mismatch
Firms in need of finance that are denied access are precisely those that are not creditworthy/not viable. In this scenario (0), it is argued that the market functions correctly. This does not mean that there is no problem; however, the problem is not genuinely finance, it has rather to do with the skills of entrepreneurs, their access to product markets, or other problems. Any interventions aimed at improving firms' viability and sustainability in order to “qualify them for finance” is certainly a sensitive policy. However, in the context of scenario (0), a major risk of increasing the pool of qualified demand is to fall into scenario (2), since the supply will likely not suffice to meet the increasing demand.111 An interesting question is what kind of market failure exists in South Africa. Undoubtedly, South Africa has a thin savings base and is also not attracting significant foreign investment, so unless the (real) interest rates are raised significantly, the supply of capital is likely to be limited. On the other hand, there is some evidence of unallocated funds. In other words, not all “needs for finance” are met. A more complex question is whether the demand that is remaining unmatched is “qualified” (creditworthy) or not. Lack of access to product markets or to skilled labour does constitute obstacles to SMMEs creditworthiness. Lastly, there is undoubtedly a mismatch situation that is particularly complex due to: bad knowledge on the side of SMME entrepreneurs (e.g. ignorance of application procedures or inability to write a business plan); lack of information and inability to determine credit risk on the side of the lenders (more exactly, determining the credit risk accurately would generate disproportional transaction costs); and communication issues in general. In order to be able to determine the right dosage of various policy interventions to ease the access to finance problem, a determination of the precise types of market failure confronting South Africa is needed. This requires a more differentiated approach.
111 The link suggested here between (macro-economic) level of savings of an economy, and (micro-economic) credit decisions may appear far-stretched. Practically, it is difficult to think of a bank rejecting a loan application because of its too narrow base of deposits. However, experience proves that bankers sometimes subject the granting of a loan to the condition of accessing a family’s savings. More generally, it is known that in times where they have more capital to allocate, banks soften their credit standards and put some pressure on their loan officers to lend more – and vice versa if funds are rare. Of course, this is monitored at high level through the bank's central asset-liability management and the credit committees rather than the individual loan officer.

69
4.3.1 Access to finance: a multiple problem, and the role of creditworthiness
In reviewing access to finance for SMMEs, it should be borne in mind the number and range of institutions providing different kinds of finance for different kinds of investment. Some institutions provide long-term capital, others short-term capital, some equity and others debt. Perhaps even more striking in South Africa is the “fragmentation” between formal and informal capital markets, which operate under very different priorities and constraints and with few linkages between each other. The picture on the demand side is equally multi-faceted. In particular, different categories of firms have:
• Different needs for capital to run their businesses,
• Different resources that they can invest; and
• Different access to external finance. To start with, a firm’s need for capital, in quantity and quality, depends on factors like the firm’s size, its sector, and its age/growth opportunities. For example, a manufacturing firm on average will need substantial long-term capital, while a retail business will mostly need short-term revolving funds to finance its inventory. Young, fast-growing enterprises can generate a considerable need for working capital, while established slow-growth businesses tend to generate sufficient cash-flow to face their needs. A start-up can not afford too much debt and will rather require equity, while better-capitalised enterprises can be better off using debt. Not only can the “needs for capital” vary from one segment to another, but also the firms’ creditworthiness, i.e. the way expressed needs are distributed between “qualified” and “unqualified” demand. Thus, an inequality clearly exists with regard to own resources of the entrepreneurs.112 This is important because most of the time the initial (own) investment of the entrepreneur will be: (a) the only start-up resources; (b) the indicator with which any external financier will gauge its investment risk before providing finance; and (c) even after external finance is granted, probably the cheapest resource for the enterprise. Clearly, in the South African context, there is a fundamental inequality between white and “previously disadvantaged” entrepreneurs in that respect. Lastly, suppliers will more easily provide finance to (and in the first place, entrepreneurs will more skilfully apply for finance in) certain types of firms. In particular, access to finance is easier for older firms than for young ones, and there are also differences between micro- and medium-sized enterprises, between an enterprise emerging from previously disadvantaged backgrounds and an established white business, etc. The picture also varies depending on the type of finance. Although no supporting statistics are available, it is expected that long-term finance is much more difficult to obtain than short-term. Most enterprises need both, but apart from instalment finance for the purchase of equipment, the supply of long-term finance appears to be very limited.
112 Implicitly included in the “own resources” concept are any investments made by family or friends.
70
This means that, depending on the segment under consideration, we may be in the presence of different types of “market failure.” A frequent assumption underlying statements from various representatives of the industry is that micro- and young/emerging enterprises are less creditworthy than medium-sized firms. This belief is generally backed on evidence that the failure rates of the former are higher than that of the latter. However, there is still a lack of evidence on whether this higher mortality is a cause or a consequence of the higher credit rejections, and whether the higher risks of these segments can be made up for an accordingly higher return. In theory, based on the law of diminishing returns, there would be some room to believe that the provision of finance to highly under-capitalised firms would produce incomparably high returns on investment. In summation, there are strong reasons to believe that the demand, creditworthiness and supply functions take very different forms depending on the segments of SMMEs. It will be important for policy to recognise this multiplicity and to adopt a bunch of “target-group focused” approaches rather than one lump-sum approach designed to resolve the finance issue in general. However, there is very little usable knowledge on how the ‘market equilibrium’ looks like for each type of enterprise.
4.3.2 The interest rate issue
To arrive at a full picture of the financial market question, the interest rate issue must be added to the conceptual framework. For this, it is important to understand the double origin, and the double function of the interest rate. There are two factors affecting interest rates: monetary policy determines Repo rates, which have a direct impact on the re-financing costs of banks at the reserve bank, as well as determine the minimum interest rate that banks will charge their borrowers (prime rate); and banks are free to determine their interest margins (spreads) above this prime rate, and the margins will differ for different types of clients. The level of interest rates has two main effects: regulating the supply of finance (an increasing interest rate being a stronger incentive for domestic agents to save, or for foreign investors to invest in the country); and regulating demand (a higher interest rate having, in theory, the effect of reducing the attractiveness of certain investment opportunities, with the result that, for example, SMMEs will waive more expansion projects and thus reduce their demand for capital). Supply and demand is successively reviewed. The ultimate capital suppliers are the individual agents of the economy having some capital surplus (banks and so on being only intermediaries). The theory says that a domestic supplier of capital will waive some projects and expenses and save more if interest rates are higher. Regarding foreign investors, they make investment decisions by comparing real interest rates. For South Africa, which needs to enlarge its capital base, high interest rates may thus have a sensitive impact on borrowing. How powerful that interest rate lever is, though, depends on what economists call the elasticity. In the case of South Africa, it can be argued that the greater savings potential to be mobilised is on the lower income layers of the population. For

71
these “unbanked” South Africans, the major hurdle is not the interest rate but logistical and cultural distance which separates them from banks. Regarding foreign investors, experience shows that their investment decisions are only partly linked with interest rates, while more general economic and political factors seem to be dominant. There is little evidence on how these various factors interact. With regard to the financial intermediaries, in their process of transforming deposits (or financial investments) into risky loans, they have to act as a “risk buffer,” bearing defaults on their own capacity, so as to avoid passing them to their investors. This is mostly true for banks, which have a custodian duty towards depositors. The process through which this ‘equalisation’ happens is the risk premium, similar to an insurance premium, and paid by every risky borrower in addition to the prime rate, in proportion of the risk it represents. Since a term loan is riskier than an overdraft facility, the premium should be higher. There is, thus, a justification for higher interest rates on riskier types of loans, especially the SMME sector and especially on longer-term loans.113 A last factor to consider is the extent of transaction costs. Every loan (or other type of finance) granted implies a certain amount of operational work and therefore costs. In general, the absolute amount of costs is about the same for a very small or micro-loan as for a small loan. To remain profitable, financial institutions need to have some income to cover these transaction costs, and will tend to increase interest rates accordingly. Hence the interest premium charged on small loans will rise to exorbitant levels. More than the risk of default, this seems to be the major reason why micro- and very small loans are often charged very high rates. Undoubtedly, there is little transparency on the types of transaction costs that are being charged to SMMEs and there probably is a potential for more efficient operations. However, the business remains costly, and unless financial institutions are offered another way of covering their transaction costs114, there is little hope that they will continue to lend to SMMEs if they are obliged to reduce their interest margins. To summarise, on the supply side, it is not clear what impact the level of interest rates itself has on the capital base and thus the financing capacity. However, the margins paid to financial intermediaries have an important function to cover default risks and transaction costs, which are vital conditions for the involvement of financial institutions in the sector. On the demand side, the theory assumes that SMMEs’ demand is “elastic” to interest rates, i.e. that an increase in rates triggers a reduction of demand. Some authors suggest, though, that this is not always the case, and there is some striking evidence of a fairly inelastic demand in South Africa. The possible causes of this phenomenon are first considered. Normally, an SMME planning to carry out a business project will only do so if the expected income is higher than the cost of the factors (to simplify, labour and capital) needed for that project. The more expensive the capital, the less likely will the project’s income suffice. This being
113 The establishment of a loan guarantee scheme, of course, is just another form of the same phenomenon, where the ’risk premium’ is paid explicitly as a guarantee premium. 114 If fees were used instead of an additional interest rate premium, the effect for the borrower would be the same, atlhough separating fees from interest payments would increase transparency. Alternatively, one could conceive a “pooled” system where transaction costs are not paid by the borrower but by some non-profit agency, provided that this is only a temporary support. In Chile, an interesting model has been implemented to subsidise financial intermediaries’ first dealings with a firm: the level of government support decreases with the number of contacts between the bank and the firm, e.g. 70% subsidy for first visit, 50% for the next, then 30%, then none.

72
said, there can be two reasons why, in spite of the expensiveness of capital, an entrepreneur does not waive his project: either the income opportunities are so good that he will still make a profit, or he does not realise that by accepting these high interest rates, he will make losses.115 To use the concept of “qualified demand” explored above, we would say that the first situation is qualified demand while the second is unqualified (not creditworthy) demand. Given the limited business skills of most “emerging” entrepreneurs, there is a good case to maintain that the second situation applies – in other words, the effective demand does react to the interest rates, but there always remains a ‘mass of unqualified demand’ that just remains unchanged116 regardless of the price conditions.117 However, again, nothing proves that the first situation does not apply in a number of settings. Additional finance may well enable a considerable income boost for under-capitalised SMMEs, far beyond the actual cost of finance.118 What do these assumptions mean in terms of interest rate policy? If the inelastic demand is still ‘qualified’ demand (which remains profitable in spite of the higher costs), then there is probably some room for higher interest rates as far as needed. If the opposite is true, then raising the interest rates may just have the effect of enlarging the ranks of the non-creditworthy demand with no improvement with regard to access. 4.3.3 Looking for solutions
This review has so far identified the following problems to be addressed:
• Insufficient entrepreneurship;
• Lack of good business opportunities, for example due to a lack of product markets;
• Lack of business skills among the entrepreneurs;
• Narrow capital base of an economy, e.g. low savings rates;
• Information problems;
• Fragmentation of the market;
115 A third reason could be that, although he knows very well that he cannot afford these interest rates, he has nothing to lose in case of default because the losses ultimately are for the lender. 116 In fact, the ’unqualified demand’ may even grow with increasing interest rates, as some SMMEs that would have been creditworthy under lower interest rates are shifted into the pool of the uncreditworthy borrowers. 117 Note that this inelastic ’unqualified demand’ is not necessarily irrational. It has to do with the “must-have“ nature of finance for the poorest communities, and the lack of alternatives available in a survivalist environment. 118 To illustrate this counter-intuitive proposition, let us take the extreme case of a street vendor with no cash resources. He may be buying his merchandise in a place 15km away from where he sells it. Let us assume he spends two days a week travelling by train, taxi and/or by foot to his supplier and back to his place, which means that he has only four days a week to sell and earn income. Now imagine this hawker would have some cash to pay a deposit to a transport micro-enterprise that would take care of the transport for him on a bakkie. Because of the greater capacity of the bakkie compared to the hawker's space in a taxi, the entrepreneur will be able to buy a sufficient stock of merchandise for the week instead of for two days, so he may work five or six days a week instead of four. He will also save transport costs, since he will pay for one travel per week instead of two. If there is a sufficient market for his products and if his margin is correct, he will strongly enhance his efficiency and profitability, and the financial costs of getting some money to pay a deposit will not be a deterrent.
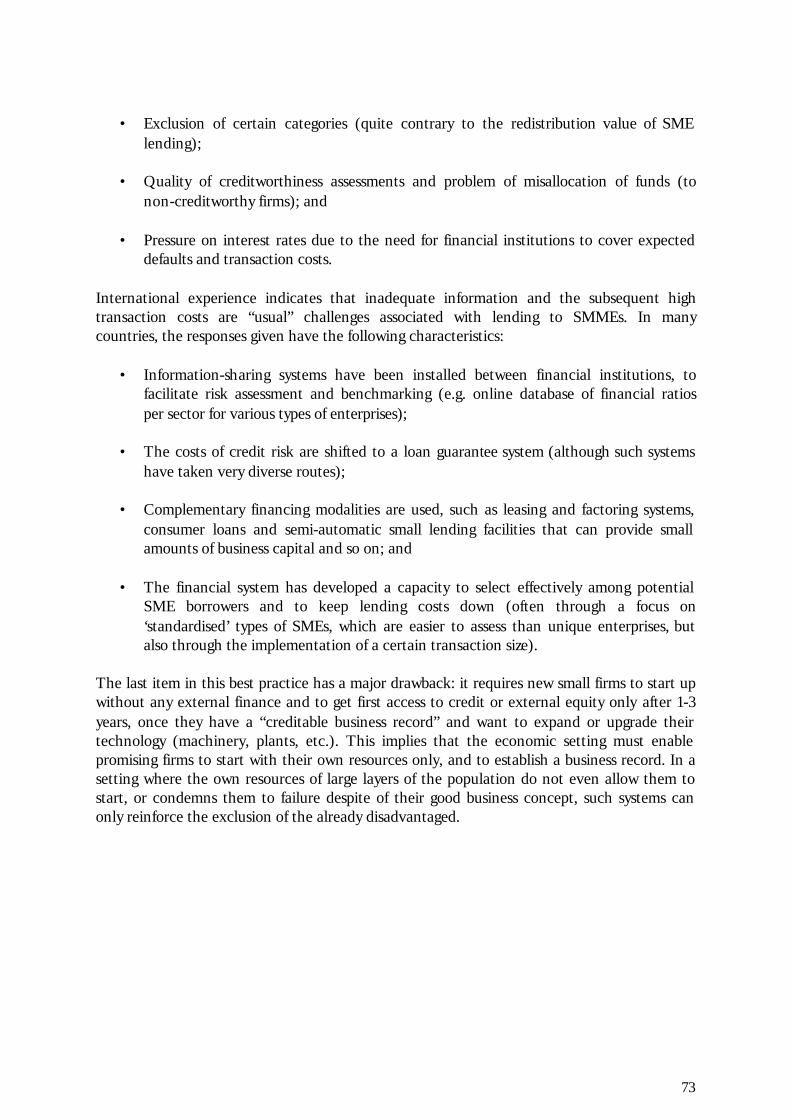
73
• Exclusion of certain categories (quite contrary to the redistribution value of SME
lending);
• Quality of creditworthiness assessments and problem of misallocation of funds (to non-creditworthy firms); and
• Pressure on interest rates due to the need for financial institutions to cover expected
defaults and transaction costs. International experience indicates that inadequate information and the subsequent high transaction costs are “usual” challenges associated with lending to SMMEs. In many countries, the responses given have the following characteristics:
• Information-sharing systems have been installed between financial institutions, to facilitate risk assessment and benchmarking (e.g. online database of financial ratios per sector for various types of enterprises);
• The costs of credit risk are shifted to a loan guarantee system (although such systems
have taken very diverse routes);
• Complementary financing modalities are used, such as leasing and factoring systems, consumer loans and semi-automatic small lending facilities that can provide small amounts of business capital and so on; and
• The financial system has developed a capacity to select effectively among potential
SME borrowers and to keep lending costs down (often through a focus on ‘standardised’ types of SMEs, which are easier to assess than unique enterprises, but also through the implementation of a certain transaction size).
The last item in this best practice has a major drawback: it requires new small firms to start up without any external finance and to get first access to credit or external equity only after 1-3 years, once they have a “creditable business record” and want to expand or upgrade their technology (machinery, plants, etc.). This implies that the economic setting must enable promising firms to start with their own resources only, and to establish a business record. In a setting where the own resources of large layers of the population do not even allow them to start, or condemns them to failure despite of their good business concept, such systems can only reinforce the exclusion of the already disadvantaged.

74
4.4 ACCESS TO FINANCE IN SOUTH AFRICA
The common thread running through the findings of micro-enterprise surveys in South Africa is that inaccessibility to finance is the major external constraint.119 Surveys in two South African townships in 1990 revealed that working capital is the most sought-after type of finance at start-up.120 Likewise, the study by Riley (1993) noted the lack of working capital as the most pressing constraint identified by proprietors, and especially by micro-enterprise manufacturers, as they do not receive supplier credits or buyer advances. Other surveys, though, often conducted among established enterprises, reveal that entrepreneurs do not suffer from a lack of finance. Among institutional obstacles, crime, tax and labour regulations, corruption and policy instability are found to be of more importance than financing.121 Levy (1996) arrived at similar conclusions.
4.4.1 Evidence from the supply side: The South African banking sector
South African banks are typically accused of either lending only to “older,” “larger” and/or “white” companies, or requiring collateral that is unaffordable to the small businessperson, particularly PDI entrepreneurs.122 For the sake of brevity, only two studies shall be mentioned here. Levy (1996) has explored, through the questioning of entrepreneurs, the controversial praxis of South African banks with regard to age, size and collateral discrimination. He found that even small and new firms have access to South Africa’s banking system123 and, as far as collaterals are concerned, South Africa’s bank system is unusually flexible relative to developing countries.124 However, the average values above tend to conceal a much more gloomy picture among ‘African businesses,’ which represent only 7% of Levy’s sample and all complained about prejudices of banks against them. More recent evidence suggests that banks have tremendously extended their engagement to SMMEs since 1996. It is difficult to say it with certitude, though, because the major banks do not disclose many statistics about their SMME books.125 Therefore, only “informal” sources are available, which are not all based on the same SMME definition. Table 4.9 is therefore only an indication of estimated orders of magnitude.
119 Liedholm and McPherson, 1991; Riley, 1993; TaskGro, 1993; Falk, 1994. 120 Liedholm and McPherson, 1991. 121 Ahwireng-Obeng and Piarey 1999. 122 Levy, 1996; Ntsika, 1999b. 123 42% of the companies in his sample received their first loan within their first year of activity, and 56% had less than 10 employees at the date when they received their first loan. 124 In 56% of his sample, banks did accept collaterals other than immovable property to secure their loans, such as equipment, debtor’s books or insurance policies. 125 Apparently, individual institutions do not even have statistical information for their own internal purposes, see discussion with Standard Bank officer, July 2001. Even though the Banking Council of South Africa is engaged on improving the disclosure on bank accounts from now on, retrieving the corresponding statistical information for past years and decades seem almost impossible.
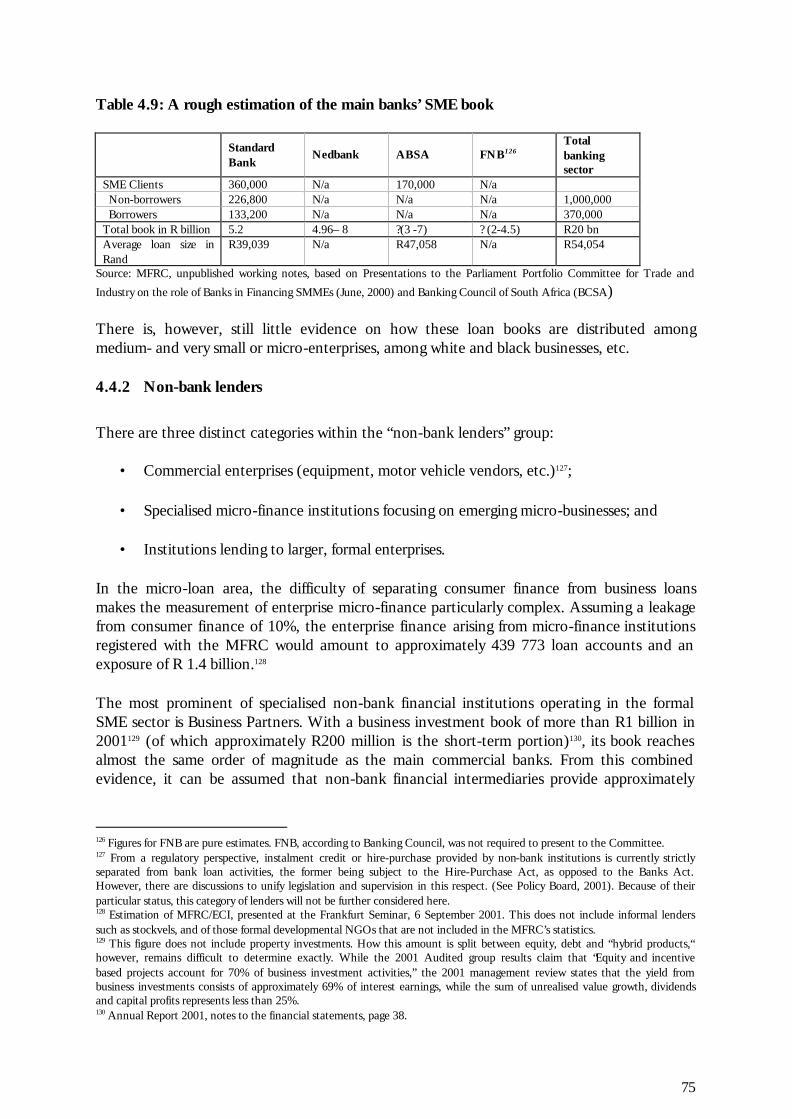
75
Table 4.9: A rough estimation of the main banks’ SME book
Standard Bank
Nedbank ABSA FNB126 Total banking sector
SME Clients 360,000 N/a 170,000 N/a Non-borrowers 226,800 N/a N/a N/a 1,000,000 Borrowers 133,200 N/a N/a N/a 370,000 Total book in R billion 5.2 4.96– 8 ?(3 -7) ? (2-4.5) R20 bn Average loan size in Rand
R39,039 N/a R47,058 N/a R54,054
Source: MFRC, unpublished working notes, based on Presentations to the Parliament Portfolio Committee for Trade and
Industry on the role of Banks in Financing SMMEs (June, 2000) and Banking Council of South Africa (BCSA) There is, however, still little evidence on how these loan books are distributed among medium- and very small or micro-enterprises, among white and black businesses, etc. 4.4.2 Non-bank lenders
There are three distinct categories within the “non-bank lenders” group:
• Commercial enterprises (equipment, motor vehicle vendors, etc.)127;
• Specialised micro-finance institutions focusing on emerging micro-businesses; and
• Institutions lending to larger, formal enterprises. In the micro-loan area, the difficulty of separating consumer finance from business loans makes the measurement of enterprise micro-finance particularly complex. Assuming a leakage from consumer finance of 10%, the enterprise finance arising from micro-finance institutions registered with the MFRC would amount to approximately 439 773 loan accounts and an exposure of R 1.4 billion.128 The most prominent of specialised non-bank financial institutions operating in the formal SME sector is Business Partners. With a business investment book of more than R1 billion in 2001129 (of which approximately R200 million is the short-term portion)130, its book reaches almost the same order of magnitude as the main commercial banks. From this combined evidence, it can be assumed that non-bank financial intermediaries provide approximately
126 Figures for FNB are pure estimates. FNB, according to Banking Council, was not required to present to the Committee. 127 From a regulatory perspective, instalment credit or hire-purchase provided by non-bank institutions is currently strictly separated from bank loan activities, the former being subject to the Hire-Purchase Act, as opposed to the Banks Act. However, there are discussions to unify legislation and supervision in this respect. (See Policy Board, 2001). Because of their particular status, this category of lenders will not be further considered here. 128 Estimation of MFRC/ECI, presented at the Frankfurt Seminar, 6 September 2001. This does not include informal lenders such as stockvels, and of those formal developmental NGOs that are not included in the MFRC’s statistics. 129 This figure does not include property investments. How this amount is split between equity, debt and “hybrid products,“ however, remains difficult to determine exactly. While the 2001 Audited group results claim that “Equity and incentive based projects account for 70% of business investment activities,” the 2001 management review states that the yield from business investments consists of approximately 69% of interest earnings, while the sum of unrealised value growth, dividends and capital profits represents less than 25%. 130 Annual Report 2001, notes to the financial statements, page 38.
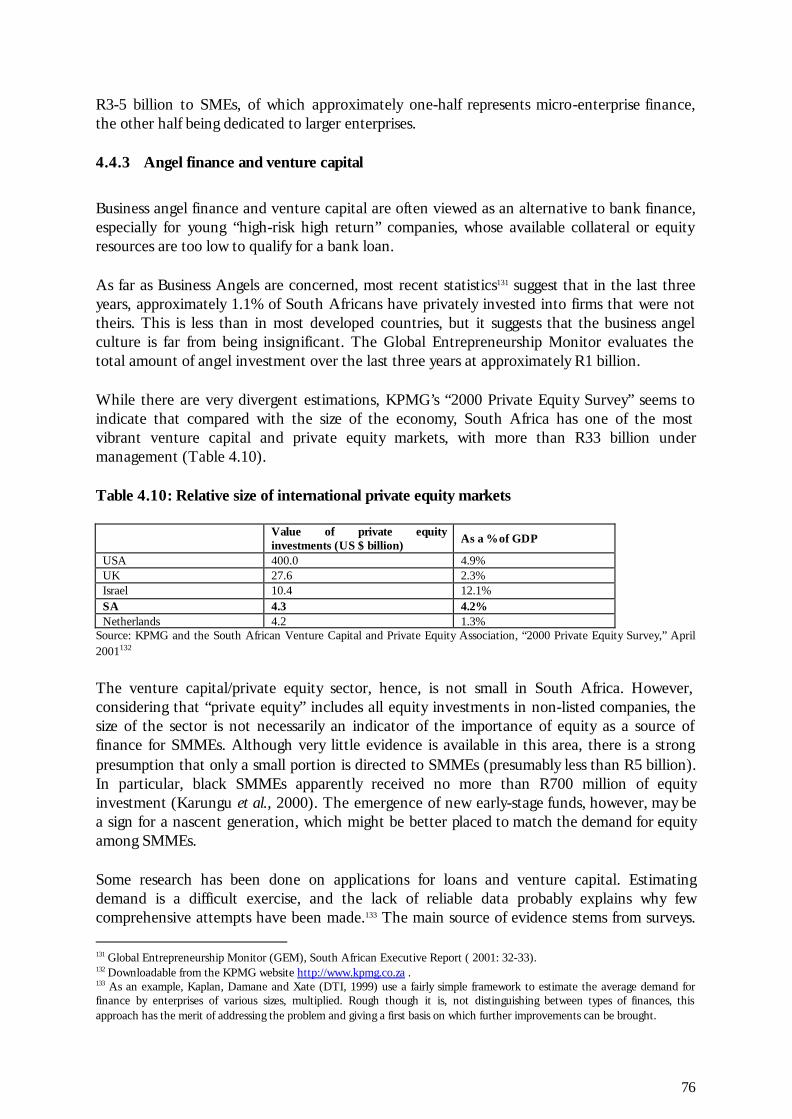
76
R3-5 billion to SMEs, of which approximately one-half represents micro-enterprise finance, the other half being dedicated to larger enterprises. 4.4.3 Angel finance and venture capital
Business angel finance and venture capital are often viewed as an alternative to bank finance, especially for young “high-risk high return” companies, whose available collateral or equity resources are too low to qualify for a bank loan. As far as Business Angels are concerned, most recent statistics131 suggest that in the last three years, approximately 1.1% of South Africans have privately invested into firms that were not theirs. This is less than in most developed countries, but it suggests that the business angel culture is far from being insignificant. The Global Entrepreneurship Monitor evaluates the total amount of angel investment over the last three years at approximately R1 billion. While there are very divergent estimations, KPMG’s “2000 Private Equity Survey” seems to indicate that compared with the size of the economy, South Africa has one of the most vibrant venture capital and private equity markets, with more than R33 billion under management (Table 4.10). Table 4.10: Relative size of international private equity markets
Value of private equity investments (US $ billion) As a % of GDP
USA 400.0 4.9% UK 27.6 2.3% Israel 10.4 12.1% SA 4.3 4.2% Netherlands 4.2 1.3%
Source: KPMG and the South African Venture Capital and Private Equity Association, “2000 Private Equity Survey,” April 2001132
The venture capital/private equity sector, hence, is not small in South Africa. However, considering that “private equity” includes all equity investments in non-listed companies, the size of the sector is not necessarily an indicator of the importance of equity as a source of finance for SMMEs. Although very little evidence is available in this area, there is a strong presumption that only a small portion is directed to SMMEs (presumably less than R5 billion). In particular, black SMMEs apparently received no more than R700 million of equity investment (Karungu et al., 2000). The emergence of new early-stage funds, however, may be a sign for a nascent generation, which might be better placed to match the demand for equity among SMMEs. Some research has been done on applications for loans and venture capital. Estimating demand is a difficult exercise, and the lack of reliable data probably explains why few comprehensive attempts have been made.133 The main source of evidence stems from surveys.
131 Global Entrepreneurship Monitor (GEM), South African Executive Report ( 2001: 32-33). 132 Downloadable from the KPMG website http://www.kpmg.co.za . 133 As an example, Kaplan, Damane and Xate (DTI, 1999) use a fairly simple framework to estimate the average demand for finance by enterprises of various sizes, multiplied. Rough though it is, not distinguishing between types of finances, this approach has the merit of addressing the problem and giving a first basis on which further improvements can be brought.

77
In this regard, two interesting studies can be mentioned, again with very different results pointing at a need to derive conclusions through broader and statistically more focused investigations. The first interesting insights are put forward by Levy (1996). In his interviews of 134 small South African companies, he found that for most of them, access to finance was not perceived as a major obstacle. Out of a list of institutional obstacles, even companies of less than five years of age in average considered “access to finance” a moderate constraint. Further investigations with debt-free enterprises revealed that the reason for their absence of loan was more often the lack of a desire to borrow, or the high interest rates, rather than the collateral requirements or other access problems. KNC and Associates134 have surveyed 213 black businesses, most of them being very small to small enterprises with a focus on the services sector. Firms were asked whether they had applied for venture capital funding and if so, whether they were successful. The results point at a lot of unsatisfied demand in the very low layers of the size range (Table 4.11). Table 4.11: Firms’ applications for venture capital by firm size Size of firms (total assets) (R million
Number of firms
Applied for venture capital funding
Received venture capital funding
Number In % of firms surveyed
Number In % of firms which applied
less than 0.5 m 120 18 15% 1 5.5% 0.5-2 million 38 7 18% 1 14% 2-5 million 9 2 22% 1 (50%), but not
significant Above 5 m 11 7 64% 3 43% Source: Karungu et al. (2000)
4.4.4 Empirical evidence from the 1999 World Bank surveys
This section presents and discusses very comprehensive results from the 1999 World Bank survey, trying to interpret results and analyse correlations between them. The following issues are addressed:
• Investment behaviour as an evidence of a financing problem;
• Sources of capital and in particular, the reasons for using or not using formal (bank) loans; and
• The reactions of various classes of enterprises to interest rates.
134 Karungu, Dr. P., T. Nyandoro and Dr. M. Stettler, Venture Capital as a Source of Economic Empowerment in South Africa, March 2000.
78
4.4.4.1 SMMEs’ low levels of investment as a symptom of a financing problem
Capital investments in new machinery and equipment were undertaken by 60% of the SMMEs sampled by the World Bank, in both 1998 and 1999. Nevertheless, when accounting for a 10% cut-off for depreciation, only 38% of all SMMEs reported net investment increases in 1998, and 32% in 1999. Figure 4.9 presents the distribution of these ‘investment expanding’ firms by background, industries, and size classes. Larger investment rates were recorded in the service sectors as compared to the manufacturing industries. The IT sector recorded investment rates in excess of 65%, for example. Black-owned SMMEs were more likely to report net investment than their white-run counterparts. Nevertheless, since no differentiation by age was made, this large percentage could reflect black SMMEs’ investment in start-up capital rather than expansion. The figure excludes the 45-52% range of the sample SMMEs that made no investments and the 17% that invested less than 10% of their fixed capital levels. Figure 4.9: Profile of the “investment expanding” SMMEs
Source: Chandra et al. (2001)135
135 From a policy perspective, it is interesting to know whether the ’investment expanding’ SMMEs were also a source of new employment opportunities. When considering only those SMMEs whose employment grew by at least 5% annually, the share of SMMEs that ’investment expanded’ falls to 30% for 1998 and 26% for 1999. Only 13% of the sample SMMEs grew both in terms of employment and assets in both years under investigation. About 23% of the sample SMMEs increased the number of their employees by more than 5% in 1998, and 30% did so in 1999.
0 1 0 2 0 3 0 4 0 5 0 6 0 7 0 8 0
Size 1 Size 2 Size 3
All f i rms
Clothing/garments Metal workers
Furniture Prepared food/beverage
Tour ism C onstruct ion
Retail IT
Black Asian+Coloured
White Foreign
Percentage of f i rms
1999 1998

79
The SMME survey asked firms that had planned – but not undertaken – new investments for their reasons. While 39% of the sample SMMEs considered new investments in 1998, one-third did not realise their plans. The main reasons provided not implementing planned investment in 1998 are shown in Table 4.12. Table 4.12: Reasons for firms not undertaking planned investment in 1998, by percentage
Size 1 Size 2 Size 3 Black Asian/ Colored
White
Lack of access to capital 26 26 14 59 32 16 Interest rates were too high 7 11 16 6 7 10 Insufficient demand 28 28 37 16 32 30 No need/desire 18 16 16 12 11 21 Insufficient business experience 14 12 2 6 12 10 Business costs too high 1 1 2 0 2 1 High labor costs 1 1 3 0 0 2 Other 5 6 9 0 4 9
Source: Chandra et al. (2001)
On average, poor business conditions pre-empt the need for capital investment and seem to be a far more critical explanation than limited access to capital markets or high costs of credit. Nevertheless, limited access to capital markets played a very significant role, and especially prevented micro and black-run SMMEs from expanding. In addition, there are good reasons to believe that these results understate the role of financing constraints in low investment levels: For the nation as a whole, access to finance is most likely lower than in the Johannesburg metropolitan area, which is known to be better served by financial institutions than the country average. Moreover, the main bias is that all surveyed firms were registered VAT vendors, and this is atypical for the majority of micro and many very small enterprises. The above data indicates that even formal black-run and micro-enterprises are more constrained than others by lack of access to formal credit. One may therefore assume that informal black micro-entrepreneurs have even less access to formal credit. Taking these arguments together, the above figures probably overstate the access by South African SMMEs to formal sector credit, with the overstatement being greater the smaller the firm size.
4.4.5 Sources of capital
SMMEs obtain start-up and working capital from various sources. The data in Figure 4.10 disclose that most SMME entrepreneurs rely for their start-up capital on private savings. The preference for cheaper non-bank credit is partly conditioned by the high costs of formal credit during the period under investigation, which was marked by relatively high interest rates. Accordingly, family savings are used by 29% of firms (19% use this source for all their financing); individual savings are used by 49% of firms (32% use them for all financing); and retained earnings from a previous business are used by 10% of firms (6% use them for all financing).

80
In 1999, only 24% of the entrepreneurs borrowed from local banks to finance their new business venture (7% use them for all of their financing).136 All other sources of start-up capital (church and community groups, retrenchment packages, and government agencies) play a minor role and finance less than 5% of all firms. Figure 4.10: Sources of start up capital, 1999
Source: Chandra et al. (2001)137
Micro-enterprises present an atypical pattern in the sense that family savings and retrenchment packages are the main sources of finance, community groups provide the start-up capital for 12% of the micro-enterprises, and no more than 15% use bank capital. Post-apartheid firms, by contrast, are distinct from micro or any other enterprises. Their reliance on family savings is significant, and about 3% benefited from small business promotion agencies by receiving as much as 100% of start-up capital. Again, generalising these results to informal micro-enterprises should take into account the fact that unlike VAT-registered firms, non-registered companies have almost no access to formal finance. It must also be said at this stage that they are the very entrepreneurs whose individual resources are a dramatic constraint to growth. With regard to working capital, the majority of the SMMEs in Greater Johannesburg rely – once again – on private savings. Indeed, over 85% of the sample SMMEs use capital from retained earnings and 23% from cheaper loans extended by partner or parent establishments. Smaller SMMEs rely more on family and personal savings for their capital requirements. Bank credit is used by 5% of the sample SMMEs to cover operational costs of the enterprise.
136 Rogerson (1999a) surveyed 135 SMMEs in inner city Johannesburg and found that nearly half preferred to remain independent of small business support structures, with high interest rates cited as a prime reason. 137 The percentages in the legend indicate the extent to which various sources of finance were used for starting up.
0 10 20 30 40 50 60
Family savings Individual savings
Retained earnings fr.prev.business
Loan from a local bank
Loan fr. parent comp.
Loan from foreign partne
r Small business agency
Govt credit/equip. supplier Retrenchment package
Church/other
Percentage of firms 1 - 49% 50 - 99 % 100%
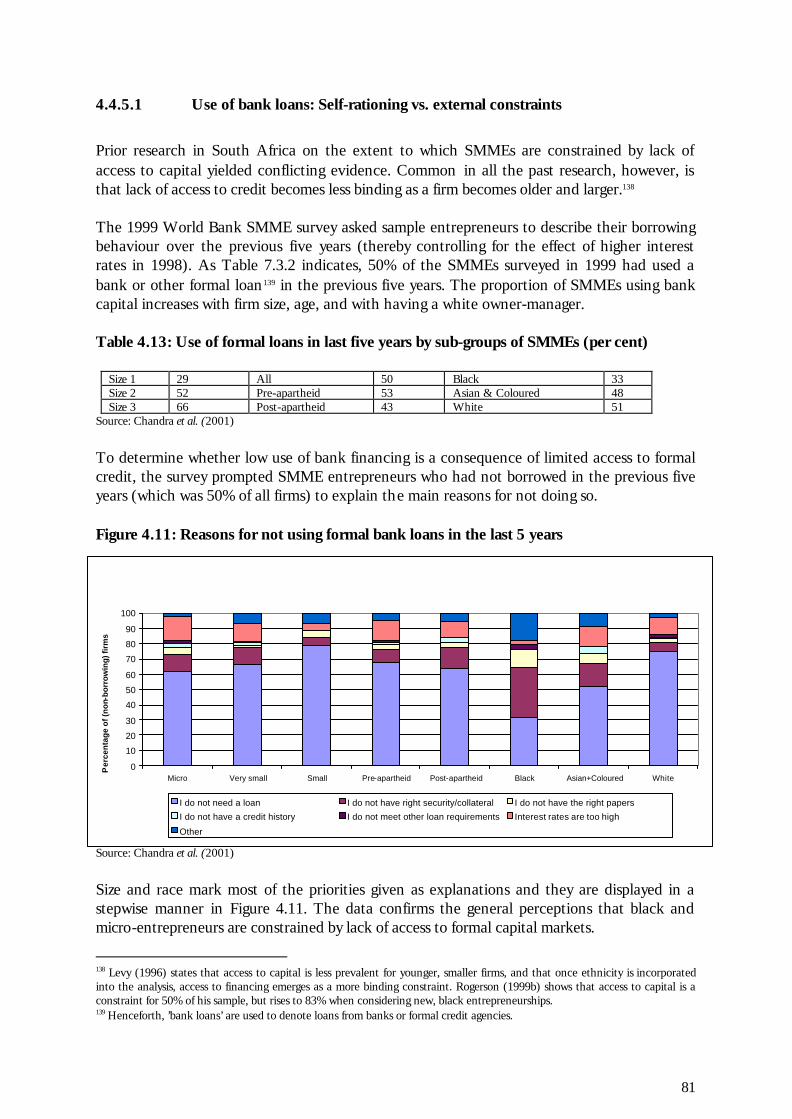
81
4.4.5.1 Use of bank loans: Self-rationing vs. external constraints
Prior research in South Africa on the extent to which SMMEs are constrained by lack of access to capital yielded conflicting evidence. Common in all the past research, however, is that lack of access to credit becomes less binding as a firm becomes older and larger.138 The 1999 World Bank SMME survey asked sample entrepreneurs to describe their borrowing behaviour over the previous five years (thereby controlling for the effect of higher interest rates in 1998). As Table 7.3.2 indicates, 50% of the SMMEs surveyed in 1999 had used a bank or other formal loan139 in the previous five years. The proportion of SMMEs using bank capital increases with firm size, age, and with having a white owner-manager. Table 4.13: Use of formal loans in last five years by sub-groups of SMMEs (per cent)
Size 1 29 All 50 Black 33 Size 2 52 Pre-apartheid 53 Asian & Coloured 48 Size 3 66 Post-apartheid 43 White 51
Source: Chandra et al. (2001)
To determine whether low use of bank financing is a consequence of limited access to formal credit, the survey prompted SMME entrepreneurs who had not borrowed in the previous five years (which was 50% of all firms) to explain the main reasons for not doing so. Figure 4.11: Reasons for not using formal bank loans in the last 5 years
Source: Chandra et al. (2001)
Size and race mark most of the priorities given as explanations and they are displayed in a stepwise manner in Figure 4.11. The data confirms the general perceptions that black and micro-entrepreneurs are constrained by lack of access to formal capital markets.
138 Levy (1996) states that access to capital is less prevalent for younger, smaller firms, and that once ethnicity is incorporated into the analysis, access to financing emerges as a more binding constraint. Rogerson (1999b) shows that access to capital is a constraint for 50% of his sample, but rises to 83% when considering new, black entrepreneurships. 139 Henceforth, ’bank loans’ are used to denote loans from banks or formal credit agencies.
0 10 20 30 40 50 60 70 80 90
100
Micro Very small Small Pre-apartheid Post-apartheid Black Asian+Coloured White Per
cent
age
of (n
on-b
orro
win
g) fi
rms
I do not need a loan I do not have right security/collateral I do not have the right papers I do not have a credit history I do not meet other loan requirements Interest rates are too high Other
82
The three dominant answers across all categories make for interesting reading. The main reason, cited by more than 60% of non-borrowing firms (but only 30% of black firms and 50% of Indian and coloured firms) was that they ‘did not need a loan.’ This is a surprisingly high result, which suggests that, at least at the time of the survey, South Africa’s formal SMMEs are (were) not so much constrained by financing problems, but rather by a lack of investment opportunities or a lack of entrepreneurial spirit. However, three considerations must be kept in mind when interpreting these results:
• They may have been influenced by the slow economic growth during the period 1994-1999;
• Although it is cited as the main reason, the fact of “not needing a loan” is strongly
negatively correlated with the fact of “not using a loan” (correlation factor of –0.635). In other words, the highest proportions of firms “not needing a loan” occur in the categories that have the highest usage rate of bank loans (that is, white and small enterprises)140; and
• The informal economy is likely to follow the pattern of black registered enterprises, so
that the extent of “self-rationing” among the whole SMME population is likely to be significantly lower.
The second more prominent reason for not borrowing from banks, provided by almost 10% of non-borrowing firms, was the lack of security/collateral. This is a real (institutional) access problem. Not surprisingly, this reason was much more significant for black firms, as were other access constraints (‘not having the right papers’ and ‘not meeting other loan requirements’). In total, perceived access constraints for black entrepreneurs amounted to more than 45%. This brings to the fore the fact that there exists a strong correlation between being “credit constrained” and “not using a loan” (correlation factor of +0.66). In other words, the explanatory value for “credit constraints” for the low use of formal loans is much stronger than the factor of need. It would be interesting to question the extent to which the credit constraint is explained by “creditworthiness” issues. Again, extending this to the entire SMME population (including informal firms), the role of this access constraint is likely to be much more significant than in the overall sample. The third reason was related to the level of interest rates. It is significant, though, that in the period of very high interest rates experienced in 1997-1998, the proportion of entrepreneurs discouraged to borrow amounted to no more than 10%. This is further discussed below.
4.4.5.2 The cost of credit and effects of high interest rate on SMMEs
Evidence on the interest rate elasticity is obtained from Levy (1996), who found that between 40-60% of firms complained about the cost of credit. This suggests a fairly high sensitivity to interest rates among the established firms, which were the majority of his sample. Among micro- and informal enterprises however, the high interest rates paid to informal lenders 140 This seems to demonstrate the phenomenon, often criticised by public opinion, that “those who get most loans are those who need them least.”

83
suggests that the need for liquidity by the excluded overrides price considerations (see Hawkins, 2001). Obviously, this does not enable us to get a comprehensive understanding of where the demand comes from, with what amounts and what quality. Even if we had a more complete picture of the demand behaviour of enterprises across the segments, the next challenge would still be to qualify that demand according to creditworthiness. This area remains almost completely untouched by researchers up to now. During the period of observation, South Africa’s Reserve Bank raised interest rates to a record-high to arrest capital flight in the wake of the exchange rate devaluations that occurred. The average nominal interest rate SMMEs paid on short-term liabilities was around 23%, and about 22% on long-term liabilities. What this means for the financing of SMMEs depends on the elasticity of demand to changes in interest rates, as discussed above. Empirically, two effects of the interest rate are noteworthy:
• Ex ante effect, i.e. discouraging effect on would-be borrowers; and
• Ex post effect, liquidity effect on current borrowers. The relationship between the two effects is also particularly interesting.
The ex ante effect is described by the height of the pink portion in Figure 4.11. Quite strikingly, it shows a very low sensitivity to interest rates among small enterprises (as opposed to micro- and very small), and among black enterprises. Less than 5% of these firms mentioned the level of interest rates as a reason for not borrowing. Intuitively, this apparent inelasticity cannot be explained by the same factors in the two cases. In the case of black firms, the insensitivity can be explained by the desperate need for capital, poorness of alternatives, or by a lack of economic understanding. On the contrary, for small enterprises, the main explanation for the low value of the “interest rate” factor is probably the prevalence of the factor “no need for capital” as a reason for not borrowing. The ex post effect of high interest rates is shown in Figure 4.12.

84
Figure 4.12: Effects of the 1998-interest rate increase on SMMEs, 1999
Source: Chandra et al. (2001)
The responses given by the firms can be grouped into three categories: • Not a problem For 26% of the sample SMMEs, higher interest rates had no impact on their operations because they were not repaying loans or planning new investment. • Constraint to growth About 30% of sample firms suggested that high interest rates acted as a constraint for their growth plans, either because they could not undertake expansion projects, or because it became more difficult to obtain new debt. The latter effects were particularly exacerbated in black SMMEs and small SMEs. • Immediate liquidity problems On average, around 15% of firms noted that they got into liquidity problems (lack of working capital and/or inability to repay loans) as a result of high interest rates. This was particularly true for black enterprises (23%) and, again, small enterprises (19%). 70% of the SMME entrepreneurs who were repaying bank loans at the time of the survey noted that interest rates had a negative effect on their business. The high negative correlation (–0.78) between the “discouragement effect” from Figure 4.12 and the “liquidity effect” of high interest rates, shown above, is particularly interesting. It suggests that firms that are the least inclined to incorporate the level of interest rates in their decision to apply for a loan, are those which, if granted a loan, get into the most liquidity trouble when interest rates increase. This could support the hypothesis that the demand for finance at very high interest rates, coming from fragile firms, is not a creditworthy demand; in
0 20 40 60 80
100 120
Micro Very small Small Pre-apartheid Post-apartheid Black Asian+Coloured White
Perc
enta
ge o
f fi
rms
Not a problem Made it difficult to get new debt Could not repay loans Not enough working capital Could not undertake/reduced new expansion Other

85
other words, it could be more appropriate to reject a loan application rather than granting it at a very high rate. To conclude, these results seem to be an indication that borrowers need to be protected against high interest rates, since these rates increase the risk of default instead of discouraging entrepreneurs from borrowing. This does not necessarily mean, though, that the interest rates must be more thoroughly regulated. An alternative could be to improve economic awareness through training and more accurate business planning. Since cost of capital is cited as only one of the necessary conditions for new investments and growth, lower interest rates will not automatically lead to an upsurge of SMMEs. The empirical evidence on SMMEs and financial markets is insufficient to separate the constraint of access to credit from cost of credit. The World Bank SMME Survey aimed to fill this void, but excluded informal micro-enterprises, which are, in all probability, those SMMEs most likely to be constrained by access to formal capital markets. Moreover, the survey was conducted at a time when interest rates were high. A greater share of SMMEs might have cited access to credit as a constraint if the survey had been undertaken earlier. Finally, the relatively depressed macroeconomic conditions would be expected to curtail investment desires and with it the judgment that lack of access was a problem. It is thus essential to carry out additional surveys for several sub-categories by size as well as to make a distinction in terms of the age of firm, race of owner, region and perhaps other variables.
4.5 THE DEMAND SIDE AND PRODUCT MARKETS: THE GROWTH POTENTIAL OF SMMES IN THE CONTEXT OF LOW AGGREGATE DEMAND
Access to product markets is a critical component of a competitive economy. Entry to product markets naturally depends on the extent to which both regulatory and structural barriers are not biased against potential clients, and in particular small firms, in favour of incumbent or monopolistic firms. The government has an important role to play in ensuring, via a range of policy instruments (discussed herein) that those firms that are able to compete do not encounter disadvantages by sectors that control distributional chains, or entry barriers are particularly high due to collusion behaviour. However, when looking at the demand side, the two factors are distinguished. To begin with, it is generally argued that SMMEs show little signs of growth when aggregate demand is shrinking. Overall macroeconomic growth in which the SMME sector’s market share grows at the same rate as the macro-economy as a whole is usually the main context in which the demand for SMMEs rises. Likewise, it is unusual to see the SMME economy thriving when the economy as a whole is doing badly. This is very important for policy makers to bear in mind. The success of SMMEs is integrally linked to what happens in the broader macro-economy. 4.5.1 Direct interventions in product markets
Besides stimulating domestic demand and encouraging exports, there is not much that the government can directly do in order to assist SMMEs. However, if demand is a constraint

86
because of concentration in product markets, there is a great deal that government can do directly to ensure better access and demand for SMMEs. This section discusses a number of policy options for product market interventions. The effectiveness of policy interventions in this area is, however, not obvious. SMMEs are specifically sensitive to aggregate demand in the economy. They are, however, not necessarily more constrained by low aggregate demand than large firms. SMMEs of all size classes and legal statuses identify falling demand levels and/or lack of marketing expertise as their strongest constraints. In an attempt to offset these constraints, policy makers need to distinguish between steps, which will have the effect of broadening the total demand for the output of the SMME sector, and steps that will simply help some SMME firms take away market share from others. Marketing efforts by both SMMEs and support institutions that shuffle market shares of large firms to SMMEs are of no overall value, unless they lower total costs by shifting production from less efficient to more efficient firms.
However, within a slow growing or stagnant economy, there is scope for SMMEs to grow if they succeed in snatching market share from other sectors such as large firms. SMMEs can gain market share from the large-scale sector either through the changing composition of demand in a way that favours SMEs, for example through the increased share of services in total manufacturing, or by more rapid improvements in competitiveness, presumably through cost reduction. It is incumbent upon the government to ensure that market shares, whether among firms or broadly defined sectors, will mainly respond to a reduction of real costs and not marketing finesse, predatory use of market power, or other things that are not reflected in consumer satisfaction. If there is evidence to suggest that the SMME sector enjoys advantages over the large-scale sector in its employment and distributional impacts (such that the multipliers of SMMEs are higher than those of large firms) then there are good reasons or public policy to ensure that:
• SMMEs do not lose market share to the large scale sector except through genuinely lower costs by the latter; and
• Competition amongst SMMEs is limited in such a way that real resources are not
wasted. Public policy can facilitate this in various ways. Firstly, an active competition policy will ensure level playing fields. At another level, export assistance and/or indirect interventions such as procurement policy could also be significant. Other means of ensuring SMME advantages over large firms include assistance with marketing expertise. 4.5.1.1 Concentrated supply and product markets: Competition policy
It has been argued that more favourable macro-economic conditions and effective SMME support measures alone are unlikely to unleash the potential of the SMME sector if high concentration in supply markets continues to hamper the competitiveness of SMMEs, and
87
concentration in product markets (which is typical for most of South Africa’s consumer industries) reduces their market access. Although concentration, anti-competitive behaviour and market access have been identified as possible SMME constraints, it is difficult to determine from the current literature, how significant this is. For example, there is some evidence to suggest that concentration in the retail segment of semi-durables and durables such as clothing and furniture is a problem. However, no in-depth studies corroborate this. Nevertheless it would seem that an effective competition policy, which is now in place in South Africa, is crucial. 4.5.1.2 Contestable markets
Market contestability from a SMME perspective has been debated elsewhere but has received little research attention in South Africa. It is, for example, not clear why SMMEs in South Africa are not prominent in certain market segments. Do they lack comparative advantage? Is market access in fact blocked by the predatory behaviours described above? The answers to these questions may vary according to sectors and industries, but they are most urgently needed for those sectors where SMMEs constitute the majority of firms. Depending on the outcome of such an analysis, intervention through competition policy should be considered. The focus of such an investigation then needs to shift from an intra-industry to a pipeline analysis. It is useful to determine, for example, whether the extreme dualism that characterises the link between retailers and producers in South Africa’s furniture and clothing industries is prevalent in other industries and if so, to what extent monopolistic retailers depress supply by SMMEs in order to keep prices up or to strengthen ties with longstanding suppliers. 4.5.2 Indirect intervention in product markets
As mentioned earlier, if there is evidence to suggest that the SMME sector has advantages over the large-scale sector in its employment and distributional impacts (such that the multipliers of SMMEs are higher than those of large firms), then there are good reasons for public policy to consider promoting the sector. As repeatedly emphasised, this must be underpinned by efficiency and not simply through handouts to inefficient firms. 4.5.2.1 Exporting
SMMEs usually lack the financial resources necessary to withstand phases of economic decline and to explore export opportunities that could make them less vulnerable to fluctuations in domestic market demand. Indeed, only 10-15% of the sample of SMMEs in Greater Johannesburg engages in exporting. The development of an export surplus, with the help of a realistic exchange rate allows aggregate demand to exceed aggregate absorption. However, encouraging exports is another daunting challenge. Exporting as a growth opportunity for SMMEs that are confronted with falling local demand has been a popular recommendation during the late 1990s in South Africa – both among policy makers and SMME entrepreneurs alike. Despite a number of export promotion
88
schemes, however, export efforts by SMMEs have been modest, in the region of 15% of output, while SADC-countries appear to be the major export destinations.141 Problems range from: establishment of the first contacts and marketing; development of production capacity to meet higher quality requirements; logistics; and price competitiveness. The Export Promotion Schemes of the DTI consist of financial assistance for entrepreneurs to personally explore potential export markets and to overcome liquidity problems because of delayed payments for exports and/or the fluctuating exchange rate. Despite the importance that has been attached to the export potential of SMMEs, there is little empirical evidence on successful SMME exporters or constraints that are specific to exporting SMMEs. Therefore, policy makers have little guidance from the literature. As a first step, the broad exporting environment has to be assessed. This involves an analysis of how recent global markets behave, followed by an evaluation of measures that are more specific to the concerns of smaller exporting firms. This could include concerns such as the removal of red tape required to get started in the exporting business, encouragement of participation in domestic and international fairs that can provide important information on markets and technology, as well as the identification of appropriate human resources that are most important to help firms in this area (e.g. language skills where targeted markets are not English-speaking). A second phase could see the registration of products and services currently exported by South African SMMEs and the province of origin in order to get a spatial handle on the export behaviour of SMMEs. 4.5.2.2 Promoting subcontracting
For some SMMEs, the problem relating to final product markets is resolved by becoming subcontractors. Subcontracting can have a major impact on SMME growth and may be an important area on which policy ought to focus. Cooperation (in the form of sub-contracting or other) between large and (black) small enterprises has been hampered in the past in South Africa as apartheid legislation prohibited joint ventures between black and formal white-run businesses, and due to the racial zoning of industrial space and the poor quality and delivery standards of many black micro-enterprises.142 The political shift in the early 1990s has, however, provoked experiments of business linkages in which NGOs played an intermediation role.143 Nevertheless, it has been argued that the corporate sector is not really interested in outsourcing and maintains linkages merely for cosmetic reasons – reflecting the desire of large firms to appear politically correct.144 The same applies to the sub-contracting and upgrading of micro-enterprises linked to the spatial development initiatives (SDIs) of the Departments of Transport (DoT), as well as DTI and casino licensing.
141 Manning, 1996; Levy, 1996; Harrison and Dunne, 1998; Kesper, 1999a. 142 Hirschowitz et al., 1991; Riley, 1993; Hirschowitz et al., 1994a; Rogerson, 1996. 143 Tendler, 1994. 144 Ibid.
89
Evidence from research suggests that the construction phase offers an ample, albeit temporary opportunity for ‘affirmative’ subcontracting. During the operational phase, by contrast, operators are neither willing nor able to compromise on their cost, quality and quantity requirements as micro-enterprises often fail to meet them.145 Indeed, large corporations hold that most SMMEs are not ‘geared up to give consistent quality of products and services’146, while micro-entrepreneurs claim that large firms are not willing to purchase from them and instead withhold disproportionate amounts of the contract value until completion, or only pay 45 days after presentation.147 Clearly, there is a need for a competent intermediary that is respected by both parties to compensate for the unequal negotiating skills and power between micro-enterprises and big business. This is particularly true as courts do not accept ignorance as a reason for non-compliance with contractual obligations, and micro-enterprises often have difficulties in understanding legal terms of a contract.148 For example, a pilot programme could reveal whether mobile SMME service stations (which are not yet existent) could provide specific training, broker funding and monitor their client micro-enterprises so that SMMEs are able to increase their capacity to meet the requirements of potential subcontractors involved in infrastructure and tourism projects. South Africa’s trajectory of horizontal and vertical collaboration and institutional environment has not been supportive of the emergence of mutually beneficial subcontracting relationships. Indeed, the misconception of co-operation and the mistrust together with ‘little incentive’ to collaborate (due to import substitution policy) results in SMMEs being loath to share information, or technical and human resource expertise with one another.149 While informal subcontracting does occur among clustered micro-enterprises, subcontracting by larger and established SMMEs to micro-enterprises is aimed at cutting costs through by-passing regulations, viz. ‘informalisation’.150 Overall, these ‘superficial’ horizontal linkages between South African SMMEs do not intensify into collaboration aimed at improving (non-price) competitiveness.151 Around the world there is a close correlation between the extent of linkages and the size, efficiency and growth of the SMME sector. Considerable descriptive research has been done on subcontracting and linkages between SMMEs in South Africa. It would be desirable to organise and update information on the type and density of the inter-firm linkages engaged in by firms at all levels of the size scale and in all industries. Given South Africa’s history and the above discussion, it is clear that there are few linkages between the large-scale sector and the micro- (mainly black) sector, although there has been some recent experimentation with participation by NGOs. It is less clear whether the extent of subcontracting between large and small-medium firms is also low. This is less obvious than in the case of large-micro relationships, and thus warrants empirical attention. Subcontracting of micro-enterprises by larger SMMEs to evade regulations is a frequently encountered motivation in other countries
145 Rogerson and Reid, 1997; interviews with major hotel chains in January 2000. 146 Sherburn et al., 1998:4. 147 Bukula et al., 1998; Ntsika, 1999b. 148 Ntsika, 1999b: 84. 149 Levy, 1996:27; Levin, 1997b; Morake, 1998; Kaplinsky and Morris, 1999. 150 Rogerson, 1991; Rogerson and Rogerson, 1997. 151 Manning, 1996; Prinsloo, 1996; Levin, 1997b; Harrison and Dunne, 1998; Kaplinsky and Morris, 1999; Kesper, 1999a.

90
too. There is some linkage among firms in the same size categories (e.g. micro, small) but how it compares to other countries is unclear. There seems little evidence from around the world that linkage systems achieve any depth and density unless they are significantly beneficial to both parties within a reasonable period of time. It is unlikely to expect moral suasion on large firms to induce them to produce any more than token efforts. On the other hand, policy pressure to increase subcontracting may be productive when the economics of it make sense, i.e. that after a brief learning period the large firm is persuaded to continue the arrangement even though the pressure to do so is taken away. The pressure acts as an ‘infant industry’ tariff whose effect is to induce learning and fairly quickly make the tariff unnecessary for the firm to be able to compete. The experience of Korea around the mid-1970s seems to have this characteristic. Policy pressure on large firms was complemented by an economic situation that increased pressure on the large firms to lower their costs. Clearly, any policy intervention in this area must be well designed, since the short-run effect will be to lower the competitiveness of the large subcontractor, unless the linkage creation process is somehow subsidised. Other approaches to fostering linkages have been tried around the world, and considerable understanding built up on their differing degrees of success. With respect to subcontracting involving informal sector firms, or more generally firms whose wage rates are lower than those of the contracting firm due to legislation and other institutional factors rather than to market forces, linkage policy is intricately linked to labour market policy. This is a hotly contested area in South Africa for many reasons, and in the analysis of this issue, it is important to know how important wage differentials are in creating employment in smaller subcontractors, as opposed to other factors that foster subcontracting. The latter includes the desire to diminish risk by handling seasonal or other output booms through subcontracting, cost savings on factors other than labour (e.g. plant space) and so on. The relative importance of these basic reasons for subcontracting varies from industry to industry and from situation to situation. The optimal setting in which subcontracting can be used as a form of labour market segmentation that lowers the distortionary costs of a high legislated wage for a given group is when below the legislated wage the demand for labour is relatively elastic at lower wages that are, however, still well above the reservation wage of labour (if there is such a reservation level). Economic theory and experience from elsewhere points out that the balance of bargaining power between contractors and subcontractors changes over time as the labour market in general tightens up. When that balance is quite unequal it is generally important to have some tools with which to protect the weaker partner. The tools which are most dangerous, in that they may cancel out the potential benefits from this sort of arrangement, are those that affect the price of the work undertaken and that try to guarantees some degree of permanence. This is not to say that these tools should never be wielded but only that they can easily backfire and would have to be used only on the basis of a very detailed understanding of the labour market at hand The potential for subcontracting varies enormously by sector (i.e. by type of production process), depending on whether stages of production are divisible and hence could be

91
subcontracted. However, the scope for interventions is limited since sub-contracting decisions are made more internally by firms than as a result of a specific policy. Examples of steps taken with some success in other countries include technical assistance to small firms that improve their performance in those areas most important to a large firm that might enter a subcontracting arrangement (e.g. reliable delivery capability), and consulting support for the two potential partners during a phase when they are considering entering into such a relationship. 4.5.2.3 Procurement as government intervention to increase demand
Carrying through the argument that it would be desirous to see an economy with greater SMME participation due to its greater multiplier effects, government procurement could be another avenue to encourage the growth of the sector. According to Ntsika (1999b: 117), due to the lack of a consistent policy and regulatory environment, the problems experienced by SMMEs and identified in the 1997 Green Paper remain and can be summarised as follows:
• Different tendering systems in South Africa create uncertainty and high information costs for SMMEs without tender experience;
• The nature of contract documentation is discouraging for inexperienced SMEs that
have problems in understanding the legal terminology used152;
• Period contracts require quantities at a certain point in time, which are not specified in advance and might pose supply problems if awarded to SMMEs;
• Contracts with low financial value, by contrast, are often those that SMMEs could
readily undertake, but are frequently declared “emergency contracts” to circumvent open tendering and instead, awarded on the basis of quotations from three approved suppliers. An official databank of approved SMME suppliers does not exist;
• Delayed or no information about the awarding of contracts is given to SMME
applicants that have tendered, and there are no records kept to monitor how many SMMEs have managed to win government tenders;
• Payment cycles for government contracts are prejudicial to SMMEs, which are often
required to supply onerous guarantees and sureties.153 Parastatals usually pay ninety days after completion of the order – which might have taken a SMME several months to carry out in the first place154; and
• Corruption is perceived as the major problem why SMMEs do not receive tenders.155
152 Ntsika, 1999b: 21. 153 Ntsika, 1999b: 22; own interviews. 154 Ntsika, 1999b: 120. 155 Ibid, 22.
92
Reinforcing the suggestions for reform made in the 1997 Green Paper, the Procurement Task Team informing the Advisory Board of the National Small Business Regulatory Review recommends the following156:
• Uniformity and consistency of tendering procedures are required if procurement is to be more accessible to SMMEs157;
• An independent monitoring body needs to be established that provides a databank of
potential SMME suppliers, lobbies for SMMEs, and investigates their complaints.158 Once a contract has been awarded, SMMEs –especially PDI SMMEs – require support, which would include judicial information, but also technical training and finance to overcome cash flow problems during the completion of a contract.159 The existing TACs are not well equipped to provide this guidance during the completion of a contract. Therefore, alternatively to, or in combination with, awarding tenders affirmatively to PDI SMMEs, large corporations could be obliged to subcontract a certain percentage of their awarded tender to these SMMEs and to train them so that SMMEs supply the required quality and quantity. However, this process requires monitoring as subcontracting to ‘ghost’ SMMEs might occur. Current evidence from the World Bank survey shows that SMMEs bidding for tenders is still rather low. This can be explained by rigidities in the system of government procurement on the one hand and SMMEs’ lack of business expertise and technology, poor quality of goods, and/or inadequate government support on the other. The SMME economy and PDI entrepreneurs have welcomed South Africa’s affirmative procurement strategy. Nevertheless, cumbersome tendering procedures and insufficient support from TACs, as well as the incapability of many SMMEs to meet quality and quantity requirements, have disillusioned SMME entrepreneurs. Older, larger, export-oriented, white-run and growing SMMEs are more likely to qualify for tenders than their black and young counterparts. While the effective implementation of the TAC programme is a necessary condition for more affirmative procurement to take place, it is seemingly not sufficient. Unless tender authorities compromise on product quality and quantity as well as payment terms, or unless PDI SMMEs manage to provide quality enhanced products (but this is not directly dependent on policy), successful affirmative procurement is not likely to occur.
156 Ibid. 157 Ibid, 118. 158 Ibid, 125. 159 RSA, 1997.

93
5 CONCLUDING OBSERVATIONS
5.1 INTRODUCTION
Six years of SMME promotion has not been able to transform South Africa’s SMME economy into a vibrant small business sector. This can be attributed in part to the fact that a small firm’s growth depends to a large extent on the growth of the macro economy. Since macroeconomic growth over the past years has, at best, been modest, it may be concluded that SMMEs have not yet been able to develop to their full growth potential. Nevertheless, more critical voices argue that the promotion of South Africa’s SMME economy suffers from poor implementation of policy initiatives, which are in turn woefully inadequate. It is this question about the inappropriateness of the current SMME policy that prompted the compilation of this report. The main objective of this report was to initiate a specific analysis on the economics of SMMEs. To date, a serious economic analysis has been lacking, despite an abundance of policy literature on SMMEs in South Africa, which focuses on various aspects such as skills, entrepreneurship, finance and others. The problem seems to be the absence of an existing coherent framework on what all these different aspects collectively mean in the context of economic growth and the problem of unemployment. This project aims to contribute to the building of the ‘bigger picture.’ This section simply aims to highlight – based on analyses within the report – the major gaps in our knowledge that still preclude us from making comprehensive policy recommendations, specifically in three areas: labour markets, capital markets and product markets. All of these factors have been shown to be explanatory factors in the growth of SMMEs. Very little has been said about crime. Indeed, in the South African context, it is one of the key factors contributing to a hostile environment of investment and SMME growth in particular.
5.2 SMME POLICIES AS PART OF A WIDER FRAMEWORK
Important and specific though they may be, SMME growth and prosperity are clearly not ‘stand-alone’ aims to be pursued in ignorance of the broader economic policy. In fact, it is easily understandable that SMME growth can be strongly affected by the macroeconomic context. Nevertheless, it makes much sense to keep SMME policies within a separate and coherent institutional responsibility. 5.2.1 Macroeconomic policy and its impact on SMME growth
It is generally difficult to arrive at solid conclusions about the impact of macroeconomic policy on SMMEs. Globally, the relationship between SMME (or entrepreneurship) and economic growth is complex, with “opportunity entrepreneurship” being stimulated by a growing economy, while “necessity entrepreneurship” is rather counter-cyclical but creates

94
very precarious employment. Increases in the numbers of enterprises should therefore not necessarily be regarded as a positive effect of the economic context. In South Africa, there is a lively debate on whether macro-economic policy in the last five to ten years has acted as a catalyst or deterrent to overall growth. Since the adoption of the GEAR strategy in 1996, the South African government has successfully reduced its fiscal deficit and contained inflation – albeit by means of raising the real interest rate. To what degree this hindered new investments in the SMME economy is less clear, for the following reasons:
• The impact of macroeconomic policies on the private sector is often very intricate; and
• Macro-policies affect not just the SMME sector, but also the private sector as a whole.
Fiscal restraint, for example, appears to have had an indirect impact on SMME growth by affecting levels of government expenditure on procurement and hence the demand side of SMME growth. Monetary policy has increased the cost of formal credit as a capital source for new investments. Fluctuations in the exchange rate impact negatively on SMMEs, which are highly dependent on imported inputs and equipment, while its depreciation was seemingly insufficient in making South African products more competitive in, export markets. It is the differential impact on the spectrum of micro to medium firms and the sectors in which they operate, which matters and needs to be investigated further. This raises a whole set of questions, which can only be dealt with through a comprehensive evaluation of the soundness of the SMME sector, and not just of the numbers.
5.3 THE LABOUR MARKET AND SMMES
5.3.1 Labour regulation and employment dynamics
The promotion of SMMEs is seen as an instrument to foster employment creation. There is, however, little empirical evidence on how strong this effect might be in South Africa. Current research on SMMEs in South Africa is limited to the use of entrepreneurs’ perceptions, which invariably point to the constraining effects of labour market regulations, and in particular minimum wages. However, the research has thus far failed to analytically investigate the functioning of the labour market, and this in turn impacts on growth in SMME employment. The functioning of the labour market is likely to affect employment growth in SMMEs because small firms tend to be more labour intensive than their larger counterparts. Indeed, SMMEs are disproportionately found in labour-intensive industries like clothing and furniture, and within a given industry they are more labour intensive than their larger counterparts. It is accordingly expected that high labour costs would deter new SMME formation and employment increases in existing firms.

95
As a middle-income country, South Africa has a highly heterogeneous labour force with a high dispersion of labour productivity (owing to a high variance in skills, which correlates with wage levels if left to the forces of the market). While the existence of a large supply of low-skilled labour should allow SMMEs to employ such labour at low wages, labour regulation may deter the skill-productivity-wage balance. There are indications that wages matter more to SMMEs than to larger firms, and that the application of too high a minimum wage makes SMMEs either exit, or become less labour intensive, i.e. to become more like larger firms. So far, however, this effect of wage levels on employment growth or decline in the SMME sector has not been rigorously analysed or quantified. 5.3.2 Flexibility of labour
Another issue of concern is the flexibility of South Africa’s labour force. The typical growing SMME does not expand smoothly or continuously. Instead, its employment often fluctuates, reflecting the arrival of competition into the niche it was the first to find, the resolution of internal problems or those of the SMME entrepreneur and so on. There are indications that regulations that limit the flexibility of ‘hiring and firing’ cause some of the SMMEs that supply very volatile product markets to close down. Unfortunately, it is difficult to assess just how much flexibility is really needed for the survival of different groups of SMMEs, and how much merely provides a pretext for unfair dismissal. Likewise, the enforcement of basic conditions of employment such as paid maternity or sick leave especially burdens SMMEs because the monetary and labour replacement costs involved are not spread over a large enough work force. One of the objectives of the dialogue with the respective unions is to clarify the difference between the areas where there is a true trade-off between the welfare of existing employees and the potential to create more jobs vs. those other areas where no such trade-off exists. This involves some combination of compromise between the interests of the two groups, and involvement of the state to bear costs, which neither of the two parties should bear. There is a widespread tendency in developing countries for unemployment insurance systems to take more of the burden of labour reallocation off the firms, while at the same time avoiding a situation where the workers are forced to pick up that burden. 5.3.3 Future research on labour and SMMEs
In order to assess the impact of labour market dynamics and regulation on SMME growth, data on employment changes by size and sector and on wage differentials among different sizes of firms is needed to answer the following questions:
• Is South Africa's labour structure different from other middle-income countries, in particular with regards to self-employment in the micro-enterprise sector?
• Does measured open unemployment obscure survivalist or micro-enterprise activities?
• Are there large wage differentials between small and large firms, and are the associated
wage/employment elasticities different (apart from variation across sectors)?
96
• To what degree does current labour market legislation negatively impact on actual (not planned) employment creation in SMMEs? To what extent do SMMEs (indirectly) generate employment through subcontracting as a response to labour market legislation?
• What is the potential for a combined unemployment insurance retraining system that
eases the burden of labour market adjustment for both the worker and the firm?
5.4 CAPITAL MARKETS AND FINANCIAL INTERMEDIATION
5.4.1 Some policy framework guidelines
A major challenge facing the government is how best to use its finite resources to support SMMEs, and how its overall support interfaces with access to finance and the role of private financial institutions in service provision. At one level there are enterprises that present viability problems per se, and thus are a high risk. It appears that these enterprises, when they are able to borrow, are charged high interest rates by institutions to make up for the risk, but this cost of finance makes them even more vulnerable. It is argued that the support needed by these enterprises is primarily non-financial, although it makes sense to accompany, for example, marketing support by an enabling financial framework to accompany growth. A major challenge is to ensure that if firms become viable entities on the (non-financial side), then the financial market should not prejudice them should they require finance. As mentioned earlier, the predicament of financial intermediation only becomes a problem if there are enterprises that could make effective use of finance but cannot get it. There is a range of factors that explain the problem of financial intermediation. First, general factors are linked with the size and risk of firms, such as: risk ceilings of financial institutions; lack of information and credit record, making the credit assessment very difficult; SMMEs’ lack of skills and experience when applying for loans; and transaction costs being too high for the size of the loan. These factors are typical explanations for market failures on SMME financing everywhere in the world. Second, there are factors specific to previously disadvantaged communities, such as the lack of valuable collateral, or the inability to provide adequate security/own contribution, as well as cultural barriers. Unfortunately, there are no known recipes for dealing with these factors. Removing interest rate ceilings to enable the development of high-risk lenders may be counter-productive if enterprises are too vulnerable to bear higher interest rates. Simplification of procedures and better control of costs are the responsibility of individual financial institutions, but pushing them into that direction raises the risk of an even more “blanket approach” and worse service quality. Subsidies are not likely to be sustainable.
97
5.4.2 Further research needs
More research is certainly needed to arrive at reasonable conclusions as to where the most pressing needs are, and how capital markets, or government intervention in the capital markets, can facilitate better access. The central vision of a needed research output to deliver a better basis for policy-making would be a “map of demand and supply,” which would encompass the research of separate studies on a segmented approach. This project would involve the following steps:
• The identification of types of enterprises that are relevant for SME finance purposes (according to the criteria of age, sector, location, size, background, growth potential), and the main types of finance to consider (equity, short-term and long-term debt, possibly asset-based vs. pure finance);
• For each type of enterprise, the identification of the average demand for various types
of external capital, according to their growth potential, their current financial structure, and typical capital intensity. The desirable upgrade of a certain number of companies into the next higher category should also be considered in the model;
• Similarly, an attempt at identification and quantification of the main sources of
finance on the market (including micro-lenders, buyer-advances or supplier-credit, business angels and venture capitalists) and to break these amounts down between the types of enterprises, in order to have a first indication of where the capital supply overshoots, almost meets, or lies far behind demand; and
• A critical review of the qualitative constraints facing supply and demand, i.e. the
institutional and economic constraints affecting the ability of various financial institutions to operate on certain segments; and the creditworthiness and interest-bearing ability of SMMEs, per category. In addition, an attempt at providing some explanatory guidelines for these constraints (regulatory obstacles, main sources of costs and risk, and so on).
Such a “cartographic exercise” is a considerable challenge, especially for the types of finance that are very badly researched (such as trade credit and lease/instalment finance) and even more for some under-researched types of enterprises (such as informal firms and rural enterprises). It probably needs to be fulfilled by the puzzle technique, i.e. investigating various samples in various settings and, at a later stage, aggregating the various pictures obtained to a coherent representation of the various (sub-) market equilibria. Further useful research would involve:
• A review of cultural barriers impeding the implementation of a working venture capital scheme. At present, venture capital is under-developed on the SMME segment, because of both a lack of interest of many venture capital firms, and a lack of readiness of SMMEs. For example, entrepreneurs tend to be discouraged from when they consider the need to give up a part of the control on what they consider to be

98
their ownership. Whether these barriers are definitive or whether the strong economic case for equity may reverse the trend and increase the demand for capital should be investigated.
• An analysis of the flows of credit funds to SMMEs in South Africa, and the way
monetary policy has influenced such flows over the last decade.
• A more accurate analysis of South African banks’ activities towards SMMEs, including:
o Comparison of South African banks’ SMME loans (and repayment experience)
with similar developing countries. Anecdotal evidence, indeed, suggests that the share of loans to SMMEs in South Africa is lower than some developing countries. This may or may not be the result of low density in the SMME sector, but to understand this better will require data from banks.
o An investigation into the likely success of cost-reducing practices or higher competition among the banks, to encourage it to service the SMME sector better. If competition generates a shift in loan books of banks from large corporate to SMME clients, SMMEs are likely to benefit. (However certain SMMEs’ dependence on larger firms, e.g. through subcontracting, may sometimes offset this effect).
o A review of the effects of bank regulation. Currently the regulatory system to which banks and other financials institutions must respond is becoming tighter, a trend which makes riskier types of business more and more capital-intensive. The need and justification of an innovative regulatory framework, which would allow “SME banks” to function with lighter capital bases under certain conditions, should be investigated.
• Very generally, a research project that investigates the issue of upgrade of informal
businesses to the formal sphere in the South African and international context would be valuable. Such research should be very focussed on the ‘field,’ and investigate different settings. There is a need to improve the understanding of the factors, which contribute to certain companies “sticking” in the informal sector or, conversely, managing the transition into the formal economy.
5.5 TRADE AND MARKET STRUCTURES
Supply-side measures alone are not sufficient to make SMMEs grow if there is a lack of access to potential markets. Indeed, falling demand levels are the core concerns of South African SMMEs at the close of the 1990s. Micro-entrepreneurs largely complain about increased competition as a result of rising unemployment and lack of purchasing power in their immediate markets, while more established SMMEs hold that their target markets are dominated by large firms or are shrinking. Identifying insufficient demand as a primary constraint is not surprising in South Africa where both small and large firms suffer from low aggregate demand. Nevertheless, small firms may be most prominent in sectors, industries and market segments that are more affected than those where large firms dominate.
99
Some sense of demand parameters may assist government in not creating overly high policy targets. More information would be needed on what SMMEs are producing and what market segments they occupy or target. One way in which the government could harness this kind of information is by linking SMME specialists to the sector directorates. Government’s ability to harness information on the SMME sector will depend less on generic SMME specialists but more on sector/economy-wide specialists with an SMME focus. With slow economic growth, which has tempered the performance of the SMMEs sector, what initiatives can be taken by the DTI to boost their performance? Are there ‘growth pockets’ in the SMME economy, where by virtue of their smaller size and other attributes, they are able to grow even in the face of overall stagnation? Unpublished data, used as background by Ntsika (2001) for their State of Small Business report could be a useful starting point as it offers considerable sectoral detail in terms of manufacturing sectors over a long period, although it only covers those SMMEs that are captured by the various manufacturing censuses released by Stats SA. The Global Entrepreneurship Monitor report and local studies, such as the reviews conducted in Johannesburg and the one pending in Cape Town, could provide additional insights to corroborate the findings of this urgently needed research.
5.6 CONCLUSIONS
The basic thrust of this report is that we are very far from having sufficient knowledge of the supply and demand parameters/factors that impact on SMME growth in South Africa. This partly reflects the incomplete understanding of these issues in developing countries in general, and also the short history of analysis of such issues in South Africa and the major change of context, and hence of challenge since the new government took power in 1994. What are the priority areas where increased information for government decision-makers will be especially important if success is to be achieved in accelerating SMME growth? South Africa’s SMME sector is expected to fulfil a number of roles ranging from poverty alleviation and employment creation to international competitiveness. Not only are these very divergent policy objectives, but also the policy instruments introduced to meet these objectives can be equally different, ranging from literacy training to technological advice. Accordingly (and presumably for political reasons), determining clear priority groups is urgent, be it the targeting of more efficient promotion activities towards the more productive SMMEs, or to better assist survivalist, mainly black-run endeavours. One of the greatest difficulties confronting policy makers is how best to develop an approach to SMMEs that achieves a sufficient degree of co-ordination between supply side effort and demand potential. Although there is the risk of investing resources in improving supply potential where demand constraints are high (e.g. low growth in demand because of regional stagnation), a major question is whether supply-side incentives have frequently been ineffective because of such demand problems or whether mis-specified supply policies/deficient service delivery are the true causes of lack of success. Ultimately, however, it is the generation of detailed information about the functioning and working of the SMME sector that decides, first and foremost, the success or failure of a redesigned SMME policy framework.

100
APPENDIX A1: LABOUR MARKET REGULATION AND SMMES IN SOUTH AFRICA
This Appendix presents additional information on SMMEs and labour market regulation in South Africa from the 1999 World Bank SMME survey.
Table A1: The number of unions that SMMEs have to deal with by size (per cent)
No Unions 1 Union 2 Unions Size 1 86.6 6.9 0.5 Size 2 73.4 20.5 2.0 Size 3 46.2 41.0 10.8
Source: Chandra et al. (2001)
Table A2: The number of unions that SMMEs have to deal with by sector (per cent) No unions 1 union 2 unions Clothing & Garments 50.0 37.8 9.2 Metals and Metal Products 66.7 25.8 1.1 Furniture 46.7 40.2 10.9 Food & Beverages 72.2 25.2 0.0 Tourism 84.8 7.6 4.4 Construction 69.6 21.7 2.2 Retail 78.5 12.9 3.5 Information Technology 90.1 6.6 0.0 Source: Chandra et al. (2001)
Table A3: Level at which collective agreements are reached No
agreement Establishment / Plant level
Company level
Sector / Industry level (Bargaining
Wage determination board
Other
Clothing & Garments 44.3 8.2 2.1 42.3 4.1 1.0 Metals and Metal Products 70.8 9.0 3.4 18.0 1.1 2.2 Furniture 59.6 5.6 4.5 24.7 5.6 5.6 Food & Beverages 72.8 5.3 7.0 11.4 3.5 1.8 Tourism 81.5 5.4 3.3 4.3 4.3 2.2 Construction 64.1 8.7 4.3 15.2 4.3 6.5 Retail 81.1 5.4 6.3 5.4 2.7 1.8 Information Technology 92.0 2.3 1.1 2.3 0.0 2.3 Source: Chandra et al. (2001)

101
Table A4: Implicit costs of doing business with labour Clothing
& Garment
Metals & Metal Product
Furniture Food & Beverage
Tourism Construction
Retail IT
Strikes/Stayaways None 22 24 37 38 26 24 31 16 1-3 strikes 12 7 7 3 0 6 4 1 More than 3 2 1 0 0 0 2 0 0 Workdays lost None 24 23 37 35 25 23 27 15 1-3 strikes 10 3 6 4 1 7 8 1 More than 3 2 5 1 2 0 2 0 1 Disciplinary inquiries None 26 22 16 26 18 23 22 13 1-3 strikes 9 8 27 12 7 9 13 3 More than 3 1 2 1 3 1 0 0 1 Dismissal time (months)
Median 3 1 2 2 1.5 1 1 1 # of respondents 10 13 10 5 6 13 10 3 Cost of dismissal Median 1750 2500 1500 1000 3000 695 1000 5500 # of respondents 14 18 7 9 7 14 11 3 Source: Chandra et al. (2001)
Table A5: Impact of labour regulations on employment by sector Clothing
& Garment
Metals & Metal
Product
Furniture Food & Beverage
Tourism Construction
Retail IT
Hire fewer workers 29.5 32.9 28.9 21.1 14.6 46.1 12.7 14.9
Substitute machinery for workers
10.4 20.9 18.9 11.5 6.7 25.8 2.7 5.8
Hire workers on a temporary basis
26.8 18.7 23.1 16.8 10.1 45.5 15.3 12.9
Rely on subcontracting 15.8 25.3 27.8 2.8 8.9 46.1 9.9 16.8
Saw labour relations and/or productivity
16.8 6.6 10.0 8.0 7.8 19.3 8.1 5.9
Source: Chandra et al. (2001)
Table A6: Reasons for subcontracting Wages of temporary
workers are lower Non-wage costs of temporary workers are lower
Flexibility to expand or to contract
Temporary workers are easier to lay off
Clothing & Garments 8.8 11.8 95.8 43.2 Metals and Metal Products 4.4 18.2 97.4 25.0 Furniture 21.4 21.4 94.1 54.8 Food & Beverages 28.9 18.4 89.3 28.6 Tourism 26.7 15.4 100.0 41.7 Construction 26.8 35.0 96.6 48.8 Retail 42.3 32.0 92.5 42.3 Information Technology 5.9 20.0 93.8 31.6 Size 1 11.4 15.2 91.8 38.9 Size 2 29.9 28.9 94.2 43.7 Size 3 12.7 13.9 97.4 35.6 Source: Chandra et al. (2001)

102
APPENDIX A2: STATISTICS ON SMMES, THEIR PROFILE AND THEIR CONTRIBUTION TO THE ECONOMY
Table A8: Size of firms by sector
Ntsika 1997 Stats SA 2000 GEM 2001 SIC Codes Surv-Micro Very sm.-small Medium Large Total Informal Formal Total Start-ups New firms
1 Agriculture, Hunting, Forestry 54,500 38,800 3,240 1,520 98,060 156,132 48,297 204,429 13,054 8,836 and fishing 8.4% 16.2% 28.6% 25.3% 10.8% 13.7% 9.9% 12.6% 1.3% 2.6% 2. Mining and Quarrying 3,600 631 112 137 4,480 1,535 751 2,286 0.6% 0.3% 1.0% 2.3% 0.5% 0.1% 0.2% 0.1% Included in “construction” 3. Manufacturing 65,300 35,400 3,840 1,479 106,019 118,224 45,119 163,343 143,597 64,909 10.0% 14.8% 33.9% 24.6% 11.7% 10.4% 9.3% 10.0% 14.3% 19.1% 4. Electricity, gas and water supply 0 40 2,298 2,338 0.0% 0.0% 0.0% 0.0% 0.0% 0.0% 0.5% 0.1% 0.0% 0.0% 5. Construction 71,600 15,600 996 320 88,516 116,264 31,566 147,830 37,154 16,992 11.0% 6.5% 8.8% 5.3% 9.8% 10.2% 6.5% 9.1% 3.7% 5.0% 6. Trade; repairs; hotels and 365,980 541,574 157,532 699,106 469,953 184,873 Restaurants 40.4% 47.6% 32.3% 43.0% 46.8% 54.3%
61 Wholesale / commission trade 7,400 12,170 660 577 20,807 0 60,250 22,09062 Retail trade & repairs 265,200 56,400 970 744 323,314 0 409,702 162,78364 Hotels and restaurants 11,300 10,050 385 124 21,859 Included in “retail”
7. Transport, storage and 50,600 7,600 293 303 58,796 39,467 45,893 85,360 98,409 5,777 Communication 7.8% 3.2% 2.6% 5.0% 6.5% 3.5% 9.4% 5.2% 9.8% 1.7%
8. 48,200 28,900 301 425 77,826 33,138 78,858 111,996 104,434 44,519
Financial intermediation, insurance, real estate and business services 7.4% 12.1% 2.7% 7.1% 8.6% 2.9% 16.2% 6.9% 10.4% 13.1%
9. Community, social and personal 72,800 33,300 525 388 107,013 109,694 70,143 179,837 136,567 14,273 Services 11.2% 13.9% 4.6% 6.4% 11.8% 9.6% 14.4% 11.1% 13.6% 4.2%10 Other activities not adequately defined 0 22,786 9,486 32,272 0.0% 0.0% 0.0% 0.0% 0.0% 2.0% 1.9% 2.0% 0.0% 0.0% 650,500 238,851 11,322 6,017 906,690 1,138,814 487,645 1,626,459 1,003,168 340,179

103
Table A9: PDI Ownership by sector
160 "Other" includes both SA citizens who did not indicate their race, and foreign citizens. This category e high number of foreign citizens interviewed explains the lower percentages of other categories
Ntsika 1997 GEM 2001 World Bank 1999
formal urban businesses only SIC Codes White PDI White Black Coloured Indian PDI White Black Colour Indian Other160 PDI
1 Agriculture, Hunting, Forestry 39,500 29,235 11,972 14,170 0 0 14,170 and fishing 57.5% 42.5% 45.8% 54.2% 0.0% 0.0% 54.2% 2. Mining and Quarrying 2,895 7,090 29.0% 71.0%
3. Manufacturing 35,962 51,280 42,607 131,305 37,793 12,436 181,534 200 19 10 45 125 74 41.2% 58.8% 19.0% 58.6% 16.9% 5.5% 81.0% 50% 5% 3% 11% 31% 19%
4. Electricity, gas and water supply 4,998 3,570 58.3% 41.7%
5. Construction 24,808 57,720 30,283 14,170 25,339 0 39,508 61 8 1 4 19 13 30.1% 69.9% 43.4% 20.3% 36.3% 0.0% 56.6% 65% 9% 1% 4% 21% 14%
6. Trade; repairs; hotels and 107,106 198,330 121,484 524,274 101,139 49,743 675,157 100 12 1 6 28 20 restaurants 35.1% 64.9% 15.2% 65.8% 12.7% 6.2% 84.8% 68% 8% 1% 4% 19% 13%
61 Wholesale trade 0 0 30,283 27,394 12,669 24,872 64,935 62 Retail trade; repairs 0 0 91,201 496,879 88,470 24,872 610,221 74 10 1 4 24 1664 Hotels and restaurants 8,833 7,100 26 2 0 1 5 4
7. Transport, storage and 9,973 36,688 30,283 83,128 12,669 0 95,797 36 3 0 2 7 6 Communication 21.4% 78.6% 24.0% 65.9% 10.0% 0.0% 76.0% 75% 7% 1% 4% 14% 12%
8. Financial intermediation, insurance, 56,525 20,725 91,201 41,564 12,669 12,436 66,669 58 6 4 4 24 14 real estate and business services 73.2% 26.8% 57.8% 26.3% 8.0% 7.9% 42.2% 61% 7% 4% 4% 25% 14%
9. Community, social and personal 48,381 55,190 23,945 137,917 25,339 6,218 169,474 8 1 0 0 2 1 services 46.7% 53.3% 12.4% 71.3% 13.1% 3.2% 87.6% 75% 7% 1% 4% 14% 12%
338,981 466,928 351,774 946,527 214,948 80,833 1,242,308 463 50 17 61 205 127 42.1% 57.9% 22.1% 59.4% 13.5% 5.1% 77.9% 58% 6% 2% 8% 26% 16%

104
Table A10: Distribution of sectoral contribution to value added across size class, 2000 (formal sector only) Micro Small Medium Large Total GDP in m R (current prices)
1. Agriculture 4.1% 8.7% 43.7% 43.5% 100% 25,875 2. Mining 1.0% 1.7% 2.6% 94.7% 100% 59,108 3. Manufacturing 5.3% 7.4% 21.0% 66.3% 100% 149,380 4. Electricity 0.0% 0.0% 0.0% 100.0% 100% 22,739 5. Construction 3.1% 35.6% 12.2% 49.1% 100% 23,906 6. Trade (incl. Motor) 2.3% 23.4% 17.1% 57.2% 100% 105,645 7. Transport 7.1% 18.5% 20.3% 54.1% 100% 79,939
8. +9. Business & other Services 14.9% 12.9% 2.9% 69.3% 100% 185,288
Government and other 156,137 Total 120,395 104,234 23,432 559,956 808,017
Average: all sectors 5.8% 13.9% 15.1% 65.2% 100%
Table A11: Percentage contribution of SMMEs to employment in the main industrial sectors (formal private sector only) Micro Small Medium Large Total Employment (formal + informal sector)
Agriculture 4.2% 13.8% 52.3% 29.7% 100% 1,099,000 Mining 0.9% 2.5% 2.6% 94.0% 100% 476,000 Manufacturing 8.4% 10.6% 24.6% 56.5% 100% 1,498,000 Electricity 0.0% 0.0% 0.0% 100.0% 100% 78,000 Construction 2.9% 37.3% 13.5% 46.3% 100% 567,000 Trade (incl. Motor) 35.8% 23.7% 13.0% 27.5% 100% 2,079,000 Transport 11.4% 23.5% 20.8% 44.3% 100% 539,000 Business Services 25.1% 19.2% 5.2% 50.5% 100% 931,000 Other Services 52.7% 18.2% 8.2% 20.9% 100% 1,984,000
(domestic work, foreign government and others) 1,110,000
Average: all sectors 17.4% 16.3% 20.8% 45.5% 100%

105
REFERENCES
Aeroe, and Hartzenberg, T. (1994). Macro-economic Policy and the Institutional Framework for Micro-Enterprise Development in South Africa. In Hirschowitz, R., Orkin, M., Rogerson, C.M. and Smith, D. (eds). Micro-Enterprise Development in South Africa. Report prepared for CASE and the European Union, Johannesburg, 38-75. Ajam, T. (1994). An Application of the Flexible Specialisation Methodology to the Furniture Industry in the Western Cape. Unpublished MA thesis, School of Economics, University of Cape Town. Altman, M. (1994). An Industrial Strategy for the Clothing Sector. University of Cape Town Press, Cape Town. Berry, A. (2000). The role of the small and medium enterprise sector in Latin America: implications for South Africa. Paper presented at the 2000 TIPS Forum, September, Johannesburg. Bloch, R. and Daze, S. (2000). Review of the South African Local Business Service Centre Programme: Current status, future prospects. Unpublished report for the IDRC-ROSA, Johannesburg. Bloch, R. and Kesper, A. (2000a). Supporting the Small and Medium Manufacturing Sector in the Highveld Production Region. Unpublished report for the Council for Scientific and Industrial Research, Pretoria. Bloch, R. and Kesper, A. (2000b). Supporting the Small and Medium Manufacturing Sector in the Western Cape. Unpublished report for the Council for Scientific and Industrial Research, Pretoria. Boomgard, J., Davies, S., Haggblade, S. and Mead, D.C. (1992). A Sub-Sector Approach to Small Enterprise Promotion and Research, World Development 20(2) 199-212. Budlender, D. (1994). Micro-Enterprises and Gender. In Hirschowitz, R., Orkin, M., Rogerson, C.M. and Smith, D. (eds.), Micro-Enterprise Development in South Africa. Report prepared for CASE and the European Union, Johannesburg, 105-129. Budlender, D. and Theron, J. (1995). Working from Home: The Plight of Home-Based Workers. South African Labour Bulletin, 19 (3), 14-19. Bukula, S. (1997). A Review of Public Policy on the Promotion of Inter-Firm Co-operation Among Small Firms. Report prepared for BEES Consulting Group, Johannesburg. Bukula, S. (1999). Report on the Support Needs of SMME Manufacturers in Gauteng. Unpublished report prepared for the Office of Industrial and Policy Research, Johannesburg. Bukula, S., Memani, M. and Fakudze, N. (1998). My Region, My Province – It’s My Business: Institutional And Legal Framework For SMME Promotion In The Gauteng Province. Unpublished report for the Gauteng Provincial Government: Directorate of Economic Empowerment,

106
report for the Gauteng Provincial Government: Directorate of Economic Empowerment, Johannesburg Chandra, V., Moorty, L., Nganou, J-P., Rajaratnam, B. and Schaefer, K. (2001). Constraints to Growth and Employment in South Africa. Report #2: Evidence from the Small, Medium and Micro Enterprise Firm Survey. Informal Discussion Paper #15. Washington DC: World Bank Southern Africa Department. Clark, I., Hofmeyr, A. and Hawken, L. (1996). MSE Horizontal Linkages Project. Unpublished report prepared for the BEES Consulting Group, Johannesburg. Da Silva, M. (1998). The Rise And Fall Of An Enterprise Cluster In Africa: The Jewellery Industry In South Africa. Paper presented at the International Graphical Union Conference on Small and Medium Sized Enterprise in a Changing World (August), Seville. DBSA (Development Bank of Southern Africa). (1993). Employment Creation Strategies For South Africa. Submission on Job Creation to the National Economic Forum’s Short-term Working Group, Halfway House. Department of Trade and Industry. (1998). Incentive Schemes. DTI, Pretoria. Dunne, N. (1999). The Importance Of Understanding Market Demand: South African Furniture Manufacturers In The Global Economy. CSDS Working Paper 22, School of Development Studies, University of Natal, Durban. Eichler, N. (1994). Technology Support For SMMEs: Suggestions For An Appropriate Institutional Framework. Issues in Development, 6. Friedrich Ebert Stiftung, Johannesburg. Falk, D. (1994). “Credit And Finance For Micro-Entrepreneurs.” In Hirschowitz, R., Orkin, M., Rogerson, C.M. and Smith, D. (eds.), Micro-enterprise Development in South Africa. Report prepared for CASE and the European Union, Johannesburg, 236-266. Fine, B. (1995). “Flexible Production and Flexible Theory: The Case of South Africa.” Geoforum 26 (2). Gape, H.T. (1999). The Reasons That May Prevent Small And Medium-Sized Enterprises From Being Successful. Unpublished MBA thesis, Potchefstroom University of Christian Higher Education, Potchefstroom. Harrison, K. and Dunne, N. (1998). KwaZulu-Natal’s clothing industry: The importance of firm-level and pipeline competitiveness issues. CSDS Working Paper 14, School of Development Studies, University of Natal, Durban. Hirsch, A. and Hanival, S. (1998). Industrial Restructuring in South Africa: The Perspective from Government. Paper presented at the 1998 TIPS Annual Forum (September), Johannesburg. Hirschowitz, R. and Orkin, M. (1994). “Conclusions,” In Hirschowitz, R., Orkin, M., Rogerson, C.M. and Smith, D. (1994a): Micro-enterprise Development in South Africa. Report

107
prepared for CASE and the European Union, Johannesburg, 326-340. Hirschowitz, R., Acutt, J. and Koch, A. (1991). The NTB/HSRC Investigation into Training for the Informal Sector: Main Report. Report prepared for the Human Sciences Research Council, Pretoria. Hirschowitz, R., Orkin, M., Rogerson, C.M. and Smith, D. (1994a). Micro-enterprise Development in South Africa. Report prepared for CASE and the European Union, Johannesburg. Hirschowitz, R., Smith, D. and Rogerson, C.M. (1994b). “Fieldwork results,” In Hirschowitz, R., Orkin, M., Rogerson, C.M. and Smith, D. (eds.), Micro-enterprise Development in South Africa. Report prepared for CASE and the European Union, Johannesburg, 130-136. Horn, G.S. (1995). “Self-Employed Women’s Union: Tackling The Class-Gender Intersection,” South African Labour Bulletin, 19 (6), 34-38. Horn, G.S., Levin, M. and Sofisa, T.N. (1993). “The Informal Sector In Mamelodi And Kwazakhele,” Africa Insight, 23, 168-175. Kaplinsky, R. and Manning, C. (1998). “Concentration, Competition Policy and the Role of Small and Medium-Sized Enterprises in South Africa’s Industrial Development,” Journal of Development Studies, 35 (1), 139-161. Kaplinsky, R. and Morris, M. (1999). “Trade Policy Reform and the Competitive Response in Kwazulu Natal Province, South Africa,” World Development, 27 (4), 717-737. Karungu, P., Nyandoro, T., and Stettler, M. (2000). Venture Capital as a Source of Economic Empowerment in South Africa. Johannesburg: KNC and Associates. Kesper, A. (1999a). “Small Clothing Manufacturers In The Johannesburg Inner City: Facing The Global Challenge,” Urban Forum, 10 (2), 137-164. Kesper, A. (1999b). Small And Medium-Sized Metalworking Companies In The Witwatersrand: Facing The Global Challenge. Paper presented at the 1999 TIPS Annual Forum (September), Johannesburg. Kesper, A. (2000a). Manufacturing SMMEs in the Vaal Triangle: Survey Results. Unpublished Report prepared for the Office of Industrial and Policy Research, Johannesburg. Kesper, A. (2000b). Making A Living in the City: Success And Failure Of Small Enterprises In The Johannesburg Inner City. Africa Insight Special Issue, forthcoming. Kesper, A. (2000c). Failing or Not Aiming to Grow? Manufacturing SMEs and their Contribution to Employment Growth in South Africa. Paper presented at the 2000 TIPS Forum, September, Johannesburg. Kesper, A. (2002). Tracing Trajectories of Successful Manufacturing SMEs in South Africa.

108
Unpublished PhD dissertation, University of the Witwatersrand, Johannesburg – forthcoming. Khosa, M. (1991). “Capital Accumulation in the Black Taxi Industry.” In E. Preston-Whyte and C. Rogerson (eds). South Africa’s Informal Economy. Cape Town, Oxford University Press, 310-325. King, K. and McGrath, S. (1999). Learning to Compete: Africa in the Era of Globalisation. Paper presented at the ‘Learning to compete’ Workshop (4-6 June), Institute of Development Studies, Nairobi. Kirsten, J. (1995). “Rural Non-Farm Enterprises: A Vehicle for Rural Development in South Africa?” Agrekon, 34, 198-204. Le Roux, J.P. (1998). The Influence Of Strategic Management On Successful Small And Medium Businesses In The South African Context. Unpublished MCom thesis, Cape Technikon, Cape Town. Levin, S. (1997a). Small Businesses in a Changing Global Economy: A Case Study of the Electronics Industry in South Africa. Unpublished MA thesis, Faculty of Arts, University of the Witwatersrand. Levin, S. (1997b). Runners and Laggards: An Analysis of the Factors Promoting and Constraining the Growth of Small Manufacturing Firms in the Plastics and Furniture Industries. Policy and Research Division, Ntsika Enterprise Promotion Agency, Pretoria. Levy, B. (1992). How Can South African Manufacturing Efficiently Create Employment? An Analysis of the Impact of Trade and Industrial Policy. Informal Discussion Paper #1.Washington DC: The World Bank. Levy, B. (1996). The Business Environment for Industrial Small and Medium Enterprises. Informal Discussion Paper #11, The World Bank, Washington DC. Liedholm, C. and McPherson, M. (1991). Small-Scale Enterprises in Mamelodi and KwaZakhele Townships, South Africa: Survey Findings. GEMINI Technical Report 14. Manning and Mashigo. (1994). “Manufacturing in South African Micro-Enterprises,” IDS Bulletin, 25 (1), Institute of Development Studies, University of Sussex, Brighton, 30-36. Manning, C. (1996). Market Access for Small and Medium Sized Producers in South Africa: The Case of the Furniture Industry. Unpublished PhD dissertation, University of Sussex, Brighton. McPherson, M.A. (1996). “Growth of Micro and Small Enterprises in Southern Africa,” Journal of Development Economics, 48, 253-77. Mead, D. (1995). “How the Legal, Regulatory and Tax Framework Affects the Dynamics of Enterprise Growth.” In English, P. and Henault, G. (eds). Agents of Change: Studies on the Policy Environment for Small Enterprise in Africa. Ottawa: IDRC, 75-86.

109
Ntsika Enterprise Promotion Agency. (1997). State of Small Business in South Africa. Policy and Research Division. Pretoria. Ntsika Enterprise Promotion Agency. (1999a). State of Small Business in South Africa. Policy and Research Division. Pretoria. Ntsika Enterprise Promotion Agency. (1999b). National Small Business Regulatory Review. Policy and Research Division, Ntsika, Pretoria. Ntsika Enterprise Promotion Agency. (2001). State of Small Business in South Africa. Policy and Research Division. Pretoria. October, L. (1996). A Study of the Cape Clothing Industry. Working Paper 2, ISP Phase 2: Sectors, clusters and regions. Development Policy and Research Unit, University of Cape Town. Preston-Whyte, E. and Rogerson, C.M. (1991). South Africa’s Informal Economy. Oxford University Press, Cape Town. Republic of South Africa. (1995). National Strategy for the Development and Promotion of Small Business in South Africa. Cape Town: White Paper of the Department of Trade and Industry. Republic of South Africa. (1996). National Small Business Act. Government Printer, Pretoria. Republic of South Africa. (1997). Green Paper on Public Sector Procurement Reform in South Africa. Cape Town: Green Paper of the Department of Finance and Public Works. Rogerson, C.M. (1991). “Deregulation, Sub-Contracting and the ‘(In) Formalisation’ of Small-Scale Manufacturing.” In Preston-Whyte, E. and Rogerson, E. (eds). South Africa’s Informal Economy, Cape Town, Oxford University Press, 365-385. Rogerson, C.M. (1994). “Micro-enterprises in South Africa.” In Hirschowitz, R., Orkin, M., Rogerson, C.M. and Smith, D. (eds). Micro-enterprise Development in South Africa. Report prepared for CASE and the European Union, Johannesburg, 14-37. Rogerson, C.M. (1996). Rethinking the Informal Economy of South Africa. Development Paper 84. Halfway House: Development Bank of Southern Africa . Rogerson, C.M. (1997). SMMEs and Poverty in South Africa. Input report for the National Project on Poverty and Inequality, Johannesburg. Rogerson, C.M. (1998). Investment-led Entrepreneurship Development. Report prepared for the Spatial Development Initiatives Technical Team/Development Bank of Southern Africa Specialist Research Unit. Halfway House: Development Bank of Southern Africa. Rogerson, C.M. (1999). “Small Enterprise Development in Post-apartheid South Africa: Gearing up for Growth and Poverty Alleviation.” In King, K. and McGrath, S. (eds). Enterprise in Africa: Between Poverty and Growth. London, IT Publications, 83-94.
110
Rogerson, C.M. and Reid, K. (1997). Towards a Framework for Rural Small Business Support. Discussion Paper. Pretoria: Ntsika Enterprise Promotion Agency. Rogerson, C.M. and Rogerson, J.M. (1997). “The Changing Post-apartheid City: Emergent Black-owned Small Enterprises in Johannesburg.” Urban Studies, 34(1), 85-103. Ruiters, A., China, A. and Spicer, S. (1994). The Functioning of Micro-enterprises and the Support Services Available to them in the Western Cape. Unpublished report for the EC Micro-enterprise Sector Study, Cape Town. Sawaya, A. (1995). Black Manufacturing Small and Medium-sized Enterprises in the Western Cape: An Analysis of Success Factors. Unpublished MCom dissertation, University of Cape Town. Sherburn, T., Hanage, R. and Brophy, D. (1998). Feasibility of a Regional Supply Office (RSO) in the Western Cape. Unpublished report for the Department for International Development and the Cape Metropolitan Council. TaskGro. (1993). Policy Proposals for Small, Medium and Micro Enterprise Development. Report prepared for the Friedrich Ebert Stiftung, Johannesburg. Tendler, J. (1994). Strengthening the Capabilities of (Largely Informal) Manufacturing Micro/Small Enterprises. Unpublished paper prepared for the Workshop on Small, Medium and Micro Enterprise Development and Financing, 2nd November, Verwoerdburg. Visser, K. (1999). The export and growth potential of small and medium-sized enterprises in the clothing industry. Unpublished report for the Centre of African Studies, University of Edinburgh. WESGRO. (1998). The Western Cape Economy on the Way Towards Global Competitiveness with Social Stability: Review of Western Cape’s Economic Performance. Prepared for the Provincial Legislature, WESGRO, Cape Town. Wood, A. (2000). When and Why Does Globalisation Increase rather than Reduce Labour Market Inequalities in Developing Countries? Paper presented at the 2000 TIPS Forum, September, Johannesburg.


![Erik van Seventer Program Manager Biobased Economy ... EU BRIDGE RTO's EvS.pdfMicrosoft PowerPoint - Ppt0000007 [Alleen-lezen] Author: WEEN0001 Created Date: 5/29/2013 4:48:57 PM ...](https://static.fdocuments.net/doc/165x107/601b4c9db691c678d96f00db/erik-van-seventer-program-manager-biobased-economy-eu-bridge-rtos-evspdf-microsoft.jpg)


