Economics of Nuclear Power: Construction Costs and Safety ...
138
HAL Id: tel-01307916 https://pastel.archives-ouvertes.fr/tel-01307916 Submitted on 27 Apr 2016 HAL is a multi-disciplinary open access archive for the deposit and dissemination of sci- entific research documents, whether they are pub- lished or not. The documents may come from teaching and research institutions in France or abroad, or from public or private research centers. L’archive ouverte pluridisciplinaire HAL, est destinée au dépôt et à la diffusion de documents scientifiques de niveau recherche, publiés ou non, émanant des établissements d’enseignement et de recherche français ou étrangers, des laboratoires publics ou privés. Economics of Nuclear Power : Construction Costs and Safety Regulation Lina Escobar To cite this version: Lina Escobar. Economics of Nuclear Power: Construction Costs and Safety Regulation. Economics and Finance. Ecole Nationale Supérieure des Mines de Paris, 2014. English. NNT : 2014ENMP0093. tel-01307916
Transcript of Economics of Nuclear Power: Construction Costs and Safety ...

HAL Id tel-01307916httpspastelarchives-ouvertesfrtel-01307916
Submitted on 27 Apr 2016
HAL is a multi-disciplinary open accessarchive for the deposit and dissemination of sci-entific research documents whether they are pub-lished or not The documents may come fromteaching and research institutions in France orabroad or from public or private research centers
Lrsquoarchive ouverte pluridisciplinaire HAL estdestineacutee au deacutepocirct et agrave la diffusion de documentsscientifiques de niveau recherche publieacutes ou noneacutemanant des eacutetablissements drsquoenseignement et derecherche franccedilais ou eacutetrangers des laboratoirespublics ou priveacutes
Economics of Nuclear Power Construction Costs andSafety Regulation
Lina Escobar
To cite this versionLina Escobar Economics of Nuclear Power Construction Costs and Safety Regulation Economicsand Finance Ecole Nationale Supeacuterieure des Mines de Paris 2014 English NNT 2014ENMP0093tel-01307916
$$ampamp$()$++++$$
MINES ParisTech Centre de Eacuteconomie Industrielle CERNA
60 Boulevard Saint Michel Paris France
$$ampamp () ++++
$$
Eacutecole doctorale ndeg 369 Economie Organisation Socieacuteteacute
preacutesenteacutee et soutenue publiquement par
Lina Patricia ESCOBAR RANGEL
10 Novembre 2014
Economics of Nuclear Power Construction Costs and Safety Regulation
LrsquoEacuteconomie de lrsquoEacutenergie Nucleacuteaire Coucircts des Construction et Reacutegulation
de la Sucircreteacute $
$
Doctorat ParisTech
T H Egrave S E pour obtenir le grade de docteur deacutelivreacute par
lrsquoEacutecole nationale supeacuterieure des mines de Paris
Speacutecialiteacute ldquo Eacuteconomie et Finance rdquo
$
Directeur de thegravese Franccedilois LEVEQUE $
T H Egrave S E
Jury M Jan KEPPLER Professeur deacuteconomie CGEMP Universiteacute Paris - Dauphine Preacutesident M Nicolas BOCCARD Professeur deacuteconomie Universitat de Girona Rapporteur M Benoit SEVI Professeur deacuteconomie UPMF Universiteacute de Grenoble Rapporteur M Franccedilois LEVEQUE Professeur deacuteconomie CERNA Ecole des Mines de Paris Examinateur
MINES PARIS TECH
Economics of Nuclear Power
Construction costs and Safety
Regulation
by
Lina Escobar Rangel
A thesis submitted in partial fulfillment for the
degree of Doctor of Philosophy in Economics
in the
CERNA - Center for Industrial Economics
May 2015
ldquoThere are things known and there are things unknown and in between are the doors of
perceptionrdquo
Aldous Huxley
MINES PARIS TECH
Abstract
CERNA - Center for Industrial Economics
Doctor of Philosophy in Economics
by Lina Escobar Rangel
This thesis studies the role of the construction costs and safety regulation on nuclear
power competitiveness The analysis of the construction costs is based on the use of the
actual data coming from the american and french nuclear fleet In particular we study
different channels from which cost reductions might arise We show that standardization
is a key criterion for the economic competitiveness of nuclear power first because the
positive learning effects are conditional to the technology this means that cost reductions
will arise only if the same type of reactor is built several times but also because it allows
to reduce the cost indirectly through shorter construction lead-times In the analysis of
the role of safety regulation we first asses the effect of the latest major nuclear accident
(ie Fukushima Dai-ichi) in the probability of occurrence of such an event and then the
effects of the uncertainty regarding how safety care reduce the probability of a nuclear
accident in setting safety standards under moral hazard and limited liability We find
that the standard will be stricter when the regulator is optimistic in the safety care
effectiveness to reduce the risk of an accident but simultaneously this policy might
induce no compliance of the most inefficient operators
Acknowledgements
I would like to express my gratitude to my supervisor Professor Francois Leveque whose
expertise added considerably to my graduate experience He has guided me over these
three years rigorously and patiently I would like to thank for his constant interest in
my work and for encourage me throughout my thesis
Besides my advisor I would like to thank other senior members of Center for Industrial
Economics (CERNA) in particular to Yann Meniere for the assistance and advices he
provided to me during the doctoral workshop Likewise I would also want to thank
Pierre Fleckinger for his comments and suggestions that were key to write the last
chapter of this thesis
I must also acknowledge Sesaria Ferreira for her assistance with all the administrative
procedures but also for helping supporting and listening to me in particular when
things went wrong
I thank my fellow colleagues in CERNA Michel Berthelemy Justus Baron Marine
Lefort Damien Dussaux Charlene Cosandier and more recently Carlotta Mariotto
Jiekai Zhang and Btissam El Bahraoui for their useful comments in the doctoral work-
shop but specially for making these years an enriching and pleasant experience
I would also like to thank my colombian friends who became my family and were the
most precious company here in Paris Diego Milanes Paula Arias Fabio Dominguez
John Mauro Perdomo Hernan Perez and David Espinosa
Last but not the least I would like to thank my family my lovely parents Jairo and
Esperanza my sister Daniela and my brother Oscar for their love their words and
unconditional support I dedicate this thesis to them
iii
Preface
This PhD thesis is embedded in a research program called The new economics of nuclear
energy directed by Francois Leveque and financially supported by Electricite de France
EDF This project aimed to study the challenges of nuclear energy through an economic
perspective focusing on three research axes innovation competitiveness and industrial
organization This thesis tacked the second issue by studying the construction costs and
nuclear safety regulation This document presents four papers that have been presented
in seminars and conferences The opinions expressed in this document do not necessarily
coincide with those of EDF
Chapter 1 is entitled How Fukushima Dai-ichi core meltdown changed the probability of
nuclear accidents and was co-written with Francois Leveque This paper was presented
in the seminar organized by the Finance for Energy Market Research Center FIME
at the Institut Poincare in Paris (22 March 2013) at the 20th EAERE conference in
Toulouse France (26-29 June 2013) and was accepted and published in Safety Science
Volume 64 on April 2014
Chapter 2 Revisiting the Cost Escalation Curse of Nuclear Power New Lessons from
the French Experience also co written with Francois Leveque was submitted and is
currently under revision to be published in Economics of Energy and Environmental
Policy This paper was presented at the Conference of Energy Markets organized by
Toulouse School of Economics in Toulouse France (17-18 January 2013) and afterwards
at the IAEE International Conference held in Daegu South Korea (16-17 June 2013)
Chapter 3 Nuclear reactorsrsquo construction costs The role of lead-time standardization
and technological progress is co-authored with Michel Berthelemy This paper has been
presented in the Seminaire de recherches en economie de lrsquoenergie held in Paris France
(12 February 2014) in the Environmental Economics Lunch Seminar organized by Paris
School of Economics (6 March 2014) the International WPNE Workshop on Project and
Logistics Management in Nuclear New Build organized by the OECD Nuclear Energy
Agency (NEA) in Paris France (11 March 2014) the 3rd Mannheim Energy Conference
(May 5-6 2014) and the IAEE International Conference held in New York US (16-18
June 2014) This paper was accepted to be published in Energy Policy
Chapter 4 is called Setting optimal safety standards for nuclear operators subject to un-
certainty moral hazard and limited liability at the moment it has not been yet presented
in any conference
iv
Contents
Abstract ii
Acknowledgements iii
Preface iv
List of Figures viii
List of Tables ix
General Introduction x
01 Context x
02 The risks of nuclear power and the probability of major accident xii
03 The cost escalation curse in the construction of new nuclear power plants xiii
04 Nuclear safety regulation xv
05 Methodological approach structure and contribution of this thesis xviii
1 How Fukushima Dai-ichi core meltdown changed the probability ofnuclear accidents 1
11 Introduction 1
12 Literature review 2
13 How to properly estimate the expected frequency of a nuclear accidentusing theoretical probability and past observations 4
131 Data 5
132 Models 8
14 Poisson Exponentially Weighted Average (PEWMA) model 14
141 PEWMA Results 16
142 Arrival rate estimates from 1952 to 2012 17
15 Conclusion 19
2 Revisiting the cost escalation curse of nuclear power New lessonsfrom the French experience 21
21 Introduction 21
22 Data and Model 28
221 French construction cost escalation 28
222 Model and data 30
v
Contents vi
223 Multicollinearity and Principal Component approach 33
23 Results 36
24 Conclusion and Policy Implications 40
3 Nuclear reactorsrsquo construction costs The role of lead-time standard-ization and technological progress 43
31 Introduction 43
311 Toward a nuclear renaissance 43
312 Existing literature on nuclear power plants construction costs andlead-times 45
313 The contributions of this paper to the economic literature and thenuclear energy policy debate 47
32 Model main hypothesis about learning opportunities and data 48
321 Model for construction costs and lead-times in nuclear power 48
3211 Hypotheses on the role reactorrsquos design standardization 50
3212 Hypotheses on learning by doing 50
3213 Hypotheses on leaning by searching 51
322 Data 52
33 Model specifications and results France versus the US 56
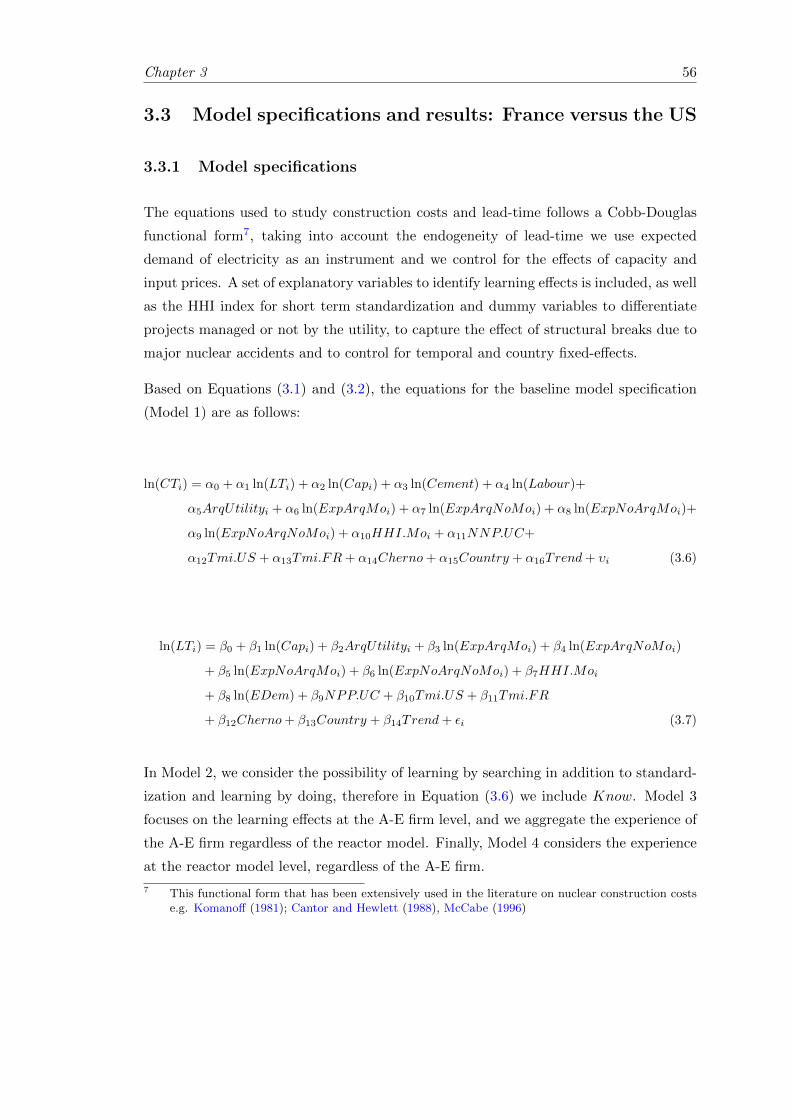
331 Model specifications 56
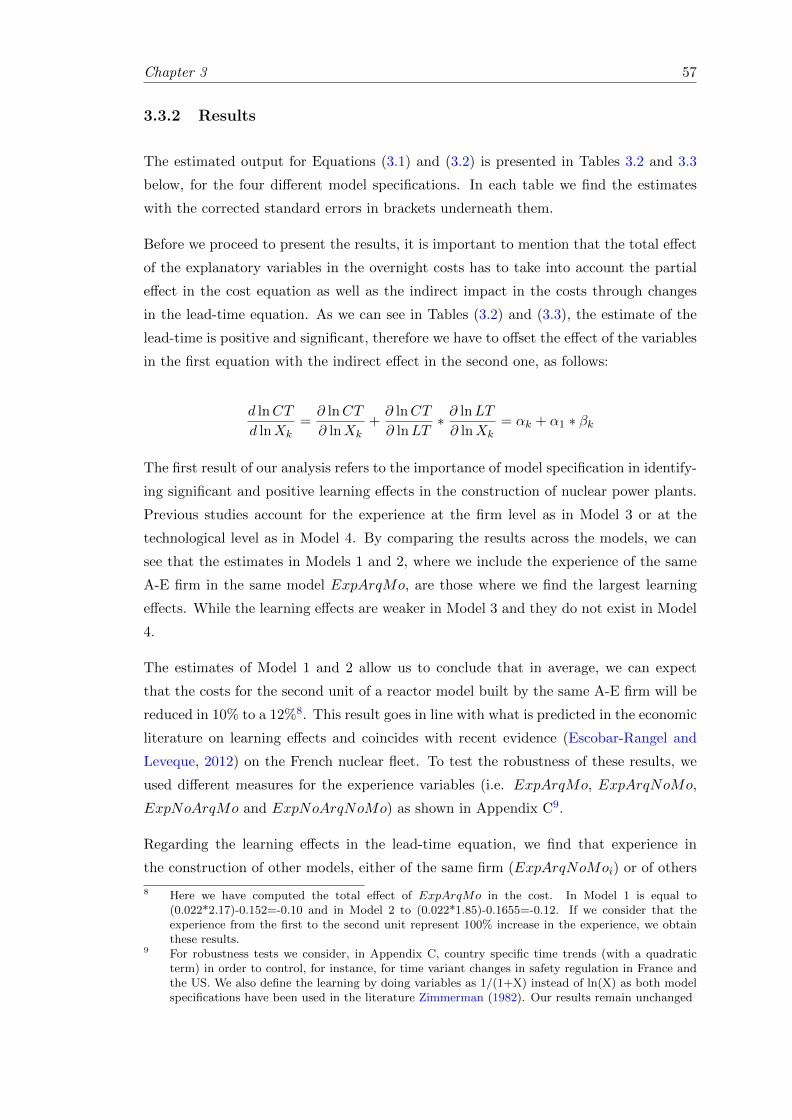
332 Results 57
34 Nuclear reactors lead-time Insights from other OECD countries 61
341 Data and Model 62
35 Conclusion 64
351 Policy implications for nuclear new-build programs 65
352 Paths for future research 67
4 Setting optimal safety standards for nuclear operators subject to un-certainty moral hazard and limited liability 69
41 Introduction 69
42 The Model 74
421 Benchmark The regulator knows β 78
43 Imprecise probabilities and robust optimization 82
431 Worst-case approach 82
432 Regret robustness approach 85
44 Conclusion 89
5 General Conclusion 93
51 Conclusion about Construction Costs 94
52 Conclusion about Safety Regulation 98
A Cour des Comptes Actual Construction Costs for the French NuclearFleet 101
B Linear models for the Construction Costs 102
C Alternative model specifications 104
Contents vii
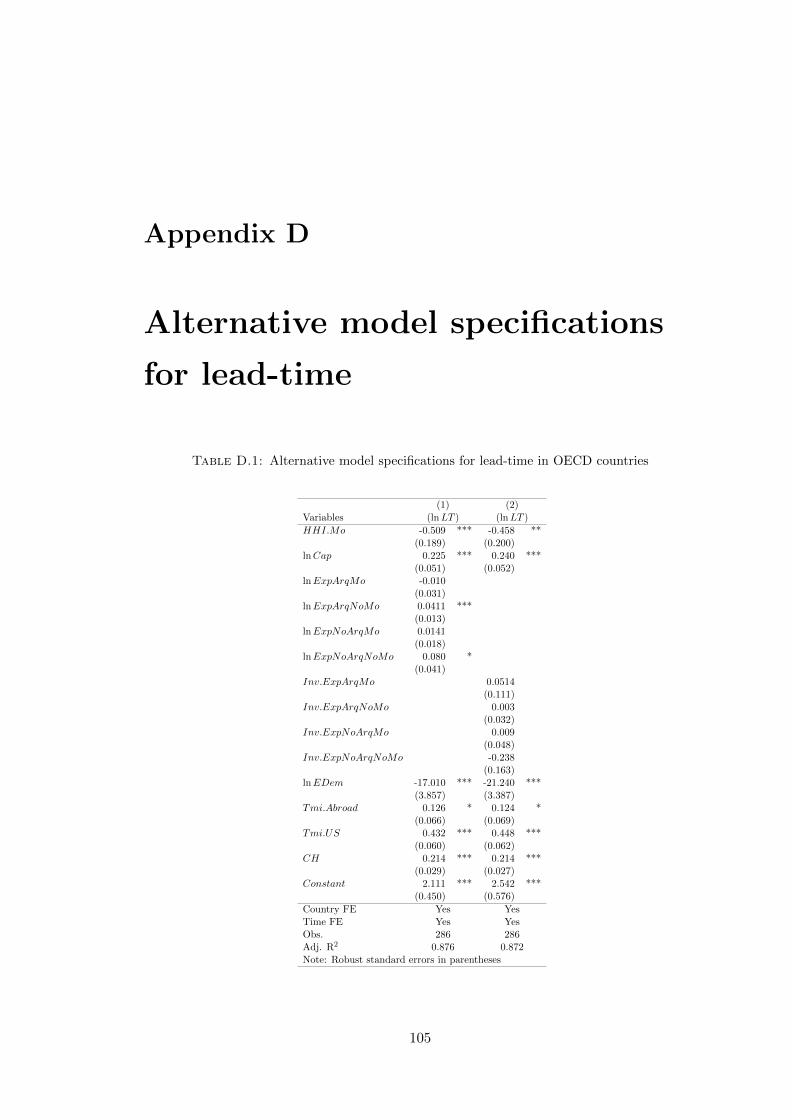
D Alternative model specifications for lead-time 105
E List of nuclear reactor models by manufacturer in France and the US106
F Operatorrsquos best response 107
Bibliography 109
List of Figures
11 Core Damage Frequency Industry Average Trend 3
12 International Nuclear and Radiological Event Scale 5
13 Major nuclear accidents reactors and operating experience 1955-2011 7
14 Histogram for nuclear accidents 1952-2011 8
15 Cumulate frequency (AccidentsReactorYears) for nuclear accidents 1952-2011 8
16 Bayesian updating with Poisson-Gamma model 12
17 Poisson-Gamma vs PEWMA for CMD 18
21 Overnight costs for the US Nuclear Fleet e 2010MW 24
22 Evolution of French Nuclear Power Fleet by palier 29
23 Grubler vs Cour de Comptes construction costs 30
24 Cour de Comptes construction cost by palier and type 31
25 Labor cost index (ICHT) and Price index for France =100 in 1973 33
31 Nuclear reactorsrsquo overnight construction costs in the US and France 53
32 Nuclear reactorsrsquoconstruction lead-time in the US and France 54
33 Nuclear reactorsrsquo construction lead-time in OCDE countries 63
41 Operatorrsquos best response to different regulatory policies (sq) 79
42 Difference in the safety standards set taking worst-case and regret robust-ness approaches 88
viii
List of Tables
11 INES Events 6
12 Poisson with constant arrival rate (1952-2011) 10
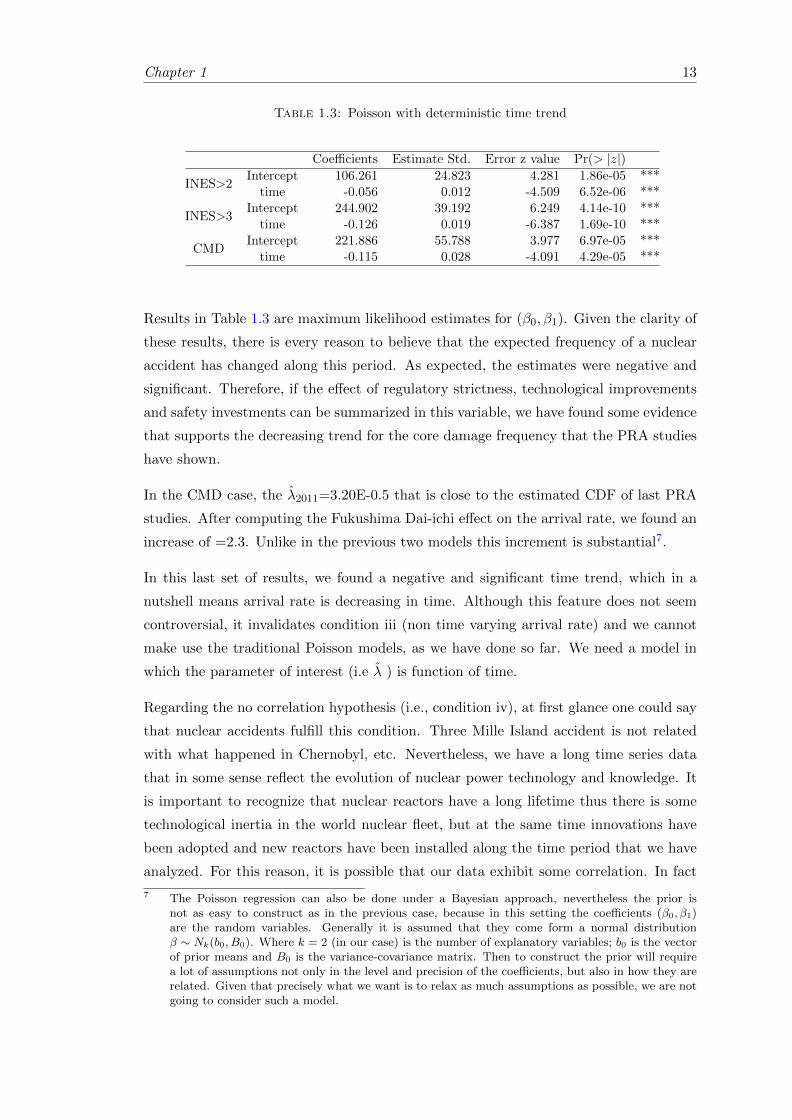
13 Poisson with deterministic time trend 13
14 PEWMA Estimates for Prior a=1 b=3500 17
15 Test for reduction to Poisson H0 ω = 1 17
16 Summary of results 19
21 First Generation of French Reactors 28
22 Descriptive statistics 34
23 Correlation Matrix 34
24 Linear regression estimates 35
25 VIF for explanatory variables 35
26 Loadings and roots 36
27 Principal Component Regression Results 37
31 Descriptive statistics 55
32 Estimation output of Equations (31) and (32) 58
33 Estimation output of Equations (31) and (32) 59
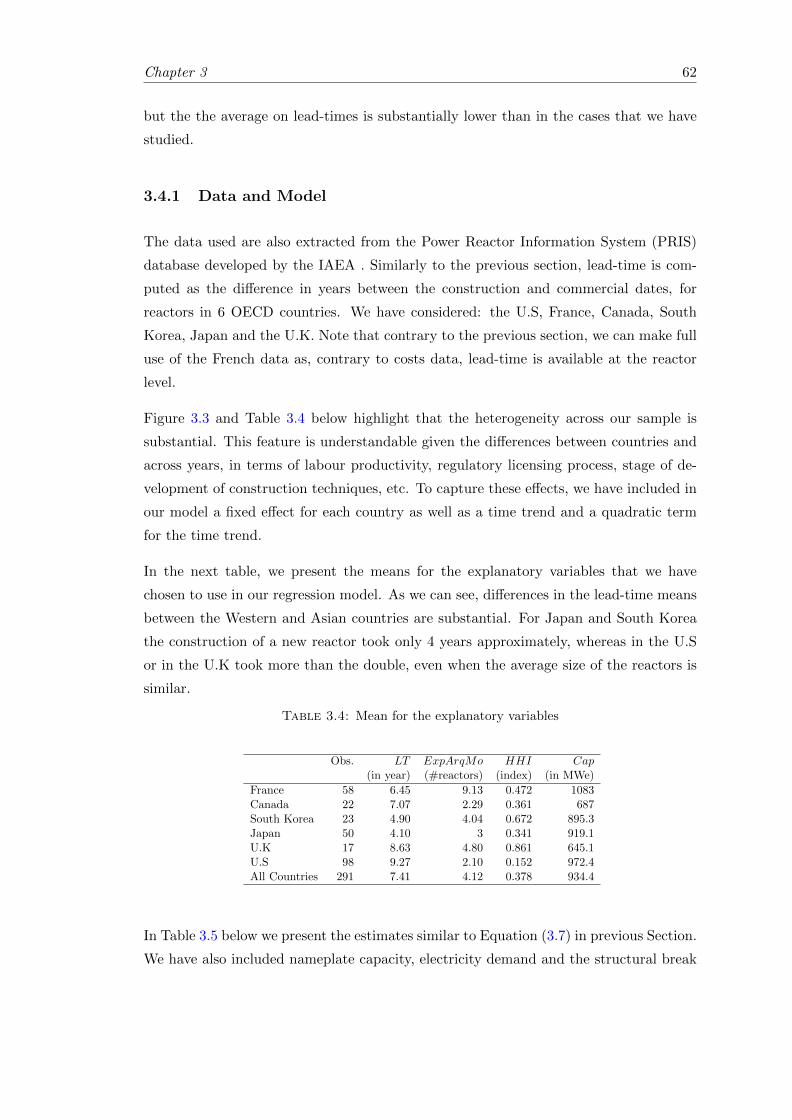
34 Mean for the explanatory variables 62
35 Regression results for lead-time with experience and the HHI index 64
A1 Data from the Cour des Comptes report 101
B1 Estimates for Model 2 102
B2 VIF for Model 2 103
B3 Estimates for Model 3 103
B4 VIF for Model 3 103
B5 Estimates for Model 4 103
B6 VIF for Model 4 103
C1 Alternative model specifications 104
D1 Alternative model specifications for lead-time in OECD countries 105
E1 List of nuclear reactor models by manufacturer in France and the US 106
ix
General Introduction
01 Context
On March 11 2011 the coast of Tohuku the region located at the northeast of Japanrsquos
main island was devastated by a series of tsunami waves resulting after a 90 earthquake
This disaster affected several reactors in different nuclear power stations on the Pacific
coast Fukushima Dai-ichi was the most impaired nuclear plant four of its six units
were severely damaged and three reactors suffered core meltdowns followed by massive
releases of radioactive material outside their containment structures Undoubtedly this
has been one of the most severe accidents in the history of nuclear power for civil uses
Briefly the timeline of the events that lead to the core melt at Fukushima Dai-ichi
happened as follows after the earthquake reactors 1 to 3 shouted down automatically
following the japanese safety protocols The emergency generators were activated to
power the cooling systems in order to keep below the melting point the fission products
that were in the fuel rods The tsunami 14 meters waves arrived 50 minutes after the
earthquake and overpassed the unitrsquos sea walls which had 101 meters only The sea
water flooded the room where the emergency generators were located and they failed
to power the cooling systems Once the batteries of the active cooling systems ran out
the reactors began to heat up As workers struggled to supply power to the reactorsrsquo
cooling systems and control rooms multiple hydrogen-air chemical explosions occurred
from 12 March to 15 March
As soon as the images of this terrible catastrophe were broadcasted worldwide they
revived the memories of the core melt at Chernobyl in Ukraine in 1986 and materialized
the hazards associated with the operation of a nuclear power plant After the accident
the reactions from both the nuclear industry and anti-nuclear groups were swift As
expected this accident deepened the divergence in their views regarding the role that
nuclear power can play in the worldrsquos energy production But beyond the passionate
1 For further details of the affected reactors hit by the earthquake and tsunami see Phillip Lipscyand Incerti (2013)
x
General Introduction xi
views of these groups the debate following after Fukushima Dai-ichi accident raised
important issues that put into question the convenience of nuclear power both in safety
and economical terms
Paradoxically Fukushima Dai-ichi accident happened in a period when after a long
time prospects of nuclear deployment were positives Throughout the 90s the con-
struction of new reactors had stagnated and the progressive aging of the fleet worldwide
seemed to indicate the inevitable narrowing of nuclear powerrsquos share in the worldrsquos en-
ergy production However since about 2001 the interest for nuclear power revived In
fact the term nuclear renaissance appeared in the energy policy debate because many
countries gave an important role to nuclear power in their agendas with projections
for new build similar to or even exceeding those of the early years of nuclear power
For instance before the accident occurred 159 reactors were planned to be constructed
around the world (WEC 2012) which would have meant an addition of 178123 MWe
(ie 47 of the present capacity)
The renewed interest in nuclear power was not fortuitous on the contrary it appeared as
a solution to multiples concerns The high oil prices registered in 2000 and the fact that
much of the oil and gas production is located in politically unstable countries recalled
the importance of reducing the dependence of fossil fuels and secure the energy supply
Given that nuclear power uses an abundant mineral (uranium) in the earthrsquos crust made
it attractive from an energy security standpoint In addition the growing awareness of
the possible damages linked with climate change led to the implementation of different
policies aimed to reduce CO2 emissions Although most of the attention has been focused
in renewables it was acknowledge that nuclear power is the only technology that can
provide base load electricity without carbon emissions (See Nuttall (2005) Joskow and
Parsons (2009) Kessides (2012))
Unquestionably the accident meant a set back in terms of public perception about
nuclear safety and induced a revision of the forecast of nuclear power expansion in many
countries The clearest example of how this accident triggered the political pressure
against nuclear power was the decision to accelerate the nuclear phase-out in Germany
Just a couple of months after the accident the Chancellor Angela Merkel decided to
accelerate the phase-down and to move the shut down deadline to 2022 which reversed
the decision that was taken one year before when the life-time extension of nuclear
power up to 20382 was granted
This accident marked a breaking point in nuclear history however the effect of Fukushima
Dai-ichi in new nuclear builds is yet to be address According Power Reactor Informa-
tion System (PRIS) of the International Atomic Energy Agency (IAEA) 62 new reactors
2 See Edenhofer and Bruckner (2012)
General Introduction xii
were under construction in 2011 and in 2014 there are 72 reactors being built Although
this current level of new built is not as high as it was expected before the accident it
represents a record for nuclear industry and shows that public opinion is not the only
barrier that nuclear power faces today For the above the materialization of the nuclear
renaissance in those countries that still have a favorable opinion of nuclear power will
depend in some extent on the responses that nuclear industry gives to the issues and
challenges raised after this accident
02 The risks of nuclear power and the probability of major
accident
The first issue for nuclear power development reemerged right after the accident The
possibility of a core melt down and the harm that such an event might provoke is the
reason why nuclear power has been perceived as a latent hazard and has had to struggle
with public opposition in many countries At that moment perhaps one of the subjects
that raised more controversy in the public debate was how likely nuclear meltdowns could
occur Despite that this issue seems only a matter of applying a statistical formula after
Fukushima Dai-ichi supporters and opponents to nuclear power claimed diametrically
opposite things
On the one hand nuclear industry claimed that Fukushima Dai-ichi core melts were the
result of an unpredictable and very rare situation they argued that core melts are not
likely to occur and they claimed that new designs can resist natural events of similar
magnitude of those that hit Japan This point of view was supported with the results
of the Probabilistic Risk Assessments (PRA) that have been done in different reactors
around the world For instance the report EPRI (2008) estimated that the average core
melt frequency for the US nuclear fleet is equal to 20E-5 which means 1 core melt
every 50000 reactor years or equivalently 1 core melt each 1000 years for a fleet of 500
reactors in operation (today worldrsquos nuclear fleet has around 430 reactors in operation)
On the other hand nuclear opponents claimed that the observed frequency is higher
than the (theoretical) expected frequency coming from the PRAs Just dividing the
total number of operating hours of all civilian nuclear reactors around the world that
is approximately 14500 reactor-years by the number of nuclear reactor meltdowns that
have actually occurred (ie 4 nuclear meltdowns 1 at Chernobyl and 3 at Fukushima)
translates into one major accident every 3625 reactor years Which is substantially
greater than what the nuclear industry suggested
General Introduction xiii
In this context how to assess properly the probability of a major accident is an important
question for nuclear power development not only to clarify this debate but also because
it will allow a proper management of the risk This means that societies can be better
informed not only about the hazards that nuclear power entails but also on how likely
is that major accidents occur Nuclear regulators will be able to set attainable and
coherent goals in terms of the accepted risk level below which nuclear power plants
should operate In addition operators can allocate better the safety investments aiming
to reduce the probability of major accidents and finally it could also be helpful to
determine insurance policies
03 The cost escalation curse in the construction of new
nuclear power plants
The second concern raised after Fukushima Dai-ichi accident is related with the safety
investments that might have to be done to allow reactors under operation to resist
natural aggressions as those that impacted the Japanese nuclear fleet But even more
important for the future development of nuclear power are the consequences that this
accident might have in terms of construction costs for new reactors Investment costs
are the main driver3 of nuclear electricity generating costs thus any unexpected and
significant increase of the expenses on the construction will undermine the profitability
of a new build It is possible to think that the lessons learned after Fukushima Dai-ichi
may encourage nuclear vendors to include other safety features safety authorities might
impose stricter licencing rules and greater public opposition to installing new nuclear
power plants can result in an increase in the construction costs
The potential effect of Fukushima Dai-ichi in the costs of new reactors worsen the doubts
about the possibility of building nuclear power plants at a reasonable cost It is impor-
tant to mention that these concerns began to emerge before the accident due to the con-
tinuous revisions in the costs estimates for new reactors in the US Taking into account
the changes made by utilities in the application forms filled for the Nuclear Regulatory
Commission the cost expectation of an AP1000 reactor passed from US$2000 in 2003
(See Base case in Parsons and Du (2003)) to US$4000 per installed kilowatt in 2009
(See Parsons and Du (2009) and Rosner and Goldberg (2011a))
These concerns were also supported by the press releases announcing delays and im-
portant cost overruns in the construction of the first of a kind Generation III+ EPR4
3 According to the IEA (2010) the share of the capital costs in the leveled cost of electricity in nuclearpower is between 60 to 80
4 European Pressurized Reactor
General Introduction xiv
reactors in Europe In Finland the construction of Olkiluoto 3 started in 2005 and was
supposed to be ready in 2009 This delay will be by far failed the commercial operation
of this reactor was expected to be in 2016 The most recent news informed that it will
be in 20185 Regarding the construction costs of the EPR at Flamanville unit in France
the continuous increases in the costs make the situation alarming The first estimate was
e33 billion in 2005 and passed to e6 billion in 2011 The most recent press release in
2012 announced a total cost of e85 billion Not to mention that Flamanville 3 was ex-
pected to start commercial operation in 2013 but due to delays during the construction
is expected now to start up in 2016
As if this were not enough the doubts about nuclear power competitiveness were also
supported by what has been registered in construction of the US and French nuclear
fleet For the former it is possible to find a 7 times difference of the overnight cost6
expressed in Me(2010)MW and collected by Koomey and Hultman (2007) for the first
and last installed nuclear reactors For France Grubler (2010) found that the difference
between the construction costs of the units installed in 1974 and those constructed after
1990 is 35 times For all these reasons the escalation of the construction costs of new
reactors has been seen as a curse for nuclear industry
The economic literature about nuclear power construction cost has not provided a clear
cut answer to explain the main drivers of the new buildrsquos costs overruns and how is it
possible to reduce them Most of the studies have used primarily US construction costs
data due to the lack of comparable data coming from other countries therefore the re-
sults are restricted to the american case It is generally accepted that the heterogeneity of
the nuclear US fleet the longer lead-times that took to construct bigger reactors and the
closer regulatory monitoring after Three Mile Island accident (Zimmerman (1982)David
and Rothwell (1996) Rothwell (1986) Cantor and Hewlett (1988)McCabe (1996) and
Cooper (2012)) were the main elements that explain the substantial increase in the costs
per MWe installed
The cost assessment done by Grubler (2010) for the french nuclear fleet concluded that
although the French nuclear fleet was constructed under a centralized industrial structure
and it has a more homogenous nuclear fleet compared with the US fleet it suffered of
forgetting by doing Making allusion to the fact that while EDF accumulated experience
nuclear construction costs per unit of capacity have been increasing instead of decreasing
5 See httpwwwhelsinkitimesfifinlandfinland-newsdomestic
11836-olkiluoto-3-to-be-ready-in-2018html6 Overnight cost includes the investments linked with site preparation and construction but it ex-
cludes financing expenses Therefore it shows the cost of the plant as if it had been fully built inone night
General Introduction xv
In this context it has been argued that nuclear power is characterized by increasing
investment costs and it is inevitable to build a new reactor without cost overruns and
delays However in 2012 the actual construction costs for the French nuclear fleet were
published in the Cour des Comptes report and by using this new information it is
possible to find that the cost escalation computed by Grubler (2010)7 was not as severe
as argued In fact the ratio between the last and the first reactor installed in France
using Grublerrsquos estimates is 3 while by taking the actual construction costs is 14 This
difference suggests that there must be a way to curb the construction costs of nuclear
reactors Using the new information coming from the Cour des Comptes report is key
to identify which have been the factors that allowed to ease the cost escalation in the
construction of new nuclear power plants in France compared with what happened in
the US
Nowadays determine the main drivers of the construction costs of new reactors and
the possible sources of cost reductions is of paramount importance for nuclear industry
As mentioned before currently there are 72 reactors under construction in 14 different
countries8 this is quite an achievement for nuclear power given that level of new build
in 2014 has not been observed since 1987 It is likely that the success of the projects
under construction in terms of meeting the schedules and budgets will represent a
step towards the materialization of the nuclear renaissance because it will give a green
light for further deployment of nuclear power While if this projects repeat the errors
of the past this might lead investments to other competing energy technologies which
have shown decreasing costs For instance Lindman and Soderholm (2012) found that
the kW from onshore wind farms decreases by more than 10 each time the installed
capacity doubles In the same direction Isoarda and Soria (2001) and C Yu and Alsema
(2011) have identified significant learning effects in the photovoltaic industry result that
is confirmed by the dramatic reductions in the underlying costs and market prices of
solar panels in the last years
04 Nuclear safety regulation
One last issue that also came as a result of Fukushima Dai-ichi accident is the role of
safety regulation as an effective way to prevent these events As described above the
height of tsunami waves was the cause of the flood that made impossible to run the
emergency generators to cool down the reactors that eventually led to the core melts
7 The costs assessment done by Grubler (2010) did not use the actual construction costs but someestimations based on EDF financial statements
8 See the list published by the World Nuclear Association (WNA) httpworld-nuclearorg
NuclearDatabaserdresultsaspxid=27569ampExampleId=62
General Introduction xvi
Right after the accident it was somehow spread in the media that a tsunami of such
magnitude was a surprise and it was not predictable therefore the whole situation could
be considered as a black swan Nevertheless different nuclear safety experts carried out
investigations after the accident and discovered that the Japanese safety authority knew
that similar tsunamis had happened in the past and it was possible to witness them
again (see Gundersen (2012) Wang et al (2013))
This revelation harmed the reputation of the safety authority and the laxity of the
Japanese nuclear regulator is now seen as the main cause of this accident (Leveque
2013) Indeed the investigation showed that it was never required to Tokyo Electric
Power Company (TEPCO) the operator of Fukushima Dai-ichi to back fitted the sea
walls even if they knew that it was likely to observe a violent tsunami in that region
Today it is possible to argue that upgrading the unitrsquos sea walls would have been much
cheaper than the costs of damages that the accident has caused However before the
accident the investment decision was not as clear cut as it might be seen now First
because even if the regulator knew that a tsunami of that magnitude was possible still
its probability was very small Second because the potential damages in case of an
event like this were highly uncertain Finally because it is hard to measure how the
sea wallrsquos upgrade would have reduced the probability of this accident In consequence
before the accident the costs of upgrading the walls could have been seen as unnecessary
thus harmful for the profitability of the company
Taking into account the above it is clear that safety regulation aside from preventing
nuclear accidents also plays its role in the economics of nuclear power Safety authorities
are in charge of determining and enforcing the acceptable risk level at which nuclear
power plants should operate However to attain the envisioned risk levels they can not
demand the first thing that comes to mind First because it might not be effective
to reduce the probability of an accident and second because it might be too costly
In economics this tension simply means that the regulators will have to identify the
standards that allow to reduce the risk of major accident in a cost-efficient way In
other words they have to determine the optimal balance between the marginal private
costs of providing safety and the social marginal benefits of achieving that level of safety
Although this balance between the costs and benefits of providing safety is also present
in other sectors like transport food drugs etc nuclear safety authorities have to deal
with several particularities First the damages left after an accident are huge and
its consequences are long-lasting For instance the preliminary cost estimates of the
Fukushima Dai-ichi accident are around 250 billion USD Schneider and Froggatt (2014)
claimed that 11 municipalities in Fukushima Prefecture covering 235 km2 will have to
undertake decontamination efforts not to mention the costs related with all the people
General Introduction xvii
that had to be relocated after the accident In the literature Shavell (1984) Kolstad
et al (1990) and Hansson and Skogh (1987) showed that when the magnitude of the harm
is huge as is the case of nuclear accidents liability rules although they are necessary to
provide incentives to exert safety care are not enough to achieve sufficiently high safety
levels
Second nuclear safety regulators have to monitor that operators comply with the re-
quirements established in the safety standards due to the unobservability of their ac-
tion (although this is not specific for nuclear power) In the economic literature Strand
(1994) Hiriart and Martimort (2004) Hiriart et al (2004) inter alia have shown that
this information asymmetry (moral hazard) means that it is not possible to enforce the
first best safety level at zero cost Therefore the challenge for nuclear safety authorities
is to be able to define a policy that induce the compliance of the safety standard as the
operatorrsquos optimal response
Finally another problem present in nuclear safety regulation is the epistemic uncer-
tainty regarding the probability of a major accident but in particular how safety care
can reduce it Nuclear regulators have some statistical tools as the PRA to evaluate
how operatorrsquos safety care translates into reductionsincreases in the probability of an
accident however the results coming from these techniques are random variables with
unknown distribution functions This last feature means nuclear regulators do not have
a single and precise probability measure when setting the safety standards but instead
they have some partial information (ie an interval of values coming from the PRA)
about the link between safety care and the probability of an accident
How to set optimal safety standards in the presence of all the particularities mentioned
above is an important challenge for nuclear power development In the first place be-
cause safety authorities have to be able to guarantee that nuclear facilities run under
the accepted risk level Second because safety standards are an effective way to comple-
ment liability rules and achieve higher safety levels Finally because it is in the interest
of both the society and the operator to avoid the damages linked with major nuclear
accidents
05 Methodological approach structure and contribution
of this thesis
All the issues described before make nuclear power a passionate subject and pose re-
search questions that are far from dull Specifically in this thesis we will try to give an
answer from a positive perspective to the following questions how to assess properly
General Introduction xviii
the probability of a nuclear accident which are the determinants of the nuclear con-
struction costs and the possible sources of reductions and finally how to set optimal
safety standards in the nuclear power sector taking into account the particularities of
major nuclear accidents To answer to these questions this thesis is composed by four
chapters that aim to study rigorously these three issues in order to derive conclusions
that shed some light in current debate but also that allow us to predict to the possible
trends in nuclear power development and help to shape future energy policies
Chapter 1 is entitle How Fukushima Dai-ichi core meltdown changed the probability of
nuclear accidents and was co-authored with Francois Leveque This chapter investigates
how to compute the probability of a nuclear accident by using past observations But
in particular how the observation of the last catastrophe at the Fukushima Dai-ichi
nuclear power plant changed the expected frequency for such events In this chapter we
aimed to answer these questions by using historical data and testing different statistical
models We have compared four Poisson models using three different definitions of
nuclear accidents from 1952 to 2012
Our results allow us to conclude that as the definition of accident takes into account
other events (ie not only the major nuclear disasters but also less serious accidents)
the independence assumption underlying the classical Poisson models is violated This
result called for a time-varying mean model such as the Poisson Exponentially Weighted
Moving Average (PEWMA) By using this last model we find a greater increase in the
risk of a core meltdown accident owing to the accident that took place in Japan in 2011
than the estimates that we obtained using the classic Poisson models
Chapter 2 is entitle Revisiting the Cost Escalation Curse of Nuclear Power New Lessons
from the French Experience and it was also co-written with Francois Leveque This
chapter studies the so called cost escalation curse that has affected the construction
of new nuclear power plants ever since the completion of the first wave in 1970 to the
ongoing construction of Generation III+ reactors in Europe As we have mentioned this
phenomenon has been studied for the US and it has been argued that the escalation
can partially be explained by a heterogeneous nuclear fleet which has made it difficult to
learn from experience The French nuclear power program has followed a standardization
strategy however previous cost assessments have also pointed to an increase in the
capital costs This observation implied that even in the best economic conditions cost
escalation is inherent to nuclear power
In this chapter we reexamine the drivers of cost escalation in France based on con-
struction costs taken from a recent report by the Cour des Comptes Using this new
information we find that the cost escalation observed in previous studies was lower
than argued Our results indicate that the scale-up resulted in more costly reactors
General Introduction xix
however we were not able to disentangle the effect of the technological change embedded
on bigger reactors from the effect of the increase in the size In parallel we find positive
learning effects but they were restricted to the same type of reactors (ie the construc-
tion cost of decrease as the experience in the same type increases) Finally we find
that those reactors with better safety performance were also more expensive This last
result suggests that safety concerns have played a role in the cost escalation observed in
France
Chapter 3 Nuclear reactorsrsquo construction costs The role of lead-time standardization
and technological progress is co-authored with Michel Berthelemy and complements the
previous chapter by analyzing the nuclear reactor construction costs and lead-times in
France and the United States We estimate a regression model for both the overnight
costs and construction time In this chapter we test the presence of standardization
gains in the short term and long term The former might arise when the diversity of
nuclear reactorsrsquo technologies under construction is low and the latter might arise as the
result of learning by doing that in this context means the experience in the construc-
tion of the same type of reactor In addition we study the effect of innovation in the
construction of new reactors by using priority patent data as a proxy for technological
progress
We find that overnight construction costs benefit directly from learning by doing but the
spillovers were only significant for nuclear models built by the same firm In addition we
show that the standardization of nuclear reactors has an indirect and positive effect in
the short run through a reduction in lead-time the latter being one of the main drivers
of construction costs Conversely we also explore the possibility of learning by searching
and find that contrary to other energy technologies innovation leads to construction
costs increases
Chapter 4 is entitle Setting optimal safety standards for nuclear operators under uncer-
tainty moral hazard and limited liability It examines the features of an optimal safety
regulatory policy under uncertainty about how safety care reduces the probability of
accident moral hazard and limited liability The regulatory policy consists in setting
a safety standard and choose a probability of inspection to the nuclear facilities After
the inspection the regulator can impose a fine in case the nuclear operator did not
comply with the safety standard The main objective of this paper is to characterize the
optimal regulatory policy that induce compliance by the operator when the regulator
does not know perfectly how the safety care level will reduce the probability of a nuclear
accident To tackle this issue we use robust optimization techniques worst case and
regret robustness
General Introduction xx
Our results suggest that under the most conservative approach ie when the regulator
minimizes the maximum expected costs the regulatory policy will be less strict than
when he is better informed On the contrary when the regulator attempts to mini-
mize regret the safety standard might be stricter but it also increases the risk of no
compliance
Finally Chapter 5 concludes This chapter outlines the main results of this PhD thesis
and links them with the challenges that nuclear power faces today In short we claim
that the development of nuclear power in the world will depend predominantly on
how the industry is able to curb the cost escalation For this reason nuclear vendors
should direct their innovation efforts not only on achieving better safety performance
(as they have done so far) but also on reducing the construction costs Countries with
ambitious nuclear power programs should adopt a standardization strategy by reducing
the technologies to be installed but also they have to determine which will be the pace
of technological change Finally nuclear regulators should concentrate their efforts in
fostering better safety performance levels within the operators through stricter operating
standards once the reactors guarantee that they have reached an acceptable ex ante risk
level
Chapter 1
How Fukushima Dai-ichi core
meltdown changed the probability
of nuclear accidents
11 Introduction
The triple core meltdown at Fukushima Dai-ichi power plant on March 11 2011 is the
worst nuclear catastrophe after Chernobyl in 1986 The substantial losses of this accident
have aroused in the public opinion an old age debate Is nuclear power safe Critics claim
that nuclear power entails a latent threat to society and we are very likely to witness
an accident in the near future Proponents say that the conditions that provoked the
Fukushima disaster were unlikely assert that new reactors can successfully face extreme
conditions and conclude that the probability of a nuclear accident is very low
In the media this debate is far from be clear For instance two months after the
Fukushima Dai-ichi meltdown a French newspaper published an article1 saying that
the risk of a nuclear accident in Europe in the next thirty years is not unlikely but on
the contrary it is a certainty The authors claimed that in France the risk is near to
50 and more than 100 in Europe
Their striking result comes from dividing the number of reactor explosions (one in Cher-
nobyl and 3 in Fukushima Dai-ichi) over cumulated experience (14000 reactor-years)
and multiplying this ratio by the number of reactors and 30 years So if we take 58
operative reactors in France we get 049 and if we consider 143 reactors in Europe we
1 Benjamin Dessus and Bernard Laponche June 3 2011 available at httpwwwliberationfr
politiques01012341150-accident-nucleaire-une-certitude-statistique
1
Chapter 1 2
obtain 122 hence their conclusion that a nuclear accident is a certainty in the European
Union
Although their methodology is essentially flawed since the figures they found are larger
than 1 the estimated frequency of a major accident reported by nuclear industry is not
very convincing neither According to a report issued by EPRI (2008) the probabilistic
risk assessment for the US nuclear fleet estimates an average expected rate of core
meltdown of the order of 20E-5 This figure means that in average we can expect one
accident per 50000 reactor years which seems quite optimistic with respect to what has
been observed in the history of nuclear power As of today one accounts approximately
14500 operating years of nuclear reactors and 10 core meltdowns This implies an
observed frequency of 1 accident per 1450 reactor years which is a higher rate than
what is predicted by the probabilistic risk assessments (PRA hereafter)
From this debate we can conclude that assessing properly the probability of a nuclear
accident with available data is key to shed light in the risks that nuclear power will entail
on tomorrow For this reason the main objective of our paper is to discuss different
statistical approaches to estimate the expected frequency of nuclear accidents Our
results suggest that although the Poisson model is the most used for addressing this
problem it is not suitable when the independence assumption is violated In such cases
a time-varying mean model like a Poisson Exponentially Weighted Moving Average
(PEWMA) is more suitable to estimate the expected frequency of core meltdown
The remainder of this paper is structured as follows Section 12 outlines the literature
about nuclear risk assessment Section 13 investigates how to estimate the expected
frequency and compute the probability of a nuclear accident using successively a fre-
quentist and a Bayesian approach Section 14 presents the PEWMA model and its
results Section 15 concludes
12 Literature review
It is possible to distinguish two approaches to assess the probability of nuclear accidents
PRA models and statistical analysis PRA models describe how nuclear reactor systems
will respond to different initiating events that can induce a core meltdown after a se-
quence of successive failures This methodology estimates the core damage frequency
Chapter 1 3
(CDF hereafter)2 based on observed and assumed probability distributions for the dif-
ferent parameters included in the model
The use of PRA in commercial reactors is a common practice in the US because the
results are a key input for the risk-based nuclear safety regulation approach (Kadak and
Matsuo 2007) The Nuclear Regulatory Commission (NRC hereafter) has been doing
PRA studies since 1975 when the so-called WASH-1400 was carried out This first
study estimated a CDF equal to 5E-05 and suggested an upper bound of 3E-04
The lessons from Three Mile Island accident and the ensuing improvements in PRA
techniques allowed the NRC to perform a PRA for 5 units in 1990 the average CDF
found was 891E-05 In 1997 the NRC published the Individual Plant Examination
Program NUREG-1560 which contains the CDFs for all the 108 commercial nuclear
power plants in the US
The latest EPRI (2008) report about the US nuclear fleet pointed out that this met-
ric has shown a decreasing trend from 1992 to 2005 (see Figure 1) due to safety en-
hancements that have induced significant reductions in the risk of core melt down As
mentioned before it claimed that the average CDF is 20E-5
Figure 11 Core Damage Frequency Industry Average Trend (EPRI 2008)
2 PRA can be done at 3 levels The first one considers internal or external initiating events followedby a series of technical and human failures that challenge the plant operation and computes the CDFas a final outcome Level 2 evaluates how the containment structures will react after an accidentat this level the Large Early Release Frequency (LERF) is computed The last level determines thefrequencies of human fatalities and environmental contamination
Chapter 1 4
The second approach to assess the probability of nuclear accidents is statistical anal-
ysis Basically this approach combines theoretical probability functions and historical
observations to estimate the parameters of interests
Hofert and Wuthrich (2011) is the first attempt in this category The authors used
Poisson maximum likelihood (MLE) to estimate the frequency of annual losses derived
from a nuclear accident The total number of accidents is computed as a Poisson random
variable with constant arrival rate denoted by λ
The authors recognized that the λ estimates change significantly depending on the time
period taken This suggests that there are doubts about the assumption of a non-time
dependent arrival rate If the arrival rate depends on time it means that the events
are correlated somehow which in turns means that one of main assumptions underlying
this model is violated and therefore the results coming from the classic Poisson model
are no longer valid The main purpose of our paper is to fill this gap in the literature
by using a structural-time series approach This model has been developed by Harvey
and Fernandes (1989) and used in political science by Brandt and Williams (1998) but
is yet to be used to assess nuclear risks
13 How to properly estimate the expected frequency of a
nuclear accident using theoretical probability and past
observations
How to compute the probability of a serious accident is a key input to assess the risk of
nuclear power Nevertheless the use of a theoretical probability distribution to predict
an outcome like a nuclear accident requires a clear interpretation of the estimates that
we are obtaining
The results that we will present in the following sections correspond to an arrival rate of
a Poisson distribution which corresponds to the expected frequency of an accident (the
mean of the distribution) Given that we are dealing with a rare event the estimates for
this rate will tend to be close to zero and this feature make it possible to approximate
the value of the arrival rate to the probability of observing at least one accident
The usual interpretation for an arrival rate for instance equal to 5E-05 is that in
average we will observe at least one accident each 20000 reactor-years Following Aven
and Reniers (2013) we can have a better interpretation and think this arrival rate as
the equivalent uncertainty that a person will assign to drawing a specific ball from an
urn containing 20000 balls
Chapter 1 5
131 Data
Defining which events can be considered as nuclear accidents was the first step in our
study As we will explain in this section the scope of the definition of accident will
determine the number of observations to be used in the statistical models that we are
going to test
In general the criterion used to define nuclear accidents is closely linked with the amount
of radioactive material that is released outside the unit The International Atomic
Energy Agency introduced the INES scale inspired by the so-called Birds pyramid that
seek to determine the ratio between the fatal and less serious accidents As we can
see in Figure 12 this scale ranks nuclear events into 7 categories The first 3 are
labeled as incidents and only the last 4 are considered as accidents The major nuclear
accident is rated with 7 and is characterized by a large amount of radioactive material
release whereas the accidents with local consequences are rated with 4 because only
minor releases of radioactive material have occurred
Figure 12 Core Damage Frequency Industry Average Trend Source IAEA httpwww-nsiaeaorgtech-areasemergencyinesasp
This pyramid is a good representation of both the severity and frequency nuclear inci-
dentsaccidents On the top we find the major nuclear accidents that are rare events
Since the installation of the first commercial nuclear reactor in 1952 unit nowadays there
have been only 2 events classified in this category Chernobyl and Fukushima Dai-ichi
On the base we find minor incidents that are more frequent but less serious As we
Chapter 1 6
climb the pyramid we have fewer observations but each one represents a more serious
accident
The International Atomic Energy Agency has recorded every single event reported by
nuclear operators since 1991 using the INES scale3 Unfortunately not all the nuclear
incidents recorded previous to 1991 are rated with this scale only the most significant
events have been evaluated and rated accordingly Table 11 summarizes the number of
observations that we gathered in each category
Table 11 INES Events
INES 3 4 5 6 7
Observations 20 13 5 1 2
As we can see in Table 11 the low frequency of a major nuclear accident (Level 7)
makes difficult to appraise its probability However if we expand the definition of
nuclear accident more observations make the cut For instance we can consider nuclear
accidents as all the events rated with more than 3 in the INES scale Table 1 shows that
with this new definition we count 21 accidents
From the above it can be deduced that the definition of nuclear accident is an important
empirical issue because as it gets narrower (ie more serious accidents) the number of
observed events is reduced This tension implies a trade-off between estimation reliability
and the meaning of the results A broader scope will result in better estimates but they
will not give a precise insight about major nuclear accidents On the contrary if we
restrict our attention only to the most dramatic accidents we only have 2 cases which
undermine the degrees of freedom therefore the reliability of any statistical model
In order to avoid the sparseness when focusing only on major nuclear accidents we
considered 3 definitions The first definition corresponds to events rated with more than
2 in the INES scale (serious incidents + accidents) the second counts those accidents
rated with more that 3 within the same scale The third definition is core meltdowns
with or without radioactive releases this events have been recorded by Cochran (2011)
who counted 9 nuclear commercial reactors that have experienced partial core meltdown
from 1955 to 2010 including the well-known Three Mile Island accident in 1979
Given that this last definition (core melt downs) is the narrowest we can compare it
with the CDF computed in the PRA studies Another advantage of using this definition
is that the magnitude of internal consequences of a core meltdown (ie the loss of
the reactor and its clean-up costs) do not differ much between a major and less severe
3 The data is available in their webpage httpwww-newsiaeaorg
Chapter 1 7
accidents4 Therefore knowing the expected frequency of a core meltdown as we have
defined could be useful to design insurance contracts to hedge nuclear operators against
the internal losses that will face in case of any of these events
It is important to recognize that given that the broader definitions (events with INESgt
2 and gt3) contain heterogeneous events it is possible that the magnitude of internal
consequences that they had had differ substantially therefore they cannot be used to
insurance purposes Nevertheless we consider it is worthwhile to consider these two
definitions despite this shortcoming because the results can be seen as an upper bound
for the expected frequency of serious catastrophes
Figure 13 Major nuclear accidents reactors and operating experience 1955-2011
Figure 13 plots the number of core melts downs (CMD hereafter) collected by Cochran
(2011) as well as the number of installed reactors on the left panel and cumulated
nuclear operating experience (in reactor years) published in the PRIS5 database on the
right panel
At first glance we can conclude that PRA results might not be completely wrong given
that most of the accidents were recorded at the early stages of nuclear power history
It is important to highlight that during the period in which nuclear experience grew
exponentially (ie over the last 10 years) only (and fortunately) the Fukushima Dai-
ichi meltdowns have been observed This intuitively suggests that there have been safety
improvements in the operation of the worldwide nuclear power fleet
Figure 14 shows how many times we have observed in our sample nuclear accidents
using our three definitions As we can see in this Figure the most frequent value for an
4 By contrast the damages in case of radioactive elements releases in the environment could vary inseveral orders of magnitude depending on the meteorological conditions and the population densityin the areas affected by the nuclear cloud
5 The Power Reactor Information System
Chapter 1 8
Figure 14 Histogram for nuclear accidents 1952-2011
event rated with more than 2 and 3 in the INES scale as well as CMD is zero This
means that that sparseness remained even if the scope of accidents that we have taken
is broader
Figure 15 Cumulate frequency (AccidentsReactorYears) for nuclear accidents 1952-2011
132 Models
Once we had defined the scope of accident we parameterized the problem We assumed
that nuclear accidents are realizations that follow a Poisson distribution This function
computes the probability of a number of discrete events occurring in a continuous but
fixed interval of time given an arrival rate In our case the events correspond to nuclear
accidents and the interval time to one year
Chapter 1 9
Assumption 1 Let yt denote the number of nuclear accidents observed at year t
Assume that yt is a Poisson random variable with an arrival rate λ and density function
given by
f(yt|λ) =(λEt)
yt exp(minusλEt)yt
(11)
Although the time period is one year we have to offset the observations by Et that
is the exposure time within this interval It corresponded to the number of operative
reactors at year t
Under Assumption 1 the problem is fully parameterized and we only need to estimate
the arrival rate denoted by λ that in our case represents the expected frequency of a
nuclear accident to compute the probability of a nuclear accident at time t
Before we proceed further we want to reiterate the necessary conditions for a count
variable to follow Poisson distribution
i The probability of two simultaneous events is negligible
ii The probability of observing one event in a time interval is proportional to the
length of the interval
iii The probability of an event within a certain interval does not change over different
intervals
iv The probability of an event in one interval is independent of the probability of an
event in any other non-overlapping interval
In the case of nuclear accidents the first two assumptions do not seem far from reality
Even if in Fukushima Dai-ichi the core melts occurred the same day the continuous
nature of time allows us to claim that they did not happen simultaneously and it is not
unreasonable to expect that as we reduce the time interval the likelihood of an accident
goes down
On the contrary conditions (iii) and (iv) might be more disputable In this section
we assumed that the data satisfy these assumptions in the next section they will be
relaxed
The simplest procedure to estimate λ is to use the observations in the sample (ytTt=0 EtTt=0)
a and compute the maximum likelihood estimate Which simply means that λ equals
the cumulative frequency Using the three definitions of nuclear accidents we computed
the estimate for λ Table 12 summarizes the results
Chapter 1 10
Table 12 Poisson with constant arrival rate (1952-2011)
Database λ Coefficients Estimate Std Error z value Pr(gt |z|)INES gt 2 000273 -5902 0156 -378 lt2e-16 INES gt 3 000139 -6571 0218 -3012 lt2e-16
CMD 000066 -7312 0316 -2312 lt2e-16
If we compute λ using the information available up to year 2010 we can define ∆ as
the change in the estimated arrival rate to measure how Fukushima Dai-ichi affected the
rate
∆ =λ2011 minus λ2010
λ2010
(12)
Using this first model the Fukushima accident represented an increase in the arrival
rate of the CMD equal to 0079 In other words after assuming a constant world fleet
of 433 reactors on the planet from 2010 to 2011 was equal to 617E-04 in the absence
of Fukushima Dai-ichi accident By including this accident it went up to 666E-04 (ie
about a 8 increase)
However the simplicity of this model comes at a price First the estimation only took
into account the information contained in the sample (ie observed accidents) it would
been suitable to incorporate the knowledge brought by nuclear engineers and scientists
over the past 40 years on the potential causes that may result in major accidents
especially core meltdowns
Second it is assumed that all the reactors built over the past 50 years are the same and
their safety features are time invariant This basic Poisson model does not measure if
there have been safety improvements that reduce the probability of a nuclear accident
progressively as PRA studies have shown
To address the first limitation our second alternative was to consider λ as a random
variable Under this approach using Bayes law the observations were combined with a
prior distribution denoted by f0(λ) that encoded the beliefs about our parameter to
update the distribution of our parameter of interest
f(λ|yt) =f(yt|λ)f0(λ)intf(yt|θ)f0(θ)dθ
(13)
Equation 13 shows the updating procedure for a continuous random variable Note that
once we have updated f0(λ) using the available information ytTt=0 we can use mean
Chapter 1 11
of the posterior distribution f(λ|yt) in Equation 11 to compute the probability of an
accident
The choice of the prior distribution has always been the central issue in Bayesian mod-
els6 Within the possible alternatives the use of a conjugate prior has two important
advantages it has a clear-cut interpretation and it is easier to compute
Inasmuch as we have already assumed that accidents come from a Poisson distribution
we have also assumed that λ followed the conjugate distribution for this likelihood which
is a Gamma distribution with parameters (a b)
Assumption 2 The arrival rate λ is a Gamma random variable with parameters (a b)
and density function given by
f0(λ) =exp(minusbλ)λaminus1ba
Γ(a)(14)
Due to the properties of the gamma distribution it is easy to interpret the chosen
parameters The intuition is the following Prior to collecting any observations our
knowledge indicates that we can expect to observe a number of accidents in b reactor
years This gives us an expected rate equal to ab that will be the mean of the gamma
(prior) distribution The parameter that reflects how confident we are about this pre-
vious knowledge is b Given that it is closely related with the variance (V (λ) = ab2)
the greater b the more certain we are of our prior Once we collect observations yt
accidents in Et reactor years we update our prior following a simple formula
au = a+ yt (15)
bu = b+ Et (16)
Which gives a new expected rate given by aubu
PRA estimates have valuable information to construct the prior For instance the
WASH-1400 report found an upper bound CDF equal to 3E-04 it means approximately
1 accident over 3500 reactor years that can be expressed in terms of prior parameters
as (a = 1 b = 3500) Likewise the NUREG-1150 study computed a CDF equal to
891E-05 that in terms of prior parameters is (a = 1 b = 10000)
6 For an extended discussion on the priorrsquos selection see Carlin and Louis (2000) or Bernardo andSmith (1994)
Chapter 1 12
As we can see in Figure 16 using the WASH-1400 information as prior the Bayesian
model predicted both a higher expected arrival rate and a wider confidence interval
because the low value of b In this case the results were driven by the observations and
quickly converged towards the results of the previous model However by taking the
NUREG-1150 study as a source for the prior we needed a larger number of observations
to move far from the prior
Figure 16 Bayesian updating with Poisson-Gamma model
In fact by using (a = 1 b = 3500) as prior we found similar results for the CMD
The Poisson-gamma model predicted an expected arrival rate equal to λ2011 = 599E-04
and ∆ represented an increase of 709 After using the figures form the NUREG-1150
(a = 1 b = 10000) we found an expected arrival rate equal to λ2011 =43E-04 and ∆=
8 for CMD
To deal with the second limitation of the Poisson model we defined λ as a function of a
time trend With this third model is possible to test if that there has been a sustained
decrease in the expected rate of nuclear accidents over the past 10 years However note
that such an approach challenges what is stated in condition (iii) because we are allowing
that the arrival rate changes in each time interval (ie one year in our case)
Assumption 3 The systematic component (mean) λt is described by a logarithmic
link function given by
λt = exp(β0 + β1t) (17)
Chapter 1 13
Table 13 Poisson with deterministic time trend
Coefficients Estimate Std Error z value Pr(gt |z|)
INESgt2Intercept 106261 24823 4281 186e-05
time -0056 0012 -4509 652e-06
INESgt3Intercept 244902 39192 6249 414e-10
time -0126 0019 -6387 169e-10
CMDIntercept 221886 55788 3977 697e-05
time -0115 0028 -4091 429e-05
Results in Table 13 are maximum likelihood estimates for (β0 β1) Given the clarity of
these results there is every reason to believe that the expected frequency of a nuclear
accident has changed along this period As expected the estimates were negative and
significant Therefore if the effect of regulatory strictness technological improvements
and safety investments can be summarized in this variable we have found some evidence
that supports the decreasing trend for the core damage frequency that the PRA studies
have shown
In the CMD case the λ2011=320E-05 that is close to the estimated CDF of last PRA
studies After computing the Fukushima Dai-ichi effect on the arrival rate we found an
increase of =23 Unlike in the previous two models this increment is substantial7
In this last set of results we found a negative and significant time trend which in a
nutshell means arrival rate is decreasing in time Although this feature does not seem
controversial it invalidates condition iii (non time varying arrival rate) and we cannot
make use the traditional Poisson models as we have done so far We need a model in
which the parameter of interest (ie λ ) is function of time
Regarding the no correlation hypothesis (ie condition iv) at first glance one could say
that nuclear accidents fulfill this condition Three Mille Island accident is not related
with what happened in Chernobyl etc Nevertheless we have a long time series data
that in some sense reflect the evolution of nuclear power technology and knowledge It
is important to recognize that nuclear reactors have a long lifetime thus there is some
technological inertia in the world nuclear fleet but at the same time innovations have
been adopted and new reactors have been installed along the time period that we have
analyzed For this reason it is possible that our data exhibit some correlation In fact
7 The Poisson regression can also be done under a Bayesian approach nevertheless the prior isnot as easy to construct as in the previous case because in this setting the coefficients (β0 β1)are the random variables Generally it is assumed that they come form a normal distributionβ sim Nk(b0 B0) Where k = 2 (in our case) is the number of explanatory variables b0 is the vectorof prior means and B0 is the variance-covariance matrix Then to construct the prior will requirea lot of assumptions not only in the level and precision of the coefficients but also in how they arerelated Given that precisely what we want is to relax as much assumptions as possible we are notgoing to consider such a model
Chapter 1 14
as we pointed out before it is clear from Figure 13 that the early stages of nuclear
power industry are related with more accidents than the lasts years of our sample
To confirm or reject the validity of this assumption it is customary when using a time
series to check if there is a stochastic process that governs data dynamics In our case
this means to know if accidents are somehow correlated or if instead we can assume
that they are independent events (condition iv) To test this we propose to use a time
series state-space approach
Before turning to the last model it is worthwhile to understand why conditions (iii) and
(iv) are relevant As in the classical regression analysis the maximum likelihood estima-
tion assigns an equal weight to each observation because under these assumptions all of
them carry the same information However if observed events are somehow correlated
some of them bring more information about the current state than others therefore past
observations have to be discounted accordingly
14 Poisson Exponentially Weighted Average (PEWMA)
model
Autoregressive Integrated Moving Average (ARIMA hereafter) models are the usual
statistical frameworks to study time series however there are two limitations to use
them in the case of nuclear accidents First it is inappropriate for discrete variables
because ARIMA models are based on normality assumptions (thus it is incompatible
with Assumption 1) Second Harvey and Fernandes (1989) noted that when the mean
of the process tends to zero ARIMA estimates could result in negative predictions
which cannot be the case for nuclear accidents
To deal with these two limitations Harvey and Fernandes (1989) and Brandt and
Williams (1998) proposed to use a structural time series model for count data This
framework has a time-varying mean as in the ARIMA models but is based on a Poisson
or a negative binomial conditional distribution
The idea is to estimate the coefficients in the exponential link as in a Poisson regression
but each observation is weighted by a smoothing parameter this is the reason why the
model is called Poisson Exponentially Weighted Moving Average (PEWMA)
We briefly describe below the structural time series approach8 following what has been
developed by Brandt and Williams (1998) and (2000) The model is defined by three
equations measurement transition and a conjugate prior The first is the models
8 Harvey and Shepard (1993) have elaborated a complete structural time series statistical analysis
Chapter 1 15
stochastic component the second shows how the state λt changes over time and the
third is the element that allows identifying the model
We keep Assumption 1 which corresponds to the measurement equation f(yt|λt) In
this setting λt has two parts the first shows the correlation across time and the sec-
ond captures the effect of the explanatory variables realized in the same period which
corresponds to an exponential link
Assumption 3rsquo The mean λt has an unobserved component given by λlowasttminus1 and an
observed part denoted microt described by an exponential link
λt = λlowasttminus1microt (18)
At its name implies the transition equation describes the dynamics of the series It
shows how the state changes across time
Assumption 4 Following Brandt and Williams (1998) we assume that the transition
equation has a multiplicative form given by
λt = λtminus1 exp(rt)ηt (19)
Where rt is the rate of growth and ηt is a random shock that follows a Beta distribution
ηt sim Beta(ωatminus1 (1minus ω)atminus1) (110)
As in an ARIMA model we are interested in knowing for how long random shocks will
persist in the series systematic component In the PEWMA setting ω is the parameter
that captures persistence It shows how fast the mean moves across time in other
words how past observations should be discounted in future forecast Smaller values of
ω means higher persistence while values close to 1 suggest that observations are highly
independent
The procedure to compute f(λt|Ytminus1) corresponds to an extended Kalman filter9 The
computation is recursive and makes use of the advantages of the Poisson-Gamma Bayesian
model that we discussed in the previous section
The idea of the filter is the following The first step consists in deriving the distribution of
λt conditional on the information set up to tminus1 We get it by combining an unconditional
9 The derivation of this density function is described in Brandt and Williams (1998)
Chapter 1 16
prior distribution λlowasttminus1 that is assumed to be a Gamma with the transition Equation
19
Using the properties of the Gamma distribution we obtain f(λt|Ytminus1) with parameters
(at|tminus1 bt|tminus1)
λt|Ytminus1 sim Γ(at|tminus1 bt|tminus1) (111)
Whereat|tminus1 = ωatminus1
bt|tminus1 = ωbtminus1 exp(minusX primeβ minus rt)
The second step consists in updating this prior distribution using the information set Yt
and Bayes rule This procedure gives us a posterior distribution f(λt|Yt) As we have
seen in the previous section the use of the conjugate distribution results in a Gamma
posterior distribution and the parameters are updated using a simple updating formula
λt|Yt sim Γ(at bt) (112)
Whereat = at|tminus1 + yt
bt = bt|tminus1 + Et
This distribution becomes the prior distribution at t and we use again the transition
equation and so on and so forth
141 PEWMA Results
Given that we had not included covariates in the link function in the previous models
we are not going to include them in the PEWMA model to be able to compare the
results Thus the only parameter to estimate is ω We used PEST10 code developed
by Brandt and Williams (1998) The estimates for the PEWMA model for the three
definitions of nuclear accident are summarized in Table 14
An important characteristic of PEWMA is that it nests the previous models When
ω = 1 we can obtain the results from the first Poisson model if the prior is (a = 0 b = 0)
Those from the Poisson-Gamma are reached if we use the same prior parameters for
instance (a = 1 b = 3500)
10 The code is available in httpwwwutdallasedu pbrandtpestspestshtm
Chapter 1 17
Table 14 PEWMA Estimates for Prior a=1 b=3500
Parameters Std Errors Z-score
INESgt2 ˆωINESgt2 0599 0024 24666INESgt3 ˆωINESgt3 0729 0055 13134
CMD ˆωCMD 0801 0024 32850
Using this last prior we obtained the results shown in Table 14 As we can see the
estimates for ω with all the definitions are smaller than one After computing a Wald
statistic to test independence assumption and reduction to simpler Poisson models we
concluded that we do not have evidence to assume that the observations are independent
The results for this test are presented in Table 15
Table 15 Test for reduction to Poisson H0 ω = 1
Wald test p-value
INESgt2 272523 lt2e-16INESgt3 23663 1147e-06
CMD 66193 4440e-16
On the basis of these results we can conclude that the use of Poisson models based on
the independence assumption is definitely not suitable to estimate the frequency and
compute the probability of nuclear accidents
The results in Tables 14 and 15 also shown that as the definition of the accident
narrowed meaning passing from INESgt2 to INESgt3 and CMD the estimate of ω got
closer to one This suggested that it is likely to accept the independence assumption
when focusing only on major nuclear accidents because what the data reflect are the
particular conditions in which these accidents occurred On the contrary when we took
a broader set of accidents we estimated a lower ω because the data set had more
information about nuclear safety as a whole
142 Arrival rate estimates from 1952 to 2012
The predictions at each period of time t in the filter for λt vary substantially depending
on ω As we have already mentioned if all the events are independent ω rarr 1 thus they
are considered equally important in the estimation As ω gets smaller recent events
become more important than those observed in the past then the latter are discounted
Figure 17 plots the mean of f(λt|Yt) for the Poisson-Gamma and PEWMA model for
CMD Note that for the former model the changes in the arrival rate are subtler with
Chapter 1 18
each observation because the effect of a new accident is diluted over the cumulated
experience In the case of the latter model we discount past events heavily thus the
observations in the latest periods are the most important and the distant are almost
irrelevant For this reason the changes in the expected arrival rate are more drastic
Figure 17 Poisson-Gamma vs PEWMA for CMD
As we can see in Figure 17 from 1952 to 1970 the arrival rate grew quickly until it
reached a high peak This can be explained by the different accidents occurred between
1960 and 1970 and the slow growth of the worldwide nuclear fleet After 1970 several
accidents occurred but the operating experience increased substantially Between 1970
and 2010 we can observe a decreasing trend in the arrival rate even though this period
is featured with the most well known accidents of Three Mile Island and Chernobyl
The Fukushima Dai-ichi results in a huge increase in the expected frequency of an
accident The arrival rate in 2011 is again similar to the arrival rate computed in 1980
after the Three Mile Island and the Saint Laurent des Eaux core meltdown In other
terms Fukushima Dai-ichi accident has increased the nuclear risk for the near future in
the same extent it has decreased over the past 30 years owing to safety improvements
In informational terms the adding of a new observation (ie new accident) is equivalent
to the offsetting of decades of safety progress
The PEWMA model estimates an arrival rate for CMD λ2010 = 442e-05 and λ2011
=1954e-3 which implies a ∆ =4321 This huge change could appear as unrealistic In
Chapter 1 19
fact at first glance the triple meltdown seems as the result of a series of exceptional
events (ie a seism of magnitude 9 and a tsunami higher than 10 meters) However for
most observers the Fukushima Dai-ichi accident is not a black swan11 Seisms followed
by a wave higher than 10 meters have been previously documented in the area It is true
that they were not documented when the Fukushima Dai-ichi power plant was built in
1966 The problem is that this new knowledge appeared in the 80s and has then been
ignored deliberately or not by the operator It has also been ignored by the nuclear
safety agency NISA because as well-demonstrated now the Nippon agency was captured
by the nuclear operators (Gundersen 2012)
Unfortunately it is likely that several NPPs in the world have been built in hazardous
areas have not been retrofitted to take into account better information on natural
risks collected after their construction and are under-regulated by a non-independent
and poorly equipped safety agency as NISA For this reason the Fukushima Dai-ichi
accident entails general lessons regarding the underestimation of some natural hazardous
initiating factors of a core meltdown and the over confidence on the actual control exerted
by safety agency on operators
Note also that such an increase seems more aligned with a comment made after the
Fukushima Dai-ichi accident a nuclear catastrophe can even take place in a technologi-
cally advanced democracy It means that a massive release of radioactive elements from
a nuclear power plant into the environment is no longer a risk limited to a few unstable
countries where scientific knowledge and technological capabilities are still scarce The
10 times order of magnitude of the Fukushima Dai-ichi effect computed by us could
therefore be realistic and consistent
15 Conclusion
Results in Table 16 recapitulates the different numbers for the arrival rate and the
Fukushima Dai-ichi effect we obtained in running the 4 models
Table 16 Summary of results
Model λ2010 λ2011 ∆
MLE Poisson 6175e-04 666e-04 00790Bayesian Poisson-Gamma 4069e-04 439e-04 00809Poisson with time trend 9691e-06 320e-05 2303PEWMA Model 4420e-05 195e-03 43216
11 See Fukushima Dai-ichi NPS Inspection Tour (2012)
Chapter 1 20
We can conclude that when it is assumed that the observations are independent the
arrival of a new event (last nuclear catastrophe) did not increase the estimates The
Fukushima effect is close to 8 regardless of whether you use a basic Poisson model or
a Bayesian Poisson Gamma model
This result does not take any safety progress into account nor the new risks that the
last accident revealed The arrival rate is computed as if all the reactors have been the
same and identically operated from the first application of nuclear technology to energy
to this day This is a strong limitation because it is obvious that over the past 50 years
the design of reactors and their operation have improved The current worldwide fleet
has a higher proportion of safer reactors than the 1960s fleet
On top of that the Fukushima Dai-ichi accident revealed potential risks associated with
a poor feedback on natural hazards in old facilities as well as the possibility of regulatory
capture even in developed countries
By contrast the introduction of a time-trend into the Poisson model has led to a high
decrease in the 2010 arrival rate The time trend captures the effect of safety and
technological improvements in the arrival rate Being significant this variable allows
predicting a lower frequency of nuclear accidents If we use a Poisson regression we find
a tripling of the arrival rate owing to the Fukushima Dai-ichi accident Note that both
findings seem more aligned with common expertise In fact the expected frequency of
an accident by reactor-year as derived by the 2010 arrival rate is closer to PRAs studies
Nevertheless the Poisson regression is also based on the assumption of independent
observations The PEWMA model has allowed us to test the validity of this hypothesis
and we find that it is not the case This seems to be more suitable because nuclear
reactors have a long lifetime and the construction of new reactors investments in safety
equipment learning process and innovations take time to be installed and adopted by
the whole industry Of course the dependence hypothesis leads to a higher arrival rate
because it introduces some inertia in the safety performances of the fleet A new accident
reveals some risks that have some systemic dimension
With the PEWMA model the Fukushima Dai-ichi event represents a very substantial
but not unrealistic increase in the estimated rate By construction each observation in
this model does not have the same weight Past accidents are discounted more than new
accidents This captures the idea that lessons from past accidents have been learnt in
modifying operations and design and that a new accident reveals new safety gaps that
will be progressively addressed later in order to avoid a similar episode
Chapter 2
Revisiting the cost escalation
curse of nuclear power New
lessons from the French
experience
21 Introduction
In OECD countries the choice to include or not include nuclear power in the energy mix is
commonly seen as primarily a matter of public opinion The very long lifetime of nuclear
waste and the risk of large radioactive materials being released into the environment
have raised major acceptability concerns The Fukushima Dai-ichi catastrophe in March
2011 has demonstrated again how public attitude vis--vis nuclear technology may dictate
political decisions and U-turns For instance German people were so stunned by the new
accident that the Chancellor Angela Merkel immediately decided to shut down eight
operating reactors and later on to accelerate the phasing-out of the nuclear fleet Four
months before Fukushima Dai-ichi a new German law was passed to extend their life
Nuclear power was viewed then by Angela Merkel and her party as a bridge technology
before renewables and storage could cover all electricity demands
However public opinion is not the only barrier that nuclear power faces today a less
addressed but also an important issue is whether new nuclear power plants can be built
at a reasonable cost The construction cost is the major component of levelized costs
of nuclear power generation Depending on assumptions on the cost of capital and the
number of years to build the nuclear plant the construction cost represents between 60
21
Chapter 2 22
and 80 of levelized costs1 In other words whether or not nuclear power generation
is cheap enough to compete with other electricity sources is critically dependent on
construction costs
In OECD countries2 where public opinion is supportive of nuclear power policy mak-
ers investors and utilities are very concerned by construction costs In countries such
as the UK Finland France and Poland nuclear generation is viewed as needed to
achieve a low carbon energy transition The technology is also considered to contribute
towards reducing energy dependency from abroad These two drivers of nuclear energy
deployment are well illustrated by the example of the UK The UK has adopted an
ambitious CO2 emissions reduction policy in a very specific context a medium-term
shortage of capacity owing to the closure of its old nuclear and coal power plants After
several years of debate and consultation the UKs decarbonization policy includes an
increasing carbon tax reaching up to 70 per ton in 2030 and a mechanism that provides
operators over a long-time period with a fixed price for electricity therefore fluctua-
tions in electricity price on the power exchange will take place regardless The so-called
contract-for-difference ensures money to generators when the wholesale market price is
below a reference or strike price set by the government and conversely generators pay
the difference between the market price and the strike price when it is positive Both
renewable energy and nuclear energy could benefit from this mechanism The UKs
vision as elaborated in the 2008 White Paper and in the 2010 Coalition Programme is
that nuclear energy has a role to play alongside renewables to reduce greenhouse gas
emissions by 80 in 2050 and to secure energy supply By the end of the 2020s 16 GW
of new nuclear capacity are envisaged
Noticeably the Fukushima Dai-ichi accident has not changed the situation Six months
after the Japanese catastrophe a national policy statement for nuclear power generation
reiterated the need for new nuclear power plants and the benefits of early deployment
In March 2014 according to a survey commissioned by the Department of Energy and
Climate Change3 42 supported nuclear power and 20 opposed it On the 21st
October 2013 a commercial agreement was reached between the EDF Group and the
UK Government for the building of two EPR reactors at Hinkley Point C in Somerset
A strike price of pound925 per MWh over a 35-year period was agreed It is supposed to
1 See NEA (2000) and NEA (2000)2 In non-OECD countries nuclear cost-competitiveness is a less sensitive issue The adoption and
continuation of nuclear technology are mainly driven by political considerations See Goldemberg(2009)
3 The Department of Energy and Climate Change publishes the DECC Public Attitudes TrackerSurvey periodically since 2012 The figures cited here correspond to the Wave 9 document that isavailable here httpswwwgovuk
Chapter 2 23
cover the pound14 billion4 that EDF estimated as the expenses to construct the plant These
figures have generated an intense debate between those that argue that nuclear power is
not competitive and needs subsidies to survive Greenpeace (2013) and those that claim
that the strike price and the construction cost correspond to a first of a kind and that
the following reactors will be much cheaper to build5
More generally speaking concerns about the cost of nuclear new-builds have been raised
with the updating of academic cost studies in the US and the long delays and budget
overshoots observed in the construction of EPR in the EU (Leveque (2013)) In 2009
the MIT published a report updating the findings of an initial study that was done six
years before called The Future of Nuclear Power (see Parsons and Du (2003) Parsons
and Du (2009)) The increase in the construction cost was spectacular expressed in
current dollars and leaving aside interests during construction costs doubled rising
from $2000 to $4000 per kW In particular this latter figure took into account the
estimated costs of 11 projected plants in the US for which the relevant utilities had
applied to the regulatory bodies for reactor licencing Likewise in 2011 the University
of Chicago estimated that on average the construction cost of AP 1000 reactors quoted
in applications by utilities was $4210 per kW which meant an increase by a factor of
21 in constant dollars in comparison with a study carried out seven years earlier (see
Rosner and Goldberg (2011a))
New-builds in Olkiluoto in Finland and Flamanville in France have been plagued with
successive revisions of budget and completion dates The construction of the Finnish
plant started in 2005 and was supposed to last four-and-a-half years with a grid con-
nection in 2009 Commercial operation is now expected in 2016 at best Construction
costs were first estimated at e3 billion and were revised upwards in 2010 to e57 billion
and in 2013 to e85 billion Similarly the initial anticipated cost of the Flamanville
EPR reactor currently under construction by EDF increased from e33 billion in 2005
to e6 billion in 2011 EDFs most recent press release in 2012 downgraded the situation
further announcing an estimated cost of 85 billion Flamanville was expected to start
commercial operation in 2013 but due to delays is expected now to start up in 2016
Looking at costs in the past to build the two largest nuclear fleets in the world recent
concerns about nuclear cost escalation do not seem unfounded In the case of the US
(see Figure 21) if we compare the overnight cost in Koomey and Hultman (2007)
for the first and last nuclear reactors installed we can see that the costs expressed in
4 EDF Energy Press release 21 October 2013 available at httpnewsroomedfenergycomNews-ReleasesAgreement-reached-on-commercial-terms-for-the-planned-Hinkley-Point-C-nuclear-power-station-82aspx
5 Nutall W (2013) Hinkley C goes ahead but future nuclear costs must fall The Conversation 31October 2013 httptheconversationcomhinkley-c-goes-ahead-but-future-nuclear-costs-must-fall-19407
Chapter 2 24
Me(2010)MW are seven times higher for the latter than for the former It is worth
mentioning that the overnight cost includes the investments linked with site preparation
and construction but it excludes financing expenses Therefore it shows the cost of the
plant as if it had been fully built in one night
Figure 21 Overnight costs for the US Nuclear Fleet e 2010MW
The severe escalation in the construction cost of the US nuclear fleet is partially ex-
plained (see infra) as the result of the heterogeneity in the reactors that were installed
(ie different types and models) and the consequent lack of standardization that to-
gether with the multiplicity of utilities vendors and constructing firms reduced the
possibility of establishing long-term relationships and building the same reactor design
repeatedly All this resulted in an erosion of the potential benefits associated with
learning effects
Alike Grubler (2010) analyzed the investments made in France to build its fleet of 58
reactors His comparison of construction costs in FF98kW between units installed in
1974 and those constructed after 1990 shows an increase by a factor of about 35 This
finding suggests that even under better economic and institutional conditions such as
those prevailing in France (ie centralized decision making vertical integrated utility
single nuclear vendor high degree of standardization and regulatory stability) cost
escalation is inherent to nuclear power According to Grubler (2010) negative learning-
by-doing effects characterize nuclear technology while accumulating experience nuclear
construction costs per unit of capacity have been increasing instead of decreasing
Chapter 2 25
By contrast as comprehensively reviewed by Martin Junginger and Faaij (2010) his-
torical trends for other base-load technologies such as gas and coal and for other zero
carbon technologies such as onshore wind and photovoltaic systems show positive learn-
ing effects Experience curves are especially impressive for renewables Lindman and
Soderholm (2012) found that the kW from onshore wind farms decreases by more than
10 each time the installed capacity doubles Meanwhile Isoarda and Soria (2001) and
C Yu and Alsema (2011) have identified higher learning effects in the photovoltaic in-
dustry confirmed by the dramatic reductions in the underlying costs and market prices
of solar panels
On top of this we can expect the Fukushima Dai-ichi accident to have consequences in
terms of construction costs for new reactors Lessons learned from this accident may
encourage nuclear vendors to include other safety features and lead to redundancies in
new reactors and site designs safety authorities might impose stricter licencing rules
and greater public opposition to installing new nuclear power plants could induce con-
struction delays and therefore cost overruns
In the debate about nuclear plants current opinion is directed against their construction
Taking into account the above it seems that there is no escape from the cost escala-
tion curse However before giving up it is worth reviewing the French nuclear power
programme experience using new data recently released by the Cour des Comptes It
is important to mention that Grubler made his cost assessment using estimations based
on an annual EDF investment report covering 1972 to 1998 because at the time of his
publication reliable data on the costs of the French nuclear programme were not avail-
able Following a request from the Prime Minister to the national audit agency Cour
des Comptes past construction and RampD expenses related to French nuclear power were
first made known to the public in 2012 The Cour des Comptesrsquo report brought together
all data concerning current construction costs for the 58 reactors installed in France as
well as investments in other nuclear facilities
When we compared costs from this new source of information with previous cost esti-
mates we found that the escalation is less severe than argued In the light of this result
in this paper we re-examine the cost drivers for the French nuclear power programme
We consider that by revisiting the French experience it will be possible to draw useful
policy recommendations to ease cost escalation in the construction of new nuclear power
plants and therefore determine the elements that will allow nuclear power to remain
competitive
In particular we are interested in investigating the existence of scale and learning effects
as well as the relationship between safety performance and costs in order to see if it is
Chapter 2 26
possible to expect cost reductions when increasing the size of the reactor when building
the same type of reactor repeatedly and if safer reactors are more expensive
The literature regarding nuclear construction drivers is large for the US case given that
the data have been available to the public ever since the construction of the first wave
of reactors We can mention the pioneering papers of Komanoff (1981) and Zimmerman
(1982) Later Krautmann and Solow (1988) Cantor and Hewlett (1988) and McCabe
(1996) revisited the existence of economies of scale and established that the construction
of larger reactors6 increased the cost per MW installed once the increase in construction
lead time was taken into account According to Cantor and Hewlett (1988) bigger units
increase projects complexity subjecting them to managerial problems longer lead times
and stricter regulatory scrutiny Learning effects were only found to be positive and
significant when public utilities constructed the plant This striking result was later
addressed by Cantor and Hewlett (1988) and McCabe (1996) The former suggested
that the market power of experienced firms allows them to charge higher prices so the
learning effects are kept as profits whereas the latter explained this difference by the
poor incentives of cost-plus contracts7 under which nuclear power plants were procured
by external constructors
More recent studies like Cooper (2012) have observed that the number of rules and
fines issued by the Nuclear Regulatory Commission (hereafter NRC) even before Three
Mile Island accident in 1979 led to an increase in construction costs According to this
author the NRC was convinced that the risk of accident would increase dramatically
as the number and size of operating reactors grew and their locations moved closer to
population centers Therefore they sought to reduce the risk by increasing the required
safety measures
Our paper is the first to use the actual construction costs of the French nuclear fleet
As mentioned previously the cost assessment done by Grubler (2010) used estimations
As in previous literature we deal with a multicolinearity problem but in addition we
have a smaller sample therefore we propose using a principal component regression
approach to deal with both econometric limitations In addition to using the common
explanatory variables to identify the main drivers of construction costs we also included
operating performance indicators in particular those linked with safety to see if cost
escalation can be justified with better safety features
6 Except Komanoff (1981) a pioneering study that suggested a 13 cost decrease when a reactorssize is doubled nevertheless subsequent papers rejected this result
7 McCabe (1996) explains that for the second wave of nuclear reactors (the one that began in the late60s) the nuclear vendors ceased to be in charge of the construction process and in turn utilitiescontracted external firms to preform plant engineering management and construction All thesecontracts were cost-plus
Chapter 2 27
After revisiting construction costs for the French nuclear fleet we find that neither
the scale-up nor cumulative experience induced cost reductions on the contrary these
variables have positive and significant coefficients We have called this phenomenon
the big size syndrome and we have identified it as the main driver of cost escalation
in France The big size syndrome summarizes the fact that as the nuclear industry
gained experience bigger and more complex reactors were designed and installed and
this resulted in a cost increase
Although the increase in the size of the reactors was done with the expectation of
reducing the cost per MW installed with our results we cannot discard the existence of
economies of scale in the French nuclear fleet We have to recognize that by using only
French data it is not possible to disentangle the effect due to increase in the reactors
capacity caused by technological change Thus it is true that bigger reactors were more
expensive per MW installed but we have to keep in mind that we are not talking about
the same reactor design
Our second important result is that we have identified positive learning effects within
similar types of reactors This finding is good news for nuclear power deployment
given that it supports the idea of standardization as an effective strategy to reduce
cost overruns linked with uncertainty when constructing complex technologies such as
nuclear reactors and therefore offers a possible way of overcoming the cost escalation
curse This result supports the idea that to avoid the cost escalation curse building
the same type of reactor repeatedly in the same sites was one of the key features of the
French nuclear programme
The last result that we found is that reactors that perform better according to the
safety indicators that we included in the regression cost more This last result shows
that improvements in safety can also be considered as a driver of cost escalation This
result is also linked with our first one because it tells us that technological improvements
embedded in new designs either because the reactor is larger or because vendors seek
to achieve better safety performance (perhaps to fulfill regulatory requirements) have
resulted in a rise in the cost per MW installed
The rest of the paper is organized as follows Section 22 briefly describes the French
nuclear power programme and the cost data from the Cour des Comptes report then
sets out the model and estimation procedure The results of the model are presented
and discussed in Section 23 Finally our conclusion is in Section 24
Chapter 2 28
22 Data and Model
221 French construction cost escalation
The inception of nuclear power for civil use in France began in the early 1960s From
1963 to 1972 EDF installed 7 reactors with different technologies that represented ap-
proximately 2600 MW These units (Table 21) were later decommissioned according to
Roche (2004) due to their technological and economic limitations In particular safety
concerns were raised after the partial core meltdown in Saint Laurent A1 reactor in 1969
Table 21 First Generation of French Reactors
Unit Type Year of connection
Chooz A Pressurized water 1967Brennilis Heavy water reactor 1967St Laurent A1 Natural uranium gas-cooled 1969St Laurent A2 Natural uranium gas-cooled 1961Chinon A2 Graphite-Gas 1965Chinon A3 Graphite-Gas 1966Bugey 1 Graphite-Gas 1972
The early adoption of nuclear power by EDF and the oil price peak in 1973 triggered the
design of the French nuclear power program with the aim of substituting fossil energy
sources This program has been described as the opposite of the situation in the US
nuclear industry because the French nuclear fleet is less diverse and investment decisions
were made by a centralized institutional structure
In France only one technology was installed corresponding to the Pressurized Water
Reactor (hereafter PWR) From 1978 to 2002 58 reactors were built in 19 units (see
Figure 22) Today all of these reactors are in operation and provide almost 78 of
French annual electricity consumption The nuclear fleet is composed of three groups
called paliers In each palier all reactors have the same size The first palierpalier
comprises 34 reactors with a 900MW nameplate capacity the second palier includes 20
reactors with 1300 MW and the last one contains 4 reactors with 1450 MW of installed
capacity This corresponds to a total installed capacity of 62510 MW
Each palier includes different types of reactor The first palier has 3 types of reactor
CP0 CP1 and CP2 Their main difference lies in the design of the intermediary cooling
system In the second palier there are two types of reactor P4 and P4 which differ
in the layout of the structure containing fuel rods and circuitry Finally the last palier
comprises only one type of reactor called N4 This design differs from the other reactors
in terms of capacity as well as the design of its steam generators primary pumps and
command room
Chapter 2 29
Figure 22 Evolution of French Nuclear Power Fleet by palier
As mentioned before the institutional setting in which the French nuclear power pro-
gram developed was highly centralized Finon and Staropoli (2001) described it as a
close-knit network between EDF the public monopoly generator Framatome (today
AREVA) the reactor vendor and the Atomic Energy Commission (CEA) the nuclear
research and development agency This centralized decision-making setting resulted in
effective coordination of the programs investments and reduced uncertainty regarding
safety regulations The downside is that it also shielded the program from public scrutiny
and accountability
However with the decommissioning deadlines for the oldest reactors approaching public
debate about the role of nuclear power in the French energy mix calls for clear account-
ability of EDFs past present and future investments For this reason in 2011 the former
Prime Minister of France asked the national audit agency Cour de Comptes to under-
take a study of EDFs past expenditure on constructing nuclear facilities including the
58 PWR commercial reactors
This report was published at the beginning of 2012 and for the first time presented to the
public the actual construction costs of the nuclear fleet It is important to point out that
we used the construction costs and not the overnight costs because in the report the
latter were presented for the whole nuclear fleet and not for each observation However
they represent 88 of the total overnight costs The costs in the report are presented
Chapter 2 30
by pairs of units in current and 2010 constant euros8 Figure 23 compares the cost data
presented in the Cour de Comptes report with the estimated costs computed by Grubler
(2010) We can conclude that the figures for the first reactors were quite accurate but
that figures for the latest ones were overestimated In fact by taking Grublers cost
estimates expressed in e2010 kW the average annual increase is equal to 57 taking
the construction costs in the Cour de Comptes we find an average annual increase of
47
Figure 23 Grubler vs Cour de Comptes construction costs
Since the cost escalation was not as severe as argued it is worth reviewing the French nu-
clear power program experience with the actual data published in the Cour de Comptes
report in order to see if new lessons can be learnt to overcome the cost escalation curse
222 Model and data
Using a linear regression model we seek to determine the construction costs main drivers
We assume a logarithmic cost function in which the explanatory variables are capacity
input prices experience safety performance indicators and finally a random error The
regression equation that we have estimated is the following
8 The actual construction cost for the French nuclear fleet published in the Cour de Comptes arepresented in Appendix A
Chapter 2 31
Figure 24 Cour de Comptes construction cost by palier and type
ln(Ci) = β0 + β1 ln(Capi) + ln(ICHTi) + β2EXPIi + β3EXPPi
+β4EXPTi + β5UCLi + β6US7i + ui (21)
Where
bull Ci Construction cost for the pair of units i in e2010 per MW
bull Capi Installed capacity in MW
bull ICHTi Index cost of labor for the year in which the construction of reactor i
started
bull EXPIi Number of completed reactors at the time of the construction of plant i
bull EXPPi Number of completed reactors within the same palier at the time of the
construction of plant i
bull EXPTi Number of completed reactors within the same type at the time of the
construction of plant i
bull UCLi Lifetime average Unplanned Capability Loss Factor for unit i
bull US7i Lifetime average Unplanned Automatic Scram for unit i
Regarding capacity Figure 24 clearly shows that the cost escalation in France is closely
related to the progressive increase in reactor size Nevertheless it is important to men-
tion that the scale-up also entailed a technological change which means that there are
Chapter 2 32
substantial design differences between reactors belonging to each palier For this reason
we have to keep in mind that with this variable we are capturing two effects ie the
size and the technological complexity of new reactors
The second set of explanatory variables was included to test the presence of learning
effects We have defined three variables the first corresponds to overall experience
(EXPI) the second only adds the previous reactors existing within the same palier
(EXPP) and the last one includes reactors of the same type (EXPT) All of these
variables show the number of reactors previously built in each category
Apart from scale and learning effects we might also be interested in identifying whether
cost escalation is linked to safety improvements According to Cooper (2012) safety
variables (ie fines and the number of safety standards and rules adopted by the NRC)
are the most consistent predictors to explain the cost escalation in the US In previous
studies (Komanoff (1981) Zimmerman (1982) Cantor and Hewlett (1988) McCabe
(1996)) safety improvements were related to the stringency of the regulatory agency that
was represented with a time trend in all of these studies it was found to be significant
and positive
For the French case it is hard to measure regulatory activity According to Grubler
(2010) there is no regulatory documented incidence from 1970 to 1999 which is not
surprising given that the Autorite de Surete Nucleaire (independent regulatory agency)
was created in 2006 However Roche (2004) and Finon (2012) argued that EDF inte-
grated safety reinforcements into new reactors gradually and thus these improvements
should be reflected in better performance in terms of unplanned outages To test how
safety improvements are related to construction costs we included in the model two in-
dicators defined by The World Association of Nuclear Operators (WANO) and adopted
by the International Atomic Energy Agency (IAEA)
The first of these is the Unplanned Capability Loss Factor (UCLi) which reflects a
reactors ability to maintain the reliability of systems and components This indicator
belongs to the first category of the safety performance indicators used by the IAEA
which seeks to quantify how smoothly a plant operates The UCL indicator shows the
percentage of energy that a plant was not capable of supplying due to deviations from
normal operations
The second indicator is Unplanned Automatic Scram (US7i) which belongs to the
category for identifying whether a plant is operating at low risk The US7 tracks the
number of automatic shutdowns during one year (ie 7000 hours) of operation We
have chosen this measure because it gives a direct indication of the frequency of actual
Chapter 2 33
Figure 25 Labor cost index (ICHT) and Price index for France =100 in 1973
challenges to the systems that submit plant equipment to extreme thermal loads and
increase the risk of serious accidents
To count the changes in input prices we have also included an index in the regression
framework to take into account the cost of labor Although the costs are expressed in
constant currency it is important to highlight that during the period we are analyzing
(ie1978-2002) the labor cost increased more rapidly than the index prices When we
compared the evolution of the French GDP price index with the Indice du cout horaire
du travail (ICHT) developed by INSEE we found that the difference between the index
in 1973 and 2000 is 4 times in the former and 9 times in the latter (see Figure 25)
We have not included other commodity price indexes such as cement copper steel or
nickel given that on average their growth rates were similar to the GDP deflector that
was used to homogenize the cost data
In addition to the Cour de Comptes costs we gathered data from the IAEAs Power
Reactor Information System (PRIS) database We took the installed capacity in MW
for the year when the reactor was constructed the number of reactors that were built
by EDF previously to audit the experience and the average UCL and US7 lifetimes for
each pair of units Descriptive statistics of the data are presented in Table 22
223 Multicollinearity and Principal Component approach
One of the main econometric problems identified in literature on nuclear construction
cost escalation is the multicollinearity between the explanatory variables and in partic-
ular the high correlation between installed capacity and industry experience To deal
Chapter 2 34
Table 22 Descriptive statistics
Variable Unit Mean Median Minimum Maximum Std
Cost e2010MW 114 114 082 163 019Cap MW 2156 1840 1740 2945 43691ICHT Index 100= 1973 49646 50440 21810 92196 17899EXPI reactors 2741 26 1 56 1730EXPP reactors 1203 12 1 30 897EXPT reactors 510 4 1 16 416UCL 712 707 307 1195 208US7 events7000 hours critical 077 069 018 140 031
with this problem Zimmerman (1982) suggested using a monotonic transformation of
overall experience instead of the original variable In subsequent studies such as those
by Cantor and Hewlett (1988) and McCabe (1996) the issue was solved by taking the
builders experience into account instead of the overall industry experience which eased
the high correlation among these variables
For the French case the multicollinearity problem is severe There is a single builder
(EDF) so experience increases with time and also with installed capacity because
the scale-up has been progressive On top of that we observe a sustained increase
in the labor cost index As we can see in Table 23 these three variables are highly
correlated which illustrates the difficulty of obtaining significant results in a linear
regression framework
Table 23 Correlation Matrix
Ln Cap ICHT EXPI EXPP EXPT UCL US7
Ln Cap 100ICHT 074 100EXPI 086 096 100EXPP -044 018 003 100EXPT -023 004 -002 054 100UCL -002 -035 -028 -048 -050 100US7 -008 -026 -023 -029 -021 053 100
Indeed when we include all of the coefficients in a linear regression they are imprecisely
estimated (see Table 24) This problem is confirmed with the high estimates for the
Variance Inflation Factor (VIF) (see Table 25) The standard way of solving multi-
collinearity problems is to eliminate one or more explanatory variables Although we
tried different specifications none of them resulted in significant estimates and the VIF
remained high The results of these models are shown in Appendix B
Unfortunately within this framework it is not possible to figure out the main drivers
because all of the explanatory variables move in the same direction thus our data
set appears redundant By using a principal component regression we have overcome
Chapter 2 35
Table 24 Linear regression estimates
Coefficients Estimate Std Error t value Pr(gt |t|)(Intercept) -0188 12454 -0015 0988
Ln Cap -0092 1477 -0063 0951Ln ICHT 0187 0399 0470 0643
EXPI 0002 0021 0127 0900EXPP -0003 0015 -0257 0800EXPT -0008 0009 -0825 0419UCL -0018 0019 -0967 0345US7 0014 0103 0143 0888
Table 25 VIF for explanatory variables
Ln Cap Ln ICHT EXPI EXPP EXPT UCL US7
116728 32345 183909 26865 2273 2166 1482
this limitation With this method we can obtain relevant information from our data
set reducing it to a smaller dimension and revealing simplified underlying correlations
between the costs and the explanatory variables
Principal component analysis is an established multivariate technique developed by Pear-
son (1901) and Hotelling (1933) In economics this method has been applied in a wide
range of subjects for instance in macroeconomics and finance by Fifield and Sinclair
(2002) and in development by Zanella and Mixon (2000) and used to construct socio-
economic indexes by Filmer and Pritchett (2001)
The main idea of this procedure is to take the correlation matrix which we denote by
C = XprimeX (where X is the n times k matrix of centered and scaled explanatory variables)
and then compute the k times k eigenvector matrix9 V
Given that VVprime = I we can rewrite a lineal model Y = X primeβlowast as follows
Y = βlowast01 + XVVprimeβlowast (22)
Y = βlowast01 + Zα (23)
Where Z is the n times k matrix of principal components This matrix contains the same
information that X but the columns are arranged according their share in the variance
9 Recall that the eigenvectors of a square matrix A are defined as the vectors that solve AW = λWwhere λ is a real or complex number called eigenvalue They can equivalently be defined as thevectors that solve (Aminus λI)W = 0
Chapter 2 36
Each principal component is a linear combination of the explanatory variables The
characteristic vectors define the weights or loadings (matrix V) and the roots (eigenval-
ues) denoted byλ identify the most important components (the higher the eigenvalue
the higher the share in the variance)
Once this decomposition is done the next step in this framework is to eliminate the prin-
cipal components (columns of Z) associated with the smallest eigenvalues (λ) in order
to reduce the variance that is causing the multicollinearity and estimate the significant
coefficients
23 Results
Although we are interested in the coefficients between the costs and explanatory vari-
ables one of the main advantages of the principal component approach is that we can
identify underlying relationships among the explanatory variables thanks to the loadings
in each component Table 26 shows the loadings and roots for the correlation matrix
of our model
Table 26 Loadings and roots
Comp 1 Comp 2 Comp 3 Comp 4 Comp 5 Comp 6 Comp 7
Ln Cap 0441 -0398 -0008 0282 -0088 0475 -0576Ln ICHT 0552 -0086 0218 -0229 -0015 -0729 -0232
EXPI 0553 -0173 0165 -0088 -0054 0282 0738EXPP 0106 0534 0335 -0605 -0076 0390 -0256EXPT 0095 0495 0368 0643 -0433 -0081 0039UCL -0313 -0429 0188 -0262 -0781 -0035 0016US7 -0274 -0295 0800 0103 0429 0028 -0009
λ 81643 66622 21171 14004 9840 2624 0093
This decomposition can be interpreted as follows The components are ordered according
to their importance which is represented in terms of variance percentage (ie the roots
λ) As each component is a linear combination of the explanatory variables those with
the highest loadings show us what each component represents
For instance in our case the first component explains 41 of the total variance in which
the variables with high loadings are wages capacity and cumulative experience This
component represents what we could call the the large size syndrome or as Cooper (2010)
termed it the Bupp-Derian-Komanoff-Taylor hypothesis This hypothesis stated that
as the nuclear power industry (vendors and utilities) gained experience they were able
to identify how to improve reactors performance and ultimately design more complex
and bigger units
Chapter 2 37
The second most important component accounts for 33 of the variance The variables
with high loadings are experience within palier and type and the two safety perfor-
mance indicators Given that these loadings have opposite signs we can think of this
component as a safety feedback This second component shows that constructing sim-
ilar reactors (either in size or type) resulted in better performance in terms of safety
indicators in the most recent units of each series in particular the reliability indicator
(UCL)
Going in the same direction Roche (2004) claimed that even when equipment inside
plants of the same series was identical and laid out in the same manner the experi-
ence gained by EDFs engineering division at series level resulted in specific and minor
modifications in order to improve reliability and safety
Even though this component decomposition gave us some insights on the French nuclear
power program we had to select the number of components to be included in the linear
regression estimation After selecting the optimal number of principal components
we were able to see how the explanatory variables were related to the variable we are
interested in ie construction costs Among the possible criteria to determine the
optimal number of components we took the root mean squared error of prediction
(RMSEP) criterion Using the leave-one-out cross-validation method we found that
using the first two components minimizes the RMSEP
Once the optimal number of principal components had been selected we computed the
coefficients for the original linear regression In Table 27 we present the estimates for our
set of explanatory variables Given that we had to standardize our explanatory variables
we differentiated the coefficients that we obtained from the centered and scaled matrix
with (βlowast) from those that we obtained for the original data denoted by β in Table 27
Table 27 Principal Component Regression Results
Coefficients βlowast β se(β) t-value
LnCap 0222 1131 0106 9489Ln ICHT 0212 0553 0536 10089EXPI 0226 0226 0020 9996EXPP -0048 -0048 0011 -3581EXPT -0046 -0046 0009 -3074UCL -0042 -0042 0022 -2677US7 -0050 -0050 0016 -3544
In the light of these results we confirm that as in the US case the scaling-up of the
French nuclear program did not translate into cost reductions The regression coefficient
for capacity in Table 27 shows that an increase in this variable will induce higher
construction costs per MW
Chapter 2 38
However as we have mentioned in the previous section we cannot overlook pure economies
of scale given that this variable captures the size from the complexity effect The lack of
or at least weak economies of scale in nuclear power plant construction is a well-known
phenomenon It has been identified that constructing larger reactors means an increase
in technological complexity and construction lead-times that requires better managerial
coordination and induces closer and stricter regulatory standards which in turn increase
the construction costs To sum up we can conclude that the greater the size of the unit
the higher the risk of cost overruns (Cooper (2010))
Regarding overall learning effects we also found that cumulated experience did not
induce a reduction in costs This result is often seen as a consequence of the intrinsic
characteristics of a complex technology such as nuclear power In particular we can
argue that given that an important part of the design of a nuclear power plant depends
on the characteristics of each site (Cooper (2010) Grubler (2010)) it is likely that the
experience gained in the construction of any reactor in a given location would not be
directly applicable to other projects and that this prevents achieving lower costs
These first two results can be summarized in the large size syndrome component As
mentioned before it has been observed in the nuclear industry that the experience gained
by vendors and operators translates into adjustments and improvements with the effect
that new reactors are bigger more complex and more expensive than their predecessors
In the French case Grubler (2010) and Finon (2012) argued that the potential learning
effects from the overall industry experience were not fully exploited precisely because
when EDF and Framatome gained experience the decision was taken to construct an
entirely new French nuclear reactor (ie Pprime4 series)
Nevertheless when we take into account experience within the same palier and type
we find a positive learning effect In Table 27 we can see that the estimates for these
variables are negative however their effect was less significant than that of the other
variables This result means that some cost reductions were achieved due to the stan-
dardization strategy adopted in the French nuclear power program
The intuition behind learning effects within the same type of reactor is straightforward
but less clear at palier level precisely because the reactors within them are not exactly
the same A possible justification is that each palier also represents a phase of the French
nuclear program Hence reactors within the same palier were designed and built in the
same time window and most of them were also built on the same sites which suggests
that suppliers workers engineers and locations did not change substantially during the
construction of one palier but that they did change between them
Chapter 2 39
To our knowledge this is the first time in economic literature that public data has
be used to justify the gains EDF claimed it obtained thanks to the standardization
strategy For instance Roche (2004)pointed out that the construction of the same series
of reactors made it possible to reduce the number of hours of skilled labor per unit and
obtain better prices for components In the light of our results we can conclude that
indeed these gains helped to reduce construction costs after the first unit of the series
was built
This result is also linked to another characteristic of the French nuclear program ie
multi-site construction involving several reactors of the same type built at one location
This strategy is another factor in easing cost escalation and citetRoche argued that a
discrepancy in location conditions translates into a gap in costs when constructing the
same type of reactor at different sites however these projects do not require a completely
new design or new components and thus the costs are avoided
Another important result shown in Table 27 is that reactors with better safety indica-
tors and so lower UCL and US7 values are related to higher costs Therefore we have
some evidence that the latest reactors although more expensive have also embodied
safety improvements that have helped to reduce the number of unplanned outages that
might induce an accident
These two last results are summarized in the second component which we call safety
feedback Here we have two counteracting effects on the one hand we determined
that constructing the same type of reactors induces cost savings which reflects positive
learning effects and on the other hand we observed that the newer reactors register
better safety indicators but that this improvement means an increase in construction
costs
This result shows the implicit trade-off between standardization and technological change
that is key to understanding the economics of nuclear power Even if it is true that
standardization reduces uncertainty and could lead to lower costs as we found for the
case of the French nuclear fleet it is also true that when new technologies are available
there is no reason to keep using older and less efficient technology especially when new
designs improve safety
In summary this result indicates that building similar reactors reduces the technological
uncertainty linked with adopting a new design and at the same time as Roche (2004)
has pointed out improves understanding of how minor modifications can be made to
improve reactors safety performance For this reason standardization can been seen as
one of the potential sources of savings for future nuclear reactors and also a way to
achieve better safety performance
Chapter 2 40
24 Conclusion and Policy Implications
In this paper we sought to use the current construction costs recently published in the
Cour de Comptes report in order to identify the main drivers of the cost escalation of
nuclear power construction in France to re-address the existence of learning effects and
to test whether the cost increase is related to safety improvements
It was originally believed that cost escalation was a factor of about 35 when comparing
the unit costs of units built in 1974 with those completed after 1990 (Grubler (2010))
Using the new data we found that the escalation was a factor of about 15 from the first
unit to the most recent and that the escalation was thus less severe and by no means
comparable with the US case For this reason it is important to review the actual
construction costs of the French nuclear power programme to identify the elements
that should be taken into account to overcome or at least mitigate the cost escalation
phenomenon
This analysis is particularly important for those countries that are interested in em-
barking upon nuclear power programmes Within the European context nuclear power
can play an important role in energy transition to a decarbonized electricity supply It
is important to recall that despite the German nuclear phase out there are other EU
members states like the United Kingdom for instance that see in nuclear an alternative
to meet their CO2 targets while securing their energy supply
On the basis of our analysis using the Cour des Comptes data there is every reason
to believe that construction cost escalation is mainly due to a scaling-up strategy The
increase in the reactors size involved a technological change that induced the construction
of more complex units meaning longer lead times to build them and ultimately an
increase in costs per MW As mentioned before it is not possible to rule out the presence
of economies of scale precisely because bigger reactors are more complex The recent
experience in the construction of the first of a kind EPR reactors has confirmed that
larger reactors are likely to be more expensive
For this reason capacity could be one of the first features that nuclear vendors should
rethink in the long run In this direction several authors such as Rosner and Goldberg
(2011b) and Kessides (2012) have outlined the advantages of installing small modular
reactors10 They argue that these reactors have shorter construction schedules and lower
market risks which reduces capital costs In addition they consider that other cost
savings can be achieved through off-site module fabrication as well as from learning by
doing in the production of multiple modules Moreover investments could be recovered
10 Small Modular Reactors are nuclear power plants with 300MWe or less capacity
Chapter 2 41
quicker because construction lead times are likely to be shorter than for bigger units
(Rothwell and Ganda (2014))
Nowadays small modular nuclear reactors are still in an early stage of development
None of the existing concepts have been tested licensed or constructed However in
the US the Department of Energy has conceived a small modular reactor technical
support programme to accelerate the design certification and licensing of small modular
reactors with different vendors and it is expected to have its first regulatory approval by
2018 If these reactors become affordable and meet all safety standards they may be an
interesting alternative
Regarding our results on learning effects we found that overall experience did not trans-
late into lower costs but that positive learning effects were achieved through construct-
ing the same types of reactor Given the nature of this result it would appear that the
French nuclear power programmes standardization and multi-unit location strategy has
been successful because it has helped to overcome delays and uncertainties during the
construction process and thus has reduced the costs of subsequent reactors in the same
series
This lesson is particularly important for those countries that are interested in installing
a high number of new nuclear power plants Unlike other technologies the construction
of a nuclear power plant depends largely on on-site characteristics and therefore one
way of overcoming the cost escalation curse could be to reduce technological variety and
construct multi-unit sites Such a strategy could reduce the uncertainty that comes with
adopting a new technology as well as any design modifications required when reactors
are built in other locations
According to our result we can argue that it is likely to expect that the cost for the
EPR reactors that would be built after Hinkley Point C11 will be lower thanks to
learning effects Thus the guaranteed price to construct and operate these reactors
should be smaller However nuclear deployment in England takes into consideration
the construction of different type of reactors at other sites Therefore our results also
suggest that the experience gained in this project will not be directly transferable into
cost reductions for other projects in other locations given that the types of reactor that
are planned to be constructed are not the same
The results in terms of safety indicators show that reducing the risk of a serious acci-
dent has also played its role in French cost escalation as found by Cooper (2010) for
the US case Our estimates suggest that designing new nuclear reactors necessarily
includes safety improvements (reflected in better safety indicators) In consequence
11 EDF Energy is also proposing to build two EPR reactors at Sizewell C in Suffolk
Chapter 2 42
when safety concerns are partly internalized in the construction costs safer reactors are
inherently more expensive For this reason the economics of safety may constitute the
most challenging issue for the future of nuclear power On the one hand the terrible
consequences of a nuclear disaster as seen after the Fukushima Dai-ichi accident leave
no room for laxity On the other hand the particular nature of serious nuclear accidents
ie huge damage but very low and uncertain probability of occurrence makes it difficult
to determine whether safety investments are cost-effective
Once again the French case teaches us an important lesson An analysis of principal
components shows that the most recent units in the same series perform better in terms
of the safety indicators used in the model Thus standardization not only generates
learning effects in the construction process but can also play a role in terms of achieving
better safety levels
In conclusion an analysis of the current construction costs of the French nuclear power
programme provides important lessons for countries interested in building new nuclear
power plants on how to ease cost escalation This is an important issue given that the
continual rise in the construction of the latest generation of reactors puts into ques-
tion the competitiveness of this technology with respect to alternative sources of energy
Taking into account our results a good strategy would be to reduce the variety or types
of reactor to be installed in order to obtain positive learning effects not only regard-
ing construction costs but also regarding operations in particular safety performance
Another consideration is that new technologies such as small modular reactors might
be an interesting alternative to reduce capital costs given the smaller scale of units but
also the possibility of off-site module manufacture might reduce the risk of delays and
associated cost overruns
Chapter 3
Nuclear reactorsrsquo construction
costs The role of lead-time
standardization and technological
progress
31 Introduction
311 Toward a nuclear renaissance
By August 2014 the World Nuclear Association (WNA) lists 72 reactors under con-
struction in 14 countries1 This level of new builds represents a record for the nuclear
industry since 1987 Countries and investors interested in nuclear power have their eyes
on the outcome of these projectsas their successes could represent a green light for fur-
ther deployment of nuclear power while failures might led to a stagnation of new builds
and a decline of nuclear power share in the worldrsquos energy production
Even though the current status of new builds can be seen as a first step towards the
so-called nuclear renaissance there is a long way to go in order to see the industry
revival envisioned when this term emerged in the late 1990s At the same time most
of the drivers that could favor a nuclear expansion are still valid today increasing
energy demands in particular from developing countries the need to reduce fossil fuel
dependence and the increased awareness of the dangers and possible effects of climate
1 See the list httpworld-nuclearorgNuclearDatabaserdresultsaspxid=
27569ampExampleId=62
43
Chapter 3 44
change Despite this positive environment it is yet to be seen if a rapid expansion of
nuclear power capacity is possible and - more important - if it is economically profitable
If we take a closer look to the list of nuclear reactors under construction there are
reasons why one should be cautious when arguing that these projects could spur a rapid
expansion of nuclear power or even that they will come to term As pointed out in
the World Nuclear Industry Status Report (2014) 8 of these reactors have been under
construction for more than 20 years 1 for 12 years and 49 have already faced significant
construction delays
Unfortunately this is not a new situation for the nuclear industry as the construction of
new reactors has been characterized in the past with lengthy lead-times in particular in
western countries For instance Schneider and Froggatt (2014) noticed that the average
construction time of the last 37 units that started since 2004 is 10 years This is twice
what is usually expected by nuclear vendors It is also substantially longer than the 3
years period to build a combined cycle gas plant and the 6 years period to build a coal
plant
In addition to the concerns about unexpected construction delays the second and prob-
ably most important challenge for nuclear power expansion is the economic profitability
of building those reactors Given that upfront investment costs are the main driver2
of nuclear electricity generating costs any unexpected and significant increase of the
expenses during the construction can significantly undermine the profitability of the
project When the construction costs of a new nuclear power plant increase substan-
tially it can even be more attractive to abandon the project and for outsider investors
to consider other energy sources
These concerns regarding Generation III+ nuclear reactors competitiveness have initially
emerged in the United States (US) due to the escalation in the construction costs
expectations for new reactors The revised estimates took into account the changes
made by utilities in the application forms filled to the Nuclear Regulatory Commission
In 2003 the cost expectation was US$2000 (see Base case in Parsons and Du (2003))and
this figure progressively increased to US$4000 per installed kilowatt (see Parsons and
Du (2009) and Rosner and Goldberg (2011a))
Similarly the recent experience in the construction of the first of a kind EPR3 in Europe
has also contributed to revising expected costs of building new nuclear power plants in
OECD economies Despite that Finland and France have successfully built nuclear
reactors in the past this did not prevent that both to face significant cost overruns In
2 According to the IEA (2010) the share of the capital costs in the leveled cost of electricity in nuclearpower is between 60 to 80
3 European Pressurized Reactor
Chapter 3 45
France the construction of Flamanville 3 unit is almost 3 times more expensive than
initially expected (e3 billion in 2009 versus e85 billion in 2012) Not to mention that
the plant should not be operational until 2016 which represents nearly a 100 increase
in lead-time from 5 to 9 years
The cost over-runs experienced in the past and the multiple upward cost revisions and
delays in construction over the last decade represent important barriers for nuclear ex-
pansion as they limit the countries where new reactors can be installed These concerns
mean that nuclear new builds are risky projects first because there is no early yield
due to the lengthy lead-times and second because the yield is uncertain in the long
term due to possible cost escalations during the construction These issues are heavily
penalized by the financial markets and further restrict the amount of capital to invest
in the sector
Consequently more than 60 of the new build is located in countries where instead of
the financial markets (private investors) the government plays a central role as investor
in the power sector through state electric companies This is the case in China where
the three national nuclear utilities are largely or entirely state-owned In Russia the 6
reactors that are under construction are designed and owned by the state-owned Rosen-
ergoatom Corporation Finally iIn South Korea the 5 new builds care also designed and
owned by the state-owned Korea Electric Power Corporation (KEPCO)
Few of the new entrant countries that have raised their interest in nuclear power over
the last decade have started the construction of their first reactor Most of them have
postponed construction probably due to difficulties to finance these projects This
has been the case of Vietnam Poland and Turkey In addition even for countries with
lower financial constraints upfront investment costs have been the key driver to select
reactor design For instance according to Schneider and Froggatt (2014) the United
Arab Emirates chose a Korean design over Francersquos EPR because it offered the highest
capacity factors lowest construction costs and shortest construction lead-times
Taking into account the above we can argue that the expansion of nuclear power today
depends on how the industry identify the key elements that will curb investment cost
escalation and allow it to meet construction schedules
312 Existing literature on nuclear power plants construction costs
and lead-times
The economic literature on construction costs and lead-times of nuclear power plants
has so far failed to provide clear empirical evidence of their determinants partly due
Chapter 3 46
to a lack of comparable and reliable data Most of the existing econometric studies
have focused on US construction costs and attribute the escalation in costs to a lack of
standardization an increase in complexity of new reactors and safety related regulatory
interventions after Three Mile Island accident
A number of authors argue that the experience gained by nuclear vendors led to the
design of bigger and more complex reactors that took longer to build and required closer
regulatory oversight (Komanoff (1981) Zimmerman (1982) Rothwell (1986) Cantor and
Hewlett (1988) and Cooper (2012)) It is also generally accepted that the heterogeneity
in the US nuclear fleet and the multiplicity of vendors and utilities failed to achieve
learning by doing gains David and Rothwell (1996) argue that the lack of standard-
ization in the nuclear US fleet entailed ballooning of construction costs whereas some
positive learning effects are found by Cantor and Hewlett (1988) and McCabe (1996)
for construction projects managed directly by utilities
In the case of the French nuclear program (second largest nuclear fleet after the US)
the data on construction costs were only published in 2012 (Cour des Comptes (2012))
Beforehand the cost data used by Grubler (2010) was based on extrapolations of annual
investment expenditures of the nuclear utility EDF and rejected the existence of learning
by doing Conversely using the actual construction costs Escobar-Rangel and Leveque
(2012) find evidence of cost reductions due to learning effects within specific reactor
models
In this paper we propose the first empirical investigation of the role of lead-times
standardization and learning opportunities on nuclear reactorsrsquo construction costs us-
ing historical cost data from both the US and France This choice is motivated by
the fact that these two countries have followed different paths in terms of industrial
structure and technological diversity For instance while in the US several firms have
acted as Architect-Engineer (A-E) and vendors of nuclear reactors these roles have
been the responsibility of the utility EDF and Areva (formerly Framatome) in France
respectively Similarly if the two countries have both built Pressurized Water Reactors
(PWR) France has implemented fewer technological variations compared to the US
This means that by looking at French and US experience together one can benefit from
more heterogeneity in the data in order to test more research hypotheses and derive
robust estimates
Chapter 3 47
313 The contributions of this paper to the economic literature and
the nuclear energy policy debate
Our model is close to the one proposed first by Rothwell (1986) and then Cantor and
Hewlett (1988) In particular to the latter where a two-stage least squares equation
model is estimated for construction costs and lead-time using US data However our
analysis tackles a number of other empirical shortcomings First our study allows a
direct comparison of nuclear reactorsrsquo overnight construction costs in the two countries
using the access to data4 on engineering and other related expenditures for French
reactors which are not detailed in the Cour des Comptes (2012) report
Unlike other papers we distinguish the potential benefits of standardization that might
arise in the short term from those that can appear in the long term In the short term
we argue that a reduced diversity of designs under construction in a particular year
can affect the costs and the lead-time of an ongoing project due to coordination gains
(for instance scale effects in the componentrsquos supply chain or for the safety assessment
by the regulatory agency) We also consider that standardization may allow long term
benefits through learning by doing spillovers gained from past experience in building
similar units In order to capture these spillover effects we differentiate the previous
experience based on reactor models and A-E firms
At the same time we study the possible effects of learning by searching (ie innovation)
on construction costs given the importance of public RampD expenditures on nuclear
power Evidence of a positive learning by searching effect has only been found using
cost and innovation data from energy economics modelling tools (Jamasb 2006) In
that respect to the best of our knowledge there is no existing literature that has looked
at the effect of innovation using actual cost data Hence our study is the first to bring
together data on nuclear power overnight construction costs and knowledge capabilities
data the latter measured as a stock of knowledge based on patent data
Our results suggest that standardization of nuclear power programs is one of the main
factors in limiting costs escalation In the short term a low diversity of reactors under
construction leads to coordination gains that reduces costs indirectly through a reduction
in lead-time More importantly this result is also confirmed by using data of lead-
times of other OECD countries with different market structure and technological paths
notably Asian countries (ie Japan and South Korea) that have achieved to maintain
relatively constant their construction lead-times
4 These data on overnight construction costs have been made available to the authors by EDF Assuch they differ slightly from the data available in the Cour des Comptesrsquo report where expenditureregarding engineering work pre-operating expenses etc are presented at an aggregated level
Chapter 3 48
We find that standardization allows learning effects We have denominated this spillovers
as the long term benefits of standardization considering that the cost reductions will
only appear if the same nuclear model is built by the same A-E firm repeatedly This
highlights the importance of reactor design standardization and the role played by the
A-E firm in reducing construction costs increases
We further show that contrary to other energy technologies (Erickson and Drennen
2006) there is a negative effect of learning by searching on reactorsrsquo overnight construc-
tion costs This means that the variable that captures innovation and knowledge is one
of the main drivers of the cost escalation registered in the US and France This result
opens the door for further research on the areas in which innovation in nuclear power
technologies has focused In the literature (Berthelemy 2012a) has found that innova-
tion is closely linked better safety performance which in some sense allow us to think
that innovation has been partly driven by nuclear safety considerations
These results suggest paths for future cost reductions through greater standardization
of reactor technologies and more emphasis on the role of A-E firms in improving the
competitiveness of nuclear power In parallel from a policy perspective one may argue
that lead-time will play a more important role under a liberalized electricity market
where higher discount rates may apply meaning that the competitiveness of nuclear
power will be more conditional on the standardization of nuclear programs For this
reason we have explore further the trends of the construction lead-times in other OECD
countries
The rest of the paper is organized as follows in Section 32 we present the model
and main hypotheses regarding learning effects and the data Section 33 describes
our empirical strategy and the results Section 34 further investigates international
experiences with nuclear power construction using a larger dataset on nuclear power
lead-time and finally we conclude in Section 35
32 Model main hypothesis about learning opportunities
and data
321 Model for construction costs and lead-times in nuclear power
In the process to construct a nuclear power plant many firms are involved First an
electricity generation firm (hereafter the utility) places an order for the construction of
a nuclear reactor and selects a specific design offered by a nuclear vendor Once the
design is chosen the construction is managed by an Architect-Engineer (A-E) firm who
Chapter 3 49
is in charge of supervising and coordinating the constructor the nuclear steam supply
system manufacturer the turbine manufacturer as well as a number of subcontractors
The allocation of firmsrsquo responsibilities may differ between projects for instance it
is possible that the utility decides to act as the A-E (as it is the case in France and
sometimes in the US)
Rothwell (1986) proposed a structural model to represent the involvement of multiple
firms in the construction of a nuclear power plant In his model the utility seeks to
maximize the net present value of the project by selecting an optimal construction lead-
time given the technical characteristics that were chosen in the tender (ie capacity
reactor design etc) The A-E firm will minimize costs given the the optimal lead-time
selected by the utility
In this paper we retake some of the elements in Rothwell (1986) but instead of a
structural model we opt for a reduced form model closer to Cantor and Hewlett (1988)
We propose an two least squares estimation (2sls) for the construction costs and the lead-
times taking into account that there might be some unobserved variables that affect the
simultaneously both variables For instance we can think that there are additional costs
associated with longer construction periods like rental of idle specialized equipment and
labour force or unexpected costs (and delays) due to defective components Cantor and
Hewlett (1988) also pointed out that longer lead-times increase the risk of regulatory
intervention which might lead to construction changes and therefore cost increases
Given that OLS estimators will be biased we will use the expected electricity demand
(EDemi) as an instrument for lead-time as in Cantor and Hewlett (1988) They con-
sidered this variable as a valid instrument inspired in the structural model in Rothwell
(1986) First because the lead-time is chosen based on the expected demand and second
because it does not influence current construction costs Our baseline model specifi-
cation follows Equations (31) and (32) where Xi is a vector of independent variables
which can impact both cost (CTi) and lead-time (LTi) and will be further presented in
the next sub-section
CTi = α0 + α1LTi +
Jsumj=2
αjXij + υi (31)
LTi = β0 + β1EDemi +
Jsumj=2
βjXij + εi (32)
Chapter 3 50
3211 Hypotheses on the role reactorrsquos design standardization
As aforementioned we are interest in investigating the role of standardization in con-
struction costs and lead-times In our set of explanatory variables we are going to
test two potential efficiency gains may be expected from the standardization of nuclear
programs The first one aims to capture the benefits (in terms of cost reductions) that
might arise in a short time period while the others will test the presence of learning by
doing that can be seen as a long term effect
Our first hypothesis is that standardization benefits can arise in the short term from a
low diversity of nuclear reactors under-construction We expect that when a reactorrsquos
design is being built in the same country in the same year the project might benefit
from coordination gains during the construction period This can be motivated by the
fact that similar high-tech components will be built during a short time window such as
steam generators or turbines leading to economies of scale Similarly a low diversity in
reactors under-construction also lowers technological uncertainty and therefore it reduces
the number unexpected events that might delay the construction
To measure this potential benefit of standardization during the construction period we
compute a Herfindahl Hirschman Index (HHI) index based on the number of specific
reactor models under-construction when the construction of reactor starts This index
is defined according to Equation (33) as the sum of the squares of the market shares
of the M reactor models under-construction in country c and year t To capture this
expected benefit of standardization we also control for the number of reactors under-
construction (NPPUCi) as for instance a high HHI could either correspond to a
situation where only one reactor is under-construction or to a situation where multiple
and similar reactors are being built
HHIct =
Msumm=1
s2mtc (33)
3212 Hypotheses on learning by doing
Regarding the potential benefits of standardization in the long term David and Rothwell
(1996) recognized that there is a trade-off between the ability to learn from diversity
in nuclear reactors versus learning from similar models Nowadays this trade-off is
important given that in some countries like China the current strategy is more directed
to favor the construction the same type of reactor repeatedly rather than to diversify
the nuclear fleet While in others like the case of UK it is envisioned to construct
different models in different sites
Chapter 3 51
Because nuclear reactors are complex units the ability to derive learning effects may
be conditional to the similarities between reactors models and the A-E which builds
reactors In that respect we hypothesize that learning by doing can take place through
two main channels nuclear reactors completed by the same A-E firm (ExpArqi) and
nuclear reactors of the same design completed (ExpMoi)
Furthermore the benefits of learning by doing might also be conditional on the A-E firm
experience with specific nuclear design (ExpArqMoi) This variable corresponds to the
second potential benefit of standardization that we wanted to test This more restricted
level of learning by doing opportunities corresponds to the traditional definition used in
the economic literature (Irwin and Klenow 1994)
It is important to mention that in the previous literature the learning by doing was
measured using either the cumulated experience at the country or firm level In this
paper we are going to decompose the country level experience (ExpCi) into four level
of learning effects (i) The experience of the A-E with the reactor model (ExpArqMoi)
(ii) the experience of the A-E with other models (ExpArqNoMoi) (iii) the experience
of other A-Es with the same model (ExpNoArqMoi) and (iv) the experience of other
A-Es with other models (ExpNoArqNoMoi)
ExpCi = ExpArqMoi +ExpArqNoMoi +ExpNoArqMoi +ExpNoArqNoMoi (34)
3213 Hypotheses on leaning by searching
One standard hypothesis made in the energy economics literature is that learning by
doing might not be the only source of cost reductions In particular learning by searching
is often found in many empirical studies dealing with the energy sector like Larsen
and Sundqvist (2005) and Erickson and Drennen (2006) as a variable that contributes
significantly to cut back costs In the case of nuclear power the impact of innovation
activity on cost remains an empirical question
According to Jamasb (2006) innovation activity may contribute to cost reduction how-
ever it can also be argued that innovation in nuclear power essentially deals with safety
improvements because of the role of safety regulation As such innovation might lead
to safer but more complex and more expensive nuclear reactors
As a proxy for nuclear innovation we rely on a unique dataset on nuclear specific patents
using a discounted stock of priority patent applications We use the patent class Y02E30
which covers technologies specific to nuclear fission reactor technologies The discounted
Chapter 3 52
stock is set at the country level reflecting the fact that innovation can come both from
RampD laboratories and nuclear vendors and can be understood to reflect national knowl-
edge capabilities We set the discount factor δ at 10 a conservative parameter found
in many studies on the dynamics of innovation (Peri 2005) This variable is denoted
Knowit and is defined according to Equation (35) where for each nuclear reactor we
use the discounted stock of patented innovations in country i when construction starts
at time t
Knowit =infinsumk=1
(1minus δ)k Patentitminusk (35)
322 Data
In our model we have taken the overnight construction costs expressed in 2010 e per
MWe as our variable of interest These costs comprise the engineering procurement
and construction expenses but they exclude those related with financing or any cost
escalation due to changes in the interests during construction In short this cost repre-
sents the lump sum up front that would have to be given if the project was completed
rdquoovernightrdquo
We have used the overnight costs instead of the actual construction cost for two main
reasons First because the financing expenses of each project will depend not only on
the lead-time but on the rate of interest on debt the debt-equity ratio and if it is
regulated how the capital costs are recovered By excluding these costs we get of rid
of the variance linked with differences on the financial structure of each utility and the
possible subsidies (that is very likely in the case of the French nuclear fleet) and we are
able compare all the projects with an uniform measure Second because we can focus
our attention on the potential effect of the observed lead-times in the engineering and
construction cost escalation if we have used the actual costs it would not have been
possible to isolate this effect
The cost data for the French nuclear fleet were collected from the French Audit Agency
Cour des Comptes (2012) report This sample only has 29 observations because the
costs on the report were presented by pair of reactors Regarding the US construction
costs we have included the cost data for 99 reactors (92 in operation and 7 shutdown)
published in Koomey and Hultman (2007) Unfortunately the capital costs for the 12
remaining operational reactors are not available
Figure 31 below highlights the strong differences between the trend in overnight con-
struction costs in US and France In particular we observe that over the entire time
Chapter 3 53
period the costs have more than doubled in France from 920eMWe in 1980 for the
Tricastin 3 and 4 reactors up to 2200eMWe in 2000 for the Chooz 1 and 2 reactors
In the US this increase has been much more rapid with the cost almost increasing by
a factor of 14 from 600eMWe in 1972 for Turkey Point 3 up to 8500eMWe in 1989
for the Shoreham reactor
One can also note that costs have been much more dispersed in the US For instance
if we look at nuclear reactors completed in 1986 in the US the costs range from
2000eMWe for Catawba 2 and 6250eMWe for the Hope Creek reactor Since France
and the US have experienced important differences in terms of industrial structure
choices during this period with more vertical integration and standardization of nuclear
reactor designs for France this figure provides an initial suggestion that the French
experience has been more successful in containing the escalation of construction costs
Figure 31 Nuclear reactorsrsquo overnight construction costs in the US and France
Following Rothwell (1986) we define the lead-time variable as the difference (in years)
between the commercial operation date and the construction start date This informa-
tion was taken from the IAEA Power Reactor Information System (PRIS) database
From this same database we have collected other reactor details as the net capacity
Chapter 3 54
(size of the reactor) in MWe information on nuclear reactor cooling systems and con-
tainment structures5 in order to define different reactor models In Figure 32 we plot
the construction lead-times of nuclear reactors in the two countries One can generally
notice that we observe the same trend as in the previous figure presenting construction
costs construction time has increased more rapidly in the US than in France This
Figure suggest that it might be possible that long construction time will generate other
expenses in addition to the financing costs owing to immobilized equipment and labour
force This may also reflect complexity of nuclear design leading both to more expensive
reactors and longer construction times
Figure 32 Nuclear reactorsrsquoconstruction lead-time in the US and France
The increase in lead-time still appears to be of a lower magnitude than the increase in
cost For instance lead-time in the US ranges from 5 years for the Vermont Yankee
reactor up to 233 years for the Watts Bar 1 reactor which represents a 5-fold increase
As instrument we have computed the 3 year time trend in the electricity consumption
as a proxy of the expected electricity demand For the French case we have taken the
national electricity consumption given that all the reactors are connected to the same
grid thus all the units intend to meet the national demands For the US we consider
the electricity consumption for the relevant market given that there is no common grid
5 Data about nuclear reactors cooling system and containment structure are detailed in the AppendixE
Chapter 3 55
therefore we took the time trend only of the electric power market6 where the reactor
was located The data was taken from the statistics of the Department of Energy (DOE)
for the US and the French National Statistics Institute (INSEE)
In the model we have also included a set of dummy variables The first one aims to
identify those projects in which the utilities were in charge of the construction project
and did not delegate it to a A-E firm For the US case we turn to the information
provided by the Nuclear Regulatory Commission (NRC) For France these data do not
require any specific access as EDF has always acted as the A-E firm and is the sole
utility to operate nuclear reactors The other dummy variables were included to control
for the possibility of structural breaks following two major nuclear accidents Three Mile
Island (TMI) in 1979 and Chernobyl in 1986 Because the TMI accident took place in
the US we also investigate for the possibility that this accident has had a heterogeneous
effect in the two countries with country specific TMI dummy variables
Finally we collect data on prices for two major inputs to the construction of nuclear
reactors cement and labour force These data are collected from the French National
Statistics Institute (INSEE) and the US Census Bureau respectively for the two coun-
tries All the definitions and descriptive statistics for our relevant variables are summa-
rized in Table 31 below
Table 31 Descriptive statistics
Variable Definition Mean Std Dev Min Max
CT Cost in e2010MWe 2282 1639 599 8571LT Construction time 8578 3507 43 233Cap Size in MWe 992390 201854 478 14725HHIMo Standardization of reac-
tors under-construction0230 0171 0122 1
Know Discounted stock of nu-clear patents
58251 10396 32648 90339
ExpArqMo Experience A-E model( reactors)
1695 2672 0 14
ExpArqNoMo Experience A-E diffmodel( reactors)
9867 13162 0 54
ExpNoArqMo Experience diff A-Emodel ( reactors)
2921 4073 0 18
ExpNoArqNoMo Experience diff A-E diffmodel ( reactors)
27414 25731 0 87
ArqUtility Vertical integration A-Ewith utility
0382 0487 0 1
Cement Cement cost index 88019 31571 368 186556Labour Labour cost index 247568 168027 87439 921968EDem Future electricity de-
mand (3 year trend)043 010 017 061
NPPUC Reactors under-construction
42632 20747 2 69
6 We added up the electricity consumption of the states that from each one of the 10 electric powermarkets California MISO New England New York Northwest PJM Southeast Southwest SPPand Texas
Chapter 3 56
33 Model specifications and results France versus the US
331 Model specifications
The equations used to study construction costs and lead-time follows a Cobb-Douglas
functional form7 taking into account the endogeneity of lead-time we use expected
demand of electricity as an instrument and we control for the effects of capacity and
input prices A set of explanatory variables to identify learning effects is included as well
as the HHI index for short term standardization and dummy variables to differentiate
projects managed or not by the utility to capture the effect of structural breaks due to
major nuclear accidents and to control for temporal and country fixed-effects
Based on Equations (31) and (32) the equations for the baseline model specification
(Model 1) are as follows
ln(CTi) = α0 + α1 ln(LTi) + α2 ln(Capi) + α3 ln(Cement) + α4 ln(Labour)+
α5ArqUtilityi + α6 ln(ExpArqMoi) + α7 ln(ExpArqNoMoi) + α8 ln(ExpNoArqMoi)+
α9 ln(ExpNoArqNoMoi) + α10HHIMoi + α11NNPUC+
α12TmiUS + α13TmiFR+ α14Cherno+ α15Country + α16Trend+ υi (36)
ln(LTi) = β0 + β1 ln(Capi) + β2ArqUtilityi + β3 ln(ExpArqMoi) + β4 ln(ExpArqNoMoi)
+ β5 ln(ExpNoArqMoi) + β6 ln(ExpNoArqNoMoi) + β7HHIMoi
+ β8 ln(EDem) + β9NPPUC + β10TmiUS + β11TmiFR
+ β12Cherno+ β13Country + β14Trend+ εi (37)
In Model 2 we consider the possibility of learning by searching in addition to standard-
ization and learning by doing therefore in Equation (36) we include Know Model 3
focuses on the learning effects at the A-E firm level and we aggregate the experience of
the A-E firm regardless of the reactor model Finally Model 4 considers the experience
at the reactor model level regardless of the A-E firm
7 This functional form that has been extensively used in the literature on nuclear construction costseg Komanoff (1981) Cantor and Hewlett (1988) McCabe (1996)
Chapter 3 57
332 Results
The estimated output for Equations (31) and (32) is presented in Tables 32 and 33
below for the four different model specifications In each table we find the estimates
with the corrected standard errors in brackets underneath them
Before we proceed to present the results it is important to mention that the total effect
of the explanatory variables in the overnight costs has to take into account the partial
effect in the cost equation as well as the indirect impact in the costs through changes
in the lead-time equation As we can see in Tables (32) and (33) the estimate of the
lead-time is positive and significant therefore we have to offset the effect of the variables
in the first equation with the indirect effect in the second one as follows
d lnCT
d lnXk=part lnCT
part lnXk+part lnCT
part lnLTlowast part lnLT
part lnXk= αk + α1 lowast βk
The first result of our analysis refers to the importance of model specification in identify-
ing significant and positive learning effects in the construction of nuclear power plants
Previous studies account for the experience at the firm level as in Model 3 or at the
technological level as in Model 4 By comparing the results across the models we can
see that the estimates in Models 1 and 2 where we include the experience of the same
A-E firm in the same model ExpArqMo are those where we find the largest learning
effects While the learning effects are weaker in Model 3 and they do not exist in Model
4
The estimates of Model 1 and 2 allow us to conclude that in average we can expect
that the costs for the second unit of a reactor model built by the same A-E firm will be
reduced in 10 to a 128 This result goes in line with what is predicted in the economic
literature on learning effects and coincides with recent evidence (Escobar-Rangel and
Leveque 2012) on the French nuclear fleet To test the robustness of these results we
used different measures for the experience variables (ie ExpArqMo ExpArqNoMo
ExpNoArqMo and ExpNoArqNoMo) as shown in Appendix C9
Regarding the learning effects in the lead-time equation we find that experience in
the construction of other models either of the same firm (ExpArqNoMoi) or of others
8 Here we have computed the total effect of ExpArqMo in the cost In Model 1 is equal to(0022217)-0152=-010 and in Model 2 to (0022185)-01655=-012 If we consider that theexperience from the first to the second unit represent 100 increase in the experience we obtainthese results
9 For robustness tests we consider in Appendix C country specific time trends (with a quadraticterm) in order to control for instance for time variant changes in safety regulation in France andthe US We also define the learning by doing variables as 1(1+X) instead of ln(X) as both modelspecifications have been used in the literature Zimmerman (1982) Our results remain unchanged
Chapter 3 58
Table 32 Estimation output of Equations (31) and (32)
Model 1 Model 2Cost Lead-time Cost Lead-time
ln(Capi) -0897 0188 -0793 0188 (0175) (0068) (0170) (0068)
ln(Cementi) -0214 -0230(0405) (0394)
ln(Labouri) 0873 0154(0409) (0413)
ln(LTi) 2177 1825 (0468) (0465)
ln ExpArqMoi -0152 0022 -0166 0022(0034) (0015) (0033) (0015)
ln ExpArqNoMoi -0036 0039 -0025 0039 (0035) (0012) (0033) (0012)
ln ExpNoArqMoi 0021 0035 0008 0035 (0036) (0015) (0035) (0015)
ln ExpNoArqNoMoi -0296 0156 -0223 0156 (0099) (0023) (0096) (0023)
Knowi 1464 (0438)
HHIMoi 0917 -0415 0865 -0415 (0468) (0207) (0463) (0207)
ln NPPUCi 0429 -0102 0356 -0102 (0102) (0045) (0099) (0045)
ArqUtilityi -0332 0052 -0340 0052(0084) (0037) (0081) (0037)
ln(EDemi) -0404 -0404 (0079) (0079)
TmiUS -0847 0436 -0504 0436 (0248) (0050) (0246) (0050)
TmiFR -0328 0040 -0230 0040(0216) (0096) (0209) (0096)
Cherno -0348 0168 -0331 0168 (0142) (0037) (0137) (0037)
Constant 4829 -0449 -0828 -0449(1573) (0510) (2714) (0510)
Country FE Yes Yes Yes YesTrend + trend2 Yes Yes Yes YesObs 128 128 128 128Adj R2 0856 0914 0865 0914
(ExpNoArqNoMoi) has a negative impact on the construction periods which translates
into an increase in the construction costs This result shows that due to the complex-
ity of a nuclear reactor and the importance of A-E firms in construction projects it
is not possible to directly transfer previous knowledge and experience gained on the
construction of any type of reactor to the new projects
The estimates for the diversity index HHIMoi suggest that there might be some ben-
efits of standardization in the short term through reductions in the lead-time Recall
that when this index is close to zero it means that the nuclear fleet under construction
is diverse then these potential benefits will vanish This result can be explained by
the fact that an heterogeneous demand in the components could lead to supply chain
Chapter 3 59
Table 33 Estimation output of Equations (31) and (32)
Model 3 Model 4Cost Lead-time Cost Lead-time
ln(Capi) -0803 0170 -0814 0167 (0184) (0067) (0184) (0064)
ln(Cementi) -0451 -0360(0425) (0433)
ln(Labouri) 0711 0464(0436) (0442)
ln(LTi) 2328 2322 (0514) (0501)
ln ExpArqi -0121 0048 (0041) (0012)
ln ExpNoArqi -0243 0165(0108) (0021)
ln ExpMoi -0083 0036 (0033) (0011)
ln ExpNoMoi -0301 0188 (0116) (0021)
HHIMoi 1388 -0389 0920 -0030(0498) (0205) (0486) (0187)
ln NPPUCi 0325 -0099 0367 -0106 (0109) (0045) (0108) (0042)
ArqUtility -0410 0064 -0257 0019(0089) (0035) (0077) (0030)
ln (EDemi) -0383 -0404 (0078) (0074)
TmiUS -0824 0441 -0784 0452 (0277) (0049) (0274) (0047)
TmiFR -0238 0052 0111 -0175(0231) (0095) (0257) (0094)
Cherno -0391 0194 -0267 0155 (0160) (0035) (0150) (0034)
Constant 5503 -0301 6500 -0474(1678) (0503) (1851) (0472)
Country FE Yes Yes Yes YesTrend + trend2 Yes Yes Yes YesObs 128 128 128 128Adj R2 0837 0902 0827 0890
constraints and therefore some construction delays As such it is rational to find that
this short term effect impacts primarily the lead-time equation
Given the nature of these three results one may argue that the lack of standardization
harms the competitiveness of nuclear power in two ways Firstly it reduces the potential
gains in terms of costs savings in the long term through learning by doing at the
firm level Secondly it tends to increase the construction lead-times and therefore the
construction costs in the short term
In addition the estimates of our model highlight positive and significant economies
of scale It is important to mention that both in the US and France the nuclear
industry decided to construct bigger reactors aiming among other things to reduce
Chapter 3 60
the costs per MW installed In the light of these results we find that indeed even if
larger nuclear reactors took longer lead-times to be built they were also cheaper per
MWe For instance Model 2 indicates a net impact of -0793+(18250188)= -045
This coefficient can be interpreted as an elasticity meaning that a 10 increase in size
reduces construction costs in average by 45
With respect to the role of A-E firms we also show that when a utility takes the A-E firm
responsibility construction costs are lower than when a project is managed by another
firm This result has been identified in previous studies (eg Cantor and Hewlett (1988)
and McCabe (1996)) and it can be understood by the fact that a vertically integrated
utility reduces potential asymmetric information problems with the other firms involved
in the construction of nuclear reactors and this leads to cost reductions
The results for Model 2 show that the estimate for the discounted stock of priority patent
applications (Knowi) is positive and significant This result contradicts the pattern
observed in many energy technologies such as renewable energy sources (Erickson and
Drennen 2006) If we compare the estimates obtained in Model 1 with those of Model 2
we can see that the inclusion this variable that aims to capture the effect of innovation
reduces the importance of capacity and lead-times in the construction cost equation
This shows that bigger reactors embed innovations and that make them more complex
and need more time to be constructed The inclusion of this variable in the model allow
us to isolate the effect of complexity in the construction costs and as we can see in Table
32 this was one of the main drivers of the construction costs in the US and France
This result can partially be explained by the fact that the requirements of nuclear safety
authorities have induced innovations (Berthelemy 2012a) According to Berthelemy
(2012b) innovations in nuclear power sector are strongly related with improvements in
the safety performance of existing reactors This result highlights the long term trade-off
faced by the nuclear power sector on the one hand innovation is needed to reduce the
externalities associated with nuclear accident risks but on the other hand innovation
hampers the competitiveness of nuclear power through an increase in construction costs
One can also note that this result is contrary to the initial findings of Jamasb (2006)
who relies on data extracted from energy modelling tools Hence from a methodological
perspective this result stresses the necessity of looking at real cost data before drawing
policy conclusions on energy technologies costs trajectories
Finally it is important to analyze the effect of the major nuclear accidents in our system
of equations As we can see in Table 33 the impact on the construction costs both in
the US and in France due to TMI and Chernobyl (CH) came indirectly from an increase
in lead-time Logically TMI primarily impacted the US where this reactor was located
Chapter 3 61
and had no significant impact on France Chernobyl which took place in the Ukraine
had a positive and significant impact albeit at the 10 level on lead-time in the two
countries This result suggests that closer monitoring from nuclear safety authorities
following these accidents resulted in delays in the construction of the reactors installed
afterwards
34 Nuclear reactors lead-time Insights from other OECD
countries
The results presented in the previous section confirm that even discounting the financial
costs delays in construction affect the construction costs In addition they also point
out that a standardized nuclear fleet was one of the elements that made it possible to
reduce construction periods which ultimately resulted in a cost reduction
As mention in the introduction meeting the construction schedules will have a positive
impact in nuclear power competitiveness besides avoiding the negative effect of delays in
the construction costs First because it allows that the utilities generate revenues soon
This is particularly important in countries with private investors in the electricity sector
given that they employ higher discount rates than those used for public infrastructure
This implies that they might prefer to build a CCGT gas plant that can be planned and
built in 2 years and be willing to face the fossil fuel and carbon price risk instead of
waiting more than 7 years (in the best case scenario) to start recovering their investments
(MacKerron 2004)
Second because a long lead-time might encourage a wait-and-see policy For instance if
we take into account that with the pre-construction period it will take between 10 and
15 years for one reactor to be commercial it can be reasonable to delay the investment
and wait until the same technology is cheaper or other technologies become affordable
Third because in countries with increasing energy demands in the reactors should be
ready when needed Finally we can expect a shorter lead-time reduces the risk of
regulatory intervention and somehow it might even improve the perception of other
stakeholders have with respect to nuclear power
For the above in this section we further investigate the potential standardization benefits
on lead-time using a larger dataset on nuclear reactors from 6 OECD countries Our
aim is to test if the results that we have obtained in the previous section for the lead-time
equation hold when using a larger data set In addition we seek to gain some insights
into the construction of other nuclear fleets for which cost information is not available
Chapter 3 62
but the the average on lead-times is substantially lower than in the cases that we have
studied
341 Data and Model
The data used are also extracted from the Power Reactor Information System (PRIS)
database developed by the IAEA Similarly to the previous section lead-time is com-
puted as the difference in years between the construction and commercial dates for
reactors in 6 OECD countries We have considered the US France Canada South
Korea Japan and the UK Note that contrary to the previous section we can make full
use of the French data as contrary to costs data lead-time is available at the reactor
level
Figure 33 and Table 34 below highlight that the heterogeneity across our sample is
substantial This feature is understandable given the differences between countries and
across years in terms of labour productivity regulatory licensing process stage of de-
velopment of construction techniques etc To capture these effects we have included in
our model a fixed effect for each country as well as a time trend and a quadratic term
for the time trend
In the next table we present the means for the explanatory variables that we have
chosen to use in our regression model As we can see differences in the lead-time means
between the Western and Asian countries are substantial For Japan and South Korea
the construction of a new reactor took only 4 years approximately whereas in the US
or in the UK took more than the double even when the average size of the reactors is
similar
Table 34 Mean for the explanatory variables
Obs LT ExpArqMo HHI Cap(in year) (reactors) (index) (in MWe)
France 58 645 913 0472 1083Canada 22 707 229 0361 687South Korea 23 490 404 0672 8953Japan 50 410 3 0341 9191UK 17 863 480 0861 6451US 98 927 210 0152 9724All Countries 291 741 412 0378 9344
In Table 35 below we present the estimates similar to Equation (37) in previous Section
We have also included nameplate capacity electricity demand and the structural break
Chapter 3 63
Figure 33 Nuclear reactorsrsquo construction lead-time in OCDE countries
dummies as controls Two model specifications are considered the second one introduces
time fixed effects Other robustness tests can also be found in Appendix D10
These estimates show that increasing the size of the reactor has a positive and significant
effect on lead-time On average we have found an increase of 3 when scaling up by 10
This result confirms the importance of offsetting the scale effects in the cost equation
as although increasing the size of the reactor means lower costs per MWe the net effect
should take into account the increase in the lead-time
This model also confirms the insights from the previous section in terms of our HHI
diversity index Recall that high values of this index mean more market concentration
which in our case corresponds to a more standardized nuclear fleet On the basis of
the analysis using the lead-time there is strong and significant evidence that reducing
the diversity of the nuclear fleet is one of the major differences between countries with
longer lead-times and those with shorter construction periods
One can also notice the negative effect of the two major nuclear accidents on the con-
struction lead-time Both TMI and Chernobyl were found to be significant structural
10 In Appendix D we consider the four learning spillovers channels used in previous section and alsodefine them both as 1(1 +X) and ln(X) The results remain unchanged
Chapter 3 64
Table 35 Regression results for lead-time with experience and the HHI index
(1) (2)Variables (lnLT ) (lnLT )
HHIMoi -0291 -0472 (0135) (0182)
lnCapi 0395 0254 (0052) (0052)
ExpArqMoi 0019 -0008(0032) (0029)
lnEDemi -16970 -21219 (2866) (3265)
lnNPPUCi -0020 -0054(0033) (0047)
TmiUS 0432 0439 (0044) (0062)
TmiAbroad 0139 0142 (0054) (0061)
Cherno 0188 0214 (0029) (0027)
Constant 1105 1977(0402) (0440)
Country FE Yes YesTime FE No YesTrend + Trend2 Yes NoObs 286 286Adj R2 0840 0869Note Robust standard errors in parentheses
breaks showing that these events have an influence beyond borders As expected the
effect of TMI is stronger on the US compared to other countries
35 Conclusion
In this paper we investigate the role of lead-times the potential short and long term ben-
efits of nuclear reactor standardization and the effect of innovation on the construction
costs of nuclear reactors in the US and France between 1966 and 2002 using overnight
construction costs data Short term benefits are defined as the gains based on the diver-
sity of nuclear reactors under construction whereas long term benefits represent learning
by doing spillovers from similar reactors We use a discounted stock of priority patent
applications in the nuclear sector as a proxy of innovation
We estimate a two stage least square regression model for construction costs and lead-
time using the expected demand of electricity as an instrument for lead-time and control
for input prices and the possibility of structural breaks following major nuclear accidents
TMI and Chernobyl
Chapter 3 65
Our results identified the main drivers of the construction cost of the two largest nuclear
fleets in the world as well as the elements that explain the increase in the lead-times
registered in the past We show that the delays during the construction and techno-
logical innovations have led to an increase in the costs In addition we identified that
the continuous changes of reactor designs and the scale-up in the size of the reactors
explained part of the increase in the construction lead-times
We also found that there are positive learning effects in the construction of nuclear
reactors and the lead-times were shorter when the fleet under construction was less
diverse This result shows that the standardization strategy adopted in France was
successful in curbing the construction costs and avoiding the long lead-times that were
observed in the US
351 Policy implications for nuclear new-build programs
While this paper focuses on the US and French construction costs we argue that our
results are useful to explain some of the latest experiences in the construction of nuclear
reactors as well to suggest what we can expect it will happen in the construction of
other nuclear fleets For instance the continuous delays in the EPR construction in
Finland and France can be seen as the conjunction of two elements First the fact that
the EPR is a first of a kind means that the experience that AREVA or EDF had in
the construction of other models can not be directly transferable to this new project
According to our results we can expect an increase in the construction lead-time due to
this change The second element that may explain the delays is that the EPR is a big
reactor (it has a 1650 MWe capacity) in the light of our results it is likely that it takes
more time to construct compared with its predecessor (N4 model 1500 MWe)
Taking into account that the lead-times were found regardless the model specification
used as one of the drivers of the construction costs we can argue that the cost revisions
in the Olkiluoto-3 and Flamanville-3 can partly be explained by the delays faced dur-
ing the construction According to our model the construction costs of the EPR will
decrease only if more units of this same model are built
This last remark is important for ongoing nuclear new build programs We found that the
largest cost reductions due to learning by doing are conditional on the standardization of
nuclear programs considering that learning by doing spillovers only take place through
reactors of the same model built by the same Architect-Engineer (A-E) firm In that
respect one can expect that the cost of the last CRR-1000 reactors that are foreseen
in the Chinese nuclear power program will be cheaper than the predecessors The same
argue could apply in India where the nuclear fleet that is currently under construction
Chapter 3 66
includes 4 reactors of the same model (ie PHWR-700) build and later operated by the
same firm the Nuclear Power Corporation Of India One also expect that the costs for the
last APR-1400 in South Korea will decrease as KEPCO finish the ongoing constructions
of this same design
At the same time we show that vertical integration of the utility and the A-E firm
reduces construction costs Therefore it is possible that vertical integration will also
contribute to lower costs for the reactors that are under construction in India Korea and
Russia For new entrant countries this potential cost reductions will not be achieved
in the short term given that most of reactors will be build as turnkey projects like in
United Arab Emirates
We also show that short term gains from standardization have a positive impact on
construction costs through a reduction in lead-time the latter being one of the main
drivers of construction costs in France and the US This result is also confirmed for
a range of other OECD countries with heterogeneous nuclear programs and can be
explained by the fact that the diversity of nuclear reactor models can lead to delays
owing to supply line constraints or delays due to increased workload for the nuclear
safety regulator
In fact this result can be part of the explanation of the delays in the construction of the
AP-1000 and EPR reactors in China According to Schneider and Froggatt (2014) the
four AP1000 reactors at Sanmen and Haiyang have 18-30 months of delays due among
other issues to an insufficient support for regulatory review They also point out that
the first EPR at Taishan has a 13-15 month delay In this case the delays are linked
with malfunctions in the equipment and along with a lack of understanding with the
Chinese safety authorities Whilst our model does not allow one to distinguish delays
due to regulatory changes from those that arise from malfunctioning equipment or other
technical problems during the construction we can argue that when the nuclear fleet
is more diverse the safety assessment done by the safety authorities is likely to take
longer This might help to understand why the lead-times for the CRP-1000 model have
been kept relatively constant (it is a well known design for the Chinese safety authority)
while the difficulties during the safety assessment for other reactor models such as the
AP1000 and EPR have increased the lead-times in those projects
In parallel we also find that the discounted stock of patents in the nuclear industry
increases construction costs reflecting that innovation has not been focused on improving
nuclear competitiveness by reducing the amount of capital needed to build a reactor
This result goes in direct contrast to the pattern seen in other energy technologies
where technical progress contributes to costs reductions notably in competing carbon-
free technologies like wind power
Chapter 3 67
From a methodological perspective this result might explain why forecasts of nuclear
power share in energy mixes in energy economics modelling tools have not been met The
existing literature has shown that certain modelsrsquo calibration (Jamasb 2006) implicitly
assumes that nuclear construction costs benefit from innovation effort when in reality
what we found is that technological progress have made new reactors more expensive
This result highlights the importance of building these models on evidence based on
actual cost data
However the implications of this last result go beyond a methodological contribution
Why innovations have increased the costs of the each new generation of reactors
Berthelemy (2012b) argues that innovation in nuclear power has allowed the indus-
try to achieve better safety performance for existing reactors In other words one could
argue that safety requirements have led vendors to include better and more reliable com-
ponents and systems in new designs aiming to improve safety features For instance
Areva markets the EPR reactor as a Generation III+ precisely due to the level of safety
obtained compared to previous designs and argues that this latter design ensures an
rdquounequalled safety level thanks to a drastic reduction of the probability of severe acci-
dents as well as of their consequences on the environment In addition it is particularly
resistant to external incidents (airplane crashes etc)rdquo
352 Paths for future research
Our results allow us to conclude that nuclear power faces an interesting trade-off between
reductions in costs permitted by standardization and potential gains from adopting new
technologies with better operating and safety performance Unfortunately we cannot
answer the question of the optimal pace of technological change in nuclear power tech-
nologies with our model In addition we have to recognize that by using patent data
as a measure of innovation we captured incremental innovation but we were not con-
sidering the possibility of radical technological change In that respect nuclear power
has been characterized by incremental innovations from initial reactor designs in the
1950s Conversely radical innovations such as 4th generation of nuclear reactors could
contribute to costs reductions and further work is needed to better understand the cost
dynamic of such technologies
It is also important to note that safety regulation can impact construction costs and lead-
time through dimensions other than technological change In particular the scope of
standardization partly depends on the evolution of the safety rules in each country This
is reported to be the case in the US where according to Cooper (2010) the increase
in safety regulations issued by the NRC grew substantially following TMI (eg from
Chapter 3 68
three safety guidelines in 1970 to 143 by 1978) limiting the ability of nuclear vendors
to standardize nuclear reactors as they had to comply with changes in safety rules
Hence the US experience shows that safety regulation can have important consequences
on the economic competitiveness of nuclear reactors In that respect standardization
and safety regulation do not have to be per-se incompatible and one could argue that
for a given level of safety effort nuclear safety regulation should be designed in order to
allow nuclear reactors to benefit more from standardization gains
This last result opens the door for further research and also represents a challenge from
a policy perspective in those countries with interest in nuclear deployment In terms of
possible research questions we argue that it is important to identify clearly how differ-
ent safety regulations have affected the design of new reactors and disentangle the effect
of technical problems from the effect of regulatory interventions in the observed con-
struction lead-times In terms of policy it is clear that a better coordination regarding
nuclear reactor certification procedures through cooperation between national nuclear
authorities can improve nuclear competitiveness while ensuring an adequate safety level
For instance enabling for a reactor design to be certified jointly in several countries
could reduce significantly regulatory uncertainty before and during construction with-
out compromising required safety standards
Chapter 4
Setting optimal safety standards
for nuclear operators subject to
uncertainty moral hazard and
limited liability
41 Introduction
Operating a nuclear power facility is a hazardous activity One of the main concerns
of nuclear power safety is the possibility of an accident releasing of significant amounts
of radiation into the environment Prolonged exposure to these radioactive materials
could cause irreversible damage to living tissue in human bodies poison animals and
contaminate soil leading to large economic and environmental losses
Over the 14500 reactor-years in the history of nuclear power for commercial use two ma-
jor nuclear accidents1 have occurred (ie Chernobyl in Ukrania in 1986 and Fukushima
Dai-ichi in Japan in 2011) Both accidents led to considerable economic and environ-
mental damage For instance preliminary cost estimates for the Fukushima Dai-ichi
accident range from 250 to 500 billion USD not to mention that approximately 30000
1 The International Atomic Energy Agency designed the International Nuclear and Radiological EventScale (INES) to explain the significance of nuclear or radiological events Events are classed intoseven levels with each level taking into account the severity in three areas of impact people andthe environment radiological barriers and control and defense in depth The scale is designed sothat the severity of an event is about ten times greater for each new level on the scale The mostserious accident is rated 7 and is called a major nuclear accident
69
Chapter 4 70
km2 of Japanrsquos land surface was contaminated and more than 139000 people had to be
evacuated2
In case of an accident nuclear operators are liable for all damages even for those that
are not directly caused by them However when the costs are as high as they are after
a major nuclear accident the operator does not internalize all of the damage done In
some countries the nuclear operatorrsquos liability is limited by law therefore if the damages
exceed this limit the state has to pay for any harm that is not covered However even in
countries with unlimited liability it is possible that an operator will not possess sufficient
assets to pay for the damages completely and as a consequence society will have to bear
part of risk
The fact that nuclear operators might not completely internalize any harm they may
inflict distorts their incentives for ensuring safety This issue calls for ex ante regulation
to correct this externality and attain higher safety levels The under-provision of safety
in presence of limited liability has been studied by Shavell (1984) and Kolstad et al
(1990) They showed that ex ante regulation (setting safety standards) improves welfare
in particular when the magnitude of harm is much greater than the injurerrsquos assets (tacit
limited liability) or when the parties shall not face the threat of lawsuit for any harm
done (legal limited liability)
Concerning the above it is not surprising that nuclear power is one of the most regu-
lated industries in the world Basically all stages of nuclear power plant development
(ie design construction operation transport and use of radioactive material and de-
commissioning) are regulated by requirements and standards set by a safety regulatory
agency with the aim of reducing the risk of a nuclear accident For instance the US
Nuclear Regulatory Commission requires that only noncombustible and heat resistant
materials be used in the construction of a nuclear power plants containment and control
room in order to minimize the risk of fire and thereby the risk of accident
Unfortunately it took the devastating damages of the Fukushima Dai-ichi accident to
act as a wake-up call of how important it is to have a competent and independent safety
regulator Following nuclear experts safety assessment of the accident several scholars
such as Leveque (2013) and Wang et al (2013) concluded that the accident was the
result of a regulatory failure and not a black swan as initially thought The assessment
revealed that the Japanese safety authority knew about the possibility of a tsunami
waves exceeding 20 meters Despite this information the unitrsquos sea walls were never
back-fitted For this reason the credibility of the Japanese nuclear safety authority has
2 See Schneider and Froggatt (2014) and httpwwwpsrorg
environment-and-healthenvironmental-health-policy-instituteresponses
costs-and-consequences-of-fukushimahtml
Chapter 4 71
been severely questioned and regulatory capture has been suggested as the trigger of
this tragedy According to Gundersen (2012) the laxity of the Japanese regulator in
enforcing safety standards was a key cause of this disaster
In this context safety regulation plays a decisive role not only in maintaining a good
record in terms of a low frequency of accidents but also in the economics of nuclear
power On the one hand safety authorities must determine and be able to enforce the
acceptable risk level at which nuclear power plants should operate On the other hand
safety regulators must keep in mind the cost for operators of complying to standards
and rules in order to attain the envisioned risk level Thus regulators must identify
standards that reduce the risk of a major accident without compromising operatorrsquos
profits
Thus the key question for a nuclear safety regulator is how to attain a sufficiently small
probability of accident in a cost-effective manner From an economic perspective the
answer is to set a standard that equates the marginal cost of providing safety with the
marginal benefit of reducing the expected damages in case of accident However in the
case of nuclear power achieving this balance between costs and benefits is easy due to
the existence of several information-related problems
First the regulator cannot directly observe the operatorrsquos behavior (although this is not
specific to nuclear power) therefore it is not possible to enforce the first best safety level
at zero cost As shown by Strand (1994) and Hiriart et al (2004) in the presence of
moral hazard only second-best care levels are attained and the only way to implement
the first-best safety level is by heavily subsidizing the firm Here the challenge for
nuclear safety authorities is to define a policy that induces compliance with the safety
standards as the operatorrsquos optimal response Compliance is a fundamental element
in nuclear safety regulation given that on the one hand the safety authorities have
to guarantee to the public that nuclear facilities run below the acceptable risk level
and on the other that their reputation and credibility will be severely damaged if non-
compliance is widespread among operators
The second informational problem present in nuclear safety regulation is the epistemic
uncertainty regarding the probability of a major accident Safety authorities cannot
exactly determine the probability of a major nuclear accident based on the observed
frequency But even more importantly (for regulatory purposes) there is some uncer-
tainty as to how safety care translates into a lowerhigher probability of an accident
These factors result from the way in which nuclear reactors are designed Nuclear power
plants are complex they have multiple safety systems each with a backup and they are
designed to accommodate human error This redundancy in the systems aims to con-
trol damage and prevent accidents and significant radioactive releases Consequently
Chapter 4 72
nuclear accidents are rare making it difficult to measure the link between safety care
and the risk of accident
Considering the above the main goal of this paper is to examine the features of an
optimal safety regulatory policy for a nuclear operator that takes into account several
particularities First in the case of a major nuclear accident the operator is protected
(tacitly or legally) by limited liability In addition the regulator cannot observe the
safety care level chosen by the operator (moral hazard) thus the regulatory policy has
to provide incentives to the operator to comply with it Finally there is epistemic
uncertainty as to how safety care affects the probability of a nuclear accident
The problem of a lack of incentives to provide safety care in the presence of limited
liability has been studied by Shavell (1984) Kolstad et al (1990) and Hansson and
Skogh (1987) The provision of safety in presence of limited liability and moral hazard
has been studied by Strand (1994) and Hiriart and Martimort (2004) Hiriart et al
(2004) also derived an optimal regulatory scheme in the presence of these two problems
as well as considering adverse selection
One of the main features of these papers is that the regulator provides incentives to
the firm through transfers that are state-contingent (ie accidentno accident) Nev-
ertheless this is not realistic in the case of nuclear power because safety regulators
cannot reward at least not directly operators in case of no accident Broadly speak-
ing most of nuclear safety regulatory agencies are responsible for establishing legislative
documents regarding nuclear safety and supervising activities on nuclear installations
For this reason we prefer to model this situation as a compliance monitoring problem
In the literature a general model was proposed by Becker (1968) and has since been
extensively used afterwards to study environmental regulation (see Cohen (1998) for an
extensive review) Our model is close to that put forward by Arguedas (2008) In this
model the regulator sets a safety standard and then in order to provide incentives to
comply with it randomly inspects firms and is able to threaten operators with fines
To tackle the problem of the uncertainty of how safety care reduces the probability of
accident the nuclear industry has come up with a procedure called Probabilistic Risk
Assessment (PRA)3 This assessment employs a set of assumptions about the probability
of events that may induce a core melt as well as about the failure of each component
and the back-up systems and uses them to compute the core damage frequency (CDF)
The CDF tells us (theoretically) how long the reactor will run before undergoing at least
one core melt
3 The first PRA assessment carried out in the US is known as the WASH-1400 report This studywas done by Norman Rasmussen for the Nuclear Regulatory Commission and concluded that theaverage CDF was equal to 5E-05 with an upper bound of 3E-04
Chapter 4 73
The PRA identifies the main sources of risks and makes it possible to rank safety invest-
ments according to their effectiveness in reducing CDF In addition CDF is a metric
that the regulator can use to compare and monitor nuclear operators Nevertheless
CDF is itself a random variable and unfortunately PRA assessments do not derive its
distribution function at most they determine the interval within which this parame-
ter belongs In summary it is possible to claim that PRA gives the safety regulator
some information regarding how safety care can reduce the probability of accident but
uncertainty remains
This last feature means that although nuclear regulators do not possess a single precise
probability measure when setting the safety standards they at least have access to some
information (ie an interval of values coming from the PRA) on the link between safety
care and the probability of an accident To capture this element in our model we propose
to use the concept of imprecise (interval) probabilities as in Aven and Hiriart (2013)
In their paper they studied safety care investments from the firmrsquos perspective using
two robust optimization concepts ie worst-case and regret robustness In our paper
we also use these approaches but we assume that the operator has perfect information
regarding its efficiency in reducing the probability of an accident We can therefore focus
our attention on how uncertainty affects the safety regulatory policies
Our results suggest that when a nuclear safety regulator is conservative and seeks to
minimize the expected social costs in the worst possible scenario then safety standards
will be less stringent and nuclear facilities will be inspected more often Both results
are derived from the fact that the regulator is pessimistic as to how safety care can
reduce the probability of an accident In the second approach the regulator considers
the possibility that it may be wrong in its beliefs regarding safety care effectiveness
and it attempts to minimize the biggest mistake that it may regret In this case safety
standards will be stricter Nevertheless the risk of no compliance increases if the cost
of the standard is too high for the operator
In summary the optimal regulatory policy subject to uncertainty of how safety care
reduces the probability of accident will always imply a residual risk for society In the
worst-case approach the regulator can guarantee that all nuclear facilities will comply
with safety standards however the safety standard corresponds to the lowest possible
bound This means that if a regulator is not as pessimistic as in the above case it might
be possible to enforce a stricter standard and further reduce the probability of accident
In this case society bears the risk associated with the difference between the probability
of an accident defined by the standard and the probability that would be attained by
inducing the compliance of the least efficient operator
Chapter 4 74
In the second case when the regulator seeks to minimize the largest mistake it sets a
stricter standard However it cannot guarantee that all operators will operate below
that risk level given that some operators may prefer to pay a fine rather than comply
with the standard In this case the risk that society has to bear depends not only on
the difference between the standard and the least efficient operator but also on how
many operators cannot comply with the standard
The rest of this paper is organized as follows Section 42 presents the model and
characterizes the optimal regulatory policy when moral hazard is the only issue In
Section 43 we assume that only the regulator does not perfectly know how safety care
level reduces the probability of an accident and we explore the optimal regulatory policy
using two robust optimization approaches ie worst-case and regret robustness Finally
Section 44 concludes
42 The Model
We consider a nuclear operator that may provoke an accident that would harm third-
parties andor the environment In particular we are interested in major nuclear acci-
dents mainly because in this case firms are unable to pay for the totality of the damage
When a firm does not completely internalize the harm that it produces this is often rep-
resented with a limited liability constraint In our case we simply assume that either
tacitly or legally the nuclear operator just pays only a fraction γ isin (0 1) of the total
damage in case of accident The accident damage is denoted by D
The nuclear operator can exert a level of safety care that reduces the probability of a
major accident We are going to assume that the probability of an accident is given by
the function αminus βe4 Where e isin [0 1] corresponds to the nuclear operatorrsquos safety care
and the parameters α and β satisfy 1 gt α gt β gt 0
Note that the probability of an accident decreases linearly as safety care increases at a
rate β This parameter captures the firmrsquos efficiency in reducing the probability of an
accident while the reactor is in operation If β is low the operatorrsquos leeway to prevent
an accident is reduced meaning that the risks are strongly linked to the design itself If
β is high it means that the main hazards are likely to arise during operation and thus
the safety care that the operator exerts is important to prevent a nuclear accident
Note also that even when the operator exerts no safety care e = 0 there is a positive
probability of no accident 1minusα For this reason α could reflect the ex ante safety level
that is guaranteed by the nuclear vendor before the reactor starts to operate or the
4 And the probability of no accident will be (1 minus α+ βe)
Chapter 4 75
minimum accepted risk that is ex ante required to obtain a license to operate a nuclear
reactor
We assume that the cost of safety care is given by c(e) which satisfies the following
conditions cprime(e) gt 0 cprimeprime(e) gt 0 and c(0) = 0 In the absence of safety regulation if an
operator seeks to minimize the expected cost given by c(e) + (α minus βe)γD the solution
satisfies the following first order condition
cprime(eps)minus βγD = 0 (41)
The private optimum safety care level eps equates the marginal cost of care with the
marginal benefit of reducing the expected harm in case of accident This safety care
level differs from the first best outcome efb that is given by cprime(efb)minusβD = 0 due to the
operatorrsquos limited liability The lower the fraction γ which is the share of the damages
that the operator internalizes the greater the difference between the private and social
safety care levels This gap arises because the marginal benefit of avoiding an accident
is lower for the firm than for the society
The difference between the optimal levels of safety care eps and efb has been identified in
the literature as the one of the main reasons for using ex-ante regulation to complement
the incentive to exert safety care created by liability rules (see Shavell (1984) Kolstad
et al (1990)) However it has also been recognized that using safety regulation to
reduce the risk of hazardous activities involves information asymmetries In particular
the literature has focused on moral hazard arising because the regulator cannot directly
observe the safety care level e chosen by the operator5 This problem is solved by
allowing state-contingent transfers (ie accident no accident) In general the second-
best policy requires giving a moral hazard rent to the firm in order to induce a given
safety care level
In our model the regulator also provides incentives to the operator through transfers
however they are only feasible in one direction (from the firm to the regulator) This
means that we opt for a monitoring and punishment scheme which is a restricted set of
general incentive schemes We consider that this is a better setting for nuclear power
given that the mission of most nuclear safety authorities worldwide is to establish all the
legislative documents to guarantee that nuclear power plants are designed constructed
operated and decommissioned without jeopardizing public health (ie define safety stan-
dards) In addition safety authorities should perform inspection activities on nuclear
installations to verify that they comply with relevant legislation (ie monitoring)
5 See Strand (1994) Hiriart and Martimort (2004) Hiriart et al (2004) Hiriart et al (2006)
Chapter 4 76
Taking into account the above we decided to follow the model in Arguedas (2008) In
our model the regulator defines a safety standard denoted by s Given that it is not
possible to observe directly whether operators are in compliance the regulator inspects
nuclear facilities with probability q and each inspection has a unit cost equal to m If
it is found that the safety care selected by an operator is below the standard (e lt s)
the regulator can impose a fixed penalty F0 If it is found that (e gt s) no penalty is
imposed
The safety standard s stands for the compendium of all regulatory requirements that
are mandatory for the operator These rules are conceived by the regulator and are
considered essential to ensure the safe operation of nuclear power plants In other
words the safety standard includes an overall review of how an operator should conduct
its activities in order to perform effectively and prevent a serious accident
Regarding the probability of inspection q this can represent either that the regulator
visits all facilities but cannot perfectly detect whether an operator is complying with
the standard (measurement errors) or even if the detection of no compliance is perfect
the regulatory agencyrsquos resources are limited and so only a fraction q of the facilities are
inspected
Finally the fine F0 represents all of the legal measures that the regulator possesses to
deter non-compliance and that are costly for the firm6 We assume a fixed penalty
because in practice fines for nuclear operators are defined ex ante and do not depend
on the degree of non-compliance but rather on the fact that the violation has been
detected
Thus for a given a policy s q the expected cost for the operator depends on its whether
or not to comply with the safety standard
C(s q)
c(s) + (αminus βs)γD if compliance
c(e) + (αminus βe)γD + (1minus α+ βe)qF0 if non-compliance(42)
Note that the operator can only be punished with a fine in case of no accident which
occurs with probability (1minusα+ βe) If there is an accident it will not pay a fine but it
will have to compensate for the harm caused by the accident Given that he it protected
with limited liability the operator will pay γD however this amount is greater than the
fine (γD gt F0)
6 For instance the Canadian Nuclear Safety Commission can in addition to the ability of im-posing a administrative monetary penalty it is also enabled to remove the operation cer-tificate or to undertake a licensed activity and to lay charges against an operator in accor-dance with the legislation See httpwwwnuclearsafetygccaengacts-and-regulations
compliance-verification-and-enforcementindexcfmsec2-8
Chapter 4 77
As mentioned above nuclear regulators do not exactly know how the operatorsrsquo safety
care level reduces the probability of a serious accident precisely because both the reac-
tor and the plant are conceived to prevent these events The design of a nuclear facility
is based on the concept of defense in depth whereby if any component fails a succes-
sive chain of back-up systems kicks in to prevent core damage and reduce the risk of
releasing radioactive material This redundancy in the systems as well as the individual
characteristics of each operator (ie specificities of the site workers type of reactor
etc) makes it very difficult for the regulator to identify a single value for β
For the above we assume that the regulator does not know the exact value of this
parameter but it does know that it belongs to an interval[β β
] while β is perfectly
known by the firm Both agents know the value of the parameter α This last part of
the model has been introduced in order to study the effect of uncertainty on how safety
care reduces the risk of a serious accident in the regulatory policy
To exemplify our setting we can consider that the regulatory agency requires that
pumps and valves are tested a certain number of times during the year In this case the
standard s corresponds to the testrsquos frequency while e is the effective number of tests
that the operator carries out during a given year If the testrsquos frequency is lower than
required it may be less likely to detect failures in the pumps and valves thus increasing
the probability of accident To check whether an operator has carried out the test as
often as required the regulator must inspect the plant However it is difficult for the
regulator to quantify how much the probability of an accident will increase if tests are
done less frequently
All of these elements further complicate the problem of setting optimal standards for
nuclear safety authorities On the one hand authorities need to deal with the moral
hazard problem when setting the rules and on the other with uncertainty as to how
safety care reduces the probability of a serious accident Taking into account all of these
elements the problem that the regulator has to solve is the following
minsq
c(e) + (αminus βrege)D + (1minus α+ βrege)q [m+ F0]
st e = e(s q)(43)
Where βreg isin[β β
]is the interval in which the regulator thinks the true β lies And
e = e(s q) corresponds to the operatorrsquos best response function to a given regulatory
policy s q
Chapter 4 78
421 Benchmark The regulator knows β
As a useful benchmark we compute the optimal policy assuming that the regulator
knows β We proceed by backward induction First we find the optimal response of the
firm to a given policy s q and then we solve the problem of the regulatory agency
Given that the penalty F0 introduces a discontinuity in the expected cost function for all
the values that are lower than the standard (e lt s) intuitively the operator proceeds as
follows First it solves the problem in Equation (44) as if it had decided not to comply
Second it compares the expected cost of this solution with the cost of complying with
the safety standard Finally it decides to exert the safety care level that represents the
cheapest alternative
minegt0
c(e) + (αminus βe)γD + (1minus α+ βe)qF0 (44)
For a given policy s q the firmrsquos best response e(s q) can be decomposed in three cases
The first one corresponds to the case in which the firm over-complies (e(s q) gt s) This
case arises when the safety standard is so low that the operator prefers to increase
its safety care level to minimize the expected costs of an accident This solution is
equivalent to an absence of regulation therefore the operator will choose eps ie the
private optimal safety care level
In the second case the firm complies with the standard (e(s q) = s) Here the safety
care level that minimizes the operatorrsquos cost is the standard because the threat of
penalties increases the cost of lower safety care levels The last case corresponds to a
situation in which the operator optimally does not comply (e(s q) lt s) In this scenario
the standard is so costly that the firm prefers to pay the expected fine rather than the
cost of the safety care level that the regulator wants to enforce
Figure 41 illustrates these three possible cases taking a numerical example7 In each
panel the horizontal axis shows the possible values for safety care e and safety standard
s The vertical axis gives the values of the expected cost function We consider three
different safety standards (s = 01 s = 06 s = 085) and the same probability of
inspection (q = 05)
The first panel illustrates the case of overcompliance Here we assume a low standard
(ie s = 01) in which case it is optimal for the firm to choose a higher safety care level
In the second case (ie s = 06) the threat of a fine is effective to induce compliance
7 We considered a quadratic cost function and the following values for the parameters D = 2γ = 06 β = 08 α = 1 F0 = 02 and q = 05
Chapter 4 79
as we can see in the second panel of the figure all of the safety care levels below the
standard have a higher expected cost thus the standard is the level that minimizes the
costs In the final case it is too costly for the firm to comply with the standard (ie
s = 085) In this case the firmrsquos best response is to choose a lower level of safety care
denoted by n
Figure 41 Operatorrsquos best response to different regulatory policies (sq)
The solution to the firmrsquos problem is summarized in the next proposition the complete
proof is presented in Appendix F
Chapter 4 80
Proposition 1 Given the policy s q the nuclear operatorrsquos optimal response is
e(s q) =
eps if cprime(s)minus βγD minus βqF0 6 0
s if cprime(s)minus βγD minus βqF0 gt 0 and c(s)minus c(n)minus βγD(sminus n) gt q(1minus α+ βn)F0
n if cprime(s)minus βγD minus βqF0 gt 0 and c(s)minus c(n)minus βγD(sminus n) lt q(1minus α+ βn)F0
(45)
Where n satisfies the following condition
cprime(n)minus β(γD minus qF0) = 0 (46)
The previous proposition can be understood as follows The operator observes the
regulatory policy s q then it evaluates the first order condition of compliance with
the standard at its inferior limit to check if it is optimal to reduce safety care marginally
If the operator observes that this optimality condition is negative (first case) it means
that the marginal benefit of avoiding an accident is greater than the marginal cost of
the standard and it is preferable to increase safety care In this case the firm will
over-comply and exert the private optimal safety effort eps
On the contrary when the first order condition is positive or equal to zero this means
that there is no incentive to marginally increase safety care because it is too costly In
this case the operator simply compares the total expected cost of complying with that
of not complying and then decides If complying with the standard is more costly the
operator will choose a safety care level n lower than the standard s
It is important to remark first that the safety care level n will be lower than the level
which would be chosen in the absence of regulation eps due to the fact that the operator
may be punished even if no accident is observed which reduces even further the marginal
benefit of avoiding an accident Second n depends on the probability of inspection q
If we implicitly differentiate n from Equation (46) with respect to this instrument we
get partnpartq = minusβF0
cprimeprime(n) lt 0
This derivative tells us that conditional on non-compliance a higher probability of
inspection q reduces the gap between the expected costs in case of accident γD and in
case of no accident qF0 hence the level of safety effort n will be lower Although this
effect mat appear as counterintuitive it is not if we consider that the overall incentive
of a higher q is that it increases the incentives to comply
Once we have found the optimal response of the firm e(s q) we proceed to solve the
regulatorrsquos problem Here it is important to mention that the task that society has given
Chapter 4 81
to safety regulators is to guarantee that nuclear power plants operate below a maximum
accepted risk level which should be attainable by complying with the safety rules For
this reason the regulator seeks only to set policies s q that induce compliance This
means that the regulatory policy has to ensure that the operatorrsquos best response is to
comply with the standard (ie e(s p) = s) Therefore the pair s q should be such
that the expected costs of choosing safety care n are higher than those of complying
with s In general the problem the safety authority solves is the following
minsq
c(s) + (αminus βs)D + q(1minus α+ βs)m
st q = qc(s)(47)
The objective function corresponds to the expected social cost when the firm complies
with the safety standard To be sure that e(s q) = s we need to satisfy the conditions
of the second case in Equation (45) This is captured in the constraint denoted with
qc(s) that defines the equation of the possible monitoring probabilities q that will induce
compliance for a given standard s The values of the pairs s q in equation qc(s) should
satisfy the following implicit condition
c(s)minus c(n)minus βγD(sminus n)minus q(1minus α+ βn)F0 = 0 (48)
Given that monitoring is costly we discard the policies s q that the firm strictly
prefers to comply (ie Equation (48) less than 0) and focus on those that satisfy the
last condition with strict equality
If we differentiate this last constraint with respect to the available tools s and q we
ascertain how the probability of monitoring q should change to induce compliance when
standard s is changed In short we compute partqparts = cprime(s)minusβγD
(1minusα+βn)F0gt 0 This last result is
quite intuitive it tells us that higher standards require higher monitoring probabilities
to induce compliance whereas lower standards are easier to enforce in the sense that
they need less frequent inspections
Now we can proceed to find the optimal policy slowast qlowast that the regulator will set when
it perfectly knows the value of β The solution is summarized in the next proposition
Proposition 2 The optimal policy slowast qlowast that induces compliance is given by the fol-
lowing conditions
cprime(slowast)minus βD +partqc(s
lowast)
parts(1minus α+ βslowast)m+ qc(s
lowast)βm = 0 (49)
qlowast = qc(slowast) (410)
Chapter 4 82
The solution given in Equations (49) and (410) shows that the safety level that the
regulator can effectively enforce is lower than the first best outcome The presence of
moral hazard imposes the social cost of monitoring in order to enforce a safety standard
43 Imprecise probabilities and robust optimization
In this section we analyze the properties of an optimal regulatory policy subject to
uncertainty about the parameter β As we mentioned previously the safety authority
does not know the exact value of β nevertheless it knows that this parameter belongs
to an interval [β β] As a reminder if the operator knows the value of β then its best
response is still given by Proposition 1 In this situation the problem for the regulator
is the following
minsq
c(s) + (αminus βregs)D + q(1minus α+ βregs)m
st q = qc(s)(411)
Where βreg isin[β β
]
This problem can be solved using robust optimization techniques This methodology
makes it possible to assess optimization problems in which the data is uncertain and
when we only know that the parameters belong to a set The main purpose is to find a
solution that gives an acceptable performance under most realizations of the uncertain
parameters In this paper we use two approaches to solve the problem ie worst-case
approach and regret robustness
431 Worst-case approach
The objective of the safety regulator in this first case is to find the optimal policy in the
worst-case of all possible scenarios In the economic literature this optimization criterion
can be compared to the maxmin expected utility proposed by Gilboa and Schmeidler
(1989)
For our particular problem the worst case corresponds to a situation in which the regu-
lator considers the value of βreg that leads to the highest total expected cost Formally
the regulatorrsquos problem can be stated as follows
Chapter 4 83
minsq
supβ
c(s) + (αminus βregs)D + q(1minus α+ βregs)m
st q = qc(s)
βreg isin[β β
] (412)
Using the expected cost equation we find that partECpartβreg
= minuss(D minus qm) Given that we
are interested in major nuclear accidents we can argue that the cost of the damages
D is greater than the total cost of inspections qm For this reason we claim that this
derivate is negative therefore the social expected costs are inversely related to the value
of β
This means that the highest expected cost (ie the worst-case) over the possible values of
βreg is attained with the lowest value in the interval that it is equal to β The rationale
behind this idea is that the worst case that the regulator can envisage is when safety
care does not effectively reduce the probability of a major accident In other words
the regulator thinks that hazards are a result of the design rather than the operatorrsquos
behavior
To see how the optimal policy differs from the policy with no uncertainty in the param-
eter β we only need to check how the conditions in Equations (49) and (410) change
with respect to this parameter
Let us first see how the safety standard s changes in the worst-case approach with respect
to the benchmark case We use the first order condition in Equation (49) and computepartspartβ We find the following expression
parts
partβ=
D minus[partqc(s)parts s+ q
]m
cprimeprime(s) +m[part2qcparts2
(1minus α+ βs) + 2spartqcparts
]mgt 0 (413)
This result tells us that the regulator will be cautious when setting the standard taking
worst-case approach We know that the expected social costs will be a function of the
lowest possible value of βreg that is β Thus the positive derivate in Equation (413)
means that the safety standard will be the lowest possible when adopting the worst case
approach This corresponds to the least stringent safety standard denoted by swc The
overall probability of an accident that the regulator can guarantee is given by αminus βswc
This conservatism regarding the safety standard is due to the fact that in taking the
worst-case approach the regulator might be underestimating the effect that safety care
has in reducing the probability of accident
Chapter 4 84
We can now consider the probability of an inspection in the worst-case approach if the
regulator would wants to enforce a given fixed safety standard s This entails computingpartqcpartβ
partqcpartβ
= minusγD(sminus n) + qnF0
(1minus α+ βn)F0lt 0 (414)
This derivate shows how the regulator modifies the probability of inspection when his
belief about β changes This equation shows that the regulator weighs the incentives
that he has to give to the operator in order to induce compliance against the potential
amount of money that is not being collected through fines The fact that this derivate is
negative indicates that in the worst-case approach the regulator has to be more vigilant
For instance to enforce slowast he would have inspected more often than in the benchmark
case
These results are two sides of the same coin Since the regulator is pessimistic and
considers that the operatorrsquos safety care is not very effective in reducing the risk of
accident (ie β) the standard will not be very strict However this also implies that it
underestimates the operatorsrsquo incentives to exert safety care or the operatorsrsquo marginal
benefit of safety care As a consequence it will increase the monitoring frequency in
order to induce compliance
However note that the probability of inspection to induce compliance in the worst-case
approach qc(swc) is also determined by swc which we know to be lower than in the
benchmark case thus it will also be lower
The results that we obtain using the worst-case approach explain why some nuclear
safety authorities have invested in properly assessing the most effective ways in which
a nuclear operator can reduce the probability of nuclear accident It is likely that with
experience8 regulators have succeeding in gathering better information about β and
that they have realized that the operatorsrsquo safety care levels have an important effect in
reducing the likelihood of a serious accident
A good example of how nuclear regulators have improved their knowledge of how safety
care translates into a lower probability of nuclear accident is the continuous improve-
ments in PRA techniques PRArsquos have been preformed repeatedly in nuclear facilities
in order to identify the main sources of probable equipment failure that can result in
core damage PRA studies have allowed nuclear operators to efficiently allocate their
safety investments and therefore effectively reduce the likelihood of a serious accident
8 For instance David et al (1996) showed that thanks to the lessons learnt after the Three Mile Islandaccident that the standards and rules set by Nuclear Regulatory Commission led to substantialreductions in the risk of unplanned outages
Chapter 4 85
These improvements have also allowed nuclear regulators to set stricter safety standards
because with the PRA updates have revealed that the marginal benefit of safety care is
higher than their initial expectations
432 Regret robustness approach
The second criterion that we use in this paper is known as the regret robustness approach
or min-max regret criterion In economic literature this approach can be compared with
that taken byLinhart and Radner (1989)
In our setting the min-max regret criterion means that the regulatorrsquos objective is to
minimize the maximum difference between the objective function and its best possible
value In other words the regulator wants to identify the value of βreg for which it can
make the largest mistake (in terms of social costs) and then choose the regulatory policy
s qc(s) that minimizes the costs on that particular case
Intuitively we can say that there are two types of mistake that the regulator will regret
The first type of error arises when it sets a standard higher than the optimal one (s gt slowast)
because it selects a high value of βreg when the real β is low In this case the standard
is not only too costly but also ineffective to reduce the probability of accident
The second type of error arises when the regulator sets a low safety standard In this case
the regulator selects a low βreg for instance like in the worst-case approach (βreg = β)
when in reality safety care can significantly reduce the probability of a serious accident
(ie high real value of β) In this case the inefficiency arises because the marginal
cost of increasing safety care is lower than the marginal benefit In addition society is
unnecessarily exposed to a greater risk of major nuclear accident
To solve this problem the regulator proceeds in several steps First for each βreg isin[β β
]it determines the optimal policy slowast(βreg) qc(slowast(βreg) βreg) and then computes
EClowast(βreg) which corresponds to the minimum expected social costs for each βreg This
minimum expected cost function is given by following equation
EClowast(βreg) = c(slowast(βreg)
)+(αminus βregslowast(βreg)
)D +
(1minus α+ βregs
lowast(βreg))qc(s
lowast(βreg) βreg)m
(415)
Second it considers all the possible compliance-inducing policies s qc(s β) for all the
possible values of β that also belongs to[β β
] Here it is important to note that the
probability of inspection which induces compliance to a certain standard s will change
Chapter 4 86
according to the value of β that the regulator thinks is the real one Here we have denoted
by β the value that the regulator uses to compute the compliance-inducing policy which
might differ from the real one The expected cost function for these compliance-inducing
policies is given by
EC(s qc(s β) βreg) = c(s) + (αminus βregs)D + (1minus α+ βregs)qc(s β)m (416)
In the next step the regulator computes the regret function denoted byR(s qc(s β) βreg)
to measure the gap between these two last equations and determine the values of βreg
and β that maximize this difference Finally it selects the regulatory policy that mini-
mizes the costs in that particular case The problem that the regulator solves under the
regret robustness approach is the following
mins
supβreg β
R(s qc(s β) βreg) = EC(s qc(s β) βreg)minus EClowast(βreg)
st βreg β isin[β β
] (417)
Note that when β = βreg the regret will be minimized by setting the optimal policy
slowast(βreg) qc(slowast(βreg) βreg) (ie the regret will be zero)
If we differentiate the regret function with respect to β and βreg we obtain the following
partR(s qc(s β) βreg
partβ= (1minus α+ βregs)m
partqc(s β)
partβlt 0 (418)
partR(s qc(s β) βreg)
partβreg=D[slowast(βreg)minus s]minusm[slowast(βreg)qc(s
lowast(βreg) βreg)minus sqc(s β)]
minus (1minus α+ βregslowast(βreg))m
partqcpartβreg
(419)
The sign of the derivate with respect to β is negative and indicates as we have already
seen in the worst-case approach that the highest expected costs are reached when safety
care is not effective in reducing the probability of accident which means a low value for
β In our case this means that β = β
The sign of the derivate of the regret function with respect to βreg will depend on the
mistake that the regulator makes When it is very optimistic and thinks that the real
β is very high the standard it sets may be greater than the optimal one (ie error
Chapter 4 87
type 1) If this error predominates the first term will be negative and given the high
magnitude of D we could argue that the derivative is negative In that case the regret
robustness problem boils down to the worst-case approach because the biggest mistake
that the regulator will regret varies inversely with the value of βreg therefore the value
that maximizes the regret will be β
However when the regulator wants to avoid setting a standard lower than the optimal
one (slowast(βreg) gt s) it will focus on a case in which the derivative in Equation (419) is
positive Therefore when a type 2 error predominates the mistake that the regulator
will regret the most is having set a policy under the assumption that safety care is
not effective in reducing the probability of an accident (β = β) when in reality it is
(βreg = β)
We now study the regulatory policy that minimizes the regret function in this last
scenario ie with values of βreg = β and β = β The optimal standard when applying
regret robustness is denoted by (srr) and satisfies the following first order condition
cprime(srr)minus βD + βqc(srr β)m+ (1minus α+ βsrr)mpartqc(srr β)
parts= 0 (420)
In the worst-case approach the optimal safety standard which we denoted by swc satisfies
the same first order condition given in Equation (420) but the regulator does not
consider the possibility of error therefore instead of β we have β as follows
cprime(swc)minus βD + βqc(swc β)m+ (1minus α+ βswc)mpartqc(swc β)
parts= 0 (421)
Taking these two first order conditions we could conclude that the optimal standard
that a safety regulator will set taking a regret robustness approach is stricter than the
one it would set when adopting a worst-case scenario but lower than the one that it
would set when assuming that it does not make mistakes ie both βreg = β = β In
Figure (42) we plot the difference between srr and swc as well the standard that the
regulator would set under this ldquobest scenariordquo (βreg = β = β) and is denoted by sβ9
Although at first glance the regulatory policy under regret robustness seems better than
the worst-case approach it is important to point out that this regulatory policy also has
its drawbacks In this case there is a risk of non-compliance if the real value of β is low
enough Remember that the operator compares the net benefit of complying with the
expected penalty if it does not comply but unlike the regulator it knows the true value
9 In this numerical example we consider again a quadratic cost function and the following value forthe parameters D = 2 γ = 06 β = 08β = 088 α = 1 and F0 = 02
Chapter 4 88
Figure 42 Difference in the safety standards set taking worst-case and regret ro-bustness approaches
of β Thus when the marginal benefit of safety care for the firm is low (ie low β) a
regulatory policy that entails a high standard makes non-compliance more attractive
The risk of non-compliance highlights the potential drawbacks that a nuclear safety
regulator has to deal with when applying regret robustness criterion This issue becomes
more relevant when the interval in which β should lie is wide Contrary to the worst-
case criterion where only the level of β is important to define the maximum acceptable
probability of an accident when taking a regret robustness approach the regulator is
concerned with the length of the interval This is because the wider the interval the
more likely it is that the regulator will set standards that nuclear operators will not
comply with Hence it is not possible for a regulator to completely ensure that the
maximum probability of an accident is αminus βsrr
This latter issue is particularly relevant when the regulator has to set an uniform safety
policy for a heterogeneous nuclear fleet If we consider k nuclear operators each of which
is characterized by a different βk isin [β β] Under the worst-case approach the regulator
can be sure that all operators will comply because the standard is determined by the
least efficient operator (β)
With the regulatory policy set under regret robustness srr qc(srr) it is possible to
determine a marginal operator which is indifferent to whether it complies with the
Chapter 4 89
standard or not If we denote the efficiency of reducing the probably of an accident by
this marginal operator when applying the regret robustness with β we can argue that for
the operators that are less efficient than this marginal operator (ie βk lt β) is optimal
not to comply with the standard
44 Conclusion
We have developed a model to study the effect of uncertainty regarding the probability
of nuclear accident when a regulator has to set a safety standard subject to both moral
hazard and limited liability Our motivation is to take into account two of the main
features that nuclear power safety regulators have to deal with First the difficulty of
properly identifying how safety care impacts the probability of a major nuclear accident
Second the fact that nuclear regulators will always want to enforce safety standards that
induce compliance
This last feature steams from the fact that safety regulators have to assure society that
nuclear reactors operate below a certain acceptable risk level that should be attainable
if the operators comply with safety standards In addition we can expect that due to
the huge damages that a major accident might provoke laxity will not only increase
the risk of nuclear accident but will also harm the credibility and reputation of safety
agencies as seen with the latest nuclear accident in Japan
In our model the regulator controls the operatorrsquos safety care level by imposing a stan-
dard Since it is not able to observe operatorrsquos action the regulator also randomly
inspects nuclear facilities and is able to threaten the operator with a fine in case of
non-compliance To deal with the fact that the regulator does not perfectly know how
safety care translates into a lower probability of accident we use an imprecise probability
approach Using this methodology we assume that the regulator can define an interval
within which the parameters that define the probability of accident should lie We use
two robust optimization techniques ie worst-case scenario and regret robustness to
solve the regulatorrsquos problem and compare the results with a benchmark case in which
the regulator is perfectly informed
In the worst-case scenario the regulator sets a safety standard under the assumption
that operatorrsquos safety care is not effective in reducing the probability of an accident In
the terms of our model this assumption means that the regulator takes the lower bound
of the interval to set the regulatory policy this is represented by βreg = β Because
the expected damages of a major nuclear accident are huge by taking this value the
expected social costs reach their maximum value
Chapter 4 90
Our result suggests that the worst case regulatory policy will imply the enforcement of
the less stringent safety standard In addition we show that for a given standard the
regulator will inspect more often than it should to induce compliance These features
arise because the regulator believes that operatorsrsquo behavior is not effective in reducing
the probability of accident thus the safety standard will not be high Simultaneously
it means that the regulator believes that the expected benefits of safety care are not
big enough incentive to deter non-compliance which is why its optimal solution is to
increase the expected penalty by increasing the monitoring probability
Although the worst-case safety standard will not be as strict as when the regulator is
perfectly informed this by no means implies that the regulator will be lax When a
regulator believes that the real β is low some ways it is placing more emphasis on the
inherent risk of the technology that on the hazards that might arise during the operation
In consequence the regulator could be stricter in ex ante licensing and design rules In
terms of our model this means that the regulatory emphasis might be done in α rather
than in β
Complementary work and an interesting future research path would be to add a previous
stage to this model in which α is determined by a nuclear vendor and it then it subject
to some uncertainty for both the regulator and operator
In our second approach known as regret robustness the regulator seeks to determine a
policy that minimizes the largest error that it might make This means that it attempts
to find the value of the unknown parameter that maximizes the difference between the
expected social costs and its optimal value We find that the mistake that the regulator
will regret the most arises when it believes that safety care is not effective to reduce the
probability of accident (β = β) but in reality it is In terms of our model this means
that βreg = β
Taking this approach the safety standard will be stricter than that of the worst-case
standard and lower than the standard the regulator would set in a case in where it does
not consider the possibility of being wrong Although this is an intermediary solution
the drawback of the policy chosen under regret robustness is that it might induce non-
compliance for the most inefficient operators (those with a low β) This last result
provides yet another warning of once again about the difficulty of enforcing strict safety
standards not only because of moral hazard but also due to technological uncertainty
We think that it is possible to consider these two approaches as alternatives to achieve
a given acceptable risk level goal usually expressed in terms of the probability of a
major nuclear accident The first way would be to use the worst-case approach to set
the safety standard which although less stringent would be easier to enforce (in terms
Chapter 4 91
of frequency of inspection) In addition to ensure that the operators function below the
fixed threshold regulators could require a high ex ante level of safety features (low α)
as a condition to granting a license
The second possibility is to focus in on operation of the reactor In this case the
regulator can use the regret robustness safety standard which is more stringent and
requires a more frequent inspections but it allows it to tolerate a lower ex ante safety
level (higher α)
In fact if we look at how nuclear safety has been assessed by regulators we can com-
pare these two ways of achieving a given acceptable risk with the deterministic and
probabilistic safety approaches respectively In the former the emphasis is done on the
nuclear power plantrsquos design The deterministic approachrsquos main goal is to ensure that
within the conception of the unit various situations are considered to be plausible and
taken into account to ensure the containment of radioactive materials In the latter the
emphasis is on the operating stages The goal of the probabilistic approach is to identify
and analyze every possible situation and sequence of events that might result in a major
nuclear accident during the operation
We argue that these two approaches have acted as complements rather than substitutes
throughout the history of nuclear power for civil use In the first stages of development
nuclear regulatorsrsquo uncertainty was considerable For this reason they focused their
attention on the design and construction to ensure high ex ante safety levels but they set
conservative safety standards (as in the worst-case approach) As they gained knowledge
on how safety care can reduce the probability of accidents they were able to increase
safety standards In parallel technological progress has made it possible to achieve
better ex ante safety levels allowed safety regulators to set lower acceptable risk levels
and focus their attention on the operatorrsquos behavior and setting stricter safety standards
(as in the regret robustness approach)
Improvements in PRA techniques provide a good example of how these two approaches
have been complementary for nuclear regulators In our framework this would be rep-
resented by a continuous increase in the lower bound of β If nuclear regulators set
safety standards using a worst-case approach our model predicts that this improved
knowledge of the effectiveness of nuclear operatorsrsquo behavior in reducing the risk of acci-
dent will make it possible to enforce stricter standards However although we consider
that new designs achieve good ex ante safety levels it is possible that safety goals in
terms of accident probability also become stricter which makes it more effective for the
regulator to turn its attention to the operation of nuclear reactors This means that it
can set stricter safety standards (use regret robustness) to achieve the new acceptable
risk levels
Chapter 4 92
Despite the simplicity of our framework it highlights the pros and cons of the two main
approaches in nuclear power safety regulation and allows us to conclude that regulatory
policies subject to uncertainty on how safety care can reduce the probability of a major
accident will always entail a residual risk for society If a safety regulator adopts a worst-
case approach it will be able to assure that nuclear facilities operate below a certain risk
level attainable with the compliance of safety standards However the safety standard
might not be as strict as it could be in which case society bears the risk of enforcing low
safety standards when it could be possible to attain a higher level If on the contrary
the regulator takes a regret robustness approach standards will be stricter However it
will not be possible to guarantee that all nuclear facilities comply with it In this case
society has to bear the risks associated with the safety level chosen by operators that
decide not yo comply with the safety standards
Chapter 5
General Conclusion
This PhD thesis analyzed some of the challenges for nuclear power development that
were raised after the latest nuclear accident at Fukushima Dai-ichi power plant In
particular we have focused our attention on two issues that have a direct impact on
nuclear power competitiveness construction costs and safety regulation The concerns
about the possibility of building a new nuclear power plant at reasonable cost were
exacerbated after the accident inasmuch as it might induce extra costs in new reactors
Additionally the importance of setting stricter safety standards reemerged after it was
knew that the japanese safety regulator had information about the possibility of tsunamis
of the magnitude seen on March 2011 The reactions of both nuclear industry and nuclear
safety regulators to these issues will determine the future of nuclear power if these
reactions are correct they will allow the materialization of the nuclear renaissance if
not they will prevent an increase of nuclear power share in the worldrsquos energy production
Given this context the main objective of this dissertation was to provide answers to
the following questions how to properly estimate the probability of a major nuclear
accident which are the main determinants of the construction costs of a new nuclear
reactor and finally how nuclear regulatory agencies set safety standards given that the
link between safety care and the likelihood of a major nuclear accident is uncertain In
this thesis we have used actual data about the construction costs lead-times technolog-
ical choices and innovation coming from the two largest nuclear fleets in the world US
and France Additionally we have taken into account in our analysis the specificities
of a major nuclear accident to be able to give more accurate answers to the previous
questions
Undoubtedly the development of nuclear power in the world will depend predominantly
on how the industry is able to curb the cost escalation than has been seen as inherent to
this technology In consequence the results of this dissertation in terms of construction
93
Chapter 5 94
costs will allow us to identify which are the elements that enhance nuclear competitive-
ness either because they induce costs reductions or because they avoid delays during
the construction In addition they will be useful to explain what we could expect in
terms of cost and lead-times from the current reactors under construction given the
technological and industrial choices that have been made Finally they will allow us to
give some policy recommendations for those countries that have envisioned to construct
nuclear reactors in the near future
In parallel the further development of nuclear power will also depend on how safety
authorities are able to determine an accepted social risk level without harming the
profitability of nuclear operators or jeopardizing the inhabitants surrounding the nuclear
facilities The first step to set this objective is to properly assess the probability of a
major nuclear accident The second step towards this objective is that nuclear regulators
set safety standards in a cost-effective way In particular nuclear regulators must take
into account the uncertainty that exists between safety care and the probability of a
major accident The results of this dissertation in terms of safety regulation will be useful
to understand the trade-off underlying different regulatory approaches and determine
which is the best way to cope with the uncertainty regarding major nuclear accidents
The analysis in this PhD thesis is particularly important for those countries that are
interested in continuing or embarking upon nuclear power programs Within the western
context nuclear power is called to play an important role in energy transition to a
decarbonized electricity supply and reduce the dependence on fossil fuels Countries like
the United States the United Kingdom Poland and France contemplate nuclear power
within their future energy mix Moreover the most promising region for nuclear power
deployment is in the east of the globe In particular in countries with growing energy
demand and ambitious nuclear programs like China India Russia and Turkey
51 Conclusion about Construction Costs
Reducing the technological variety of the nuclear fleet by limiting the models that can
be installed is key to improve nuclear power competitiveness Our results showed that
the standardization of the French nuclear fleet was successful in curbing the construction
costs contrary to what happened in the construction of the US nuclear fleet We found
that building the same type of reactor repeatedly would allow to reduce the costs of the
last units of a given series According to our model in Chapter 3 we might expect that
the costs for the second unit of a reactor model built by the same firm would be reduced
in 10 to a 12
Chapter 5 95
This first result is particularly important for those countries that have conceived signif-
icant additions in nuclear capacity by building a high number of reactors Given that
the construction of a nuclear power plant depends largely on on-site and reactor char-
acteristics reducing the technological variety and construct multi-unit sites will mean
that a new reactor can be built without any design or site modifications and thus it
is possible to avoid the additional costs related with them In addition a standardized
nuclear fleet might reduce the probability of incidentals during the construction that
lead to delays and cost overruns Finally building the same type of reactor could induce
cost reductions thanks to the possibility of buying components in a larger scale
In the light of this result we can expect that Chinese nuclear fleet that nowadays
relies on the construction of several CPR-1000 reactors will be successful in terms of
progressively reducing the construction cost of this model This might be also what we
can expect to see in India where the nuclear fleet that is currently under construction
consists in 4 reactors of the same design (ie PHWR-700) We can also expect that the
costs of the new reactors in South Korea decrease in particular for the latest APR-1400
reactors that will be built
In the UK the situation might be different The potential cost reductions in the nuclear
fleet would be conditional to the result of the first project at Hinkley Point C We could
expect that if this project meet the initial budget and schedule and if it is decided to
continue with the EPR at Sizewell C in Suffolk the costs of these reactors will be less
than the previous However it is yet to be seen if this first experience with the EPR does
not repeat the cost overruns and delays in the construction as in Finland and France
The second lesson learnt from the construction of the US and French nuclear fleet is that
there existed positive and significant economies of scale This means that constructing
larger reactors might be a way to reduce the costs per MWe The results of Chapter
3 suggested that even if the construction of bigger reactors meant an increase in the
construction periods in average we could expect that an increase of 10 in the capacity
installed would reduce construction costs by 45 This result solved the impossibility
of testing economies of scale by using only the cost data coming from the French nuclear
fleet as we highlighted in Chapter 2
For countries with growing energy demand it is possible that constructing large reac-
tors will allow to supply much of the demand while allowing some cost reductions per
MWe installed and without taking a large space (contrary to wind farms for instance)
However as we have mentioned in Chapter 2 reducing the capacity of nuclear reactors
could be one of elements to rethink nuclear industry In fact we consider that the devel-
opment of small modular reactors might foster nuclear development in other countries
that have not yet considered it within their energy agendas either because they have
Chapter 5 96
lower energy demand or because they have restricted budgets In this sense smaller
reactors could have shorter construction schedules lower capital costs and the potential
of further savings due to off-site module fabrication
Our third important result highlighted the importance of meeting the construction sched-
ules as an effective way to curb the cost escalation Regarding this result we identified
different factors that explain why the construction periods in US and France have been
so lengthy The first explanation is linked to changes in the installed technologies We
have found that cumulated experience in other designs had a negative impact on the
lead-times that ended up raising the construction costs This result shows that the ex-
perience in the construction of other reactor models is not directly transferable to all
the projects hence it is likely to expect lengthy construction periods when a new design
is installed
We also have found that the increments in the lead-times in the construction of the US
and French fleet were partially due to the effect of the two major nuclear accidents
Three Mile Island and Chernoblyl This last result warns of the possible effects that
Fukushima Dai-ichi might have had in the reactors under construction We will have to
wait until they are finished to see if it is possible to link the potential delays during the
construction with a stricter supervision or new safety requirements due to the latest
major accident in Japan
All these factors that were key to understand the increase in the lead-times in the US
and France can also be used to explain why the construction of the EPR in Europe
has had continuos delays Given that the EPR is a new design a first of a kind
the experience that AREVA or EDF had in the construction of other models is not
directly transferable to this new project therefore it is likely that incidentals during the
construction translates into delays In addition we may explain the lengthy construction
period of the EPR as a result of its capacity (ie 1650 MWe ) We find that bigger
reactors take longer periods to be built for this reason it is likely to expect that it takes
more time to construct this design than its predecessor (N4 model 1500 MWe) The
first N4 model constructed in France took approximately 12 years
Our results also indicated that an homogenous nuclear fleet besides allowing cost reduc-
tions in the long run (ie after building repeatedly the same reactor) it might also have
some benefits in the short term through reductions in the lead-time For this reason we
are convinced that a standardization strategy enhances the competitiveness of nuclear
power in two ways As we mention at the beginning it allows costs savings through
learning by doing at the firm level But in addition it tends to reduce the construction
lead-times and therefore the construction costs in the short term
Chapter 5 97
In fact these results are also helpful to explain the first delays observed in the construc-
tion of the AP-1000 and EPR reactors in China China has based their nuclear program
around their CPR-1000 reactor and so far it has a good record in terms of construction
lead-times (4 years in average) However recently they decided to install Generation
III+ reactors by building four AP1000 reactors at Sanmen and Haiyang and two EPR
at Taishan Both construction projects have delays 18-30 months in the former and
13-15 months in the latter1 In the light of our results we can argue that part of the
increase in the construction lead-times is a result of a less homogeneous nuclear fleet
under construction
The last and perhaps the most important result in terms of construction costs that we
have found is that innovation has not improved nuclear power competitiveness Tech-
nological change in nuclear power has not induced reductions in the amount of capital
needed to build a new reactor On the contrary we found that it was one of the main
drivers of the cost escalation This result represents a major challenge for nuclear power
development given that it goes in the opposite direction with the pattern observed in
other energy technologies where technical progress has contributed to reduce their in-
vestment costs This trend has been registered in competing carbon-free technologies
like wind power and photovoltaics
This last result might partially be explained by the fact that the requirements of nuclear
safety authorities have pushed nuclear vendors to innovate in order to achieve better
safety performance in the existing reactors In Chapter 2 we found some evidence that
suggested that reactors with better safety indicators in terms of lower unexpected events
that might lead to a serious accident were related with higher construction costs These
results lead us to conclude that the latest reactors although more expensive have also
embodied safety improvements aiming to reduce risks of major accident
Taking into account the above we can argue that one of the possible reasons to explain
why the EPR is such expensive is precisely because it embodies some innovations that
allow it to achieve higher safety levels inter alia In fact AREVA promotes this design
saying that it is an upgrade in nuclear technology (ie Generation III+) precisely due
to the level of safety that it guarantees According to the vendor the EPR has an
expected core melt down frequency less than 1 event each one million reactor years
The trade-off between the benefits of standardization and those related with technolog-
ical change is of paramount importance for nuclear power development We started this
section arguing that standardization leads to lower construction costs hence it is key
for nuclear power competitiveness However we have also found that new designs have
better safety features This means that to adopt a new technology it is necessary to do
1 See Schneider and Froggatt (2014)
Chapter 5 98
a cost benefit analysis to see whether it is reasonable to invest in a better reactor in
terms of a reduced risk of accident or if instead the gain in safety does not worth the
increase in the costs and therefore it is better to keep on using the established technol-
ogy In this sense we can conclude that complementarily to a standardization strategy
countries interested in nuclear power have to consider within their programs which will
be the optimal pace of technological change
After studying the history of the construction of the US and French nuclear fleet we can
say that the relation between the economics of safety and nuclear innovation constitutes
the most challenging issue for nuclear power industry On the one hand it is desirable
to minimize the risk of a nuclear disaster as much as possible in particular after seeing
the terrible consequences of Fukushima Dai-ichi core melts But on the other hand
innovations have to be done without threatening nuclear power competitiveness In
summary we consider that nuclear industry should make innovation efforts not only to
increase safety performance but also in allowing to reduce the capital costs needed to
construct a new nuclear reactor
52 Conclusion about Safety Regulation
In terms of safety regulation our model in Chapter 4 highlighted the trade-off linked with
the adoption of both a deterministic and a probabilistic approach to regulate nuclear
facilities In some sense the deterministic approach focus in design of the unit as a
way to achieve a given accepted risk level This alternative can be related to our worst
case approach in which the regulator is not optimistic in how the operatorrsquos behavior
can reduce the probability of an accident Under this assumption the regulator will
fix the less stringent safety standard and monitor more often Given that he believes
that safety care is not so effective in reducing the probability of accident he thinks that
expected benefits of safety care are not a enough incentive to deter no compliance that
is the reason why he finds optimal to increase the monitoring probability
On the contrary the probabilistic approach focus the regulatory effort on the operatorrsquos
behavior Here the regulator believes that safety care during the operation of the
reactor is very effective to reduce the probability of a major nuclear accident In terms
of our model this approach is similar to the regret robustness criterion In this case
the regulator seeks to find a policy that minimizes the largest error that he can make
We found that if the safety authority sets the regulatory policy under this approach the
standard will be stricter compared with the the worst case standard but it will be less
strict than the one that the regulator will set in the case in which he does not consider
the possibility of being wrong
Chapter 5 99
Even though the safety standard obtained under regret robustness is more stringent
and might allow to achieve a better safety level it is important to remark that it might
induce no compliance of the less efficient operators This last result warns once again
about the difficulty of enforcing strict safety standards not only due to the problem of
moral hazard but also because technological uncertainty
From an static point of view the model that we have developed to study how to set
safety standards for nuclear operators captures both the pros and cons of the two main
approaches that have been used so far in the history of nuclear power The main
conclusion is that setting standards under the uncertainty on how safety care can reduce
the probability of major accident will always entail a residual risk for the society Under
the worst-case approach the society bears the risk associated with the difference between
the less efficient operator and the safety level provided by the standard If the regulator
prefers a regret robustness approach the standard will be stricter however it will no be
possible to guarantee that all the nuclear facilities comply with it Here the society has
to bear the risk associated with the difference between the safety level chosen by the
operators that decide to not comply and the safety standard
Up to this point it is important to recognize that our model is very simple and do not
pretend to capture all the features that a nuclear regulator has to face when setting
safety standards For instance we have reduced the operator effort to provide safety to
one dimension when it is multidimensional In the sense that nuclear operators perform
many tasks to achieve a given safety care level In addition we have assume that the
regulator can not observe the safety care level selected by the operator when it might
be possible that some of the standards are more easy to verify than others Given that
the multidimensionality and degree of observability of safety care may have an impact
on the regulatory policy these elements could represent possible extensions of our basic
model
Another important caveat of our model is that it is static therefore we can not conclude
anything about the transition of the regulatory process If this model is extended to
introduce dynamics in the way in which nuclear regulator set safety standards it might
be possible to determine when it is optimal to change from a deterministic approach
to a probabilistic one In fact if we revise the history of nuclear safety regulation
we can claim that roughly these two approaches have been complements rather than
substitutes The transition of the emphasis given to these approaches have changed to
the extent that the regulator has gained better knowledge about how safety care reduces
the probability of an accident
In the inception of nuclear industry (for civil uses) the uncertainties for regulators were
huge As a result they focused their attention in establishing safety rules related with
Chapter 5 100
the design and construction but they set conservative standards for the operation (as
in the worst case approach) Progressively they got better knowledge of how safety
care affects the probability of nuclear accidents For instance after the core melt down
in Three Mile island that was due to a mistake during the operation the US Nuclear
Regulatory Commission decided to carry out PRAs in nuclear reactors in order to detect
how nuclear operators could prevent events that lead to a serious accident The results
of the PRAs and their continuous improvements have given to nuclear operators precious
information about how to reduce the risk of a major accident In consequence they were
able to set stricter safety standards
In parallel new reactors have been installed As we have observed in the US and
French nuclear fleet (Chapters 2 and 3) new reactors have embodied innovations aiming
to achieve better safety performance This means that technological progress made it
possible to achieve better ex ante safety levels allowing safety regulators to set even lower
acceptable risk levels and translate their attention to the performance of the nuclear
operators through the adoption of stricter safety standards (as in regret robustness
approach)
It is clear that the complementary transition from a worst case to a regret robustness
approach is strongly related with technological progress Once again the relation be-
tween nuclear safety and innovation pops up as a cornerstone for nuclear power As we
mentioned in the previous section this relation was relevant to understand the cost es-
calation in the construction both in of US and French nuclear fleet It might be possible
that due to the increase on the safety performance of new reactors nuclear regulators
have been able to set stricter safety standards and pursue even lower accepted risks
levels However the impact of technological progress in nuclear safety regulation was
not studied in our model what makes this subject a potential area for further research
Appendix A
Cour des Comptes Actual
Construction Costs for the French
Nuclear Fleet
Table A1 Data from the Cour des Comptes report
Pair of units Capacity MW Year Type Overnight Cost (Me2010MW)
Palier 900 MW
Fessenheim12 1780 1978 CP0 0836Bugey23 1840 1979 CP0 0886Bugey45 1800 1979 CP0 0899
Damprierre12 1800 1980 CP1 1217Gravelines12 1840 1980 CP1 0822Tricastin12 1840 1980 CP1 1188Blayais12 1830 1982 CP1 1110
Dampierre34 1800 1981 CP1 1172Gravelines34 1840 1981 CP1 0856Tricastin34 1840 1981 CP1 1247Blayais34 1820 1983 CP1 0890
Gravelines56 1820 1985 CP1 1093SaintLaurent 12 1760 1983 CP2 1120
Chinon 12 1740 1984 CP2 1148Cruas12 1760 1984 CP2 1119Cruas34 1760 1984 CP2 1253
Chinon34 1760 1987 CP2 0978
Palier 1300 MW
Paluel12 2580 1985 P4 1531Paluel34 2580 1986 P4 1157
St Alban12 2600 1986 P4 1129Flamanville12 2580 1987 P4 1287Cattenom12 2565 1987 Prsquo4 1358Belleville12 2620 1988 Prsquo4 1083Cattenom34 2600 1991 Prsquo4 1149
Nogent12 2620 1988 Prsquo4 1194Glofech12 2620 1992 Prsquo4 1305Penly12 2660 1991 Prsquo4 1227
Palier 1450 MW
Chooz12 2910 2000 N4 1635Civaux12 2945 2002 N4 1251
101
Appendix B
Linear models for the
Construction Costs
In this Appendix we show the estimation results as well as the VIF for different speci-
fications of the linear regression model shown in Equation 1 The models that we have
estimated are the following
bull Model 2
ln(Ci) = α0 + α1 ln(Capi) + α2EXPIi + α3EXPPi + α4EXPTi + ui (B1)
bull Model 3
ln(Ci) = γ0 + γ1 ln(Capi) + γ2EXPPi + γ3EXPTi + ui (B2)
bull Model 4
ln(Ci) = θ0 + θ1EXPIi + θ2EXPPi + θ3EXPTi + ui (B3)
Table B1 Estimates for Model 2
Coefficients Estimate Std Error t value Pr(gt |t|)(Intercept) 5474 8444 0648 0523Ln Cap -0732 1125 -0650 0522EXPI 0013 0011 1193 0245EXPP -0008 0013 -0667 0511EXPT -0003 0008 -0386 0703
102
Chapter 5 103
Table B2 VIF for Model 2
Ln Cap EXPI EXPP EXPT73161 58620 20917 1794
Table B3 Estimates for Model 3
Coefficients Estimate Std Error t value Pr(gt |t|)(Intercept) -4502 1155 -3896 0001 Ln Cap 0598 0148 4032 0001 EXPP 0006 0003 1661 0109EXPT -0007 0007 -1027 0314
Table B4 VIF for Model 3
Ln Cap EXPP EXPT1257 1692 1429
Table B5 Estimates for Model 4
Coefficients Estimate Std Error t value Pr(gt |t|)(Intercept) -0017 0060 -0291 0773EXPI 0006 0001 4236 2e-04 EXPP -0001 0003 -0152 0880EXPT -0005 0007 -0768 0449
Table B6 VIF for Model 4
EXPI EXPP EXPT1003 1432 1432
Appendix C
Alternative model specifications
Table C1 Alternative model specifications
Model 5 Model 6Cost Lead-time Cost Lead-time
HHIMo 1249 -0400 0247 -0444 (0490) (0141) (0481) (0185)
lnExpArqMo -0153 0005(0041) (0011)
lnExpArqNoMo 0028 0024 (0035) (0009)
lnExpNoArqMo 00461 0014(0041) (0011)
lnExpNoArqNoMo -0095 0152 (0103) (0017)
InvExpArqMo 0335 -0025(0067) (0027)
InvExpArqNoMo -0097 -0007(0080) (0032)
InvExpNoArqMo -0150 -0016(0079) (0032)
InvExpNoArqNoMo 0181 -0337 (0245) (0076)
lnKnow 1291 (0598)
lnCap -0839 0117 -0609 0174 (0221) (0050) (0182) (0061)
lnNPPUC 0498 -0101 0318 -0040(0182) (0043) (0105) (0040)
ArqUtility -0255 -0008 -0292 0024(0096) (0027) (0087) (0034)
lnEDem -1202 -1467 (0108) (0125)
lnLT 2270 1133 (0820) (0686)
lnCement 0392 0003(0538) (0359)
lnLabour -2020 -0710(1365) (0808)
TmiUS -0055 0292 0075 0300 (0197) (0041) (0177) (0049)
TmiFR -0001 -0053 -0184 -0004(0252) (0071) (0223) (0089)
CH -0107 0053 -0051 0053(0140) (0030) (0122) (0036)
Constant 7841 -2220 -3776 -3056 (4597) (0428) (5726) (0507)
Country FE Yes Yes Yes YesCountry specific trend + trend2 Yes Yes No NoTrend + trend2 No No Yes YesObs 128 128 128 128Adj R2 0823 0960 0873 0940
104
Appendix D
Alternative model specifications
for lead-time
Table D1 Alternative model specifications for lead-time in OECD countries
(1) (2)Variables (lnLT ) (lnLT )
HHIMo -0509 -0458 (0189) (0200)
lnCap 0225 0240 (0051) (0052)
lnExpArqMo -0010(0031)
lnExpArqNoMo 00411 (0013)
lnExpNoArqMo 00141(0018)
lnExpNoArqNoMo 0080 (0041)
InvExpArqMo 00514(0111)
InvExpArqNoMo 0003(0032)
InvExpNoArqMo 0009(0048)
InvExpNoArqNoMo -0238(0163)
lnEDem -17010 -21240 (3857) (3387)
TmiAbroad 0126 0124 (0066) (0069)
TmiUS 0432 0448 (0060) (0062)
CH 0214 0214 (0029) (0027)
Constant 2111 2542 (0450) (0576)
Country FE Yes YesTime FE Yes YesObs 286 286Adj R2 0876 0872Note Robust standard errors in parentheses
105
Appendix E
List of nuclear reactor models by
manufacturer in France and the
US
Table E1 List of nuclear reactor models by manufacturer in France and the US
Model Manufacturer Number of reactors built
B W (L-loop) DRYAMB BabcockWilcox 9BWR-3 General Electric 1BWR-41 General Electric 15BWR-42 General Electric 4BWR-5 General Electric 5BWR-6 General Electric 4
CE (2-loop) DRYAMB Combustion Engineering 13COMB CE80 DRYAMB Combustion Engineering 2
CP0 Areva 6CP1 Areva 18CP2 Areva 10N4 Areva 4P4 Areva 8Prsquo4 Areva 12
W (2-loop) DRYAMB Westinghouse 3W (3-loop) DRYAMB Westinghouse 8W (3-loop) DRYSUB Westinghouse 4W (4-loop) DRYAMB Westinghouse 21W (4-loop) DRYSUB Westinghouse 1W (4-loop) ICECND Westinghouse 9
Total 157
106
Appendix F
Operatorrsquos best response
Proof of proposition 1 The Lagrangian for the operator as long as e gt s is given by
L(e λ) = c(e) + (α minus βe)γD + λ(eminus s) and the Kuhn Tucker first order conditions are
the following
cprime(e)minus βγD + λ = 0 (F1)
λ(eminus s) gt 0 (eminus s) gt 0λ gt 0 (F2)
In case that λ = 0 then the firm overcomplies and e gt s and the best response of the
firm in this case satisfies
cprime(eps)minus βγD = 0
In case that λ = 0 thus e = s The first order condition is cprime(s)minus βγD 6 0
The Lagrangian for the operator when e 6 s is given by L(e micro) = c(e) + (αminus βe)γD +
(1minusα+βe)qF0 +micro(sminus e) and the Kuhn Tucker first order conditions are the following
cprime(e)minus βγD + βqF0 minus micro = 0 (F3)
micro(sminus e) gt 0 (sminus e) gt 0micro gt 0 (F4)
In case that micro gt 0 then the e = s and the best response of the firm in this case is to
comply with the standards and satisfies the following condition
107
Chapter 5 108
micro = cprime(s)minus βγD + βqF0 gt 0
Finally if micro = 0 then the firm do not comply e lt s and the best response of the firm in
this case satisfies
cprime(n)minus βγD + βqF0 = 0
As long as c(s) + (αminus βs)γD gt c(n) + (αminus βn)γD + (1minus α+ βn)qF0
Bibliography
Arguedas C (2008) lsquoTo comply or not to comply pollution standard setting under
costly monitoring and sanctioningrsquo Environmental and Resource Economics 41 155ndash
168
Aven T and Hiriart Y (2013) lsquoRobust optimization in relation to a basic safety
investment modelrsquo Safety Science 55 188ndash194
Aven T and Reniers G (2013) lsquoHow to define and interpret a probability in a risk
and safety settingrsquo Safety Science 51 223ndash231
Becker G (1968) lsquoCrime and punishment an economic approachrsquo Journal of Political
Economy 76 169ndash217
Bernardo J and Smith A (1994) Bayesian Theory John Wiley and Sons
Berthelemy M (2012a) Innovation learning by doing opportunities and nuclear reac-
torsrsquo performance Unpublished manuscript
Berthelemy M (2012b) What drives innovation in nuclear power technologies an
empirical study based in patent counts Unpublished manuscript
Brandt P and Williams J (1998) Modeling time series count data A state-space
approach to event counts
Brandt P and Williams J (2000) lsquoDynamic modeling for persistent event count time
seriesrsquo American Journal of Political Science 44 823ndash843
C Yu W v S and Alsema E (2011) lsquoUnraveling the photovoltaic technology learn-
ing curve by incorporation of input price changes and scale effectsrsquo Renewable and
Sustainable Energy Reviews 15 324337
Cantor R and Hewlett J (1988) lsquoThe economics of nuclear power Further evidence
on learning economics of scale and regulatory effectsrsquo The Bell Journal of Economics
13 297ndash310
109
Bibliography 110
Carlin B and Louis T A (2000) Empirical Bayes Methods for Data Analysis Chap-
man and Hall
Cochran T (2011) Fukushima nuclear disaster and its implications for US nuclear
power reactors
Cohen M (1998) Monitoring and enforcement of environmental policy
Cooper M (2010) Policy challenges of nuclear reactor construction cost escalation and
crowding out alternatives Unpublished manuscript
Cooper M (2012) Nuclear safety and nuclear economics Unpublished manuscript
David P Maude-Griffin R and Rothwell G (1996) lsquoLearning by accident reductions
in the risk of unplanned outages in us nuclear power plants after three mile islandrsquo
Journal of Risk and Uncertainty 13 175ndash198
David P and Rothwell G (1996) lsquoStandardization diversity and learning Strategies
for the coevolution if technology and industrial capacityrsquo International Journal of
Industrial Organization 14 181ndash201
des Comptes C (2012) Les couts de la filiere electronucleaire Technical report Cour
des Comptes
Edenhofer B K M P H K F J O and Bruckner T (2012) Germanys nuclear
phase-out Impacts on electricity prices co2 emissions and on europe
EPRI (2008) Safety and operational benefits of risk-informed initiatives Technical re-
port Electric Power Research Institute
Erickson P K J and Drennen T (2006) lsquoTechnological learning and renewable energy
costs implications for us renewable energy policyrsquo Energy Policy 34 1645ndash1658
Escobar-Rangel L and Leveque F (2012) Revisiting the cost escalation curse of nuclear
power New lessons from the french experience Unpublished manuscript
Fifield P and Sinclair (2002) lsquoMacroeconomic factors and share returns an analysis
using emerging market datarsquo International Journal of Finance amp Economics 7 51ndash62
Filmer D and Pritchett L (2001) lsquoEstimating wealth effects without expenditure data
or tears An application to educational enrollments in states of indiarsquo Demography
38 115ndash132
Finon D (2012) Lrsquoeconomie du nucleeaire revisitee Unpublished manuscript
Finon D and Staropoli C (2001) lsquoInstitutional and technological co-evolution in the
french electronuclear industryrsquo Industry amp Innovation 8 179ndash199
Bibliography 111
Gilboa I and Schmeidler D (1989) lsquoMaxmin expected utility with non-unique priorrsquo
Journal of Mathematical Economics 18 141ndash153
Goldemberg J (2009) lsquoNuclear energy in developing countriesrsquo Daedalus 138 71ndash80
Greenpeace (2013) Greenpeace statement and briefing 21 october 2013
available at httpwwwgreenpeaceorgukmediapress-releases
hinkley-c-greenpeace-statement-and-briefing-20131021 Technical report
Greenpeace
Grubler A (2010) lsquoThe cost of the french nuclear scale-up A case of negative learning
by doingrsquo Energy Policy 38 5174ndash5188
Gundersen A (2012) Lesson from fukushima Technical report Greenpeace
Hansson I and Skogh G (1987) lsquoMoral hazard and safety regulationrsquo The Geneva
Papers on Risk and Insurance 12 132ndash144
Harvey A and Fernandes C (1989) lsquoTime series models for count or qualitative ob-
servationsrsquo Journal of Business and Economic Statistics 7 407ndash417
Harvey A and Shepard N (1993) lsquoStructural time series modelsrsquo Handbook of Statis-
tics 11 261ndash301
Hiriart Y and Martimort D (2004) lsquoEnvironmental risk regulation and liability under
adverse selection and moral hazardrsquo IDEI Working Papers 256
Hiriart Y Martimort D and Pouyet J (2004) lsquoOn the optimal use of ex ante regu-
lation and ex post liabilityrsquo Economics Letters 84 231ndash235
Hiriart Y Martimort D and Pouyet J (2006) lsquoThe regulator and the judge The
optimal mix in the control of environmental riskrsquo Revue drsquoeconomie politique 06 941ndash
967
Hofert M and Wuthrich M (2011) Statistical review of nuclear power accidents
Hotelling H (1933) lsquoAnalysis of a complex of statistical variables into principal com-
ponentsrsquo Journal of Educational Psychology 24 417ndash441
IEA (2010) Projected costs of generating electricity 2010 edition Technical report
IEA
Isoarda S and Soria A (2001) lsquoTechnical change dynamics evidence from the emerg-
ing renewable energy technologiesrsquo Energy Economics 23 619ndash636
Jamasb T (2006) Technical change theory and learning curves Patterns of progress
in energy technologies Unpublished manuscript
Bibliography 112
Joskow P and Parsons J (2009) lsquoThe economic future of nuclear powerrsquo Daedalus
138 45ndash59
Kadak A and Matsuo T (2007) lsquoThe nuclear industryrsquos transition to risk-informed
regulation and operation in the united statesrsquo Reliability Engineering and System
Safety 29 609ndash618
Kessides I (2012) lsquoThe future of the nuclear industry reconsidered Risk uncertainties
and continued promisersquo Energy Policy 48 185ndash208
Kolstad C Ulen T and Johnson G (1990) lsquoEx post liability for harm vs ex ante
safety regulation Substitutes or complementsrsquo The American Economic Review
80 888ndash901
Komanoff C (1981) Power Plant Cost Escalation Nuclear and Coal Cost Regulation
and Economics Van Nostrand Reinhold Publishing
Koomey J and Hultman N (2007) lsquoA reactor-level analysis if busbar cost for the us
nuclear plants 1970-2005rsquo Energy Policy 35 5630ndash5642
Krautmann A and Solow J (1988) lsquoEconomies of scale in nuclear power generationrsquo
Southern Economic Journal 55 70ndash85
Larsen G K A M K and Sundqvist T (2005) lsquoThe impact of rampd on innovation
for wind energy in denmark germany and the united kingdomrsquo Ecological Economics
54 227ndash71
Leveque F (2013) Nucleaire OnOff Analyse economique drsquoun pari DUNOD
Lindman A and Soderholm P (2012) lsquoWind power learning rates a conceptual review
and meta-analysisrsquo Energy Economics pp 754ndash761
Linhart P and Radner R (1989) lsquoMinmax-regret strategies for bargaining over several
variablesrsquo Journal of Economic Theory 48 152ndash178
MacKerron G (2004) lsquoNuclear power and the characteristics of rsquoordinarinessrsquo - the case
of uk energy policyrsquo Energy Policy 32 19571965
Martin Junginger W v S and Faaij A (2010) Technological learning in the energy
sector Edward Elgar Publishing
McCabe M (1996) lsquoPrincipals agents and the learning curve The case of steam-
electric power plant design and constructionrsquo The Journal of Industrial Economics
XLIV 357ndash375
Bibliography 113
NEA (2000) Reduction of capital costs of nuclear power plants Technical report Nu-
clear Energy Agency
Nuttall W J (2005) Nuclear Renaissance Technologies and Policies for the Future of
Nuclear Power Taylor and Francis Group
Parsons J and Du Y (2003) The future of nuclear power Technical report MIT
Parsons J and Du Y (2009) Update on the cost of nuclear power Technical report
MIT
Pearson K (1901) lsquoOn lines and planes of closest fit to systems of points in spacersquo
Philosophical Magazine 2 559ndash572
Peri G (2005) lsquoDeterminants of knowledge flows and their effect on innovationrsquo The
Review of Economics and Statistics 87 308ndash322
Phillip Lipscy K K and Incerti T (2013) lsquoThe fukushima disaster and japans nuclear
plant vulnerability in comparative perspectiversquo Environmental Science and Technol-
ogy 47 6082ndash6088
Roche B (2004) The french nuclear program Edfrsquos experience Technical report EDF
Generation and Engeenering
Rosner R and Goldberg S (2011a) Analysis of gw-scale overnight capital cost Tech-
nical report The University of Chicago
Rosner R and Goldberg S (2011b) Small modular reactors - key to future nuclear
power generation in the us Unpublished manuscript
Rothwell G (1986) lsquoSteam-electric scale economies and construction lead timesrsquo Cal-
Tech working paper 63
Rothwell G and Ganda F (2014) Electricity generating portfolios with small modular
reactors Unpublished manuscript
Schneider M and Froggatt A (2014) World nuclear industry status report 2014 Tech-
nical report Mycle Schneider Consulting Project
Shavell S (1984) lsquoA model of the optimal use of liability and safety regulationrsquo Rand
Journal of Economics 15 271ndash280
Strand J (1994) lsquoEnvironmental accidents under moral hazard and limited firm liabil-
ityrsquo Environmental and Resource Economics 4 495ndash509
Tour F N I (2012) Investigation committee on the accident at fukushima nuclear
power stations Technical report Fukushima NPS Inspection Tour
Bibliography 114
Wang Q Chen X and Yi-chong X (2013) lsquoAccident like the fukushima unlikely in a
country with effective nuclear regulation Literature review and proposed guidelinesrsquo
Renewable and Sustainable Energy Reviews 17 126ndash146
WEC (2012) World energy perspective Nuclear energy one year after fukushima Tech-
nical report World Energy Council
Zanella S C F and Mixon F (2000) lsquoIs economic freedom one dimensional a fac-
tor analysis of some common measures of economic freedomrsquo Journal of Economic
Development 25 17ndash40
Zimmerman M (1982) lsquoLearning effects and the commercialization of new technologies
The case of nuclear powerrsquo The Bell Journal of Economics 13 297ndash310
LrsquoEacuteconomie de lrsquoEacutenergie Nucleacuteaire Coucircts des Construction et Reacutegulation de la Sucircreteacute
RESUME Cette thegravese eacutetudie le rocircle des coucircts de construction et de reacuteglementation de la seacutecuriteacute
sur la compeacutetitiviteacute de leacutenergie nucleacuteaire Lanalyse des coucircts de construction est baseacutee sur
lutilisation de donneacutees reacuteelles provenant des parcs nucleacuteaires franccedilais et ameacutericains En particulier
nous eacutetudions diffeacuterents canaux agrave partir de laquelle des reacuteductions de coucircts pourraient survenir
Nous montrons que la normalisation est un critegravere crucial pour la compeacutetitiviteacute eacuteconomique de
leacutenergie nucleacuteaire dabord parce que les effets dapprentissage positifs sont conditionnels agrave la
technologie ce qui signifie que les reacuteductions de coucircts ne peuvent venir que si le mecircme type de
reacuteacteur est construit agrave plusieurs reprises mais aussi parce quelle permet de reacuteduire le coucirct
indirectement par lintermeacutediaire courts deacutelais de construction Dans lanalyse du rocircle de
reacuteglementation de la seacutecuriteacute nous eacutevaluons dabord leffet de la derniegravere accident nucleacuteaire majeur
(c-agrave Fukushima Dai-ichi) de la probabiliteacute de survenance dun tel eacuteveacutenement puis les effets de
lincertitude concernant la faccedilon dont les soins de la seacutecuriteacute agrave reacuteduire le probabiliteacute dun accident
nucleacuteaire dans leacutetablissement de normes de seacutecuriteacute en vertu de laleacutea moral et responsabiliteacute
limiteacutee Nous constatons que la norme sera la moins stricte lorsque le reacutegulateur adopte une
approche pire des cas et plus stricte lorsque le reacutegulateur adopte lapproche de la robustesse de
regret et il est optimiste quant agrave lefficaciteacute des soins de la seacutecuriteacute pour reacuteduire le risque daccident
Toutefois cette norme pourrait induire le non-respect par les opeacuterateurs les moins efficaces
Mots cleacutes Eacutenergie nucleacuteaire coucircts de construction effets dapprentissage reacutegulation de la sucircreteacute risque moral optimisation robuste
Economics of Nuclear Power Construction Costs and Safety Regulation
ABSTRACT This thesis studies the role of construction costs and safety regulation on nuclear
powers competitiveness The analysis of construction costs is based on the use of actual data
coming from the American and French nuclear fleets In particular we study different channels from
which cost reductions might arise We show that standardization is a crucial criterion for the
economic competitiveness of nuclear power first because the positive learning effects are
conditional to the technology this means that cost reductions will arise only if the same type of
reactor is built several times but also because it allows to reduce the cost indirectly through shorter
construction lead-times In the analysis of the role of safety regulation we first assess the effect of
the latest major nuclear accident (ie Fukushima Dai-ichi) in the probability of occurrence of such an
event and then the effects of the uncertainty regarding how safety care reduce the probability of a
nuclear accident in setting safety standards under moral hazard and limited liability We find that the
standard will be the less strict when the regulator adopt a worst-case approach and stricter when the
regulator adopts the regret robustness approach and it is optimistic about safety care effectiveness to
reduce the risk of an accident However this standard might induce non-compliance by the least
efficient operators
Keywords Nuclear power construction costs learning effects safety regulation moral hazard robust optimization
- Abstract
- Acknowledgements
- Preface
- List of Figures
- List of Tables
- General Introduction
-
- 01 Context
- 02 The risks of nuclear power and the probability of major accident
- 03 The cost escalation curse in the construction of new nuclear power plants
- 04 Nuclear safety regulation
- 05 Methodological approach structure and contribution of this thesis
-
- 1 How Fukushima Dai-ichi core meltdown changed the probability of nuclear accidents
-
- 11 Introduction
- 12 Literature review
- 13 How to properly estimate the expected frequency of a nuclear accident using theoretical probability and past observations
- 14 Poisson Exponentially Weighted Average (PEWMA) model
-
- 141 PEWMA Results
- 142 Arrival rate estimates from 1952 to 2012
-
- 15 Conclusion
-
- 2 Revisiting the cost escalation curse of nuclear power New lessons from the French experience
-
- 21 Introduction
- 22 Data and Model
-
- 221 French construction cost escalation
-
- 23 Results
- 24 Conclusion and Policy Implications
-
- 3 Nuclear reactors construction costs The role of lead-time standardization and technological progress
-
- 31 Introduction
-
- 311 Toward a nuclear renaissance
- 312 Existing literature on nuclear power plants construction costs and lead-times
- 313 The contributions of this paper to the economic literature and the nuclear energy policy debate
-
- 32 Model main hypothesis about learning opportunities and data
-
- 321 Model for construction costs and lead-times in nuclear power
-
- 3211 Hypotheses on the role reactors design standardization
- 3212 Hypotheses on learning by doing
- 3213 Hypotheses on leaning by searching
-
- 322 Data
-
- 33 Model specifications and results France versus the US
-
- 331 Model specifications
- 332 Results
-
- 34 Nuclear reactors lead-time Insights from other OECD countries
-
- 341 Data and Model
-
- 35 Conclusion
-
- 351 Policy implications for nuclear new-build programs
- 352 Paths for future research
-
- 4 Setting optimal safety standards for nuclear operators subject to uncertainty moral hazard and limited liability
-
- 41 Introduction
- 42 The Model
-
- 421 Benchmark The regulator knows
-
- 43 Imprecise probabilities and robust optimization
-
- 431 Worst-case approach
- 432 Regret robustness approach
-
- 44 Conclusion
-
- 5 General Conclusion
-
- 51 Conclusion about Construction Costs
- 52 Conclusion about Safety Regulation
-
- A Cour des Comptes Actual Construction Costs for the French Nuclear Fleet
- B Linear models for the Construction Costs
- C Alternative model specifications
- D Alternative model specifications for lead-time
- E List of nuclear reactor models by manufacturer in France and the US
- F Operators best response
- Bibliography
-

$$ampamp$()$++++$$
MINES ParisTech Centre de Eacuteconomie Industrielle CERNA
60 Boulevard Saint Michel Paris France
$$ampamp () ++++
$$
Eacutecole doctorale ndeg 369 Economie Organisation Socieacuteteacute
preacutesenteacutee et soutenue publiquement par
Lina Patricia ESCOBAR RANGEL
10 Novembre 2014
Economics of Nuclear Power Construction Costs and Safety Regulation
LrsquoEacuteconomie de lrsquoEacutenergie Nucleacuteaire Coucircts des Construction et Reacutegulation
de la Sucircreteacute $
$
Doctorat ParisTech
T H Egrave S E pour obtenir le grade de docteur deacutelivreacute par
lrsquoEacutecole nationale supeacuterieure des mines de Paris
Speacutecialiteacute ldquo Eacuteconomie et Finance rdquo
$
Directeur de thegravese Franccedilois LEVEQUE $
T H Egrave S E
Jury M Jan KEPPLER Professeur deacuteconomie CGEMP Universiteacute Paris - Dauphine Preacutesident M Nicolas BOCCARD Professeur deacuteconomie Universitat de Girona Rapporteur M Benoit SEVI Professeur deacuteconomie UPMF Universiteacute de Grenoble Rapporteur M Franccedilois LEVEQUE Professeur deacuteconomie CERNA Ecole des Mines de Paris Examinateur
MINES PARIS TECH
Economics of Nuclear Power
Construction costs and Safety
Regulation
by
Lina Escobar Rangel
A thesis submitted in partial fulfillment for the
degree of Doctor of Philosophy in Economics
in the
CERNA - Center for Industrial Economics
May 2015
ldquoThere are things known and there are things unknown and in between are the doors of
perceptionrdquo
Aldous Huxley
MINES PARIS TECH
Abstract
CERNA - Center for Industrial Economics
Doctor of Philosophy in Economics
by Lina Escobar Rangel
This thesis studies the role of the construction costs and safety regulation on nuclear
power competitiveness The analysis of the construction costs is based on the use of the
actual data coming from the american and french nuclear fleet In particular we study
different channels from which cost reductions might arise We show that standardization
is a key criterion for the economic competitiveness of nuclear power first because the
positive learning effects are conditional to the technology this means that cost reductions
will arise only if the same type of reactor is built several times but also because it allows
to reduce the cost indirectly through shorter construction lead-times In the analysis of
the role of safety regulation we first asses the effect of the latest major nuclear accident
(ie Fukushima Dai-ichi) in the probability of occurrence of such an event and then the
effects of the uncertainty regarding how safety care reduce the probability of a nuclear
accident in setting safety standards under moral hazard and limited liability We find
that the standard will be stricter when the regulator is optimistic in the safety care
effectiveness to reduce the risk of an accident but simultaneously this policy might
induce no compliance of the most inefficient operators
Acknowledgements
I would like to express my gratitude to my supervisor Professor Francois Leveque whose
expertise added considerably to my graduate experience He has guided me over these
three years rigorously and patiently I would like to thank for his constant interest in
my work and for encourage me throughout my thesis
Besides my advisor I would like to thank other senior members of Center for Industrial
Economics (CERNA) in particular to Yann Meniere for the assistance and advices he
provided to me during the doctoral workshop Likewise I would also want to thank
Pierre Fleckinger for his comments and suggestions that were key to write the last
chapter of this thesis
I must also acknowledge Sesaria Ferreira for her assistance with all the administrative
procedures but also for helping supporting and listening to me in particular when
things went wrong
I thank my fellow colleagues in CERNA Michel Berthelemy Justus Baron Marine
Lefort Damien Dussaux Charlene Cosandier and more recently Carlotta Mariotto
Jiekai Zhang and Btissam El Bahraoui for their useful comments in the doctoral work-
shop but specially for making these years an enriching and pleasant experience
I would also like to thank my colombian friends who became my family and were the
most precious company here in Paris Diego Milanes Paula Arias Fabio Dominguez
John Mauro Perdomo Hernan Perez and David Espinosa
Last but not the least I would like to thank my family my lovely parents Jairo and
Esperanza my sister Daniela and my brother Oscar for their love their words and
unconditional support I dedicate this thesis to them
iii
Preface
This PhD thesis is embedded in a research program called The new economics of nuclear
energy directed by Francois Leveque and financially supported by Electricite de France
EDF This project aimed to study the challenges of nuclear energy through an economic
perspective focusing on three research axes innovation competitiveness and industrial
organization This thesis tacked the second issue by studying the construction costs and
nuclear safety regulation This document presents four papers that have been presented
in seminars and conferences The opinions expressed in this document do not necessarily
coincide with those of EDF
Chapter 1 is entitled How Fukushima Dai-ichi core meltdown changed the probability of
nuclear accidents and was co-written with Francois Leveque This paper was presented
in the seminar organized by the Finance for Energy Market Research Center FIME
at the Institut Poincare in Paris (22 March 2013) at the 20th EAERE conference in
Toulouse France (26-29 June 2013) and was accepted and published in Safety Science
Volume 64 on April 2014
Chapter 2 Revisiting the Cost Escalation Curse of Nuclear Power New Lessons from
the French Experience also co written with Francois Leveque was submitted and is
currently under revision to be published in Economics of Energy and Environmental
Policy This paper was presented at the Conference of Energy Markets organized by
Toulouse School of Economics in Toulouse France (17-18 January 2013) and afterwards
at the IAEE International Conference held in Daegu South Korea (16-17 June 2013)
Chapter 3 Nuclear reactorsrsquo construction costs The role of lead-time standardization
and technological progress is co-authored with Michel Berthelemy This paper has been
presented in the Seminaire de recherches en economie de lrsquoenergie held in Paris France
(12 February 2014) in the Environmental Economics Lunch Seminar organized by Paris
School of Economics (6 March 2014) the International WPNE Workshop on Project and
Logistics Management in Nuclear New Build organized by the OECD Nuclear Energy
Agency (NEA) in Paris France (11 March 2014) the 3rd Mannheim Energy Conference
(May 5-6 2014) and the IAEE International Conference held in New York US (16-18
June 2014) This paper was accepted to be published in Energy Policy
Chapter 4 is called Setting optimal safety standards for nuclear operators subject to un-
certainty moral hazard and limited liability at the moment it has not been yet presented
in any conference
iv
Contents
Abstract ii
Acknowledgements iii
Preface iv
List of Figures viii
List of Tables ix
General Introduction x
01 Context x
02 The risks of nuclear power and the probability of major accident xii
03 The cost escalation curse in the construction of new nuclear power plants xiii
04 Nuclear safety regulation xv
05 Methodological approach structure and contribution of this thesis xviii
1 How Fukushima Dai-ichi core meltdown changed the probability ofnuclear accidents 1
11 Introduction 1
12 Literature review 2
13 How to properly estimate the expected frequency of a nuclear accidentusing theoretical probability and past observations 4
131 Data 5
132 Models 8
14 Poisson Exponentially Weighted Average (PEWMA) model 14
141 PEWMA Results 16
142 Arrival rate estimates from 1952 to 2012 17
15 Conclusion 19
2 Revisiting the cost escalation curse of nuclear power New lessonsfrom the French experience 21
21 Introduction 21
22 Data and Model 28
221 French construction cost escalation 28
222 Model and data 30
v
Contents vi
223 Multicollinearity and Principal Component approach 33
23 Results 36
24 Conclusion and Policy Implications 40
3 Nuclear reactorsrsquo construction costs The role of lead-time standard-ization and technological progress 43
31 Introduction 43
311 Toward a nuclear renaissance 43
312 Existing literature on nuclear power plants construction costs andlead-times 45
313 The contributions of this paper to the economic literature and thenuclear energy policy debate 47
32 Model main hypothesis about learning opportunities and data 48
321 Model for construction costs and lead-times in nuclear power 48
3211 Hypotheses on the role reactorrsquos design standardization 50
3212 Hypotheses on learning by doing 50
3213 Hypotheses on leaning by searching 51
322 Data 52
33 Model specifications and results France versus the US 56
331 Model specifications 56
332 Results 57
34 Nuclear reactors lead-time Insights from other OECD countries 61
341 Data and Model 62
35 Conclusion 64
351 Policy implications for nuclear new-build programs 65
352 Paths for future research 67
4 Setting optimal safety standards for nuclear operators subject to un-certainty moral hazard and limited liability 69
41 Introduction 69
42 The Model 74
421 Benchmark The regulator knows β 78
43 Imprecise probabilities and robust optimization 82
431 Worst-case approach 82
432 Regret robustness approach 85
44 Conclusion 89
5 General Conclusion 93
51 Conclusion about Construction Costs 94
52 Conclusion about Safety Regulation 98
A Cour des Comptes Actual Construction Costs for the French NuclearFleet 101
B Linear models for the Construction Costs 102
C Alternative model specifications 104
Contents vii
D Alternative model specifications for lead-time 105
E List of nuclear reactor models by manufacturer in France and the US106
F Operatorrsquos best response 107
Bibliography 109
List of Figures
11 Core Damage Frequency Industry Average Trend 3
12 International Nuclear and Radiological Event Scale 5
13 Major nuclear accidents reactors and operating experience 1955-2011 7
14 Histogram for nuclear accidents 1952-2011 8
15 Cumulate frequency (AccidentsReactorYears) for nuclear accidents 1952-2011 8
16 Bayesian updating with Poisson-Gamma model 12
17 Poisson-Gamma vs PEWMA for CMD 18
21 Overnight costs for the US Nuclear Fleet e 2010MW 24
22 Evolution of French Nuclear Power Fleet by palier 29
23 Grubler vs Cour de Comptes construction costs 30
24 Cour de Comptes construction cost by palier and type 31
25 Labor cost index (ICHT) and Price index for France =100 in 1973 33
31 Nuclear reactorsrsquo overnight construction costs in the US and France 53
32 Nuclear reactorsrsquoconstruction lead-time in the US and France 54
33 Nuclear reactorsrsquo construction lead-time in OCDE countries 63
41 Operatorrsquos best response to different regulatory policies (sq) 79
42 Difference in the safety standards set taking worst-case and regret robust-ness approaches 88
viii
List of Tables
11 INES Events 6
12 Poisson with constant arrival rate (1952-2011) 10
13 Poisson with deterministic time trend 13
14 PEWMA Estimates for Prior a=1 b=3500 17
15 Test for reduction to Poisson H0 ω = 1 17
16 Summary of results 19
21 First Generation of French Reactors 28
22 Descriptive statistics 34
23 Correlation Matrix 34
24 Linear regression estimates 35
25 VIF for explanatory variables 35
26 Loadings and roots 36
27 Principal Component Regression Results 37
31 Descriptive statistics 55
32 Estimation output of Equations (31) and (32) 58
33 Estimation output of Equations (31) and (32) 59
34 Mean for the explanatory variables 62
35 Regression results for lead-time with experience and the HHI index 64
A1 Data from the Cour des Comptes report 101
B1 Estimates for Model 2 102
B2 VIF for Model 2 103
B3 Estimates for Model 3 103
B4 VIF for Model 3 103
B5 Estimates for Model 4 103
B6 VIF for Model 4 103
C1 Alternative model specifications 104
D1 Alternative model specifications for lead-time in OECD countries 105
E1 List of nuclear reactor models by manufacturer in France and the US 106
ix
General Introduction
01 Context
On March 11 2011 the coast of Tohuku the region located at the northeast of Japanrsquos
main island was devastated by a series of tsunami waves resulting after a 90 earthquake
This disaster affected several reactors in different nuclear power stations on the Pacific
coast Fukushima Dai-ichi was the most impaired nuclear plant four of its six units
were severely damaged and three reactors suffered core meltdowns followed by massive
releases of radioactive material outside their containment structures Undoubtedly this
has been one of the most severe accidents in the history of nuclear power for civil uses
Briefly the timeline of the events that lead to the core melt at Fukushima Dai-ichi
happened as follows after the earthquake reactors 1 to 3 shouted down automatically
following the japanese safety protocols The emergency generators were activated to
power the cooling systems in order to keep below the melting point the fission products
that were in the fuel rods The tsunami 14 meters waves arrived 50 minutes after the
earthquake and overpassed the unitrsquos sea walls which had 101 meters only The sea
water flooded the room where the emergency generators were located and they failed
to power the cooling systems Once the batteries of the active cooling systems ran out
the reactors began to heat up As workers struggled to supply power to the reactorsrsquo
cooling systems and control rooms multiple hydrogen-air chemical explosions occurred
from 12 March to 15 March
As soon as the images of this terrible catastrophe were broadcasted worldwide they
revived the memories of the core melt at Chernobyl in Ukraine in 1986 and materialized
the hazards associated with the operation of a nuclear power plant After the accident
the reactions from both the nuclear industry and anti-nuclear groups were swift As
expected this accident deepened the divergence in their views regarding the role that
nuclear power can play in the worldrsquos energy production But beyond the passionate
1 For further details of the affected reactors hit by the earthquake and tsunami see Phillip Lipscyand Incerti (2013)
x
General Introduction xi
views of these groups the debate following after Fukushima Dai-ichi accident raised
important issues that put into question the convenience of nuclear power both in safety
and economical terms
Paradoxically Fukushima Dai-ichi accident happened in a period when after a long
time prospects of nuclear deployment were positives Throughout the 90s the con-
struction of new reactors had stagnated and the progressive aging of the fleet worldwide
seemed to indicate the inevitable narrowing of nuclear powerrsquos share in the worldrsquos en-
ergy production However since about 2001 the interest for nuclear power revived In
fact the term nuclear renaissance appeared in the energy policy debate because many
countries gave an important role to nuclear power in their agendas with projections
for new build similar to or even exceeding those of the early years of nuclear power
For instance before the accident occurred 159 reactors were planned to be constructed
around the world (WEC 2012) which would have meant an addition of 178123 MWe
(ie 47 of the present capacity)
The renewed interest in nuclear power was not fortuitous on the contrary it appeared as
a solution to multiples concerns The high oil prices registered in 2000 and the fact that
much of the oil and gas production is located in politically unstable countries recalled
the importance of reducing the dependence of fossil fuels and secure the energy supply
Given that nuclear power uses an abundant mineral (uranium) in the earthrsquos crust made
it attractive from an energy security standpoint In addition the growing awareness of
the possible damages linked with climate change led to the implementation of different
policies aimed to reduce CO2 emissions Although most of the attention has been focused
in renewables it was acknowledge that nuclear power is the only technology that can
provide base load electricity without carbon emissions (See Nuttall (2005) Joskow and
Parsons (2009) Kessides (2012))
Unquestionably the accident meant a set back in terms of public perception about
nuclear safety and induced a revision of the forecast of nuclear power expansion in many
countries The clearest example of how this accident triggered the political pressure
against nuclear power was the decision to accelerate the nuclear phase-out in Germany
Just a couple of months after the accident the Chancellor Angela Merkel decided to
accelerate the phase-down and to move the shut down deadline to 2022 which reversed
the decision that was taken one year before when the life-time extension of nuclear
power up to 20382 was granted
This accident marked a breaking point in nuclear history however the effect of Fukushima
Dai-ichi in new nuclear builds is yet to be address According Power Reactor Informa-
tion System (PRIS) of the International Atomic Energy Agency (IAEA) 62 new reactors
2 See Edenhofer and Bruckner (2012)
General Introduction xii
were under construction in 2011 and in 2014 there are 72 reactors being built Although
this current level of new built is not as high as it was expected before the accident it
represents a record for nuclear industry and shows that public opinion is not the only
barrier that nuclear power faces today For the above the materialization of the nuclear
renaissance in those countries that still have a favorable opinion of nuclear power will
depend in some extent on the responses that nuclear industry gives to the issues and
challenges raised after this accident
02 The risks of nuclear power and the probability of major
accident
The first issue for nuclear power development reemerged right after the accident The
possibility of a core melt down and the harm that such an event might provoke is the
reason why nuclear power has been perceived as a latent hazard and has had to struggle
with public opposition in many countries At that moment perhaps one of the subjects
that raised more controversy in the public debate was how likely nuclear meltdowns could
occur Despite that this issue seems only a matter of applying a statistical formula after
Fukushima Dai-ichi supporters and opponents to nuclear power claimed diametrically
opposite things
On the one hand nuclear industry claimed that Fukushima Dai-ichi core melts were the
result of an unpredictable and very rare situation they argued that core melts are not
likely to occur and they claimed that new designs can resist natural events of similar
magnitude of those that hit Japan This point of view was supported with the results
of the Probabilistic Risk Assessments (PRA) that have been done in different reactors
around the world For instance the report EPRI (2008) estimated that the average core
melt frequency for the US nuclear fleet is equal to 20E-5 which means 1 core melt
every 50000 reactor years or equivalently 1 core melt each 1000 years for a fleet of 500
reactors in operation (today worldrsquos nuclear fleet has around 430 reactors in operation)
On the other hand nuclear opponents claimed that the observed frequency is higher
than the (theoretical) expected frequency coming from the PRAs Just dividing the
total number of operating hours of all civilian nuclear reactors around the world that
is approximately 14500 reactor-years by the number of nuclear reactor meltdowns that
have actually occurred (ie 4 nuclear meltdowns 1 at Chernobyl and 3 at Fukushima)
translates into one major accident every 3625 reactor years Which is substantially
greater than what the nuclear industry suggested
General Introduction xiii
In this context how to assess properly the probability of a major accident is an important
question for nuclear power development not only to clarify this debate but also because
it will allow a proper management of the risk This means that societies can be better
informed not only about the hazards that nuclear power entails but also on how likely
is that major accidents occur Nuclear regulators will be able to set attainable and
coherent goals in terms of the accepted risk level below which nuclear power plants
should operate In addition operators can allocate better the safety investments aiming
to reduce the probability of major accidents and finally it could also be helpful to
determine insurance policies
03 The cost escalation curse in the construction of new
nuclear power plants
The second concern raised after Fukushima Dai-ichi accident is related with the safety
investments that might have to be done to allow reactors under operation to resist
natural aggressions as those that impacted the Japanese nuclear fleet But even more
important for the future development of nuclear power are the consequences that this
accident might have in terms of construction costs for new reactors Investment costs
are the main driver3 of nuclear electricity generating costs thus any unexpected and
significant increase of the expenses on the construction will undermine the profitability
of a new build It is possible to think that the lessons learned after Fukushima Dai-ichi
may encourage nuclear vendors to include other safety features safety authorities might
impose stricter licencing rules and greater public opposition to installing new nuclear
power plants can result in an increase in the construction costs
The potential effect of Fukushima Dai-ichi in the costs of new reactors worsen the doubts
about the possibility of building nuclear power plants at a reasonable cost It is impor-
tant to mention that these concerns began to emerge before the accident due to the con-
tinuous revisions in the costs estimates for new reactors in the US Taking into account
the changes made by utilities in the application forms filled for the Nuclear Regulatory
Commission the cost expectation of an AP1000 reactor passed from US$2000 in 2003
(See Base case in Parsons and Du (2003)) to US$4000 per installed kilowatt in 2009
(See Parsons and Du (2009) and Rosner and Goldberg (2011a))
These concerns were also supported by the press releases announcing delays and im-
portant cost overruns in the construction of the first of a kind Generation III+ EPR4
3 According to the IEA (2010) the share of the capital costs in the leveled cost of electricity in nuclearpower is between 60 to 80
4 European Pressurized Reactor
General Introduction xiv
reactors in Europe In Finland the construction of Olkiluoto 3 started in 2005 and was
supposed to be ready in 2009 This delay will be by far failed the commercial operation
of this reactor was expected to be in 2016 The most recent news informed that it will
be in 20185 Regarding the construction costs of the EPR at Flamanville unit in France
the continuous increases in the costs make the situation alarming The first estimate was
e33 billion in 2005 and passed to e6 billion in 2011 The most recent press release in
2012 announced a total cost of e85 billion Not to mention that Flamanville 3 was ex-
pected to start commercial operation in 2013 but due to delays during the construction
is expected now to start up in 2016
As if this were not enough the doubts about nuclear power competitiveness were also
supported by what has been registered in construction of the US and French nuclear
fleet For the former it is possible to find a 7 times difference of the overnight cost6
expressed in Me(2010)MW and collected by Koomey and Hultman (2007) for the first
and last installed nuclear reactors For France Grubler (2010) found that the difference
between the construction costs of the units installed in 1974 and those constructed after
1990 is 35 times For all these reasons the escalation of the construction costs of new
reactors has been seen as a curse for nuclear industry
The economic literature about nuclear power construction cost has not provided a clear
cut answer to explain the main drivers of the new buildrsquos costs overruns and how is it
possible to reduce them Most of the studies have used primarily US construction costs
data due to the lack of comparable data coming from other countries therefore the re-
sults are restricted to the american case It is generally accepted that the heterogeneity of
the nuclear US fleet the longer lead-times that took to construct bigger reactors and the
closer regulatory monitoring after Three Mile Island accident (Zimmerman (1982)David
and Rothwell (1996) Rothwell (1986) Cantor and Hewlett (1988)McCabe (1996) and
Cooper (2012)) were the main elements that explain the substantial increase in the costs
per MWe installed
The cost assessment done by Grubler (2010) for the french nuclear fleet concluded that
although the French nuclear fleet was constructed under a centralized industrial structure
and it has a more homogenous nuclear fleet compared with the US fleet it suffered of
forgetting by doing Making allusion to the fact that while EDF accumulated experience
nuclear construction costs per unit of capacity have been increasing instead of decreasing
5 See httpwwwhelsinkitimesfifinlandfinland-newsdomestic
11836-olkiluoto-3-to-be-ready-in-2018html6 Overnight cost includes the investments linked with site preparation and construction but it ex-
cludes financing expenses Therefore it shows the cost of the plant as if it had been fully built inone night
General Introduction xv
In this context it has been argued that nuclear power is characterized by increasing
investment costs and it is inevitable to build a new reactor without cost overruns and
delays However in 2012 the actual construction costs for the French nuclear fleet were
published in the Cour des Comptes report and by using this new information it is
possible to find that the cost escalation computed by Grubler (2010)7 was not as severe
as argued In fact the ratio between the last and the first reactor installed in France
using Grublerrsquos estimates is 3 while by taking the actual construction costs is 14 This
difference suggests that there must be a way to curb the construction costs of nuclear
reactors Using the new information coming from the Cour des Comptes report is key
to identify which have been the factors that allowed to ease the cost escalation in the
construction of new nuclear power plants in France compared with what happened in
the US
Nowadays determine the main drivers of the construction costs of new reactors and
the possible sources of cost reductions is of paramount importance for nuclear industry
As mentioned before currently there are 72 reactors under construction in 14 different
countries8 this is quite an achievement for nuclear power given that level of new build
in 2014 has not been observed since 1987 It is likely that the success of the projects
under construction in terms of meeting the schedules and budgets will represent a
step towards the materialization of the nuclear renaissance because it will give a green
light for further deployment of nuclear power While if this projects repeat the errors
of the past this might lead investments to other competing energy technologies which
have shown decreasing costs For instance Lindman and Soderholm (2012) found that
the kW from onshore wind farms decreases by more than 10 each time the installed
capacity doubles In the same direction Isoarda and Soria (2001) and C Yu and Alsema
(2011) have identified significant learning effects in the photovoltaic industry result that
is confirmed by the dramatic reductions in the underlying costs and market prices of
solar panels in the last years
04 Nuclear safety regulation
One last issue that also came as a result of Fukushima Dai-ichi accident is the role of
safety regulation as an effective way to prevent these events As described above the
height of tsunami waves was the cause of the flood that made impossible to run the
emergency generators to cool down the reactors that eventually led to the core melts
7 The costs assessment done by Grubler (2010) did not use the actual construction costs but someestimations based on EDF financial statements
8 See the list published by the World Nuclear Association (WNA) httpworld-nuclearorg
NuclearDatabaserdresultsaspxid=27569ampExampleId=62
General Introduction xvi
Right after the accident it was somehow spread in the media that a tsunami of such
magnitude was a surprise and it was not predictable therefore the whole situation could
be considered as a black swan Nevertheless different nuclear safety experts carried out
investigations after the accident and discovered that the Japanese safety authority knew
that similar tsunamis had happened in the past and it was possible to witness them
again (see Gundersen (2012) Wang et al (2013))
This revelation harmed the reputation of the safety authority and the laxity of the
Japanese nuclear regulator is now seen as the main cause of this accident (Leveque
2013) Indeed the investigation showed that it was never required to Tokyo Electric
Power Company (TEPCO) the operator of Fukushima Dai-ichi to back fitted the sea
walls even if they knew that it was likely to observe a violent tsunami in that region
Today it is possible to argue that upgrading the unitrsquos sea walls would have been much
cheaper than the costs of damages that the accident has caused However before the
accident the investment decision was not as clear cut as it might be seen now First
because even if the regulator knew that a tsunami of that magnitude was possible still
its probability was very small Second because the potential damages in case of an
event like this were highly uncertain Finally because it is hard to measure how the
sea wallrsquos upgrade would have reduced the probability of this accident In consequence
before the accident the costs of upgrading the walls could have been seen as unnecessary
thus harmful for the profitability of the company
Taking into account the above it is clear that safety regulation aside from preventing
nuclear accidents also plays its role in the economics of nuclear power Safety authorities
are in charge of determining and enforcing the acceptable risk level at which nuclear
power plants should operate However to attain the envisioned risk levels they can not
demand the first thing that comes to mind First because it might not be effective
to reduce the probability of an accident and second because it might be too costly
In economics this tension simply means that the regulators will have to identify the
standards that allow to reduce the risk of major accident in a cost-efficient way In
other words they have to determine the optimal balance between the marginal private
costs of providing safety and the social marginal benefits of achieving that level of safety
Although this balance between the costs and benefits of providing safety is also present
in other sectors like transport food drugs etc nuclear safety authorities have to deal
with several particularities First the damages left after an accident are huge and
its consequences are long-lasting For instance the preliminary cost estimates of the
Fukushima Dai-ichi accident are around 250 billion USD Schneider and Froggatt (2014)
claimed that 11 municipalities in Fukushima Prefecture covering 235 km2 will have to
undertake decontamination efforts not to mention the costs related with all the people
General Introduction xvii
that had to be relocated after the accident In the literature Shavell (1984) Kolstad
et al (1990) and Hansson and Skogh (1987) showed that when the magnitude of the harm
is huge as is the case of nuclear accidents liability rules although they are necessary to
provide incentives to exert safety care are not enough to achieve sufficiently high safety
levels
Second nuclear safety regulators have to monitor that operators comply with the re-
quirements established in the safety standards due to the unobservability of their ac-
tion (although this is not specific for nuclear power) In the economic literature Strand
(1994) Hiriart and Martimort (2004) Hiriart et al (2004) inter alia have shown that
this information asymmetry (moral hazard) means that it is not possible to enforce the
first best safety level at zero cost Therefore the challenge for nuclear safety authorities
is to be able to define a policy that induce the compliance of the safety standard as the
operatorrsquos optimal response
Finally another problem present in nuclear safety regulation is the epistemic uncer-
tainty regarding the probability of a major accident but in particular how safety care
can reduce it Nuclear regulators have some statistical tools as the PRA to evaluate
how operatorrsquos safety care translates into reductionsincreases in the probability of an
accident however the results coming from these techniques are random variables with
unknown distribution functions This last feature means nuclear regulators do not have
a single and precise probability measure when setting the safety standards but instead
they have some partial information (ie an interval of values coming from the PRA)
about the link between safety care and the probability of an accident
How to set optimal safety standards in the presence of all the particularities mentioned
above is an important challenge for nuclear power development In the first place be-
cause safety authorities have to be able to guarantee that nuclear facilities run under
the accepted risk level Second because safety standards are an effective way to comple-
ment liability rules and achieve higher safety levels Finally because it is in the interest
of both the society and the operator to avoid the damages linked with major nuclear
accidents
05 Methodological approach structure and contribution
of this thesis
All the issues described before make nuclear power a passionate subject and pose re-
search questions that are far from dull Specifically in this thesis we will try to give an
answer from a positive perspective to the following questions how to assess properly
General Introduction xviii
the probability of a nuclear accident which are the determinants of the nuclear con-
struction costs and the possible sources of reductions and finally how to set optimal
safety standards in the nuclear power sector taking into account the particularities of
major nuclear accidents To answer to these questions this thesis is composed by four
chapters that aim to study rigorously these three issues in order to derive conclusions
that shed some light in current debate but also that allow us to predict to the possible
trends in nuclear power development and help to shape future energy policies
Chapter 1 is entitle How Fukushima Dai-ichi core meltdown changed the probability of
nuclear accidents and was co-authored with Francois Leveque This chapter investigates
how to compute the probability of a nuclear accident by using past observations But
in particular how the observation of the last catastrophe at the Fukushima Dai-ichi
nuclear power plant changed the expected frequency for such events In this chapter we
aimed to answer these questions by using historical data and testing different statistical
models We have compared four Poisson models using three different definitions of
nuclear accidents from 1952 to 2012
Our results allow us to conclude that as the definition of accident takes into account
other events (ie not only the major nuclear disasters but also less serious accidents)
the independence assumption underlying the classical Poisson models is violated This
result called for a time-varying mean model such as the Poisson Exponentially Weighted
Moving Average (PEWMA) By using this last model we find a greater increase in the
risk of a core meltdown accident owing to the accident that took place in Japan in 2011
than the estimates that we obtained using the classic Poisson models
Chapter 2 is entitle Revisiting the Cost Escalation Curse of Nuclear Power New Lessons
from the French Experience and it was also co-written with Francois Leveque This
chapter studies the so called cost escalation curse that has affected the construction
of new nuclear power plants ever since the completion of the first wave in 1970 to the
ongoing construction of Generation III+ reactors in Europe As we have mentioned this
phenomenon has been studied for the US and it has been argued that the escalation
can partially be explained by a heterogeneous nuclear fleet which has made it difficult to
learn from experience The French nuclear power program has followed a standardization
strategy however previous cost assessments have also pointed to an increase in the
capital costs This observation implied that even in the best economic conditions cost
escalation is inherent to nuclear power
In this chapter we reexamine the drivers of cost escalation in France based on con-
struction costs taken from a recent report by the Cour des Comptes Using this new
information we find that the cost escalation observed in previous studies was lower
than argued Our results indicate that the scale-up resulted in more costly reactors
General Introduction xix
however we were not able to disentangle the effect of the technological change embedded
on bigger reactors from the effect of the increase in the size In parallel we find positive
learning effects but they were restricted to the same type of reactors (ie the construc-
tion cost of decrease as the experience in the same type increases) Finally we find
that those reactors with better safety performance were also more expensive This last
result suggests that safety concerns have played a role in the cost escalation observed in
France
Chapter 3 Nuclear reactorsrsquo construction costs The role of lead-time standardization
and technological progress is co-authored with Michel Berthelemy and complements the
previous chapter by analyzing the nuclear reactor construction costs and lead-times in
France and the United States We estimate a regression model for both the overnight
costs and construction time In this chapter we test the presence of standardization
gains in the short term and long term The former might arise when the diversity of
nuclear reactorsrsquo technologies under construction is low and the latter might arise as the
result of learning by doing that in this context means the experience in the construc-
tion of the same type of reactor In addition we study the effect of innovation in the
construction of new reactors by using priority patent data as a proxy for technological
progress
We find that overnight construction costs benefit directly from learning by doing but the
spillovers were only significant for nuclear models built by the same firm In addition we
show that the standardization of nuclear reactors has an indirect and positive effect in
the short run through a reduction in lead-time the latter being one of the main drivers
of construction costs Conversely we also explore the possibility of learning by searching
and find that contrary to other energy technologies innovation leads to construction
costs increases
Chapter 4 is entitle Setting optimal safety standards for nuclear operators under uncer-
tainty moral hazard and limited liability It examines the features of an optimal safety
regulatory policy under uncertainty about how safety care reduces the probability of
accident moral hazard and limited liability The regulatory policy consists in setting
a safety standard and choose a probability of inspection to the nuclear facilities After
the inspection the regulator can impose a fine in case the nuclear operator did not
comply with the safety standard The main objective of this paper is to characterize the
optimal regulatory policy that induce compliance by the operator when the regulator
does not know perfectly how the safety care level will reduce the probability of a nuclear
accident To tackle this issue we use robust optimization techniques worst case and
regret robustness
General Introduction xx
Our results suggest that under the most conservative approach ie when the regulator
minimizes the maximum expected costs the regulatory policy will be less strict than
when he is better informed On the contrary when the regulator attempts to mini-
mize regret the safety standard might be stricter but it also increases the risk of no
compliance
Finally Chapter 5 concludes This chapter outlines the main results of this PhD thesis
and links them with the challenges that nuclear power faces today In short we claim
that the development of nuclear power in the world will depend predominantly on
how the industry is able to curb the cost escalation For this reason nuclear vendors
should direct their innovation efforts not only on achieving better safety performance
(as they have done so far) but also on reducing the construction costs Countries with
ambitious nuclear power programs should adopt a standardization strategy by reducing
the technologies to be installed but also they have to determine which will be the pace
of technological change Finally nuclear regulators should concentrate their efforts in
fostering better safety performance levels within the operators through stricter operating
standards once the reactors guarantee that they have reached an acceptable ex ante risk
level
Chapter 1
How Fukushima Dai-ichi core
meltdown changed the probability
of nuclear accidents
11 Introduction
The triple core meltdown at Fukushima Dai-ichi power plant on March 11 2011 is the
worst nuclear catastrophe after Chernobyl in 1986 The substantial losses of this accident
have aroused in the public opinion an old age debate Is nuclear power safe Critics claim
that nuclear power entails a latent threat to society and we are very likely to witness
an accident in the near future Proponents say that the conditions that provoked the
Fukushima disaster were unlikely assert that new reactors can successfully face extreme
conditions and conclude that the probability of a nuclear accident is very low
In the media this debate is far from be clear For instance two months after the
Fukushima Dai-ichi meltdown a French newspaper published an article1 saying that
the risk of a nuclear accident in Europe in the next thirty years is not unlikely but on
the contrary it is a certainty The authors claimed that in France the risk is near to
50 and more than 100 in Europe
Their striking result comes from dividing the number of reactor explosions (one in Cher-
nobyl and 3 in Fukushima Dai-ichi) over cumulated experience (14000 reactor-years)
and multiplying this ratio by the number of reactors and 30 years So if we take 58
operative reactors in France we get 049 and if we consider 143 reactors in Europe we
1 Benjamin Dessus and Bernard Laponche June 3 2011 available at httpwwwliberationfr
politiques01012341150-accident-nucleaire-une-certitude-statistique
1
Chapter 1 2
obtain 122 hence their conclusion that a nuclear accident is a certainty in the European
Union
Although their methodology is essentially flawed since the figures they found are larger
than 1 the estimated frequency of a major accident reported by nuclear industry is not
very convincing neither According to a report issued by EPRI (2008) the probabilistic
risk assessment for the US nuclear fleet estimates an average expected rate of core
meltdown of the order of 20E-5 This figure means that in average we can expect one
accident per 50000 reactor years which seems quite optimistic with respect to what has
been observed in the history of nuclear power As of today one accounts approximately
14500 operating years of nuclear reactors and 10 core meltdowns This implies an
observed frequency of 1 accident per 1450 reactor years which is a higher rate than
what is predicted by the probabilistic risk assessments (PRA hereafter)
From this debate we can conclude that assessing properly the probability of a nuclear
accident with available data is key to shed light in the risks that nuclear power will entail
on tomorrow For this reason the main objective of our paper is to discuss different
statistical approaches to estimate the expected frequency of nuclear accidents Our
results suggest that although the Poisson model is the most used for addressing this
problem it is not suitable when the independence assumption is violated In such cases
a time-varying mean model like a Poisson Exponentially Weighted Moving Average
(PEWMA) is more suitable to estimate the expected frequency of core meltdown
The remainder of this paper is structured as follows Section 12 outlines the literature
about nuclear risk assessment Section 13 investigates how to estimate the expected
frequency and compute the probability of a nuclear accident using successively a fre-
quentist and a Bayesian approach Section 14 presents the PEWMA model and its
results Section 15 concludes
12 Literature review
It is possible to distinguish two approaches to assess the probability of nuclear accidents
PRA models and statistical analysis PRA models describe how nuclear reactor systems
will respond to different initiating events that can induce a core meltdown after a se-
quence of successive failures This methodology estimates the core damage frequency
Chapter 1 3
(CDF hereafter)2 based on observed and assumed probability distributions for the dif-
ferent parameters included in the model
The use of PRA in commercial reactors is a common practice in the US because the
results are a key input for the risk-based nuclear safety regulation approach (Kadak and
Matsuo 2007) The Nuclear Regulatory Commission (NRC hereafter) has been doing
PRA studies since 1975 when the so-called WASH-1400 was carried out This first
study estimated a CDF equal to 5E-05 and suggested an upper bound of 3E-04
The lessons from Three Mile Island accident and the ensuing improvements in PRA
techniques allowed the NRC to perform a PRA for 5 units in 1990 the average CDF
found was 891E-05 In 1997 the NRC published the Individual Plant Examination
Program NUREG-1560 which contains the CDFs for all the 108 commercial nuclear
power plants in the US
The latest EPRI (2008) report about the US nuclear fleet pointed out that this met-
ric has shown a decreasing trend from 1992 to 2005 (see Figure 1) due to safety en-
hancements that have induced significant reductions in the risk of core melt down As
mentioned before it claimed that the average CDF is 20E-5
Figure 11 Core Damage Frequency Industry Average Trend (EPRI 2008)
2 PRA can be done at 3 levels The first one considers internal or external initiating events followedby a series of technical and human failures that challenge the plant operation and computes the CDFas a final outcome Level 2 evaluates how the containment structures will react after an accidentat this level the Large Early Release Frequency (LERF) is computed The last level determines thefrequencies of human fatalities and environmental contamination
Chapter 1 4
The second approach to assess the probability of nuclear accidents is statistical anal-
ysis Basically this approach combines theoretical probability functions and historical
observations to estimate the parameters of interests
Hofert and Wuthrich (2011) is the first attempt in this category The authors used
Poisson maximum likelihood (MLE) to estimate the frequency of annual losses derived
from a nuclear accident The total number of accidents is computed as a Poisson random
variable with constant arrival rate denoted by λ
The authors recognized that the λ estimates change significantly depending on the time
period taken This suggests that there are doubts about the assumption of a non-time
dependent arrival rate If the arrival rate depends on time it means that the events
are correlated somehow which in turns means that one of main assumptions underlying
this model is violated and therefore the results coming from the classic Poisson model
are no longer valid The main purpose of our paper is to fill this gap in the literature
by using a structural-time series approach This model has been developed by Harvey
and Fernandes (1989) and used in political science by Brandt and Williams (1998) but
is yet to be used to assess nuclear risks
13 How to properly estimate the expected frequency of a
nuclear accident using theoretical probability and past
observations
How to compute the probability of a serious accident is a key input to assess the risk of
nuclear power Nevertheless the use of a theoretical probability distribution to predict
an outcome like a nuclear accident requires a clear interpretation of the estimates that
we are obtaining
The results that we will present in the following sections correspond to an arrival rate of
a Poisson distribution which corresponds to the expected frequency of an accident (the
mean of the distribution) Given that we are dealing with a rare event the estimates for
this rate will tend to be close to zero and this feature make it possible to approximate
the value of the arrival rate to the probability of observing at least one accident
The usual interpretation for an arrival rate for instance equal to 5E-05 is that in
average we will observe at least one accident each 20000 reactor-years Following Aven
and Reniers (2013) we can have a better interpretation and think this arrival rate as
the equivalent uncertainty that a person will assign to drawing a specific ball from an
urn containing 20000 balls
Chapter 1 5
131 Data
Defining which events can be considered as nuclear accidents was the first step in our
study As we will explain in this section the scope of the definition of accident will
determine the number of observations to be used in the statistical models that we are
going to test
In general the criterion used to define nuclear accidents is closely linked with the amount
of radioactive material that is released outside the unit The International Atomic
Energy Agency introduced the INES scale inspired by the so-called Birds pyramid that
seek to determine the ratio between the fatal and less serious accidents As we can
see in Figure 12 this scale ranks nuclear events into 7 categories The first 3 are
labeled as incidents and only the last 4 are considered as accidents The major nuclear
accident is rated with 7 and is characterized by a large amount of radioactive material
release whereas the accidents with local consequences are rated with 4 because only
minor releases of radioactive material have occurred
Figure 12 Core Damage Frequency Industry Average Trend Source IAEA httpwww-nsiaeaorgtech-areasemergencyinesasp
This pyramid is a good representation of both the severity and frequency nuclear inci-
dentsaccidents On the top we find the major nuclear accidents that are rare events
Since the installation of the first commercial nuclear reactor in 1952 unit nowadays there
have been only 2 events classified in this category Chernobyl and Fukushima Dai-ichi
On the base we find minor incidents that are more frequent but less serious As we
Chapter 1 6
climb the pyramid we have fewer observations but each one represents a more serious
accident
The International Atomic Energy Agency has recorded every single event reported by
nuclear operators since 1991 using the INES scale3 Unfortunately not all the nuclear
incidents recorded previous to 1991 are rated with this scale only the most significant
events have been evaluated and rated accordingly Table 11 summarizes the number of
observations that we gathered in each category
Table 11 INES Events
INES 3 4 5 6 7
Observations 20 13 5 1 2
As we can see in Table 11 the low frequency of a major nuclear accident (Level 7)
makes difficult to appraise its probability However if we expand the definition of
nuclear accident more observations make the cut For instance we can consider nuclear
accidents as all the events rated with more than 3 in the INES scale Table 1 shows that
with this new definition we count 21 accidents
From the above it can be deduced that the definition of nuclear accident is an important
empirical issue because as it gets narrower (ie more serious accidents) the number of
observed events is reduced This tension implies a trade-off between estimation reliability
and the meaning of the results A broader scope will result in better estimates but they
will not give a precise insight about major nuclear accidents On the contrary if we
restrict our attention only to the most dramatic accidents we only have 2 cases which
undermine the degrees of freedom therefore the reliability of any statistical model
In order to avoid the sparseness when focusing only on major nuclear accidents we
considered 3 definitions The first definition corresponds to events rated with more than
2 in the INES scale (serious incidents + accidents) the second counts those accidents
rated with more that 3 within the same scale The third definition is core meltdowns
with or without radioactive releases this events have been recorded by Cochran (2011)
who counted 9 nuclear commercial reactors that have experienced partial core meltdown
from 1955 to 2010 including the well-known Three Mile Island accident in 1979
Given that this last definition (core melt downs) is the narrowest we can compare it
with the CDF computed in the PRA studies Another advantage of using this definition
is that the magnitude of internal consequences of a core meltdown (ie the loss of
the reactor and its clean-up costs) do not differ much between a major and less severe
3 The data is available in their webpage httpwww-newsiaeaorg
Chapter 1 7
accidents4 Therefore knowing the expected frequency of a core meltdown as we have
defined could be useful to design insurance contracts to hedge nuclear operators against
the internal losses that will face in case of any of these events
It is important to recognize that given that the broader definitions (events with INESgt
2 and gt3) contain heterogeneous events it is possible that the magnitude of internal
consequences that they had had differ substantially therefore they cannot be used to
insurance purposes Nevertheless we consider it is worthwhile to consider these two
definitions despite this shortcoming because the results can be seen as an upper bound
for the expected frequency of serious catastrophes
Figure 13 Major nuclear accidents reactors and operating experience 1955-2011
Figure 13 plots the number of core melts downs (CMD hereafter) collected by Cochran
(2011) as well as the number of installed reactors on the left panel and cumulated
nuclear operating experience (in reactor years) published in the PRIS5 database on the
right panel
At first glance we can conclude that PRA results might not be completely wrong given
that most of the accidents were recorded at the early stages of nuclear power history
It is important to highlight that during the period in which nuclear experience grew
exponentially (ie over the last 10 years) only (and fortunately) the Fukushima Dai-
ichi meltdowns have been observed This intuitively suggests that there have been safety
improvements in the operation of the worldwide nuclear power fleet
Figure 14 shows how many times we have observed in our sample nuclear accidents
using our three definitions As we can see in this Figure the most frequent value for an
4 By contrast the damages in case of radioactive elements releases in the environment could vary inseveral orders of magnitude depending on the meteorological conditions and the population densityin the areas affected by the nuclear cloud
5 The Power Reactor Information System
Chapter 1 8
Figure 14 Histogram for nuclear accidents 1952-2011
event rated with more than 2 and 3 in the INES scale as well as CMD is zero This
means that that sparseness remained even if the scope of accidents that we have taken
is broader
Figure 15 Cumulate frequency (AccidentsReactorYears) for nuclear accidents 1952-2011
132 Models
Once we had defined the scope of accident we parameterized the problem We assumed
that nuclear accidents are realizations that follow a Poisson distribution This function
computes the probability of a number of discrete events occurring in a continuous but
fixed interval of time given an arrival rate In our case the events correspond to nuclear
accidents and the interval time to one year
Chapter 1 9
Assumption 1 Let yt denote the number of nuclear accidents observed at year t
Assume that yt is a Poisson random variable with an arrival rate λ and density function
given by
f(yt|λ) =(λEt)
yt exp(minusλEt)yt
(11)
Although the time period is one year we have to offset the observations by Et that
is the exposure time within this interval It corresponded to the number of operative
reactors at year t
Under Assumption 1 the problem is fully parameterized and we only need to estimate
the arrival rate denoted by λ that in our case represents the expected frequency of a
nuclear accident to compute the probability of a nuclear accident at time t
Before we proceed further we want to reiterate the necessary conditions for a count
variable to follow Poisson distribution
i The probability of two simultaneous events is negligible
ii The probability of observing one event in a time interval is proportional to the
length of the interval
iii The probability of an event within a certain interval does not change over different
intervals
iv The probability of an event in one interval is independent of the probability of an
event in any other non-overlapping interval
In the case of nuclear accidents the first two assumptions do not seem far from reality
Even if in Fukushima Dai-ichi the core melts occurred the same day the continuous
nature of time allows us to claim that they did not happen simultaneously and it is not
unreasonable to expect that as we reduce the time interval the likelihood of an accident
goes down
On the contrary conditions (iii) and (iv) might be more disputable In this section
we assumed that the data satisfy these assumptions in the next section they will be
relaxed
The simplest procedure to estimate λ is to use the observations in the sample (ytTt=0 EtTt=0)
a and compute the maximum likelihood estimate Which simply means that λ equals
the cumulative frequency Using the three definitions of nuclear accidents we computed
the estimate for λ Table 12 summarizes the results
Chapter 1 10
Table 12 Poisson with constant arrival rate (1952-2011)
Database λ Coefficients Estimate Std Error z value Pr(gt |z|)INES gt 2 000273 -5902 0156 -378 lt2e-16 INES gt 3 000139 -6571 0218 -3012 lt2e-16
CMD 000066 -7312 0316 -2312 lt2e-16
If we compute λ using the information available up to year 2010 we can define ∆ as
the change in the estimated arrival rate to measure how Fukushima Dai-ichi affected the
rate
∆ =λ2011 minus λ2010
λ2010
(12)
Using this first model the Fukushima accident represented an increase in the arrival
rate of the CMD equal to 0079 In other words after assuming a constant world fleet
of 433 reactors on the planet from 2010 to 2011 was equal to 617E-04 in the absence
of Fukushima Dai-ichi accident By including this accident it went up to 666E-04 (ie
about a 8 increase)
However the simplicity of this model comes at a price First the estimation only took
into account the information contained in the sample (ie observed accidents) it would
been suitable to incorporate the knowledge brought by nuclear engineers and scientists
over the past 40 years on the potential causes that may result in major accidents
especially core meltdowns
Second it is assumed that all the reactors built over the past 50 years are the same and
their safety features are time invariant This basic Poisson model does not measure if
there have been safety improvements that reduce the probability of a nuclear accident
progressively as PRA studies have shown
To address the first limitation our second alternative was to consider λ as a random
variable Under this approach using Bayes law the observations were combined with a
prior distribution denoted by f0(λ) that encoded the beliefs about our parameter to
update the distribution of our parameter of interest
f(λ|yt) =f(yt|λ)f0(λ)intf(yt|θ)f0(θ)dθ
(13)
Equation 13 shows the updating procedure for a continuous random variable Note that
once we have updated f0(λ) using the available information ytTt=0 we can use mean
Chapter 1 11
of the posterior distribution f(λ|yt) in Equation 11 to compute the probability of an
accident
The choice of the prior distribution has always been the central issue in Bayesian mod-
els6 Within the possible alternatives the use of a conjugate prior has two important
advantages it has a clear-cut interpretation and it is easier to compute
Inasmuch as we have already assumed that accidents come from a Poisson distribution
we have also assumed that λ followed the conjugate distribution for this likelihood which
is a Gamma distribution with parameters (a b)
Assumption 2 The arrival rate λ is a Gamma random variable with parameters (a b)
and density function given by
f0(λ) =exp(minusbλ)λaminus1ba
Γ(a)(14)
Due to the properties of the gamma distribution it is easy to interpret the chosen
parameters The intuition is the following Prior to collecting any observations our
knowledge indicates that we can expect to observe a number of accidents in b reactor
years This gives us an expected rate equal to ab that will be the mean of the gamma
(prior) distribution The parameter that reflects how confident we are about this pre-
vious knowledge is b Given that it is closely related with the variance (V (λ) = ab2)
the greater b the more certain we are of our prior Once we collect observations yt
accidents in Et reactor years we update our prior following a simple formula
au = a+ yt (15)
bu = b+ Et (16)
Which gives a new expected rate given by aubu
PRA estimates have valuable information to construct the prior For instance the
WASH-1400 report found an upper bound CDF equal to 3E-04 it means approximately
1 accident over 3500 reactor years that can be expressed in terms of prior parameters
as (a = 1 b = 3500) Likewise the NUREG-1150 study computed a CDF equal to
891E-05 that in terms of prior parameters is (a = 1 b = 10000)
6 For an extended discussion on the priorrsquos selection see Carlin and Louis (2000) or Bernardo andSmith (1994)
Chapter 1 12
As we can see in Figure 16 using the WASH-1400 information as prior the Bayesian
model predicted both a higher expected arrival rate and a wider confidence interval
because the low value of b In this case the results were driven by the observations and
quickly converged towards the results of the previous model However by taking the
NUREG-1150 study as a source for the prior we needed a larger number of observations
to move far from the prior
Figure 16 Bayesian updating with Poisson-Gamma model
In fact by using (a = 1 b = 3500) as prior we found similar results for the CMD
The Poisson-gamma model predicted an expected arrival rate equal to λ2011 = 599E-04
and ∆ represented an increase of 709 After using the figures form the NUREG-1150
(a = 1 b = 10000) we found an expected arrival rate equal to λ2011 =43E-04 and ∆=
8 for CMD
To deal with the second limitation of the Poisson model we defined λ as a function of a
time trend With this third model is possible to test if that there has been a sustained
decrease in the expected rate of nuclear accidents over the past 10 years However note
that such an approach challenges what is stated in condition (iii) because we are allowing
that the arrival rate changes in each time interval (ie one year in our case)
Assumption 3 The systematic component (mean) λt is described by a logarithmic
link function given by
λt = exp(β0 + β1t) (17)
Chapter 1 13
Table 13 Poisson with deterministic time trend
Coefficients Estimate Std Error z value Pr(gt |z|)
INESgt2Intercept 106261 24823 4281 186e-05
time -0056 0012 -4509 652e-06
INESgt3Intercept 244902 39192 6249 414e-10
time -0126 0019 -6387 169e-10
CMDIntercept 221886 55788 3977 697e-05
time -0115 0028 -4091 429e-05
Results in Table 13 are maximum likelihood estimates for (β0 β1) Given the clarity of
these results there is every reason to believe that the expected frequency of a nuclear
accident has changed along this period As expected the estimates were negative and
significant Therefore if the effect of regulatory strictness technological improvements
and safety investments can be summarized in this variable we have found some evidence
that supports the decreasing trend for the core damage frequency that the PRA studies
have shown
In the CMD case the λ2011=320E-05 that is close to the estimated CDF of last PRA
studies After computing the Fukushima Dai-ichi effect on the arrival rate we found an
increase of =23 Unlike in the previous two models this increment is substantial7
In this last set of results we found a negative and significant time trend which in a
nutshell means arrival rate is decreasing in time Although this feature does not seem
controversial it invalidates condition iii (non time varying arrival rate) and we cannot
make use the traditional Poisson models as we have done so far We need a model in
which the parameter of interest (ie λ ) is function of time
Regarding the no correlation hypothesis (ie condition iv) at first glance one could say
that nuclear accidents fulfill this condition Three Mille Island accident is not related
with what happened in Chernobyl etc Nevertheless we have a long time series data
that in some sense reflect the evolution of nuclear power technology and knowledge It
is important to recognize that nuclear reactors have a long lifetime thus there is some
technological inertia in the world nuclear fleet but at the same time innovations have
been adopted and new reactors have been installed along the time period that we have
analyzed For this reason it is possible that our data exhibit some correlation In fact
7 The Poisson regression can also be done under a Bayesian approach nevertheless the prior isnot as easy to construct as in the previous case because in this setting the coefficients (β0 β1)are the random variables Generally it is assumed that they come form a normal distributionβ sim Nk(b0 B0) Where k = 2 (in our case) is the number of explanatory variables b0 is the vectorof prior means and B0 is the variance-covariance matrix Then to construct the prior will requirea lot of assumptions not only in the level and precision of the coefficients but also in how they arerelated Given that precisely what we want is to relax as much assumptions as possible we are notgoing to consider such a model
Chapter 1 14
as we pointed out before it is clear from Figure 13 that the early stages of nuclear
power industry are related with more accidents than the lasts years of our sample
To confirm or reject the validity of this assumption it is customary when using a time
series to check if there is a stochastic process that governs data dynamics In our case
this means to know if accidents are somehow correlated or if instead we can assume
that they are independent events (condition iv) To test this we propose to use a time
series state-space approach
Before turning to the last model it is worthwhile to understand why conditions (iii) and
(iv) are relevant As in the classical regression analysis the maximum likelihood estima-
tion assigns an equal weight to each observation because under these assumptions all of
them carry the same information However if observed events are somehow correlated
some of them bring more information about the current state than others therefore past
observations have to be discounted accordingly
14 Poisson Exponentially Weighted Average (PEWMA)
model
Autoregressive Integrated Moving Average (ARIMA hereafter) models are the usual
statistical frameworks to study time series however there are two limitations to use
them in the case of nuclear accidents First it is inappropriate for discrete variables
because ARIMA models are based on normality assumptions (thus it is incompatible
with Assumption 1) Second Harvey and Fernandes (1989) noted that when the mean
of the process tends to zero ARIMA estimates could result in negative predictions
which cannot be the case for nuclear accidents
To deal with these two limitations Harvey and Fernandes (1989) and Brandt and
Williams (1998) proposed to use a structural time series model for count data This
framework has a time-varying mean as in the ARIMA models but is based on a Poisson
or a negative binomial conditional distribution
The idea is to estimate the coefficients in the exponential link as in a Poisson regression
but each observation is weighted by a smoothing parameter this is the reason why the
model is called Poisson Exponentially Weighted Moving Average (PEWMA)
We briefly describe below the structural time series approach8 following what has been
developed by Brandt and Williams (1998) and (2000) The model is defined by three
equations measurement transition and a conjugate prior The first is the models
8 Harvey and Shepard (1993) have elaborated a complete structural time series statistical analysis
Chapter 1 15
stochastic component the second shows how the state λt changes over time and the
third is the element that allows identifying the model
We keep Assumption 1 which corresponds to the measurement equation f(yt|λt) In
this setting λt has two parts the first shows the correlation across time and the sec-
ond captures the effect of the explanatory variables realized in the same period which
corresponds to an exponential link
Assumption 3rsquo The mean λt has an unobserved component given by λlowasttminus1 and an
observed part denoted microt described by an exponential link
λt = λlowasttminus1microt (18)
At its name implies the transition equation describes the dynamics of the series It
shows how the state changes across time
Assumption 4 Following Brandt and Williams (1998) we assume that the transition
equation has a multiplicative form given by
λt = λtminus1 exp(rt)ηt (19)
Where rt is the rate of growth and ηt is a random shock that follows a Beta distribution
ηt sim Beta(ωatminus1 (1minus ω)atminus1) (110)
As in an ARIMA model we are interested in knowing for how long random shocks will
persist in the series systematic component In the PEWMA setting ω is the parameter
that captures persistence It shows how fast the mean moves across time in other
words how past observations should be discounted in future forecast Smaller values of
ω means higher persistence while values close to 1 suggest that observations are highly
independent
The procedure to compute f(λt|Ytminus1) corresponds to an extended Kalman filter9 The
computation is recursive and makes use of the advantages of the Poisson-Gamma Bayesian
model that we discussed in the previous section
The idea of the filter is the following The first step consists in deriving the distribution of
λt conditional on the information set up to tminus1 We get it by combining an unconditional
9 The derivation of this density function is described in Brandt and Williams (1998)
Chapter 1 16
prior distribution λlowasttminus1 that is assumed to be a Gamma with the transition Equation
19
Using the properties of the Gamma distribution we obtain f(λt|Ytminus1) with parameters
(at|tminus1 bt|tminus1)
λt|Ytminus1 sim Γ(at|tminus1 bt|tminus1) (111)
Whereat|tminus1 = ωatminus1
bt|tminus1 = ωbtminus1 exp(minusX primeβ minus rt)
The second step consists in updating this prior distribution using the information set Yt
and Bayes rule This procedure gives us a posterior distribution f(λt|Yt) As we have
seen in the previous section the use of the conjugate distribution results in a Gamma
posterior distribution and the parameters are updated using a simple updating formula
λt|Yt sim Γ(at bt) (112)
Whereat = at|tminus1 + yt
bt = bt|tminus1 + Et
This distribution becomes the prior distribution at t and we use again the transition
equation and so on and so forth
141 PEWMA Results
Given that we had not included covariates in the link function in the previous models
we are not going to include them in the PEWMA model to be able to compare the
results Thus the only parameter to estimate is ω We used PEST10 code developed
by Brandt and Williams (1998) The estimates for the PEWMA model for the three
definitions of nuclear accident are summarized in Table 14
An important characteristic of PEWMA is that it nests the previous models When
ω = 1 we can obtain the results from the first Poisson model if the prior is (a = 0 b = 0)
Those from the Poisson-Gamma are reached if we use the same prior parameters for
instance (a = 1 b = 3500)
10 The code is available in httpwwwutdallasedu pbrandtpestspestshtm
Chapter 1 17
Table 14 PEWMA Estimates for Prior a=1 b=3500
Parameters Std Errors Z-score
INESgt2 ˆωINESgt2 0599 0024 24666INESgt3 ˆωINESgt3 0729 0055 13134
CMD ˆωCMD 0801 0024 32850
Using this last prior we obtained the results shown in Table 14 As we can see the
estimates for ω with all the definitions are smaller than one After computing a Wald
statistic to test independence assumption and reduction to simpler Poisson models we
concluded that we do not have evidence to assume that the observations are independent
The results for this test are presented in Table 15
Table 15 Test for reduction to Poisson H0 ω = 1
Wald test p-value
INESgt2 272523 lt2e-16INESgt3 23663 1147e-06
CMD 66193 4440e-16
On the basis of these results we can conclude that the use of Poisson models based on
the independence assumption is definitely not suitable to estimate the frequency and
compute the probability of nuclear accidents
The results in Tables 14 and 15 also shown that as the definition of the accident
narrowed meaning passing from INESgt2 to INESgt3 and CMD the estimate of ω got
closer to one This suggested that it is likely to accept the independence assumption
when focusing only on major nuclear accidents because what the data reflect are the
particular conditions in which these accidents occurred On the contrary when we took
a broader set of accidents we estimated a lower ω because the data set had more
information about nuclear safety as a whole
142 Arrival rate estimates from 1952 to 2012
The predictions at each period of time t in the filter for λt vary substantially depending
on ω As we have already mentioned if all the events are independent ω rarr 1 thus they
are considered equally important in the estimation As ω gets smaller recent events
become more important than those observed in the past then the latter are discounted
Figure 17 plots the mean of f(λt|Yt) for the Poisson-Gamma and PEWMA model for
CMD Note that for the former model the changes in the arrival rate are subtler with
Chapter 1 18
each observation because the effect of a new accident is diluted over the cumulated
experience In the case of the latter model we discount past events heavily thus the
observations in the latest periods are the most important and the distant are almost
irrelevant For this reason the changes in the expected arrival rate are more drastic
Figure 17 Poisson-Gamma vs PEWMA for CMD
As we can see in Figure 17 from 1952 to 1970 the arrival rate grew quickly until it
reached a high peak This can be explained by the different accidents occurred between
1960 and 1970 and the slow growth of the worldwide nuclear fleet After 1970 several
accidents occurred but the operating experience increased substantially Between 1970
and 2010 we can observe a decreasing trend in the arrival rate even though this period
is featured with the most well known accidents of Three Mile Island and Chernobyl
The Fukushima Dai-ichi results in a huge increase in the expected frequency of an
accident The arrival rate in 2011 is again similar to the arrival rate computed in 1980
after the Three Mile Island and the Saint Laurent des Eaux core meltdown In other
terms Fukushima Dai-ichi accident has increased the nuclear risk for the near future in
the same extent it has decreased over the past 30 years owing to safety improvements
In informational terms the adding of a new observation (ie new accident) is equivalent
to the offsetting of decades of safety progress
The PEWMA model estimates an arrival rate for CMD λ2010 = 442e-05 and λ2011
=1954e-3 which implies a ∆ =4321 This huge change could appear as unrealistic In
Chapter 1 19
fact at first glance the triple meltdown seems as the result of a series of exceptional
events (ie a seism of magnitude 9 and a tsunami higher than 10 meters) However for
most observers the Fukushima Dai-ichi accident is not a black swan11 Seisms followed
by a wave higher than 10 meters have been previously documented in the area It is true
that they were not documented when the Fukushima Dai-ichi power plant was built in
1966 The problem is that this new knowledge appeared in the 80s and has then been
ignored deliberately or not by the operator It has also been ignored by the nuclear
safety agency NISA because as well-demonstrated now the Nippon agency was captured
by the nuclear operators (Gundersen 2012)
Unfortunately it is likely that several NPPs in the world have been built in hazardous
areas have not been retrofitted to take into account better information on natural
risks collected after their construction and are under-regulated by a non-independent
and poorly equipped safety agency as NISA For this reason the Fukushima Dai-ichi
accident entails general lessons regarding the underestimation of some natural hazardous
initiating factors of a core meltdown and the over confidence on the actual control exerted
by safety agency on operators
Note also that such an increase seems more aligned with a comment made after the
Fukushima Dai-ichi accident a nuclear catastrophe can even take place in a technologi-
cally advanced democracy It means that a massive release of radioactive elements from
a nuclear power plant into the environment is no longer a risk limited to a few unstable
countries where scientific knowledge and technological capabilities are still scarce The
10 times order of magnitude of the Fukushima Dai-ichi effect computed by us could
therefore be realistic and consistent
15 Conclusion
Results in Table 16 recapitulates the different numbers for the arrival rate and the
Fukushima Dai-ichi effect we obtained in running the 4 models
Table 16 Summary of results
Model λ2010 λ2011 ∆
MLE Poisson 6175e-04 666e-04 00790Bayesian Poisson-Gamma 4069e-04 439e-04 00809Poisson with time trend 9691e-06 320e-05 2303PEWMA Model 4420e-05 195e-03 43216
11 See Fukushima Dai-ichi NPS Inspection Tour (2012)
Chapter 1 20
We can conclude that when it is assumed that the observations are independent the
arrival of a new event (last nuclear catastrophe) did not increase the estimates The
Fukushima effect is close to 8 regardless of whether you use a basic Poisson model or
a Bayesian Poisson Gamma model
This result does not take any safety progress into account nor the new risks that the
last accident revealed The arrival rate is computed as if all the reactors have been the
same and identically operated from the first application of nuclear technology to energy
to this day This is a strong limitation because it is obvious that over the past 50 years
the design of reactors and their operation have improved The current worldwide fleet
has a higher proportion of safer reactors than the 1960s fleet
On top of that the Fukushima Dai-ichi accident revealed potential risks associated with
a poor feedback on natural hazards in old facilities as well as the possibility of regulatory
capture even in developed countries
By contrast the introduction of a time-trend into the Poisson model has led to a high
decrease in the 2010 arrival rate The time trend captures the effect of safety and
technological improvements in the arrival rate Being significant this variable allows
predicting a lower frequency of nuclear accidents If we use a Poisson regression we find
a tripling of the arrival rate owing to the Fukushima Dai-ichi accident Note that both
findings seem more aligned with common expertise In fact the expected frequency of
an accident by reactor-year as derived by the 2010 arrival rate is closer to PRAs studies
Nevertheless the Poisson regression is also based on the assumption of independent
observations The PEWMA model has allowed us to test the validity of this hypothesis
and we find that it is not the case This seems to be more suitable because nuclear
reactors have a long lifetime and the construction of new reactors investments in safety
equipment learning process and innovations take time to be installed and adopted by
the whole industry Of course the dependence hypothesis leads to a higher arrival rate
because it introduces some inertia in the safety performances of the fleet A new accident
reveals some risks that have some systemic dimension
With the PEWMA model the Fukushima Dai-ichi event represents a very substantial
but not unrealistic increase in the estimated rate By construction each observation in
this model does not have the same weight Past accidents are discounted more than new
accidents This captures the idea that lessons from past accidents have been learnt in
modifying operations and design and that a new accident reveals new safety gaps that
will be progressively addressed later in order to avoid a similar episode
Chapter 2
Revisiting the cost escalation
curse of nuclear power New
lessons from the French
experience
21 Introduction
In OECD countries the choice to include or not include nuclear power in the energy mix is
commonly seen as primarily a matter of public opinion The very long lifetime of nuclear
waste and the risk of large radioactive materials being released into the environment
have raised major acceptability concerns The Fukushima Dai-ichi catastrophe in March
2011 has demonstrated again how public attitude vis--vis nuclear technology may dictate
political decisions and U-turns For instance German people were so stunned by the new
accident that the Chancellor Angela Merkel immediately decided to shut down eight
operating reactors and later on to accelerate the phasing-out of the nuclear fleet Four
months before Fukushima Dai-ichi a new German law was passed to extend their life
Nuclear power was viewed then by Angela Merkel and her party as a bridge technology
before renewables and storage could cover all electricity demands
However public opinion is not the only barrier that nuclear power faces today a less
addressed but also an important issue is whether new nuclear power plants can be built
at a reasonable cost The construction cost is the major component of levelized costs
of nuclear power generation Depending on assumptions on the cost of capital and the
number of years to build the nuclear plant the construction cost represents between 60
21
Chapter 2 22
and 80 of levelized costs1 In other words whether or not nuclear power generation
is cheap enough to compete with other electricity sources is critically dependent on
construction costs
In OECD countries2 where public opinion is supportive of nuclear power policy mak-
ers investors and utilities are very concerned by construction costs In countries such
as the UK Finland France and Poland nuclear generation is viewed as needed to
achieve a low carbon energy transition The technology is also considered to contribute
towards reducing energy dependency from abroad These two drivers of nuclear energy
deployment are well illustrated by the example of the UK The UK has adopted an
ambitious CO2 emissions reduction policy in a very specific context a medium-term
shortage of capacity owing to the closure of its old nuclear and coal power plants After
several years of debate and consultation the UKs decarbonization policy includes an
increasing carbon tax reaching up to 70 per ton in 2030 and a mechanism that provides
operators over a long-time period with a fixed price for electricity therefore fluctua-
tions in electricity price on the power exchange will take place regardless The so-called
contract-for-difference ensures money to generators when the wholesale market price is
below a reference or strike price set by the government and conversely generators pay
the difference between the market price and the strike price when it is positive Both
renewable energy and nuclear energy could benefit from this mechanism The UKs
vision as elaborated in the 2008 White Paper and in the 2010 Coalition Programme is
that nuclear energy has a role to play alongside renewables to reduce greenhouse gas
emissions by 80 in 2050 and to secure energy supply By the end of the 2020s 16 GW
of new nuclear capacity are envisaged
Noticeably the Fukushima Dai-ichi accident has not changed the situation Six months
after the Japanese catastrophe a national policy statement for nuclear power generation
reiterated the need for new nuclear power plants and the benefits of early deployment
In March 2014 according to a survey commissioned by the Department of Energy and
Climate Change3 42 supported nuclear power and 20 opposed it On the 21st
October 2013 a commercial agreement was reached between the EDF Group and the
UK Government for the building of two EPR reactors at Hinkley Point C in Somerset
A strike price of pound925 per MWh over a 35-year period was agreed It is supposed to
1 See NEA (2000) and NEA (2000)2 In non-OECD countries nuclear cost-competitiveness is a less sensitive issue The adoption and
continuation of nuclear technology are mainly driven by political considerations See Goldemberg(2009)
3 The Department of Energy and Climate Change publishes the DECC Public Attitudes TrackerSurvey periodically since 2012 The figures cited here correspond to the Wave 9 document that isavailable here httpswwwgovuk
Chapter 2 23
cover the pound14 billion4 that EDF estimated as the expenses to construct the plant These
figures have generated an intense debate between those that argue that nuclear power is
not competitive and needs subsidies to survive Greenpeace (2013) and those that claim
that the strike price and the construction cost correspond to a first of a kind and that
the following reactors will be much cheaper to build5
More generally speaking concerns about the cost of nuclear new-builds have been raised
with the updating of academic cost studies in the US and the long delays and budget
overshoots observed in the construction of EPR in the EU (Leveque (2013)) In 2009
the MIT published a report updating the findings of an initial study that was done six
years before called The Future of Nuclear Power (see Parsons and Du (2003) Parsons
and Du (2009)) The increase in the construction cost was spectacular expressed in
current dollars and leaving aside interests during construction costs doubled rising
from $2000 to $4000 per kW In particular this latter figure took into account the
estimated costs of 11 projected plants in the US for which the relevant utilities had
applied to the regulatory bodies for reactor licencing Likewise in 2011 the University
of Chicago estimated that on average the construction cost of AP 1000 reactors quoted
in applications by utilities was $4210 per kW which meant an increase by a factor of
21 in constant dollars in comparison with a study carried out seven years earlier (see
Rosner and Goldberg (2011a))
New-builds in Olkiluoto in Finland and Flamanville in France have been plagued with
successive revisions of budget and completion dates The construction of the Finnish
plant started in 2005 and was supposed to last four-and-a-half years with a grid con-
nection in 2009 Commercial operation is now expected in 2016 at best Construction
costs were first estimated at e3 billion and were revised upwards in 2010 to e57 billion
and in 2013 to e85 billion Similarly the initial anticipated cost of the Flamanville
EPR reactor currently under construction by EDF increased from e33 billion in 2005
to e6 billion in 2011 EDFs most recent press release in 2012 downgraded the situation
further announcing an estimated cost of 85 billion Flamanville was expected to start
commercial operation in 2013 but due to delays is expected now to start up in 2016
Looking at costs in the past to build the two largest nuclear fleets in the world recent
concerns about nuclear cost escalation do not seem unfounded In the case of the US
(see Figure 21) if we compare the overnight cost in Koomey and Hultman (2007)
for the first and last nuclear reactors installed we can see that the costs expressed in
4 EDF Energy Press release 21 October 2013 available at httpnewsroomedfenergycomNews-ReleasesAgreement-reached-on-commercial-terms-for-the-planned-Hinkley-Point-C-nuclear-power-station-82aspx
5 Nutall W (2013) Hinkley C goes ahead but future nuclear costs must fall The Conversation 31October 2013 httptheconversationcomhinkley-c-goes-ahead-but-future-nuclear-costs-must-fall-19407
Chapter 2 24
Me(2010)MW are seven times higher for the latter than for the former It is worth
mentioning that the overnight cost includes the investments linked with site preparation
and construction but it excludes financing expenses Therefore it shows the cost of the
plant as if it had been fully built in one night
Figure 21 Overnight costs for the US Nuclear Fleet e 2010MW
The severe escalation in the construction cost of the US nuclear fleet is partially ex-
plained (see infra) as the result of the heterogeneity in the reactors that were installed
(ie different types and models) and the consequent lack of standardization that to-
gether with the multiplicity of utilities vendors and constructing firms reduced the
possibility of establishing long-term relationships and building the same reactor design
repeatedly All this resulted in an erosion of the potential benefits associated with
learning effects
Alike Grubler (2010) analyzed the investments made in France to build its fleet of 58
reactors His comparison of construction costs in FF98kW between units installed in
1974 and those constructed after 1990 shows an increase by a factor of about 35 This
finding suggests that even under better economic and institutional conditions such as
those prevailing in France (ie centralized decision making vertical integrated utility
single nuclear vendor high degree of standardization and regulatory stability) cost
escalation is inherent to nuclear power According to Grubler (2010) negative learning-
by-doing effects characterize nuclear technology while accumulating experience nuclear
construction costs per unit of capacity have been increasing instead of decreasing
Chapter 2 25
By contrast as comprehensively reviewed by Martin Junginger and Faaij (2010) his-
torical trends for other base-load technologies such as gas and coal and for other zero
carbon technologies such as onshore wind and photovoltaic systems show positive learn-
ing effects Experience curves are especially impressive for renewables Lindman and
Soderholm (2012) found that the kW from onshore wind farms decreases by more than
10 each time the installed capacity doubles Meanwhile Isoarda and Soria (2001) and
C Yu and Alsema (2011) have identified higher learning effects in the photovoltaic in-
dustry confirmed by the dramatic reductions in the underlying costs and market prices
of solar panels
On top of this we can expect the Fukushima Dai-ichi accident to have consequences in
terms of construction costs for new reactors Lessons learned from this accident may
encourage nuclear vendors to include other safety features and lead to redundancies in
new reactors and site designs safety authorities might impose stricter licencing rules
and greater public opposition to installing new nuclear power plants could induce con-
struction delays and therefore cost overruns
In the debate about nuclear plants current opinion is directed against their construction
Taking into account the above it seems that there is no escape from the cost escala-
tion curse However before giving up it is worth reviewing the French nuclear power
programme experience using new data recently released by the Cour des Comptes It
is important to mention that Grubler made his cost assessment using estimations based
on an annual EDF investment report covering 1972 to 1998 because at the time of his
publication reliable data on the costs of the French nuclear programme were not avail-
able Following a request from the Prime Minister to the national audit agency Cour
des Comptes past construction and RampD expenses related to French nuclear power were
first made known to the public in 2012 The Cour des Comptesrsquo report brought together
all data concerning current construction costs for the 58 reactors installed in France as
well as investments in other nuclear facilities
When we compared costs from this new source of information with previous cost esti-
mates we found that the escalation is less severe than argued In the light of this result
in this paper we re-examine the cost drivers for the French nuclear power programme
We consider that by revisiting the French experience it will be possible to draw useful
policy recommendations to ease cost escalation in the construction of new nuclear power
plants and therefore determine the elements that will allow nuclear power to remain
competitive
In particular we are interested in investigating the existence of scale and learning effects
as well as the relationship between safety performance and costs in order to see if it is
Chapter 2 26
possible to expect cost reductions when increasing the size of the reactor when building
the same type of reactor repeatedly and if safer reactors are more expensive
The literature regarding nuclear construction drivers is large for the US case given that
the data have been available to the public ever since the construction of the first wave
of reactors We can mention the pioneering papers of Komanoff (1981) and Zimmerman
(1982) Later Krautmann and Solow (1988) Cantor and Hewlett (1988) and McCabe
(1996) revisited the existence of economies of scale and established that the construction
of larger reactors6 increased the cost per MW installed once the increase in construction
lead time was taken into account According to Cantor and Hewlett (1988) bigger units
increase projects complexity subjecting them to managerial problems longer lead times
and stricter regulatory scrutiny Learning effects were only found to be positive and
significant when public utilities constructed the plant This striking result was later
addressed by Cantor and Hewlett (1988) and McCabe (1996) The former suggested
that the market power of experienced firms allows them to charge higher prices so the
learning effects are kept as profits whereas the latter explained this difference by the
poor incentives of cost-plus contracts7 under which nuclear power plants were procured
by external constructors
More recent studies like Cooper (2012) have observed that the number of rules and
fines issued by the Nuclear Regulatory Commission (hereafter NRC) even before Three
Mile Island accident in 1979 led to an increase in construction costs According to this
author the NRC was convinced that the risk of accident would increase dramatically
as the number and size of operating reactors grew and their locations moved closer to
population centers Therefore they sought to reduce the risk by increasing the required
safety measures
Our paper is the first to use the actual construction costs of the French nuclear fleet
As mentioned previously the cost assessment done by Grubler (2010) used estimations
As in previous literature we deal with a multicolinearity problem but in addition we
have a smaller sample therefore we propose using a principal component regression
approach to deal with both econometric limitations In addition to using the common
explanatory variables to identify the main drivers of construction costs we also included
operating performance indicators in particular those linked with safety to see if cost
escalation can be justified with better safety features
6 Except Komanoff (1981) a pioneering study that suggested a 13 cost decrease when a reactorssize is doubled nevertheless subsequent papers rejected this result
7 McCabe (1996) explains that for the second wave of nuclear reactors (the one that began in the late60s) the nuclear vendors ceased to be in charge of the construction process and in turn utilitiescontracted external firms to preform plant engineering management and construction All thesecontracts were cost-plus
Chapter 2 27
After revisiting construction costs for the French nuclear fleet we find that neither
the scale-up nor cumulative experience induced cost reductions on the contrary these
variables have positive and significant coefficients We have called this phenomenon
the big size syndrome and we have identified it as the main driver of cost escalation
in France The big size syndrome summarizes the fact that as the nuclear industry
gained experience bigger and more complex reactors were designed and installed and
this resulted in a cost increase
Although the increase in the size of the reactors was done with the expectation of
reducing the cost per MW installed with our results we cannot discard the existence of
economies of scale in the French nuclear fleet We have to recognize that by using only
French data it is not possible to disentangle the effect due to increase in the reactors
capacity caused by technological change Thus it is true that bigger reactors were more
expensive per MW installed but we have to keep in mind that we are not talking about
the same reactor design
Our second important result is that we have identified positive learning effects within
similar types of reactors This finding is good news for nuclear power deployment
given that it supports the idea of standardization as an effective strategy to reduce
cost overruns linked with uncertainty when constructing complex technologies such as
nuclear reactors and therefore offers a possible way of overcoming the cost escalation
curse This result supports the idea that to avoid the cost escalation curse building
the same type of reactor repeatedly in the same sites was one of the key features of the
French nuclear programme
The last result that we found is that reactors that perform better according to the
safety indicators that we included in the regression cost more This last result shows
that improvements in safety can also be considered as a driver of cost escalation This
result is also linked with our first one because it tells us that technological improvements
embedded in new designs either because the reactor is larger or because vendors seek
to achieve better safety performance (perhaps to fulfill regulatory requirements) have
resulted in a rise in the cost per MW installed
The rest of the paper is organized as follows Section 22 briefly describes the French
nuclear power programme and the cost data from the Cour des Comptes report then
sets out the model and estimation procedure The results of the model are presented
and discussed in Section 23 Finally our conclusion is in Section 24
Chapter 2 28
22 Data and Model
221 French construction cost escalation
The inception of nuclear power for civil use in France began in the early 1960s From
1963 to 1972 EDF installed 7 reactors with different technologies that represented ap-
proximately 2600 MW These units (Table 21) were later decommissioned according to
Roche (2004) due to their technological and economic limitations In particular safety
concerns were raised after the partial core meltdown in Saint Laurent A1 reactor in 1969
Table 21 First Generation of French Reactors
Unit Type Year of connection
Chooz A Pressurized water 1967Brennilis Heavy water reactor 1967St Laurent A1 Natural uranium gas-cooled 1969St Laurent A2 Natural uranium gas-cooled 1961Chinon A2 Graphite-Gas 1965Chinon A3 Graphite-Gas 1966Bugey 1 Graphite-Gas 1972
The early adoption of nuclear power by EDF and the oil price peak in 1973 triggered the
design of the French nuclear power program with the aim of substituting fossil energy
sources This program has been described as the opposite of the situation in the US
nuclear industry because the French nuclear fleet is less diverse and investment decisions
were made by a centralized institutional structure
In France only one technology was installed corresponding to the Pressurized Water
Reactor (hereafter PWR) From 1978 to 2002 58 reactors were built in 19 units (see
Figure 22) Today all of these reactors are in operation and provide almost 78 of
French annual electricity consumption The nuclear fleet is composed of three groups
called paliers In each palier all reactors have the same size The first palierpalier
comprises 34 reactors with a 900MW nameplate capacity the second palier includes 20
reactors with 1300 MW and the last one contains 4 reactors with 1450 MW of installed
capacity This corresponds to a total installed capacity of 62510 MW
Each palier includes different types of reactor The first palier has 3 types of reactor
CP0 CP1 and CP2 Their main difference lies in the design of the intermediary cooling
system In the second palier there are two types of reactor P4 and P4 which differ
in the layout of the structure containing fuel rods and circuitry Finally the last palier
comprises only one type of reactor called N4 This design differs from the other reactors
in terms of capacity as well as the design of its steam generators primary pumps and
command room
Chapter 2 29
Figure 22 Evolution of French Nuclear Power Fleet by palier
As mentioned before the institutional setting in which the French nuclear power pro-
gram developed was highly centralized Finon and Staropoli (2001) described it as a
close-knit network between EDF the public monopoly generator Framatome (today
AREVA) the reactor vendor and the Atomic Energy Commission (CEA) the nuclear
research and development agency This centralized decision-making setting resulted in
effective coordination of the programs investments and reduced uncertainty regarding
safety regulations The downside is that it also shielded the program from public scrutiny
and accountability
However with the decommissioning deadlines for the oldest reactors approaching public
debate about the role of nuclear power in the French energy mix calls for clear account-
ability of EDFs past present and future investments For this reason in 2011 the former
Prime Minister of France asked the national audit agency Cour de Comptes to under-
take a study of EDFs past expenditure on constructing nuclear facilities including the
58 PWR commercial reactors
This report was published at the beginning of 2012 and for the first time presented to the
public the actual construction costs of the nuclear fleet It is important to point out that
we used the construction costs and not the overnight costs because in the report the
latter were presented for the whole nuclear fleet and not for each observation However
they represent 88 of the total overnight costs The costs in the report are presented
Chapter 2 30
by pairs of units in current and 2010 constant euros8 Figure 23 compares the cost data
presented in the Cour de Comptes report with the estimated costs computed by Grubler
(2010) We can conclude that the figures for the first reactors were quite accurate but
that figures for the latest ones were overestimated In fact by taking Grublers cost
estimates expressed in e2010 kW the average annual increase is equal to 57 taking
the construction costs in the Cour de Comptes we find an average annual increase of
47
Figure 23 Grubler vs Cour de Comptes construction costs
Since the cost escalation was not as severe as argued it is worth reviewing the French nu-
clear power program experience with the actual data published in the Cour de Comptes
report in order to see if new lessons can be learnt to overcome the cost escalation curse
222 Model and data
Using a linear regression model we seek to determine the construction costs main drivers
We assume a logarithmic cost function in which the explanatory variables are capacity
input prices experience safety performance indicators and finally a random error The
regression equation that we have estimated is the following
8 The actual construction cost for the French nuclear fleet published in the Cour de Comptes arepresented in Appendix A
Chapter 2 31
Figure 24 Cour de Comptes construction cost by palier and type
ln(Ci) = β0 + β1 ln(Capi) + ln(ICHTi) + β2EXPIi + β3EXPPi
+β4EXPTi + β5UCLi + β6US7i + ui (21)
Where
bull Ci Construction cost for the pair of units i in e2010 per MW
bull Capi Installed capacity in MW
bull ICHTi Index cost of labor for the year in which the construction of reactor i
started
bull EXPIi Number of completed reactors at the time of the construction of plant i
bull EXPPi Number of completed reactors within the same palier at the time of the
construction of plant i
bull EXPTi Number of completed reactors within the same type at the time of the
construction of plant i
bull UCLi Lifetime average Unplanned Capability Loss Factor for unit i
bull US7i Lifetime average Unplanned Automatic Scram for unit i
Regarding capacity Figure 24 clearly shows that the cost escalation in France is closely
related to the progressive increase in reactor size Nevertheless it is important to men-
tion that the scale-up also entailed a technological change which means that there are
Chapter 2 32
substantial design differences between reactors belonging to each palier For this reason
we have to keep in mind that with this variable we are capturing two effects ie the
size and the technological complexity of new reactors
The second set of explanatory variables was included to test the presence of learning
effects We have defined three variables the first corresponds to overall experience
(EXPI) the second only adds the previous reactors existing within the same palier
(EXPP) and the last one includes reactors of the same type (EXPT) All of these
variables show the number of reactors previously built in each category
Apart from scale and learning effects we might also be interested in identifying whether
cost escalation is linked to safety improvements According to Cooper (2012) safety
variables (ie fines and the number of safety standards and rules adopted by the NRC)
are the most consistent predictors to explain the cost escalation in the US In previous
studies (Komanoff (1981) Zimmerman (1982) Cantor and Hewlett (1988) McCabe
(1996)) safety improvements were related to the stringency of the regulatory agency that
was represented with a time trend in all of these studies it was found to be significant
and positive
For the French case it is hard to measure regulatory activity According to Grubler
(2010) there is no regulatory documented incidence from 1970 to 1999 which is not
surprising given that the Autorite de Surete Nucleaire (independent regulatory agency)
was created in 2006 However Roche (2004) and Finon (2012) argued that EDF inte-
grated safety reinforcements into new reactors gradually and thus these improvements
should be reflected in better performance in terms of unplanned outages To test how
safety improvements are related to construction costs we included in the model two in-
dicators defined by The World Association of Nuclear Operators (WANO) and adopted
by the International Atomic Energy Agency (IAEA)
The first of these is the Unplanned Capability Loss Factor (UCLi) which reflects a
reactors ability to maintain the reliability of systems and components This indicator
belongs to the first category of the safety performance indicators used by the IAEA
which seeks to quantify how smoothly a plant operates The UCL indicator shows the
percentage of energy that a plant was not capable of supplying due to deviations from
normal operations
The second indicator is Unplanned Automatic Scram (US7i) which belongs to the
category for identifying whether a plant is operating at low risk The US7 tracks the
number of automatic shutdowns during one year (ie 7000 hours) of operation We
have chosen this measure because it gives a direct indication of the frequency of actual
Chapter 2 33
Figure 25 Labor cost index (ICHT) and Price index for France =100 in 1973
challenges to the systems that submit plant equipment to extreme thermal loads and
increase the risk of serious accidents
To count the changes in input prices we have also included an index in the regression
framework to take into account the cost of labor Although the costs are expressed in
constant currency it is important to highlight that during the period we are analyzing
(ie1978-2002) the labor cost increased more rapidly than the index prices When we
compared the evolution of the French GDP price index with the Indice du cout horaire
du travail (ICHT) developed by INSEE we found that the difference between the index
in 1973 and 2000 is 4 times in the former and 9 times in the latter (see Figure 25)
We have not included other commodity price indexes such as cement copper steel or
nickel given that on average their growth rates were similar to the GDP deflector that
was used to homogenize the cost data
In addition to the Cour de Comptes costs we gathered data from the IAEAs Power
Reactor Information System (PRIS) database We took the installed capacity in MW
for the year when the reactor was constructed the number of reactors that were built
by EDF previously to audit the experience and the average UCL and US7 lifetimes for
each pair of units Descriptive statistics of the data are presented in Table 22
223 Multicollinearity and Principal Component approach
One of the main econometric problems identified in literature on nuclear construction
cost escalation is the multicollinearity between the explanatory variables and in partic-
ular the high correlation between installed capacity and industry experience To deal
Chapter 2 34
Table 22 Descriptive statistics
Variable Unit Mean Median Minimum Maximum Std
Cost e2010MW 114 114 082 163 019Cap MW 2156 1840 1740 2945 43691ICHT Index 100= 1973 49646 50440 21810 92196 17899EXPI reactors 2741 26 1 56 1730EXPP reactors 1203 12 1 30 897EXPT reactors 510 4 1 16 416UCL 712 707 307 1195 208US7 events7000 hours critical 077 069 018 140 031
with this problem Zimmerman (1982) suggested using a monotonic transformation of
overall experience instead of the original variable In subsequent studies such as those
by Cantor and Hewlett (1988) and McCabe (1996) the issue was solved by taking the
builders experience into account instead of the overall industry experience which eased
the high correlation among these variables
For the French case the multicollinearity problem is severe There is a single builder
(EDF) so experience increases with time and also with installed capacity because
the scale-up has been progressive On top of that we observe a sustained increase
in the labor cost index As we can see in Table 23 these three variables are highly
correlated which illustrates the difficulty of obtaining significant results in a linear
regression framework
Table 23 Correlation Matrix
Ln Cap ICHT EXPI EXPP EXPT UCL US7
Ln Cap 100ICHT 074 100EXPI 086 096 100EXPP -044 018 003 100EXPT -023 004 -002 054 100UCL -002 -035 -028 -048 -050 100US7 -008 -026 -023 -029 -021 053 100
Indeed when we include all of the coefficients in a linear regression they are imprecisely
estimated (see Table 24) This problem is confirmed with the high estimates for the
Variance Inflation Factor (VIF) (see Table 25) The standard way of solving multi-
collinearity problems is to eliminate one or more explanatory variables Although we
tried different specifications none of them resulted in significant estimates and the VIF
remained high The results of these models are shown in Appendix B
Unfortunately within this framework it is not possible to figure out the main drivers
because all of the explanatory variables move in the same direction thus our data
set appears redundant By using a principal component regression we have overcome
Chapter 2 35
Table 24 Linear regression estimates
Coefficients Estimate Std Error t value Pr(gt |t|)(Intercept) -0188 12454 -0015 0988
Ln Cap -0092 1477 -0063 0951Ln ICHT 0187 0399 0470 0643
EXPI 0002 0021 0127 0900EXPP -0003 0015 -0257 0800EXPT -0008 0009 -0825 0419UCL -0018 0019 -0967 0345US7 0014 0103 0143 0888
Table 25 VIF for explanatory variables
Ln Cap Ln ICHT EXPI EXPP EXPT UCL US7
116728 32345 183909 26865 2273 2166 1482
this limitation With this method we can obtain relevant information from our data
set reducing it to a smaller dimension and revealing simplified underlying correlations
between the costs and the explanatory variables
Principal component analysis is an established multivariate technique developed by Pear-
son (1901) and Hotelling (1933) In economics this method has been applied in a wide
range of subjects for instance in macroeconomics and finance by Fifield and Sinclair
(2002) and in development by Zanella and Mixon (2000) and used to construct socio-
economic indexes by Filmer and Pritchett (2001)
The main idea of this procedure is to take the correlation matrix which we denote by
C = XprimeX (where X is the n times k matrix of centered and scaled explanatory variables)
and then compute the k times k eigenvector matrix9 V
Given that VVprime = I we can rewrite a lineal model Y = X primeβlowast as follows
Y = βlowast01 + XVVprimeβlowast (22)
Y = βlowast01 + Zα (23)
Where Z is the n times k matrix of principal components This matrix contains the same
information that X but the columns are arranged according their share in the variance
9 Recall that the eigenvectors of a square matrix A are defined as the vectors that solve AW = λWwhere λ is a real or complex number called eigenvalue They can equivalently be defined as thevectors that solve (Aminus λI)W = 0
Chapter 2 36
Each principal component is a linear combination of the explanatory variables The
characteristic vectors define the weights or loadings (matrix V) and the roots (eigenval-
ues) denoted byλ identify the most important components (the higher the eigenvalue
the higher the share in the variance)
Once this decomposition is done the next step in this framework is to eliminate the prin-
cipal components (columns of Z) associated with the smallest eigenvalues (λ) in order
to reduce the variance that is causing the multicollinearity and estimate the significant
coefficients
23 Results
Although we are interested in the coefficients between the costs and explanatory vari-
ables one of the main advantages of the principal component approach is that we can
identify underlying relationships among the explanatory variables thanks to the loadings
in each component Table 26 shows the loadings and roots for the correlation matrix
of our model
Table 26 Loadings and roots
Comp 1 Comp 2 Comp 3 Comp 4 Comp 5 Comp 6 Comp 7
Ln Cap 0441 -0398 -0008 0282 -0088 0475 -0576Ln ICHT 0552 -0086 0218 -0229 -0015 -0729 -0232
EXPI 0553 -0173 0165 -0088 -0054 0282 0738EXPP 0106 0534 0335 -0605 -0076 0390 -0256EXPT 0095 0495 0368 0643 -0433 -0081 0039UCL -0313 -0429 0188 -0262 -0781 -0035 0016US7 -0274 -0295 0800 0103 0429 0028 -0009
λ 81643 66622 21171 14004 9840 2624 0093
This decomposition can be interpreted as follows The components are ordered according
to their importance which is represented in terms of variance percentage (ie the roots
λ) As each component is a linear combination of the explanatory variables those with
the highest loadings show us what each component represents
For instance in our case the first component explains 41 of the total variance in which
the variables with high loadings are wages capacity and cumulative experience This
component represents what we could call the the large size syndrome or as Cooper (2010)
termed it the Bupp-Derian-Komanoff-Taylor hypothesis This hypothesis stated that
as the nuclear power industry (vendors and utilities) gained experience they were able
to identify how to improve reactors performance and ultimately design more complex
and bigger units
Chapter 2 37
The second most important component accounts for 33 of the variance The variables
with high loadings are experience within palier and type and the two safety perfor-
mance indicators Given that these loadings have opposite signs we can think of this
component as a safety feedback This second component shows that constructing sim-
ilar reactors (either in size or type) resulted in better performance in terms of safety
indicators in the most recent units of each series in particular the reliability indicator
(UCL)
Going in the same direction Roche (2004) claimed that even when equipment inside
plants of the same series was identical and laid out in the same manner the experi-
ence gained by EDFs engineering division at series level resulted in specific and minor
modifications in order to improve reliability and safety
Even though this component decomposition gave us some insights on the French nuclear
power program we had to select the number of components to be included in the linear
regression estimation After selecting the optimal number of principal components
we were able to see how the explanatory variables were related to the variable we are
interested in ie construction costs Among the possible criteria to determine the
optimal number of components we took the root mean squared error of prediction
(RMSEP) criterion Using the leave-one-out cross-validation method we found that
using the first two components minimizes the RMSEP
Once the optimal number of principal components had been selected we computed the
coefficients for the original linear regression In Table 27 we present the estimates for our
set of explanatory variables Given that we had to standardize our explanatory variables
we differentiated the coefficients that we obtained from the centered and scaled matrix
with (βlowast) from those that we obtained for the original data denoted by β in Table 27
Table 27 Principal Component Regression Results
Coefficients βlowast β se(β) t-value
LnCap 0222 1131 0106 9489Ln ICHT 0212 0553 0536 10089EXPI 0226 0226 0020 9996EXPP -0048 -0048 0011 -3581EXPT -0046 -0046 0009 -3074UCL -0042 -0042 0022 -2677US7 -0050 -0050 0016 -3544
In the light of these results we confirm that as in the US case the scaling-up of the
French nuclear program did not translate into cost reductions The regression coefficient
for capacity in Table 27 shows that an increase in this variable will induce higher
construction costs per MW
Chapter 2 38
However as we have mentioned in the previous section we cannot overlook pure economies
of scale given that this variable captures the size from the complexity effect The lack of
or at least weak economies of scale in nuclear power plant construction is a well-known
phenomenon It has been identified that constructing larger reactors means an increase
in technological complexity and construction lead-times that requires better managerial
coordination and induces closer and stricter regulatory standards which in turn increase
the construction costs To sum up we can conclude that the greater the size of the unit
the higher the risk of cost overruns (Cooper (2010))
Regarding overall learning effects we also found that cumulated experience did not
induce a reduction in costs This result is often seen as a consequence of the intrinsic
characteristics of a complex technology such as nuclear power In particular we can
argue that given that an important part of the design of a nuclear power plant depends
on the characteristics of each site (Cooper (2010) Grubler (2010)) it is likely that the
experience gained in the construction of any reactor in a given location would not be
directly applicable to other projects and that this prevents achieving lower costs
These first two results can be summarized in the large size syndrome component As
mentioned before it has been observed in the nuclear industry that the experience gained
by vendors and operators translates into adjustments and improvements with the effect
that new reactors are bigger more complex and more expensive than their predecessors
In the French case Grubler (2010) and Finon (2012) argued that the potential learning
effects from the overall industry experience were not fully exploited precisely because
when EDF and Framatome gained experience the decision was taken to construct an
entirely new French nuclear reactor (ie Pprime4 series)
Nevertheless when we take into account experience within the same palier and type
we find a positive learning effect In Table 27 we can see that the estimates for these
variables are negative however their effect was less significant than that of the other
variables This result means that some cost reductions were achieved due to the stan-
dardization strategy adopted in the French nuclear power program
The intuition behind learning effects within the same type of reactor is straightforward
but less clear at palier level precisely because the reactors within them are not exactly
the same A possible justification is that each palier also represents a phase of the French
nuclear program Hence reactors within the same palier were designed and built in the
same time window and most of them were also built on the same sites which suggests
that suppliers workers engineers and locations did not change substantially during the
construction of one palier but that they did change between them
Chapter 2 39
To our knowledge this is the first time in economic literature that public data has
be used to justify the gains EDF claimed it obtained thanks to the standardization
strategy For instance Roche (2004)pointed out that the construction of the same series
of reactors made it possible to reduce the number of hours of skilled labor per unit and
obtain better prices for components In the light of our results we can conclude that
indeed these gains helped to reduce construction costs after the first unit of the series
was built
This result is also linked to another characteristic of the French nuclear program ie
multi-site construction involving several reactors of the same type built at one location
This strategy is another factor in easing cost escalation and citetRoche argued that a
discrepancy in location conditions translates into a gap in costs when constructing the
same type of reactor at different sites however these projects do not require a completely
new design or new components and thus the costs are avoided
Another important result shown in Table 27 is that reactors with better safety indica-
tors and so lower UCL and US7 values are related to higher costs Therefore we have
some evidence that the latest reactors although more expensive have also embodied
safety improvements that have helped to reduce the number of unplanned outages that
might induce an accident
These two last results are summarized in the second component which we call safety
feedback Here we have two counteracting effects on the one hand we determined
that constructing the same type of reactors induces cost savings which reflects positive
learning effects and on the other hand we observed that the newer reactors register
better safety indicators but that this improvement means an increase in construction
costs
This result shows the implicit trade-off between standardization and technological change
that is key to understanding the economics of nuclear power Even if it is true that
standardization reduces uncertainty and could lead to lower costs as we found for the
case of the French nuclear fleet it is also true that when new technologies are available
there is no reason to keep using older and less efficient technology especially when new
designs improve safety
In summary this result indicates that building similar reactors reduces the technological
uncertainty linked with adopting a new design and at the same time as Roche (2004)
has pointed out improves understanding of how minor modifications can be made to
improve reactors safety performance For this reason standardization can been seen as
one of the potential sources of savings for future nuclear reactors and also a way to
achieve better safety performance
Chapter 2 40
24 Conclusion and Policy Implications
In this paper we sought to use the current construction costs recently published in the
Cour de Comptes report in order to identify the main drivers of the cost escalation of
nuclear power construction in France to re-address the existence of learning effects and
to test whether the cost increase is related to safety improvements
It was originally believed that cost escalation was a factor of about 35 when comparing
the unit costs of units built in 1974 with those completed after 1990 (Grubler (2010))
Using the new data we found that the escalation was a factor of about 15 from the first
unit to the most recent and that the escalation was thus less severe and by no means
comparable with the US case For this reason it is important to review the actual
construction costs of the French nuclear power programme to identify the elements
that should be taken into account to overcome or at least mitigate the cost escalation
phenomenon
This analysis is particularly important for those countries that are interested in em-
barking upon nuclear power programmes Within the European context nuclear power
can play an important role in energy transition to a decarbonized electricity supply It
is important to recall that despite the German nuclear phase out there are other EU
members states like the United Kingdom for instance that see in nuclear an alternative
to meet their CO2 targets while securing their energy supply
On the basis of our analysis using the Cour des Comptes data there is every reason
to believe that construction cost escalation is mainly due to a scaling-up strategy The
increase in the reactors size involved a technological change that induced the construction
of more complex units meaning longer lead times to build them and ultimately an
increase in costs per MW As mentioned before it is not possible to rule out the presence
of economies of scale precisely because bigger reactors are more complex The recent
experience in the construction of the first of a kind EPR reactors has confirmed that
larger reactors are likely to be more expensive
For this reason capacity could be one of the first features that nuclear vendors should
rethink in the long run In this direction several authors such as Rosner and Goldberg
(2011b) and Kessides (2012) have outlined the advantages of installing small modular
reactors10 They argue that these reactors have shorter construction schedules and lower
market risks which reduces capital costs In addition they consider that other cost
savings can be achieved through off-site module fabrication as well as from learning by
doing in the production of multiple modules Moreover investments could be recovered
10 Small Modular Reactors are nuclear power plants with 300MWe or less capacity
Chapter 2 41
quicker because construction lead times are likely to be shorter than for bigger units
(Rothwell and Ganda (2014))
Nowadays small modular nuclear reactors are still in an early stage of development
None of the existing concepts have been tested licensed or constructed However in
the US the Department of Energy has conceived a small modular reactor technical
support programme to accelerate the design certification and licensing of small modular
reactors with different vendors and it is expected to have its first regulatory approval by
2018 If these reactors become affordable and meet all safety standards they may be an
interesting alternative
Regarding our results on learning effects we found that overall experience did not trans-
late into lower costs but that positive learning effects were achieved through construct-
ing the same types of reactor Given the nature of this result it would appear that the
French nuclear power programmes standardization and multi-unit location strategy has
been successful because it has helped to overcome delays and uncertainties during the
construction process and thus has reduced the costs of subsequent reactors in the same
series
This lesson is particularly important for those countries that are interested in installing
a high number of new nuclear power plants Unlike other technologies the construction
of a nuclear power plant depends largely on on-site characteristics and therefore one
way of overcoming the cost escalation curse could be to reduce technological variety and
construct multi-unit sites Such a strategy could reduce the uncertainty that comes with
adopting a new technology as well as any design modifications required when reactors
are built in other locations
According to our result we can argue that it is likely to expect that the cost for the
EPR reactors that would be built after Hinkley Point C11 will be lower thanks to
learning effects Thus the guaranteed price to construct and operate these reactors
should be smaller However nuclear deployment in England takes into consideration
the construction of different type of reactors at other sites Therefore our results also
suggest that the experience gained in this project will not be directly transferable into
cost reductions for other projects in other locations given that the types of reactor that
are planned to be constructed are not the same
The results in terms of safety indicators show that reducing the risk of a serious acci-
dent has also played its role in French cost escalation as found by Cooper (2010) for
the US case Our estimates suggest that designing new nuclear reactors necessarily
includes safety improvements (reflected in better safety indicators) In consequence
11 EDF Energy is also proposing to build two EPR reactors at Sizewell C in Suffolk
Chapter 2 42
when safety concerns are partly internalized in the construction costs safer reactors are
inherently more expensive For this reason the economics of safety may constitute the
most challenging issue for the future of nuclear power On the one hand the terrible
consequences of a nuclear disaster as seen after the Fukushima Dai-ichi accident leave
no room for laxity On the other hand the particular nature of serious nuclear accidents
ie huge damage but very low and uncertain probability of occurrence makes it difficult
to determine whether safety investments are cost-effective
Once again the French case teaches us an important lesson An analysis of principal
components shows that the most recent units in the same series perform better in terms
of the safety indicators used in the model Thus standardization not only generates
learning effects in the construction process but can also play a role in terms of achieving
better safety levels
In conclusion an analysis of the current construction costs of the French nuclear power
programme provides important lessons for countries interested in building new nuclear
power plants on how to ease cost escalation This is an important issue given that the
continual rise in the construction of the latest generation of reactors puts into ques-
tion the competitiveness of this technology with respect to alternative sources of energy
Taking into account our results a good strategy would be to reduce the variety or types
of reactor to be installed in order to obtain positive learning effects not only regard-
ing construction costs but also regarding operations in particular safety performance
Another consideration is that new technologies such as small modular reactors might
be an interesting alternative to reduce capital costs given the smaller scale of units but
also the possibility of off-site module manufacture might reduce the risk of delays and
associated cost overruns
Chapter 3
Nuclear reactorsrsquo construction
costs The role of lead-time
standardization and technological
progress
31 Introduction
311 Toward a nuclear renaissance
By August 2014 the World Nuclear Association (WNA) lists 72 reactors under con-
struction in 14 countries1 This level of new builds represents a record for the nuclear
industry since 1987 Countries and investors interested in nuclear power have their eyes
on the outcome of these projectsas their successes could represent a green light for fur-
ther deployment of nuclear power while failures might led to a stagnation of new builds
and a decline of nuclear power share in the worldrsquos energy production
Even though the current status of new builds can be seen as a first step towards the
so-called nuclear renaissance there is a long way to go in order to see the industry
revival envisioned when this term emerged in the late 1990s At the same time most
of the drivers that could favor a nuclear expansion are still valid today increasing
energy demands in particular from developing countries the need to reduce fossil fuel
dependence and the increased awareness of the dangers and possible effects of climate
1 See the list httpworld-nuclearorgNuclearDatabaserdresultsaspxid=
27569ampExampleId=62
43
Chapter 3 44
change Despite this positive environment it is yet to be seen if a rapid expansion of
nuclear power capacity is possible and - more important - if it is economically profitable
If we take a closer look to the list of nuclear reactors under construction there are
reasons why one should be cautious when arguing that these projects could spur a rapid
expansion of nuclear power or even that they will come to term As pointed out in
the World Nuclear Industry Status Report (2014) 8 of these reactors have been under
construction for more than 20 years 1 for 12 years and 49 have already faced significant
construction delays
Unfortunately this is not a new situation for the nuclear industry as the construction of
new reactors has been characterized in the past with lengthy lead-times in particular in
western countries For instance Schneider and Froggatt (2014) noticed that the average
construction time of the last 37 units that started since 2004 is 10 years This is twice
what is usually expected by nuclear vendors It is also substantially longer than the 3
years period to build a combined cycle gas plant and the 6 years period to build a coal
plant
In addition to the concerns about unexpected construction delays the second and prob-
ably most important challenge for nuclear power expansion is the economic profitability
of building those reactors Given that upfront investment costs are the main driver2
of nuclear electricity generating costs any unexpected and significant increase of the
expenses during the construction can significantly undermine the profitability of the
project When the construction costs of a new nuclear power plant increase substan-
tially it can even be more attractive to abandon the project and for outsider investors
to consider other energy sources
These concerns regarding Generation III+ nuclear reactors competitiveness have initially
emerged in the United States (US) due to the escalation in the construction costs
expectations for new reactors The revised estimates took into account the changes
made by utilities in the application forms filled to the Nuclear Regulatory Commission
In 2003 the cost expectation was US$2000 (see Base case in Parsons and Du (2003))and
this figure progressively increased to US$4000 per installed kilowatt (see Parsons and
Du (2009) and Rosner and Goldberg (2011a))
Similarly the recent experience in the construction of the first of a kind EPR3 in Europe
has also contributed to revising expected costs of building new nuclear power plants in
OECD economies Despite that Finland and France have successfully built nuclear
reactors in the past this did not prevent that both to face significant cost overruns In
2 According to the IEA (2010) the share of the capital costs in the leveled cost of electricity in nuclearpower is between 60 to 80
3 European Pressurized Reactor
Chapter 3 45
France the construction of Flamanville 3 unit is almost 3 times more expensive than
initially expected (e3 billion in 2009 versus e85 billion in 2012) Not to mention that
the plant should not be operational until 2016 which represents nearly a 100 increase
in lead-time from 5 to 9 years
The cost over-runs experienced in the past and the multiple upward cost revisions and
delays in construction over the last decade represent important barriers for nuclear ex-
pansion as they limit the countries where new reactors can be installed These concerns
mean that nuclear new builds are risky projects first because there is no early yield
due to the lengthy lead-times and second because the yield is uncertain in the long
term due to possible cost escalations during the construction These issues are heavily
penalized by the financial markets and further restrict the amount of capital to invest
in the sector
Consequently more than 60 of the new build is located in countries where instead of
the financial markets (private investors) the government plays a central role as investor
in the power sector through state electric companies This is the case in China where
the three national nuclear utilities are largely or entirely state-owned In Russia the 6
reactors that are under construction are designed and owned by the state-owned Rosen-
ergoatom Corporation Finally iIn South Korea the 5 new builds care also designed and
owned by the state-owned Korea Electric Power Corporation (KEPCO)
Few of the new entrant countries that have raised their interest in nuclear power over
the last decade have started the construction of their first reactor Most of them have
postponed construction probably due to difficulties to finance these projects This
has been the case of Vietnam Poland and Turkey In addition even for countries with
lower financial constraints upfront investment costs have been the key driver to select
reactor design For instance according to Schneider and Froggatt (2014) the United
Arab Emirates chose a Korean design over Francersquos EPR because it offered the highest
capacity factors lowest construction costs and shortest construction lead-times
Taking into account the above we can argue that the expansion of nuclear power today
depends on how the industry identify the key elements that will curb investment cost
escalation and allow it to meet construction schedules
312 Existing literature on nuclear power plants construction costs
and lead-times
The economic literature on construction costs and lead-times of nuclear power plants
has so far failed to provide clear empirical evidence of their determinants partly due
Chapter 3 46
to a lack of comparable and reliable data Most of the existing econometric studies
have focused on US construction costs and attribute the escalation in costs to a lack of
standardization an increase in complexity of new reactors and safety related regulatory
interventions after Three Mile Island accident
A number of authors argue that the experience gained by nuclear vendors led to the
design of bigger and more complex reactors that took longer to build and required closer
regulatory oversight (Komanoff (1981) Zimmerman (1982) Rothwell (1986) Cantor and
Hewlett (1988) and Cooper (2012)) It is also generally accepted that the heterogeneity
in the US nuclear fleet and the multiplicity of vendors and utilities failed to achieve
learning by doing gains David and Rothwell (1996) argue that the lack of standard-
ization in the nuclear US fleet entailed ballooning of construction costs whereas some
positive learning effects are found by Cantor and Hewlett (1988) and McCabe (1996)
for construction projects managed directly by utilities
In the case of the French nuclear program (second largest nuclear fleet after the US)
the data on construction costs were only published in 2012 (Cour des Comptes (2012))
Beforehand the cost data used by Grubler (2010) was based on extrapolations of annual
investment expenditures of the nuclear utility EDF and rejected the existence of learning
by doing Conversely using the actual construction costs Escobar-Rangel and Leveque
(2012) find evidence of cost reductions due to learning effects within specific reactor
models
In this paper we propose the first empirical investigation of the role of lead-times
standardization and learning opportunities on nuclear reactorsrsquo construction costs us-
ing historical cost data from both the US and France This choice is motivated by
the fact that these two countries have followed different paths in terms of industrial
structure and technological diversity For instance while in the US several firms have
acted as Architect-Engineer (A-E) and vendors of nuclear reactors these roles have
been the responsibility of the utility EDF and Areva (formerly Framatome) in France
respectively Similarly if the two countries have both built Pressurized Water Reactors
(PWR) France has implemented fewer technological variations compared to the US
This means that by looking at French and US experience together one can benefit from
more heterogeneity in the data in order to test more research hypotheses and derive
robust estimates
Chapter 3 47
313 The contributions of this paper to the economic literature and
the nuclear energy policy debate
Our model is close to the one proposed first by Rothwell (1986) and then Cantor and
Hewlett (1988) In particular to the latter where a two-stage least squares equation
model is estimated for construction costs and lead-time using US data However our
analysis tackles a number of other empirical shortcomings First our study allows a
direct comparison of nuclear reactorsrsquo overnight construction costs in the two countries
using the access to data4 on engineering and other related expenditures for French
reactors which are not detailed in the Cour des Comptes (2012) report
Unlike other papers we distinguish the potential benefits of standardization that might
arise in the short term from those that can appear in the long term In the short term
we argue that a reduced diversity of designs under construction in a particular year
can affect the costs and the lead-time of an ongoing project due to coordination gains
(for instance scale effects in the componentrsquos supply chain or for the safety assessment
by the regulatory agency) We also consider that standardization may allow long term
benefits through learning by doing spillovers gained from past experience in building
similar units In order to capture these spillover effects we differentiate the previous
experience based on reactor models and A-E firms
At the same time we study the possible effects of learning by searching (ie innovation)
on construction costs given the importance of public RampD expenditures on nuclear
power Evidence of a positive learning by searching effect has only been found using
cost and innovation data from energy economics modelling tools (Jamasb 2006) In
that respect to the best of our knowledge there is no existing literature that has looked
at the effect of innovation using actual cost data Hence our study is the first to bring
together data on nuclear power overnight construction costs and knowledge capabilities
data the latter measured as a stock of knowledge based on patent data
Our results suggest that standardization of nuclear power programs is one of the main
factors in limiting costs escalation In the short term a low diversity of reactors under
construction leads to coordination gains that reduces costs indirectly through a reduction
in lead-time More importantly this result is also confirmed by using data of lead-
times of other OECD countries with different market structure and technological paths
notably Asian countries (ie Japan and South Korea) that have achieved to maintain
relatively constant their construction lead-times
4 These data on overnight construction costs have been made available to the authors by EDF Assuch they differ slightly from the data available in the Cour des Comptesrsquo report where expenditureregarding engineering work pre-operating expenses etc are presented at an aggregated level
Chapter 3 48
We find that standardization allows learning effects We have denominated this spillovers
as the long term benefits of standardization considering that the cost reductions will
only appear if the same nuclear model is built by the same A-E firm repeatedly This
highlights the importance of reactor design standardization and the role played by the
A-E firm in reducing construction costs increases
We further show that contrary to other energy technologies (Erickson and Drennen
2006) there is a negative effect of learning by searching on reactorsrsquo overnight construc-
tion costs This means that the variable that captures innovation and knowledge is one
of the main drivers of the cost escalation registered in the US and France This result
opens the door for further research on the areas in which innovation in nuclear power
technologies has focused In the literature (Berthelemy 2012a) has found that innova-
tion is closely linked better safety performance which in some sense allow us to think
that innovation has been partly driven by nuclear safety considerations
These results suggest paths for future cost reductions through greater standardization
of reactor technologies and more emphasis on the role of A-E firms in improving the
competitiveness of nuclear power In parallel from a policy perspective one may argue
that lead-time will play a more important role under a liberalized electricity market
where higher discount rates may apply meaning that the competitiveness of nuclear
power will be more conditional on the standardization of nuclear programs For this
reason we have explore further the trends of the construction lead-times in other OECD
countries
The rest of the paper is organized as follows in Section 32 we present the model
and main hypotheses regarding learning effects and the data Section 33 describes
our empirical strategy and the results Section 34 further investigates international
experiences with nuclear power construction using a larger dataset on nuclear power
lead-time and finally we conclude in Section 35
32 Model main hypothesis about learning opportunities
and data
321 Model for construction costs and lead-times in nuclear power
In the process to construct a nuclear power plant many firms are involved First an
electricity generation firm (hereafter the utility) places an order for the construction of
a nuclear reactor and selects a specific design offered by a nuclear vendor Once the
design is chosen the construction is managed by an Architect-Engineer (A-E) firm who
Chapter 3 49
is in charge of supervising and coordinating the constructor the nuclear steam supply
system manufacturer the turbine manufacturer as well as a number of subcontractors
The allocation of firmsrsquo responsibilities may differ between projects for instance it
is possible that the utility decides to act as the A-E (as it is the case in France and
sometimes in the US)
Rothwell (1986) proposed a structural model to represent the involvement of multiple
firms in the construction of a nuclear power plant In his model the utility seeks to
maximize the net present value of the project by selecting an optimal construction lead-
time given the technical characteristics that were chosen in the tender (ie capacity
reactor design etc) The A-E firm will minimize costs given the the optimal lead-time
selected by the utility
In this paper we retake some of the elements in Rothwell (1986) but instead of a
structural model we opt for a reduced form model closer to Cantor and Hewlett (1988)
We propose an two least squares estimation (2sls) for the construction costs and the lead-
times taking into account that there might be some unobserved variables that affect the
simultaneously both variables For instance we can think that there are additional costs
associated with longer construction periods like rental of idle specialized equipment and
labour force or unexpected costs (and delays) due to defective components Cantor and
Hewlett (1988) also pointed out that longer lead-times increase the risk of regulatory
intervention which might lead to construction changes and therefore cost increases
Given that OLS estimators will be biased we will use the expected electricity demand
(EDemi) as an instrument for lead-time as in Cantor and Hewlett (1988) They con-
sidered this variable as a valid instrument inspired in the structural model in Rothwell
(1986) First because the lead-time is chosen based on the expected demand and second
because it does not influence current construction costs Our baseline model specifi-
cation follows Equations (31) and (32) where Xi is a vector of independent variables
which can impact both cost (CTi) and lead-time (LTi) and will be further presented in
the next sub-section
CTi = α0 + α1LTi +
Jsumj=2
αjXij + υi (31)
LTi = β0 + β1EDemi +
Jsumj=2
βjXij + εi (32)
Chapter 3 50
3211 Hypotheses on the role reactorrsquos design standardization
As aforementioned we are interest in investigating the role of standardization in con-
struction costs and lead-times In our set of explanatory variables we are going to
test two potential efficiency gains may be expected from the standardization of nuclear
programs The first one aims to capture the benefits (in terms of cost reductions) that
might arise in a short time period while the others will test the presence of learning by
doing that can be seen as a long term effect
Our first hypothesis is that standardization benefits can arise in the short term from a
low diversity of nuclear reactors under-construction We expect that when a reactorrsquos
design is being built in the same country in the same year the project might benefit
from coordination gains during the construction period This can be motivated by the
fact that similar high-tech components will be built during a short time window such as
steam generators or turbines leading to economies of scale Similarly a low diversity in
reactors under-construction also lowers technological uncertainty and therefore it reduces
the number unexpected events that might delay the construction
To measure this potential benefit of standardization during the construction period we
compute a Herfindahl Hirschman Index (HHI) index based on the number of specific
reactor models under-construction when the construction of reactor starts This index
is defined according to Equation (33) as the sum of the squares of the market shares
of the M reactor models under-construction in country c and year t To capture this
expected benefit of standardization we also control for the number of reactors under-
construction (NPPUCi) as for instance a high HHI could either correspond to a
situation where only one reactor is under-construction or to a situation where multiple
and similar reactors are being built
HHIct =
Msumm=1
s2mtc (33)
3212 Hypotheses on learning by doing
Regarding the potential benefits of standardization in the long term David and Rothwell
(1996) recognized that there is a trade-off between the ability to learn from diversity
in nuclear reactors versus learning from similar models Nowadays this trade-off is
important given that in some countries like China the current strategy is more directed
to favor the construction the same type of reactor repeatedly rather than to diversify
the nuclear fleet While in others like the case of UK it is envisioned to construct
different models in different sites
Chapter 3 51
Because nuclear reactors are complex units the ability to derive learning effects may
be conditional to the similarities between reactors models and the A-E which builds
reactors In that respect we hypothesize that learning by doing can take place through
two main channels nuclear reactors completed by the same A-E firm (ExpArqi) and
nuclear reactors of the same design completed (ExpMoi)
Furthermore the benefits of learning by doing might also be conditional on the A-E firm
experience with specific nuclear design (ExpArqMoi) This variable corresponds to the
second potential benefit of standardization that we wanted to test This more restricted
level of learning by doing opportunities corresponds to the traditional definition used in
the economic literature (Irwin and Klenow 1994)
It is important to mention that in the previous literature the learning by doing was
measured using either the cumulated experience at the country or firm level In this
paper we are going to decompose the country level experience (ExpCi) into four level
of learning effects (i) The experience of the A-E with the reactor model (ExpArqMoi)
(ii) the experience of the A-E with other models (ExpArqNoMoi) (iii) the experience
of other A-Es with the same model (ExpNoArqMoi) and (iv) the experience of other
A-Es with other models (ExpNoArqNoMoi)
ExpCi = ExpArqMoi +ExpArqNoMoi +ExpNoArqMoi +ExpNoArqNoMoi (34)
3213 Hypotheses on leaning by searching
One standard hypothesis made in the energy economics literature is that learning by
doing might not be the only source of cost reductions In particular learning by searching
is often found in many empirical studies dealing with the energy sector like Larsen
and Sundqvist (2005) and Erickson and Drennen (2006) as a variable that contributes
significantly to cut back costs In the case of nuclear power the impact of innovation
activity on cost remains an empirical question
According to Jamasb (2006) innovation activity may contribute to cost reduction how-
ever it can also be argued that innovation in nuclear power essentially deals with safety
improvements because of the role of safety regulation As such innovation might lead
to safer but more complex and more expensive nuclear reactors
As a proxy for nuclear innovation we rely on a unique dataset on nuclear specific patents
using a discounted stock of priority patent applications We use the patent class Y02E30
which covers technologies specific to nuclear fission reactor technologies The discounted
Chapter 3 52
stock is set at the country level reflecting the fact that innovation can come both from
RampD laboratories and nuclear vendors and can be understood to reflect national knowl-
edge capabilities We set the discount factor δ at 10 a conservative parameter found
in many studies on the dynamics of innovation (Peri 2005) This variable is denoted
Knowit and is defined according to Equation (35) where for each nuclear reactor we
use the discounted stock of patented innovations in country i when construction starts
at time t
Knowit =infinsumk=1
(1minus δ)k Patentitminusk (35)
322 Data
In our model we have taken the overnight construction costs expressed in 2010 e per
MWe as our variable of interest These costs comprise the engineering procurement
and construction expenses but they exclude those related with financing or any cost
escalation due to changes in the interests during construction In short this cost repre-
sents the lump sum up front that would have to be given if the project was completed
rdquoovernightrdquo
We have used the overnight costs instead of the actual construction cost for two main
reasons First because the financing expenses of each project will depend not only on
the lead-time but on the rate of interest on debt the debt-equity ratio and if it is
regulated how the capital costs are recovered By excluding these costs we get of rid
of the variance linked with differences on the financial structure of each utility and the
possible subsidies (that is very likely in the case of the French nuclear fleet) and we are
able compare all the projects with an uniform measure Second because we can focus
our attention on the potential effect of the observed lead-times in the engineering and
construction cost escalation if we have used the actual costs it would not have been
possible to isolate this effect
The cost data for the French nuclear fleet were collected from the French Audit Agency
Cour des Comptes (2012) report This sample only has 29 observations because the
costs on the report were presented by pair of reactors Regarding the US construction
costs we have included the cost data for 99 reactors (92 in operation and 7 shutdown)
published in Koomey and Hultman (2007) Unfortunately the capital costs for the 12
remaining operational reactors are not available
Figure 31 below highlights the strong differences between the trend in overnight con-
struction costs in US and France In particular we observe that over the entire time
Chapter 3 53
period the costs have more than doubled in France from 920eMWe in 1980 for the
Tricastin 3 and 4 reactors up to 2200eMWe in 2000 for the Chooz 1 and 2 reactors
In the US this increase has been much more rapid with the cost almost increasing by
a factor of 14 from 600eMWe in 1972 for Turkey Point 3 up to 8500eMWe in 1989
for the Shoreham reactor
One can also note that costs have been much more dispersed in the US For instance
if we look at nuclear reactors completed in 1986 in the US the costs range from
2000eMWe for Catawba 2 and 6250eMWe for the Hope Creek reactor Since France
and the US have experienced important differences in terms of industrial structure
choices during this period with more vertical integration and standardization of nuclear
reactor designs for France this figure provides an initial suggestion that the French
experience has been more successful in containing the escalation of construction costs
Figure 31 Nuclear reactorsrsquo overnight construction costs in the US and France
Following Rothwell (1986) we define the lead-time variable as the difference (in years)
between the commercial operation date and the construction start date This informa-
tion was taken from the IAEA Power Reactor Information System (PRIS) database
From this same database we have collected other reactor details as the net capacity
Chapter 3 54
(size of the reactor) in MWe information on nuclear reactor cooling systems and con-
tainment structures5 in order to define different reactor models In Figure 32 we plot
the construction lead-times of nuclear reactors in the two countries One can generally
notice that we observe the same trend as in the previous figure presenting construction
costs construction time has increased more rapidly in the US than in France This
Figure suggest that it might be possible that long construction time will generate other
expenses in addition to the financing costs owing to immobilized equipment and labour
force This may also reflect complexity of nuclear design leading both to more expensive
reactors and longer construction times
Figure 32 Nuclear reactorsrsquoconstruction lead-time in the US and France
The increase in lead-time still appears to be of a lower magnitude than the increase in
cost For instance lead-time in the US ranges from 5 years for the Vermont Yankee
reactor up to 233 years for the Watts Bar 1 reactor which represents a 5-fold increase
As instrument we have computed the 3 year time trend in the electricity consumption
as a proxy of the expected electricity demand For the French case we have taken the
national electricity consumption given that all the reactors are connected to the same
grid thus all the units intend to meet the national demands For the US we consider
the electricity consumption for the relevant market given that there is no common grid
5 Data about nuclear reactors cooling system and containment structure are detailed in the AppendixE
Chapter 3 55
therefore we took the time trend only of the electric power market6 where the reactor
was located The data was taken from the statistics of the Department of Energy (DOE)
for the US and the French National Statistics Institute (INSEE)
In the model we have also included a set of dummy variables The first one aims to
identify those projects in which the utilities were in charge of the construction project
and did not delegate it to a A-E firm For the US case we turn to the information
provided by the Nuclear Regulatory Commission (NRC) For France these data do not
require any specific access as EDF has always acted as the A-E firm and is the sole
utility to operate nuclear reactors The other dummy variables were included to control
for the possibility of structural breaks following two major nuclear accidents Three Mile
Island (TMI) in 1979 and Chernobyl in 1986 Because the TMI accident took place in
the US we also investigate for the possibility that this accident has had a heterogeneous
effect in the two countries with country specific TMI dummy variables
Finally we collect data on prices for two major inputs to the construction of nuclear
reactors cement and labour force These data are collected from the French National
Statistics Institute (INSEE) and the US Census Bureau respectively for the two coun-
tries All the definitions and descriptive statistics for our relevant variables are summa-
rized in Table 31 below
Table 31 Descriptive statistics
Variable Definition Mean Std Dev Min Max
CT Cost in e2010MWe 2282 1639 599 8571LT Construction time 8578 3507 43 233Cap Size in MWe 992390 201854 478 14725HHIMo Standardization of reac-
tors under-construction0230 0171 0122 1
Know Discounted stock of nu-clear patents
58251 10396 32648 90339
ExpArqMo Experience A-E model( reactors)
1695 2672 0 14
ExpArqNoMo Experience A-E diffmodel( reactors)
9867 13162 0 54
ExpNoArqMo Experience diff A-Emodel ( reactors)
2921 4073 0 18
ExpNoArqNoMo Experience diff A-E diffmodel ( reactors)
27414 25731 0 87
ArqUtility Vertical integration A-Ewith utility
0382 0487 0 1
Cement Cement cost index 88019 31571 368 186556Labour Labour cost index 247568 168027 87439 921968EDem Future electricity de-
mand (3 year trend)043 010 017 061
NPPUC Reactors under-construction
42632 20747 2 69
6 We added up the electricity consumption of the states that from each one of the 10 electric powermarkets California MISO New England New York Northwest PJM Southeast Southwest SPPand Texas
Chapter 3 56
33 Model specifications and results France versus the US
331 Model specifications
The equations used to study construction costs and lead-time follows a Cobb-Douglas
functional form7 taking into account the endogeneity of lead-time we use expected
demand of electricity as an instrument and we control for the effects of capacity and
input prices A set of explanatory variables to identify learning effects is included as well
as the HHI index for short term standardization and dummy variables to differentiate
projects managed or not by the utility to capture the effect of structural breaks due to
major nuclear accidents and to control for temporal and country fixed-effects
Based on Equations (31) and (32) the equations for the baseline model specification
(Model 1) are as follows
ln(CTi) = α0 + α1 ln(LTi) + α2 ln(Capi) + α3 ln(Cement) + α4 ln(Labour)+
α5ArqUtilityi + α6 ln(ExpArqMoi) + α7 ln(ExpArqNoMoi) + α8 ln(ExpNoArqMoi)+
α9 ln(ExpNoArqNoMoi) + α10HHIMoi + α11NNPUC+
α12TmiUS + α13TmiFR+ α14Cherno+ α15Country + α16Trend+ υi (36)
ln(LTi) = β0 + β1 ln(Capi) + β2ArqUtilityi + β3 ln(ExpArqMoi) + β4 ln(ExpArqNoMoi)
+ β5 ln(ExpNoArqMoi) + β6 ln(ExpNoArqNoMoi) + β7HHIMoi
+ β8 ln(EDem) + β9NPPUC + β10TmiUS + β11TmiFR
+ β12Cherno+ β13Country + β14Trend+ εi (37)
In Model 2 we consider the possibility of learning by searching in addition to standard-
ization and learning by doing therefore in Equation (36) we include Know Model 3
focuses on the learning effects at the A-E firm level and we aggregate the experience of
the A-E firm regardless of the reactor model Finally Model 4 considers the experience
at the reactor model level regardless of the A-E firm
7 This functional form that has been extensively used in the literature on nuclear construction costseg Komanoff (1981) Cantor and Hewlett (1988) McCabe (1996)
Chapter 3 57
332 Results
The estimated output for Equations (31) and (32) is presented in Tables 32 and 33
below for the four different model specifications In each table we find the estimates
with the corrected standard errors in brackets underneath them
Before we proceed to present the results it is important to mention that the total effect
of the explanatory variables in the overnight costs has to take into account the partial
effect in the cost equation as well as the indirect impact in the costs through changes
in the lead-time equation As we can see in Tables (32) and (33) the estimate of the
lead-time is positive and significant therefore we have to offset the effect of the variables
in the first equation with the indirect effect in the second one as follows
d lnCT
d lnXk=part lnCT
part lnXk+part lnCT
part lnLTlowast part lnLT
part lnXk= αk + α1 lowast βk
The first result of our analysis refers to the importance of model specification in identify-
ing significant and positive learning effects in the construction of nuclear power plants
Previous studies account for the experience at the firm level as in Model 3 or at the
technological level as in Model 4 By comparing the results across the models we can
see that the estimates in Models 1 and 2 where we include the experience of the same
A-E firm in the same model ExpArqMo are those where we find the largest learning
effects While the learning effects are weaker in Model 3 and they do not exist in Model
4
The estimates of Model 1 and 2 allow us to conclude that in average we can expect
that the costs for the second unit of a reactor model built by the same A-E firm will be
reduced in 10 to a 128 This result goes in line with what is predicted in the economic
literature on learning effects and coincides with recent evidence (Escobar-Rangel and
Leveque 2012) on the French nuclear fleet To test the robustness of these results we
used different measures for the experience variables (ie ExpArqMo ExpArqNoMo
ExpNoArqMo and ExpNoArqNoMo) as shown in Appendix C9
Regarding the learning effects in the lead-time equation we find that experience in
the construction of other models either of the same firm (ExpArqNoMoi) or of others
8 Here we have computed the total effect of ExpArqMo in the cost In Model 1 is equal to(0022217)-0152=-010 and in Model 2 to (0022185)-01655=-012 If we consider that theexperience from the first to the second unit represent 100 increase in the experience we obtainthese results
9 For robustness tests we consider in Appendix C country specific time trends (with a quadraticterm) in order to control for instance for time variant changes in safety regulation in France andthe US We also define the learning by doing variables as 1(1+X) instead of ln(X) as both modelspecifications have been used in the literature Zimmerman (1982) Our results remain unchanged
Chapter 3 58
Table 32 Estimation output of Equations (31) and (32)
Model 1 Model 2Cost Lead-time Cost Lead-time
ln(Capi) -0897 0188 -0793 0188 (0175) (0068) (0170) (0068)
ln(Cementi) -0214 -0230(0405) (0394)
ln(Labouri) 0873 0154(0409) (0413)
ln(LTi) 2177 1825 (0468) (0465)
ln ExpArqMoi -0152 0022 -0166 0022(0034) (0015) (0033) (0015)
ln ExpArqNoMoi -0036 0039 -0025 0039 (0035) (0012) (0033) (0012)
ln ExpNoArqMoi 0021 0035 0008 0035 (0036) (0015) (0035) (0015)
ln ExpNoArqNoMoi -0296 0156 -0223 0156 (0099) (0023) (0096) (0023)
Knowi 1464 (0438)
HHIMoi 0917 -0415 0865 -0415 (0468) (0207) (0463) (0207)
ln NPPUCi 0429 -0102 0356 -0102 (0102) (0045) (0099) (0045)
ArqUtilityi -0332 0052 -0340 0052(0084) (0037) (0081) (0037)
ln(EDemi) -0404 -0404 (0079) (0079)
TmiUS -0847 0436 -0504 0436 (0248) (0050) (0246) (0050)
TmiFR -0328 0040 -0230 0040(0216) (0096) (0209) (0096)
Cherno -0348 0168 -0331 0168 (0142) (0037) (0137) (0037)
Constant 4829 -0449 -0828 -0449(1573) (0510) (2714) (0510)
Country FE Yes Yes Yes YesTrend + trend2 Yes Yes Yes YesObs 128 128 128 128Adj R2 0856 0914 0865 0914
(ExpNoArqNoMoi) has a negative impact on the construction periods which translates
into an increase in the construction costs This result shows that due to the complex-
ity of a nuclear reactor and the importance of A-E firms in construction projects it
is not possible to directly transfer previous knowledge and experience gained on the
construction of any type of reactor to the new projects
The estimates for the diversity index HHIMoi suggest that there might be some ben-
efits of standardization in the short term through reductions in the lead-time Recall
that when this index is close to zero it means that the nuclear fleet under construction
is diverse then these potential benefits will vanish This result can be explained by
the fact that an heterogeneous demand in the components could lead to supply chain
Chapter 3 59
Table 33 Estimation output of Equations (31) and (32)
Model 3 Model 4Cost Lead-time Cost Lead-time
ln(Capi) -0803 0170 -0814 0167 (0184) (0067) (0184) (0064)
ln(Cementi) -0451 -0360(0425) (0433)
ln(Labouri) 0711 0464(0436) (0442)
ln(LTi) 2328 2322 (0514) (0501)
ln ExpArqi -0121 0048 (0041) (0012)
ln ExpNoArqi -0243 0165(0108) (0021)
ln ExpMoi -0083 0036 (0033) (0011)
ln ExpNoMoi -0301 0188 (0116) (0021)
HHIMoi 1388 -0389 0920 -0030(0498) (0205) (0486) (0187)
ln NPPUCi 0325 -0099 0367 -0106 (0109) (0045) (0108) (0042)
ArqUtility -0410 0064 -0257 0019(0089) (0035) (0077) (0030)
ln (EDemi) -0383 -0404 (0078) (0074)
TmiUS -0824 0441 -0784 0452 (0277) (0049) (0274) (0047)
TmiFR -0238 0052 0111 -0175(0231) (0095) (0257) (0094)
Cherno -0391 0194 -0267 0155 (0160) (0035) (0150) (0034)
Constant 5503 -0301 6500 -0474(1678) (0503) (1851) (0472)
Country FE Yes Yes Yes YesTrend + trend2 Yes Yes Yes YesObs 128 128 128 128Adj R2 0837 0902 0827 0890
constraints and therefore some construction delays As such it is rational to find that
this short term effect impacts primarily the lead-time equation
Given the nature of these three results one may argue that the lack of standardization
harms the competitiveness of nuclear power in two ways Firstly it reduces the potential
gains in terms of costs savings in the long term through learning by doing at the
firm level Secondly it tends to increase the construction lead-times and therefore the
construction costs in the short term
In addition the estimates of our model highlight positive and significant economies
of scale It is important to mention that both in the US and France the nuclear
industry decided to construct bigger reactors aiming among other things to reduce
Chapter 3 60
the costs per MW installed In the light of these results we find that indeed even if
larger nuclear reactors took longer lead-times to be built they were also cheaper per
MWe For instance Model 2 indicates a net impact of -0793+(18250188)= -045
This coefficient can be interpreted as an elasticity meaning that a 10 increase in size
reduces construction costs in average by 45
With respect to the role of A-E firms we also show that when a utility takes the A-E firm
responsibility construction costs are lower than when a project is managed by another
firm This result has been identified in previous studies (eg Cantor and Hewlett (1988)
and McCabe (1996)) and it can be understood by the fact that a vertically integrated
utility reduces potential asymmetric information problems with the other firms involved
in the construction of nuclear reactors and this leads to cost reductions
The results for Model 2 show that the estimate for the discounted stock of priority patent
applications (Knowi) is positive and significant This result contradicts the pattern
observed in many energy technologies such as renewable energy sources (Erickson and
Drennen 2006) If we compare the estimates obtained in Model 1 with those of Model 2
we can see that the inclusion this variable that aims to capture the effect of innovation
reduces the importance of capacity and lead-times in the construction cost equation
This shows that bigger reactors embed innovations and that make them more complex
and need more time to be constructed The inclusion of this variable in the model allow
us to isolate the effect of complexity in the construction costs and as we can see in Table
32 this was one of the main drivers of the construction costs in the US and France
This result can partially be explained by the fact that the requirements of nuclear safety
authorities have induced innovations (Berthelemy 2012a) According to Berthelemy
(2012b) innovations in nuclear power sector are strongly related with improvements in
the safety performance of existing reactors This result highlights the long term trade-off
faced by the nuclear power sector on the one hand innovation is needed to reduce the
externalities associated with nuclear accident risks but on the other hand innovation
hampers the competitiveness of nuclear power through an increase in construction costs
One can also note that this result is contrary to the initial findings of Jamasb (2006)
who relies on data extracted from energy modelling tools Hence from a methodological
perspective this result stresses the necessity of looking at real cost data before drawing
policy conclusions on energy technologies costs trajectories
Finally it is important to analyze the effect of the major nuclear accidents in our system
of equations As we can see in Table 33 the impact on the construction costs both in
the US and in France due to TMI and Chernobyl (CH) came indirectly from an increase
in lead-time Logically TMI primarily impacted the US where this reactor was located
Chapter 3 61
and had no significant impact on France Chernobyl which took place in the Ukraine
had a positive and significant impact albeit at the 10 level on lead-time in the two
countries This result suggests that closer monitoring from nuclear safety authorities
following these accidents resulted in delays in the construction of the reactors installed
afterwards
34 Nuclear reactors lead-time Insights from other OECD
countries
The results presented in the previous section confirm that even discounting the financial
costs delays in construction affect the construction costs In addition they also point
out that a standardized nuclear fleet was one of the elements that made it possible to
reduce construction periods which ultimately resulted in a cost reduction
As mention in the introduction meeting the construction schedules will have a positive
impact in nuclear power competitiveness besides avoiding the negative effect of delays in
the construction costs First because it allows that the utilities generate revenues soon
This is particularly important in countries with private investors in the electricity sector
given that they employ higher discount rates than those used for public infrastructure
This implies that they might prefer to build a CCGT gas plant that can be planned and
built in 2 years and be willing to face the fossil fuel and carbon price risk instead of
waiting more than 7 years (in the best case scenario) to start recovering their investments
(MacKerron 2004)
Second because a long lead-time might encourage a wait-and-see policy For instance if
we take into account that with the pre-construction period it will take between 10 and
15 years for one reactor to be commercial it can be reasonable to delay the investment
and wait until the same technology is cheaper or other technologies become affordable
Third because in countries with increasing energy demands in the reactors should be
ready when needed Finally we can expect a shorter lead-time reduces the risk of
regulatory intervention and somehow it might even improve the perception of other
stakeholders have with respect to nuclear power
For the above in this section we further investigate the potential standardization benefits
on lead-time using a larger dataset on nuclear reactors from 6 OECD countries Our
aim is to test if the results that we have obtained in the previous section for the lead-time
equation hold when using a larger data set In addition we seek to gain some insights
into the construction of other nuclear fleets for which cost information is not available
Chapter 3 62
but the the average on lead-times is substantially lower than in the cases that we have
studied
341 Data and Model
The data used are also extracted from the Power Reactor Information System (PRIS)
database developed by the IAEA Similarly to the previous section lead-time is com-
puted as the difference in years between the construction and commercial dates for
reactors in 6 OECD countries We have considered the US France Canada South
Korea Japan and the UK Note that contrary to the previous section we can make full
use of the French data as contrary to costs data lead-time is available at the reactor
level
Figure 33 and Table 34 below highlight that the heterogeneity across our sample is
substantial This feature is understandable given the differences between countries and
across years in terms of labour productivity regulatory licensing process stage of de-
velopment of construction techniques etc To capture these effects we have included in
our model a fixed effect for each country as well as a time trend and a quadratic term
for the time trend
In the next table we present the means for the explanatory variables that we have
chosen to use in our regression model As we can see differences in the lead-time means
between the Western and Asian countries are substantial For Japan and South Korea
the construction of a new reactor took only 4 years approximately whereas in the US
or in the UK took more than the double even when the average size of the reactors is
similar
Table 34 Mean for the explanatory variables
Obs LT ExpArqMo HHI Cap(in year) (reactors) (index) (in MWe)
France 58 645 913 0472 1083Canada 22 707 229 0361 687South Korea 23 490 404 0672 8953Japan 50 410 3 0341 9191UK 17 863 480 0861 6451US 98 927 210 0152 9724All Countries 291 741 412 0378 9344
In Table 35 below we present the estimates similar to Equation (37) in previous Section
We have also included nameplate capacity electricity demand and the structural break
Chapter 3 63
Figure 33 Nuclear reactorsrsquo construction lead-time in OCDE countries
dummies as controls Two model specifications are considered the second one introduces
time fixed effects Other robustness tests can also be found in Appendix D10
These estimates show that increasing the size of the reactor has a positive and significant
effect on lead-time On average we have found an increase of 3 when scaling up by 10
This result confirms the importance of offsetting the scale effects in the cost equation
as although increasing the size of the reactor means lower costs per MWe the net effect
should take into account the increase in the lead-time
This model also confirms the insights from the previous section in terms of our HHI
diversity index Recall that high values of this index mean more market concentration
which in our case corresponds to a more standardized nuclear fleet On the basis of
the analysis using the lead-time there is strong and significant evidence that reducing
the diversity of the nuclear fleet is one of the major differences between countries with
longer lead-times and those with shorter construction periods
One can also notice the negative effect of the two major nuclear accidents on the con-
struction lead-time Both TMI and Chernobyl were found to be significant structural
10 In Appendix D we consider the four learning spillovers channels used in previous section and alsodefine them both as 1(1 +X) and ln(X) The results remain unchanged
Chapter 3 64
Table 35 Regression results for lead-time with experience and the HHI index
(1) (2)Variables (lnLT ) (lnLT )
HHIMoi -0291 -0472 (0135) (0182)
lnCapi 0395 0254 (0052) (0052)
ExpArqMoi 0019 -0008(0032) (0029)
lnEDemi -16970 -21219 (2866) (3265)
lnNPPUCi -0020 -0054(0033) (0047)
TmiUS 0432 0439 (0044) (0062)
TmiAbroad 0139 0142 (0054) (0061)
Cherno 0188 0214 (0029) (0027)
Constant 1105 1977(0402) (0440)
Country FE Yes YesTime FE No YesTrend + Trend2 Yes NoObs 286 286Adj R2 0840 0869Note Robust standard errors in parentheses
breaks showing that these events have an influence beyond borders As expected the
effect of TMI is stronger on the US compared to other countries
35 Conclusion
In this paper we investigate the role of lead-times the potential short and long term ben-
efits of nuclear reactor standardization and the effect of innovation on the construction
costs of nuclear reactors in the US and France between 1966 and 2002 using overnight
construction costs data Short term benefits are defined as the gains based on the diver-
sity of nuclear reactors under construction whereas long term benefits represent learning
by doing spillovers from similar reactors We use a discounted stock of priority patent
applications in the nuclear sector as a proxy of innovation
We estimate a two stage least square regression model for construction costs and lead-
time using the expected demand of electricity as an instrument for lead-time and control
for input prices and the possibility of structural breaks following major nuclear accidents
TMI and Chernobyl
Chapter 3 65
Our results identified the main drivers of the construction cost of the two largest nuclear
fleets in the world as well as the elements that explain the increase in the lead-times
registered in the past We show that the delays during the construction and techno-
logical innovations have led to an increase in the costs In addition we identified that
the continuous changes of reactor designs and the scale-up in the size of the reactors
explained part of the increase in the construction lead-times
We also found that there are positive learning effects in the construction of nuclear
reactors and the lead-times were shorter when the fleet under construction was less
diverse This result shows that the standardization strategy adopted in France was
successful in curbing the construction costs and avoiding the long lead-times that were
observed in the US
351 Policy implications for nuclear new-build programs
While this paper focuses on the US and French construction costs we argue that our
results are useful to explain some of the latest experiences in the construction of nuclear
reactors as well to suggest what we can expect it will happen in the construction of
other nuclear fleets For instance the continuous delays in the EPR construction in
Finland and France can be seen as the conjunction of two elements First the fact that
the EPR is a first of a kind means that the experience that AREVA or EDF had in
the construction of other models can not be directly transferable to this new project
According to our results we can expect an increase in the construction lead-time due to
this change The second element that may explain the delays is that the EPR is a big
reactor (it has a 1650 MWe capacity) in the light of our results it is likely that it takes
more time to construct compared with its predecessor (N4 model 1500 MWe)
Taking into account that the lead-times were found regardless the model specification
used as one of the drivers of the construction costs we can argue that the cost revisions
in the Olkiluoto-3 and Flamanville-3 can partly be explained by the delays faced dur-
ing the construction According to our model the construction costs of the EPR will
decrease only if more units of this same model are built
This last remark is important for ongoing nuclear new build programs We found that the
largest cost reductions due to learning by doing are conditional on the standardization of
nuclear programs considering that learning by doing spillovers only take place through
reactors of the same model built by the same Architect-Engineer (A-E) firm In that
respect one can expect that the cost of the last CRR-1000 reactors that are foreseen
in the Chinese nuclear power program will be cheaper than the predecessors The same
argue could apply in India where the nuclear fleet that is currently under construction
Chapter 3 66
includes 4 reactors of the same model (ie PHWR-700) build and later operated by the
same firm the Nuclear Power Corporation Of India One also expect that the costs for the
last APR-1400 in South Korea will decrease as KEPCO finish the ongoing constructions
of this same design
At the same time we show that vertical integration of the utility and the A-E firm
reduces construction costs Therefore it is possible that vertical integration will also
contribute to lower costs for the reactors that are under construction in India Korea and
Russia For new entrant countries this potential cost reductions will not be achieved
in the short term given that most of reactors will be build as turnkey projects like in
United Arab Emirates
We also show that short term gains from standardization have a positive impact on
construction costs through a reduction in lead-time the latter being one of the main
drivers of construction costs in France and the US This result is also confirmed for
a range of other OECD countries with heterogeneous nuclear programs and can be
explained by the fact that the diversity of nuclear reactor models can lead to delays
owing to supply line constraints or delays due to increased workload for the nuclear
safety regulator
In fact this result can be part of the explanation of the delays in the construction of the
AP-1000 and EPR reactors in China According to Schneider and Froggatt (2014) the
four AP1000 reactors at Sanmen and Haiyang have 18-30 months of delays due among
other issues to an insufficient support for regulatory review They also point out that
the first EPR at Taishan has a 13-15 month delay In this case the delays are linked
with malfunctions in the equipment and along with a lack of understanding with the
Chinese safety authorities Whilst our model does not allow one to distinguish delays
due to regulatory changes from those that arise from malfunctioning equipment or other
technical problems during the construction we can argue that when the nuclear fleet
is more diverse the safety assessment done by the safety authorities is likely to take
longer This might help to understand why the lead-times for the CRP-1000 model have
been kept relatively constant (it is a well known design for the Chinese safety authority)
while the difficulties during the safety assessment for other reactor models such as the
AP1000 and EPR have increased the lead-times in those projects
In parallel we also find that the discounted stock of patents in the nuclear industry
increases construction costs reflecting that innovation has not been focused on improving
nuclear competitiveness by reducing the amount of capital needed to build a reactor
This result goes in direct contrast to the pattern seen in other energy technologies
where technical progress contributes to costs reductions notably in competing carbon-
free technologies like wind power
Chapter 3 67
From a methodological perspective this result might explain why forecasts of nuclear
power share in energy mixes in energy economics modelling tools have not been met The
existing literature has shown that certain modelsrsquo calibration (Jamasb 2006) implicitly
assumes that nuclear construction costs benefit from innovation effort when in reality
what we found is that technological progress have made new reactors more expensive
This result highlights the importance of building these models on evidence based on
actual cost data
However the implications of this last result go beyond a methodological contribution
Why innovations have increased the costs of the each new generation of reactors
Berthelemy (2012b) argues that innovation in nuclear power has allowed the indus-
try to achieve better safety performance for existing reactors In other words one could
argue that safety requirements have led vendors to include better and more reliable com-
ponents and systems in new designs aiming to improve safety features For instance
Areva markets the EPR reactor as a Generation III+ precisely due to the level of safety
obtained compared to previous designs and argues that this latter design ensures an
rdquounequalled safety level thanks to a drastic reduction of the probability of severe acci-
dents as well as of their consequences on the environment In addition it is particularly
resistant to external incidents (airplane crashes etc)rdquo
352 Paths for future research
Our results allow us to conclude that nuclear power faces an interesting trade-off between
reductions in costs permitted by standardization and potential gains from adopting new
technologies with better operating and safety performance Unfortunately we cannot
answer the question of the optimal pace of technological change in nuclear power tech-
nologies with our model In addition we have to recognize that by using patent data
as a measure of innovation we captured incremental innovation but we were not con-
sidering the possibility of radical technological change In that respect nuclear power
has been characterized by incremental innovations from initial reactor designs in the
1950s Conversely radical innovations such as 4th generation of nuclear reactors could
contribute to costs reductions and further work is needed to better understand the cost
dynamic of such technologies
It is also important to note that safety regulation can impact construction costs and lead-
time through dimensions other than technological change In particular the scope of
standardization partly depends on the evolution of the safety rules in each country This
is reported to be the case in the US where according to Cooper (2010) the increase
in safety regulations issued by the NRC grew substantially following TMI (eg from
Chapter 3 68
three safety guidelines in 1970 to 143 by 1978) limiting the ability of nuclear vendors
to standardize nuclear reactors as they had to comply with changes in safety rules
Hence the US experience shows that safety regulation can have important consequences
on the economic competitiveness of nuclear reactors In that respect standardization
and safety regulation do not have to be per-se incompatible and one could argue that
for a given level of safety effort nuclear safety regulation should be designed in order to
allow nuclear reactors to benefit more from standardization gains
This last result opens the door for further research and also represents a challenge from
a policy perspective in those countries with interest in nuclear deployment In terms of
possible research questions we argue that it is important to identify clearly how differ-
ent safety regulations have affected the design of new reactors and disentangle the effect
of technical problems from the effect of regulatory interventions in the observed con-
struction lead-times In terms of policy it is clear that a better coordination regarding
nuclear reactor certification procedures through cooperation between national nuclear
authorities can improve nuclear competitiveness while ensuring an adequate safety level
For instance enabling for a reactor design to be certified jointly in several countries
could reduce significantly regulatory uncertainty before and during construction with-
out compromising required safety standards
Chapter 4
Setting optimal safety standards
for nuclear operators subject to
uncertainty moral hazard and
limited liability
41 Introduction
Operating a nuclear power facility is a hazardous activity One of the main concerns
of nuclear power safety is the possibility of an accident releasing of significant amounts
of radiation into the environment Prolonged exposure to these radioactive materials
could cause irreversible damage to living tissue in human bodies poison animals and
contaminate soil leading to large economic and environmental losses
Over the 14500 reactor-years in the history of nuclear power for commercial use two ma-
jor nuclear accidents1 have occurred (ie Chernobyl in Ukrania in 1986 and Fukushima
Dai-ichi in Japan in 2011) Both accidents led to considerable economic and environ-
mental damage For instance preliminary cost estimates for the Fukushima Dai-ichi
accident range from 250 to 500 billion USD not to mention that approximately 30000
1 The International Atomic Energy Agency designed the International Nuclear and Radiological EventScale (INES) to explain the significance of nuclear or radiological events Events are classed intoseven levels with each level taking into account the severity in three areas of impact people andthe environment radiological barriers and control and defense in depth The scale is designed sothat the severity of an event is about ten times greater for each new level on the scale The mostserious accident is rated 7 and is called a major nuclear accident
69
Chapter 4 70
km2 of Japanrsquos land surface was contaminated and more than 139000 people had to be
evacuated2
In case of an accident nuclear operators are liable for all damages even for those that
are not directly caused by them However when the costs are as high as they are after
a major nuclear accident the operator does not internalize all of the damage done In
some countries the nuclear operatorrsquos liability is limited by law therefore if the damages
exceed this limit the state has to pay for any harm that is not covered However even in
countries with unlimited liability it is possible that an operator will not possess sufficient
assets to pay for the damages completely and as a consequence society will have to bear
part of risk
The fact that nuclear operators might not completely internalize any harm they may
inflict distorts their incentives for ensuring safety This issue calls for ex ante regulation
to correct this externality and attain higher safety levels The under-provision of safety
in presence of limited liability has been studied by Shavell (1984) and Kolstad et al
(1990) They showed that ex ante regulation (setting safety standards) improves welfare
in particular when the magnitude of harm is much greater than the injurerrsquos assets (tacit
limited liability) or when the parties shall not face the threat of lawsuit for any harm
done (legal limited liability)
Concerning the above it is not surprising that nuclear power is one of the most regu-
lated industries in the world Basically all stages of nuclear power plant development
(ie design construction operation transport and use of radioactive material and de-
commissioning) are regulated by requirements and standards set by a safety regulatory
agency with the aim of reducing the risk of a nuclear accident For instance the US
Nuclear Regulatory Commission requires that only noncombustible and heat resistant
materials be used in the construction of a nuclear power plants containment and control
room in order to minimize the risk of fire and thereby the risk of accident
Unfortunately it took the devastating damages of the Fukushima Dai-ichi accident to
act as a wake-up call of how important it is to have a competent and independent safety
regulator Following nuclear experts safety assessment of the accident several scholars
such as Leveque (2013) and Wang et al (2013) concluded that the accident was the
result of a regulatory failure and not a black swan as initially thought The assessment
revealed that the Japanese safety authority knew about the possibility of a tsunami
waves exceeding 20 meters Despite this information the unitrsquos sea walls were never
back-fitted For this reason the credibility of the Japanese nuclear safety authority has
2 See Schneider and Froggatt (2014) and httpwwwpsrorg
environment-and-healthenvironmental-health-policy-instituteresponses
costs-and-consequences-of-fukushimahtml
Chapter 4 71
been severely questioned and regulatory capture has been suggested as the trigger of
this tragedy According to Gundersen (2012) the laxity of the Japanese regulator in
enforcing safety standards was a key cause of this disaster
In this context safety regulation plays a decisive role not only in maintaining a good
record in terms of a low frequency of accidents but also in the economics of nuclear
power On the one hand safety authorities must determine and be able to enforce the
acceptable risk level at which nuclear power plants should operate On the other hand
safety regulators must keep in mind the cost for operators of complying to standards
and rules in order to attain the envisioned risk level Thus regulators must identify
standards that reduce the risk of a major accident without compromising operatorrsquos
profits
Thus the key question for a nuclear safety regulator is how to attain a sufficiently small
probability of accident in a cost-effective manner From an economic perspective the
answer is to set a standard that equates the marginal cost of providing safety with the
marginal benefit of reducing the expected damages in case of accident However in the
case of nuclear power achieving this balance between costs and benefits is easy due to
the existence of several information-related problems
First the regulator cannot directly observe the operatorrsquos behavior (although this is not
specific to nuclear power) therefore it is not possible to enforce the first best safety level
at zero cost As shown by Strand (1994) and Hiriart et al (2004) in the presence of
moral hazard only second-best care levels are attained and the only way to implement
the first-best safety level is by heavily subsidizing the firm Here the challenge for
nuclear safety authorities is to define a policy that induces compliance with the safety
standards as the operatorrsquos optimal response Compliance is a fundamental element
in nuclear safety regulation given that on the one hand the safety authorities have
to guarantee to the public that nuclear facilities run below the acceptable risk level
and on the other that their reputation and credibility will be severely damaged if non-
compliance is widespread among operators
The second informational problem present in nuclear safety regulation is the epistemic
uncertainty regarding the probability of a major accident Safety authorities cannot
exactly determine the probability of a major nuclear accident based on the observed
frequency But even more importantly (for regulatory purposes) there is some uncer-
tainty as to how safety care translates into a lowerhigher probability of an accident
These factors result from the way in which nuclear reactors are designed Nuclear power
plants are complex they have multiple safety systems each with a backup and they are
designed to accommodate human error This redundancy in the systems aims to con-
trol damage and prevent accidents and significant radioactive releases Consequently
Chapter 4 72
nuclear accidents are rare making it difficult to measure the link between safety care
and the risk of accident
Considering the above the main goal of this paper is to examine the features of an
optimal safety regulatory policy for a nuclear operator that takes into account several
particularities First in the case of a major nuclear accident the operator is protected
(tacitly or legally) by limited liability In addition the regulator cannot observe the
safety care level chosen by the operator (moral hazard) thus the regulatory policy has
to provide incentives to the operator to comply with it Finally there is epistemic
uncertainty as to how safety care affects the probability of a nuclear accident
The problem of a lack of incentives to provide safety care in the presence of limited
liability has been studied by Shavell (1984) Kolstad et al (1990) and Hansson and
Skogh (1987) The provision of safety in presence of limited liability and moral hazard
has been studied by Strand (1994) and Hiriart and Martimort (2004) Hiriart et al
(2004) also derived an optimal regulatory scheme in the presence of these two problems
as well as considering adverse selection
One of the main features of these papers is that the regulator provides incentives to
the firm through transfers that are state-contingent (ie accidentno accident) Nev-
ertheless this is not realistic in the case of nuclear power because safety regulators
cannot reward at least not directly operators in case of no accident Broadly speak-
ing most of nuclear safety regulatory agencies are responsible for establishing legislative
documents regarding nuclear safety and supervising activities on nuclear installations
For this reason we prefer to model this situation as a compliance monitoring problem
In the literature a general model was proposed by Becker (1968) and has since been
extensively used afterwards to study environmental regulation (see Cohen (1998) for an
extensive review) Our model is close to that put forward by Arguedas (2008) In this
model the regulator sets a safety standard and then in order to provide incentives to
comply with it randomly inspects firms and is able to threaten operators with fines
To tackle the problem of the uncertainty of how safety care reduces the probability of
accident the nuclear industry has come up with a procedure called Probabilistic Risk
Assessment (PRA)3 This assessment employs a set of assumptions about the probability
of events that may induce a core melt as well as about the failure of each component
and the back-up systems and uses them to compute the core damage frequency (CDF)
The CDF tells us (theoretically) how long the reactor will run before undergoing at least
one core melt
3 The first PRA assessment carried out in the US is known as the WASH-1400 report This studywas done by Norman Rasmussen for the Nuclear Regulatory Commission and concluded that theaverage CDF was equal to 5E-05 with an upper bound of 3E-04
Chapter 4 73
The PRA identifies the main sources of risks and makes it possible to rank safety invest-
ments according to their effectiveness in reducing CDF In addition CDF is a metric
that the regulator can use to compare and monitor nuclear operators Nevertheless
CDF is itself a random variable and unfortunately PRA assessments do not derive its
distribution function at most they determine the interval within which this parame-
ter belongs In summary it is possible to claim that PRA gives the safety regulator
some information regarding how safety care can reduce the probability of accident but
uncertainty remains
This last feature means that although nuclear regulators do not possess a single precise
probability measure when setting the safety standards they at least have access to some
information (ie an interval of values coming from the PRA) on the link between safety
care and the probability of an accident To capture this element in our model we propose
to use the concept of imprecise (interval) probabilities as in Aven and Hiriart (2013)
In their paper they studied safety care investments from the firmrsquos perspective using
two robust optimization concepts ie worst-case and regret robustness In our paper
we also use these approaches but we assume that the operator has perfect information
regarding its efficiency in reducing the probability of an accident We can therefore focus
our attention on how uncertainty affects the safety regulatory policies
Our results suggest that when a nuclear safety regulator is conservative and seeks to
minimize the expected social costs in the worst possible scenario then safety standards
will be less stringent and nuclear facilities will be inspected more often Both results
are derived from the fact that the regulator is pessimistic as to how safety care can
reduce the probability of an accident In the second approach the regulator considers
the possibility that it may be wrong in its beliefs regarding safety care effectiveness
and it attempts to minimize the biggest mistake that it may regret In this case safety
standards will be stricter Nevertheless the risk of no compliance increases if the cost
of the standard is too high for the operator
In summary the optimal regulatory policy subject to uncertainty of how safety care
reduces the probability of accident will always imply a residual risk for society In the
worst-case approach the regulator can guarantee that all nuclear facilities will comply
with safety standards however the safety standard corresponds to the lowest possible
bound This means that if a regulator is not as pessimistic as in the above case it might
be possible to enforce a stricter standard and further reduce the probability of accident
In this case society bears the risk associated with the difference between the probability
of an accident defined by the standard and the probability that would be attained by
inducing the compliance of the least efficient operator
Chapter 4 74
In the second case when the regulator seeks to minimize the largest mistake it sets a
stricter standard However it cannot guarantee that all operators will operate below
that risk level given that some operators may prefer to pay a fine rather than comply
with the standard In this case the risk that society has to bear depends not only on
the difference between the standard and the least efficient operator but also on how
many operators cannot comply with the standard
The rest of this paper is organized as follows Section 42 presents the model and
characterizes the optimal regulatory policy when moral hazard is the only issue In
Section 43 we assume that only the regulator does not perfectly know how safety care
level reduces the probability of an accident and we explore the optimal regulatory policy
using two robust optimization approaches ie worst-case and regret robustness Finally
Section 44 concludes
42 The Model
We consider a nuclear operator that may provoke an accident that would harm third-
parties andor the environment In particular we are interested in major nuclear acci-
dents mainly because in this case firms are unable to pay for the totality of the damage
When a firm does not completely internalize the harm that it produces this is often rep-
resented with a limited liability constraint In our case we simply assume that either
tacitly or legally the nuclear operator just pays only a fraction γ isin (0 1) of the total
damage in case of accident The accident damage is denoted by D
The nuclear operator can exert a level of safety care that reduces the probability of a
major accident We are going to assume that the probability of an accident is given by
the function αminus βe4 Where e isin [0 1] corresponds to the nuclear operatorrsquos safety care
and the parameters α and β satisfy 1 gt α gt β gt 0
Note that the probability of an accident decreases linearly as safety care increases at a
rate β This parameter captures the firmrsquos efficiency in reducing the probability of an
accident while the reactor is in operation If β is low the operatorrsquos leeway to prevent
an accident is reduced meaning that the risks are strongly linked to the design itself If
β is high it means that the main hazards are likely to arise during operation and thus
the safety care that the operator exerts is important to prevent a nuclear accident
Note also that even when the operator exerts no safety care e = 0 there is a positive
probability of no accident 1minusα For this reason α could reflect the ex ante safety level
that is guaranteed by the nuclear vendor before the reactor starts to operate or the
4 And the probability of no accident will be (1 minus α+ βe)
Chapter 4 75
minimum accepted risk that is ex ante required to obtain a license to operate a nuclear
reactor
We assume that the cost of safety care is given by c(e) which satisfies the following
conditions cprime(e) gt 0 cprimeprime(e) gt 0 and c(0) = 0 In the absence of safety regulation if an
operator seeks to minimize the expected cost given by c(e) + (α minus βe)γD the solution
satisfies the following first order condition
cprime(eps)minus βγD = 0 (41)
The private optimum safety care level eps equates the marginal cost of care with the
marginal benefit of reducing the expected harm in case of accident This safety care
level differs from the first best outcome efb that is given by cprime(efb)minusβD = 0 due to the
operatorrsquos limited liability The lower the fraction γ which is the share of the damages
that the operator internalizes the greater the difference between the private and social
safety care levels This gap arises because the marginal benefit of avoiding an accident
is lower for the firm than for the society
The difference between the optimal levels of safety care eps and efb has been identified in
the literature as the one of the main reasons for using ex-ante regulation to complement
the incentive to exert safety care created by liability rules (see Shavell (1984) Kolstad
et al (1990)) However it has also been recognized that using safety regulation to
reduce the risk of hazardous activities involves information asymmetries In particular
the literature has focused on moral hazard arising because the regulator cannot directly
observe the safety care level e chosen by the operator5 This problem is solved by
allowing state-contingent transfers (ie accident no accident) In general the second-
best policy requires giving a moral hazard rent to the firm in order to induce a given
safety care level
In our model the regulator also provides incentives to the operator through transfers
however they are only feasible in one direction (from the firm to the regulator) This
means that we opt for a monitoring and punishment scheme which is a restricted set of
general incentive schemes We consider that this is a better setting for nuclear power
given that the mission of most nuclear safety authorities worldwide is to establish all the
legislative documents to guarantee that nuclear power plants are designed constructed
operated and decommissioned without jeopardizing public health (ie define safety stan-
dards) In addition safety authorities should perform inspection activities on nuclear
installations to verify that they comply with relevant legislation (ie monitoring)
5 See Strand (1994) Hiriart and Martimort (2004) Hiriart et al (2004) Hiriart et al (2006)
Chapter 4 76
Taking into account the above we decided to follow the model in Arguedas (2008) In
our model the regulator defines a safety standard denoted by s Given that it is not
possible to observe directly whether operators are in compliance the regulator inspects
nuclear facilities with probability q and each inspection has a unit cost equal to m If
it is found that the safety care selected by an operator is below the standard (e lt s)
the regulator can impose a fixed penalty F0 If it is found that (e gt s) no penalty is
imposed
The safety standard s stands for the compendium of all regulatory requirements that
are mandatory for the operator These rules are conceived by the regulator and are
considered essential to ensure the safe operation of nuclear power plants In other
words the safety standard includes an overall review of how an operator should conduct
its activities in order to perform effectively and prevent a serious accident
Regarding the probability of inspection q this can represent either that the regulator
visits all facilities but cannot perfectly detect whether an operator is complying with
the standard (measurement errors) or even if the detection of no compliance is perfect
the regulatory agencyrsquos resources are limited and so only a fraction q of the facilities are
inspected
Finally the fine F0 represents all of the legal measures that the regulator possesses to
deter non-compliance and that are costly for the firm6 We assume a fixed penalty
because in practice fines for nuclear operators are defined ex ante and do not depend
on the degree of non-compliance but rather on the fact that the violation has been
detected
Thus for a given a policy s q the expected cost for the operator depends on its whether
or not to comply with the safety standard
C(s q)
c(s) + (αminus βs)γD if compliance
c(e) + (αminus βe)γD + (1minus α+ βe)qF0 if non-compliance(42)
Note that the operator can only be punished with a fine in case of no accident which
occurs with probability (1minusα+ βe) If there is an accident it will not pay a fine but it
will have to compensate for the harm caused by the accident Given that he it protected
with limited liability the operator will pay γD however this amount is greater than the
fine (γD gt F0)
6 For instance the Canadian Nuclear Safety Commission can in addition to the ability of im-posing a administrative monetary penalty it is also enabled to remove the operation cer-tificate or to undertake a licensed activity and to lay charges against an operator in accor-dance with the legislation See httpwwwnuclearsafetygccaengacts-and-regulations
compliance-verification-and-enforcementindexcfmsec2-8
Chapter 4 77
As mentioned above nuclear regulators do not exactly know how the operatorsrsquo safety
care level reduces the probability of a serious accident precisely because both the reac-
tor and the plant are conceived to prevent these events The design of a nuclear facility
is based on the concept of defense in depth whereby if any component fails a succes-
sive chain of back-up systems kicks in to prevent core damage and reduce the risk of
releasing radioactive material This redundancy in the systems as well as the individual
characteristics of each operator (ie specificities of the site workers type of reactor
etc) makes it very difficult for the regulator to identify a single value for β
For the above we assume that the regulator does not know the exact value of this
parameter but it does know that it belongs to an interval[β β
] while β is perfectly
known by the firm Both agents know the value of the parameter α This last part of
the model has been introduced in order to study the effect of uncertainty on how safety
care reduces the risk of a serious accident in the regulatory policy
To exemplify our setting we can consider that the regulatory agency requires that
pumps and valves are tested a certain number of times during the year In this case the
standard s corresponds to the testrsquos frequency while e is the effective number of tests
that the operator carries out during a given year If the testrsquos frequency is lower than
required it may be less likely to detect failures in the pumps and valves thus increasing
the probability of accident To check whether an operator has carried out the test as
often as required the regulator must inspect the plant However it is difficult for the
regulator to quantify how much the probability of an accident will increase if tests are
done less frequently
All of these elements further complicate the problem of setting optimal standards for
nuclear safety authorities On the one hand authorities need to deal with the moral
hazard problem when setting the rules and on the other with uncertainty as to how
safety care reduces the probability of a serious accident Taking into account all of these
elements the problem that the regulator has to solve is the following
minsq
c(e) + (αminus βrege)D + (1minus α+ βrege)q [m+ F0]
st e = e(s q)(43)
Where βreg isin[β β
]is the interval in which the regulator thinks the true β lies And
e = e(s q) corresponds to the operatorrsquos best response function to a given regulatory
policy s q
Chapter 4 78
421 Benchmark The regulator knows β
As a useful benchmark we compute the optimal policy assuming that the regulator
knows β We proceed by backward induction First we find the optimal response of the
firm to a given policy s q and then we solve the problem of the regulatory agency
Given that the penalty F0 introduces a discontinuity in the expected cost function for all
the values that are lower than the standard (e lt s) intuitively the operator proceeds as
follows First it solves the problem in Equation (44) as if it had decided not to comply
Second it compares the expected cost of this solution with the cost of complying with
the safety standard Finally it decides to exert the safety care level that represents the
cheapest alternative
minegt0
c(e) + (αminus βe)γD + (1minus α+ βe)qF0 (44)
For a given policy s q the firmrsquos best response e(s q) can be decomposed in three cases
The first one corresponds to the case in which the firm over-complies (e(s q) gt s) This
case arises when the safety standard is so low that the operator prefers to increase
its safety care level to minimize the expected costs of an accident This solution is
equivalent to an absence of regulation therefore the operator will choose eps ie the
private optimal safety care level
In the second case the firm complies with the standard (e(s q) = s) Here the safety
care level that minimizes the operatorrsquos cost is the standard because the threat of
penalties increases the cost of lower safety care levels The last case corresponds to a
situation in which the operator optimally does not comply (e(s q) lt s) In this scenario
the standard is so costly that the firm prefers to pay the expected fine rather than the
cost of the safety care level that the regulator wants to enforce
Figure 41 illustrates these three possible cases taking a numerical example7 In each
panel the horizontal axis shows the possible values for safety care e and safety standard
s The vertical axis gives the values of the expected cost function We consider three
different safety standards (s = 01 s = 06 s = 085) and the same probability of
inspection (q = 05)
The first panel illustrates the case of overcompliance Here we assume a low standard
(ie s = 01) in which case it is optimal for the firm to choose a higher safety care level
In the second case (ie s = 06) the threat of a fine is effective to induce compliance
7 We considered a quadratic cost function and the following values for the parameters D = 2γ = 06 β = 08 α = 1 F0 = 02 and q = 05
Chapter 4 79
as we can see in the second panel of the figure all of the safety care levels below the
standard have a higher expected cost thus the standard is the level that minimizes the
costs In the final case it is too costly for the firm to comply with the standard (ie
s = 085) In this case the firmrsquos best response is to choose a lower level of safety care
denoted by n
Figure 41 Operatorrsquos best response to different regulatory policies (sq)
The solution to the firmrsquos problem is summarized in the next proposition the complete
proof is presented in Appendix F
Chapter 4 80
Proposition 1 Given the policy s q the nuclear operatorrsquos optimal response is
e(s q) =
eps if cprime(s)minus βγD minus βqF0 6 0
s if cprime(s)minus βγD minus βqF0 gt 0 and c(s)minus c(n)minus βγD(sminus n) gt q(1minus α+ βn)F0
n if cprime(s)minus βγD minus βqF0 gt 0 and c(s)minus c(n)minus βγD(sminus n) lt q(1minus α+ βn)F0
(45)
Where n satisfies the following condition
cprime(n)minus β(γD minus qF0) = 0 (46)
The previous proposition can be understood as follows The operator observes the
regulatory policy s q then it evaluates the first order condition of compliance with
the standard at its inferior limit to check if it is optimal to reduce safety care marginally
If the operator observes that this optimality condition is negative (first case) it means
that the marginal benefit of avoiding an accident is greater than the marginal cost of
the standard and it is preferable to increase safety care In this case the firm will
over-comply and exert the private optimal safety effort eps
On the contrary when the first order condition is positive or equal to zero this means
that there is no incentive to marginally increase safety care because it is too costly In
this case the operator simply compares the total expected cost of complying with that
of not complying and then decides If complying with the standard is more costly the
operator will choose a safety care level n lower than the standard s
It is important to remark first that the safety care level n will be lower than the level
which would be chosen in the absence of regulation eps due to the fact that the operator
may be punished even if no accident is observed which reduces even further the marginal
benefit of avoiding an accident Second n depends on the probability of inspection q
If we implicitly differentiate n from Equation (46) with respect to this instrument we
get partnpartq = minusβF0
cprimeprime(n) lt 0
This derivative tells us that conditional on non-compliance a higher probability of
inspection q reduces the gap between the expected costs in case of accident γD and in
case of no accident qF0 hence the level of safety effort n will be lower Although this
effect mat appear as counterintuitive it is not if we consider that the overall incentive
of a higher q is that it increases the incentives to comply
Once we have found the optimal response of the firm e(s q) we proceed to solve the
regulatorrsquos problem Here it is important to mention that the task that society has given
Chapter 4 81
to safety regulators is to guarantee that nuclear power plants operate below a maximum
accepted risk level which should be attainable by complying with the safety rules For
this reason the regulator seeks only to set policies s q that induce compliance This
means that the regulatory policy has to ensure that the operatorrsquos best response is to
comply with the standard (ie e(s p) = s) Therefore the pair s q should be such
that the expected costs of choosing safety care n are higher than those of complying
with s In general the problem the safety authority solves is the following
minsq
c(s) + (αminus βs)D + q(1minus α+ βs)m
st q = qc(s)(47)
The objective function corresponds to the expected social cost when the firm complies
with the safety standard To be sure that e(s q) = s we need to satisfy the conditions
of the second case in Equation (45) This is captured in the constraint denoted with
qc(s) that defines the equation of the possible monitoring probabilities q that will induce
compliance for a given standard s The values of the pairs s q in equation qc(s) should
satisfy the following implicit condition
c(s)minus c(n)minus βγD(sminus n)minus q(1minus α+ βn)F0 = 0 (48)
Given that monitoring is costly we discard the policies s q that the firm strictly
prefers to comply (ie Equation (48) less than 0) and focus on those that satisfy the
last condition with strict equality
If we differentiate this last constraint with respect to the available tools s and q we
ascertain how the probability of monitoring q should change to induce compliance when
standard s is changed In short we compute partqparts = cprime(s)minusβγD
(1minusα+βn)F0gt 0 This last result is
quite intuitive it tells us that higher standards require higher monitoring probabilities
to induce compliance whereas lower standards are easier to enforce in the sense that
they need less frequent inspections
Now we can proceed to find the optimal policy slowast qlowast that the regulator will set when
it perfectly knows the value of β The solution is summarized in the next proposition
Proposition 2 The optimal policy slowast qlowast that induces compliance is given by the fol-
lowing conditions
cprime(slowast)minus βD +partqc(s
lowast)
parts(1minus α+ βslowast)m+ qc(s
lowast)βm = 0 (49)
qlowast = qc(slowast) (410)
Chapter 4 82
The solution given in Equations (49) and (410) shows that the safety level that the
regulator can effectively enforce is lower than the first best outcome The presence of
moral hazard imposes the social cost of monitoring in order to enforce a safety standard
43 Imprecise probabilities and robust optimization
In this section we analyze the properties of an optimal regulatory policy subject to
uncertainty about the parameter β As we mentioned previously the safety authority
does not know the exact value of β nevertheless it knows that this parameter belongs
to an interval [β β] As a reminder if the operator knows the value of β then its best
response is still given by Proposition 1 In this situation the problem for the regulator
is the following
minsq
c(s) + (αminus βregs)D + q(1minus α+ βregs)m
st q = qc(s)(411)
Where βreg isin[β β
]
This problem can be solved using robust optimization techniques This methodology
makes it possible to assess optimization problems in which the data is uncertain and
when we only know that the parameters belong to a set The main purpose is to find a
solution that gives an acceptable performance under most realizations of the uncertain
parameters In this paper we use two approaches to solve the problem ie worst-case
approach and regret robustness
431 Worst-case approach
The objective of the safety regulator in this first case is to find the optimal policy in the
worst-case of all possible scenarios In the economic literature this optimization criterion
can be compared to the maxmin expected utility proposed by Gilboa and Schmeidler
(1989)
For our particular problem the worst case corresponds to a situation in which the regu-
lator considers the value of βreg that leads to the highest total expected cost Formally
the regulatorrsquos problem can be stated as follows
Chapter 4 83
minsq
supβ
c(s) + (αminus βregs)D + q(1minus α+ βregs)m
st q = qc(s)
βreg isin[β β
] (412)
Using the expected cost equation we find that partECpartβreg
= minuss(D minus qm) Given that we
are interested in major nuclear accidents we can argue that the cost of the damages
D is greater than the total cost of inspections qm For this reason we claim that this
derivate is negative therefore the social expected costs are inversely related to the value
of β
This means that the highest expected cost (ie the worst-case) over the possible values of
βreg is attained with the lowest value in the interval that it is equal to β The rationale
behind this idea is that the worst case that the regulator can envisage is when safety
care does not effectively reduce the probability of a major accident In other words
the regulator thinks that hazards are a result of the design rather than the operatorrsquos
behavior
To see how the optimal policy differs from the policy with no uncertainty in the param-
eter β we only need to check how the conditions in Equations (49) and (410) change
with respect to this parameter
Let us first see how the safety standard s changes in the worst-case approach with respect
to the benchmark case We use the first order condition in Equation (49) and computepartspartβ We find the following expression
parts
partβ=
D minus[partqc(s)parts s+ q
]m
cprimeprime(s) +m[part2qcparts2
(1minus α+ βs) + 2spartqcparts
]mgt 0 (413)
This result tells us that the regulator will be cautious when setting the standard taking
worst-case approach We know that the expected social costs will be a function of the
lowest possible value of βreg that is β Thus the positive derivate in Equation (413)
means that the safety standard will be the lowest possible when adopting the worst case
approach This corresponds to the least stringent safety standard denoted by swc The
overall probability of an accident that the regulator can guarantee is given by αminus βswc
This conservatism regarding the safety standard is due to the fact that in taking the
worst-case approach the regulator might be underestimating the effect that safety care
has in reducing the probability of accident
Chapter 4 84
We can now consider the probability of an inspection in the worst-case approach if the
regulator would wants to enforce a given fixed safety standard s This entails computingpartqcpartβ
partqcpartβ
= minusγD(sminus n) + qnF0
(1minus α+ βn)F0lt 0 (414)
This derivate shows how the regulator modifies the probability of inspection when his
belief about β changes This equation shows that the regulator weighs the incentives
that he has to give to the operator in order to induce compliance against the potential
amount of money that is not being collected through fines The fact that this derivate is
negative indicates that in the worst-case approach the regulator has to be more vigilant
For instance to enforce slowast he would have inspected more often than in the benchmark
case
These results are two sides of the same coin Since the regulator is pessimistic and
considers that the operatorrsquos safety care is not very effective in reducing the risk of
accident (ie β) the standard will not be very strict However this also implies that it
underestimates the operatorsrsquo incentives to exert safety care or the operatorsrsquo marginal
benefit of safety care As a consequence it will increase the monitoring frequency in
order to induce compliance
However note that the probability of inspection to induce compliance in the worst-case
approach qc(swc) is also determined by swc which we know to be lower than in the
benchmark case thus it will also be lower
The results that we obtain using the worst-case approach explain why some nuclear
safety authorities have invested in properly assessing the most effective ways in which
a nuclear operator can reduce the probability of nuclear accident It is likely that with
experience8 regulators have succeeding in gathering better information about β and
that they have realized that the operatorsrsquo safety care levels have an important effect in
reducing the likelihood of a serious accident
A good example of how nuclear regulators have improved their knowledge of how safety
care translates into a lower probability of nuclear accident is the continuous improve-
ments in PRA techniques PRArsquos have been preformed repeatedly in nuclear facilities
in order to identify the main sources of probable equipment failure that can result in
core damage PRA studies have allowed nuclear operators to efficiently allocate their
safety investments and therefore effectively reduce the likelihood of a serious accident
8 For instance David et al (1996) showed that thanks to the lessons learnt after the Three Mile Islandaccident that the standards and rules set by Nuclear Regulatory Commission led to substantialreductions in the risk of unplanned outages
Chapter 4 85
These improvements have also allowed nuclear regulators to set stricter safety standards
because with the PRA updates have revealed that the marginal benefit of safety care is
higher than their initial expectations
432 Regret robustness approach
The second criterion that we use in this paper is known as the regret robustness approach
or min-max regret criterion In economic literature this approach can be compared with
that taken byLinhart and Radner (1989)
In our setting the min-max regret criterion means that the regulatorrsquos objective is to
minimize the maximum difference between the objective function and its best possible
value In other words the regulator wants to identify the value of βreg for which it can
make the largest mistake (in terms of social costs) and then choose the regulatory policy
s qc(s) that minimizes the costs on that particular case
Intuitively we can say that there are two types of mistake that the regulator will regret
The first type of error arises when it sets a standard higher than the optimal one (s gt slowast)
because it selects a high value of βreg when the real β is low In this case the standard
is not only too costly but also ineffective to reduce the probability of accident
The second type of error arises when the regulator sets a low safety standard In this case
the regulator selects a low βreg for instance like in the worst-case approach (βreg = β)
when in reality safety care can significantly reduce the probability of a serious accident
(ie high real value of β) In this case the inefficiency arises because the marginal
cost of increasing safety care is lower than the marginal benefit In addition society is
unnecessarily exposed to a greater risk of major nuclear accident
To solve this problem the regulator proceeds in several steps First for each βreg isin[β β
]it determines the optimal policy slowast(βreg) qc(slowast(βreg) βreg) and then computes
EClowast(βreg) which corresponds to the minimum expected social costs for each βreg This
minimum expected cost function is given by following equation
EClowast(βreg) = c(slowast(βreg)
)+(αminus βregslowast(βreg)
)D +
(1minus α+ βregs
lowast(βreg))qc(s
lowast(βreg) βreg)m
(415)
Second it considers all the possible compliance-inducing policies s qc(s β) for all the
possible values of β that also belongs to[β β
] Here it is important to note that the
probability of inspection which induces compliance to a certain standard s will change
Chapter 4 86
according to the value of β that the regulator thinks is the real one Here we have denoted
by β the value that the regulator uses to compute the compliance-inducing policy which
might differ from the real one The expected cost function for these compliance-inducing
policies is given by
EC(s qc(s β) βreg) = c(s) + (αminus βregs)D + (1minus α+ βregs)qc(s β)m (416)
In the next step the regulator computes the regret function denoted byR(s qc(s β) βreg)
to measure the gap between these two last equations and determine the values of βreg
and β that maximize this difference Finally it selects the regulatory policy that mini-
mizes the costs in that particular case The problem that the regulator solves under the
regret robustness approach is the following
mins
supβreg β
R(s qc(s β) βreg) = EC(s qc(s β) βreg)minus EClowast(βreg)
st βreg β isin[β β
] (417)
Note that when β = βreg the regret will be minimized by setting the optimal policy
slowast(βreg) qc(slowast(βreg) βreg) (ie the regret will be zero)
If we differentiate the regret function with respect to β and βreg we obtain the following
partR(s qc(s β) βreg
partβ= (1minus α+ βregs)m
partqc(s β)
partβlt 0 (418)
partR(s qc(s β) βreg)
partβreg=D[slowast(βreg)minus s]minusm[slowast(βreg)qc(s
lowast(βreg) βreg)minus sqc(s β)]
minus (1minus α+ βregslowast(βreg))m
partqcpartβreg
(419)
The sign of the derivate with respect to β is negative and indicates as we have already
seen in the worst-case approach that the highest expected costs are reached when safety
care is not effective in reducing the probability of accident which means a low value for
β In our case this means that β = β
The sign of the derivate of the regret function with respect to βreg will depend on the
mistake that the regulator makes When it is very optimistic and thinks that the real
β is very high the standard it sets may be greater than the optimal one (ie error
Chapter 4 87
type 1) If this error predominates the first term will be negative and given the high
magnitude of D we could argue that the derivative is negative In that case the regret
robustness problem boils down to the worst-case approach because the biggest mistake
that the regulator will regret varies inversely with the value of βreg therefore the value
that maximizes the regret will be β
However when the regulator wants to avoid setting a standard lower than the optimal
one (slowast(βreg) gt s) it will focus on a case in which the derivative in Equation (419) is
positive Therefore when a type 2 error predominates the mistake that the regulator
will regret the most is having set a policy under the assumption that safety care is
not effective in reducing the probability of an accident (β = β) when in reality it is
(βreg = β)
We now study the regulatory policy that minimizes the regret function in this last
scenario ie with values of βreg = β and β = β The optimal standard when applying
regret robustness is denoted by (srr) and satisfies the following first order condition
cprime(srr)minus βD + βqc(srr β)m+ (1minus α+ βsrr)mpartqc(srr β)
parts= 0 (420)
In the worst-case approach the optimal safety standard which we denoted by swc satisfies
the same first order condition given in Equation (420) but the regulator does not
consider the possibility of error therefore instead of β we have β as follows
cprime(swc)minus βD + βqc(swc β)m+ (1minus α+ βswc)mpartqc(swc β)
parts= 0 (421)
Taking these two first order conditions we could conclude that the optimal standard
that a safety regulator will set taking a regret robustness approach is stricter than the
one it would set when adopting a worst-case scenario but lower than the one that it
would set when assuming that it does not make mistakes ie both βreg = β = β In
Figure (42) we plot the difference between srr and swc as well the standard that the
regulator would set under this ldquobest scenariordquo (βreg = β = β) and is denoted by sβ9
Although at first glance the regulatory policy under regret robustness seems better than
the worst-case approach it is important to point out that this regulatory policy also has
its drawbacks In this case there is a risk of non-compliance if the real value of β is low
enough Remember that the operator compares the net benefit of complying with the
expected penalty if it does not comply but unlike the regulator it knows the true value
9 In this numerical example we consider again a quadratic cost function and the following value forthe parameters D = 2 γ = 06 β = 08β = 088 α = 1 and F0 = 02
Chapter 4 88
Figure 42 Difference in the safety standards set taking worst-case and regret ro-bustness approaches
of β Thus when the marginal benefit of safety care for the firm is low (ie low β) a
regulatory policy that entails a high standard makes non-compliance more attractive
The risk of non-compliance highlights the potential drawbacks that a nuclear safety
regulator has to deal with when applying regret robustness criterion This issue becomes
more relevant when the interval in which β should lie is wide Contrary to the worst-
case criterion where only the level of β is important to define the maximum acceptable
probability of an accident when taking a regret robustness approach the regulator is
concerned with the length of the interval This is because the wider the interval the
more likely it is that the regulator will set standards that nuclear operators will not
comply with Hence it is not possible for a regulator to completely ensure that the
maximum probability of an accident is αminus βsrr
This latter issue is particularly relevant when the regulator has to set an uniform safety
policy for a heterogeneous nuclear fleet If we consider k nuclear operators each of which
is characterized by a different βk isin [β β] Under the worst-case approach the regulator
can be sure that all operators will comply because the standard is determined by the
least efficient operator (β)
With the regulatory policy set under regret robustness srr qc(srr) it is possible to
determine a marginal operator which is indifferent to whether it complies with the
Chapter 4 89
standard or not If we denote the efficiency of reducing the probably of an accident by
this marginal operator when applying the regret robustness with β we can argue that for
the operators that are less efficient than this marginal operator (ie βk lt β) is optimal
not to comply with the standard
44 Conclusion
We have developed a model to study the effect of uncertainty regarding the probability
of nuclear accident when a regulator has to set a safety standard subject to both moral
hazard and limited liability Our motivation is to take into account two of the main
features that nuclear power safety regulators have to deal with First the difficulty of
properly identifying how safety care impacts the probability of a major nuclear accident
Second the fact that nuclear regulators will always want to enforce safety standards that
induce compliance
This last feature steams from the fact that safety regulators have to assure society that
nuclear reactors operate below a certain acceptable risk level that should be attainable
if the operators comply with safety standards In addition we can expect that due to
the huge damages that a major accident might provoke laxity will not only increase
the risk of nuclear accident but will also harm the credibility and reputation of safety
agencies as seen with the latest nuclear accident in Japan
In our model the regulator controls the operatorrsquos safety care level by imposing a stan-
dard Since it is not able to observe operatorrsquos action the regulator also randomly
inspects nuclear facilities and is able to threaten the operator with a fine in case of
non-compliance To deal with the fact that the regulator does not perfectly know how
safety care translates into a lower probability of accident we use an imprecise probability
approach Using this methodology we assume that the regulator can define an interval
within which the parameters that define the probability of accident should lie We use
two robust optimization techniques ie worst-case scenario and regret robustness to
solve the regulatorrsquos problem and compare the results with a benchmark case in which
the regulator is perfectly informed
In the worst-case scenario the regulator sets a safety standard under the assumption
that operatorrsquos safety care is not effective in reducing the probability of an accident In
the terms of our model this assumption means that the regulator takes the lower bound
of the interval to set the regulatory policy this is represented by βreg = β Because
the expected damages of a major nuclear accident are huge by taking this value the
expected social costs reach their maximum value
Chapter 4 90
Our result suggests that the worst case regulatory policy will imply the enforcement of
the less stringent safety standard In addition we show that for a given standard the
regulator will inspect more often than it should to induce compliance These features
arise because the regulator believes that operatorsrsquo behavior is not effective in reducing
the probability of accident thus the safety standard will not be high Simultaneously
it means that the regulator believes that the expected benefits of safety care are not
big enough incentive to deter non-compliance which is why its optimal solution is to
increase the expected penalty by increasing the monitoring probability
Although the worst-case safety standard will not be as strict as when the regulator is
perfectly informed this by no means implies that the regulator will be lax When a
regulator believes that the real β is low some ways it is placing more emphasis on the
inherent risk of the technology that on the hazards that might arise during the operation
In consequence the regulator could be stricter in ex ante licensing and design rules In
terms of our model this means that the regulatory emphasis might be done in α rather
than in β
Complementary work and an interesting future research path would be to add a previous
stage to this model in which α is determined by a nuclear vendor and it then it subject
to some uncertainty for both the regulator and operator
In our second approach known as regret robustness the regulator seeks to determine a
policy that minimizes the largest error that it might make This means that it attempts
to find the value of the unknown parameter that maximizes the difference between the
expected social costs and its optimal value We find that the mistake that the regulator
will regret the most arises when it believes that safety care is not effective to reduce the
probability of accident (β = β) but in reality it is In terms of our model this means
that βreg = β
Taking this approach the safety standard will be stricter than that of the worst-case
standard and lower than the standard the regulator would set in a case in where it does
not consider the possibility of being wrong Although this is an intermediary solution
the drawback of the policy chosen under regret robustness is that it might induce non-
compliance for the most inefficient operators (those with a low β) This last result
provides yet another warning of once again about the difficulty of enforcing strict safety
standards not only because of moral hazard but also due to technological uncertainty
We think that it is possible to consider these two approaches as alternatives to achieve
a given acceptable risk level goal usually expressed in terms of the probability of a
major nuclear accident The first way would be to use the worst-case approach to set
the safety standard which although less stringent would be easier to enforce (in terms
Chapter 4 91
of frequency of inspection) In addition to ensure that the operators function below the
fixed threshold regulators could require a high ex ante level of safety features (low α)
as a condition to granting a license
The second possibility is to focus in on operation of the reactor In this case the
regulator can use the regret robustness safety standard which is more stringent and
requires a more frequent inspections but it allows it to tolerate a lower ex ante safety
level (higher α)
In fact if we look at how nuclear safety has been assessed by regulators we can com-
pare these two ways of achieving a given acceptable risk with the deterministic and
probabilistic safety approaches respectively In the former the emphasis is done on the
nuclear power plantrsquos design The deterministic approachrsquos main goal is to ensure that
within the conception of the unit various situations are considered to be plausible and
taken into account to ensure the containment of radioactive materials In the latter the
emphasis is on the operating stages The goal of the probabilistic approach is to identify
and analyze every possible situation and sequence of events that might result in a major
nuclear accident during the operation
We argue that these two approaches have acted as complements rather than substitutes
throughout the history of nuclear power for civil use In the first stages of development
nuclear regulatorsrsquo uncertainty was considerable For this reason they focused their
attention on the design and construction to ensure high ex ante safety levels but they set
conservative safety standards (as in the worst-case approach) As they gained knowledge
on how safety care can reduce the probability of accidents they were able to increase
safety standards In parallel technological progress has made it possible to achieve
better ex ante safety levels allowed safety regulators to set lower acceptable risk levels
and focus their attention on the operatorrsquos behavior and setting stricter safety standards
(as in the regret robustness approach)
Improvements in PRA techniques provide a good example of how these two approaches
have been complementary for nuclear regulators In our framework this would be rep-
resented by a continuous increase in the lower bound of β If nuclear regulators set
safety standards using a worst-case approach our model predicts that this improved
knowledge of the effectiveness of nuclear operatorsrsquo behavior in reducing the risk of acci-
dent will make it possible to enforce stricter standards However although we consider
that new designs achieve good ex ante safety levels it is possible that safety goals in
terms of accident probability also become stricter which makes it more effective for the
regulator to turn its attention to the operation of nuclear reactors This means that it
can set stricter safety standards (use regret robustness) to achieve the new acceptable
risk levels
Chapter 4 92
Despite the simplicity of our framework it highlights the pros and cons of the two main
approaches in nuclear power safety regulation and allows us to conclude that regulatory
policies subject to uncertainty on how safety care can reduce the probability of a major
accident will always entail a residual risk for society If a safety regulator adopts a worst-
case approach it will be able to assure that nuclear facilities operate below a certain risk
level attainable with the compliance of safety standards However the safety standard
might not be as strict as it could be in which case society bears the risk of enforcing low
safety standards when it could be possible to attain a higher level If on the contrary
the regulator takes a regret robustness approach standards will be stricter However it
will not be possible to guarantee that all nuclear facilities comply with it In this case
society has to bear the risks associated with the safety level chosen by operators that
decide not yo comply with the safety standards
Chapter 5
General Conclusion
This PhD thesis analyzed some of the challenges for nuclear power development that
were raised after the latest nuclear accident at Fukushima Dai-ichi power plant In
particular we have focused our attention on two issues that have a direct impact on
nuclear power competitiveness construction costs and safety regulation The concerns
about the possibility of building a new nuclear power plant at reasonable cost were
exacerbated after the accident inasmuch as it might induce extra costs in new reactors
Additionally the importance of setting stricter safety standards reemerged after it was
knew that the japanese safety regulator had information about the possibility of tsunamis
of the magnitude seen on March 2011 The reactions of both nuclear industry and nuclear
safety regulators to these issues will determine the future of nuclear power if these
reactions are correct they will allow the materialization of the nuclear renaissance if
not they will prevent an increase of nuclear power share in the worldrsquos energy production
Given this context the main objective of this dissertation was to provide answers to
the following questions how to properly estimate the probability of a major nuclear
accident which are the main determinants of the construction costs of a new nuclear
reactor and finally how nuclear regulatory agencies set safety standards given that the
link between safety care and the likelihood of a major nuclear accident is uncertain In
this thesis we have used actual data about the construction costs lead-times technolog-
ical choices and innovation coming from the two largest nuclear fleets in the world US
and France Additionally we have taken into account in our analysis the specificities
of a major nuclear accident to be able to give more accurate answers to the previous
questions
Undoubtedly the development of nuclear power in the world will depend predominantly
on how the industry is able to curb the cost escalation than has been seen as inherent to
this technology In consequence the results of this dissertation in terms of construction
93
Chapter 5 94
costs will allow us to identify which are the elements that enhance nuclear competitive-
ness either because they induce costs reductions or because they avoid delays during
the construction In addition they will be useful to explain what we could expect in
terms of cost and lead-times from the current reactors under construction given the
technological and industrial choices that have been made Finally they will allow us to
give some policy recommendations for those countries that have envisioned to construct
nuclear reactors in the near future
In parallel the further development of nuclear power will also depend on how safety
authorities are able to determine an accepted social risk level without harming the
profitability of nuclear operators or jeopardizing the inhabitants surrounding the nuclear
facilities The first step to set this objective is to properly assess the probability of a
major nuclear accident The second step towards this objective is that nuclear regulators
set safety standards in a cost-effective way In particular nuclear regulators must take
into account the uncertainty that exists between safety care and the probability of a
major accident The results of this dissertation in terms of safety regulation will be useful
to understand the trade-off underlying different regulatory approaches and determine
which is the best way to cope with the uncertainty regarding major nuclear accidents
The analysis in this PhD thesis is particularly important for those countries that are
interested in continuing or embarking upon nuclear power programs Within the western
context nuclear power is called to play an important role in energy transition to a
decarbonized electricity supply and reduce the dependence on fossil fuels Countries like
the United States the United Kingdom Poland and France contemplate nuclear power
within their future energy mix Moreover the most promising region for nuclear power
deployment is in the east of the globe In particular in countries with growing energy
demand and ambitious nuclear programs like China India Russia and Turkey
51 Conclusion about Construction Costs
Reducing the technological variety of the nuclear fleet by limiting the models that can
be installed is key to improve nuclear power competitiveness Our results showed that
the standardization of the French nuclear fleet was successful in curbing the construction
costs contrary to what happened in the construction of the US nuclear fleet We found
that building the same type of reactor repeatedly would allow to reduce the costs of the
last units of a given series According to our model in Chapter 3 we might expect that
the costs for the second unit of a reactor model built by the same firm would be reduced
in 10 to a 12
Chapter 5 95
This first result is particularly important for those countries that have conceived signif-
icant additions in nuclear capacity by building a high number of reactors Given that
the construction of a nuclear power plant depends largely on on-site and reactor char-
acteristics reducing the technological variety and construct multi-unit sites will mean
that a new reactor can be built without any design or site modifications and thus it
is possible to avoid the additional costs related with them In addition a standardized
nuclear fleet might reduce the probability of incidentals during the construction that
lead to delays and cost overruns Finally building the same type of reactor could induce
cost reductions thanks to the possibility of buying components in a larger scale
In the light of this result we can expect that Chinese nuclear fleet that nowadays
relies on the construction of several CPR-1000 reactors will be successful in terms of
progressively reducing the construction cost of this model This might be also what we
can expect to see in India where the nuclear fleet that is currently under construction
consists in 4 reactors of the same design (ie PHWR-700) We can also expect that the
costs of the new reactors in South Korea decrease in particular for the latest APR-1400
reactors that will be built
In the UK the situation might be different The potential cost reductions in the nuclear
fleet would be conditional to the result of the first project at Hinkley Point C We could
expect that if this project meet the initial budget and schedule and if it is decided to
continue with the EPR at Sizewell C in Suffolk the costs of these reactors will be less
than the previous However it is yet to be seen if this first experience with the EPR does
not repeat the cost overruns and delays in the construction as in Finland and France
The second lesson learnt from the construction of the US and French nuclear fleet is that
there existed positive and significant economies of scale This means that constructing
larger reactors might be a way to reduce the costs per MWe The results of Chapter
3 suggested that even if the construction of bigger reactors meant an increase in the
construction periods in average we could expect that an increase of 10 in the capacity
installed would reduce construction costs by 45 This result solved the impossibility
of testing economies of scale by using only the cost data coming from the French nuclear
fleet as we highlighted in Chapter 2
For countries with growing energy demand it is possible that constructing large reac-
tors will allow to supply much of the demand while allowing some cost reductions per
MWe installed and without taking a large space (contrary to wind farms for instance)
However as we have mentioned in Chapter 2 reducing the capacity of nuclear reactors
could be one of elements to rethink nuclear industry In fact we consider that the devel-
opment of small modular reactors might foster nuclear development in other countries
that have not yet considered it within their energy agendas either because they have
Chapter 5 96
lower energy demand or because they have restricted budgets In this sense smaller
reactors could have shorter construction schedules lower capital costs and the potential
of further savings due to off-site module fabrication
Our third important result highlighted the importance of meeting the construction sched-
ules as an effective way to curb the cost escalation Regarding this result we identified
different factors that explain why the construction periods in US and France have been
so lengthy The first explanation is linked to changes in the installed technologies We
have found that cumulated experience in other designs had a negative impact on the
lead-times that ended up raising the construction costs This result shows that the ex-
perience in the construction of other reactor models is not directly transferable to all
the projects hence it is likely to expect lengthy construction periods when a new design
is installed
We also have found that the increments in the lead-times in the construction of the US
and French fleet were partially due to the effect of the two major nuclear accidents
Three Mile Island and Chernoblyl This last result warns of the possible effects that
Fukushima Dai-ichi might have had in the reactors under construction We will have to
wait until they are finished to see if it is possible to link the potential delays during the
construction with a stricter supervision or new safety requirements due to the latest
major accident in Japan
All these factors that were key to understand the increase in the lead-times in the US
and France can also be used to explain why the construction of the EPR in Europe
has had continuos delays Given that the EPR is a new design a first of a kind
the experience that AREVA or EDF had in the construction of other models is not
directly transferable to this new project therefore it is likely that incidentals during the
construction translates into delays In addition we may explain the lengthy construction
period of the EPR as a result of its capacity (ie 1650 MWe ) We find that bigger
reactors take longer periods to be built for this reason it is likely to expect that it takes
more time to construct this design than its predecessor (N4 model 1500 MWe) The
first N4 model constructed in France took approximately 12 years
Our results also indicated that an homogenous nuclear fleet besides allowing cost reduc-
tions in the long run (ie after building repeatedly the same reactor) it might also have
some benefits in the short term through reductions in the lead-time For this reason we
are convinced that a standardization strategy enhances the competitiveness of nuclear
power in two ways As we mention at the beginning it allows costs savings through
learning by doing at the firm level But in addition it tends to reduce the construction
lead-times and therefore the construction costs in the short term
Chapter 5 97
In fact these results are also helpful to explain the first delays observed in the construc-
tion of the AP-1000 and EPR reactors in China China has based their nuclear program
around their CPR-1000 reactor and so far it has a good record in terms of construction
lead-times (4 years in average) However recently they decided to install Generation
III+ reactors by building four AP1000 reactors at Sanmen and Haiyang and two EPR
at Taishan Both construction projects have delays 18-30 months in the former and
13-15 months in the latter1 In the light of our results we can argue that part of the
increase in the construction lead-times is a result of a less homogeneous nuclear fleet
under construction
The last and perhaps the most important result in terms of construction costs that we
have found is that innovation has not improved nuclear power competitiveness Tech-
nological change in nuclear power has not induced reductions in the amount of capital
needed to build a new reactor On the contrary we found that it was one of the main
drivers of the cost escalation This result represents a major challenge for nuclear power
development given that it goes in the opposite direction with the pattern observed in
other energy technologies where technical progress has contributed to reduce their in-
vestment costs This trend has been registered in competing carbon-free technologies
like wind power and photovoltaics
This last result might partially be explained by the fact that the requirements of nuclear
safety authorities have pushed nuclear vendors to innovate in order to achieve better
safety performance in the existing reactors In Chapter 2 we found some evidence that
suggested that reactors with better safety indicators in terms of lower unexpected events
that might lead to a serious accident were related with higher construction costs These
results lead us to conclude that the latest reactors although more expensive have also
embodied safety improvements aiming to reduce risks of major accident
Taking into account the above we can argue that one of the possible reasons to explain
why the EPR is such expensive is precisely because it embodies some innovations that
allow it to achieve higher safety levels inter alia In fact AREVA promotes this design
saying that it is an upgrade in nuclear technology (ie Generation III+) precisely due
to the level of safety that it guarantees According to the vendor the EPR has an
expected core melt down frequency less than 1 event each one million reactor years
The trade-off between the benefits of standardization and those related with technolog-
ical change is of paramount importance for nuclear power development We started this
section arguing that standardization leads to lower construction costs hence it is key
for nuclear power competitiveness However we have also found that new designs have
better safety features This means that to adopt a new technology it is necessary to do
1 See Schneider and Froggatt (2014)
Chapter 5 98
a cost benefit analysis to see whether it is reasonable to invest in a better reactor in
terms of a reduced risk of accident or if instead the gain in safety does not worth the
increase in the costs and therefore it is better to keep on using the established technol-
ogy In this sense we can conclude that complementarily to a standardization strategy
countries interested in nuclear power have to consider within their programs which will
be the optimal pace of technological change
After studying the history of the construction of the US and French nuclear fleet we can
say that the relation between the economics of safety and nuclear innovation constitutes
the most challenging issue for nuclear power industry On the one hand it is desirable
to minimize the risk of a nuclear disaster as much as possible in particular after seeing
the terrible consequences of Fukushima Dai-ichi core melts But on the other hand
innovations have to be done without threatening nuclear power competitiveness In
summary we consider that nuclear industry should make innovation efforts not only to
increase safety performance but also in allowing to reduce the capital costs needed to
construct a new nuclear reactor
52 Conclusion about Safety Regulation
In terms of safety regulation our model in Chapter 4 highlighted the trade-off linked with
the adoption of both a deterministic and a probabilistic approach to regulate nuclear
facilities In some sense the deterministic approach focus in design of the unit as a
way to achieve a given accepted risk level This alternative can be related to our worst
case approach in which the regulator is not optimistic in how the operatorrsquos behavior
can reduce the probability of an accident Under this assumption the regulator will
fix the less stringent safety standard and monitor more often Given that he believes
that safety care is not so effective in reducing the probability of accident he thinks that
expected benefits of safety care are not a enough incentive to deter no compliance that
is the reason why he finds optimal to increase the monitoring probability
On the contrary the probabilistic approach focus the regulatory effort on the operatorrsquos
behavior Here the regulator believes that safety care during the operation of the
reactor is very effective to reduce the probability of a major nuclear accident In terms
of our model this approach is similar to the regret robustness criterion In this case
the regulator seeks to find a policy that minimizes the largest error that he can make
We found that if the safety authority sets the regulatory policy under this approach the
standard will be stricter compared with the the worst case standard but it will be less
strict than the one that the regulator will set in the case in which he does not consider
the possibility of being wrong
Chapter 5 99
Even though the safety standard obtained under regret robustness is more stringent
and might allow to achieve a better safety level it is important to remark that it might
induce no compliance of the less efficient operators This last result warns once again
about the difficulty of enforcing strict safety standards not only due to the problem of
moral hazard but also because technological uncertainty
From an static point of view the model that we have developed to study how to set
safety standards for nuclear operators captures both the pros and cons of the two main
approaches that have been used so far in the history of nuclear power The main
conclusion is that setting standards under the uncertainty on how safety care can reduce
the probability of major accident will always entail a residual risk for the society Under
the worst-case approach the society bears the risk associated with the difference between
the less efficient operator and the safety level provided by the standard If the regulator
prefers a regret robustness approach the standard will be stricter however it will no be
possible to guarantee that all the nuclear facilities comply with it Here the society has
to bear the risk associated with the difference between the safety level chosen by the
operators that decide to not comply and the safety standard
Up to this point it is important to recognize that our model is very simple and do not
pretend to capture all the features that a nuclear regulator has to face when setting
safety standards For instance we have reduced the operator effort to provide safety to
one dimension when it is multidimensional In the sense that nuclear operators perform
many tasks to achieve a given safety care level In addition we have assume that the
regulator can not observe the safety care level selected by the operator when it might
be possible that some of the standards are more easy to verify than others Given that
the multidimensionality and degree of observability of safety care may have an impact
on the regulatory policy these elements could represent possible extensions of our basic
model
Another important caveat of our model is that it is static therefore we can not conclude
anything about the transition of the regulatory process If this model is extended to
introduce dynamics in the way in which nuclear regulator set safety standards it might
be possible to determine when it is optimal to change from a deterministic approach
to a probabilistic one In fact if we revise the history of nuclear safety regulation
we can claim that roughly these two approaches have been complements rather than
substitutes The transition of the emphasis given to these approaches have changed to
the extent that the regulator has gained better knowledge about how safety care reduces
the probability of an accident
In the inception of nuclear industry (for civil uses) the uncertainties for regulators were
huge As a result they focused their attention in establishing safety rules related with
Chapter 5 100
the design and construction but they set conservative standards for the operation (as
in the worst case approach) Progressively they got better knowledge of how safety
care affects the probability of nuclear accidents For instance after the core melt down
in Three Mile island that was due to a mistake during the operation the US Nuclear
Regulatory Commission decided to carry out PRAs in nuclear reactors in order to detect
how nuclear operators could prevent events that lead to a serious accident The results
of the PRAs and their continuous improvements have given to nuclear operators precious
information about how to reduce the risk of a major accident In consequence they were
able to set stricter safety standards
In parallel new reactors have been installed As we have observed in the US and
French nuclear fleet (Chapters 2 and 3) new reactors have embodied innovations aiming
to achieve better safety performance This means that technological progress made it
possible to achieve better ex ante safety levels allowing safety regulators to set even lower
acceptable risk levels and translate their attention to the performance of the nuclear
operators through the adoption of stricter safety standards (as in regret robustness
approach)
It is clear that the complementary transition from a worst case to a regret robustness
approach is strongly related with technological progress Once again the relation be-
tween nuclear safety and innovation pops up as a cornerstone for nuclear power As we
mentioned in the previous section this relation was relevant to understand the cost es-
calation in the construction both in of US and French nuclear fleet It might be possible
that due to the increase on the safety performance of new reactors nuclear regulators
have been able to set stricter safety standards and pursue even lower accepted risks
levels However the impact of technological progress in nuclear safety regulation was
not studied in our model what makes this subject a potential area for further research
Appendix A
Cour des Comptes Actual
Construction Costs for the French
Nuclear Fleet
Table A1 Data from the Cour des Comptes report
Pair of units Capacity MW Year Type Overnight Cost (Me2010MW)
Palier 900 MW
Fessenheim12 1780 1978 CP0 0836Bugey23 1840 1979 CP0 0886Bugey45 1800 1979 CP0 0899
Damprierre12 1800 1980 CP1 1217Gravelines12 1840 1980 CP1 0822Tricastin12 1840 1980 CP1 1188Blayais12 1830 1982 CP1 1110
Dampierre34 1800 1981 CP1 1172Gravelines34 1840 1981 CP1 0856Tricastin34 1840 1981 CP1 1247Blayais34 1820 1983 CP1 0890
Gravelines56 1820 1985 CP1 1093SaintLaurent 12 1760 1983 CP2 1120
Chinon 12 1740 1984 CP2 1148Cruas12 1760 1984 CP2 1119Cruas34 1760 1984 CP2 1253
Chinon34 1760 1987 CP2 0978
Palier 1300 MW
Paluel12 2580 1985 P4 1531Paluel34 2580 1986 P4 1157
St Alban12 2600 1986 P4 1129Flamanville12 2580 1987 P4 1287Cattenom12 2565 1987 Prsquo4 1358Belleville12 2620 1988 Prsquo4 1083Cattenom34 2600 1991 Prsquo4 1149
Nogent12 2620 1988 Prsquo4 1194Glofech12 2620 1992 Prsquo4 1305Penly12 2660 1991 Prsquo4 1227
Palier 1450 MW
Chooz12 2910 2000 N4 1635Civaux12 2945 2002 N4 1251
101
Appendix B
Linear models for the
Construction Costs
In this Appendix we show the estimation results as well as the VIF for different speci-
fications of the linear regression model shown in Equation 1 The models that we have
estimated are the following
bull Model 2
ln(Ci) = α0 + α1 ln(Capi) + α2EXPIi + α3EXPPi + α4EXPTi + ui (B1)
bull Model 3
ln(Ci) = γ0 + γ1 ln(Capi) + γ2EXPPi + γ3EXPTi + ui (B2)
bull Model 4
ln(Ci) = θ0 + θ1EXPIi + θ2EXPPi + θ3EXPTi + ui (B3)
Table B1 Estimates for Model 2
Coefficients Estimate Std Error t value Pr(gt |t|)(Intercept) 5474 8444 0648 0523Ln Cap -0732 1125 -0650 0522EXPI 0013 0011 1193 0245EXPP -0008 0013 -0667 0511EXPT -0003 0008 -0386 0703
102
Chapter 5 103
Table B2 VIF for Model 2
Ln Cap EXPI EXPP EXPT73161 58620 20917 1794
Table B3 Estimates for Model 3
Coefficients Estimate Std Error t value Pr(gt |t|)(Intercept) -4502 1155 -3896 0001 Ln Cap 0598 0148 4032 0001 EXPP 0006 0003 1661 0109EXPT -0007 0007 -1027 0314
Table B4 VIF for Model 3
Ln Cap EXPP EXPT1257 1692 1429
Table B5 Estimates for Model 4
Coefficients Estimate Std Error t value Pr(gt |t|)(Intercept) -0017 0060 -0291 0773EXPI 0006 0001 4236 2e-04 EXPP -0001 0003 -0152 0880EXPT -0005 0007 -0768 0449
Table B6 VIF for Model 4
EXPI EXPP EXPT1003 1432 1432
Appendix C
Alternative model specifications
Table C1 Alternative model specifications
Model 5 Model 6Cost Lead-time Cost Lead-time
HHIMo 1249 -0400 0247 -0444 (0490) (0141) (0481) (0185)
lnExpArqMo -0153 0005(0041) (0011)
lnExpArqNoMo 0028 0024 (0035) (0009)
lnExpNoArqMo 00461 0014(0041) (0011)
lnExpNoArqNoMo -0095 0152 (0103) (0017)
InvExpArqMo 0335 -0025(0067) (0027)
InvExpArqNoMo -0097 -0007(0080) (0032)
InvExpNoArqMo -0150 -0016(0079) (0032)
InvExpNoArqNoMo 0181 -0337 (0245) (0076)
lnKnow 1291 (0598)
lnCap -0839 0117 -0609 0174 (0221) (0050) (0182) (0061)
lnNPPUC 0498 -0101 0318 -0040(0182) (0043) (0105) (0040)
ArqUtility -0255 -0008 -0292 0024(0096) (0027) (0087) (0034)
lnEDem -1202 -1467 (0108) (0125)
lnLT 2270 1133 (0820) (0686)
lnCement 0392 0003(0538) (0359)
lnLabour -2020 -0710(1365) (0808)
TmiUS -0055 0292 0075 0300 (0197) (0041) (0177) (0049)
TmiFR -0001 -0053 -0184 -0004(0252) (0071) (0223) (0089)
CH -0107 0053 -0051 0053(0140) (0030) (0122) (0036)
Constant 7841 -2220 -3776 -3056 (4597) (0428) (5726) (0507)
Country FE Yes Yes Yes YesCountry specific trend + trend2 Yes Yes No NoTrend + trend2 No No Yes YesObs 128 128 128 128Adj R2 0823 0960 0873 0940
104
Appendix D
Alternative model specifications
for lead-time
Table D1 Alternative model specifications for lead-time in OECD countries
(1) (2)Variables (lnLT ) (lnLT )
HHIMo -0509 -0458 (0189) (0200)
lnCap 0225 0240 (0051) (0052)
lnExpArqMo -0010(0031)
lnExpArqNoMo 00411 (0013)
lnExpNoArqMo 00141(0018)
lnExpNoArqNoMo 0080 (0041)
InvExpArqMo 00514(0111)
InvExpArqNoMo 0003(0032)
InvExpNoArqMo 0009(0048)
InvExpNoArqNoMo -0238(0163)
lnEDem -17010 -21240 (3857) (3387)
TmiAbroad 0126 0124 (0066) (0069)
TmiUS 0432 0448 (0060) (0062)
CH 0214 0214 (0029) (0027)
Constant 2111 2542 (0450) (0576)
Country FE Yes YesTime FE Yes YesObs 286 286Adj R2 0876 0872Note Robust standard errors in parentheses
105
Appendix E
List of nuclear reactor models by
manufacturer in France and the
US
Table E1 List of nuclear reactor models by manufacturer in France and the US
Model Manufacturer Number of reactors built
B W (L-loop) DRYAMB BabcockWilcox 9BWR-3 General Electric 1BWR-41 General Electric 15BWR-42 General Electric 4BWR-5 General Electric 5BWR-6 General Electric 4
CE (2-loop) DRYAMB Combustion Engineering 13COMB CE80 DRYAMB Combustion Engineering 2
CP0 Areva 6CP1 Areva 18CP2 Areva 10N4 Areva 4P4 Areva 8Prsquo4 Areva 12
W (2-loop) DRYAMB Westinghouse 3W (3-loop) DRYAMB Westinghouse 8W (3-loop) DRYSUB Westinghouse 4W (4-loop) DRYAMB Westinghouse 21W (4-loop) DRYSUB Westinghouse 1W (4-loop) ICECND Westinghouse 9
Total 157
106
Appendix F
Operatorrsquos best response
Proof of proposition 1 The Lagrangian for the operator as long as e gt s is given by
L(e λ) = c(e) + (α minus βe)γD + λ(eminus s) and the Kuhn Tucker first order conditions are
the following
cprime(e)minus βγD + λ = 0 (F1)
λ(eminus s) gt 0 (eminus s) gt 0λ gt 0 (F2)
In case that λ = 0 then the firm overcomplies and e gt s and the best response of the
firm in this case satisfies
cprime(eps)minus βγD = 0
In case that λ = 0 thus e = s The first order condition is cprime(s)minus βγD 6 0
The Lagrangian for the operator when e 6 s is given by L(e micro) = c(e) + (αminus βe)γD +
(1minusα+βe)qF0 +micro(sminus e) and the Kuhn Tucker first order conditions are the following
cprime(e)minus βγD + βqF0 minus micro = 0 (F3)
micro(sminus e) gt 0 (sminus e) gt 0micro gt 0 (F4)
In case that micro gt 0 then the e = s and the best response of the firm in this case is to
comply with the standards and satisfies the following condition
107
Chapter 5 108
micro = cprime(s)minus βγD + βqF0 gt 0
Finally if micro = 0 then the firm do not comply e lt s and the best response of the firm in
this case satisfies
cprime(n)minus βγD + βqF0 = 0
As long as c(s) + (αminus βs)γD gt c(n) + (αminus βn)γD + (1minus α+ βn)qF0
Bibliography
Arguedas C (2008) lsquoTo comply or not to comply pollution standard setting under
costly monitoring and sanctioningrsquo Environmental and Resource Economics 41 155ndash
168
Aven T and Hiriart Y (2013) lsquoRobust optimization in relation to a basic safety
investment modelrsquo Safety Science 55 188ndash194
Aven T and Reniers G (2013) lsquoHow to define and interpret a probability in a risk
and safety settingrsquo Safety Science 51 223ndash231
Becker G (1968) lsquoCrime and punishment an economic approachrsquo Journal of Political
Economy 76 169ndash217
Bernardo J and Smith A (1994) Bayesian Theory John Wiley and Sons
Berthelemy M (2012a) Innovation learning by doing opportunities and nuclear reac-
torsrsquo performance Unpublished manuscript
Berthelemy M (2012b) What drives innovation in nuclear power technologies an
empirical study based in patent counts Unpublished manuscript
Brandt P and Williams J (1998) Modeling time series count data A state-space
approach to event counts
Brandt P and Williams J (2000) lsquoDynamic modeling for persistent event count time
seriesrsquo American Journal of Political Science 44 823ndash843
C Yu W v S and Alsema E (2011) lsquoUnraveling the photovoltaic technology learn-
ing curve by incorporation of input price changes and scale effectsrsquo Renewable and
Sustainable Energy Reviews 15 324337
Cantor R and Hewlett J (1988) lsquoThe economics of nuclear power Further evidence
on learning economics of scale and regulatory effectsrsquo The Bell Journal of Economics
13 297ndash310
109
Bibliography 110
Carlin B and Louis T A (2000) Empirical Bayes Methods for Data Analysis Chap-
man and Hall
Cochran T (2011) Fukushima nuclear disaster and its implications for US nuclear
power reactors
Cohen M (1998) Monitoring and enforcement of environmental policy
Cooper M (2010) Policy challenges of nuclear reactor construction cost escalation and
crowding out alternatives Unpublished manuscript
Cooper M (2012) Nuclear safety and nuclear economics Unpublished manuscript
David P Maude-Griffin R and Rothwell G (1996) lsquoLearning by accident reductions
in the risk of unplanned outages in us nuclear power plants after three mile islandrsquo
Journal of Risk and Uncertainty 13 175ndash198
David P and Rothwell G (1996) lsquoStandardization diversity and learning Strategies
for the coevolution if technology and industrial capacityrsquo International Journal of
Industrial Organization 14 181ndash201
des Comptes C (2012) Les couts de la filiere electronucleaire Technical report Cour
des Comptes
Edenhofer B K M P H K F J O and Bruckner T (2012) Germanys nuclear
phase-out Impacts on electricity prices co2 emissions and on europe
EPRI (2008) Safety and operational benefits of risk-informed initiatives Technical re-
port Electric Power Research Institute
Erickson P K J and Drennen T (2006) lsquoTechnological learning and renewable energy
costs implications for us renewable energy policyrsquo Energy Policy 34 1645ndash1658
Escobar-Rangel L and Leveque F (2012) Revisiting the cost escalation curse of nuclear
power New lessons from the french experience Unpublished manuscript
Fifield P and Sinclair (2002) lsquoMacroeconomic factors and share returns an analysis
using emerging market datarsquo International Journal of Finance amp Economics 7 51ndash62
Filmer D and Pritchett L (2001) lsquoEstimating wealth effects without expenditure data
or tears An application to educational enrollments in states of indiarsquo Demography
38 115ndash132
Finon D (2012) Lrsquoeconomie du nucleeaire revisitee Unpublished manuscript
Finon D and Staropoli C (2001) lsquoInstitutional and technological co-evolution in the
french electronuclear industryrsquo Industry amp Innovation 8 179ndash199
Bibliography 111
Gilboa I and Schmeidler D (1989) lsquoMaxmin expected utility with non-unique priorrsquo
Journal of Mathematical Economics 18 141ndash153
Goldemberg J (2009) lsquoNuclear energy in developing countriesrsquo Daedalus 138 71ndash80
Greenpeace (2013) Greenpeace statement and briefing 21 october 2013
available at httpwwwgreenpeaceorgukmediapress-releases
hinkley-c-greenpeace-statement-and-briefing-20131021 Technical report
Greenpeace
Grubler A (2010) lsquoThe cost of the french nuclear scale-up A case of negative learning
by doingrsquo Energy Policy 38 5174ndash5188
Gundersen A (2012) Lesson from fukushima Technical report Greenpeace
Hansson I and Skogh G (1987) lsquoMoral hazard and safety regulationrsquo The Geneva
Papers on Risk and Insurance 12 132ndash144
Harvey A and Fernandes C (1989) lsquoTime series models for count or qualitative ob-
servationsrsquo Journal of Business and Economic Statistics 7 407ndash417
Harvey A and Shepard N (1993) lsquoStructural time series modelsrsquo Handbook of Statis-
tics 11 261ndash301
Hiriart Y and Martimort D (2004) lsquoEnvironmental risk regulation and liability under
adverse selection and moral hazardrsquo IDEI Working Papers 256
Hiriart Y Martimort D and Pouyet J (2004) lsquoOn the optimal use of ex ante regu-
lation and ex post liabilityrsquo Economics Letters 84 231ndash235
Hiriart Y Martimort D and Pouyet J (2006) lsquoThe regulator and the judge The
optimal mix in the control of environmental riskrsquo Revue drsquoeconomie politique 06 941ndash
967
Hofert M and Wuthrich M (2011) Statistical review of nuclear power accidents
Hotelling H (1933) lsquoAnalysis of a complex of statistical variables into principal com-
ponentsrsquo Journal of Educational Psychology 24 417ndash441
IEA (2010) Projected costs of generating electricity 2010 edition Technical report
IEA
Isoarda S and Soria A (2001) lsquoTechnical change dynamics evidence from the emerg-
ing renewable energy technologiesrsquo Energy Economics 23 619ndash636
Jamasb T (2006) Technical change theory and learning curves Patterns of progress
in energy technologies Unpublished manuscript
Bibliography 112
Joskow P and Parsons J (2009) lsquoThe economic future of nuclear powerrsquo Daedalus
138 45ndash59
Kadak A and Matsuo T (2007) lsquoThe nuclear industryrsquos transition to risk-informed
regulation and operation in the united statesrsquo Reliability Engineering and System
Safety 29 609ndash618
Kessides I (2012) lsquoThe future of the nuclear industry reconsidered Risk uncertainties
and continued promisersquo Energy Policy 48 185ndash208
Kolstad C Ulen T and Johnson G (1990) lsquoEx post liability for harm vs ex ante
safety regulation Substitutes or complementsrsquo The American Economic Review
80 888ndash901
Komanoff C (1981) Power Plant Cost Escalation Nuclear and Coal Cost Regulation
and Economics Van Nostrand Reinhold Publishing
Koomey J and Hultman N (2007) lsquoA reactor-level analysis if busbar cost for the us
nuclear plants 1970-2005rsquo Energy Policy 35 5630ndash5642
Krautmann A and Solow J (1988) lsquoEconomies of scale in nuclear power generationrsquo
Southern Economic Journal 55 70ndash85
Larsen G K A M K and Sundqvist T (2005) lsquoThe impact of rampd on innovation
for wind energy in denmark germany and the united kingdomrsquo Ecological Economics
54 227ndash71
Leveque F (2013) Nucleaire OnOff Analyse economique drsquoun pari DUNOD
Lindman A and Soderholm P (2012) lsquoWind power learning rates a conceptual review
and meta-analysisrsquo Energy Economics pp 754ndash761
Linhart P and Radner R (1989) lsquoMinmax-regret strategies for bargaining over several
variablesrsquo Journal of Economic Theory 48 152ndash178
MacKerron G (2004) lsquoNuclear power and the characteristics of rsquoordinarinessrsquo - the case
of uk energy policyrsquo Energy Policy 32 19571965
Martin Junginger W v S and Faaij A (2010) Technological learning in the energy
sector Edward Elgar Publishing
McCabe M (1996) lsquoPrincipals agents and the learning curve The case of steam-
electric power plant design and constructionrsquo The Journal of Industrial Economics
XLIV 357ndash375
Bibliography 113
NEA (2000) Reduction of capital costs of nuclear power plants Technical report Nu-
clear Energy Agency
Nuttall W J (2005) Nuclear Renaissance Technologies and Policies for the Future of
Nuclear Power Taylor and Francis Group
Parsons J and Du Y (2003) The future of nuclear power Technical report MIT
Parsons J and Du Y (2009) Update on the cost of nuclear power Technical report
MIT
Pearson K (1901) lsquoOn lines and planes of closest fit to systems of points in spacersquo
Philosophical Magazine 2 559ndash572
Peri G (2005) lsquoDeterminants of knowledge flows and their effect on innovationrsquo The
Review of Economics and Statistics 87 308ndash322
Phillip Lipscy K K and Incerti T (2013) lsquoThe fukushima disaster and japans nuclear
plant vulnerability in comparative perspectiversquo Environmental Science and Technol-
ogy 47 6082ndash6088
Roche B (2004) The french nuclear program Edfrsquos experience Technical report EDF
Generation and Engeenering
Rosner R and Goldberg S (2011a) Analysis of gw-scale overnight capital cost Tech-
nical report The University of Chicago
Rosner R and Goldberg S (2011b) Small modular reactors - key to future nuclear
power generation in the us Unpublished manuscript
Rothwell G (1986) lsquoSteam-electric scale economies and construction lead timesrsquo Cal-
Tech working paper 63
Rothwell G and Ganda F (2014) Electricity generating portfolios with small modular
reactors Unpublished manuscript
Schneider M and Froggatt A (2014) World nuclear industry status report 2014 Tech-
nical report Mycle Schneider Consulting Project
Shavell S (1984) lsquoA model of the optimal use of liability and safety regulationrsquo Rand
Journal of Economics 15 271ndash280
Strand J (1994) lsquoEnvironmental accidents under moral hazard and limited firm liabil-
ityrsquo Environmental and Resource Economics 4 495ndash509
Tour F N I (2012) Investigation committee on the accident at fukushima nuclear
power stations Technical report Fukushima NPS Inspection Tour
Bibliography 114
Wang Q Chen X and Yi-chong X (2013) lsquoAccident like the fukushima unlikely in a
country with effective nuclear regulation Literature review and proposed guidelinesrsquo
Renewable and Sustainable Energy Reviews 17 126ndash146
WEC (2012) World energy perspective Nuclear energy one year after fukushima Tech-
nical report World Energy Council
Zanella S C F and Mixon F (2000) lsquoIs economic freedom one dimensional a fac-
tor analysis of some common measures of economic freedomrsquo Journal of Economic
Development 25 17ndash40
Zimmerman M (1982) lsquoLearning effects and the commercialization of new technologies
The case of nuclear powerrsquo The Bell Journal of Economics 13 297ndash310
LrsquoEacuteconomie de lrsquoEacutenergie Nucleacuteaire Coucircts des Construction et Reacutegulation de la Sucircreteacute
RESUME Cette thegravese eacutetudie le rocircle des coucircts de construction et de reacuteglementation de la seacutecuriteacute
sur la compeacutetitiviteacute de leacutenergie nucleacuteaire Lanalyse des coucircts de construction est baseacutee sur
lutilisation de donneacutees reacuteelles provenant des parcs nucleacuteaires franccedilais et ameacutericains En particulier
nous eacutetudions diffeacuterents canaux agrave partir de laquelle des reacuteductions de coucircts pourraient survenir
Nous montrons que la normalisation est un critegravere crucial pour la compeacutetitiviteacute eacuteconomique de
leacutenergie nucleacuteaire dabord parce que les effets dapprentissage positifs sont conditionnels agrave la
technologie ce qui signifie que les reacuteductions de coucircts ne peuvent venir que si le mecircme type de
reacuteacteur est construit agrave plusieurs reprises mais aussi parce quelle permet de reacuteduire le coucirct
indirectement par lintermeacutediaire courts deacutelais de construction Dans lanalyse du rocircle de
reacuteglementation de la seacutecuriteacute nous eacutevaluons dabord leffet de la derniegravere accident nucleacuteaire majeur
(c-agrave Fukushima Dai-ichi) de la probabiliteacute de survenance dun tel eacuteveacutenement puis les effets de
lincertitude concernant la faccedilon dont les soins de la seacutecuriteacute agrave reacuteduire le probabiliteacute dun accident
nucleacuteaire dans leacutetablissement de normes de seacutecuriteacute en vertu de laleacutea moral et responsabiliteacute
limiteacutee Nous constatons que la norme sera la moins stricte lorsque le reacutegulateur adopte une
approche pire des cas et plus stricte lorsque le reacutegulateur adopte lapproche de la robustesse de
regret et il est optimiste quant agrave lefficaciteacute des soins de la seacutecuriteacute pour reacuteduire le risque daccident
Toutefois cette norme pourrait induire le non-respect par les opeacuterateurs les moins efficaces
Mots cleacutes Eacutenergie nucleacuteaire coucircts de construction effets dapprentissage reacutegulation de la sucircreteacute risque moral optimisation robuste
Economics of Nuclear Power Construction Costs and Safety Regulation
ABSTRACT This thesis studies the role of construction costs and safety regulation on nuclear
powers competitiveness The analysis of construction costs is based on the use of actual data
coming from the American and French nuclear fleets In particular we study different channels from
which cost reductions might arise We show that standardization is a crucial criterion for the
economic competitiveness of nuclear power first because the positive learning effects are
conditional to the technology this means that cost reductions will arise only if the same type of
reactor is built several times but also because it allows to reduce the cost indirectly through shorter
construction lead-times In the analysis of the role of safety regulation we first assess the effect of
the latest major nuclear accident (ie Fukushima Dai-ichi) in the probability of occurrence of such an
event and then the effects of the uncertainty regarding how safety care reduce the probability of a
nuclear accident in setting safety standards under moral hazard and limited liability We find that the
standard will be the less strict when the regulator adopt a worst-case approach and stricter when the
regulator adopts the regret robustness approach and it is optimistic about safety care effectiveness to
reduce the risk of an accident However this standard might induce non-compliance by the least
efficient operators
Keywords Nuclear power construction costs learning effects safety regulation moral hazard robust optimization
- Abstract
- Acknowledgements
- Preface
- List of Figures
- List of Tables
- General Introduction
-
- 01 Context
- 02 The risks of nuclear power and the probability of major accident
- 03 The cost escalation curse in the construction of new nuclear power plants
- 04 Nuclear safety regulation
- 05 Methodological approach structure and contribution of this thesis
-
- 1 How Fukushima Dai-ichi core meltdown changed the probability of nuclear accidents
-
- 11 Introduction
- 12 Literature review
- 13 How to properly estimate the expected frequency of a nuclear accident using theoretical probability and past observations
- 14 Poisson Exponentially Weighted Average (PEWMA) model
-
- 141 PEWMA Results
- 142 Arrival rate estimates from 1952 to 2012
-
- 15 Conclusion
-
- 2 Revisiting the cost escalation curse of nuclear power New lessons from the French experience
-
- 21 Introduction
- 22 Data and Model
-
- 221 French construction cost escalation
-
- 23 Results
- 24 Conclusion and Policy Implications
-
- 3 Nuclear reactors construction costs The role of lead-time standardization and technological progress
-
- 31 Introduction
-
- 311 Toward a nuclear renaissance
- 312 Existing literature on nuclear power plants construction costs and lead-times
- 313 The contributions of this paper to the economic literature and the nuclear energy policy debate
-
- 32 Model main hypothesis about learning opportunities and data
-
- 321 Model for construction costs and lead-times in nuclear power
-
- 3211 Hypotheses on the role reactors design standardization
- 3212 Hypotheses on learning by doing
- 3213 Hypotheses on leaning by searching
-
- 322 Data
-
- 33 Model specifications and results France versus the US
-
- 331 Model specifications
- 332 Results
-
- 34 Nuclear reactors lead-time Insights from other OECD countries
-
- 341 Data and Model
-
- 35 Conclusion
-
- 351 Policy implications for nuclear new-build programs
- 352 Paths for future research
-
- 4 Setting optimal safety standards for nuclear operators subject to uncertainty moral hazard and limited liability
-
- 41 Introduction
- 42 The Model
-
- 421 Benchmark The regulator knows
-
- 43 Imprecise probabilities and robust optimization
-
- 431 Worst-case approach
- 432 Regret robustness approach
-
- 44 Conclusion
-
- 5 General Conclusion
-
- 51 Conclusion about Construction Costs
- 52 Conclusion about Safety Regulation
-
- A Cour des Comptes Actual Construction Costs for the French Nuclear Fleet
- B Linear models for the Construction Costs
- C Alternative model specifications
- D Alternative model specifications for lead-time
- E List of nuclear reactor models by manufacturer in France and the US
- F Operators best response
- Bibliography
-

MINES PARIS TECH
Economics of Nuclear Power
Construction costs and Safety
Regulation
by
Lina Escobar Rangel
A thesis submitted in partial fulfillment for the
degree of Doctor of Philosophy in Economics
in the
CERNA - Center for Industrial Economics
May 2015
ldquoThere are things known and there are things unknown and in between are the doors of
perceptionrdquo
Aldous Huxley
MINES PARIS TECH
Abstract
CERNA - Center for Industrial Economics
Doctor of Philosophy in Economics
by Lina Escobar Rangel
This thesis studies the role of the construction costs and safety regulation on nuclear
power competitiveness The analysis of the construction costs is based on the use of the
actual data coming from the american and french nuclear fleet In particular we study
different channels from which cost reductions might arise We show that standardization
is a key criterion for the economic competitiveness of nuclear power first because the
positive learning effects are conditional to the technology this means that cost reductions
will arise only if the same type of reactor is built several times but also because it allows
to reduce the cost indirectly through shorter construction lead-times In the analysis of
the role of safety regulation we first asses the effect of the latest major nuclear accident
(ie Fukushima Dai-ichi) in the probability of occurrence of such an event and then the
effects of the uncertainty regarding how safety care reduce the probability of a nuclear
accident in setting safety standards under moral hazard and limited liability We find
that the standard will be stricter when the regulator is optimistic in the safety care
effectiveness to reduce the risk of an accident but simultaneously this policy might
induce no compliance of the most inefficient operators
Acknowledgements
I would like to express my gratitude to my supervisor Professor Francois Leveque whose
expertise added considerably to my graduate experience He has guided me over these
three years rigorously and patiently I would like to thank for his constant interest in
my work and for encourage me throughout my thesis
Besides my advisor I would like to thank other senior members of Center for Industrial
Economics (CERNA) in particular to Yann Meniere for the assistance and advices he
provided to me during the doctoral workshop Likewise I would also want to thank
Pierre Fleckinger for his comments and suggestions that were key to write the last
chapter of this thesis
I must also acknowledge Sesaria Ferreira for her assistance with all the administrative
procedures but also for helping supporting and listening to me in particular when
things went wrong
I thank my fellow colleagues in CERNA Michel Berthelemy Justus Baron Marine
Lefort Damien Dussaux Charlene Cosandier and more recently Carlotta Mariotto
Jiekai Zhang and Btissam El Bahraoui for their useful comments in the doctoral work-
shop but specially for making these years an enriching and pleasant experience
I would also like to thank my colombian friends who became my family and were the
most precious company here in Paris Diego Milanes Paula Arias Fabio Dominguez
John Mauro Perdomo Hernan Perez and David Espinosa
Last but not the least I would like to thank my family my lovely parents Jairo and
Esperanza my sister Daniela and my brother Oscar for their love their words and
unconditional support I dedicate this thesis to them
iii
Preface
This PhD thesis is embedded in a research program called The new economics of nuclear
energy directed by Francois Leveque and financially supported by Electricite de France
EDF This project aimed to study the challenges of nuclear energy through an economic
perspective focusing on three research axes innovation competitiveness and industrial
organization This thesis tacked the second issue by studying the construction costs and
nuclear safety regulation This document presents four papers that have been presented
in seminars and conferences The opinions expressed in this document do not necessarily
coincide with those of EDF
Chapter 1 is entitled How Fukushima Dai-ichi core meltdown changed the probability of
nuclear accidents and was co-written with Francois Leveque This paper was presented
in the seminar organized by the Finance for Energy Market Research Center FIME
at the Institut Poincare in Paris (22 March 2013) at the 20th EAERE conference in
Toulouse France (26-29 June 2013) and was accepted and published in Safety Science
Volume 64 on April 2014
Chapter 2 Revisiting the Cost Escalation Curse of Nuclear Power New Lessons from
the French Experience also co written with Francois Leveque was submitted and is
currently under revision to be published in Economics of Energy and Environmental
Policy This paper was presented at the Conference of Energy Markets organized by
Toulouse School of Economics in Toulouse France (17-18 January 2013) and afterwards
at the IAEE International Conference held in Daegu South Korea (16-17 June 2013)
Chapter 3 Nuclear reactorsrsquo construction costs The role of lead-time standardization
and technological progress is co-authored with Michel Berthelemy This paper has been
presented in the Seminaire de recherches en economie de lrsquoenergie held in Paris France
(12 February 2014) in the Environmental Economics Lunch Seminar organized by Paris
School of Economics (6 March 2014) the International WPNE Workshop on Project and
Logistics Management in Nuclear New Build organized by the OECD Nuclear Energy
Agency (NEA) in Paris France (11 March 2014) the 3rd Mannheim Energy Conference
(May 5-6 2014) and the IAEE International Conference held in New York US (16-18
June 2014) This paper was accepted to be published in Energy Policy
Chapter 4 is called Setting optimal safety standards for nuclear operators subject to un-
certainty moral hazard and limited liability at the moment it has not been yet presented
in any conference
iv
Contents
Abstract ii
Acknowledgements iii
Preface iv
List of Figures viii
List of Tables ix
General Introduction x
01 Context x
02 The risks of nuclear power and the probability of major accident xii
03 The cost escalation curse in the construction of new nuclear power plants xiii
04 Nuclear safety regulation xv
05 Methodological approach structure and contribution of this thesis xviii
1 How Fukushima Dai-ichi core meltdown changed the probability ofnuclear accidents 1
11 Introduction 1
12 Literature review 2
13 How to properly estimate the expected frequency of a nuclear accidentusing theoretical probability and past observations 4
131 Data 5
132 Models 8
14 Poisson Exponentially Weighted Average (PEWMA) model 14
141 PEWMA Results 16
142 Arrival rate estimates from 1952 to 2012 17
15 Conclusion 19
2 Revisiting the cost escalation curse of nuclear power New lessonsfrom the French experience 21
21 Introduction 21
22 Data and Model 28
221 French construction cost escalation 28
222 Model and data 30
v
Contents vi
223 Multicollinearity and Principal Component approach 33
23 Results 36
24 Conclusion and Policy Implications 40
3 Nuclear reactorsrsquo construction costs The role of lead-time standard-ization and technological progress 43
31 Introduction 43
311 Toward a nuclear renaissance 43
312 Existing literature on nuclear power plants construction costs andlead-times 45
313 The contributions of this paper to the economic literature and thenuclear energy policy debate 47
32 Model main hypothesis about learning opportunities and data 48
321 Model for construction costs and lead-times in nuclear power 48
3211 Hypotheses on the role reactorrsquos design standardization 50
3212 Hypotheses on learning by doing 50
3213 Hypotheses on leaning by searching 51
322 Data 52
33 Model specifications and results France versus the US 56
331 Model specifications 56
332 Results 57
34 Nuclear reactors lead-time Insights from other OECD countries 61
341 Data and Model 62
35 Conclusion 64
351 Policy implications for nuclear new-build programs 65
352 Paths for future research 67
4 Setting optimal safety standards for nuclear operators subject to un-certainty moral hazard and limited liability 69
41 Introduction 69
42 The Model 74
421 Benchmark The regulator knows β 78
43 Imprecise probabilities and robust optimization 82
431 Worst-case approach 82
432 Regret robustness approach 85
44 Conclusion 89
5 General Conclusion 93
51 Conclusion about Construction Costs 94
52 Conclusion about Safety Regulation 98
A Cour des Comptes Actual Construction Costs for the French NuclearFleet 101
B Linear models for the Construction Costs 102
C Alternative model specifications 104
Contents vii
D Alternative model specifications for lead-time 105
E List of nuclear reactor models by manufacturer in France and the US106
F Operatorrsquos best response 107
Bibliography 109
List of Figures
11 Core Damage Frequency Industry Average Trend 3
12 International Nuclear and Radiological Event Scale 5
13 Major nuclear accidents reactors and operating experience 1955-2011 7
14 Histogram for nuclear accidents 1952-2011 8
15 Cumulate frequency (AccidentsReactorYears) for nuclear accidents 1952-2011 8
16 Bayesian updating with Poisson-Gamma model 12
17 Poisson-Gamma vs PEWMA for CMD 18
21 Overnight costs for the US Nuclear Fleet e 2010MW 24
22 Evolution of French Nuclear Power Fleet by palier 29
23 Grubler vs Cour de Comptes construction costs 30
24 Cour de Comptes construction cost by palier and type 31
25 Labor cost index (ICHT) and Price index for France =100 in 1973 33
31 Nuclear reactorsrsquo overnight construction costs in the US and France 53
32 Nuclear reactorsrsquoconstruction lead-time in the US and France 54
33 Nuclear reactorsrsquo construction lead-time in OCDE countries 63
41 Operatorrsquos best response to different regulatory policies (sq) 79
42 Difference in the safety standards set taking worst-case and regret robust-ness approaches 88
viii
List of Tables
11 INES Events 6
12 Poisson with constant arrival rate (1952-2011) 10
13 Poisson with deterministic time trend 13
14 PEWMA Estimates for Prior a=1 b=3500 17
15 Test for reduction to Poisson H0 ω = 1 17
16 Summary of results 19
21 First Generation of French Reactors 28
22 Descriptive statistics 34
23 Correlation Matrix 34
24 Linear regression estimates 35
25 VIF for explanatory variables 35
26 Loadings and roots 36
27 Principal Component Regression Results 37
31 Descriptive statistics 55
32 Estimation output of Equations (31) and (32) 58
33 Estimation output of Equations (31) and (32) 59
34 Mean for the explanatory variables 62
35 Regression results for lead-time with experience and the HHI index 64
A1 Data from the Cour des Comptes report 101
B1 Estimates for Model 2 102
B2 VIF for Model 2 103
B3 Estimates for Model 3 103
B4 VIF for Model 3 103
B5 Estimates for Model 4 103
B6 VIF for Model 4 103
C1 Alternative model specifications 104
D1 Alternative model specifications for lead-time in OECD countries 105
E1 List of nuclear reactor models by manufacturer in France and the US 106
ix
General Introduction
01 Context
On March 11 2011 the coast of Tohuku the region located at the northeast of Japanrsquos
main island was devastated by a series of tsunami waves resulting after a 90 earthquake
This disaster affected several reactors in different nuclear power stations on the Pacific
coast Fukushima Dai-ichi was the most impaired nuclear plant four of its six units
were severely damaged and three reactors suffered core meltdowns followed by massive
releases of radioactive material outside their containment structures Undoubtedly this
has been one of the most severe accidents in the history of nuclear power for civil uses
Briefly the timeline of the events that lead to the core melt at Fukushima Dai-ichi
happened as follows after the earthquake reactors 1 to 3 shouted down automatically
following the japanese safety protocols The emergency generators were activated to
power the cooling systems in order to keep below the melting point the fission products
that were in the fuel rods The tsunami 14 meters waves arrived 50 minutes after the
earthquake and overpassed the unitrsquos sea walls which had 101 meters only The sea
water flooded the room where the emergency generators were located and they failed
to power the cooling systems Once the batteries of the active cooling systems ran out
the reactors began to heat up As workers struggled to supply power to the reactorsrsquo
cooling systems and control rooms multiple hydrogen-air chemical explosions occurred
from 12 March to 15 March
As soon as the images of this terrible catastrophe were broadcasted worldwide they
revived the memories of the core melt at Chernobyl in Ukraine in 1986 and materialized
the hazards associated with the operation of a nuclear power plant After the accident
the reactions from both the nuclear industry and anti-nuclear groups were swift As
expected this accident deepened the divergence in their views regarding the role that
nuclear power can play in the worldrsquos energy production But beyond the passionate
1 For further details of the affected reactors hit by the earthquake and tsunami see Phillip Lipscyand Incerti (2013)
x
General Introduction xi
views of these groups the debate following after Fukushima Dai-ichi accident raised
important issues that put into question the convenience of nuclear power both in safety
and economical terms
Paradoxically Fukushima Dai-ichi accident happened in a period when after a long
time prospects of nuclear deployment were positives Throughout the 90s the con-
struction of new reactors had stagnated and the progressive aging of the fleet worldwide
seemed to indicate the inevitable narrowing of nuclear powerrsquos share in the worldrsquos en-
ergy production However since about 2001 the interest for nuclear power revived In
fact the term nuclear renaissance appeared in the energy policy debate because many
countries gave an important role to nuclear power in their agendas with projections
for new build similar to or even exceeding those of the early years of nuclear power
For instance before the accident occurred 159 reactors were planned to be constructed
around the world (WEC 2012) which would have meant an addition of 178123 MWe
(ie 47 of the present capacity)
The renewed interest in nuclear power was not fortuitous on the contrary it appeared as
a solution to multiples concerns The high oil prices registered in 2000 and the fact that
much of the oil and gas production is located in politically unstable countries recalled
the importance of reducing the dependence of fossil fuels and secure the energy supply
Given that nuclear power uses an abundant mineral (uranium) in the earthrsquos crust made
it attractive from an energy security standpoint In addition the growing awareness of
the possible damages linked with climate change led to the implementation of different
policies aimed to reduce CO2 emissions Although most of the attention has been focused
in renewables it was acknowledge that nuclear power is the only technology that can
provide base load electricity without carbon emissions (See Nuttall (2005) Joskow and
Parsons (2009) Kessides (2012))
Unquestionably the accident meant a set back in terms of public perception about
nuclear safety and induced a revision of the forecast of nuclear power expansion in many
countries The clearest example of how this accident triggered the political pressure
against nuclear power was the decision to accelerate the nuclear phase-out in Germany
Just a couple of months after the accident the Chancellor Angela Merkel decided to
accelerate the phase-down and to move the shut down deadline to 2022 which reversed
the decision that was taken one year before when the life-time extension of nuclear
power up to 20382 was granted
This accident marked a breaking point in nuclear history however the effect of Fukushima
Dai-ichi in new nuclear builds is yet to be address According Power Reactor Informa-
tion System (PRIS) of the International Atomic Energy Agency (IAEA) 62 new reactors
2 See Edenhofer and Bruckner (2012)
General Introduction xii
were under construction in 2011 and in 2014 there are 72 reactors being built Although
this current level of new built is not as high as it was expected before the accident it
represents a record for nuclear industry and shows that public opinion is not the only
barrier that nuclear power faces today For the above the materialization of the nuclear
renaissance in those countries that still have a favorable opinion of nuclear power will
depend in some extent on the responses that nuclear industry gives to the issues and
challenges raised after this accident
02 The risks of nuclear power and the probability of major
accident
The first issue for nuclear power development reemerged right after the accident The
possibility of a core melt down and the harm that such an event might provoke is the
reason why nuclear power has been perceived as a latent hazard and has had to struggle
with public opposition in many countries At that moment perhaps one of the subjects
that raised more controversy in the public debate was how likely nuclear meltdowns could
occur Despite that this issue seems only a matter of applying a statistical formula after
Fukushima Dai-ichi supporters and opponents to nuclear power claimed diametrically
opposite things
On the one hand nuclear industry claimed that Fukushima Dai-ichi core melts were the
result of an unpredictable and very rare situation they argued that core melts are not
likely to occur and they claimed that new designs can resist natural events of similar
magnitude of those that hit Japan This point of view was supported with the results
of the Probabilistic Risk Assessments (PRA) that have been done in different reactors
around the world For instance the report EPRI (2008) estimated that the average core
melt frequency for the US nuclear fleet is equal to 20E-5 which means 1 core melt
every 50000 reactor years or equivalently 1 core melt each 1000 years for a fleet of 500
reactors in operation (today worldrsquos nuclear fleet has around 430 reactors in operation)
On the other hand nuclear opponents claimed that the observed frequency is higher
than the (theoretical) expected frequency coming from the PRAs Just dividing the
total number of operating hours of all civilian nuclear reactors around the world that
is approximately 14500 reactor-years by the number of nuclear reactor meltdowns that
have actually occurred (ie 4 nuclear meltdowns 1 at Chernobyl and 3 at Fukushima)
translates into one major accident every 3625 reactor years Which is substantially
greater than what the nuclear industry suggested
General Introduction xiii
In this context how to assess properly the probability of a major accident is an important
question for nuclear power development not only to clarify this debate but also because
it will allow a proper management of the risk This means that societies can be better
informed not only about the hazards that nuclear power entails but also on how likely
is that major accidents occur Nuclear regulators will be able to set attainable and
coherent goals in terms of the accepted risk level below which nuclear power plants
should operate In addition operators can allocate better the safety investments aiming
to reduce the probability of major accidents and finally it could also be helpful to
determine insurance policies
03 The cost escalation curse in the construction of new
nuclear power plants
The second concern raised after Fukushima Dai-ichi accident is related with the safety
investments that might have to be done to allow reactors under operation to resist
natural aggressions as those that impacted the Japanese nuclear fleet But even more
important for the future development of nuclear power are the consequences that this
accident might have in terms of construction costs for new reactors Investment costs
are the main driver3 of nuclear electricity generating costs thus any unexpected and
significant increase of the expenses on the construction will undermine the profitability
of a new build It is possible to think that the lessons learned after Fukushima Dai-ichi
may encourage nuclear vendors to include other safety features safety authorities might
impose stricter licencing rules and greater public opposition to installing new nuclear
power plants can result in an increase in the construction costs
The potential effect of Fukushima Dai-ichi in the costs of new reactors worsen the doubts
about the possibility of building nuclear power plants at a reasonable cost It is impor-
tant to mention that these concerns began to emerge before the accident due to the con-
tinuous revisions in the costs estimates for new reactors in the US Taking into account
the changes made by utilities in the application forms filled for the Nuclear Regulatory
Commission the cost expectation of an AP1000 reactor passed from US$2000 in 2003
(See Base case in Parsons and Du (2003)) to US$4000 per installed kilowatt in 2009
(See Parsons and Du (2009) and Rosner and Goldberg (2011a))
These concerns were also supported by the press releases announcing delays and im-
portant cost overruns in the construction of the first of a kind Generation III+ EPR4
3 According to the IEA (2010) the share of the capital costs in the leveled cost of electricity in nuclearpower is between 60 to 80
4 European Pressurized Reactor
General Introduction xiv
reactors in Europe In Finland the construction of Olkiluoto 3 started in 2005 and was
supposed to be ready in 2009 This delay will be by far failed the commercial operation
of this reactor was expected to be in 2016 The most recent news informed that it will
be in 20185 Regarding the construction costs of the EPR at Flamanville unit in France
the continuous increases in the costs make the situation alarming The first estimate was
e33 billion in 2005 and passed to e6 billion in 2011 The most recent press release in
2012 announced a total cost of e85 billion Not to mention that Flamanville 3 was ex-
pected to start commercial operation in 2013 but due to delays during the construction
is expected now to start up in 2016
As if this were not enough the doubts about nuclear power competitiveness were also
supported by what has been registered in construction of the US and French nuclear
fleet For the former it is possible to find a 7 times difference of the overnight cost6
expressed in Me(2010)MW and collected by Koomey and Hultman (2007) for the first
and last installed nuclear reactors For France Grubler (2010) found that the difference
between the construction costs of the units installed in 1974 and those constructed after
1990 is 35 times For all these reasons the escalation of the construction costs of new
reactors has been seen as a curse for nuclear industry
The economic literature about nuclear power construction cost has not provided a clear
cut answer to explain the main drivers of the new buildrsquos costs overruns and how is it
possible to reduce them Most of the studies have used primarily US construction costs
data due to the lack of comparable data coming from other countries therefore the re-
sults are restricted to the american case It is generally accepted that the heterogeneity of
the nuclear US fleet the longer lead-times that took to construct bigger reactors and the
closer regulatory monitoring after Three Mile Island accident (Zimmerman (1982)David
and Rothwell (1996) Rothwell (1986) Cantor and Hewlett (1988)McCabe (1996) and
Cooper (2012)) were the main elements that explain the substantial increase in the costs
per MWe installed
The cost assessment done by Grubler (2010) for the french nuclear fleet concluded that
although the French nuclear fleet was constructed under a centralized industrial structure
and it has a more homogenous nuclear fleet compared with the US fleet it suffered of
forgetting by doing Making allusion to the fact that while EDF accumulated experience
nuclear construction costs per unit of capacity have been increasing instead of decreasing
5 See httpwwwhelsinkitimesfifinlandfinland-newsdomestic
11836-olkiluoto-3-to-be-ready-in-2018html6 Overnight cost includes the investments linked with site preparation and construction but it ex-
cludes financing expenses Therefore it shows the cost of the plant as if it had been fully built inone night
General Introduction xv
In this context it has been argued that nuclear power is characterized by increasing
investment costs and it is inevitable to build a new reactor without cost overruns and
delays However in 2012 the actual construction costs for the French nuclear fleet were
published in the Cour des Comptes report and by using this new information it is
possible to find that the cost escalation computed by Grubler (2010)7 was not as severe
as argued In fact the ratio between the last and the first reactor installed in France
using Grublerrsquos estimates is 3 while by taking the actual construction costs is 14 This
difference suggests that there must be a way to curb the construction costs of nuclear
reactors Using the new information coming from the Cour des Comptes report is key
to identify which have been the factors that allowed to ease the cost escalation in the
construction of new nuclear power plants in France compared with what happened in
the US
Nowadays determine the main drivers of the construction costs of new reactors and
the possible sources of cost reductions is of paramount importance for nuclear industry
As mentioned before currently there are 72 reactors under construction in 14 different
countries8 this is quite an achievement for nuclear power given that level of new build
in 2014 has not been observed since 1987 It is likely that the success of the projects
under construction in terms of meeting the schedules and budgets will represent a
step towards the materialization of the nuclear renaissance because it will give a green
light for further deployment of nuclear power While if this projects repeat the errors
of the past this might lead investments to other competing energy technologies which
have shown decreasing costs For instance Lindman and Soderholm (2012) found that
the kW from onshore wind farms decreases by more than 10 each time the installed
capacity doubles In the same direction Isoarda and Soria (2001) and C Yu and Alsema
(2011) have identified significant learning effects in the photovoltaic industry result that
is confirmed by the dramatic reductions in the underlying costs and market prices of
solar panels in the last years
04 Nuclear safety regulation
One last issue that also came as a result of Fukushima Dai-ichi accident is the role of
safety regulation as an effective way to prevent these events As described above the
height of tsunami waves was the cause of the flood that made impossible to run the
emergency generators to cool down the reactors that eventually led to the core melts
7 The costs assessment done by Grubler (2010) did not use the actual construction costs but someestimations based on EDF financial statements
8 See the list published by the World Nuclear Association (WNA) httpworld-nuclearorg
NuclearDatabaserdresultsaspxid=27569ampExampleId=62
General Introduction xvi
Right after the accident it was somehow spread in the media that a tsunami of such
magnitude was a surprise and it was not predictable therefore the whole situation could
be considered as a black swan Nevertheless different nuclear safety experts carried out
investigations after the accident and discovered that the Japanese safety authority knew
that similar tsunamis had happened in the past and it was possible to witness them
again (see Gundersen (2012) Wang et al (2013))
This revelation harmed the reputation of the safety authority and the laxity of the
Japanese nuclear regulator is now seen as the main cause of this accident (Leveque
2013) Indeed the investigation showed that it was never required to Tokyo Electric
Power Company (TEPCO) the operator of Fukushima Dai-ichi to back fitted the sea
walls even if they knew that it was likely to observe a violent tsunami in that region
Today it is possible to argue that upgrading the unitrsquos sea walls would have been much
cheaper than the costs of damages that the accident has caused However before the
accident the investment decision was not as clear cut as it might be seen now First
because even if the regulator knew that a tsunami of that magnitude was possible still
its probability was very small Second because the potential damages in case of an
event like this were highly uncertain Finally because it is hard to measure how the
sea wallrsquos upgrade would have reduced the probability of this accident In consequence
before the accident the costs of upgrading the walls could have been seen as unnecessary
thus harmful for the profitability of the company
Taking into account the above it is clear that safety regulation aside from preventing
nuclear accidents also plays its role in the economics of nuclear power Safety authorities
are in charge of determining and enforcing the acceptable risk level at which nuclear
power plants should operate However to attain the envisioned risk levels they can not
demand the first thing that comes to mind First because it might not be effective
to reduce the probability of an accident and second because it might be too costly
In economics this tension simply means that the regulators will have to identify the
standards that allow to reduce the risk of major accident in a cost-efficient way In
other words they have to determine the optimal balance between the marginal private
costs of providing safety and the social marginal benefits of achieving that level of safety
Although this balance between the costs and benefits of providing safety is also present
in other sectors like transport food drugs etc nuclear safety authorities have to deal
with several particularities First the damages left after an accident are huge and
its consequences are long-lasting For instance the preliminary cost estimates of the
Fukushima Dai-ichi accident are around 250 billion USD Schneider and Froggatt (2014)
claimed that 11 municipalities in Fukushima Prefecture covering 235 km2 will have to
undertake decontamination efforts not to mention the costs related with all the people
General Introduction xvii
that had to be relocated after the accident In the literature Shavell (1984) Kolstad
et al (1990) and Hansson and Skogh (1987) showed that when the magnitude of the harm
is huge as is the case of nuclear accidents liability rules although they are necessary to
provide incentives to exert safety care are not enough to achieve sufficiently high safety
levels
Second nuclear safety regulators have to monitor that operators comply with the re-
quirements established in the safety standards due to the unobservability of their ac-
tion (although this is not specific for nuclear power) In the economic literature Strand
(1994) Hiriart and Martimort (2004) Hiriart et al (2004) inter alia have shown that
this information asymmetry (moral hazard) means that it is not possible to enforce the
first best safety level at zero cost Therefore the challenge for nuclear safety authorities
is to be able to define a policy that induce the compliance of the safety standard as the
operatorrsquos optimal response
Finally another problem present in nuclear safety regulation is the epistemic uncer-
tainty regarding the probability of a major accident but in particular how safety care
can reduce it Nuclear regulators have some statistical tools as the PRA to evaluate
how operatorrsquos safety care translates into reductionsincreases in the probability of an
accident however the results coming from these techniques are random variables with
unknown distribution functions This last feature means nuclear regulators do not have
a single and precise probability measure when setting the safety standards but instead
they have some partial information (ie an interval of values coming from the PRA)
about the link between safety care and the probability of an accident
How to set optimal safety standards in the presence of all the particularities mentioned
above is an important challenge for nuclear power development In the first place be-
cause safety authorities have to be able to guarantee that nuclear facilities run under
the accepted risk level Second because safety standards are an effective way to comple-
ment liability rules and achieve higher safety levels Finally because it is in the interest
of both the society and the operator to avoid the damages linked with major nuclear
accidents
05 Methodological approach structure and contribution
of this thesis
All the issues described before make nuclear power a passionate subject and pose re-
search questions that are far from dull Specifically in this thesis we will try to give an
answer from a positive perspective to the following questions how to assess properly
General Introduction xviii
the probability of a nuclear accident which are the determinants of the nuclear con-
struction costs and the possible sources of reductions and finally how to set optimal
safety standards in the nuclear power sector taking into account the particularities of
major nuclear accidents To answer to these questions this thesis is composed by four
chapters that aim to study rigorously these three issues in order to derive conclusions
that shed some light in current debate but also that allow us to predict to the possible
trends in nuclear power development and help to shape future energy policies
Chapter 1 is entitle How Fukushima Dai-ichi core meltdown changed the probability of
nuclear accidents and was co-authored with Francois Leveque This chapter investigates
how to compute the probability of a nuclear accident by using past observations But
in particular how the observation of the last catastrophe at the Fukushima Dai-ichi
nuclear power plant changed the expected frequency for such events In this chapter we
aimed to answer these questions by using historical data and testing different statistical
models We have compared four Poisson models using three different definitions of
nuclear accidents from 1952 to 2012
Our results allow us to conclude that as the definition of accident takes into account
other events (ie not only the major nuclear disasters but also less serious accidents)
the independence assumption underlying the classical Poisson models is violated This
result called for a time-varying mean model such as the Poisson Exponentially Weighted
Moving Average (PEWMA) By using this last model we find a greater increase in the
risk of a core meltdown accident owing to the accident that took place in Japan in 2011
than the estimates that we obtained using the classic Poisson models
Chapter 2 is entitle Revisiting the Cost Escalation Curse of Nuclear Power New Lessons
from the French Experience and it was also co-written with Francois Leveque This
chapter studies the so called cost escalation curse that has affected the construction
of new nuclear power plants ever since the completion of the first wave in 1970 to the
ongoing construction of Generation III+ reactors in Europe As we have mentioned this
phenomenon has been studied for the US and it has been argued that the escalation
can partially be explained by a heterogeneous nuclear fleet which has made it difficult to
learn from experience The French nuclear power program has followed a standardization
strategy however previous cost assessments have also pointed to an increase in the
capital costs This observation implied that even in the best economic conditions cost
escalation is inherent to nuclear power
In this chapter we reexamine the drivers of cost escalation in France based on con-
struction costs taken from a recent report by the Cour des Comptes Using this new
information we find that the cost escalation observed in previous studies was lower
than argued Our results indicate that the scale-up resulted in more costly reactors
General Introduction xix
however we were not able to disentangle the effect of the technological change embedded
on bigger reactors from the effect of the increase in the size In parallel we find positive
learning effects but they were restricted to the same type of reactors (ie the construc-
tion cost of decrease as the experience in the same type increases) Finally we find
that those reactors with better safety performance were also more expensive This last
result suggests that safety concerns have played a role in the cost escalation observed in
France
Chapter 3 Nuclear reactorsrsquo construction costs The role of lead-time standardization
and technological progress is co-authored with Michel Berthelemy and complements the
previous chapter by analyzing the nuclear reactor construction costs and lead-times in
France and the United States We estimate a regression model for both the overnight
costs and construction time In this chapter we test the presence of standardization
gains in the short term and long term The former might arise when the diversity of
nuclear reactorsrsquo technologies under construction is low and the latter might arise as the
result of learning by doing that in this context means the experience in the construc-
tion of the same type of reactor In addition we study the effect of innovation in the
construction of new reactors by using priority patent data as a proxy for technological
progress
We find that overnight construction costs benefit directly from learning by doing but the
spillovers were only significant for nuclear models built by the same firm In addition we
show that the standardization of nuclear reactors has an indirect and positive effect in
the short run through a reduction in lead-time the latter being one of the main drivers
of construction costs Conversely we also explore the possibility of learning by searching
and find that contrary to other energy technologies innovation leads to construction
costs increases
Chapter 4 is entitle Setting optimal safety standards for nuclear operators under uncer-
tainty moral hazard and limited liability It examines the features of an optimal safety
regulatory policy under uncertainty about how safety care reduces the probability of
accident moral hazard and limited liability The regulatory policy consists in setting
a safety standard and choose a probability of inspection to the nuclear facilities After
the inspection the regulator can impose a fine in case the nuclear operator did not
comply with the safety standard The main objective of this paper is to characterize the
optimal regulatory policy that induce compliance by the operator when the regulator
does not know perfectly how the safety care level will reduce the probability of a nuclear
accident To tackle this issue we use robust optimization techniques worst case and
regret robustness
General Introduction xx
Our results suggest that under the most conservative approach ie when the regulator
minimizes the maximum expected costs the regulatory policy will be less strict than
when he is better informed On the contrary when the regulator attempts to mini-
mize regret the safety standard might be stricter but it also increases the risk of no
compliance
Finally Chapter 5 concludes This chapter outlines the main results of this PhD thesis
and links them with the challenges that nuclear power faces today In short we claim
that the development of nuclear power in the world will depend predominantly on
how the industry is able to curb the cost escalation For this reason nuclear vendors
should direct their innovation efforts not only on achieving better safety performance
(as they have done so far) but also on reducing the construction costs Countries with
ambitious nuclear power programs should adopt a standardization strategy by reducing
the technologies to be installed but also they have to determine which will be the pace
of technological change Finally nuclear regulators should concentrate their efforts in
fostering better safety performance levels within the operators through stricter operating
standards once the reactors guarantee that they have reached an acceptable ex ante risk
level
Chapter 1
How Fukushima Dai-ichi core
meltdown changed the probability
of nuclear accidents
11 Introduction
The triple core meltdown at Fukushima Dai-ichi power plant on March 11 2011 is the
worst nuclear catastrophe after Chernobyl in 1986 The substantial losses of this accident
have aroused in the public opinion an old age debate Is nuclear power safe Critics claim
that nuclear power entails a latent threat to society and we are very likely to witness
an accident in the near future Proponents say that the conditions that provoked the
Fukushima disaster were unlikely assert that new reactors can successfully face extreme
conditions and conclude that the probability of a nuclear accident is very low
In the media this debate is far from be clear For instance two months after the
Fukushima Dai-ichi meltdown a French newspaper published an article1 saying that
the risk of a nuclear accident in Europe in the next thirty years is not unlikely but on
the contrary it is a certainty The authors claimed that in France the risk is near to
50 and more than 100 in Europe
Their striking result comes from dividing the number of reactor explosions (one in Cher-
nobyl and 3 in Fukushima Dai-ichi) over cumulated experience (14000 reactor-years)
and multiplying this ratio by the number of reactors and 30 years So if we take 58
operative reactors in France we get 049 and if we consider 143 reactors in Europe we
1 Benjamin Dessus and Bernard Laponche June 3 2011 available at httpwwwliberationfr
politiques01012341150-accident-nucleaire-une-certitude-statistique
1
Chapter 1 2
obtain 122 hence their conclusion that a nuclear accident is a certainty in the European
Union
Although their methodology is essentially flawed since the figures they found are larger
than 1 the estimated frequency of a major accident reported by nuclear industry is not
very convincing neither According to a report issued by EPRI (2008) the probabilistic
risk assessment for the US nuclear fleet estimates an average expected rate of core
meltdown of the order of 20E-5 This figure means that in average we can expect one
accident per 50000 reactor years which seems quite optimistic with respect to what has
been observed in the history of nuclear power As of today one accounts approximately
14500 operating years of nuclear reactors and 10 core meltdowns This implies an
observed frequency of 1 accident per 1450 reactor years which is a higher rate than
what is predicted by the probabilistic risk assessments (PRA hereafter)
From this debate we can conclude that assessing properly the probability of a nuclear
accident with available data is key to shed light in the risks that nuclear power will entail
on tomorrow For this reason the main objective of our paper is to discuss different
statistical approaches to estimate the expected frequency of nuclear accidents Our
results suggest that although the Poisson model is the most used for addressing this
problem it is not suitable when the independence assumption is violated In such cases
a time-varying mean model like a Poisson Exponentially Weighted Moving Average
(PEWMA) is more suitable to estimate the expected frequency of core meltdown
The remainder of this paper is structured as follows Section 12 outlines the literature
about nuclear risk assessment Section 13 investigates how to estimate the expected
frequency and compute the probability of a nuclear accident using successively a fre-
quentist and a Bayesian approach Section 14 presents the PEWMA model and its
results Section 15 concludes
12 Literature review
It is possible to distinguish two approaches to assess the probability of nuclear accidents
PRA models and statistical analysis PRA models describe how nuclear reactor systems
will respond to different initiating events that can induce a core meltdown after a se-
quence of successive failures This methodology estimates the core damage frequency
Chapter 1 3
(CDF hereafter)2 based on observed and assumed probability distributions for the dif-
ferent parameters included in the model
The use of PRA in commercial reactors is a common practice in the US because the
results are a key input for the risk-based nuclear safety regulation approach (Kadak and
Matsuo 2007) The Nuclear Regulatory Commission (NRC hereafter) has been doing
PRA studies since 1975 when the so-called WASH-1400 was carried out This first
study estimated a CDF equal to 5E-05 and suggested an upper bound of 3E-04
The lessons from Three Mile Island accident and the ensuing improvements in PRA
techniques allowed the NRC to perform a PRA for 5 units in 1990 the average CDF
found was 891E-05 In 1997 the NRC published the Individual Plant Examination
Program NUREG-1560 which contains the CDFs for all the 108 commercial nuclear
power plants in the US
The latest EPRI (2008) report about the US nuclear fleet pointed out that this met-
ric has shown a decreasing trend from 1992 to 2005 (see Figure 1) due to safety en-
hancements that have induced significant reductions in the risk of core melt down As
mentioned before it claimed that the average CDF is 20E-5
Figure 11 Core Damage Frequency Industry Average Trend (EPRI 2008)
2 PRA can be done at 3 levels The first one considers internal or external initiating events followedby a series of technical and human failures that challenge the plant operation and computes the CDFas a final outcome Level 2 evaluates how the containment structures will react after an accidentat this level the Large Early Release Frequency (LERF) is computed The last level determines thefrequencies of human fatalities and environmental contamination
Chapter 1 4
The second approach to assess the probability of nuclear accidents is statistical anal-
ysis Basically this approach combines theoretical probability functions and historical
observations to estimate the parameters of interests
Hofert and Wuthrich (2011) is the first attempt in this category The authors used
Poisson maximum likelihood (MLE) to estimate the frequency of annual losses derived
from a nuclear accident The total number of accidents is computed as a Poisson random
variable with constant arrival rate denoted by λ
The authors recognized that the λ estimates change significantly depending on the time
period taken This suggests that there are doubts about the assumption of a non-time
dependent arrival rate If the arrival rate depends on time it means that the events
are correlated somehow which in turns means that one of main assumptions underlying
this model is violated and therefore the results coming from the classic Poisson model
are no longer valid The main purpose of our paper is to fill this gap in the literature
by using a structural-time series approach This model has been developed by Harvey
and Fernandes (1989) and used in political science by Brandt and Williams (1998) but
is yet to be used to assess nuclear risks
13 How to properly estimate the expected frequency of a
nuclear accident using theoretical probability and past
observations
How to compute the probability of a serious accident is a key input to assess the risk of
nuclear power Nevertheless the use of a theoretical probability distribution to predict
an outcome like a nuclear accident requires a clear interpretation of the estimates that
we are obtaining
The results that we will present in the following sections correspond to an arrival rate of
a Poisson distribution which corresponds to the expected frequency of an accident (the
mean of the distribution) Given that we are dealing with a rare event the estimates for
this rate will tend to be close to zero and this feature make it possible to approximate
the value of the arrival rate to the probability of observing at least one accident
The usual interpretation for an arrival rate for instance equal to 5E-05 is that in
average we will observe at least one accident each 20000 reactor-years Following Aven
and Reniers (2013) we can have a better interpretation and think this arrival rate as
the equivalent uncertainty that a person will assign to drawing a specific ball from an
urn containing 20000 balls
Chapter 1 5
131 Data
Defining which events can be considered as nuclear accidents was the first step in our
study As we will explain in this section the scope of the definition of accident will
determine the number of observations to be used in the statistical models that we are
going to test
In general the criterion used to define nuclear accidents is closely linked with the amount
of radioactive material that is released outside the unit The International Atomic
Energy Agency introduced the INES scale inspired by the so-called Birds pyramid that
seek to determine the ratio between the fatal and less serious accidents As we can
see in Figure 12 this scale ranks nuclear events into 7 categories The first 3 are
labeled as incidents and only the last 4 are considered as accidents The major nuclear
accident is rated with 7 and is characterized by a large amount of radioactive material
release whereas the accidents with local consequences are rated with 4 because only
minor releases of radioactive material have occurred
Figure 12 Core Damage Frequency Industry Average Trend Source IAEA httpwww-nsiaeaorgtech-areasemergencyinesasp
This pyramid is a good representation of both the severity and frequency nuclear inci-
dentsaccidents On the top we find the major nuclear accidents that are rare events
Since the installation of the first commercial nuclear reactor in 1952 unit nowadays there
have been only 2 events classified in this category Chernobyl and Fukushima Dai-ichi
On the base we find minor incidents that are more frequent but less serious As we
Chapter 1 6
climb the pyramid we have fewer observations but each one represents a more serious
accident
The International Atomic Energy Agency has recorded every single event reported by
nuclear operators since 1991 using the INES scale3 Unfortunately not all the nuclear
incidents recorded previous to 1991 are rated with this scale only the most significant
events have been evaluated and rated accordingly Table 11 summarizes the number of
observations that we gathered in each category
Table 11 INES Events
INES 3 4 5 6 7
Observations 20 13 5 1 2
As we can see in Table 11 the low frequency of a major nuclear accident (Level 7)
makes difficult to appraise its probability However if we expand the definition of
nuclear accident more observations make the cut For instance we can consider nuclear
accidents as all the events rated with more than 3 in the INES scale Table 1 shows that
with this new definition we count 21 accidents
From the above it can be deduced that the definition of nuclear accident is an important
empirical issue because as it gets narrower (ie more serious accidents) the number of
observed events is reduced This tension implies a trade-off between estimation reliability
and the meaning of the results A broader scope will result in better estimates but they
will not give a precise insight about major nuclear accidents On the contrary if we
restrict our attention only to the most dramatic accidents we only have 2 cases which
undermine the degrees of freedom therefore the reliability of any statistical model
In order to avoid the sparseness when focusing only on major nuclear accidents we
considered 3 definitions The first definition corresponds to events rated with more than
2 in the INES scale (serious incidents + accidents) the second counts those accidents
rated with more that 3 within the same scale The third definition is core meltdowns
with or without radioactive releases this events have been recorded by Cochran (2011)
who counted 9 nuclear commercial reactors that have experienced partial core meltdown
from 1955 to 2010 including the well-known Three Mile Island accident in 1979
Given that this last definition (core melt downs) is the narrowest we can compare it
with the CDF computed in the PRA studies Another advantage of using this definition
is that the magnitude of internal consequences of a core meltdown (ie the loss of
the reactor and its clean-up costs) do not differ much between a major and less severe
3 The data is available in their webpage httpwww-newsiaeaorg
Chapter 1 7
accidents4 Therefore knowing the expected frequency of a core meltdown as we have
defined could be useful to design insurance contracts to hedge nuclear operators against
the internal losses that will face in case of any of these events
It is important to recognize that given that the broader definitions (events with INESgt
2 and gt3) contain heterogeneous events it is possible that the magnitude of internal
consequences that they had had differ substantially therefore they cannot be used to
insurance purposes Nevertheless we consider it is worthwhile to consider these two
definitions despite this shortcoming because the results can be seen as an upper bound
for the expected frequency of serious catastrophes
Figure 13 Major nuclear accidents reactors and operating experience 1955-2011
Figure 13 plots the number of core melts downs (CMD hereafter) collected by Cochran
(2011) as well as the number of installed reactors on the left panel and cumulated
nuclear operating experience (in reactor years) published in the PRIS5 database on the
right panel
At first glance we can conclude that PRA results might not be completely wrong given
that most of the accidents were recorded at the early stages of nuclear power history
It is important to highlight that during the period in which nuclear experience grew
exponentially (ie over the last 10 years) only (and fortunately) the Fukushima Dai-
ichi meltdowns have been observed This intuitively suggests that there have been safety
improvements in the operation of the worldwide nuclear power fleet
Figure 14 shows how many times we have observed in our sample nuclear accidents
using our three definitions As we can see in this Figure the most frequent value for an
4 By contrast the damages in case of radioactive elements releases in the environment could vary inseveral orders of magnitude depending on the meteorological conditions and the population densityin the areas affected by the nuclear cloud
5 The Power Reactor Information System
Chapter 1 8
Figure 14 Histogram for nuclear accidents 1952-2011
event rated with more than 2 and 3 in the INES scale as well as CMD is zero This
means that that sparseness remained even if the scope of accidents that we have taken
is broader
Figure 15 Cumulate frequency (AccidentsReactorYears) for nuclear accidents 1952-2011
132 Models
Once we had defined the scope of accident we parameterized the problem We assumed
that nuclear accidents are realizations that follow a Poisson distribution This function
computes the probability of a number of discrete events occurring in a continuous but
fixed interval of time given an arrival rate In our case the events correspond to nuclear
accidents and the interval time to one year
Chapter 1 9
Assumption 1 Let yt denote the number of nuclear accidents observed at year t
Assume that yt is a Poisson random variable with an arrival rate λ and density function
given by
f(yt|λ) =(λEt)
yt exp(minusλEt)yt
(11)
Although the time period is one year we have to offset the observations by Et that
is the exposure time within this interval It corresponded to the number of operative
reactors at year t
Under Assumption 1 the problem is fully parameterized and we only need to estimate
the arrival rate denoted by λ that in our case represents the expected frequency of a
nuclear accident to compute the probability of a nuclear accident at time t
Before we proceed further we want to reiterate the necessary conditions for a count
variable to follow Poisson distribution
i The probability of two simultaneous events is negligible
ii The probability of observing one event in a time interval is proportional to the
length of the interval
iii The probability of an event within a certain interval does not change over different
intervals
iv The probability of an event in one interval is independent of the probability of an
event in any other non-overlapping interval
In the case of nuclear accidents the first two assumptions do not seem far from reality
Even if in Fukushima Dai-ichi the core melts occurred the same day the continuous
nature of time allows us to claim that they did not happen simultaneously and it is not
unreasonable to expect that as we reduce the time interval the likelihood of an accident
goes down
On the contrary conditions (iii) and (iv) might be more disputable In this section
we assumed that the data satisfy these assumptions in the next section they will be
relaxed
The simplest procedure to estimate λ is to use the observations in the sample (ytTt=0 EtTt=0)
a and compute the maximum likelihood estimate Which simply means that λ equals
the cumulative frequency Using the three definitions of nuclear accidents we computed
the estimate for λ Table 12 summarizes the results
Chapter 1 10
Table 12 Poisson with constant arrival rate (1952-2011)
Database λ Coefficients Estimate Std Error z value Pr(gt |z|)INES gt 2 000273 -5902 0156 -378 lt2e-16 INES gt 3 000139 -6571 0218 -3012 lt2e-16
CMD 000066 -7312 0316 -2312 lt2e-16
If we compute λ using the information available up to year 2010 we can define ∆ as
the change in the estimated arrival rate to measure how Fukushima Dai-ichi affected the
rate
∆ =λ2011 minus λ2010
λ2010
(12)
Using this first model the Fukushima accident represented an increase in the arrival
rate of the CMD equal to 0079 In other words after assuming a constant world fleet
of 433 reactors on the planet from 2010 to 2011 was equal to 617E-04 in the absence
of Fukushima Dai-ichi accident By including this accident it went up to 666E-04 (ie
about a 8 increase)
However the simplicity of this model comes at a price First the estimation only took
into account the information contained in the sample (ie observed accidents) it would
been suitable to incorporate the knowledge brought by nuclear engineers and scientists
over the past 40 years on the potential causes that may result in major accidents
especially core meltdowns
Second it is assumed that all the reactors built over the past 50 years are the same and
their safety features are time invariant This basic Poisson model does not measure if
there have been safety improvements that reduce the probability of a nuclear accident
progressively as PRA studies have shown
To address the first limitation our second alternative was to consider λ as a random
variable Under this approach using Bayes law the observations were combined with a
prior distribution denoted by f0(λ) that encoded the beliefs about our parameter to
update the distribution of our parameter of interest
f(λ|yt) =f(yt|λ)f0(λ)intf(yt|θ)f0(θ)dθ
(13)
Equation 13 shows the updating procedure for a continuous random variable Note that
once we have updated f0(λ) using the available information ytTt=0 we can use mean
Chapter 1 11
of the posterior distribution f(λ|yt) in Equation 11 to compute the probability of an
accident
The choice of the prior distribution has always been the central issue in Bayesian mod-
els6 Within the possible alternatives the use of a conjugate prior has two important
advantages it has a clear-cut interpretation and it is easier to compute
Inasmuch as we have already assumed that accidents come from a Poisson distribution
we have also assumed that λ followed the conjugate distribution for this likelihood which
is a Gamma distribution with parameters (a b)
Assumption 2 The arrival rate λ is a Gamma random variable with parameters (a b)
and density function given by
f0(λ) =exp(minusbλ)λaminus1ba
Γ(a)(14)
Due to the properties of the gamma distribution it is easy to interpret the chosen
parameters The intuition is the following Prior to collecting any observations our
knowledge indicates that we can expect to observe a number of accidents in b reactor
years This gives us an expected rate equal to ab that will be the mean of the gamma
(prior) distribution The parameter that reflects how confident we are about this pre-
vious knowledge is b Given that it is closely related with the variance (V (λ) = ab2)
the greater b the more certain we are of our prior Once we collect observations yt
accidents in Et reactor years we update our prior following a simple formula
au = a+ yt (15)
bu = b+ Et (16)
Which gives a new expected rate given by aubu
PRA estimates have valuable information to construct the prior For instance the
WASH-1400 report found an upper bound CDF equal to 3E-04 it means approximately
1 accident over 3500 reactor years that can be expressed in terms of prior parameters
as (a = 1 b = 3500) Likewise the NUREG-1150 study computed a CDF equal to
891E-05 that in terms of prior parameters is (a = 1 b = 10000)
6 For an extended discussion on the priorrsquos selection see Carlin and Louis (2000) or Bernardo andSmith (1994)
Chapter 1 12
As we can see in Figure 16 using the WASH-1400 information as prior the Bayesian
model predicted both a higher expected arrival rate and a wider confidence interval
because the low value of b In this case the results were driven by the observations and
quickly converged towards the results of the previous model However by taking the
NUREG-1150 study as a source for the prior we needed a larger number of observations
to move far from the prior
Figure 16 Bayesian updating with Poisson-Gamma model
In fact by using (a = 1 b = 3500) as prior we found similar results for the CMD
The Poisson-gamma model predicted an expected arrival rate equal to λ2011 = 599E-04
and ∆ represented an increase of 709 After using the figures form the NUREG-1150
(a = 1 b = 10000) we found an expected arrival rate equal to λ2011 =43E-04 and ∆=
8 for CMD
To deal with the second limitation of the Poisson model we defined λ as a function of a
time trend With this third model is possible to test if that there has been a sustained
decrease in the expected rate of nuclear accidents over the past 10 years However note
that such an approach challenges what is stated in condition (iii) because we are allowing
that the arrival rate changes in each time interval (ie one year in our case)
Assumption 3 The systematic component (mean) λt is described by a logarithmic
link function given by
λt = exp(β0 + β1t) (17)
Chapter 1 13
Table 13 Poisson with deterministic time trend
Coefficients Estimate Std Error z value Pr(gt |z|)
INESgt2Intercept 106261 24823 4281 186e-05
time -0056 0012 -4509 652e-06
INESgt3Intercept 244902 39192 6249 414e-10
time -0126 0019 -6387 169e-10
CMDIntercept 221886 55788 3977 697e-05
time -0115 0028 -4091 429e-05
Results in Table 13 are maximum likelihood estimates for (β0 β1) Given the clarity of
these results there is every reason to believe that the expected frequency of a nuclear
accident has changed along this period As expected the estimates were negative and
significant Therefore if the effect of regulatory strictness technological improvements
and safety investments can be summarized in this variable we have found some evidence
that supports the decreasing trend for the core damage frequency that the PRA studies
have shown
In the CMD case the λ2011=320E-05 that is close to the estimated CDF of last PRA
studies After computing the Fukushima Dai-ichi effect on the arrival rate we found an
increase of =23 Unlike in the previous two models this increment is substantial7
In this last set of results we found a negative and significant time trend which in a
nutshell means arrival rate is decreasing in time Although this feature does not seem
controversial it invalidates condition iii (non time varying arrival rate) and we cannot
make use the traditional Poisson models as we have done so far We need a model in
which the parameter of interest (ie λ ) is function of time
Regarding the no correlation hypothesis (ie condition iv) at first glance one could say
that nuclear accidents fulfill this condition Three Mille Island accident is not related
with what happened in Chernobyl etc Nevertheless we have a long time series data
that in some sense reflect the evolution of nuclear power technology and knowledge It
is important to recognize that nuclear reactors have a long lifetime thus there is some
technological inertia in the world nuclear fleet but at the same time innovations have
been adopted and new reactors have been installed along the time period that we have
analyzed For this reason it is possible that our data exhibit some correlation In fact
7 The Poisson regression can also be done under a Bayesian approach nevertheless the prior isnot as easy to construct as in the previous case because in this setting the coefficients (β0 β1)are the random variables Generally it is assumed that they come form a normal distributionβ sim Nk(b0 B0) Where k = 2 (in our case) is the number of explanatory variables b0 is the vectorof prior means and B0 is the variance-covariance matrix Then to construct the prior will requirea lot of assumptions not only in the level and precision of the coefficients but also in how they arerelated Given that precisely what we want is to relax as much assumptions as possible we are notgoing to consider such a model
Chapter 1 14
as we pointed out before it is clear from Figure 13 that the early stages of nuclear
power industry are related with more accidents than the lasts years of our sample
To confirm or reject the validity of this assumption it is customary when using a time
series to check if there is a stochastic process that governs data dynamics In our case
this means to know if accidents are somehow correlated or if instead we can assume
that they are independent events (condition iv) To test this we propose to use a time
series state-space approach
Before turning to the last model it is worthwhile to understand why conditions (iii) and
(iv) are relevant As in the classical regression analysis the maximum likelihood estima-
tion assigns an equal weight to each observation because under these assumptions all of
them carry the same information However if observed events are somehow correlated
some of them bring more information about the current state than others therefore past
observations have to be discounted accordingly
14 Poisson Exponentially Weighted Average (PEWMA)
model
Autoregressive Integrated Moving Average (ARIMA hereafter) models are the usual
statistical frameworks to study time series however there are two limitations to use
them in the case of nuclear accidents First it is inappropriate for discrete variables
because ARIMA models are based on normality assumptions (thus it is incompatible
with Assumption 1) Second Harvey and Fernandes (1989) noted that when the mean
of the process tends to zero ARIMA estimates could result in negative predictions
which cannot be the case for nuclear accidents
To deal with these two limitations Harvey and Fernandes (1989) and Brandt and
Williams (1998) proposed to use a structural time series model for count data This
framework has a time-varying mean as in the ARIMA models but is based on a Poisson
or a negative binomial conditional distribution
The idea is to estimate the coefficients in the exponential link as in a Poisson regression
but each observation is weighted by a smoothing parameter this is the reason why the
model is called Poisson Exponentially Weighted Moving Average (PEWMA)
We briefly describe below the structural time series approach8 following what has been
developed by Brandt and Williams (1998) and (2000) The model is defined by three
equations measurement transition and a conjugate prior The first is the models
8 Harvey and Shepard (1993) have elaborated a complete structural time series statistical analysis
Chapter 1 15
stochastic component the second shows how the state λt changes over time and the
third is the element that allows identifying the model
We keep Assumption 1 which corresponds to the measurement equation f(yt|λt) In
this setting λt has two parts the first shows the correlation across time and the sec-
ond captures the effect of the explanatory variables realized in the same period which
corresponds to an exponential link
Assumption 3rsquo The mean λt has an unobserved component given by λlowasttminus1 and an
observed part denoted microt described by an exponential link
λt = λlowasttminus1microt (18)
At its name implies the transition equation describes the dynamics of the series It
shows how the state changes across time
Assumption 4 Following Brandt and Williams (1998) we assume that the transition
equation has a multiplicative form given by
λt = λtminus1 exp(rt)ηt (19)
Where rt is the rate of growth and ηt is a random shock that follows a Beta distribution
ηt sim Beta(ωatminus1 (1minus ω)atminus1) (110)
As in an ARIMA model we are interested in knowing for how long random shocks will
persist in the series systematic component In the PEWMA setting ω is the parameter
that captures persistence It shows how fast the mean moves across time in other
words how past observations should be discounted in future forecast Smaller values of
ω means higher persistence while values close to 1 suggest that observations are highly
independent
The procedure to compute f(λt|Ytminus1) corresponds to an extended Kalman filter9 The
computation is recursive and makes use of the advantages of the Poisson-Gamma Bayesian
model that we discussed in the previous section
The idea of the filter is the following The first step consists in deriving the distribution of
λt conditional on the information set up to tminus1 We get it by combining an unconditional
9 The derivation of this density function is described in Brandt and Williams (1998)
Chapter 1 16
prior distribution λlowasttminus1 that is assumed to be a Gamma with the transition Equation
19
Using the properties of the Gamma distribution we obtain f(λt|Ytminus1) with parameters
(at|tminus1 bt|tminus1)
λt|Ytminus1 sim Γ(at|tminus1 bt|tminus1) (111)
Whereat|tminus1 = ωatminus1
bt|tminus1 = ωbtminus1 exp(minusX primeβ minus rt)
The second step consists in updating this prior distribution using the information set Yt
and Bayes rule This procedure gives us a posterior distribution f(λt|Yt) As we have
seen in the previous section the use of the conjugate distribution results in a Gamma
posterior distribution and the parameters are updated using a simple updating formula
λt|Yt sim Γ(at bt) (112)
Whereat = at|tminus1 + yt
bt = bt|tminus1 + Et
This distribution becomes the prior distribution at t and we use again the transition
equation and so on and so forth
141 PEWMA Results
Given that we had not included covariates in the link function in the previous models
we are not going to include them in the PEWMA model to be able to compare the
results Thus the only parameter to estimate is ω We used PEST10 code developed
by Brandt and Williams (1998) The estimates for the PEWMA model for the three
definitions of nuclear accident are summarized in Table 14
An important characteristic of PEWMA is that it nests the previous models When
ω = 1 we can obtain the results from the first Poisson model if the prior is (a = 0 b = 0)
Those from the Poisson-Gamma are reached if we use the same prior parameters for
instance (a = 1 b = 3500)
10 The code is available in httpwwwutdallasedu pbrandtpestspestshtm
Chapter 1 17
Table 14 PEWMA Estimates for Prior a=1 b=3500
Parameters Std Errors Z-score
INESgt2 ˆωINESgt2 0599 0024 24666INESgt3 ˆωINESgt3 0729 0055 13134
CMD ˆωCMD 0801 0024 32850
Using this last prior we obtained the results shown in Table 14 As we can see the
estimates for ω with all the definitions are smaller than one After computing a Wald
statistic to test independence assumption and reduction to simpler Poisson models we
concluded that we do not have evidence to assume that the observations are independent
The results for this test are presented in Table 15
Table 15 Test for reduction to Poisson H0 ω = 1
Wald test p-value
INESgt2 272523 lt2e-16INESgt3 23663 1147e-06
CMD 66193 4440e-16
On the basis of these results we can conclude that the use of Poisson models based on
the independence assumption is definitely not suitable to estimate the frequency and
compute the probability of nuclear accidents
The results in Tables 14 and 15 also shown that as the definition of the accident
narrowed meaning passing from INESgt2 to INESgt3 and CMD the estimate of ω got
closer to one This suggested that it is likely to accept the independence assumption
when focusing only on major nuclear accidents because what the data reflect are the
particular conditions in which these accidents occurred On the contrary when we took
a broader set of accidents we estimated a lower ω because the data set had more
information about nuclear safety as a whole
142 Arrival rate estimates from 1952 to 2012
The predictions at each period of time t in the filter for λt vary substantially depending
on ω As we have already mentioned if all the events are independent ω rarr 1 thus they
are considered equally important in the estimation As ω gets smaller recent events
become more important than those observed in the past then the latter are discounted
Figure 17 plots the mean of f(λt|Yt) for the Poisson-Gamma and PEWMA model for
CMD Note that for the former model the changes in the arrival rate are subtler with
Chapter 1 18
each observation because the effect of a new accident is diluted over the cumulated
experience In the case of the latter model we discount past events heavily thus the
observations in the latest periods are the most important and the distant are almost
irrelevant For this reason the changes in the expected arrival rate are more drastic
Figure 17 Poisson-Gamma vs PEWMA for CMD
As we can see in Figure 17 from 1952 to 1970 the arrival rate grew quickly until it
reached a high peak This can be explained by the different accidents occurred between
1960 and 1970 and the slow growth of the worldwide nuclear fleet After 1970 several
accidents occurred but the operating experience increased substantially Between 1970
and 2010 we can observe a decreasing trend in the arrival rate even though this period
is featured with the most well known accidents of Three Mile Island and Chernobyl
The Fukushima Dai-ichi results in a huge increase in the expected frequency of an
accident The arrival rate in 2011 is again similar to the arrival rate computed in 1980
after the Three Mile Island and the Saint Laurent des Eaux core meltdown In other
terms Fukushima Dai-ichi accident has increased the nuclear risk for the near future in
the same extent it has decreased over the past 30 years owing to safety improvements
In informational terms the adding of a new observation (ie new accident) is equivalent
to the offsetting of decades of safety progress
The PEWMA model estimates an arrival rate for CMD λ2010 = 442e-05 and λ2011
=1954e-3 which implies a ∆ =4321 This huge change could appear as unrealistic In
Chapter 1 19
fact at first glance the triple meltdown seems as the result of a series of exceptional
events (ie a seism of magnitude 9 and a tsunami higher than 10 meters) However for
most observers the Fukushima Dai-ichi accident is not a black swan11 Seisms followed
by a wave higher than 10 meters have been previously documented in the area It is true
that they were not documented when the Fukushima Dai-ichi power plant was built in
1966 The problem is that this new knowledge appeared in the 80s and has then been
ignored deliberately or not by the operator It has also been ignored by the nuclear
safety agency NISA because as well-demonstrated now the Nippon agency was captured
by the nuclear operators (Gundersen 2012)
Unfortunately it is likely that several NPPs in the world have been built in hazardous
areas have not been retrofitted to take into account better information on natural
risks collected after their construction and are under-regulated by a non-independent
and poorly equipped safety agency as NISA For this reason the Fukushima Dai-ichi
accident entails general lessons regarding the underestimation of some natural hazardous
initiating factors of a core meltdown and the over confidence on the actual control exerted
by safety agency on operators
Note also that such an increase seems more aligned with a comment made after the
Fukushima Dai-ichi accident a nuclear catastrophe can even take place in a technologi-
cally advanced democracy It means that a massive release of radioactive elements from
a nuclear power plant into the environment is no longer a risk limited to a few unstable
countries where scientific knowledge and technological capabilities are still scarce The
10 times order of magnitude of the Fukushima Dai-ichi effect computed by us could
therefore be realistic and consistent
15 Conclusion
Results in Table 16 recapitulates the different numbers for the arrival rate and the
Fukushima Dai-ichi effect we obtained in running the 4 models
Table 16 Summary of results
Model λ2010 λ2011 ∆
MLE Poisson 6175e-04 666e-04 00790Bayesian Poisson-Gamma 4069e-04 439e-04 00809Poisson with time trend 9691e-06 320e-05 2303PEWMA Model 4420e-05 195e-03 43216
11 See Fukushima Dai-ichi NPS Inspection Tour (2012)
Chapter 1 20
We can conclude that when it is assumed that the observations are independent the
arrival of a new event (last nuclear catastrophe) did not increase the estimates The
Fukushima effect is close to 8 regardless of whether you use a basic Poisson model or
a Bayesian Poisson Gamma model
This result does not take any safety progress into account nor the new risks that the
last accident revealed The arrival rate is computed as if all the reactors have been the
same and identically operated from the first application of nuclear technology to energy
to this day This is a strong limitation because it is obvious that over the past 50 years
the design of reactors and their operation have improved The current worldwide fleet
has a higher proportion of safer reactors than the 1960s fleet
On top of that the Fukushima Dai-ichi accident revealed potential risks associated with
a poor feedback on natural hazards in old facilities as well as the possibility of regulatory
capture even in developed countries
By contrast the introduction of a time-trend into the Poisson model has led to a high
decrease in the 2010 arrival rate The time trend captures the effect of safety and
technological improvements in the arrival rate Being significant this variable allows
predicting a lower frequency of nuclear accidents If we use a Poisson regression we find
a tripling of the arrival rate owing to the Fukushima Dai-ichi accident Note that both
findings seem more aligned with common expertise In fact the expected frequency of
an accident by reactor-year as derived by the 2010 arrival rate is closer to PRAs studies
Nevertheless the Poisson regression is also based on the assumption of independent
observations The PEWMA model has allowed us to test the validity of this hypothesis
and we find that it is not the case This seems to be more suitable because nuclear
reactors have a long lifetime and the construction of new reactors investments in safety
equipment learning process and innovations take time to be installed and adopted by
the whole industry Of course the dependence hypothesis leads to a higher arrival rate
because it introduces some inertia in the safety performances of the fleet A new accident
reveals some risks that have some systemic dimension
With the PEWMA model the Fukushima Dai-ichi event represents a very substantial
but not unrealistic increase in the estimated rate By construction each observation in
this model does not have the same weight Past accidents are discounted more than new
accidents This captures the idea that lessons from past accidents have been learnt in
modifying operations and design and that a new accident reveals new safety gaps that
will be progressively addressed later in order to avoid a similar episode
Chapter 2
Revisiting the cost escalation
curse of nuclear power New
lessons from the French
experience
21 Introduction
In OECD countries the choice to include or not include nuclear power in the energy mix is
commonly seen as primarily a matter of public opinion The very long lifetime of nuclear
waste and the risk of large radioactive materials being released into the environment
have raised major acceptability concerns The Fukushima Dai-ichi catastrophe in March
2011 has demonstrated again how public attitude vis--vis nuclear technology may dictate
political decisions and U-turns For instance German people were so stunned by the new
accident that the Chancellor Angela Merkel immediately decided to shut down eight
operating reactors and later on to accelerate the phasing-out of the nuclear fleet Four
months before Fukushima Dai-ichi a new German law was passed to extend their life
Nuclear power was viewed then by Angela Merkel and her party as a bridge technology
before renewables and storage could cover all electricity demands
However public opinion is not the only barrier that nuclear power faces today a less
addressed but also an important issue is whether new nuclear power plants can be built
at a reasonable cost The construction cost is the major component of levelized costs
of nuclear power generation Depending on assumptions on the cost of capital and the
number of years to build the nuclear plant the construction cost represents between 60
21
Chapter 2 22
and 80 of levelized costs1 In other words whether or not nuclear power generation
is cheap enough to compete with other electricity sources is critically dependent on
construction costs
In OECD countries2 where public opinion is supportive of nuclear power policy mak-
ers investors and utilities are very concerned by construction costs In countries such
as the UK Finland France and Poland nuclear generation is viewed as needed to
achieve a low carbon energy transition The technology is also considered to contribute
towards reducing energy dependency from abroad These two drivers of nuclear energy
deployment are well illustrated by the example of the UK The UK has adopted an
ambitious CO2 emissions reduction policy in a very specific context a medium-term
shortage of capacity owing to the closure of its old nuclear and coal power plants After
several years of debate and consultation the UKs decarbonization policy includes an
increasing carbon tax reaching up to 70 per ton in 2030 and a mechanism that provides
operators over a long-time period with a fixed price for electricity therefore fluctua-
tions in electricity price on the power exchange will take place regardless The so-called
contract-for-difference ensures money to generators when the wholesale market price is
below a reference or strike price set by the government and conversely generators pay
the difference between the market price and the strike price when it is positive Both
renewable energy and nuclear energy could benefit from this mechanism The UKs
vision as elaborated in the 2008 White Paper and in the 2010 Coalition Programme is
that nuclear energy has a role to play alongside renewables to reduce greenhouse gas
emissions by 80 in 2050 and to secure energy supply By the end of the 2020s 16 GW
of new nuclear capacity are envisaged
Noticeably the Fukushima Dai-ichi accident has not changed the situation Six months
after the Japanese catastrophe a national policy statement for nuclear power generation
reiterated the need for new nuclear power plants and the benefits of early deployment
In March 2014 according to a survey commissioned by the Department of Energy and
Climate Change3 42 supported nuclear power and 20 opposed it On the 21st
October 2013 a commercial agreement was reached between the EDF Group and the
UK Government for the building of two EPR reactors at Hinkley Point C in Somerset
A strike price of pound925 per MWh over a 35-year period was agreed It is supposed to
1 See NEA (2000) and NEA (2000)2 In non-OECD countries nuclear cost-competitiveness is a less sensitive issue The adoption and
continuation of nuclear technology are mainly driven by political considerations See Goldemberg(2009)
3 The Department of Energy and Climate Change publishes the DECC Public Attitudes TrackerSurvey periodically since 2012 The figures cited here correspond to the Wave 9 document that isavailable here httpswwwgovuk
Chapter 2 23
cover the pound14 billion4 that EDF estimated as the expenses to construct the plant These
figures have generated an intense debate between those that argue that nuclear power is
not competitive and needs subsidies to survive Greenpeace (2013) and those that claim
that the strike price and the construction cost correspond to a first of a kind and that
the following reactors will be much cheaper to build5
More generally speaking concerns about the cost of nuclear new-builds have been raised
with the updating of academic cost studies in the US and the long delays and budget
overshoots observed in the construction of EPR in the EU (Leveque (2013)) In 2009
the MIT published a report updating the findings of an initial study that was done six
years before called The Future of Nuclear Power (see Parsons and Du (2003) Parsons
and Du (2009)) The increase in the construction cost was spectacular expressed in
current dollars and leaving aside interests during construction costs doubled rising
from $2000 to $4000 per kW In particular this latter figure took into account the
estimated costs of 11 projected plants in the US for which the relevant utilities had
applied to the regulatory bodies for reactor licencing Likewise in 2011 the University
of Chicago estimated that on average the construction cost of AP 1000 reactors quoted
in applications by utilities was $4210 per kW which meant an increase by a factor of
21 in constant dollars in comparison with a study carried out seven years earlier (see
Rosner and Goldberg (2011a))
New-builds in Olkiluoto in Finland and Flamanville in France have been plagued with
successive revisions of budget and completion dates The construction of the Finnish
plant started in 2005 and was supposed to last four-and-a-half years with a grid con-
nection in 2009 Commercial operation is now expected in 2016 at best Construction
costs were first estimated at e3 billion and were revised upwards in 2010 to e57 billion
and in 2013 to e85 billion Similarly the initial anticipated cost of the Flamanville
EPR reactor currently under construction by EDF increased from e33 billion in 2005
to e6 billion in 2011 EDFs most recent press release in 2012 downgraded the situation
further announcing an estimated cost of 85 billion Flamanville was expected to start
commercial operation in 2013 but due to delays is expected now to start up in 2016
Looking at costs in the past to build the two largest nuclear fleets in the world recent
concerns about nuclear cost escalation do not seem unfounded In the case of the US
(see Figure 21) if we compare the overnight cost in Koomey and Hultman (2007)
for the first and last nuclear reactors installed we can see that the costs expressed in
4 EDF Energy Press release 21 October 2013 available at httpnewsroomedfenergycomNews-ReleasesAgreement-reached-on-commercial-terms-for-the-planned-Hinkley-Point-C-nuclear-power-station-82aspx
5 Nutall W (2013) Hinkley C goes ahead but future nuclear costs must fall The Conversation 31October 2013 httptheconversationcomhinkley-c-goes-ahead-but-future-nuclear-costs-must-fall-19407
Chapter 2 24
Me(2010)MW are seven times higher for the latter than for the former It is worth
mentioning that the overnight cost includes the investments linked with site preparation
and construction but it excludes financing expenses Therefore it shows the cost of the
plant as if it had been fully built in one night
Figure 21 Overnight costs for the US Nuclear Fleet e 2010MW
The severe escalation in the construction cost of the US nuclear fleet is partially ex-
plained (see infra) as the result of the heterogeneity in the reactors that were installed
(ie different types and models) and the consequent lack of standardization that to-
gether with the multiplicity of utilities vendors and constructing firms reduced the
possibility of establishing long-term relationships and building the same reactor design
repeatedly All this resulted in an erosion of the potential benefits associated with
learning effects
Alike Grubler (2010) analyzed the investments made in France to build its fleet of 58
reactors His comparison of construction costs in FF98kW between units installed in
1974 and those constructed after 1990 shows an increase by a factor of about 35 This
finding suggests that even under better economic and institutional conditions such as
those prevailing in France (ie centralized decision making vertical integrated utility
single nuclear vendor high degree of standardization and regulatory stability) cost
escalation is inherent to nuclear power According to Grubler (2010) negative learning-
by-doing effects characterize nuclear technology while accumulating experience nuclear
construction costs per unit of capacity have been increasing instead of decreasing
Chapter 2 25
By contrast as comprehensively reviewed by Martin Junginger and Faaij (2010) his-
torical trends for other base-load technologies such as gas and coal and for other zero
carbon technologies such as onshore wind and photovoltaic systems show positive learn-
ing effects Experience curves are especially impressive for renewables Lindman and
Soderholm (2012) found that the kW from onshore wind farms decreases by more than
10 each time the installed capacity doubles Meanwhile Isoarda and Soria (2001) and
C Yu and Alsema (2011) have identified higher learning effects in the photovoltaic in-
dustry confirmed by the dramatic reductions in the underlying costs and market prices
of solar panels
On top of this we can expect the Fukushima Dai-ichi accident to have consequences in
terms of construction costs for new reactors Lessons learned from this accident may
encourage nuclear vendors to include other safety features and lead to redundancies in
new reactors and site designs safety authorities might impose stricter licencing rules
and greater public opposition to installing new nuclear power plants could induce con-
struction delays and therefore cost overruns
In the debate about nuclear plants current opinion is directed against their construction
Taking into account the above it seems that there is no escape from the cost escala-
tion curse However before giving up it is worth reviewing the French nuclear power
programme experience using new data recently released by the Cour des Comptes It
is important to mention that Grubler made his cost assessment using estimations based
on an annual EDF investment report covering 1972 to 1998 because at the time of his
publication reliable data on the costs of the French nuclear programme were not avail-
able Following a request from the Prime Minister to the national audit agency Cour
des Comptes past construction and RampD expenses related to French nuclear power were
first made known to the public in 2012 The Cour des Comptesrsquo report brought together
all data concerning current construction costs for the 58 reactors installed in France as
well as investments in other nuclear facilities
When we compared costs from this new source of information with previous cost esti-
mates we found that the escalation is less severe than argued In the light of this result
in this paper we re-examine the cost drivers for the French nuclear power programme
We consider that by revisiting the French experience it will be possible to draw useful
policy recommendations to ease cost escalation in the construction of new nuclear power
plants and therefore determine the elements that will allow nuclear power to remain
competitive
In particular we are interested in investigating the existence of scale and learning effects
as well as the relationship between safety performance and costs in order to see if it is
Chapter 2 26
possible to expect cost reductions when increasing the size of the reactor when building
the same type of reactor repeatedly and if safer reactors are more expensive
The literature regarding nuclear construction drivers is large for the US case given that
the data have been available to the public ever since the construction of the first wave
of reactors We can mention the pioneering papers of Komanoff (1981) and Zimmerman
(1982) Later Krautmann and Solow (1988) Cantor and Hewlett (1988) and McCabe
(1996) revisited the existence of economies of scale and established that the construction
of larger reactors6 increased the cost per MW installed once the increase in construction
lead time was taken into account According to Cantor and Hewlett (1988) bigger units
increase projects complexity subjecting them to managerial problems longer lead times
and stricter regulatory scrutiny Learning effects were only found to be positive and
significant when public utilities constructed the plant This striking result was later
addressed by Cantor and Hewlett (1988) and McCabe (1996) The former suggested
that the market power of experienced firms allows them to charge higher prices so the
learning effects are kept as profits whereas the latter explained this difference by the
poor incentives of cost-plus contracts7 under which nuclear power plants were procured
by external constructors
More recent studies like Cooper (2012) have observed that the number of rules and
fines issued by the Nuclear Regulatory Commission (hereafter NRC) even before Three
Mile Island accident in 1979 led to an increase in construction costs According to this
author the NRC was convinced that the risk of accident would increase dramatically
as the number and size of operating reactors grew and their locations moved closer to
population centers Therefore they sought to reduce the risk by increasing the required
safety measures
Our paper is the first to use the actual construction costs of the French nuclear fleet
As mentioned previously the cost assessment done by Grubler (2010) used estimations
As in previous literature we deal with a multicolinearity problem but in addition we
have a smaller sample therefore we propose using a principal component regression
approach to deal with both econometric limitations In addition to using the common
explanatory variables to identify the main drivers of construction costs we also included
operating performance indicators in particular those linked with safety to see if cost
escalation can be justified with better safety features
6 Except Komanoff (1981) a pioneering study that suggested a 13 cost decrease when a reactorssize is doubled nevertheless subsequent papers rejected this result
7 McCabe (1996) explains that for the second wave of nuclear reactors (the one that began in the late60s) the nuclear vendors ceased to be in charge of the construction process and in turn utilitiescontracted external firms to preform plant engineering management and construction All thesecontracts were cost-plus
Chapter 2 27
After revisiting construction costs for the French nuclear fleet we find that neither
the scale-up nor cumulative experience induced cost reductions on the contrary these
variables have positive and significant coefficients We have called this phenomenon
the big size syndrome and we have identified it as the main driver of cost escalation
in France The big size syndrome summarizes the fact that as the nuclear industry
gained experience bigger and more complex reactors were designed and installed and
this resulted in a cost increase
Although the increase in the size of the reactors was done with the expectation of
reducing the cost per MW installed with our results we cannot discard the existence of
economies of scale in the French nuclear fleet We have to recognize that by using only
French data it is not possible to disentangle the effect due to increase in the reactors
capacity caused by technological change Thus it is true that bigger reactors were more
expensive per MW installed but we have to keep in mind that we are not talking about
the same reactor design
Our second important result is that we have identified positive learning effects within
similar types of reactors This finding is good news for nuclear power deployment
given that it supports the idea of standardization as an effective strategy to reduce
cost overruns linked with uncertainty when constructing complex technologies such as
nuclear reactors and therefore offers a possible way of overcoming the cost escalation
curse This result supports the idea that to avoid the cost escalation curse building
the same type of reactor repeatedly in the same sites was one of the key features of the
French nuclear programme
The last result that we found is that reactors that perform better according to the
safety indicators that we included in the regression cost more This last result shows
that improvements in safety can also be considered as a driver of cost escalation This
result is also linked with our first one because it tells us that technological improvements
embedded in new designs either because the reactor is larger or because vendors seek
to achieve better safety performance (perhaps to fulfill regulatory requirements) have
resulted in a rise in the cost per MW installed
The rest of the paper is organized as follows Section 22 briefly describes the French
nuclear power programme and the cost data from the Cour des Comptes report then
sets out the model and estimation procedure The results of the model are presented
and discussed in Section 23 Finally our conclusion is in Section 24
Chapter 2 28
22 Data and Model
221 French construction cost escalation
The inception of nuclear power for civil use in France began in the early 1960s From
1963 to 1972 EDF installed 7 reactors with different technologies that represented ap-
proximately 2600 MW These units (Table 21) were later decommissioned according to
Roche (2004) due to their technological and economic limitations In particular safety
concerns were raised after the partial core meltdown in Saint Laurent A1 reactor in 1969
Table 21 First Generation of French Reactors
Unit Type Year of connection
Chooz A Pressurized water 1967Brennilis Heavy water reactor 1967St Laurent A1 Natural uranium gas-cooled 1969St Laurent A2 Natural uranium gas-cooled 1961Chinon A2 Graphite-Gas 1965Chinon A3 Graphite-Gas 1966Bugey 1 Graphite-Gas 1972
The early adoption of nuclear power by EDF and the oil price peak in 1973 triggered the
design of the French nuclear power program with the aim of substituting fossil energy
sources This program has been described as the opposite of the situation in the US
nuclear industry because the French nuclear fleet is less diverse and investment decisions
were made by a centralized institutional structure
In France only one technology was installed corresponding to the Pressurized Water
Reactor (hereafter PWR) From 1978 to 2002 58 reactors were built in 19 units (see
Figure 22) Today all of these reactors are in operation and provide almost 78 of
French annual electricity consumption The nuclear fleet is composed of three groups
called paliers In each palier all reactors have the same size The first palierpalier
comprises 34 reactors with a 900MW nameplate capacity the second palier includes 20
reactors with 1300 MW and the last one contains 4 reactors with 1450 MW of installed
capacity This corresponds to a total installed capacity of 62510 MW
Each palier includes different types of reactor The first palier has 3 types of reactor
CP0 CP1 and CP2 Their main difference lies in the design of the intermediary cooling
system In the second palier there are two types of reactor P4 and P4 which differ
in the layout of the structure containing fuel rods and circuitry Finally the last palier
comprises only one type of reactor called N4 This design differs from the other reactors
in terms of capacity as well as the design of its steam generators primary pumps and
command room
Chapter 2 29
Figure 22 Evolution of French Nuclear Power Fleet by palier
As mentioned before the institutional setting in which the French nuclear power pro-
gram developed was highly centralized Finon and Staropoli (2001) described it as a
close-knit network between EDF the public monopoly generator Framatome (today
AREVA) the reactor vendor and the Atomic Energy Commission (CEA) the nuclear
research and development agency This centralized decision-making setting resulted in
effective coordination of the programs investments and reduced uncertainty regarding
safety regulations The downside is that it also shielded the program from public scrutiny
and accountability
However with the decommissioning deadlines for the oldest reactors approaching public
debate about the role of nuclear power in the French energy mix calls for clear account-
ability of EDFs past present and future investments For this reason in 2011 the former
Prime Minister of France asked the national audit agency Cour de Comptes to under-
take a study of EDFs past expenditure on constructing nuclear facilities including the
58 PWR commercial reactors
This report was published at the beginning of 2012 and for the first time presented to the
public the actual construction costs of the nuclear fleet It is important to point out that
we used the construction costs and not the overnight costs because in the report the
latter were presented for the whole nuclear fleet and not for each observation However
they represent 88 of the total overnight costs The costs in the report are presented
Chapter 2 30
by pairs of units in current and 2010 constant euros8 Figure 23 compares the cost data
presented in the Cour de Comptes report with the estimated costs computed by Grubler
(2010) We can conclude that the figures for the first reactors were quite accurate but
that figures for the latest ones were overestimated In fact by taking Grublers cost
estimates expressed in e2010 kW the average annual increase is equal to 57 taking
the construction costs in the Cour de Comptes we find an average annual increase of
47
Figure 23 Grubler vs Cour de Comptes construction costs
Since the cost escalation was not as severe as argued it is worth reviewing the French nu-
clear power program experience with the actual data published in the Cour de Comptes
report in order to see if new lessons can be learnt to overcome the cost escalation curse
222 Model and data
Using a linear regression model we seek to determine the construction costs main drivers
We assume a logarithmic cost function in which the explanatory variables are capacity
input prices experience safety performance indicators and finally a random error The
regression equation that we have estimated is the following
8 The actual construction cost for the French nuclear fleet published in the Cour de Comptes arepresented in Appendix A
Chapter 2 31
Figure 24 Cour de Comptes construction cost by palier and type
ln(Ci) = β0 + β1 ln(Capi) + ln(ICHTi) + β2EXPIi + β3EXPPi
+β4EXPTi + β5UCLi + β6US7i + ui (21)
Where
bull Ci Construction cost for the pair of units i in e2010 per MW
bull Capi Installed capacity in MW
bull ICHTi Index cost of labor for the year in which the construction of reactor i
started
bull EXPIi Number of completed reactors at the time of the construction of plant i
bull EXPPi Number of completed reactors within the same palier at the time of the
construction of plant i
bull EXPTi Number of completed reactors within the same type at the time of the
construction of plant i
bull UCLi Lifetime average Unplanned Capability Loss Factor for unit i
bull US7i Lifetime average Unplanned Automatic Scram for unit i
Regarding capacity Figure 24 clearly shows that the cost escalation in France is closely
related to the progressive increase in reactor size Nevertheless it is important to men-
tion that the scale-up also entailed a technological change which means that there are
Chapter 2 32
substantial design differences between reactors belonging to each palier For this reason
we have to keep in mind that with this variable we are capturing two effects ie the
size and the technological complexity of new reactors
The second set of explanatory variables was included to test the presence of learning
effects We have defined three variables the first corresponds to overall experience
(EXPI) the second only adds the previous reactors existing within the same palier
(EXPP) and the last one includes reactors of the same type (EXPT) All of these
variables show the number of reactors previously built in each category
Apart from scale and learning effects we might also be interested in identifying whether
cost escalation is linked to safety improvements According to Cooper (2012) safety
variables (ie fines and the number of safety standards and rules adopted by the NRC)
are the most consistent predictors to explain the cost escalation in the US In previous
studies (Komanoff (1981) Zimmerman (1982) Cantor and Hewlett (1988) McCabe
(1996)) safety improvements were related to the stringency of the regulatory agency that
was represented with a time trend in all of these studies it was found to be significant
and positive
For the French case it is hard to measure regulatory activity According to Grubler
(2010) there is no regulatory documented incidence from 1970 to 1999 which is not
surprising given that the Autorite de Surete Nucleaire (independent regulatory agency)
was created in 2006 However Roche (2004) and Finon (2012) argued that EDF inte-
grated safety reinforcements into new reactors gradually and thus these improvements
should be reflected in better performance in terms of unplanned outages To test how
safety improvements are related to construction costs we included in the model two in-
dicators defined by The World Association of Nuclear Operators (WANO) and adopted
by the International Atomic Energy Agency (IAEA)
The first of these is the Unplanned Capability Loss Factor (UCLi) which reflects a
reactors ability to maintain the reliability of systems and components This indicator
belongs to the first category of the safety performance indicators used by the IAEA
which seeks to quantify how smoothly a plant operates The UCL indicator shows the
percentage of energy that a plant was not capable of supplying due to deviations from
normal operations
The second indicator is Unplanned Automatic Scram (US7i) which belongs to the
category for identifying whether a plant is operating at low risk The US7 tracks the
number of automatic shutdowns during one year (ie 7000 hours) of operation We
have chosen this measure because it gives a direct indication of the frequency of actual
Chapter 2 33
Figure 25 Labor cost index (ICHT) and Price index for France =100 in 1973
challenges to the systems that submit plant equipment to extreme thermal loads and
increase the risk of serious accidents
To count the changes in input prices we have also included an index in the regression
framework to take into account the cost of labor Although the costs are expressed in
constant currency it is important to highlight that during the period we are analyzing
(ie1978-2002) the labor cost increased more rapidly than the index prices When we
compared the evolution of the French GDP price index with the Indice du cout horaire
du travail (ICHT) developed by INSEE we found that the difference between the index
in 1973 and 2000 is 4 times in the former and 9 times in the latter (see Figure 25)
We have not included other commodity price indexes such as cement copper steel or
nickel given that on average their growth rates were similar to the GDP deflector that
was used to homogenize the cost data
In addition to the Cour de Comptes costs we gathered data from the IAEAs Power
Reactor Information System (PRIS) database We took the installed capacity in MW
for the year when the reactor was constructed the number of reactors that were built
by EDF previously to audit the experience and the average UCL and US7 lifetimes for
each pair of units Descriptive statistics of the data are presented in Table 22
223 Multicollinearity and Principal Component approach
One of the main econometric problems identified in literature on nuclear construction
cost escalation is the multicollinearity between the explanatory variables and in partic-
ular the high correlation between installed capacity and industry experience To deal
Chapter 2 34
Table 22 Descriptive statistics
Variable Unit Mean Median Minimum Maximum Std
Cost e2010MW 114 114 082 163 019Cap MW 2156 1840 1740 2945 43691ICHT Index 100= 1973 49646 50440 21810 92196 17899EXPI reactors 2741 26 1 56 1730EXPP reactors 1203 12 1 30 897EXPT reactors 510 4 1 16 416UCL 712 707 307 1195 208US7 events7000 hours critical 077 069 018 140 031
with this problem Zimmerman (1982) suggested using a monotonic transformation of
overall experience instead of the original variable In subsequent studies such as those
by Cantor and Hewlett (1988) and McCabe (1996) the issue was solved by taking the
builders experience into account instead of the overall industry experience which eased
the high correlation among these variables
For the French case the multicollinearity problem is severe There is a single builder
(EDF) so experience increases with time and also with installed capacity because
the scale-up has been progressive On top of that we observe a sustained increase
in the labor cost index As we can see in Table 23 these three variables are highly
correlated which illustrates the difficulty of obtaining significant results in a linear
regression framework
Table 23 Correlation Matrix
Ln Cap ICHT EXPI EXPP EXPT UCL US7
Ln Cap 100ICHT 074 100EXPI 086 096 100EXPP -044 018 003 100EXPT -023 004 -002 054 100UCL -002 -035 -028 -048 -050 100US7 -008 -026 -023 -029 -021 053 100
Indeed when we include all of the coefficients in a linear regression they are imprecisely
estimated (see Table 24) This problem is confirmed with the high estimates for the
Variance Inflation Factor (VIF) (see Table 25) The standard way of solving multi-
collinearity problems is to eliminate one or more explanatory variables Although we
tried different specifications none of them resulted in significant estimates and the VIF
remained high The results of these models are shown in Appendix B
Unfortunately within this framework it is not possible to figure out the main drivers
because all of the explanatory variables move in the same direction thus our data
set appears redundant By using a principal component regression we have overcome
Chapter 2 35
Table 24 Linear regression estimates
Coefficients Estimate Std Error t value Pr(gt |t|)(Intercept) -0188 12454 -0015 0988
Ln Cap -0092 1477 -0063 0951Ln ICHT 0187 0399 0470 0643
EXPI 0002 0021 0127 0900EXPP -0003 0015 -0257 0800EXPT -0008 0009 -0825 0419UCL -0018 0019 -0967 0345US7 0014 0103 0143 0888
Table 25 VIF for explanatory variables
Ln Cap Ln ICHT EXPI EXPP EXPT UCL US7
116728 32345 183909 26865 2273 2166 1482
this limitation With this method we can obtain relevant information from our data
set reducing it to a smaller dimension and revealing simplified underlying correlations
between the costs and the explanatory variables
Principal component analysis is an established multivariate technique developed by Pear-
son (1901) and Hotelling (1933) In economics this method has been applied in a wide
range of subjects for instance in macroeconomics and finance by Fifield and Sinclair
(2002) and in development by Zanella and Mixon (2000) and used to construct socio-
economic indexes by Filmer and Pritchett (2001)
The main idea of this procedure is to take the correlation matrix which we denote by
C = XprimeX (where X is the n times k matrix of centered and scaled explanatory variables)
and then compute the k times k eigenvector matrix9 V
Given that VVprime = I we can rewrite a lineal model Y = X primeβlowast as follows
Y = βlowast01 + XVVprimeβlowast (22)
Y = βlowast01 + Zα (23)
Where Z is the n times k matrix of principal components This matrix contains the same
information that X but the columns are arranged according their share in the variance
9 Recall that the eigenvectors of a square matrix A are defined as the vectors that solve AW = λWwhere λ is a real or complex number called eigenvalue They can equivalently be defined as thevectors that solve (Aminus λI)W = 0
Chapter 2 36
Each principal component is a linear combination of the explanatory variables The
characteristic vectors define the weights or loadings (matrix V) and the roots (eigenval-
ues) denoted byλ identify the most important components (the higher the eigenvalue
the higher the share in the variance)
Once this decomposition is done the next step in this framework is to eliminate the prin-
cipal components (columns of Z) associated with the smallest eigenvalues (λ) in order
to reduce the variance that is causing the multicollinearity and estimate the significant
coefficients
23 Results
Although we are interested in the coefficients between the costs and explanatory vari-
ables one of the main advantages of the principal component approach is that we can
identify underlying relationships among the explanatory variables thanks to the loadings
in each component Table 26 shows the loadings and roots for the correlation matrix
of our model
Table 26 Loadings and roots
Comp 1 Comp 2 Comp 3 Comp 4 Comp 5 Comp 6 Comp 7
Ln Cap 0441 -0398 -0008 0282 -0088 0475 -0576Ln ICHT 0552 -0086 0218 -0229 -0015 -0729 -0232
EXPI 0553 -0173 0165 -0088 -0054 0282 0738EXPP 0106 0534 0335 -0605 -0076 0390 -0256EXPT 0095 0495 0368 0643 -0433 -0081 0039UCL -0313 -0429 0188 -0262 -0781 -0035 0016US7 -0274 -0295 0800 0103 0429 0028 -0009
λ 81643 66622 21171 14004 9840 2624 0093
This decomposition can be interpreted as follows The components are ordered according
to their importance which is represented in terms of variance percentage (ie the roots
λ) As each component is a linear combination of the explanatory variables those with
the highest loadings show us what each component represents
For instance in our case the first component explains 41 of the total variance in which
the variables with high loadings are wages capacity and cumulative experience This
component represents what we could call the the large size syndrome or as Cooper (2010)
termed it the Bupp-Derian-Komanoff-Taylor hypothesis This hypothesis stated that
as the nuclear power industry (vendors and utilities) gained experience they were able
to identify how to improve reactors performance and ultimately design more complex
and bigger units
Chapter 2 37
The second most important component accounts for 33 of the variance The variables
with high loadings are experience within palier and type and the two safety perfor-
mance indicators Given that these loadings have opposite signs we can think of this
component as a safety feedback This second component shows that constructing sim-
ilar reactors (either in size or type) resulted in better performance in terms of safety
indicators in the most recent units of each series in particular the reliability indicator
(UCL)
Going in the same direction Roche (2004) claimed that even when equipment inside
plants of the same series was identical and laid out in the same manner the experi-
ence gained by EDFs engineering division at series level resulted in specific and minor
modifications in order to improve reliability and safety
Even though this component decomposition gave us some insights on the French nuclear
power program we had to select the number of components to be included in the linear
regression estimation After selecting the optimal number of principal components
we were able to see how the explanatory variables were related to the variable we are
interested in ie construction costs Among the possible criteria to determine the
optimal number of components we took the root mean squared error of prediction
(RMSEP) criterion Using the leave-one-out cross-validation method we found that
using the first two components minimizes the RMSEP
Once the optimal number of principal components had been selected we computed the
coefficients for the original linear regression In Table 27 we present the estimates for our
set of explanatory variables Given that we had to standardize our explanatory variables
we differentiated the coefficients that we obtained from the centered and scaled matrix
with (βlowast) from those that we obtained for the original data denoted by β in Table 27
Table 27 Principal Component Regression Results
Coefficients βlowast β se(β) t-value
LnCap 0222 1131 0106 9489Ln ICHT 0212 0553 0536 10089EXPI 0226 0226 0020 9996EXPP -0048 -0048 0011 -3581EXPT -0046 -0046 0009 -3074UCL -0042 -0042 0022 -2677US7 -0050 -0050 0016 -3544
In the light of these results we confirm that as in the US case the scaling-up of the
French nuclear program did not translate into cost reductions The regression coefficient
for capacity in Table 27 shows that an increase in this variable will induce higher
construction costs per MW
Chapter 2 38
However as we have mentioned in the previous section we cannot overlook pure economies
of scale given that this variable captures the size from the complexity effect The lack of
or at least weak economies of scale in nuclear power plant construction is a well-known
phenomenon It has been identified that constructing larger reactors means an increase
in technological complexity and construction lead-times that requires better managerial
coordination and induces closer and stricter regulatory standards which in turn increase
the construction costs To sum up we can conclude that the greater the size of the unit
the higher the risk of cost overruns (Cooper (2010))
Regarding overall learning effects we also found that cumulated experience did not
induce a reduction in costs This result is often seen as a consequence of the intrinsic
characteristics of a complex technology such as nuclear power In particular we can
argue that given that an important part of the design of a nuclear power plant depends
on the characteristics of each site (Cooper (2010) Grubler (2010)) it is likely that the
experience gained in the construction of any reactor in a given location would not be
directly applicable to other projects and that this prevents achieving lower costs
These first two results can be summarized in the large size syndrome component As
mentioned before it has been observed in the nuclear industry that the experience gained
by vendors and operators translates into adjustments and improvements with the effect
that new reactors are bigger more complex and more expensive than their predecessors
In the French case Grubler (2010) and Finon (2012) argued that the potential learning
effects from the overall industry experience were not fully exploited precisely because
when EDF and Framatome gained experience the decision was taken to construct an
entirely new French nuclear reactor (ie Pprime4 series)
Nevertheless when we take into account experience within the same palier and type
we find a positive learning effect In Table 27 we can see that the estimates for these
variables are negative however their effect was less significant than that of the other
variables This result means that some cost reductions were achieved due to the stan-
dardization strategy adopted in the French nuclear power program
The intuition behind learning effects within the same type of reactor is straightforward
but less clear at palier level precisely because the reactors within them are not exactly
the same A possible justification is that each palier also represents a phase of the French
nuclear program Hence reactors within the same palier were designed and built in the
same time window and most of them were also built on the same sites which suggests
that suppliers workers engineers and locations did not change substantially during the
construction of one palier but that they did change between them
Chapter 2 39
To our knowledge this is the first time in economic literature that public data has
be used to justify the gains EDF claimed it obtained thanks to the standardization
strategy For instance Roche (2004)pointed out that the construction of the same series
of reactors made it possible to reduce the number of hours of skilled labor per unit and
obtain better prices for components In the light of our results we can conclude that
indeed these gains helped to reduce construction costs after the first unit of the series
was built
This result is also linked to another characteristic of the French nuclear program ie
multi-site construction involving several reactors of the same type built at one location
This strategy is another factor in easing cost escalation and citetRoche argued that a
discrepancy in location conditions translates into a gap in costs when constructing the
same type of reactor at different sites however these projects do not require a completely
new design or new components and thus the costs are avoided
Another important result shown in Table 27 is that reactors with better safety indica-
tors and so lower UCL and US7 values are related to higher costs Therefore we have
some evidence that the latest reactors although more expensive have also embodied
safety improvements that have helped to reduce the number of unplanned outages that
might induce an accident
These two last results are summarized in the second component which we call safety
feedback Here we have two counteracting effects on the one hand we determined
that constructing the same type of reactors induces cost savings which reflects positive
learning effects and on the other hand we observed that the newer reactors register
better safety indicators but that this improvement means an increase in construction
costs
This result shows the implicit trade-off between standardization and technological change
that is key to understanding the economics of nuclear power Even if it is true that
standardization reduces uncertainty and could lead to lower costs as we found for the
case of the French nuclear fleet it is also true that when new technologies are available
there is no reason to keep using older and less efficient technology especially when new
designs improve safety
In summary this result indicates that building similar reactors reduces the technological
uncertainty linked with adopting a new design and at the same time as Roche (2004)
has pointed out improves understanding of how minor modifications can be made to
improve reactors safety performance For this reason standardization can been seen as
one of the potential sources of savings for future nuclear reactors and also a way to
achieve better safety performance
Chapter 2 40
24 Conclusion and Policy Implications
In this paper we sought to use the current construction costs recently published in the
Cour de Comptes report in order to identify the main drivers of the cost escalation of
nuclear power construction in France to re-address the existence of learning effects and
to test whether the cost increase is related to safety improvements
It was originally believed that cost escalation was a factor of about 35 when comparing
the unit costs of units built in 1974 with those completed after 1990 (Grubler (2010))
Using the new data we found that the escalation was a factor of about 15 from the first
unit to the most recent and that the escalation was thus less severe and by no means
comparable with the US case For this reason it is important to review the actual
construction costs of the French nuclear power programme to identify the elements
that should be taken into account to overcome or at least mitigate the cost escalation
phenomenon
This analysis is particularly important for those countries that are interested in em-
barking upon nuclear power programmes Within the European context nuclear power
can play an important role in energy transition to a decarbonized electricity supply It
is important to recall that despite the German nuclear phase out there are other EU
members states like the United Kingdom for instance that see in nuclear an alternative
to meet their CO2 targets while securing their energy supply
On the basis of our analysis using the Cour des Comptes data there is every reason
to believe that construction cost escalation is mainly due to a scaling-up strategy The
increase in the reactors size involved a technological change that induced the construction
of more complex units meaning longer lead times to build them and ultimately an
increase in costs per MW As mentioned before it is not possible to rule out the presence
of economies of scale precisely because bigger reactors are more complex The recent
experience in the construction of the first of a kind EPR reactors has confirmed that
larger reactors are likely to be more expensive
For this reason capacity could be one of the first features that nuclear vendors should
rethink in the long run In this direction several authors such as Rosner and Goldberg
(2011b) and Kessides (2012) have outlined the advantages of installing small modular
reactors10 They argue that these reactors have shorter construction schedules and lower
market risks which reduces capital costs In addition they consider that other cost
savings can be achieved through off-site module fabrication as well as from learning by
doing in the production of multiple modules Moreover investments could be recovered
10 Small Modular Reactors are nuclear power plants with 300MWe or less capacity
Chapter 2 41
quicker because construction lead times are likely to be shorter than for bigger units
(Rothwell and Ganda (2014))
Nowadays small modular nuclear reactors are still in an early stage of development
None of the existing concepts have been tested licensed or constructed However in
the US the Department of Energy has conceived a small modular reactor technical
support programme to accelerate the design certification and licensing of small modular
reactors with different vendors and it is expected to have its first regulatory approval by
2018 If these reactors become affordable and meet all safety standards they may be an
interesting alternative
Regarding our results on learning effects we found that overall experience did not trans-
late into lower costs but that positive learning effects were achieved through construct-
ing the same types of reactor Given the nature of this result it would appear that the
French nuclear power programmes standardization and multi-unit location strategy has
been successful because it has helped to overcome delays and uncertainties during the
construction process and thus has reduced the costs of subsequent reactors in the same
series
This lesson is particularly important for those countries that are interested in installing
a high number of new nuclear power plants Unlike other technologies the construction
of a nuclear power plant depends largely on on-site characteristics and therefore one
way of overcoming the cost escalation curse could be to reduce technological variety and
construct multi-unit sites Such a strategy could reduce the uncertainty that comes with
adopting a new technology as well as any design modifications required when reactors
are built in other locations
According to our result we can argue that it is likely to expect that the cost for the
EPR reactors that would be built after Hinkley Point C11 will be lower thanks to
learning effects Thus the guaranteed price to construct and operate these reactors
should be smaller However nuclear deployment in England takes into consideration
the construction of different type of reactors at other sites Therefore our results also
suggest that the experience gained in this project will not be directly transferable into
cost reductions for other projects in other locations given that the types of reactor that
are planned to be constructed are not the same
The results in terms of safety indicators show that reducing the risk of a serious acci-
dent has also played its role in French cost escalation as found by Cooper (2010) for
the US case Our estimates suggest that designing new nuclear reactors necessarily
includes safety improvements (reflected in better safety indicators) In consequence
11 EDF Energy is also proposing to build two EPR reactors at Sizewell C in Suffolk
Chapter 2 42
when safety concerns are partly internalized in the construction costs safer reactors are
inherently more expensive For this reason the economics of safety may constitute the
most challenging issue for the future of nuclear power On the one hand the terrible
consequences of a nuclear disaster as seen after the Fukushima Dai-ichi accident leave
no room for laxity On the other hand the particular nature of serious nuclear accidents
ie huge damage but very low and uncertain probability of occurrence makes it difficult
to determine whether safety investments are cost-effective
Once again the French case teaches us an important lesson An analysis of principal
components shows that the most recent units in the same series perform better in terms
of the safety indicators used in the model Thus standardization not only generates
learning effects in the construction process but can also play a role in terms of achieving
better safety levels
In conclusion an analysis of the current construction costs of the French nuclear power
programme provides important lessons for countries interested in building new nuclear
power plants on how to ease cost escalation This is an important issue given that the
continual rise in the construction of the latest generation of reactors puts into ques-
tion the competitiveness of this technology with respect to alternative sources of energy
Taking into account our results a good strategy would be to reduce the variety or types
of reactor to be installed in order to obtain positive learning effects not only regard-
ing construction costs but also regarding operations in particular safety performance
Another consideration is that new technologies such as small modular reactors might
be an interesting alternative to reduce capital costs given the smaller scale of units but
also the possibility of off-site module manufacture might reduce the risk of delays and
associated cost overruns
Chapter 3
Nuclear reactorsrsquo construction
costs The role of lead-time
standardization and technological
progress
31 Introduction
311 Toward a nuclear renaissance
By August 2014 the World Nuclear Association (WNA) lists 72 reactors under con-
struction in 14 countries1 This level of new builds represents a record for the nuclear
industry since 1987 Countries and investors interested in nuclear power have their eyes
on the outcome of these projectsas their successes could represent a green light for fur-
ther deployment of nuclear power while failures might led to a stagnation of new builds
and a decline of nuclear power share in the worldrsquos energy production
Even though the current status of new builds can be seen as a first step towards the
so-called nuclear renaissance there is a long way to go in order to see the industry
revival envisioned when this term emerged in the late 1990s At the same time most
of the drivers that could favor a nuclear expansion are still valid today increasing
energy demands in particular from developing countries the need to reduce fossil fuel
dependence and the increased awareness of the dangers and possible effects of climate
1 See the list httpworld-nuclearorgNuclearDatabaserdresultsaspxid=
27569ampExampleId=62
43
Chapter 3 44
change Despite this positive environment it is yet to be seen if a rapid expansion of
nuclear power capacity is possible and - more important - if it is economically profitable
If we take a closer look to the list of nuclear reactors under construction there are
reasons why one should be cautious when arguing that these projects could spur a rapid
expansion of nuclear power or even that they will come to term As pointed out in
the World Nuclear Industry Status Report (2014) 8 of these reactors have been under
construction for more than 20 years 1 for 12 years and 49 have already faced significant
construction delays
Unfortunately this is not a new situation for the nuclear industry as the construction of
new reactors has been characterized in the past with lengthy lead-times in particular in
western countries For instance Schneider and Froggatt (2014) noticed that the average
construction time of the last 37 units that started since 2004 is 10 years This is twice
what is usually expected by nuclear vendors It is also substantially longer than the 3
years period to build a combined cycle gas plant and the 6 years period to build a coal
plant
In addition to the concerns about unexpected construction delays the second and prob-
ably most important challenge for nuclear power expansion is the economic profitability
of building those reactors Given that upfront investment costs are the main driver2
of nuclear electricity generating costs any unexpected and significant increase of the
expenses during the construction can significantly undermine the profitability of the
project When the construction costs of a new nuclear power plant increase substan-
tially it can even be more attractive to abandon the project and for outsider investors
to consider other energy sources
These concerns regarding Generation III+ nuclear reactors competitiveness have initially
emerged in the United States (US) due to the escalation in the construction costs
expectations for new reactors The revised estimates took into account the changes
made by utilities in the application forms filled to the Nuclear Regulatory Commission
In 2003 the cost expectation was US$2000 (see Base case in Parsons and Du (2003))and
this figure progressively increased to US$4000 per installed kilowatt (see Parsons and
Du (2009) and Rosner and Goldberg (2011a))
Similarly the recent experience in the construction of the first of a kind EPR3 in Europe
has also contributed to revising expected costs of building new nuclear power plants in
OECD economies Despite that Finland and France have successfully built nuclear
reactors in the past this did not prevent that both to face significant cost overruns In
2 According to the IEA (2010) the share of the capital costs in the leveled cost of electricity in nuclearpower is between 60 to 80
3 European Pressurized Reactor
Chapter 3 45
France the construction of Flamanville 3 unit is almost 3 times more expensive than
initially expected (e3 billion in 2009 versus e85 billion in 2012) Not to mention that
the plant should not be operational until 2016 which represents nearly a 100 increase
in lead-time from 5 to 9 years
The cost over-runs experienced in the past and the multiple upward cost revisions and
delays in construction over the last decade represent important barriers for nuclear ex-
pansion as they limit the countries where new reactors can be installed These concerns
mean that nuclear new builds are risky projects first because there is no early yield
due to the lengthy lead-times and second because the yield is uncertain in the long
term due to possible cost escalations during the construction These issues are heavily
penalized by the financial markets and further restrict the amount of capital to invest
in the sector
Consequently more than 60 of the new build is located in countries where instead of
the financial markets (private investors) the government plays a central role as investor
in the power sector through state electric companies This is the case in China where
the three national nuclear utilities are largely or entirely state-owned In Russia the 6
reactors that are under construction are designed and owned by the state-owned Rosen-
ergoatom Corporation Finally iIn South Korea the 5 new builds care also designed and
owned by the state-owned Korea Electric Power Corporation (KEPCO)
Few of the new entrant countries that have raised their interest in nuclear power over
the last decade have started the construction of their first reactor Most of them have
postponed construction probably due to difficulties to finance these projects This
has been the case of Vietnam Poland and Turkey In addition even for countries with
lower financial constraints upfront investment costs have been the key driver to select
reactor design For instance according to Schneider and Froggatt (2014) the United
Arab Emirates chose a Korean design over Francersquos EPR because it offered the highest
capacity factors lowest construction costs and shortest construction lead-times
Taking into account the above we can argue that the expansion of nuclear power today
depends on how the industry identify the key elements that will curb investment cost
escalation and allow it to meet construction schedules
312 Existing literature on nuclear power plants construction costs
and lead-times
The economic literature on construction costs and lead-times of nuclear power plants
has so far failed to provide clear empirical evidence of their determinants partly due
Chapter 3 46
to a lack of comparable and reliable data Most of the existing econometric studies
have focused on US construction costs and attribute the escalation in costs to a lack of
standardization an increase in complexity of new reactors and safety related regulatory
interventions after Three Mile Island accident
A number of authors argue that the experience gained by nuclear vendors led to the
design of bigger and more complex reactors that took longer to build and required closer
regulatory oversight (Komanoff (1981) Zimmerman (1982) Rothwell (1986) Cantor and
Hewlett (1988) and Cooper (2012)) It is also generally accepted that the heterogeneity
in the US nuclear fleet and the multiplicity of vendors and utilities failed to achieve
learning by doing gains David and Rothwell (1996) argue that the lack of standard-
ization in the nuclear US fleet entailed ballooning of construction costs whereas some
positive learning effects are found by Cantor and Hewlett (1988) and McCabe (1996)
for construction projects managed directly by utilities
In the case of the French nuclear program (second largest nuclear fleet after the US)
the data on construction costs were only published in 2012 (Cour des Comptes (2012))
Beforehand the cost data used by Grubler (2010) was based on extrapolations of annual
investment expenditures of the nuclear utility EDF and rejected the existence of learning
by doing Conversely using the actual construction costs Escobar-Rangel and Leveque
(2012) find evidence of cost reductions due to learning effects within specific reactor
models
In this paper we propose the first empirical investigation of the role of lead-times
standardization and learning opportunities on nuclear reactorsrsquo construction costs us-
ing historical cost data from both the US and France This choice is motivated by
the fact that these two countries have followed different paths in terms of industrial
structure and technological diversity For instance while in the US several firms have
acted as Architect-Engineer (A-E) and vendors of nuclear reactors these roles have
been the responsibility of the utility EDF and Areva (formerly Framatome) in France
respectively Similarly if the two countries have both built Pressurized Water Reactors
(PWR) France has implemented fewer technological variations compared to the US
This means that by looking at French and US experience together one can benefit from
more heterogeneity in the data in order to test more research hypotheses and derive
robust estimates
Chapter 3 47
313 The contributions of this paper to the economic literature and
the nuclear energy policy debate
Our model is close to the one proposed first by Rothwell (1986) and then Cantor and
Hewlett (1988) In particular to the latter where a two-stage least squares equation
model is estimated for construction costs and lead-time using US data However our
analysis tackles a number of other empirical shortcomings First our study allows a
direct comparison of nuclear reactorsrsquo overnight construction costs in the two countries
using the access to data4 on engineering and other related expenditures for French
reactors which are not detailed in the Cour des Comptes (2012) report
Unlike other papers we distinguish the potential benefits of standardization that might
arise in the short term from those that can appear in the long term In the short term
we argue that a reduced diversity of designs under construction in a particular year
can affect the costs and the lead-time of an ongoing project due to coordination gains
(for instance scale effects in the componentrsquos supply chain or for the safety assessment
by the regulatory agency) We also consider that standardization may allow long term
benefits through learning by doing spillovers gained from past experience in building
similar units In order to capture these spillover effects we differentiate the previous
experience based on reactor models and A-E firms
At the same time we study the possible effects of learning by searching (ie innovation)
on construction costs given the importance of public RampD expenditures on nuclear
power Evidence of a positive learning by searching effect has only been found using
cost and innovation data from energy economics modelling tools (Jamasb 2006) In
that respect to the best of our knowledge there is no existing literature that has looked
at the effect of innovation using actual cost data Hence our study is the first to bring
together data on nuclear power overnight construction costs and knowledge capabilities
data the latter measured as a stock of knowledge based on patent data
Our results suggest that standardization of nuclear power programs is one of the main
factors in limiting costs escalation In the short term a low diversity of reactors under
construction leads to coordination gains that reduces costs indirectly through a reduction
in lead-time More importantly this result is also confirmed by using data of lead-
times of other OECD countries with different market structure and technological paths
notably Asian countries (ie Japan and South Korea) that have achieved to maintain
relatively constant their construction lead-times
4 These data on overnight construction costs have been made available to the authors by EDF Assuch they differ slightly from the data available in the Cour des Comptesrsquo report where expenditureregarding engineering work pre-operating expenses etc are presented at an aggregated level
Chapter 3 48
We find that standardization allows learning effects We have denominated this spillovers
as the long term benefits of standardization considering that the cost reductions will
only appear if the same nuclear model is built by the same A-E firm repeatedly This
highlights the importance of reactor design standardization and the role played by the
A-E firm in reducing construction costs increases
We further show that contrary to other energy technologies (Erickson and Drennen
2006) there is a negative effect of learning by searching on reactorsrsquo overnight construc-
tion costs This means that the variable that captures innovation and knowledge is one
of the main drivers of the cost escalation registered in the US and France This result
opens the door for further research on the areas in which innovation in nuclear power
technologies has focused In the literature (Berthelemy 2012a) has found that innova-
tion is closely linked better safety performance which in some sense allow us to think
that innovation has been partly driven by nuclear safety considerations
These results suggest paths for future cost reductions through greater standardization
of reactor technologies and more emphasis on the role of A-E firms in improving the
competitiveness of nuclear power In parallel from a policy perspective one may argue
that lead-time will play a more important role under a liberalized electricity market
where higher discount rates may apply meaning that the competitiveness of nuclear
power will be more conditional on the standardization of nuclear programs For this
reason we have explore further the trends of the construction lead-times in other OECD
countries
The rest of the paper is organized as follows in Section 32 we present the model
and main hypotheses regarding learning effects and the data Section 33 describes
our empirical strategy and the results Section 34 further investigates international
experiences with nuclear power construction using a larger dataset on nuclear power
lead-time and finally we conclude in Section 35
32 Model main hypothesis about learning opportunities
and data
321 Model for construction costs and lead-times in nuclear power
In the process to construct a nuclear power plant many firms are involved First an
electricity generation firm (hereafter the utility) places an order for the construction of
a nuclear reactor and selects a specific design offered by a nuclear vendor Once the
design is chosen the construction is managed by an Architect-Engineer (A-E) firm who
Chapter 3 49
is in charge of supervising and coordinating the constructor the nuclear steam supply
system manufacturer the turbine manufacturer as well as a number of subcontractors
The allocation of firmsrsquo responsibilities may differ between projects for instance it
is possible that the utility decides to act as the A-E (as it is the case in France and
sometimes in the US)
Rothwell (1986) proposed a structural model to represent the involvement of multiple
firms in the construction of a nuclear power plant In his model the utility seeks to
maximize the net present value of the project by selecting an optimal construction lead-
time given the technical characteristics that were chosen in the tender (ie capacity
reactor design etc) The A-E firm will minimize costs given the the optimal lead-time
selected by the utility
In this paper we retake some of the elements in Rothwell (1986) but instead of a
structural model we opt for a reduced form model closer to Cantor and Hewlett (1988)
We propose an two least squares estimation (2sls) for the construction costs and the lead-
times taking into account that there might be some unobserved variables that affect the
simultaneously both variables For instance we can think that there are additional costs
associated with longer construction periods like rental of idle specialized equipment and
labour force or unexpected costs (and delays) due to defective components Cantor and
Hewlett (1988) also pointed out that longer lead-times increase the risk of regulatory
intervention which might lead to construction changes and therefore cost increases
Given that OLS estimators will be biased we will use the expected electricity demand
(EDemi) as an instrument for lead-time as in Cantor and Hewlett (1988) They con-
sidered this variable as a valid instrument inspired in the structural model in Rothwell
(1986) First because the lead-time is chosen based on the expected demand and second
because it does not influence current construction costs Our baseline model specifi-
cation follows Equations (31) and (32) where Xi is a vector of independent variables
which can impact both cost (CTi) and lead-time (LTi) and will be further presented in
the next sub-section
CTi = α0 + α1LTi +
Jsumj=2
αjXij + υi (31)
LTi = β0 + β1EDemi +
Jsumj=2
βjXij + εi (32)
Chapter 3 50
3211 Hypotheses on the role reactorrsquos design standardization
As aforementioned we are interest in investigating the role of standardization in con-
struction costs and lead-times In our set of explanatory variables we are going to
test two potential efficiency gains may be expected from the standardization of nuclear
programs The first one aims to capture the benefits (in terms of cost reductions) that
might arise in a short time period while the others will test the presence of learning by
doing that can be seen as a long term effect
Our first hypothesis is that standardization benefits can arise in the short term from a
low diversity of nuclear reactors under-construction We expect that when a reactorrsquos
design is being built in the same country in the same year the project might benefit
from coordination gains during the construction period This can be motivated by the
fact that similar high-tech components will be built during a short time window such as
steam generators or turbines leading to economies of scale Similarly a low diversity in
reactors under-construction also lowers technological uncertainty and therefore it reduces
the number unexpected events that might delay the construction
To measure this potential benefit of standardization during the construction period we
compute a Herfindahl Hirschman Index (HHI) index based on the number of specific
reactor models under-construction when the construction of reactor starts This index
is defined according to Equation (33) as the sum of the squares of the market shares
of the M reactor models under-construction in country c and year t To capture this
expected benefit of standardization we also control for the number of reactors under-
construction (NPPUCi) as for instance a high HHI could either correspond to a
situation where only one reactor is under-construction or to a situation where multiple
and similar reactors are being built
HHIct =
Msumm=1
s2mtc (33)
3212 Hypotheses on learning by doing
Regarding the potential benefits of standardization in the long term David and Rothwell
(1996) recognized that there is a trade-off between the ability to learn from diversity
in nuclear reactors versus learning from similar models Nowadays this trade-off is
important given that in some countries like China the current strategy is more directed
to favor the construction the same type of reactor repeatedly rather than to diversify
the nuclear fleet While in others like the case of UK it is envisioned to construct
different models in different sites
Chapter 3 51
Because nuclear reactors are complex units the ability to derive learning effects may
be conditional to the similarities between reactors models and the A-E which builds
reactors In that respect we hypothesize that learning by doing can take place through
two main channels nuclear reactors completed by the same A-E firm (ExpArqi) and
nuclear reactors of the same design completed (ExpMoi)
Furthermore the benefits of learning by doing might also be conditional on the A-E firm
experience with specific nuclear design (ExpArqMoi) This variable corresponds to the
second potential benefit of standardization that we wanted to test This more restricted
level of learning by doing opportunities corresponds to the traditional definition used in
the economic literature (Irwin and Klenow 1994)
It is important to mention that in the previous literature the learning by doing was
measured using either the cumulated experience at the country or firm level In this
paper we are going to decompose the country level experience (ExpCi) into four level
of learning effects (i) The experience of the A-E with the reactor model (ExpArqMoi)
(ii) the experience of the A-E with other models (ExpArqNoMoi) (iii) the experience
of other A-Es with the same model (ExpNoArqMoi) and (iv) the experience of other
A-Es with other models (ExpNoArqNoMoi)
ExpCi = ExpArqMoi +ExpArqNoMoi +ExpNoArqMoi +ExpNoArqNoMoi (34)
3213 Hypotheses on leaning by searching
One standard hypothesis made in the energy economics literature is that learning by
doing might not be the only source of cost reductions In particular learning by searching
is often found in many empirical studies dealing with the energy sector like Larsen
and Sundqvist (2005) and Erickson and Drennen (2006) as a variable that contributes
significantly to cut back costs In the case of nuclear power the impact of innovation
activity on cost remains an empirical question
According to Jamasb (2006) innovation activity may contribute to cost reduction how-
ever it can also be argued that innovation in nuclear power essentially deals with safety
improvements because of the role of safety regulation As such innovation might lead
to safer but more complex and more expensive nuclear reactors
As a proxy for nuclear innovation we rely on a unique dataset on nuclear specific patents
using a discounted stock of priority patent applications We use the patent class Y02E30
which covers technologies specific to nuclear fission reactor technologies The discounted
Chapter 3 52
stock is set at the country level reflecting the fact that innovation can come both from
RampD laboratories and nuclear vendors and can be understood to reflect national knowl-
edge capabilities We set the discount factor δ at 10 a conservative parameter found
in many studies on the dynamics of innovation (Peri 2005) This variable is denoted
Knowit and is defined according to Equation (35) where for each nuclear reactor we
use the discounted stock of patented innovations in country i when construction starts
at time t
Knowit =infinsumk=1
(1minus δ)k Patentitminusk (35)
322 Data
In our model we have taken the overnight construction costs expressed in 2010 e per
MWe as our variable of interest These costs comprise the engineering procurement
and construction expenses but they exclude those related with financing or any cost
escalation due to changes in the interests during construction In short this cost repre-
sents the lump sum up front that would have to be given if the project was completed
rdquoovernightrdquo
We have used the overnight costs instead of the actual construction cost for two main
reasons First because the financing expenses of each project will depend not only on
the lead-time but on the rate of interest on debt the debt-equity ratio and if it is
regulated how the capital costs are recovered By excluding these costs we get of rid
of the variance linked with differences on the financial structure of each utility and the
possible subsidies (that is very likely in the case of the French nuclear fleet) and we are
able compare all the projects with an uniform measure Second because we can focus
our attention on the potential effect of the observed lead-times in the engineering and
construction cost escalation if we have used the actual costs it would not have been
possible to isolate this effect
The cost data for the French nuclear fleet were collected from the French Audit Agency
Cour des Comptes (2012) report This sample only has 29 observations because the
costs on the report were presented by pair of reactors Regarding the US construction
costs we have included the cost data for 99 reactors (92 in operation and 7 shutdown)
published in Koomey and Hultman (2007) Unfortunately the capital costs for the 12
remaining operational reactors are not available
Figure 31 below highlights the strong differences between the trend in overnight con-
struction costs in US and France In particular we observe that over the entire time
Chapter 3 53
period the costs have more than doubled in France from 920eMWe in 1980 for the
Tricastin 3 and 4 reactors up to 2200eMWe in 2000 for the Chooz 1 and 2 reactors
In the US this increase has been much more rapid with the cost almost increasing by
a factor of 14 from 600eMWe in 1972 for Turkey Point 3 up to 8500eMWe in 1989
for the Shoreham reactor
One can also note that costs have been much more dispersed in the US For instance
if we look at nuclear reactors completed in 1986 in the US the costs range from
2000eMWe for Catawba 2 and 6250eMWe for the Hope Creek reactor Since France
and the US have experienced important differences in terms of industrial structure
choices during this period with more vertical integration and standardization of nuclear
reactor designs for France this figure provides an initial suggestion that the French
experience has been more successful in containing the escalation of construction costs
Figure 31 Nuclear reactorsrsquo overnight construction costs in the US and France
Following Rothwell (1986) we define the lead-time variable as the difference (in years)
between the commercial operation date and the construction start date This informa-
tion was taken from the IAEA Power Reactor Information System (PRIS) database
From this same database we have collected other reactor details as the net capacity
Chapter 3 54
(size of the reactor) in MWe information on nuclear reactor cooling systems and con-
tainment structures5 in order to define different reactor models In Figure 32 we plot
the construction lead-times of nuclear reactors in the two countries One can generally
notice that we observe the same trend as in the previous figure presenting construction
costs construction time has increased more rapidly in the US than in France This
Figure suggest that it might be possible that long construction time will generate other
expenses in addition to the financing costs owing to immobilized equipment and labour
force This may also reflect complexity of nuclear design leading both to more expensive
reactors and longer construction times
Figure 32 Nuclear reactorsrsquoconstruction lead-time in the US and France
The increase in lead-time still appears to be of a lower magnitude than the increase in
cost For instance lead-time in the US ranges from 5 years for the Vermont Yankee
reactor up to 233 years for the Watts Bar 1 reactor which represents a 5-fold increase
As instrument we have computed the 3 year time trend in the electricity consumption
as a proxy of the expected electricity demand For the French case we have taken the
national electricity consumption given that all the reactors are connected to the same
grid thus all the units intend to meet the national demands For the US we consider
the electricity consumption for the relevant market given that there is no common grid
5 Data about nuclear reactors cooling system and containment structure are detailed in the AppendixE
Chapter 3 55
therefore we took the time trend only of the electric power market6 where the reactor
was located The data was taken from the statistics of the Department of Energy (DOE)
for the US and the French National Statistics Institute (INSEE)
In the model we have also included a set of dummy variables The first one aims to
identify those projects in which the utilities were in charge of the construction project
and did not delegate it to a A-E firm For the US case we turn to the information
provided by the Nuclear Regulatory Commission (NRC) For France these data do not
require any specific access as EDF has always acted as the A-E firm and is the sole
utility to operate nuclear reactors The other dummy variables were included to control
for the possibility of structural breaks following two major nuclear accidents Three Mile
Island (TMI) in 1979 and Chernobyl in 1986 Because the TMI accident took place in
the US we also investigate for the possibility that this accident has had a heterogeneous
effect in the two countries with country specific TMI dummy variables
Finally we collect data on prices for two major inputs to the construction of nuclear
reactors cement and labour force These data are collected from the French National
Statistics Institute (INSEE) and the US Census Bureau respectively for the two coun-
tries All the definitions and descriptive statistics for our relevant variables are summa-
rized in Table 31 below
Table 31 Descriptive statistics
Variable Definition Mean Std Dev Min Max
CT Cost in e2010MWe 2282 1639 599 8571LT Construction time 8578 3507 43 233Cap Size in MWe 992390 201854 478 14725HHIMo Standardization of reac-
tors under-construction0230 0171 0122 1
Know Discounted stock of nu-clear patents
58251 10396 32648 90339
ExpArqMo Experience A-E model( reactors)
1695 2672 0 14
ExpArqNoMo Experience A-E diffmodel( reactors)
9867 13162 0 54
ExpNoArqMo Experience diff A-Emodel ( reactors)
2921 4073 0 18
ExpNoArqNoMo Experience diff A-E diffmodel ( reactors)
27414 25731 0 87
ArqUtility Vertical integration A-Ewith utility
0382 0487 0 1
Cement Cement cost index 88019 31571 368 186556Labour Labour cost index 247568 168027 87439 921968EDem Future electricity de-
mand (3 year trend)043 010 017 061
NPPUC Reactors under-construction
42632 20747 2 69
6 We added up the electricity consumption of the states that from each one of the 10 electric powermarkets California MISO New England New York Northwest PJM Southeast Southwest SPPand Texas
Chapter 3 56
33 Model specifications and results France versus the US
331 Model specifications
The equations used to study construction costs and lead-time follows a Cobb-Douglas
functional form7 taking into account the endogeneity of lead-time we use expected
demand of electricity as an instrument and we control for the effects of capacity and
input prices A set of explanatory variables to identify learning effects is included as well
as the HHI index for short term standardization and dummy variables to differentiate
projects managed or not by the utility to capture the effect of structural breaks due to
major nuclear accidents and to control for temporal and country fixed-effects
Based on Equations (31) and (32) the equations for the baseline model specification
(Model 1) are as follows
ln(CTi) = α0 + α1 ln(LTi) + α2 ln(Capi) + α3 ln(Cement) + α4 ln(Labour)+
α5ArqUtilityi + α6 ln(ExpArqMoi) + α7 ln(ExpArqNoMoi) + α8 ln(ExpNoArqMoi)+
α9 ln(ExpNoArqNoMoi) + α10HHIMoi + α11NNPUC+
α12TmiUS + α13TmiFR+ α14Cherno+ α15Country + α16Trend+ υi (36)
ln(LTi) = β0 + β1 ln(Capi) + β2ArqUtilityi + β3 ln(ExpArqMoi) + β4 ln(ExpArqNoMoi)
+ β5 ln(ExpNoArqMoi) + β6 ln(ExpNoArqNoMoi) + β7HHIMoi
+ β8 ln(EDem) + β9NPPUC + β10TmiUS + β11TmiFR
+ β12Cherno+ β13Country + β14Trend+ εi (37)
In Model 2 we consider the possibility of learning by searching in addition to standard-
ization and learning by doing therefore in Equation (36) we include Know Model 3
focuses on the learning effects at the A-E firm level and we aggregate the experience of
the A-E firm regardless of the reactor model Finally Model 4 considers the experience
at the reactor model level regardless of the A-E firm
7 This functional form that has been extensively used in the literature on nuclear construction costseg Komanoff (1981) Cantor and Hewlett (1988) McCabe (1996)
Chapter 3 57
332 Results
The estimated output for Equations (31) and (32) is presented in Tables 32 and 33
below for the four different model specifications In each table we find the estimates
with the corrected standard errors in brackets underneath them
Before we proceed to present the results it is important to mention that the total effect
of the explanatory variables in the overnight costs has to take into account the partial
effect in the cost equation as well as the indirect impact in the costs through changes
in the lead-time equation As we can see in Tables (32) and (33) the estimate of the
lead-time is positive and significant therefore we have to offset the effect of the variables
in the first equation with the indirect effect in the second one as follows
d lnCT
d lnXk=part lnCT
part lnXk+part lnCT
part lnLTlowast part lnLT
part lnXk= αk + α1 lowast βk
The first result of our analysis refers to the importance of model specification in identify-
ing significant and positive learning effects in the construction of nuclear power plants
Previous studies account for the experience at the firm level as in Model 3 or at the
technological level as in Model 4 By comparing the results across the models we can
see that the estimates in Models 1 and 2 where we include the experience of the same
A-E firm in the same model ExpArqMo are those where we find the largest learning
effects While the learning effects are weaker in Model 3 and they do not exist in Model
4
The estimates of Model 1 and 2 allow us to conclude that in average we can expect
that the costs for the second unit of a reactor model built by the same A-E firm will be
reduced in 10 to a 128 This result goes in line with what is predicted in the economic
literature on learning effects and coincides with recent evidence (Escobar-Rangel and
Leveque 2012) on the French nuclear fleet To test the robustness of these results we
used different measures for the experience variables (ie ExpArqMo ExpArqNoMo
ExpNoArqMo and ExpNoArqNoMo) as shown in Appendix C9
Regarding the learning effects in the lead-time equation we find that experience in
the construction of other models either of the same firm (ExpArqNoMoi) or of others
8 Here we have computed the total effect of ExpArqMo in the cost In Model 1 is equal to(0022217)-0152=-010 and in Model 2 to (0022185)-01655=-012 If we consider that theexperience from the first to the second unit represent 100 increase in the experience we obtainthese results
9 For robustness tests we consider in Appendix C country specific time trends (with a quadraticterm) in order to control for instance for time variant changes in safety regulation in France andthe US We also define the learning by doing variables as 1(1+X) instead of ln(X) as both modelspecifications have been used in the literature Zimmerman (1982) Our results remain unchanged
Chapter 3 58
Table 32 Estimation output of Equations (31) and (32)
Model 1 Model 2Cost Lead-time Cost Lead-time
ln(Capi) -0897 0188 -0793 0188 (0175) (0068) (0170) (0068)
ln(Cementi) -0214 -0230(0405) (0394)
ln(Labouri) 0873 0154(0409) (0413)
ln(LTi) 2177 1825 (0468) (0465)
ln ExpArqMoi -0152 0022 -0166 0022(0034) (0015) (0033) (0015)
ln ExpArqNoMoi -0036 0039 -0025 0039 (0035) (0012) (0033) (0012)
ln ExpNoArqMoi 0021 0035 0008 0035 (0036) (0015) (0035) (0015)
ln ExpNoArqNoMoi -0296 0156 -0223 0156 (0099) (0023) (0096) (0023)
Knowi 1464 (0438)
HHIMoi 0917 -0415 0865 -0415 (0468) (0207) (0463) (0207)
ln NPPUCi 0429 -0102 0356 -0102 (0102) (0045) (0099) (0045)
ArqUtilityi -0332 0052 -0340 0052(0084) (0037) (0081) (0037)
ln(EDemi) -0404 -0404 (0079) (0079)
TmiUS -0847 0436 -0504 0436 (0248) (0050) (0246) (0050)
TmiFR -0328 0040 -0230 0040(0216) (0096) (0209) (0096)
Cherno -0348 0168 -0331 0168 (0142) (0037) (0137) (0037)
Constant 4829 -0449 -0828 -0449(1573) (0510) (2714) (0510)
Country FE Yes Yes Yes YesTrend + trend2 Yes Yes Yes YesObs 128 128 128 128Adj R2 0856 0914 0865 0914
(ExpNoArqNoMoi) has a negative impact on the construction periods which translates
into an increase in the construction costs This result shows that due to the complex-
ity of a nuclear reactor and the importance of A-E firms in construction projects it
is not possible to directly transfer previous knowledge and experience gained on the
construction of any type of reactor to the new projects
The estimates for the diversity index HHIMoi suggest that there might be some ben-
efits of standardization in the short term through reductions in the lead-time Recall
that when this index is close to zero it means that the nuclear fleet under construction
is diverse then these potential benefits will vanish This result can be explained by
the fact that an heterogeneous demand in the components could lead to supply chain
Chapter 3 59
Table 33 Estimation output of Equations (31) and (32)
Model 3 Model 4Cost Lead-time Cost Lead-time
ln(Capi) -0803 0170 -0814 0167 (0184) (0067) (0184) (0064)
ln(Cementi) -0451 -0360(0425) (0433)
ln(Labouri) 0711 0464(0436) (0442)
ln(LTi) 2328 2322 (0514) (0501)
ln ExpArqi -0121 0048 (0041) (0012)
ln ExpNoArqi -0243 0165(0108) (0021)
ln ExpMoi -0083 0036 (0033) (0011)
ln ExpNoMoi -0301 0188 (0116) (0021)
HHIMoi 1388 -0389 0920 -0030(0498) (0205) (0486) (0187)
ln NPPUCi 0325 -0099 0367 -0106 (0109) (0045) (0108) (0042)
ArqUtility -0410 0064 -0257 0019(0089) (0035) (0077) (0030)
ln (EDemi) -0383 -0404 (0078) (0074)
TmiUS -0824 0441 -0784 0452 (0277) (0049) (0274) (0047)
TmiFR -0238 0052 0111 -0175(0231) (0095) (0257) (0094)
Cherno -0391 0194 -0267 0155 (0160) (0035) (0150) (0034)
Constant 5503 -0301 6500 -0474(1678) (0503) (1851) (0472)
Country FE Yes Yes Yes YesTrend + trend2 Yes Yes Yes YesObs 128 128 128 128Adj R2 0837 0902 0827 0890
constraints and therefore some construction delays As such it is rational to find that
this short term effect impacts primarily the lead-time equation
Given the nature of these three results one may argue that the lack of standardization
harms the competitiveness of nuclear power in two ways Firstly it reduces the potential
gains in terms of costs savings in the long term through learning by doing at the
firm level Secondly it tends to increase the construction lead-times and therefore the
construction costs in the short term
In addition the estimates of our model highlight positive and significant economies
of scale It is important to mention that both in the US and France the nuclear
industry decided to construct bigger reactors aiming among other things to reduce
Chapter 3 60
the costs per MW installed In the light of these results we find that indeed even if
larger nuclear reactors took longer lead-times to be built they were also cheaper per
MWe For instance Model 2 indicates a net impact of -0793+(18250188)= -045
This coefficient can be interpreted as an elasticity meaning that a 10 increase in size
reduces construction costs in average by 45
With respect to the role of A-E firms we also show that when a utility takes the A-E firm
responsibility construction costs are lower than when a project is managed by another
firm This result has been identified in previous studies (eg Cantor and Hewlett (1988)
and McCabe (1996)) and it can be understood by the fact that a vertically integrated
utility reduces potential asymmetric information problems with the other firms involved
in the construction of nuclear reactors and this leads to cost reductions
The results for Model 2 show that the estimate for the discounted stock of priority patent
applications (Knowi) is positive and significant This result contradicts the pattern
observed in many energy technologies such as renewable energy sources (Erickson and
Drennen 2006) If we compare the estimates obtained in Model 1 with those of Model 2
we can see that the inclusion this variable that aims to capture the effect of innovation
reduces the importance of capacity and lead-times in the construction cost equation
This shows that bigger reactors embed innovations and that make them more complex
and need more time to be constructed The inclusion of this variable in the model allow
us to isolate the effect of complexity in the construction costs and as we can see in Table
32 this was one of the main drivers of the construction costs in the US and France
This result can partially be explained by the fact that the requirements of nuclear safety
authorities have induced innovations (Berthelemy 2012a) According to Berthelemy
(2012b) innovations in nuclear power sector are strongly related with improvements in
the safety performance of existing reactors This result highlights the long term trade-off
faced by the nuclear power sector on the one hand innovation is needed to reduce the
externalities associated with nuclear accident risks but on the other hand innovation
hampers the competitiveness of nuclear power through an increase in construction costs
One can also note that this result is contrary to the initial findings of Jamasb (2006)
who relies on data extracted from energy modelling tools Hence from a methodological
perspective this result stresses the necessity of looking at real cost data before drawing
policy conclusions on energy technologies costs trajectories
Finally it is important to analyze the effect of the major nuclear accidents in our system
of equations As we can see in Table 33 the impact on the construction costs both in
the US and in France due to TMI and Chernobyl (CH) came indirectly from an increase
in lead-time Logically TMI primarily impacted the US where this reactor was located
Chapter 3 61
and had no significant impact on France Chernobyl which took place in the Ukraine
had a positive and significant impact albeit at the 10 level on lead-time in the two
countries This result suggests that closer monitoring from nuclear safety authorities
following these accidents resulted in delays in the construction of the reactors installed
afterwards
34 Nuclear reactors lead-time Insights from other OECD
countries
The results presented in the previous section confirm that even discounting the financial
costs delays in construction affect the construction costs In addition they also point
out that a standardized nuclear fleet was one of the elements that made it possible to
reduce construction periods which ultimately resulted in a cost reduction
As mention in the introduction meeting the construction schedules will have a positive
impact in nuclear power competitiveness besides avoiding the negative effect of delays in
the construction costs First because it allows that the utilities generate revenues soon
This is particularly important in countries with private investors in the electricity sector
given that they employ higher discount rates than those used for public infrastructure
This implies that they might prefer to build a CCGT gas plant that can be planned and
built in 2 years and be willing to face the fossil fuel and carbon price risk instead of
waiting more than 7 years (in the best case scenario) to start recovering their investments
(MacKerron 2004)
Second because a long lead-time might encourage a wait-and-see policy For instance if
we take into account that with the pre-construction period it will take between 10 and
15 years for one reactor to be commercial it can be reasonable to delay the investment
and wait until the same technology is cheaper or other technologies become affordable
Third because in countries with increasing energy demands in the reactors should be
ready when needed Finally we can expect a shorter lead-time reduces the risk of
regulatory intervention and somehow it might even improve the perception of other
stakeholders have with respect to nuclear power
For the above in this section we further investigate the potential standardization benefits
on lead-time using a larger dataset on nuclear reactors from 6 OECD countries Our
aim is to test if the results that we have obtained in the previous section for the lead-time
equation hold when using a larger data set In addition we seek to gain some insights
into the construction of other nuclear fleets for which cost information is not available
Chapter 3 62
but the the average on lead-times is substantially lower than in the cases that we have
studied
341 Data and Model
The data used are also extracted from the Power Reactor Information System (PRIS)
database developed by the IAEA Similarly to the previous section lead-time is com-
puted as the difference in years between the construction and commercial dates for
reactors in 6 OECD countries We have considered the US France Canada South
Korea Japan and the UK Note that contrary to the previous section we can make full
use of the French data as contrary to costs data lead-time is available at the reactor
level
Figure 33 and Table 34 below highlight that the heterogeneity across our sample is
substantial This feature is understandable given the differences between countries and
across years in terms of labour productivity regulatory licensing process stage of de-
velopment of construction techniques etc To capture these effects we have included in
our model a fixed effect for each country as well as a time trend and a quadratic term
for the time trend
In the next table we present the means for the explanatory variables that we have
chosen to use in our regression model As we can see differences in the lead-time means
between the Western and Asian countries are substantial For Japan and South Korea
the construction of a new reactor took only 4 years approximately whereas in the US
or in the UK took more than the double even when the average size of the reactors is
similar
Table 34 Mean for the explanatory variables
Obs LT ExpArqMo HHI Cap(in year) (reactors) (index) (in MWe)
France 58 645 913 0472 1083Canada 22 707 229 0361 687South Korea 23 490 404 0672 8953Japan 50 410 3 0341 9191UK 17 863 480 0861 6451US 98 927 210 0152 9724All Countries 291 741 412 0378 9344
In Table 35 below we present the estimates similar to Equation (37) in previous Section
We have also included nameplate capacity electricity demand and the structural break
Chapter 3 63
Figure 33 Nuclear reactorsrsquo construction lead-time in OCDE countries
dummies as controls Two model specifications are considered the second one introduces
time fixed effects Other robustness tests can also be found in Appendix D10
These estimates show that increasing the size of the reactor has a positive and significant
effect on lead-time On average we have found an increase of 3 when scaling up by 10
This result confirms the importance of offsetting the scale effects in the cost equation
as although increasing the size of the reactor means lower costs per MWe the net effect
should take into account the increase in the lead-time
This model also confirms the insights from the previous section in terms of our HHI
diversity index Recall that high values of this index mean more market concentration
which in our case corresponds to a more standardized nuclear fleet On the basis of
the analysis using the lead-time there is strong and significant evidence that reducing
the diversity of the nuclear fleet is one of the major differences between countries with
longer lead-times and those with shorter construction periods
One can also notice the negative effect of the two major nuclear accidents on the con-
struction lead-time Both TMI and Chernobyl were found to be significant structural
10 In Appendix D we consider the four learning spillovers channels used in previous section and alsodefine them both as 1(1 +X) and ln(X) The results remain unchanged
Chapter 3 64
Table 35 Regression results for lead-time with experience and the HHI index
(1) (2)Variables (lnLT ) (lnLT )
HHIMoi -0291 -0472 (0135) (0182)
lnCapi 0395 0254 (0052) (0052)
ExpArqMoi 0019 -0008(0032) (0029)
lnEDemi -16970 -21219 (2866) (3265)
lnNPPUCi -0020 -0054(0033) (0047)
TmiUS 0432 0439 (0044) (0062)
TmiAbroad 0139 0142 (0054) (0061)
Cherno 0188 0214 (0029) (0027)
Constant 1105 1977(0402) (0440)
Country FE Yes YesTime FE No YesTrend + Trend2 Yes NoObs 286 286Adj R2 0840 0869Note Robust standard errors in parentheses
breaks showing that these events have an influence beyond borders As expected the
effect of TMI is stronger on the US compared to other countries
35 Conclusion
In this paper we investigate the role of lead-times the potential short and long term ben-
efits of nuclear reactor standardization and the effect of innovation on the construction
costs of nuclear reactors in the US and France between 1966 and 2002 using overnight
construction costs data Short term benefits are defined as the gains based on the diver-
sity of nuclear reactors under construction whereas long term benefits represent learning
by doing spillovers from similar reactors We use a discounted stock of priority patent
applications in the nuclear sector as a proxy of innovation
We estimate a two stage least square regression model for construction costs and lead-
time using the expected demand of electricity as an instrument for lead-time and control
for input prices and the possibility of structural breaks following major nuclear accidents
TMI and Chernobyl
Chapter 3 65
Our results identified the main drivers of the construction cost of the two largest nuclear
fleets in the world as well as the elements that explain the increase in the lead-times
registered in the past We show that the delays during the construction and techno-
logical innovations have led to an increase in the costs In addition we identified that
the continuous changes of reactor designs and the scale-up in the size of the reactors
explained part of the increase in the construction lead-times
We also found that there are positive learning effects in the construction of nuclear
reactors and the lead-times were shorter when the fleet under construction was less
diverse This result shows that the standardization strategy adopted in France was
successful in curbing the construction costs and avoiding the long lead-times that were
observed in the US
351 Policy implications for nuclear new-build programs
While this paper focuses on the US and French construction costs we argue that our
results are useful to explain some of the latest experiences in the construction of nuclear
reactors as well to suggest what we can expect it will happen in the construction of
other nuclear fleets For instance the continuous delays in the EPR construction in
Finland and France can be seen as the conjunction of two elements First the fact that
the EPR is a first of a kind means that the experience that AREVA or EDF had in
the construction of other models can not be directly transferable to this new project
According to our results we can expect an increase in the construction lead-time due to
this change The second element that may explain the delays is that the EPR is a big
reactor (it has a 1650 MWe capacity) in the light of our results it is likely that it takes
more time to construct compared with its predecessor (N4 model 1500 MWe)
Taking into account that the lead-times were found regardless the model specification
used as one of the drivers of the construction costs we can argue that the cost revisions
in the Olkiluoto-3 and Flamanville-3 can partly be explained by the delays faced dur-
ing the construction According to our model the construction costs of the EPR will
decrease only if more units of this same model are built
This last remark is important for ongoing nuclear new build programs We found that the
largest cost reductions due to learning by doing are conditional on the standardization of
nuclear programs considering that learning by doing spillovers only take place through
reactors of the same model built by the same Architect-Engineer (A-E) firm In that
respect one can expect that the cost of the last CRR-1000 reactors that are foreseen
in the Chinese nuclear power program will be cheaper than the predecessors The same
argue could apply in India where the nuclear fleet that is currently under construction
Chapter 3 66
includes 4 reactors of the same model (ie PHWR-700) build and later operated by the
same firm the Nuclear Power Corporation Of India One also expect that the costs for the
last APR-1400 in South Korea will decrease as KEPCO finish the ongoing constructions
of this same design
At the same time we show that vertical integration of the utility and the A-E firm
reduces construction costs Therefore it is possible that vertical integration will also
contribute to lower costs for the reactors that are under construction in India Korea and
Russia For new entrant countries this potential cost reductions will not be achieved
in the short term given that most of reactors will be build as turnkey projects like in
United Arab Emirates
We also show that short term gains from standardization have a positive impact on
construction costs through a reduction in lead-time the latter being one of the main
drivers of construction costs in France and the US This result is also confirmed for
a range of other OECD countries with heterogeneous nuclear programs and can be
explained by the fact that the diversity of nuclear reactor models can lead to delays
owing to supply line constraints or delays due to increased workload for the nuclear
safety regulator
In fact this result can be part of the explanation of the delays in the construction of the
AP-1000 and EPR reactors in China According to Schneider and Froggatt (2014) the
four AP1000 reactors at Sanmen and Haiyang have 18-30 months of delays due among
other issues to an insufficient support for regulatory review They also point out that
the first EPR at Taishan has a 13-15 month delay In this case the delays are linked
with malfunctions in the equipment and along with a lack of understanding with the
Chinese safety authorities Whilst our model does not allow one to distinguish delays
due to regulatory changes from those that arise from malfunctioning equipment or other
technical problems during the construction we can argue that when the nuclear fleet
is more diverse the safety assessment done by the safety authorities is likely to take
longer This might help to understand why the lead-times for the CRP-1000 model have
been kept relatively constant (it is a well known design for the Chinese safety authority)
while the difficulties during the safety assessment for other reactor models such as the
AP1000 and EPR have increased the lead-times in those projects
In parallel we also find that the discounted stock of patents in the nuclear industry
increases construction costs reflecting that innovation has not been focused on improving
nuclear competitiveness by reducing the amount of capital needed to build a reactor
This result goes in direct contrast to the pattern seen in other energy technologies
where technical progress contributes to costs reductions notably in competing carbon-
free technologies like wind power
Chapter 3 67
From a methodological perspective this result might explain why forecasts of nuclear
power share in energy mixes in energy economics modelling tools have not been met The
existing literature has shown that certain modelsrsquo calibration (Jamasb 2006) implicitly
assumes that nuclear construction costs benefit from innovation effort when in reality
what we found is that technological progress have made new reactors more expensive
This result highlights the importance of building these models on evidence based on
actual cost data
However the implications of this last result go beyond a methodological contribution
Why innovations have increased the costs of the each new generation of reactors
Berthelemy (2012b) argues that innovation in nuclear power has allowed the indus-
try to achieve better safety performance for existing reactors In other words one could
argue that safety requirements have led vendors to include better and more reliable com-
ponents and systems in new designs aiming to improve safety features For instance
Areva markets the EPR reactor as a Generation III+ precisely due to the level of safety
obtained compared to previous designs and argues that this latter design ensures an
rdquounequalled safety level thanks to a drastic reduction of the probability of severe acci-
dents as well as of their consequences on the environment In addition it is particularly
resistant to external incidents (airplane crashes etc)rdquo
352 Paths for future research
Our results allow us to conclude that nuclear power faces an interesting trade-off between
reductions in costs permitted by standardization and potential gains from adopting new
technologies with better operating and safety performance Unfortunately we cannot
answer the question of the optimal pace of technological change in nuclear power tech-
nologies with our model In addition we have to recognize that by using patent data
as a measure of innovation we captured incremental innovation but we were not con-
sidering the possibility of radical technological change In that respect nuclear power
has been characterized by incremental innovations from initial reactor designs in the
1950s Conversely radical innovations such as 4th generation of nuclear reactors could
contribute to costs reductions and further work is needed to better understand the cost
dynamic of such technologies
It is also important to note that safety regulation can impact construction costs and lead-
time through dimensions other than technological change In particular the scope of
standardization partly depends on the evolution of the safety rules in each country This
is reported to be the case in the US where according to Cooper (2010) the increase
in safety regulations issued by the NRC grew substantially following TMI (eg from
Chapter 3 68
three safety guidelines in 1970 to 143 by 1978) limiting the ability of nuclear vendors
to standardize nuclear reactors as they had to comply with changes in safety rules
Hence the US experience shows that safety regulation can have important consequences
on the economic competitiveness of nuclear reactors In that respect standardization
and safety regulation do not have to be per-se incompatible and one could argue that
for a given level of safety effort nuclear safety regulation should be designed in order to
allow nuclear reactors to benefit more from standardization gains
This last result opens the door for further research and also represents a challenge from
a policy perspective in those countries with interest in nuclear deployment In terms of
possible research questions we argue that it is important to identify clearly how differ-
ent safety regulations have affected the design of new reactors and disentangle the effect
of technical problems from the effect of regulatory interventions in the observed con-
struction lead-times In terms of policy it is clear that a better coordination regarding
nuclear reactor certification procedures through cooperation between national nuclear
authorities can improve nuclear competitiveness while ensuring an adequate safety level
For instance enabling for a reactor design to be certified jointly in several countries
could reduce significantly regulatory uncertainty before and during construction with-
out compromising required safety standards
Chapter 4
Setting optimal safety standards
for nuclear operators subject to
uncertainty moral hazard and
limited liability
41 Introduction
Operating a nuclear power facility is a hazardous activity One of the main concerns
of nuclear power safety is the possibility of an accident releasing of significant amounts
of radiation into the environment Prolonged exposure to these radioactive materials
could cause irreversible damage to living tissue in human bodies poison animals and
contaminate soil leading to large economic and environmental losses
Over the 14500 reactor-years in the history of nuclear power for commercial use two ma-
jor nuclear accidents1 have occurred (ie Chernobyl in Ukrania in 1986 and Fukushima
Dai-ichi in Japan in 2011) Both accidents led to considerable economic and environ-
mental damage For instance preliminary cost estimates for the Fukushima Dai-ichi
accident range from 250 to 500 billion USD not to mention that approximately 30000
1 The International Atomic Energy Agency designed the International Nuclear and Radiological EventScale (INES) to explain the significance of nuclear or radiological events Events are classed intoseven levels with each level taking into account the severity in three areas of impact people andthe environment radiological barriers and control and defense in depth The scale is designed sothat the severity of an event is about ten times greater for each new level on the scale The mostserious accident is rated 7 and is called a major nuclear accident
69
Chapter 4 70
km2 of Japanrsquos land surface was contaminated and more than 139000 people had to be
evacuated2
In case of an accident nuclear operators are liable for all damages even for those that
are not directly caused by them However when the costs are as high as they are after
a major nuclear accident the operator does not internalize all of the damage done In
some countries the nuclear operatorrsquos liability is limited by law therefore if the damages
exceed this limit the state has to pay for any harm that is not covered However even in
countries with unlimited liability it is possible that an operator will not possess sufficient
assets to pay for the damages completely and as a consequence society will have to bear
part of risk
The fact that nuclear operators might not completely internalize any harm they may
inflict distorts their incentives for ensuring safety This issue calls for ex ante regulation
to correct this externality and attain higher safety levels The under-provision of safety
in presence of limited liability has been studied by Shavell (1984) and Kolstad et al
(1990) They showed that ex ante regulation (setting safety standards) improves welfare
in particular when the magnitude of harm is much greater than the injurerrsquos assets (tacit
limited liability) or when the parties shall not face the threat of lawsuit for any harm
done (legal limited liability)
Concerning the above it is not surprising that nuclear power is one of the most regu-
lated industries in the world Basically all stages of nuclear power plant development
(ie design construction operation transport and use of radioactive material and de-
commissioning) are regulated by requirements and standards set by a safety regulatory
agency with the aim of reducing the risk of a nuclear accident For instance the US
Nuclear Regulatory Commission requires that only noncombustible and heat resistant
materials be used in the construction of a nuclear power plants containment and control
room in order to minimize the risk of fire and thereby the risk of accident
Unfortunately it took the devastating damages of the Fukushima Dai-ichi accident to
act as a wake-up call of how important it is to have a competent and independent safety
regulator Following nuclear experts safety assessment of the accident several scholars
such as Leveque (2013) and Wang et al (2013) concluded that the accident was the
result of a regulatory failure and not a black swan as initially thought The assessment
revealed that the Japanese safety authority knew about the possibility of a tsunami
waves exceeding 20 meters Despite this information the unitrsquos sea walls were never
back-fitted For this reason the credibility of the Japanese nuclear safety authority has
2 See Schneider and Froggatt (2014) and httpwwwpsrorg
environment-and-healthenvironmental-health-policy-instituteresponses
costs-and-consequences-of-fukushimahtml
Chapter 4 71
been severely questioned and regulatory capture has been suggested as the trigger of
this tragedy According to Gundersen (2012) the laxity of the Japanese regulator in
enforcing safety standards was a key cause of this disaster
In this context safety regulation plays a decisive role not only in maintaining a good
record in terms of a low frequency of accidents but also in the economics of nuclear
power On the one hand safety authorities must determine and be able to enforce the
acceptable risk level at which nuclear power plants should operate On the other hand
safety regulators must keep in mind the cost for operators of complying to standards
and rules in order to attain the envisioned risk level Thus regulators must identify
standards that reduce the risk of a major accident without compromising operatorrsquos
profits
Thus the key question for a nuclear safety regulator is how to attain a sufficiently small
probability of accident in a cost-effective manner From an economic perspective the
answer is to set a standard that equates the marginal cost of providing safety with the
marginal benefit of reducing the expected damages in case of accident However in the
case of nuclear power achieving this balance between costs and benefits is easy due to
the existence of several information-related problems
First the regulator cannot directly observe the operatorrsquos behavior (although this is not
specific to nuclear power) therefore it is not possible to enforce the first best safety level
at zero cost As shown by Strand (1994) and Hiriart et al (2004) in the presence of
moral hazard only second-best care levels are attained and the only way to implement
the first-best safety level is by heavily subsidizing the firm Here the challenge for
nuclear safety authorities is to define a policy that induces compliance with the safety
standards as the operatorrsquos optimal response Compliance is a fundamental element
in nuclear safety regulation given that on the one hand the safety authorities have
to guarantee to the public that nuclear facilities run below the acceptable risk level
and on the other that their reputation and credibility will be severely damaged if non-
compliance is widespread among operators
The second informational problem present in nuclear safety regulation is the epistemic
uncertainty regarding the probability of a major accident Safety authorities cannot
exactly determine the probability of a major nuclear accident based on the observed
frequency But even more importantly (for regulatory purposes) there is some uncer-
tainty as to how safety care translates into a lowerhigher probability of an accident
These factors result from the way in which nuclear reactors are designed Nuclear power
plants are complex they have multiple safety systems each with a backup and they are
designed to accommodate human error This redundancy in the systems aims to con-
trol damage and prevent accidents and significant radioactive releases Consequently
Chapter 4 72
nuclear accidents are rare making it difficult to measure the link between safety care
and the risk of accident
Considering the above the main goal of this paper is to examine the features of an
optimal safety regulatory policy for a nuclear operator that takes into account several
particularities First in the case of a major nuclear accident the operator is protected
(tacitly or legally) by limited liability In addition the regulator cannot observe the
safety care level chosen by the operator (moral hazard) thus the regulatory policy has
to provide incentives to the operator to comply with it Finally there is epistemic
uncertainty as to how safety care affects the probability of a nuclear accident
The problem of a lack of incentives to provide safety care in the presence of limited
liability has been studied by Shavell (1984) Kolstad et al (1990) and Hansson and
Skogh (1987) The provision of safety in presence of limited liability and moral hazard
has been studied by Strand (1994) and Hiriart and Martimort (2004) Hiriart et al
(2004) also derived an optimal regulatory scheme in the presence of these two problems
as well as considering adverse selection
One of the main features of these papers is that the regulator provides incentives to
the firm through transfers that are state-contingent (ie accidentno accident) Nev-
ertheless this is not realistic in the case of nuclear power because safety regulators
cannot reward at least not directly operators in case of no accident Broadly speak-
ing most of nuclear safety regulatory agencies are responsible for establishing legislative
documents regarding nuclear safety and supervising activities on nuclear installations
For this reason we prefer to model this situation as a compliance monitoring problem
In the literature a general model was proposed by Becker (1968) and has since been
extensively used afterwards to study environmental regulation (see Cohen (1998) for an
extensive review) Our model is close to that put forward by Arguedas (2008) In this
model the regulator sets a safety standard and then in order to provide incentives to
comply with it randomly inspects firms and is able to threaten operators with fines
To tackle the problem of the uncertainty of how safety care reduces the probability of
accident the nuclear industry has come up with a procedure called Probabilistic Risk
Assessment (PRA)3 This assessment employs a set of assumptions about the probability
of events that may induce a core melt as well as about the failure of each component
and the back-up systems and uses them to compute the core damage frequency (CDF)
The CDF tells us (theoretically) how long the reactor will run before undergoing at least
one core melt
3 The first PRA assessment carried out in the US is known as the WASH-1400 report This studywas done by Norman Rasmussen for the Nuclear Regulatory Commission and concluded that theaverage CDF was equal to 5E-05 with an upper bound of 3E-04
Chapter 4 73
The PRA identifies the main sources of risks and makes it possible to rank safety invest-
ments according to their effectiveness in reducing CDF In addition CDF is a metric
that the regulator can use to compare and monitor nuclear operators Nevertheless
CDF is itself a random variable and unfortunately PRA assessments do not derive its
distribution function at most they determine the interval within which this parame-
ter belongs In summary it is possible to claim that PRA gives the safety regulator
some information regarding how safety care can reduce the probability of accident but
uncertainty remains
This last feature means that although nuclear regulators do not possess a single precise
probability measure when setting the safety standards they at least have access to some
information (ie an interval of values coming from the PRA) on the link between safety
care and the probability of an accident To capture this element in our model we propose
to use the concept of imprecise (interval) probabilities as in Aven and Hiriart (2013)
In their paper they studied safety care investments from the firmrsquos perspective using
two robust optimization concepts ie worst-case and regret robustness In our paper
we also use these approaches but we assume that the operator has perfect information
regarding its efficiency in reducing the probability of an accident We can therefore focus
our attention on how uncertainty affects the safety regulatory policies
Our results suggest that when a nuclear safety regulator is conservative and seeks to
minimize the expected social costs in the worst possible scenario then safety standards
will be less stringent and nuclear facilities will be inspected more often Both results
are derived from the fact that the regulator is pessimistic as to how safety care can
reduce the probability of an accident In the second approach the regulator considers
the possibility that it may be wrong in its beliefs regarding safety care effectiveness
and it attempts to minimize the biggest mistake that it may regret In this case safety
standards will be stricter Nevertheless the risk of no compliance increases if the cost
of the standard is too high for the operator
In summary the optimal regulatory policy subject to uncertainty of how safety care
reduces the probability of accident will always imply a residual risk for society In the
worst-case approach the regulator can guarantee that all nuclear facilities will comply
with safety standards however the safety standard corresponds to the lowest possible
bound This means that if a regulator is not as pessimistic as in the above case it might
be possible to enforce a stricter standard and further reduce the probability of accident
In this case society bears the risk associated with the difference between the probability
of an accident defined by the standard and the probability that would be attained by
inducing the compliance of the least efficient operator
Chapter 4 74
In the second case when the regulator seeks to minimize the largest mistake it sets a
stricter standard However it cannot guarantee that all operators will operate below
that risk level given that some operators may prefer to pay a fine rather than comply
with the standard In this case the risk that society has to bear depends not only on
the difference between the standard and the least efficient operator but also on how
many operators cannot comply with the standard
The rest of this paper is organized as follows Section 42 presents the model and
characterizes the optimal regulatory policy when moral hazard is the only issue In
Section 43 we assume that only the regulator does not perfectly know how safety care
level reduces the probability of an accident and we explore the optimal regulatory policy
using two robust optimization approaches ie worst-case and regret robustness Finally
Section 44 concludes
42 The Model
We consider a nuclear operator that may provoke an accident that would harm third-
parties andor the environment In particular we are interested in major nuclear acci-
dents mainly because in this case firms are unable to pay for the totality of the damage
When a firm does not completely internalize the harm that it produces this is often rep-
resented with a limited liability constraint In our case we simply assume that either
tacitly or legally the nuclear operator just pays only a fraction γ isin (0 1) of the total
damage in case of accident The accident damage is denoted by D
The nuclear operator can exert a level of safety care that reduces the probability of a
major accident We are going to assume that the probability of an accident is given by
the function αminus βe4 Where e isin [0 1] corresponds to the nuclear operatorrsquos safety care
and the parameters α and β satisfy 1 gt α gt β gt 0
Note that the probability of an accident decreases linearly as safety care increases at a
rate β This parameter captures the firmrsquos efficiency in reducing the probability of an
accident while the reactor is in operation If β is low the operatorrsquos leeway to prevent
an accident is reduced meaning that the risks are strongly linked to the design itself If
β is high it means that the main hazards are likely to arise during operation and thus
the safety care that the operator exerts is important to prevent a nuclear accident
Note also that even when the operator exerts no safety care e = 0 there is a positive
probability of no accident 1minusα For this reason α could reflect the ex ante safety level
that is guaranteed by the nuclear vendor before the reactor starts to operate or the
4 And the probability of no accident will be (1 minus α+ βe)
Chapter 4 75
minimum accepted risk that is ex ante required to obtain a license to operate a nuclear
reactor
We assume that the cost of safety care is given by c(e) which satisfies the following
conditions cprime(e) gt 0 cprimeprime(e) gt 0 and c(0) = 0 In the absence of safety regulation if an
operator seeks to minimize the expected cost given by c(e) + (α minus βe)γD the solution
satisfies the following first order condition
cprime(eps)minus βγD = 0 (41)
The private optimum safety care level eps equates the marginal cost of care with the
marginal benefit of reducing the expected harm in case of accident This safety care
level differs from the first best outcome efb that is given by cprime(efb)minusβD = 0 due to the
operatorrsquos limited liability The lower the fraction γ which is the share of the damages
that the operator internalizes the greater the difference between the private and social
safety care levels This gap arises because the marginal benefit of avoiding an accident
is lower for the firm than for the society
The difference between the optimal levels of safety care eps and efb has been identified in
the literature as the one of the main reasons for using ex-ante regulation to complement
the incentive to exert safety care created by liability rules (see Shavell (1984) Kolstad
et al (1990)) However it has also been recognized that using safety regulation to
reduce the risk of hazardous activities involves information asymmetries In particular
the literature has focused on moral hazard arising because the regulator cannot directly
observe the safety care level e chosen by the operator5 This problem is solved by
allowing state-contingent transfers (ie accident no accident) In general the second-
best policy requires giving a moral hazard rent to the firm in order to induce a given
safety care level
In our model the regulator also provides incentives to the operator through transfers
however they are only feasible in one direction (from the firm to the regulator) This
means that we opt for a monitoring and punishment scheme which is a restricted set of
general incentive schemes We consider that this is a better setting for nuclear power
given that the mission of most nuclear safety authorities worldwide is to establish all the
legislative documents to guarantee that nuclear power plants are designed constructed
operated and decommissioned without jeopardizing public health (ie define safety stan-
dards) In addition safety authorities should perform inspection activities on nuclear
installations to verify that they comply with relevant legislation (ie monitoring)
5 See Strand (1994) Hiriart and Martimort (2004) Hiriart et al (2004) Hiriart et al (2006)
Chapter 4 76
Taking into account the above we decided to follow the model in Arguedas (2008) In
our model the regulator defines a safety standard denoted by s Given that it is not
possible to observe directly whether operators are in compliance the regulator inspects
nuclear facilities with probability q and each inspection has a unit cost equal to m If
it is found that the safety care selected by an operator is below the standard (e lt s)
the regulator can impose a fixed penalty F0 If it is found that (e gt s) no penalty is
imposed
The safety standard s stands for the compendium of all regulatory requirements that
are mandatory for the operator These rules are conceived by the regulator and are
considered essential to ensure the safe operation of nuclear power plants In other
words the safety standard includes an overall review of how an operator should conduct
its activities in order to perform effectively and prevent a serious accident
Regarding the probability of inspection q this can represent either that the regulator
visits all facilities but cannot perfectly detect whether an operator is complying with
the standard (measurement errors) or even if the detection of no compliance is perfect
the regulatory agencyrsquos resources are limited and so only a fraction q of the facilities are
inspected
Finally the fine F0 represents all of the legal measures that the regulator possesses to
deter non-compliance and that are costly for the firm6 We assume a fixed penalty
because in practice fines for nuclear operators are defined ex ante and do not depend
on the degree of non-compliance but rather on the fact that the violation has been
detected
Thus for a given a policy s q the expected cost for the operator depends on its whether
or not to comply with the safety standard
C(s q)
c(s) + (αminus βs)γD if compliance
c(e) + (αminus βe)γD + (1minus α+ βe)qF0 if non-compliance(42)
Note that the operator can only be punished with a fine in case of no accident which
occurs with probability (1minusα+ βe) If there is an accident it will not pay a fine but it
will have to compensate for the harm caused by the accident Given that he it protected
with limited liability the operator will pay γD however this amount is greater than the
fine (γD gt F0)
6 For instance the Canadian Nuclear Safety Commission can in addition to the ability of im-posing a administrative monetary penalty it is also enabled to remove the operation cer-tificate or to undertake a licensed activity and to lay charges against an operator in accor-dance with the legislation See httpwwwnuclearsafetygccaengacts-and-regulations
compliance-verification-and-enforcementindexcfmsec2-8
Chapter 4 77
As mentioned above nuclear regulators do not exactly know how the operatorsrsquo safety
care level reduces the probability of a serious accident precisely because both the reac-
tor and the plant are conceived to prevent these events The design of a nuclear facility
is based on the concept of defense in depth whereby if any component fails a succes-
sive chain of back-up systems kicks in to prevent core damage and reduce the risk of
releasing radioactive material This redundancy in the systems as well as the individual
characteristics of each operator (ie specificities of the site workers type of reactor
etc) makes it very difficult for the regulator to identify a single value for β
For the above we assume that the regulator does not know the exact value of this
parameter but it does know that it belongs to an interval[β β
] while β is perfectly
known by the firm Both agents know the value of the parameter α This last part of
the model has been introduced in order to study the effect of uncertainty on how safety
care reduces the risk of a serious accident in the regulatory policy
To exemplify our setting we can consider that the regulatory agency requires that
pumps and valves are tested a certain number of times during the year In this case the
standard s corresponds to the testrsquos frequency while e is the effective number of tests
that the operator carries out during a given year If the testrsquos frequency is lower than
required it may be less likely to detect failures in the pumps and valves thus increasing
the probability of accident To check whether an operator has carried out the test as
often as required the regulator must inspect the plant However it is difficult for the
regulator to quantify how much the probability of an accident will increase if tests are
done less frequently
All of these elements further complicate the problem of setting optimal standards for
nuclear safety authorities On the one hand authorities need to deal with the moral
hazard problem when setting the rules and on the other with uncertainty as to how
safety care reduces the probability of a serious accident Taking into account all of these
elements the problem that the regulator has to solve is the following
minsq
c(e) + (αminus βrege)D + (1minus α+ βrege)q [m+ F0]
st e = e(s q)(43)
Where βreg isin[β β
]is the interval in which the regulator thinks the true β lies And
e = e(s q) corresponds to the operatorrsquos best response function to a given regulatory
policy s q
Chapter 4 78
421 Benchmark The regulator knows β
As a useful benchmark we compute the optimal policy assuming that the regulator
knows β We proceed by backward induction First we find the optimal response of the
firm to a given policy s q and then we solve the problem of the regulatory agency
Given that the penalty F0 introduces a discontinuity in the expected cost function for all
the values that are lower than the standard (e lt s) intuitively the operator proceeds as
follows First it solves the problem in Equation (44) as if it had decided not to comply
Second it compares the expected cost of this solution with the cost of complying with
the safety standard Finally it decides to exert the safety care level that represents the
cheapest alternative
minegt0
c(e) + (αminus βe)γD + (1minus α+ βe)qF0 (44)
For a given policy s q the firmrsquos best response e(s q) can be decomposed in three cases
The first one corresponds to the case in which the firm over-complies (e(s q) gt s) This
case arises when the safety standard is so low that the operator prefers to increase
its safety care level to minimize the expected costs of an accident This solution is
equivalent to an absence of regulation therefore the operator will choose eps ie the
private optimal safety care level
In the second case the firm complies with the standard (e(s q) = s) Here the safety
care level that minimizes the operatorrsquos cost is the standard because the threat of
penalties increases the cost of lower safety care levels The last case corresponds to a
situation in which the operator optimally does not comply (e(s q) lt s) In this scenario
the standard is so costly that the firm prefers to pay the expected fine rather than the
cost of the safety care level that the regulator wants to enforce
Figure 41 illustrates these three possible cases taking a numerical example7 In each
panel the horizontal axis shows the possible values for safety care e and safety standard
s The vertical axis gives the values of the expected cost function We consider three
different safety standards (s = 01 s = 06 s = 085) and the same probability of
inspection (q = 05)
The first panel illustrates the case of overcompliance Here we assume a low standard
(ie s = 01) in which case it is optimal for the firm to choose a higher safety care level
In the second case (ie s = 06) the threat of a fine is effective to induce compliance
7 We considered a quadratic cost function and the following values for the parameters D = 2γ = 06 β = 08 α = 1 F0 = 02 and q = 05
Chapter 4 79
as we can see in the second panel of the figure all of the safety care levels below the
standard have a higher expected cost thus the standard is the level that minimizes the
costs In the final case it is too costly for the firm to comply with the standard (ie
s = 085) In this case the firmrsquos best response is to choose a lower level of safety care
denoted by n
Figure 41 Operatorrsquos best response to different regulatory policies (sq)
The solution to the firmrsquos problem is summarized in the next proposition the complete
proof is presented in Appendix F
Chapter 4 80
Proposition 1 Given the policy s q the nuclear operatorrsquos optimal response is
e(s q) =
eps if cprime(s)minus βγD minus βqF0 6 0
s if cprime(s)minus βγD minus βqF0 gt 0 and c(s)minus c(n)minus βγD(sminus n) gt q(1minus α+ βn)F0
n if cprime(s)minus βγD minus βqF0 gt 0 and c(s)minus c(n)minus βγD(sminus n) lt q(1minus α+ βn)F0
(45)
Where n satisfies the following condition
cprime(n)minus β(γD minus qF0) = 0 (46)
The previous proposition can be understood as follows The operator observes the
regulatory policy s q then it evaluates the first order condition of compliance with
the standard at its inferior limit to check if it is optimal to reduce safety care marginally
If the operator observes that this optimality condition is negative (first case) it means
that the marginal benefit of avoiding an accident is greater than the marginal cost of
the standard and it is preferable to increase safety care In this case the firm will
over-comply and exert the private optimal safety effort eps
On the contrary when the first order condition is positive or equal to zero this means
that there is no incentive to marginally increase safety care because it is too costly In
this case the operator simply compares the total expected cost of complying with that
of not complying and then decides If complying with the standard is more costly the
operator will choose a safety care level n lower than the standard s
It is important to remark first that the safety care level n will be lower than the level
which would be chosen in the absence of regulation eps due to the fact that the operator
may be punished even if no accident is observed which reduces even further the marginal
benefit of avoiding an accident Second n depends on the probability of inspection q
If we implicitly differentiate n from Equation (46) with respect to this instrument we
get partnpartq = minusβF0
cprimeprime(n) lt 0
This derivative tells us that conditional on non-compliance a higher probability of
inspection q reduces the gap between the expected costs in case of accident γD and in
case of no accident qF0 hence the level of safety effort n will be lower Although this
effect mat appear as counterintuitive it is not if we consider that the overall incentive
of a higher q is that it increases the incentives to comply
Once we have found the optimal response of the firm e(s q) we proceed to solve the
regulatorrsquos problem Here it is important to mention that the task that society has given
Chapter 4 81
to safety regulators is to guarantee that nuclear power plants operate below a maximum
accepted risk level which should be attainable by complying with the safety rules For
this reason the regulator seeks only to set policies s q that induce compliance This
means that the regulatory policy has to ensure that the operatorrsquos best response is to
comply with the standard (ie e(s p) = s) Therefore the pair s q should be such
that the expected costs of choosing safety care n are higher than those of complying
with s In general the problem the safety authority solves is the following
minsq
c(s) + (αminus βs)D + q(1minus α+ βs)m
st q = qc(s)(47)
The objective function corresponds to the expected social cost when the firm complies
with the safety standard To be sure that e(s q) = s we need to satisfy the conditions
of the second case in Equation (45) This is captured in the constraint denoted with
qc(s) that defines the equation of the possible monitoring probabilities q that will induce
compliance for a given standard s The values of the pairs s q in equation qc(s) should
satisfy the following implicit condition
c(s)minus c(n)minus βγD(sminus n)minus q(1minus α+ βn)F0 = 0 (48)
Given that monitoring is costly we discard the policies s q that the firm strictly
prefers to comply (ie Equation (48) less than 0) and focus on those that satisfy the
last condition with strict equality
If we differentiate this last constraint with respect to the available tools s and q we
ascertain how the probability of monitoring q should change to induce compliance when
standard s is changed In short we compute partqparts = cprime(s)minusβγD
(1minusα+βn)F0gt 0 This last result is
quite intuitive it tells us that higher standards require higher monitoring probabilities
to induce compliance whereas lower standards are easier to enforce in the sense that
they need less frequent inspections
Now we can proceed to find the optimal policy slowast qlowast that the regulator will set when
it perfectly knows the value of β The solution is summarized in the next proposition
Proposition 2 The optimal policy slowast qlowast that induces compliance is given by the fol-
lowing conditions
cprime(slowast)minus βD +partqc(s
lowast)
parts(1minus α+ βslowast)m+ qc(s
lowast)βm = 0 (49)
qlowast = qc(slowast) (410)
Chapter 4 82
The solution given in Equations (49) and (410) shows that the safety level that the
regulator can effectively enforce is lower than the first best outcome The presence of
moral hazard imposes the social cost of monitoring in order to enforce a safety standard
43 Imprecise probabilities and robust optimization
In this section we analyze the properties of an optimal regulatory policy subject to
uncertainty about the parameter β As we mentioned previously the safety authority
does not know the exact value of β nevertheless it knows that this parameter belongs
to an interval [β β] As a reminder if the operator knows the value of β then its best
response is still given by Proposition 1 In this situation the problem for the regulator
is the following
minsq
c(s) + (αminus βregs)D + q(1minus α+ βregs)m
st q = qc(s)(411)
Where βreg isin[β β
]
This problem can be solved using robust optimization techniques This methodology
makes it possible to assess optimization problems in which the data is uncertain and
when we only know that the parameters belong to a set The main purpose is to find a
solution that gives an acceptable performance under most realizations of the uncertain
parameters In this paper we use two approaches to solve the problem ie worst-case
approach and regret robustness
431 Worst-case approach
The objective of the safety regulator in this first case is to find the optimal policy in the
worst-case of all possible scenarios In the economic literature this optimization criterion
can be compared to the maxmin expected utility proposed by Gilboa and Schmeidler
(1989)
For our particular problem the worst case corresponds to a situation in which the regu-
lator considers the value of βreg that leads to the highest total expected cost Formally
the regulatorrsquos problem can be stated as follows
Chapter 4 83
minsq
supβ
c(s) + (αminus βregs)D + q(1minus α+ βregs)m
st q = qc(s)
βreg isin[β β
] (412)
Using the expected cost equation we find that partECpartβreg
= minuss(D minus qm) Given that we
are interested in major nuclear accidents we can argue that the cost of the damages
D is greater than the total cost of inspections qm For this reason we claim that this
derivate is negative therefore the social expected costs are inversely related to the value
of β
This means that the highest expected cost (ie the worst-case) over the possible values of
βreg is attained with the lowest value in the interval that it is equal to β The rationale
behind this idea is that the worst case that the regulator can envisage is when safety
care does not effectively reduce the probability of a major accident In other words
the regulator thinks that hazards are a result of the design rather than the operatorrsquos
behavior
To see how the optimal policy differs from the policy with no uncertainty in the param-
eter β we only need to check how the conditions in Equations (49) and (410) change
with respect to this parameter
Let us first see how the safety standard s changes in the worst-case approach with respect
to the benchmark case We use the first order condition in Equation (49) and computepartspartβ We find the following expression
parts
partβ=
D minus[partqc(s)parts s+ q
]m
cprimeprime(s) +m[part2qcparts2
(1minus α+ βs) + 2spartqcparts
]mgt 0 (413)
This result tells us that the regulator will be cautious when setting the standard taking
worst-case approach We know that the expected social costs will be a function of the
lowest possible value of βreg that is β Thus the positive derivate in Equation (413)
means that the safety standard will be the lowest possible when adopting the worst case
approach This corresponds to the least stringent safety standard denoted by swc The
overall probability of an accident that the regulator can guarantee is given by αminus βswc
This conservatism regarding the safety standard is due to the fact that in taking the
worst-case approach the regulator might be underestimating the effect that safety care
has in reducing the probability of accident
Chapter 4 84
We can now consider the probability of an inspection in the worst-case approach if the
regulator would wants to enforce a given fixed safety standard s This entails computingpartqcpartβ
partqcpartβ
= minusγD(sminus n) + qnF0
(1minus α+ βn)F0lt 0 (414)
This derivate shows how the regulator modifies the probability of inspection when his
belief about β changes This equation shows that the regulator weighs the incentives
that he has to give to the operator in order to induce compliance against the potential
amount of money that is not being collected through fines The fact that this derivate is
negative indicates that in the worst-case approach the regulator has to be more vigilant
For instance to enforce slowast he would have inspected more often than in the benchmark
case
These results are two sides of the same coin Since the regulator is pessimistic and
considers that the operatorrsquos safety care is not very effective in reducing the risk of
accident (ie β) the standard will not be very strict However this also implies that it
underestimates the operatorsrsquo incentives to exert safety care or the operatorsrsquo marginal
benefit of safety care As a consequence it will increase the monitoring frequency in
order to induce compliance
However note that the probability of inspection to induce compliance in the worst-case
approach qc(swc) is also determined by swc which we know to be lower than in the
benchmark case thus it will also be lower
The results that we obtain using the worst-case approach explain why some nuclear
safety authorities have invested in properly assessing the most effective ways in which
a nuclear operator can reduce the probability of nuclear accident It is likely that with
experience8 regulators have succeeding in gathering better information about β and
that they have realized that the operatorsrsquo safety care levels have an important effect in
reducing the likelihood of a serious accident
A good example of how nuclear regulators have improved their knowledge of how safety
care translates into a lower probability of nuclear accident is the continuous improve-
ments in PRA techniques PRArsquos have been preformed repeatedly in nuclear facilities
in order to identify the main sources of probable equipment failure that can result in
core damage PRA studies have allowed nuclear operators to efficiently allocate their
safety investments and therefore effectively reduce the likelihood of a serious accident
8 For instance David et al (1996) showed that thanks to the lessons learnt after the Three Mile Islandaccident that the standards and rules set by Nuclear Regulatory Commission led to substantialreductions in the risk of unplanned outages
Chapter 4 85
These improvements have also allowed nuclear regulators to set stricter safety standards
because with the PRA updates have revealed that the marginal benefit of safety care is
higher than their initial expectations
432 Regret robustness approach
The second criterion that we use in this paper is known as the regret robustness approach
or min-max regret criterion In economic literature this approach can be compared with
that taken byLinhart and Radner (1989)
In our setting the min-max regret criterion means that the regulatorrsquos objective is to
minimize the maximum difference between the objective function and its best possible
value In other words the regulator wants to identify the value of βreg for which it can
make the largest mistake (in terms of social costs) and then choose the regulatory policy
s qc(s) that minimizes the costs on that particular case
Intuitively we can say that there are two types of mistake that the regulator will regret
The first type of error arises when it sets a standard higher than the optimal one (s gt slowast)
because it selects a high value of βreg when the real β is low In this case the standard
is not only too costly but also ineffective to reduce the probability of accident
The second type of error arises when the regulator sets a low safety standard In this case
the regulator selects a low βreg for instance like in the worst-case approach (βreg = β)
when in reality safety care can significantly reduce the probability of a serious accident
(ie high real value of β) In this case the inefficiency arises because the marginal
cost of increasing safety care is lower than the marginal benefit In addition society is
unnecessarily exposed to a greater risk of major nuclear accident
To solve this problem the regulator proceeds in several steps First for each βreg isin[β β
]it determines the optimal policy slowast(βreg) qc(slowast(βreg) βreg) and then computes
EClowast(βreg) which corresponds to the minimum expected social costs for each βreg This
minimum expected cost function is given by following equation
EClowast(βreg) = c(slowast(βreg)
)+(αminus βregslowast(βreg)
)D +
(1minus α+ βregs
lowast(βreg))qc(s
lowast(βreg) βreg)m
(415)
Second it considers all the possible compliance-inducing policies s qc(s β) for all the
possible values of β that also belongs to[β β
] Here it is important to note that the
probability of inspection which induces compliance to a certain standard s will change
Chapter 4 86
according to the value of β that the regulator thinks is the real one Here we have denoted
by β the value that the regulator uses to compute the compliance-inducing policy which
might differ from the real one The expected cost function for these compliance-inducing
policies is given by
EC(s qc(s β) βreg) = c(s) + (αminus βregs)D + (1minus α+ βregs)qc(s β)m (416)
In the next step the regulator computes the regret function denoted byR(s qc(s β) βreg)
to measure the gap between these two last equations and determine the values of βreg
and β that maximize this difference Finally it selects the regulatory policy that mini-
mizes the costs in that particular case The problem that the regulator solves under the
regret robustness approach is the following
mins
supβreg β
R(s qc(s β) βreg) = EC(s qc(s β) βreg)minus EClowast(βreg)
st βreg β isin[β β
] (417)
Note that when β = βreg the regret will be minimized by setting the optimal policy
slowast(βreg) qc(slowast(βreg) βreg) (ie the regret will be zero)
If we differentiate the regret function with respect to β and βreg we obtain the following
partR(s qc(s β) βreg
partβ= (1minus α+ βregs)m
partqc(s β)
partβlt 0 (418)
partR(s qc(s β) βreg)
partβreg=D[slowast(βreg)minus s]minusm[slowast(βreg)qc(s
lowast(βreg) βreg)minus sqc(s β)]
minus (1minus α+ βregslowast(βreg))m
partqcpartβreg
(419)
The sign of the derivate with respect to β is negative and indicates as we have already
seen in the worst-case approach that the highest expected costs are reached when safety
care is not effective in reducing the probability of accident which means a low value for
β In our case this means that β = β
The sign of the derivate of the regret function with respect to βreg will depend on the
mistake that the regulator makes When it is very optimistic and thinks that the real
β is very high the standard it sets may be greater than the optimal one (ie error
Chapter 4 87
type 1) If this error predominates the first term will be negative and given the high
magnitude of D we could argue that the derivative is negative In that case the regret
robustness problem boils down to the worst-case approach because the biggest mistake
that the regulator will regret varies inversely with the value of βreg therefore the value
that maximizes the regret will be β
However when the regulator wants to avoid setting a standard lower than the optimal
one (slowast(βreg) gt s) it will focus on a case in which the derivative in Equation (419) is
positive Therefore when a type 2 error predominates the mistake that the regulator
will regret the most is having set a policy under the assumption that safety care is
not effective in reducing the probability of an accident (β = β) when in reality it is
(βreg = β)
We now study the regulatory policy that minimizes the regret function in this last
scenario ie with values of βreg = β and β = β The optimal standard when applying
regret robustness is denoted by (srr) and satisfies the following first order condition
cprime(srr)minus βD + βqc(srr β)m+ (1minus α+ βsrr)mpartqc(srr β)
parts= 0 (420)
In the worst-case approach the optimal safety standard which we denoted by swc satisfies
the same first order condition given in Equation (420) but the regulator does not
consider the possibility of error therefore instead of β we have β as follows
cprime(swc)minus βD + βqc(swc β)m+ (1minus α+ βswc)mpartqc(swc β)
parts= 0 (421)
Taking these two first order conditions we could conclude that the optimal standard
that a safety regulator will set taking a regret robustness approach is stricter than the
one it would set when adopting a worst-case scenario but lower than the one that it
would set when assuming that it does not make mistakes ie both βreg = β = β In
Figure (42) we plot the difference between srr and swc as well the standard that the
regulator would set under this ldquobest scenariordquo (βreg = β = β) and is denoted by sβ9
Although at first glance the regulatory policy under regret robustness seems better than
the worst-case approach it is important to point out that this regulatory policy also has
its drawbacks In this case there is a risk of non-compliance if the real value of β is low
enough Remember that the operator compares the net benefit of complying with the
expected penalty if it does not comply but unlike the regulator it knows the true value
9 In this numerical example we consider again a quadratic cost function and the following value forthe parameters D = 2 γ = 06 β = 08β = 088 α = 1 and F0 = 02
Chapter 4 88
Figure 42 Difference in the safety standards set taking worst-case and regret ro-bustness approaches
of β Thus when the marginal benefit of safety care for the firm is low (ie low β) a
regulatory policy that entails a high standard makes non-compliance more attractive
The risk of non-compliance highlights the potential drawbacks that a nuclear safety
regulator has to deal with when applying regret robustness criterion This issue becomes
more relevant when the interval in which β should lie is wide Contrary to the worst-
case criterion where only the level of β is important to define the maximum acceptable
probability of an accident when taking a regret robustness approach the regulator is
concerned with the length of the interval This is because the wider the interval the
more likely it is that the regulator will set standards that nuclear operators will not
comply with Hence it is not possible for a regulator to completely ensure that the
maximum probability of an accident is αminus βsrr
This latter issue is particularly relevant when the regulator has to set an uniform safety
policy for a heterogeneous nuclear fleet If we consider k nuclear operators each of which
is characterized by a different βk isin [β β] Under the worst-case approach the regulator
can be sure that all operators will comply because the standard is determined by the
least efficient operator (β)
With the regulatory policy set under regret robustness srr qc(srr) it is possible to
determine a marginal operator which is indifferent to whether it complies with the
Chapter 4 89
standard or not If we denote the efficiency of reducing the probably of an accident by
this marginal operator when applying the regret robustness with β we can argue that for
the operators that are less efficient than this marginal operator (ie βk lt β) is optimal
not to comply with the standard
44 Conclusion
We have developed a model to study the effect of uncertainty regarding the probability
of nuclear accident when a regulator has to set a safety standard subject to both moral
hazard and limited liability Our motivation is to take into account two of the main
features that nuclear power safety regulators have to deal with First the difficulty of
properly identifying how safety care impacts the probability of a major nuclear accident
Second the fact that nuclear regulators will always want to enforce safety standards that
induce compliance
This last feature steams from the fact that safety regulators have to assure society that
nuclear reactors operate below a certain acceptable risk level that should be attainable
if the operators comply with safety standards In addition we can expect that due to
the huge damages that a major accident might provoke laxity will not only increase
the risk of nuclear accident but will also harm the credibility and reputation of safety
agencies as seen with the latest nuclear accident in Japan
In our model the regulator controls the operatorrsquos safety care level by imposing a stan-
dard Since it is not able to observe operatorrsquos action the regulator also randomly
inspects nuclear facilities and is able to threaten the operator with a fine in case of
non-compliance To deal with the fact that the regulator does not perfectly know how
safety care translates into a lower probability of accident we use an imprecise probability
approach Using this methodology we assume that the regulator can define an interval
within which the parameters that define the probability of accident should lie We use
two robust optimization techniques ie worst-case scenario and regret robustness to
solve the regulatorrsquos problem and compare the results with a benchmark case in which
the regulator is perfectly informed
In the worst-case scenario the regulator sets a safety standard under the assumption
that operatorrsquos safety care is not effective in reducing the probability of an accident In
the terms of our model this assumption means that the regulator takes the lower bound
of the interval to set the regulatory policy this is represented by βreg = β Because
the expected damages of a major nuclear accident are huge by taking this value the
expected social costs reach their maximum value
Chapter 4 90
Our result suggests that the worst case regulatory policy will imply the enforcement of
the less stringent safety standard In addition we show that for a given standard the
regulator will inspect more often than it should to induce compliance These features
arise because the regulator believes that operatorsrsquo behavior is not effective in reducing
the probability of accident thus the safety standard will not be high Simultaneously
it means that the regulator believes that the expected benefits of safety care are not
big enough incentive to deter non-compliance which is why its optimal solution is to
increase the expected penalty by increasing the monitoring probability
Although the worst-case safety standard will not be as strict as when the regulator is
perfectly informed this by no means implies that the regulator will be lax When a
regulator believes that the real β is low some ways it is placing more emphasis on the
inherent risk of the technology that on the hazards that might arise during the operation
In consequence the regulator could be stricter in ex ante licensing and design rules In
terms of our model this means that the regulatory emphasis might be done in α rather
than in β
Complementary work and an interesting future research path would be to add a previous
stage to this model in which α is determined by a nuclear vendor and it then it subject
to some uncertainty for both the regulator and operator
In our second approach known as regret robustness the regulator seeks to determine a
policy that minimizes the largest error that it might make This means that it attempts
to find the value of the unknown parameter that maximizes the difference between the
expected social costs and its optimal value We find that the mistake that the regulator
will regret the most arises when it believes that safety care is not effective to reduce the
probability of accident (β = β) but in reality it is In terms of our model this means
that βreg = β
Taking this approach the safety standard will be stricter than that of the worst-case
standard and lower than the standard the regulator would set in a case in where it does
not consider the possibility of being wrong Although this is an intermediary solution
the drawback of the policy chosen under regret robustness is that it might induce non-
compliance for the most inefficient operators (those with a low β) This last result
provides yet another warning of once again about the difficulty of enforcing strict safety
standards not only because of moral hazard but also due to technological uncertainty
We think that it is possible to consider these two approaches as alternatives to achieve
a given acceptable risk level goal usually expressed in terms of the probability of a
major nuclear accident The first way would be to use the worst-case approach to set
the safety standard which although less stringent would be easier to enforce (in terms
Chapter 4 91
of frequency of inspection) In addition to ensure that the operators function below the
fixed threshold regulators could require a high ex ante level of safety features (low α)
as a condition to granting a license
The second possibility is to focus in on operation of the reactor In this case the
regulator can use the regret robustness safety standard which is more stringent and
requires a more frequent inspections but it allows it to tolerate a lower ex ante safety
level (higher α)
In fact if we look at how nuclear safety has been assessed by regulators we can com-
pare these two ways of achieving a given acceptable risk with the deterministic and
probabilistic safety approaches respectively In the former the emphasis is done on the
nuclear power plantrsquos design The deterministic approachrsquos main goal is to ensure that
within the conception of the unit various situations are considered to be plausible and
taken into account to ensure the containment of radioactive materials In the latter the
emphasis is on the operating stages The goal of the probabilistic approach is to identify
and analyze every possible situation and sequence of events that might result in a major
nuclear accident during the operation
We argue that these two approaches have acted as complements rather than substitutes
throughout the history of nuclear power for civil use In the first stages of development
nuclear regulatorsrsquo uncertainty was considerable For this reason they focused their
attention on the design and construction to ensure high ex ante safety levels but they set
conservative safety standards (as in the worst-case approach) As they gained knowledge
on how safety care can reduce the probability of accidents they were able to increase
safety standards In parallel technological progress has made it possible to achieve
better ex ante safety levels allowed safety regulators to set lower acceptable risk levels
and focus their attention on the operatorrsquos behavior and setting stricter safety standards
(as in the regret robustness approach)
Improvements in PRA techniques provide a good example of how these two approaches
have been complementary for nuclear regulators In our framework this would be rep-
resented by a continuous increase in the lower bound of β If nuclear regulators set
safety standards using a worst-case approach our model predicts that this improved
knowledge of the effectiveness of nuclear operatorsrsquo behavior in reducing the risk of acci-
dent will make it possible to enforce stricter standards However although we consider
that new designs achieve good ex ante safety levels it is possible that safety goals in
terms of accident probability also become stricter which makes it more effective for the
regulator to turn its attention to the operation of nuclear reactors This means that it
can set stricter safety standards (use regret robustness) to achieve the new acceptable
risk levels
Chapter 4 92
Despite the simplicity of our framework it highlights the pros and cons of the two main
approaches in nuclear power safety regulation and allows us to conclude that regulatory
policies subject to uncertainty on how safety care can reduce the probability of a major
accident will always entail a residual risk for society If a safety regulator adopts a worst-
case approach it will be able to assure that nuclear facilities operate below a certain risk
level attainable with the compliance of safety standards However the safety standard
might not be as strict as it could be in which case society bears the risk of enforcing low
safety standards when it could be possible to attain a higher level If on the contrary
the regulator takes a regret robustness approach standards will be stricter However it
will not be possible to guarantee that all nuclear facilities comply with it In this case
society has to bear the risks associated with the safety level chosen by operators that
decide not yo comply with the safety standards
Chapter 5
General Conclusion
This PhD thesis analyzed some of the challenges for nuclear power development that
were raised after the latest nuclear accident at Fukushima Dai-ichi power plant In
particular we have focused our attention on two issues that have a direct impact on
nuclear power competitiveness construction costs and safety regulation The concerns
about the possibility of building a new nuclear power plant at reasonable cost were
exacerbated after the accident inasmuch as it might induce extra costs in new reactors
Additionally the importance of setting stricter safety standards reemerged after it was
knew that the japanese safety regulator had information about the possibility of tsunamis
of the magnitude seen on March 2011 The reactions of both nuclear industry and nuclear
safety regulators to these issues will determine the future of nuclear power if these
reactions are correct they will allow the materialization of the nuclear renaissance if
not they will prevent an increase of nuclear power share in the worldrsquos energy production
Given this context the main objective of this dissertation was to provide answers to
the following questions how to properly estimate the probability of a major nuclear
accident which are the main determinants of the construction costs of a new nuclear
reactor and finally how nuclear regulatory agencies set safety standards given that the
link between safety care and the likelihood of a major nuclear accident is uncertain In
this thesis we have used actual data about the construction costs lead-times technolog-
ical choices and innovation coming from the two largest nuclear fleets in the world US
and France Additionally we have taken into account in our analysis the specificities
of a major nuclear accident to be able to give more accurate answers to the previous
questions
Undoubtedly the development of nuclear power in the world will depend predominantly
on how the industry is able to curb the cost escalation than has been seen as inherent to
this technology In consequence the results of this dissertation in terms of construction
93
Chapter 5 94
costs will allow us to identify which are the elements that enhance nuclear competitive-
ness either because they induce costs reductions or because they avoid delays during
the construction In addition they will be useful to explain what we could expect in
terms of cost and lead-times from the current reactors under construction given the
technological and industrial choices that have been made Finally they will allow us to
give some policy recommendations for those countries that have envisioned to construct
nuclear reactors in the near future
In parallel the further development of nuclear power will also depend on how safety
authorities are able to determine an accepted social risk level without harming the
profitability of nuclear operators or jeopardizing the inhabitants surrounding the nuclear
facilities The first step to set this objective is to properly assess the probability of a
major nuclear accident The second step towards this objective is that nuclear regulators
set safety standards in a cost-effective way In particular nuclear regulators must take
into account the uncertainty that exists between safety care and the probability of a
major accident The results of this dissertation in terms of safety regulation will be useful
to understand the trade-off underlying different regulatory approaches and determine
which is the best way to cope with the uncertainty regarding major nuclear accidents
The analysis in this PhD thesis is particularly important for those countries that are
interested in continuing or embarking upon nuclear power programs Within the western
context nuclear power is called to play an important role in energy transition to a
decarbonized electricity supply and reduce the dependence on fossil fuels Countries like
the United States the United Kingdom Poland and France contemplate nuclear power
within their future energy mix Moreover the most promising region for nuclear power
deployment is in the east of the globe In particular in countries with growing energy
demand and ambitious nuclear programs like China India Russia and Turkey
51 Conclusion about Construction Costs
Reducing the technological variety of the nuclear fleet by limiting the models that can
be installed is key to improve nuclear power competitiveness Our results showed that
the standardization of the French nuclear fleet was successful in curbing the construction
costs contrary to what happened in the construction of the US nuclear fleet We found
that building the same type of reactor repeatedly would allow to reduce the costs of the
last units of a given series According to our model in Chapter 3 we might expect that
the costs for the second unit of a reactor model built by the same firm would be reduced
in 10 to a 12
Chapter 5 95
This first result is particularly important for those countries that have conceived signif-
icant additions in nuclear capacity by building a high number of reactors Given that
the construction of a nuclear power plant depends largely on on-site and reactor char-
acteristics reducing the technological variety and construct multi-unit sites will mean
that a new reactor can be built without any design or site modifications and thus it
is possible to avoid the additional costs related with them In addition a standardized
nuclear fleet might reduce the probability of incidentals during the construction that
lead to delays and cost overruns Finally building the same type of reactor could induce
cost reductions thanks to the possibility of buying components in a larger scale
In the light of this result we can expect that Chinese nuclear fleet that nowadays
relies on the construction of several CPR-1000 reactors will be successful in terms of
progressively reducing the construction cost of this model This might be also what we
can expect to see in India where the nuclear fleet that is currently under construction
consists in 4 reactors of the same design (ie PHWR-700) We can also expect that the
costs of the new reactors in South Korea decrease in particular for the latest APR-1400
reactors that will be built
In the UK the situation might be different The potential cost reductions in the nuclear
fleet would be conditional to the result of the first project at Hinkley Point C We could
expect that if this project meet the initial budget and schedule and if it is decided to
continue with the EPR at Sizewell C in Suffolk the costs of these reactors will be less
than the previous However it is yet to be seen if this first experience with the EPR does
not repeat the cost overruns and delays in the construction as in Finland and France
The second lesson learnt from the construction of the US and French nuclear fleet is that
there existed positive and significant economies of scale This means that constructing
larger reactors might be a way to reduce the costs per MWe The results of Chapter
3 suggested that even if the construction of bigger reactors meant an increase in the
construction periods in average we could expect that an increase of 10 in the capacity
installed would reduce construction costs by 45 This result solved the impossibility
of testing economies of scale by using only the cost data coming from the French nuclear
fleet as we highlighted in Chapter 2
For countries with growing energy demand it is possible that constructing large reac-
tors will allow to supply much of the demand while allowing some cost reductions per
MWe installed and without taking a large space (contrary to wind farms for instance)
However as we have mentioned in Chapter 2 reducing the capacity of nuclear reactors
could be one of elements to rethink nuclear industry In fact we consider that the devel-
opment of small modular reactors might foster nuclear development in other countries
that have not yet considered it within their energy agendas either because they have
Chapter 5 96
lower energy demand or because they have restricted budgets In this sense smaller
reactors could have shorter construction schedules lower capital costs and the potential
of further savings due to off-site module fabrication
Our third important result highlighted the importance of meeting the construction sched-
ules as an effective way to curb the cost escalation Regarding this result we identified
different factors that explain why the construction periods in US and France have been
so lengthy The first explanation is linked to changes in the installed technologies We
have found that cumulated experience in other designs had a negative impact on the
lead-times that ended up raising the construction costs This result shows that the ex-
perience in the construction of other reactor models is not directly transferable to all
the projects hence it is likely to expect lengthy construction periods when a new design
is installed
We also have found that the increments in the lead-times in the construction of the US
and French fleet were partially due to the effect of the two major nuclear accidents
Three Mile Island and Chernoblyl This last result warns of the possible effects that
Fukushima Dai-ichi might have had in the reactors under construction We will have to
wait until they are finished to see if it is possible to link the potential delays during the
construction with a stricter supervision or new safety requirements due to the latest
major accident in Japan
All these factors that were key to understand the increase in the lead-times in the US
and France can also be used to explain why the construction of the EPR in Europe
has had continuos delays Given that the EPR is a new design a first of a kind
the experience that AREVA or EDF had in the construction of other models is not
directly transferable to this new project therefore it is likely that incidentals during the
construction translates into delays In addition we may explain the lengthy construction
period of the EPR as a result of its capacity (ie 1650 MWe ) We find that bigger
reactors take longer periods to be built for this reason it is likely to expect that it takes
more time to construct this design than its predecessor (N4 model 1500 MWe) The
first N4 model constructed in France took approximately 12 years
Our results also indicated that an homogenous nuclear fleet besides allowing cost reduc-
tions in the long run (ie after building repeatedly the same reactor) it might also have
some benefits in the short term through reductions in the lead-time For this reason we
are convinced that a standardization strategy enhances the competitiveness of nuclear
power in two ways As we mention at the beginning it allows costs savings through
learning by doing at the firm level But in addition it tends to reduce the construction
lead-times and therefore the construction costs in the short term
Chapter 5 97
In fact these results are also helpful to explain the first delays observed in the construc-
tion of the AP-1000 and EPR reactors in China China has based their nuclear program
around their CPR-1000 reactor and so far it has a good record in terms of construction
lead-times (4 years in average) However recently they decided to install Generation
III+ reactors by building four AP1000 reactors at Sanmen and Haiyang and two EPR
at Taishan Both construction projects have delays 18-30 months in the former and
13-15 months in the latter1 In the light of our results we can argue that part of the
increase in the construction lead-times is a result of a less homogeneous nuclear fleet
under construction
The last and perhaps the most important result in terms of construction costs that we
have found is that innovation has not improved nuclear power competitiveness Tech-
nological change in nuclear power has not induced reductions in the amount of capital
needed to build a new reactor On the contrary we found that it was one of the main
drivers of the cost escalation This result represents a major challenge for nuclear power
development given that it goes in the opposite direction with the pattern observed in
other energy technologies where technical progress has contributed to reduce their in-
vestment costs This trend has been registered in competing carbon-free technologies
like wind power and photovoltaics
This last result might partially be explained by the fact that the requirements of nuclear
safety authorities have pushed nuclear vendors to innovate in order to achieve better
safety performance in the existing reactors In Chapter 2 we found some evidence that
suggested that reactors with better safety indicators in terms of lower unexpected events
that might lead to a serious accident were related with higher construction costs These
results lead us to conclude that the latest reactors although more expensive have also
embodied safety improvements aiming to reduce risks of major accident
Taking into account the above we can argue that one of the possible reasons to explain
why the EPR is such expensive is precisely because it embodies some innovations that
allow it to achieve higher safety levels inter alia In fact AREVA promotes this design
saying that it is an upgrade in nuclear technology (ie Generation III+) precisely due
to the level of safety that it guarantees According to the vendor the EPR has an
expected core melt down frequency less than 1 event each one million reactor years
The trade-off between the benefits of standardization and those related with technolog-
ical change is of paramount importance for nuclear power development We started this
section arguing that standardization leads to lower construction costs hence it is key
for nuclear power competitiveness However we have also found that new designs have
better safety features This means that to adopt a new technology it is necessary to do
1 See Schneider and Froggatt (2014)
Chapter 5 98
a cost benefit analysis to see whether it is reasonable to invest in a better reactor in
terms of a reduced risk of accident or if instead the gain in safety does not worth the
increase in the costs and therefore it is better to keep on using the established technol-
ogy In this sense we can conclude that complementarily to a standardization strategy
countries interested in nuclear power have to consider within their programs which will
be the optimal pace of technological change
After studying the history of the construction of the US and French nuclear fleet we can
say that the relation between the economics of safety and nuclear innovation constitutes
the most challenging issue for nuclear power industry On the one hand it is desirable
to minimize the risk of a nuclear disaster as much as possible in particular after seeing
the terrible consequences of Fukushima Dai-ichi core melts But on the other hand
innovations have to be done without threatening nuclear power competitiveness In
summary we consider that nuclear industry should make innovation efforts not only to
increase safety performance but also in allowing to reduce the capital costs needed to
construct a new nuclear reactor
52 Conclusion about Safety Regulation
In terms of safety regulation our model in Chapter 4 highlighted the trade-off linked with
the adoption of both a deterministic and a probabilistic approach to regulate nuclear
facilities In some sense the deterministic approach focus in design of the unit as a
way to achieve a given accepted risk level This alternative can be related to our worst
case approach in which the regulator is not optimistic in how the operatorrsquos behavior
can reduce the probability of an accident Under this assumption the regulator will
fix the less stringent safety standard and monitor more often Given that he believes
that safety care is not so effective in reducing the probability of accident he thinks that
expected benefits of safety care are not a enough incentive to deter no compliance that
is the reason why he finds optimal to increase the monitoring probability
On the contrary the probabilistic approach focus the regulatory effort on the operatorrsquos
behavior Here the regulator believes that safety care during the operation of the
reactor is very effective to reduce the probability of a major nuclear accident In terms
of our model this approach is similar to the regret robustness criterion In this case
the regulator seeks to find a policy that minimizes the largest error that he can make
We found that if the safety authority sets the regulatory policy under this approach the
standard will be stricter compared with the the worst case standard but it will be less
strict than the one that the regulator will set in the case in which he does not consider
the possibility of being wrong
Chapter 5 99
Even though the safety standard obtained under regret robustness is more stringent
and might allow to achieve a better safety level it is important to remark that it might
induce no compliance of the less efficient operators This last result warns once again
about the difficulty of enforcing strict safety standards not only due to the problem of
moral hazard but also because technological uncertainty
From an static point of view the model that we have developed to study how to set
safety standards for nuclear operators captures both the pros and cons of the two main
approaches that have been used so far in the history of nuclear power The main
conclusion is that setting standards under the uncertainty on how safety care can reduce
the probability of major accident will always entail a residual risk for the society Under
the worst-case approach the society bears the risk associated with the difference between
the less efficient operator and the safety level provided by the standard If the regulator
prefers a regret robustness approach the standard will be stricter however it will no be
possible to guarantee that all the nuclear facilities comply with it Here the society has
to bear the risk associated with the difference between the safety level chosen by the
operators that decide to not comply and the safety standard
Up to this point it is important to recognize that our model is very simple and do not
pretend to capture all the features that a nuclear regulator has to face when setting
safety standards For instance we have reduced the operator effort to provide safety to
one dimension when it is multidimensional In the sense that nuclear operators perform
many tasks to achieve a given safety care level In addition we have assume that the
regulator can not observe the safety care level selected by the operator when it might
be possible that some of the standards are more easy to verify than others Given that
the multidimensionality and degree of observability of safety care may have an impact
on the regulatory policy these elements could represent possible extensions of our basic
model
Another important caveat of our model is that it is static therefore we can not conclude
anything about the transition of the regulatory process If this model is extended to
introduce dynamics in the way in which nuclear regulator set safety standards it might
be possible to determine when it is optimal to change from a deterministic approach
to a probabilistic one In fact if we revise the history of nuclear safety regulation
we can claim that roughly these two approaches have been complements rather than
substitutes The transition of the emphasis given to these approaches have changed to
the extent that the regulator has gained better knowledge about how safety care reduces
the probability of an accident
In the inception of nuclear industry (for civil uses) the uncertainties for regulators were
huge As a result they focused their attention in establishing safety rules related with
Chapter 5 100
the design and construction but they set conservative standards for the operation (as
in the worst case approach) Progressively they got better knowledge of how safety
care affects the probability of nuclear accidents For instance after the core melt down
in Three Mile island that was due to a mistake during the operation the US Nuclear
Regulatory Commission decided to carry out PRAs in nuclear reactors in order to detect
how nuclear operators could prevent events that lead to a serious accident The results
of the PRAs and their continuous improvements have given to nuclear operators precious
information about how to reduce the risk of a major accident In consequence they were
able to set stricter safety standards
In parallel new reactors have been installed As we have observed in the US and
French nuclear fleet (Chapters 2 and 3) new reactors have embodied innovations aiming
to achieve better safety performance This means that technological progress made it
possible to achieve better ex ante safety levels allowing safety regulators to set even lower
acceptable risk levels and translate their attention to the performance of the nuclear
operators through the adoption of stricter safety standards (as in regret robustness
approach)
It is clear that the complementary transition from a worst case to a regret robustness
approach is strongly related with technological progress Once again the relation be-
tween nuclear safety and innovation pops up as a cornerstone for nuclear power As we
mentioned in the previous section this relation was relevant to understand the cost es-
calation in the construction both in of US and French nuclear fleet It might be possible
that due to the increase on the safety performance of new reactors nuclear regulators
have been able to set stricter safety standards and pursue even lower accepted risks
levels However the impact of technological progress in nuclear safety regulation was
not studied in our model what makes this subject a potential area for further research
Appendix A
Cour des Comptes Actual
Construction Costs for the French
Nuclear Fleet
Table A1 Data from the Cour des Comptes report
Pair of units Capacity MW Year Type Overnight Cost (Me2010MW)
Palier 900 MW
Fessenheim12 1780 1978 CP0 0836Bugey23 1840 1979 CP0 0886Bugey45 1800 1979 CP0 0899
Damprierre12 1800 1980 CP1 1217Gravelines12 1840 1980 CP1 0822Tricastin12 1840 1980 CP1 1188Blayais12 1830 1982 CP1 1110
Dampierre34 1800 1981 CP1 1172Gravelines34 1840 1981 CP1 0856Tricastin34 1840 1981 CP1 1247Blayais34 1820 1983 CP1 0890
Gravelines56 1820 1985 CP1 1093SaintLaurent 12 1760 1983 CP2 1120
Chinon 12 1740 1984 CP2 1148Cruas12 1760 1984 CP2 1119Cruas34 1760 1984 CP2 1253
Chinon34 1760 1987 CP2 0978
Palier 1300 MW
Paluel12 2580 1985 P4 1531Paluel34 2580 1986 P4 1157
St Alban12 2600 1986 P4 1129Flamanville12 2580 1987 P4 1287Cattenom12 2565 1987 Prsquo4 1358Belleville12 2620 1988 Prsquo4 1083Cattenom34 2600 1991 Prsquo4 1149
Nogent12 2620 1988 Prsquo4 1194Glofech12 2620 1992 Prsquo4 1305Penly12 2660 1991 Prsquo4 1227
Palier 1450 MW
Chooz12 2910 2000 N4 1635Civaux12 2945 2002 N4 1251
101
Appendix B
Linear models for the
Construction Costs
In this Appendix we show the estimation results as well as the VIF for different speci-
fications of the linear regression model shown in Equation 1 The models that we have
estimated are the following
bull Model 2
ln(Ci) = α0 + α1 ln(Capi) + α2EXPIi + α3EXPPi + α4EXPTi + ui (B1)
bull Model 3
ln(Ci) = γ0 + γ1 ln(Capi) + γ2EXPPi + γ3EXPTi + ui (B2)
bull Model 4
ln(Ci) = θ0 + θ1EXPIi + θ2EXPPi + θ3EXPTi + ui (B3)
Table B1 Estimates for Model 2
Coefficients Estimate Std Error t value Pr(gt |t|)(Intercept) 5474 8444 0648 0523Ln Cap -0732 1125 -0650 0522EXPI 0013 0011 1193 0245EXPP -0008 0013 -0667 0511EXPT -0003 0008 -0386 0703
102
Chapter 5 103
Table B2 VIF for Model 2
Ln Cap EXPI EXPP EXPT73161 58620 20917 1794
Table B3 Estimates for Model 3
Coefficients Estimate Std Error t value Pr(gt |t|)(Intercept) -4502 1155 -3896 0001 Ln Cap 0598 0148 4032 0001 EXPP 0006 0003 1661 0109EXPT -0007 0007 -1027 0314
Table B4 VIF for Model 3
Ln Cap EXPP EXPT1257 1692 1429
Table B5 Estimates for Model 4
Coefficients Estimate Std Error t value Pr(gt |t|)(Intercept) -0017 0060 -0291 0773EXPI 0006 0001 4236 2e-04 EXPP -0001 0003 -0152 0880EXPT -0005 0007 -0768 0449
Table B6 VIF for Model 4
EXPI EXPP EXPT1003 1432 1432
Appendix C
Alternative model specifications
Table C1 Alternative model specifications
Model 5 Model 6Cost Lead-time Cost Lead-time
HHIMo 1249 -0400 0247 -0444 (0490) (0141) (0481) (0185)
lnExpArqMo -0153 0005(0041) (0011)
lnExpArqNoMo 0028 0024 (0035) (0009)
lnExpNoArqMo 00461 0014(0041) (0011)
lnExpNoArqNoMo -0095 0152 (0103) (0017)
InvExpArqMo 0335 -0025(0067) (0027)
InvExpArqNoMo -0097 -0007(0080) (0032)
InvExpNoArqMo -0150 -0016(0079) (0032)
InvExpNoArqNoMo 0181 -0337 (0245) (0076)
lnKnow 1291 (0598)
lnCap -0839 0117 -0609 0174 (0221) (0050) (0182) (0061)
lnNPPUC 0498 -0101 0318 -0040(0182) (0043) (0105) (0040)
ArqUtility -0255 -0008 -0292 0024(0096) (0027) (0087) (0034)
lnEDem -1202 -1467 (0108) (0125)
lnLT 2270 1133 (0820) (0686)
lnCement 0392 0003(0538) (0359)
lnLabour -2020 -0710(1365) (0808)
TmiUS -0055 0292 0075 0300 (0197) (0041) (0177) (0049)
TmiFR -0001 -0053 -0184 -0004(0252) (0071) (0223) (0089)
CH -0107 0053 -0051 0053(0140) (0030) (0122) (0036)
Constant 7841 -2220 -3776 -3056 (4597) (0428) (5726) (0507)
Country FE Yes Yes Yes YesCountry specific trend + trend2 Yes Yes No NoTrend + trend2 No No Yes YesObs 128 128 128 128Adj R2 0823 0960 0873 0940
104
Appendix D
Alternative model specifications
for lead-time
Table D1 Alternative model specifications for lead-time in OECD countries
(1) (2)Variables (lnLT ) (lnLT )
HHIMo -0509 -0458 (0189) (0200)
lnCap 0225 0240 (0051) (0052)
lnExpArqMo -0010(0031)
lnExpArqNoMo 00411 (0013)
lnExpNoArqMo 00141(0018)
lnExpNoArqNoMo 0080 (0041)
InvExpArqMo 00514(0111)
InvExpArqNoMo 0003(0032)
InvExpNoArqMo 0009(0048)
InvExpNoArqNoMo -0238(0163)
lnEDem -17010 -21240 (3857) (3387)
TmiAbroad 0126 0124 (0066) (0069)
TmiUS 0432 0448 (0060) (0062)
CH 0214 0214 (0029) (0027)
Constant 2111 2542 (0450) (0576)
Country FE Yes YesTime FE Yes YesObs 286 286Adj R2 0876 0872Note Robust standard errors in parentheses
105
Appendix E
List of nuclear reactor models by
manufacturer in France and the
US
Table E1 List of nuclear reactor models by manufacturer in France and the US
Model Manufacturer Number of reactors built
B W (L-loop) DRYAMB BabcockWilcox 9BWR-3 General Electric 1BWR-41 General Electric 15BWR-42 General Electric 4BWR-5 General Electric 5BWR-6 General Electric 4
CE (2-loop) DRYAMB Combustion Engineering 13COMB CE80 DRYAMB Combustion Engineering 2
CP0 Areva 6CP1 Areva 18CP2 Areva 10N4 Areva 4P4 Areva 8Prsquo4 Areva 12
W (2-loop) DRYAMB Westinghouse 3W (3-loop) DRYAMB Westinghouse 8W (3-loop) DRYSUB Westinghouse 4W (4-loop) DRYAMB Westinghouse 21W (4-loop) DRYSUB Westinghouse 1W (4-loop) ICECND Westinghouse 9
Total 157
106
Appendix F
Operatorrsquos best response
Proof of proposition 1 The Lagrangian for the operator as long as e gt s is given by
L(e λ) = c(e) + (α minus βe)γD + λ(eminus s) and the Kuhn Tucker first order conditions are
the following
cprime(e)minus βγD + λ = 0 (F1)
λ(eminus s) gt 0 (eminus s) gt 0λ gt 0 (F2)
In case that λ = 0 then the firm overcomplies and e gt s and the best response of the
firm in this case satisfies
cprime(eps)minus βγD = 0
In case that λ = 0 thus e = s The first order condition is cprime(s)minus βγD 6 0
The Lagrangian for the operator when e 6 s is given by L(e micro) = c(e) + (αminus βe)γD +
(1minusα+βe)qF0 +micro(sminus e) and the Kuhn Tucker first order conditions are the following
cprime(e)minus βγD + βqF0 minus micro = 0 (F3)
micro(sminus e) gt 0 (sminus e) gt 0micro gt 0 (F4)
In case that micro gt 0 then the e = s and the best response of the firm in this case is to
comply with the standards and satisfies the following condition
107
Chapter 5 108
micro = cprime(s)minus βγD + βqF0 gt 0
Finally if micro = 0 then the firm do not comply e lt s and the best response of the firm in
this case satisfies
cprime(n)minus βγD + βqF0 = 0
As long as c(s) + (αminus βs)γD gt c(n) + (αminus βn)γD + (1minus α+ βn)qF0
Bibliography
Arguedas C (2008) lsquoTo comply or not to comply pollution standard setting under
costly monitoring and sanctioningrsquo Environmental and Resource Economics 41 155ndash
168
Aven T and Hiriart Y (2013) lsquoRobust optimization in relation to a basic safety
investment modelrsquo Safety Science 55 188ndash194
Aven T and Reniers G (2013) lsquoHow to define and interpret a probability in a risk
and safety settingrsquo Safety Science 51 223ndash231
Becker G (1968) lsquoCrime and punishment an economic approachrsquo Journal of Political
Economy 76 169ndash217
Bernardo J and Smith A (1994) Bayesian Theory John Wiley and Sons
Berthelemy M (2012a) Innovation learning by doing opportunities and nuclear reac-
torsrsquo performance Unpublished manuscript
Berthelemy M (2012b) What drives innovation in nuclear power technologies an
empirical study based in patent counts Unpublished manuscript
Brandt P and Williams J (1998) Modeling time series count data A state-space
approach to event counts
Brandt P and Williams J (2000) lsquoDynamic modeling for persistent event count time
seriesrsquo American Journal of Political Science 44 823ndash843
C Yu W v S and Alsema E (2011) lsquoUnraveling the photovoltaic technology learn-
ing curve by incorporation of input price changes and scale effectsrsquo Renewable and
Sustainable Energy Reviews 15 324337
Cantor R and Hewlett J (1988) lsquoThe economics of nuclear power Further evidence
on learning economics of scale and regulatory effectsrsquo The Bell Journal of Economics
13 297ndash310
109
Bibliography 110
Carlin B and Louis T A (2000) Empirical Bayes Methods for Data Analysis Chap-
man and Hall
Cochran T (2011) Fukushima nuclear disaster and its implications for US nuclear
power reactors
Cohen M (1998) Monitoring and enforcement of environmental policy
Cooper M (2010) Policy challenges of nuclear reactor construction cost escalation and
crowding out alternatives Unpublished manuscript
Cooper M (2012) Nuclear safety and nuclear economics Unpublished manuscript
David P Maude-Griffin R and Rothwell G (1996) lsquoLearning by accident reductions
in the risk of unplanned outages in us nuclear power plants after three mile islandrsquo
Journal of Risk and Uncertainty 13 175ndash198
David P and Rothwell G (1996) lsquoStandardization diversity and learning Strategies
for the coevolution if technology and industrial capacityrsquo International Journal of
Industrial Organization 14 181ndash201
des Comptes C (2012) Les couts de la filiere electronucleaire Technical report Cour
des Comptes
Edenhofer B K M P H K F J O and Bruckner T (2012) Germanys nuclear
phase-out Impacts on electricity prices co2 emissions and on europe
EPRI (2008) Safety and operational benefits of risk-informed initiatives Technical re-
port Electric Power Research Institute
Erickson P K J and Drennen T (2006) lsquoTechnological learning and renewable energy
costs implications for us renewable energy policyrsquo Energy Policy 34 1645ndash1658
Escobar-Rangel L and Leveque F (2012) Revisiting the cost escalation curse of nuclear
power New lessons from the french experience Unpublished manuscript
Fifield P and Sinclair (2002) lsquoMacroeconomic factors and share returns an analysis
using emerging market datarsquo International Journal of Finance amp Economics 7 51ndash62
Filmer D and Pritchett L (2001) lsquoEstimating wealth effects without expenditure data
or tears An application to educational enrollments in states of indiarsquo Demography
38 115ndash132
Finon D (2012) Lrsquoeconomie du nucleeaire revisitee Unpublished manuscript
Finon D and Staropoli C (2001) lsquoInstitutional and technological co-evolution in the
french electronuclear industryrsquo Industry amp Innovation 8 179ndash199
Bibliography 111
Gilboa I and Schmeidler D (1989) lsquoMaxmin expected utility with non-unique priorrsquo
Journal of Mathematical Economics 18 141ndash153
Goldemberg J (2009) lsquoNuclear energy in developing countriesrsquo Daedalus 138 71ndash80
Greenpeace (2013) Greenpeace statement and briefing 21 october 2013
available at httpwwwgreenpeaceorgukmediapress-releases
hinkley-c-greenpeace-statement-and-briefing-20131021 Technical report
Greenpeace
Grubler A (2010) lsquoThe cost of the french nuclear scale-up A case of negative learning
by doingrsquo Energy Policy 38 5174ndash5188
Gundersen A (2012) Lesson from fukushima Technical report Greenpeace
Hansson I and Skogh G (1987) lsquoMoral hazard and safety regulationrsquo The Geneva
Papers on Risk and Insurance 12 132ndash144
Harvey A and Fernandes C (1989) lsquoTime series models for count or qualitative ob-
servationsrsquo Journal of Business and Economic Statistics 7 407ndash417
Harvey A and Shepard N (1993) lsquoStructural time series modelsrsquo Handbook of Statis-
tics 11 261ndash301
Hiriart Y and Martimort D (2004) lsquoEnvironmental risk regulation and liability under
adverse selection and moral hazardrsquo IDEI Working Papers 256
Hiriart Y Martimort D and Pouyet J (2004) lsquoOn the optimal use of ex ante regu-
lation and ex post liabilityrsquo Economics Letters 84 231ndash235
Hiriart Y Martimort D and Pouyet J (2006) lsquoThe regulator and the judge The
optimal mix in the control of environmental riskrsquo Revue drsquoeconomie politique 06 941ndash
967
Hofert M and Wuthrich M (2011) Statistical review of nuclear power accidents
Hotelling H (1933) lsquoAnalysis of a complex of statistical variables into principal com-
ponentsrsquo Journal of Educational Psychology 24 417ndash441
IEA (2010) Projected costs of generating electricity 2010 edition Technical report
IEA
Isoarda S and Soria A (2001) lsquoTechnical change dynamics evidence from the emerg-
ing renewable energy technologiesrsquo Energy Economics 23 619ndash636
Jamasb T (2006) Technical change theory and learning curves Patterns of progress
in energy technologies Unpublished manuscript
Bibliography 112
Joskow P and Parsons J (2009) lsquoThe economic future of nuclear powerrsquo Daedalus
138 45ndash59
Kadak A and Matsuo T (2007) lsquoThe nuclear industryrsquos transition to risk-informed
regulation and operation in the united statesrsquo Reliability Engineering and System
Safety 29 609ndash618
Kessides I (2012) lsquoThe future of the nuclear industry reconsidered Risk uncertainties
and continued promisersquo Energy Policy 48 185ndash208
Kolstad C Ulen T and Johnson G (1990) lsquoEx post liability for harm vs ex ante
safety regulation Substitutes or complementsrsquo The American Economic Review
80 888ndash901
Komanoff C (1981) Power Plant Cost Escalation Nuclear and Coal Cost Regulation
and Economics Van Nostrand Reinhold Publishing
Koomey J and Hultman N (2007) lsquoA reactor-level analysis if busbar cost for the us
nuclear plants 1970-2005rsquo Energy Policy 35 5630ndash5642
Krautmann A and Solow J (1988) lsquoEconomies of scale in nuclear power generationrsquo
Southern Economic Journal 55 70ndash85
Larsen G K A M K and Sundqvist T (2005) lsquoThe impact of rampd on innovation
for wind energy in denmark germany and the united kingdomrsquo Ecological Economics
54 227ndash71
Leveque F (2013) Nucleaire OnOff Analyse economique drsquoun pari DUNOD
Lindman A and Soderholm P (2012) lsquoWind power learning rates a conceptual review
and meta-analysisrsquo Energy Economics pp 754ndash761
Linhart P and Radner R (1989) lsquoMinmax-regret strategies for bargaining over several
variablesrsquo Journal of Economic Theory 48 152ndash178
MacKerron G (2004) lsquoNuclear power and the characteristics of rsquoordinarinessrsquo - the case
of uk energy policyrsquo Energy Policy 32 19571965
Martin Junginger W v S and Faaij A (2010) Technological learning in the energy
sector Edward Elgar Publishing
McCabe M (1996) lsquoPrincipals agents and the learning curve The case of steam-
electric power plant design and constructionrsquo The Journal of Industrial Economics
XLIV 357ndash375
Bibliography 113
NEA (2000) Reduction of capital costs of nuclear power plants Technical report Nu-
clear Energy Agency
Nuttall W J (2005) Nuclear Renaissance Technologies and Policies for the Future of
Nuclear Power Taylor and Francis Group
Parsons J and Du Y (2003) The future of nuclear power Technical report MIT
Parsons J and Du Y (2009) Update on the cost of nuclear power Technical report
MIT
Pearson K (1901) lsquoOn lines and planes of closest fit to systems of points in spacersquo
Philosophical Magazine 2 559ndash572
Peri G (2005) lsquoDeterminants of knowledge flows and their effect on innovationrsquo The
Review of Economics and Statistics 87 308ndash322
Phillip Lipscy K K and Incerti T (2013) lsquoThe fukushima disaster and japans nuclear
plant vulnerability in comparative perspectiversquo Environmental Science and Technol-
ogy 47 6082ndash6088
Roche B (2004) The french nuclear program Edfrsquos experience Technical report EDF
Generation and Engeenering
Rosner R and Goldberg S (2011a) Analysis of gw-scale overnight capital cost Tech-
nical report The University of Chicago
Rosner R and Goldberg S (2011b) Small modular reactors - key to future nuclear
power generation in the us Unpublished manuscript
Rothwell G (1986) lsquoSteam-electric scale economies and construction lead timesrsquo Cal-
Tech working paper 63
Rothwell G and Ganda F (2014) Electricity generating portfolios with small modular
reactors Unpublished manuscript
Schneider M and Froggatt A (2014) World nuclear industry status report 2014 Tech-
nical report Mycle Schneider Consulting Project
Shavell S (1984) lsquoA model of the optimal use of liability and safety regulationrsquo Rand
Journal of Economics 15 271ndash280
Strand J (1994) lsquoEnvironmental accidents under moral hazard and limited firm liabil-
ityrsquo Environmental and Resource Economics 4 495ndash509
Tour F N I (2012) Investigation committee on the accident at fukushima nuclear
power stations Technical report Fukushima NPS Inspection Tour
Bibliography 114
Wang Q Chen X and Yi-chong X (2013) lsquoAccident like the fukushima unlikely in a
country with effective nuclear regulation Literature review and proposed guidelinesrsquo
Renewable and Sustainable Energy Reviews 17 126ndash146
WEC (2012) World energy perspective Nuclear energy one year after fukushima Tech-
nical report World Energy Council
Zanella S C F and Mixon F (2000) lsquoIs economic freedom one dimensional a fac-
tor analysis of some common measures of economic freedomrsquo Journal of Economic
Development 25 17ndash40
Zimmerman M (1982) lsquoLearning effects and the commercialization of new technologies
The case of nuclear powerrsquo The Bell Journal of Economics 13 297ndash310
LrsquoEacuteconomie de lrsquoEacutenergie Nucleacuteaire Coucircts des Construction et Reacutegulation de la Sucircreteacute
RESUME Cette thegravese eacutetudie le rocircle des coucircts de construction et de reacuteglementation de la seacutecuriteacute
sur la compeacutetitiviteacute de leacutenergie nucleacuteaire Lanalyse des coucircts de construction est baseacutee sur
lutilisation de donneacutees reacuteelles provenant des parcs nucleacuteaires franccedilais et ameacutericains En particulier
nous eacutetudions diffeacuterents canaux agrave partir de laquelle des reacuteductions de coucircts pourraient survenir
Nous montrons que la normalisation est un critegravere crucial pour la compeacutetitiviteacute eacuteconomique de
leacutenergie nucleacuteaire dabord parce que les effets dapprentissage positifs sont conditionnels agrave la
technologie ce qui signifie que les reacuteductions de coucircts ne peuvent venir que si le mecircme type de
reacuteacteur est construit agrave plusieurs reprises mais aussi parce quelle permet de reacuteduire le coucirct
indirectement par lintermeacutediaire courts deacutelais de construction Dans lanalyse du rocircle de
reacuteglementation de la seacutecuriteacute nous eacutevaluons dabord leffet de la derniegravere accident nucleacuteaire majeur
(c-agrave Fukushima Dai-ichi) de la probabiliteacute de survenance dun tel eacuteveacutenement puis les effets de
lincertitude concernant la faccedilon dont les soins de la seacutecuriteacute agrave reacuteduire le probabiliteacute dun accident
nucleacuteaire dans leacutetablissement de normes de seacutecuriteacute en vertu de laleacutea moral et responsabiliteacute
limiteacutee Nous constatons que la norme sera la moins stricte lorsque le reacutegulateur adopte une
approche pire des cas et plus stricte lorsque le reacutegulateur adopte lapproche de la robustesse de
regret et il est optimiste quant agrave lefficaciteacute des soins de la seacutecuriteacute pour reacuteduire le risque daccident
Toutefois cette norme pourrait induire le non-respect par les opeacuterateurs les moins efficaces
Mots cleacutes Eacutenergie nucleacuteaire coucircts de construction effets dapprentissage reacutegulation de la sucircreteacute risque moral optimisation robuste
Economics of Nuclear Power Construction Costs and Safety Regulation
ABSTRACT This thesis studies the role of construction costs and safety regulation on nuclear
powers competitiveness The analysis of construction costs is based on the use of actual data
coming from the American and French nuclear fleets In particular we study different channels from
which cost reductions might arise We show that standardization is a crucial criterion for the
economic competitiveness of nuclear power first because the positive learning effects are
conditional to the technology this means that cost reductions will arise only if the same type of
reactor is built several times but also because it allows to reduce the cost indirectly through shorter
construction lead-times In the analysis of the role of safety regulation we first assess the effect of
the latest major nuclear accident (ie Fukushima Dai-ichi) in the probability of occurrence of such an
event and then the effects of the uncertainty regarding how safety care reduce the probability of a
nuclear accident in setting safety standards under moral hazard and limited liability We find that the
standard will be the less strict when the regulator adopt a worst-case approach and stricter when the
regulator adopts the regret robustness approach and it is optimistic about safety care effectiveness to
reduce the risk of an accident However this standard might induce non-compliance by the least
efficient operators
Keywords Nuclear power construction costs learning effects safety regulation moral hazard robust optimization
- Abstract
- Acknowledgements
- Preface
- List of Figures
- List of Tables
- General Introduction
-
- 01 Context
- 02 The risks of nuclear power and the probability of major accident
- 03 The cost escalation curse in the construction of new nuclear power plants
- 04 Nuclear safety regulation
- 05 Methodological approach structure and contribution of this thesis
-
- 1 How Fukushima Dai-ichi core meltdown changed the probability of nuclear accidents
-
- 11 Introduction
- 12 Literature review
- 13 How to properly estimate the expected frequency of a nuclear accident using theoretical probability and past observations
- 14 Poisson Exponentially Weighted Average (PEWMA) model
-
- 141 PEWMA Results
- 142 Arrival rate estimates from 1952 to 2012
-
- 15 Conclusion
-
- 2 Revisiting the cost escalation curse of nuclear power New lessons from the French experience
-
- 21 Introduction
- 22 Data and Model
-
- 221 French construction cost escalation
-
- 23 Results
- 24 Conclusion and Policy Implications
-
- 3 Nuclear reactors construction costs The role of lead-time standardization and technological progress
-
- 31 Introduction
-
- 311 Toward a nuclear renaissance
- 312 Existing literature on nuclear power plants construction costs and lead-times
- 313 The contributions of this paper to the economic literature and the nuclear energy policy debate
-
- 32 Model main hypothesis about learning opportunities and data
-
- 321 Model for construction costs and lead-times in nuclear power
-
- 3211 Hypotheses on the role reactors design standardization
- 3212 Hypotheses on learning by doing
- 3213 Hypotheses on leaning by searching
-
- 322 Data
-
- 33 Model specifications and results France versus the US
-
- 331 Model specifications
- 332 Results
-
- 34 Nuclear reactors lead-time Insights from other OECD countries
-
- 341 Data and Model
-
- 35 Conclusion
-
- 351 Policy implications for nuclear new-build programs
- 352 Paths for future research
-
- 4 Setting optimal safety standards for nuclear operators subject to uncertainty moral hazard and limited liability
-
- 41 Introduction
- 42 The Model
-
- 421 Benchmark The regulator knows
-
- 43 Imprecise probabilities and robust optimization
-
- 431 Worst-case approach
- 432 Regret robustness approach
-
- 44 Conclusion
-
- 5 General Conclusion
-
- 51 Conclusion about Construction Costs
- 52 Conclusion about Safety Regulation
-
- A Cour des Comptes Actual Construction Costs for the French Nuclear Fleet
- B Linear models for the Construction Costs
- C Alternative model specifications
- D Alternative model specifications for lead-time
- E List of nuclear reactor models by manufacturer in France and the US
- F Operators best response
- Bibliography
-