Economics of carbon dioxide capture and utilization—a ...
16
TECHNOECONOMIC PERSPECTIVES ON SUSTAINABLE CO2 CAPTURE AND UTILIZATION Economics of carbon dioxide capture and utilization—a supply and demand perspective Henriette Naims 1 Received: 28 October 2015 /Accepted: 2 May 2016 /Published online: 18 May 2016 # The Author(s) 2016. This article is published with open access at Springerlink.com Abstract Lately, the technical research on carbon diox- ide capture and utilization (CCU) has achieved impor- tant breakthroughs. While single CO 2 -based innovations are entering the markets, the possible economic effects of a large-scale CO 2 utilization still remain unclear to policy makers and the public. Hence, this paper reviews the literature on CCU and provides insights on the mo- tivations and potential of making use of recovered CO 2 emissions as a commodity in the industrial production of materials and fuels. By analyzing data on current global CO 2 supply from industrial sources, best practice benchmark capture costs and the demand potential of CO 2 utilization and storage scenarios with comparative statics, conclusions can be drawn on the role of differ- ent CO 2 sources. For near-term scenarios the demand for the commodity CO 2 can be covered from industrial processes, that emit CO 2 at a high purity and low benchmark capture cost of approximately 33 €/t. In the long-term, with synthetic fuel production and large-scale CO 2 utilization, CO 2 is likely to be available from a variety of processes at benchmark costs of approx. 65 €/t. Even if fossil-fired power generation is phased out, the CO 2 emissions of current industrial processes would suffice for ambitious CCU demand scenarios. At current economic conditions, the business case for CO 2 utiliza- tion is technology specific and depends on whether efficiency gains or substitution of volatile priced raw materials can be achieved. Overall, it is argued that CCU should be advanced complementary to mitigation technologies and can unfold its potential in creating lo- cal circular economy solutions. Keywords Carbon capture and utilization . Supply and demand scenarios . Commodity CO 2 . Costs of CO 2 capture . Circular economy Motivations for using CO 2 In the context of the global climate change debate, the motivation behind the research on CO 2 utilization seems obvious: If there are possibilities to make use of the industrial CO 2 emissions that are a major cause of glob- al warming they should be harvested. If recovered CO 2 emissions can be used as feedstock for industrial pro- duction processes the existing resource base could be broadened. Especially in the context of circular econo- my thinking as promoted by the World Economic Forum (2014) making use of waste emissions offers a promising new perspective. However, the largest part of worldwide industrial emissions is still unregulated and unpriced. Currently, only approx. 6 Gt of the estimated annual 37 Gt of global anthropogenic CO 2 emissions are regulated by some form of carbon pricing instru- ment (Le Quéré et al. 2014 ; World Bank 2014 ). Meanwhile, in the few existing schemes the emission allowance price is rather low, for example around 8 €/t in the EU Emission Trading Scheme (EEX 2015) and approx. 13 US$/t in the California Cap and Trade Program (California Carbon Dashboard 2015 ). Consequently, the economic incentives to tackle the Responsible editor: Philippe Garrigues * Henriette Naims [email protected] 1 IASS—Institute for Advanced Sustainability Studies e.V., Berliner Strasse 130, 14467 Potsdam, Germany Environ Sci Pollut Res (2016) 23:22226–22241 DOI 10.1007/s11356-016-6810-2
Transcript of Economics of carbon dioxide capture and utilization—a ...
TECHNOECONOMIC PERSPECTIVES ON SUSTAINABLE CO2 CAPTURE AND UTILIZATION
Economics of carbon dioxide capture and utilization—a supplyand demand perspective
Henriette Naims1
Received: 28 October 2015 /Accepted: 2 May 2016 /Published online: 18 May 2016# The Author(s) 2016. This article is published with open access at Springerlink.com
Abstract Lately, the technical research on carbon diox-ide capture and utilization (CCU) has achieved impor-tant breakthroughs. While single CO2-based innovationsare entering the markets, the possible economic effectsof a large-scale CO2 utilization still remain unclear topolicy makers and the public. Hence, this paper reviewsthe literature on CCU and provides insights on the mo-tivations and potential of making use of recovered CO2
emissions as a commodity in the industrial productionof materials and fuels. By analyzing data on currentglobal CO2 supply from industrial sources, best practicebenchmark capture costs and the demand potential ofCO2 utilization and storage scenarios with comparativestatics, conclusions can be drawn on the role of differ-ent CO2 sources. For near-term scenarios the demandfor the commodity CO2 can be covered from industrialprocesses, that emit CO2 at a high purity and lowbenchmark capture cost of approximately 33 €/t. In thelong-term, with synthetic fuel production and large-scaleCO2 utilization, CO2 is likely to be available from avariety of processes at benchmark costs of approx. 65€/t. Even if fossil-fired power generation is phased out,the CO2 emissions of current industrial processes wouldsuffice for ambitious CCU demand scenarios. At currenteconomic conditions, the business case for CO2 utiliza-tion is technology specific and depends on whether
efficiency gains or substitution of volatile priced rawmaterials can be achieved. Overall, it is argued thatCCU should be advanced complementary to mitigationtechnologies and can unfold its potential in creating lo-cal circular economy solutions.
Keywords Carbon capture and utilization . Supply anddemand scenarios . Commodity CO2
. Costs of CO2 capture .
Circular economy
Motivations for using CO2
In the context of the global climate change debate, themotivation behind the research on CO2 utilization seemsobvious: If there are possibilities to make use of theindustrial CO2 emissions that are a major cause of glob-al warming they should be harvested. If recovered CO2
emissions can be used as feedstock for industrial pro-duction processes the existing resource base could bebroadened. Especially in the context of circular econo-my thinking as promoted by the World EconomicForum (2014) making use of waste emissions offers apromising new perspective. However, the largest part ofworldwide industrial emissions is still unregulated andunpriced. Currently, only approx. 6 Gt of the estimatedannual 37 Gt of global anthropogenic CO2 emissionsare regulated by some form of carbon pricing instru-ment (Le Quéré et al. 2014; World Bank 2014).Meanwhile, in the few existing schemes the emissionallowance price is rather low, for example around 8€/t in the EU Emission Trading Scheme (EEX 2015)and approx. 13 US$/t in the California Cap and TradeProgram (Cal i fornia Carbon Dashboard 2015) .Consequently, the economic incentives to tackle the
Responsible editor: Philippe Garrigues
* Henriette [email protected]
1 IASS—Institute for Advanced Sustainability Studies e.V., BerlinerStrasse 130, 14467 Potsdam, Germany
Environ Sci Pollut Res (2016) 23:22226–22241DOI 10.1007/s11356-016-6810-2
CO2 problem are largely insufficient. The developmentof technically, environmentally, and economically viableways of utilizing CO2 as a feedstock for industrial pro-duction can imply a complementary route to existingmitigation strategies such as the deployment of renew-able energy and other green technologies.
As almost all materials that surround us in our ev-eryday lives are carbon-based, the option to use recov-ered CO2 to substitute fossil carbon sources remains anattractive possibility that could be worth further investi-gation. In the last years, several public funding pro-grams, e.g., by the US Department of Energy or theGerman Federal Ministry of Education and Researchhave encouraged research in this field and already thefirst technological breakthroughs and advances to ademonstration scale can be observed (Federal Ministryof Education and Research 2014; US DOE n.d.). Eventhough the first CO2-based products are just enteringglobal markets in the near future their number and scaleis expected to grow (Aresta et al. 2013). Consequently,based on a literature review, the potential supply anddemand of the commodity CO2 is presented in this pa-per to discuss the fundamentals of the commodity CO2
from an economic perspective of comparative statics.Since the utilized CO2 in most cases is reemitted at a later
point in time a simple aggregation of the used volumes ofCO2 is not an indicator of ecologic performance (von derAssen et al. 2013). Instead, a detailed environmental analy-sis is necessary to calculate the real carbon footprint of acertain CCU technology compared to a conventional tech-nology (von der Assen et al. 2015). Indeed, the same prin-ciple applies to the business case of CO2 utilization. In somecases, using comparatively cheap CO2 as a feedstock andreplacing more costly and volatile priced fossil-based rawmaterials can lead to a cost reduction which sets the businesscase for CCU. However, for those production processes thatuse CO2 still inefficiently or are not competitive to conven-tional fossil-based production, there is no business case untilfurther research and development or political incentivesprove otherwise. While CO2 can generally be used in manyprocesses, this paper focuses on potential commodity CO2
from industrial capture and does not include biological fix-ation and conversion via the cultivation of crops or algae forexample for making biofuels.
Supply side: potential sources and cost of CO2
The potential sources of waste CO2 emissions are nu-merous. Industrial plants emit CO2 in different quanti-ties and at diverse qualities. Several capture technolo-gies can be applied, for example adsorption, absorption,cryogenic separation, or membranes (de Coninck and
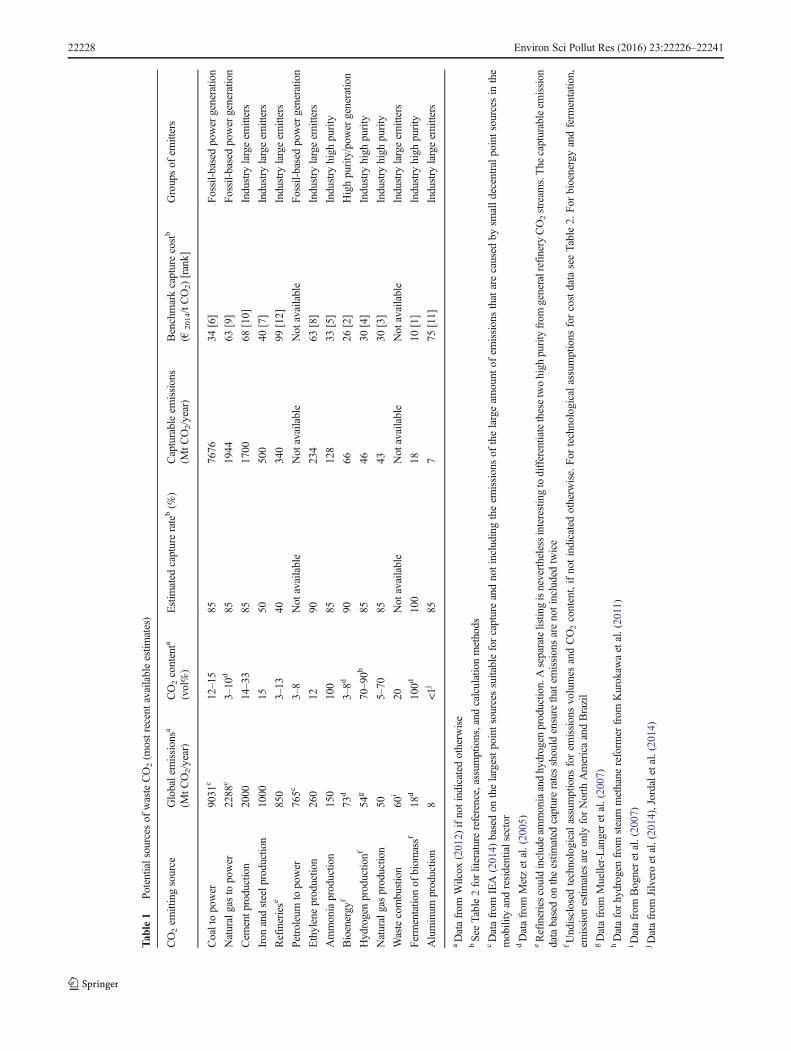
Benson 2014). The costs of capturing CO2 at a certainsource depend on the technological efforts that must beundertaken to collect the CO2 in the required qualityfrom the industrial exhaust gas. Thus, the costs arelargely influenced by the concentration of CO2 in theexhaust gas. Moreover, the CO2 needs to be purifiedand any toxic or hazardous chemicals removed (Arestaand Dibenedetto 2010). Furthermore, a larger plant size canlower the investment and operating costs per captured tonne ofCO2 through economies of scale (Faulstich et al. 2009;Möllersten et al. 2003). Consequently, despite technical feasi-bility, not all emitting sources represent economically viableoptions at current conditions.
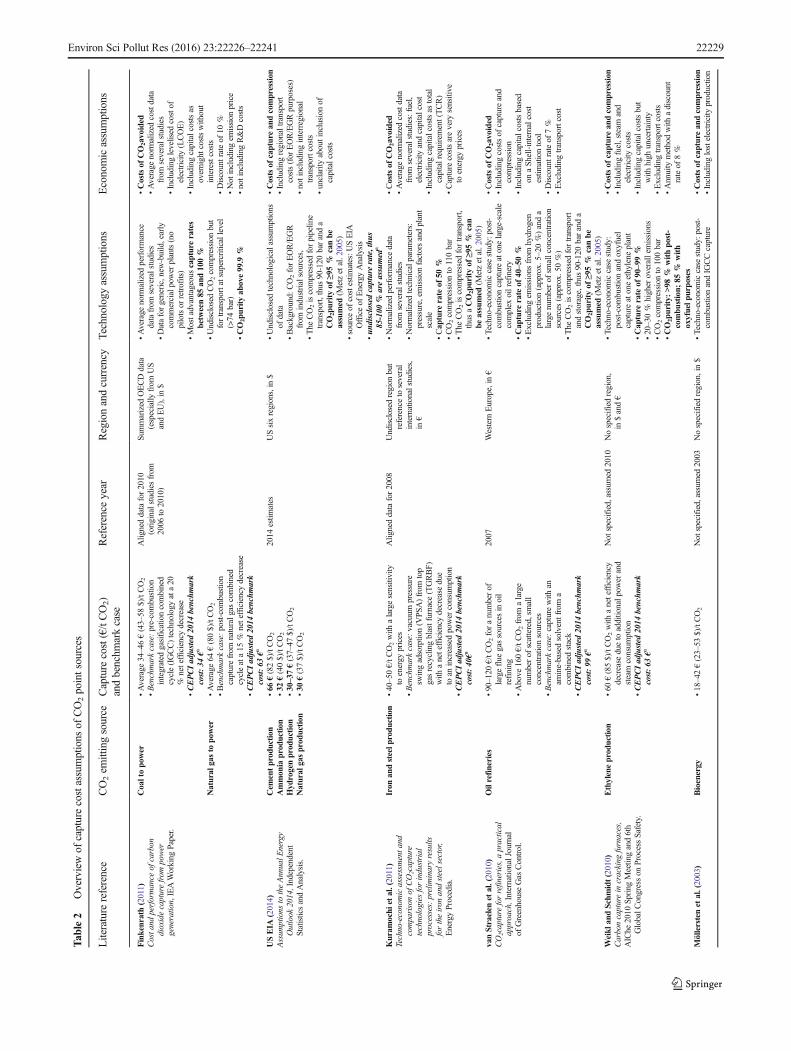
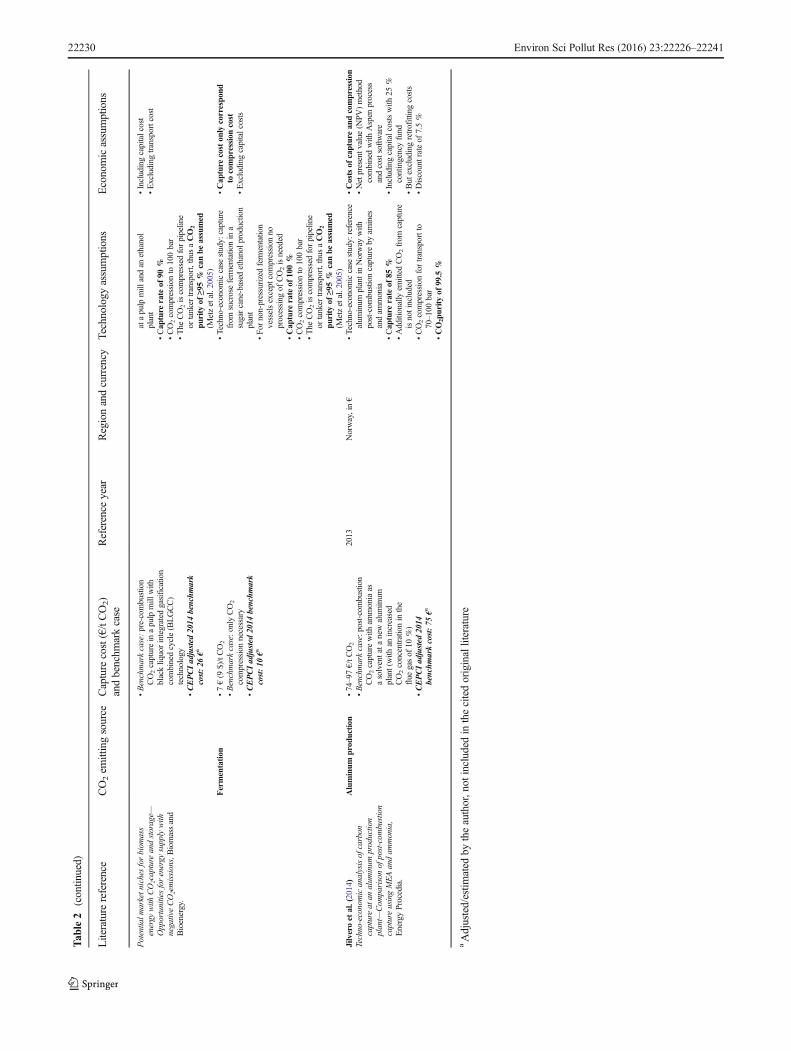
Table 1 summarizes current data on respective globalemission volumes, concentrations, estimated capturerates, and benchmark capture costs per type of sourcefor the largest point sources of CO2 based on a litera-ture review. The presented data are based on severalselected sources with heterogeneous technological andfinancial assumptions, calculation methods, and refer-ence years. Therefore, the collected data do not allowfor a detailed cost comparison or technological discus-sion. Nevertheless, it is useful to provide general in-sights on potential large-scale supply of CO2 as a com-modity. The presented emission volumes represent re-cent global direct CO2 emissions. The capturable emis-sions are calculated by applying the estimated lower-bound capture rate as a benchmark to the global emis-sion volume per type of source. The benchmark costsrepresent minimum cost of CO2 captured per tonne thatare possible to achieve with a certain benchmark tech-nology, a so-called best practice process. The purity ofthe recovered CO2 depends on the respective processbut can be assumed between 95 and 99.9 %. The de-tailed underlying assumptions are further explained inthe following and in Table 2.
Costs of CO2 capture
Today, CO2 capture is technologically feasible and in-dustrial practice on a small scale around the world.However, due to a lack of incentives, large-scale captureis currently not economically viable. Hence, the costs ofcapture are essential when considering potential sourcesand technologies for recovering CO2 emissions. Capturecosts are generally defined as the costs of CO2 separa-tion and compression at a single facility (e.g., an indus-trial plant), disregarding any costs of transport, storage,or further conversion steps (Metz et al. 2005). They areusually derived from comparing a system with CO2 cap-ture to a reference system without capture. In the liter-ature, two main measures for CO2 capture costs exist:costs of capture and costs of avoidance of CO2.
Environ Sci Pollut Res (2016) 23:22226–22241 22227
Tab
le1
Potentialsources
ofwasteCO2(m
ostrecentavailableestim
ates)
CO2em
ittingsource
Globalemissionsa
(MtC
O2/year)
CO2contenta
(vol%)
Estim
ated
capturerateb(%
)Capturableem
issions
(MtC
O2/year)
Benchmarkcapturecostb
(€2014/tCO2)[rank]
Groupsof
emitters
Coaltopower
9031
c12–15
857676
34[6]
Fossil-basedpowergeneratio
n
Naturalgasto
power
2288
c3–10
d85
1944
63[9]
Fossil-basedpowergeneratio
n
Cem
entp
roduction
2000
14–33
851700
68[10]
Industry
largeem
itters
Iron
andsteelp
roduction
1000
1550
500
40[7]
Industry
largeem
itters
Refineriese
850
3–13
40340
99[12]
Industry
largeem
itters
Petroleum
topower
765c
3–8
Not
available
Not
available
Not
available
Fossil-basedpowergeneratio
n
Ethyleneproductio
n260
1290
234
63[8]
Industry
largeem
itters
Ammoniaproductio
n150
100
85128
33[5]
Industry
high
purity
Bioenergy
f73
d3–8d
9066
26[2]
Highpurity/pow
ergeneratio
n
Hydrogenproductio
nf54
g70–90h
8546
30[4]
Industry
high
purity
Naturalgasproductio
n50
5–70
8543
30[3]
Industry
high
purity
Wastecombustion
60i
20Not
available
Not
available
Not
available
Industry
largeem
itters
Ferm
entatio
nof
biom
assf
18d
100d
100
1810
[1]
Industry
high
purity
Aluminum
productio
n8
<1j
857
75[11]
Industry
largeem
itters
aDatafrom
Wilcox
(2012)
ifnotindicated
otherw
ise
bSeeTable2forliteraturereference,assumptions,and
calculationmethods
cDatafrom
IEA(2014)
basedon
thelargestpointsourcessuitableforcaptureandnotincludingtheem
issionsof
thelargeam
ount
ofem
issionsthatarecaused
bysm
alldecentralpointsourcesin
the
mobility
andresidentialsector
dDatafrom
Metzetal.(2005)
eRefineriescouldincludeam
moniaandhydrogen
productio
n.Aseparatelistin
gisneverthelessinterestingtodifferentiatethesetwohigh
purityfrom
generalrefineryCO2stream
s.The
capturableem
ission
databasedon
theestim
ated
captureratesshould
ensure
thatem
issionsarenotincludedtwice
fUndisclosed
technologicalassumptions
forem
issionsvolumes
andCO2content,ifnotindicatedotherw
ise.Fo
rtechnologicalassumptions
forcostdataseeTable2.
For
bioenergyandferm
entatio
n,em
ission
estim
ates
areonly
forNorth
AmericaandBrazil
gDatafrom
Mueller-Langeretal.(2007)
hDataforhydrogen
from
steam
methane
reform
erfrom
Kurokaw
aetal.(2011)
iDatafrom
Bogneretal.(2007)
jDatafrom
Jilveroetal.(2014),Jordaletal.(2014)
22228 Environ Sci Pollut Res (2016) 23:22226–22241
Tab
le2
Overviewof
capturecostassumptions
ofCO2pointsources
Literature
reference
CO2em
ittingsource
Capture
cost(€/tCO2)
andbenchm
arkcase
Reference
year
Regionandcurrency
Technology
assumptions
Economicassumptions
Finkenrath(2011)
Costa
ndperformance
ofcarbon
dioxidecapturefrom
power
generation,IEAWorking
Paper.
Coaltopo
wer
•Average
34–46€(43–58
$)/tCO2
•Benchmarkcase:pre-combustion
integrated
gasificationcombined
cycle(IGCC)technology
ata20
%netefficiencydecrease
•CEPCIadjusted
2014
benchm
ark
cost:34
€a
Alig
neddatafor2010
(originalstudies
from
2006
to2010)
Summarized
OECDdata
(especially
from
US
andEU),in
$
•Average
norm
alized
performance
datafrom
severalstudies
•Dataforgeneric,new-build,early
commercialpowerplants(no
pilotsor
retrofits)
•Mostadvantageouscapturerates
betw
een85
and100%
•Undisclosed
CO2compression
but
fortransportatsupercriticallevel
(>74
bar)
•CO
2pu
rity
above99.9
%
•Costsof
CO
2avoided
•Average
norm
alized
costdata
from
severalstudies
•Includinglevelised
costof
electricity
(LCOE)
•Includingcapitalcostsas
overnightcostswithout
interestcosts
•Discountrateof
10%
•Not
includingem
ission
price
•notincluding
R&Dcosts
Natural
gasto
power
•Average
64€(80$)/tCO2
•Benchmarkcase:p
ost-combustion
capturefrom
naturalg
ascombined
cycleata15
%netefficiencydecrease
•CEPCIadjusted
2014
benchm
ark
cost:63
€a
USEIA
(2014)
Assum
ptions
totheAnnualE
nergy
Outlook
2014,Independent
StatisticsandAnalysis.
Cem
entprod
uction
•66
€(82$)/tCO2
2014
estim
ates
USsixregions,in
$•Undisclosed
technologicalassum
ptions
ofdata
•Background:
CO2forEOR/EGR
from
industrialsources,
•The
CO2iscompressedforpipeline
transport,thus
90-120
baranda
CO
2purityof
≥95%
canbe
assumed
(Metzetal.2005)
•source
ofcostestim
ates:U
SEIA
Officeof
EnergyAnalysis
•un
disclosedcapturerate,thu
s85-100
%areassumed
a
•Costsof
capturean
dcompression
•Includingregionaltransport
costs(for
EOR/EGRpurposes)
•notincluding
interregional
transportcosts
•unclarity
aboutinclusion
ofcapitalcosts
Ammon
iaprod
uction
•32
€(40$)/tCO2
Hyd
rogenprod
uction
•30–37€(37–47
$)/tCO2
Natural
gasprod
uction
•30
€(37$)/tCO2
Kuram
ochi
etal.(2011)
Techno-economicassessmenta
ndcomparisonof
CO2capture
technologies
forindustrial
processes:preliminaryresults
fortheiron
andsteelsector,
EnergyProcedia.
Iron
andsteelp
rodu
ction
•40–50€/tC
O2with
alargesensitivity
toenergy
prices
•Benchmarkcase:vacuum
pressure
swingadsorption(V
PSA
)from
top
gasrecyclingblastfurnace
(TGRBF)
with
anetefficiencydecrease
due
toan
increasedpowerconsum
ption
•CEPCIadjusted
2014
benchm
ark
cost:40€a
Alig
neddatafor2008
Undisclosed
region
but
referenceto
several
internationalstudies,
in€
•Normalized
performance
data
from
severalstudies
•Normalized
technicalparam
eters:
pressure,emission
factorsandplant
scale
•Cap
ture
rateof
50%
•CO2compression
to110bar
•The
CO2iscompressedfortransport,
thus
aCO
2purityof
≥95%
can
beassumed
(Metzetal.2005)
•Costsof
CO
2avoided
•Average
norm
alized
costdata
from
severalstudies:fuel,
electricity
andcapitalcost
•Includingcapitalcostsas
total
capitalrequirement(TCR)
•Capturecostsarevery
sensitive
toenergy
prices
vanStraelen
etal.(2010)
CO2capture
forrefineries,apractical
approach,InternationalJournal
ofGreenhouseGas
Control.
Oilrefineries
•90–120
€/tC
O2foranumberof
largeflue
gassourcesin
oil
refining
•Above
160€/tC
O2from
alarge
numberof
scattered,sm
all
concentrationsources
•Benchmarkcase:capturewith
anam
ine-basedsolventfrom
acombinedstack
•CEPCIadjusted
2014
benchm
ark
cost:99
€a
2007
Western
Europe,in
ۥTechno-economiccase
study:
post-
combustioncaptureatonelarge-scale
complex
oilrefinery
•Cap
ture
rateof
40–50%
•Excluding
emissionsfrom
hydrogen
production(approx.5–20
%)anda
largenumberof
smallconcentration
sources(approx.50
%)
•The
CO2iscompressedfortransport
andstorage,thus
90-120
baranda
CO
2purityof
≥95%
canbe
assumed
(Metzetal.2005)
•Costsof
CO
2avoided
•Includingcostsof
captureand
compression
•Includingcapitalcostsbased
onaSh
ell-internalcost
estim
ationtool
•Discountrateof
7%
•Excluding
transportcost
Weikl
andSchm
idt(2010)
Carboncapturein
cracking
furnaces,
AIChe
2010
Spring
Meetin
gand6th
GlobalC
ongresson
ProcessSafety.
Ethyleneprod
uction
•60
€(85$)/tCO2with
anetefficiency
decrease
dueto
additionalp
owerand
steam
consum
ption
•CEPCIadjusted
2014
benchm
ark
cost:63
€a
Not
specified,assumed
2010
Nospecifiedregion,
in$and€
•Techno-economiccase
study:
post-com
bustionandoxyfuel
captureatoneethylene
plant
•Cap
ture
rateof
90–99%
•20–30%
higheroverallemissions
•CO2compression
to100bar
•CO
2pu
rity:>98
%withpo
st-
combu
stion;
85%
with
oxyfuelp
urpo
ses
•Costsof
capturean
dcompression
•Includingfuel,steam
and
electricity
costs
•Includingcapitalcostsbut
with
high
uncertainty
•Excluding
transportcosts
•Annuity
methodwith
adiscount
rateof
8%
Möllerstenetal.(2003)
Bioenergy
•18–42€(23–53
$)/tCO2
Not
specified,assumed
2003
Nospecifiedregion,in$
•Techno-economiccase
study:
post-
combustionandIG
CCcapture
•Costsof
capturean
dcompression
•Includinglostelectricity
production
Environ Sci Pollut Res (2016) 23:22226–22241 22229
Tab
le2
(contin
ued)
Literature
reference
CO2em
ittingsource
Capture
cost(€/tCO2)
andbenchm
arkcase
Reference
year
Regionandcurrency
Technology
assumptions
Economicassumptions
Potentialm
arketn
ichesforbiom
ass
energy
with
CO2capture
andstorage—
Opportunitiesforenergy
supplywith
negativeCO2emissions,Biomassand
Bioenergy.
•Benchmarkcase:p
re-com
bustion
CO2capturein
apulp
mill
with
blackliquorintegrated
gasification
combinedcycle(BLGCC)
technology
•CEPCIadjusted
2014
benchm
ark
cost:26
€a
atapulp
mill
andan
ethanol
plant
•Cap
ture
rateof
90%
•CO2compression
to100bar
•The
CO2iscompressedforpipeline
ortankertransport,thus
aCO
2
purity
of≥9
5%
canbe
assumed
(Metzetal.2005)
•Includingcapitalcost
•Excluding
transportcost
Fermentation
•7€(9
$)/tCO2
•Benchmarkcase:o
nlyCO2
compression
necessary
•CEPCIadjusted
2014
benchm
ark
cost:10
€a
•Techno-economiccase
study:
capture
from
sucroseferm
entationin
asugarcane-based
ethanolp
roduction
plant
•Fo
rnon-pressurizedferm
entation
vesselsexcept
compression
noprocessing
ofCO2isneeded
•Cap
ture
rateof
100%
•CO2compression
to100bar
•The
CO2iscompressedforpipeline
ortankertransport,thus
aCO
2
purity
of≥9
5%
canbe
assumed
(Metzetal.2005)
•Cap
ture
coston
lycorrespo
ndto
compression
cost
•Excluding
capitalcosts
Jilveroetal.(2014)
Techno-economicanalysisof
carbon
captureat
analum
inum
production
plant—
Com
parisonof
post-com
bustion
captureusingMEAandam
monia,
EnergyProcedia.
Aluminum
prod
uction
•74–97€/tC
O2
•Benchmarkcase:p
ost-combustion
CO2capturewith
ammoniaas
asolventata
newalum
inum
plant(with
anincreased
CO2concentrationin
the
flue
gasof
10%)
•CEPCIadjusted
2014
benchm
arkcost:75
€a
2013
Norway,in€
•Techno-economiccase
study:
reference
alum
inum
plantinNorway
with
post-com
bustioncaptureby
amines
andam
monia
•Cap
ture
rateof
85%
•Additionally
emitted
CO2from
capture
isnotincluded
•CO2compression
fortransportto
70–100
bar
•CO
2purityof
99.5
%
•Costsof
capturean
dcompression
•Netpresentv
alue
(NPV
)method
combinedwith
Aspen
process
andcostsoftware
•Includingcapitalcostswith
25%
contingencyfund
•But
excludingretrofittingcosts
•Discountrateof
7.5%
aAdjusted/estim
ated
bytheauthor,not
included
inthecitedoriginalliterature
22230 Environ Sci Pollut Res (2016) 23:22226–22241
According to the IPCC (Metz et al. 2005), the twomeasures are clearly defined as follows:
(a) Cost of CO2captured represents the rather straightfor-ward cost of capturing per amount of captured CO2.They can be determined through formula (1):
costof CO2 captured€
tCO2
� �¼ additionalcostsof CO2 capture €ð Þ
amountof CO2 captured tCO2ð Þ¼ costscapture plant €ð Þ−costsreference plant €ð Þ
CO2 captured tCO2ð Þð1Þ
These capture cost can reveal Bthe viability of a CO2 cap-ture system given a market price for CO2 (as an industrialcommodity)^ (Bogner et al. 2007). Consequently, if thesecosts can be reimbursed, e.g., through CO2 utilization optionsor political incentives such as a carbon tax, then carbon cap-ture could make economic sense. Due to this information val-ue, costs of capture are the preferred measure in this study.
(b) Cost of CO2avoided gauges the effect of the overallemission reduction by calculating the cost of capturingper amount of CO2 reduced compared to a referenceprocess. The respective formula is (2):
costof CO2 avoidedC¼
tCO2
� �¼ additional costs of CO2 capture C¼ð Þ
amount of CO2 reduction tCO2ð Þ¼ costscapture plant C¼ð Þ−costsre ference plant C¼ð Þ
CO2 emittedre ference plant tCO2ð Þ−CO2 emitted captureplant tCO2ð Þð2Þ
The cost of CO2 avoided considers actual emission reduc-tions and thus contains more ecologically relevant informa-tion. As the process of capturing usually requires additionalenergy and decreases the plant’s efficiency, the capturing oftenproduces additional CO2 emissions. Therefore, the amount ofCO2 reduced or avoided compared to a reference system willlargely be smaller than the amount of CO2 captured.Consequently, the cost of CO2 avoided will generally behigher than the cost of capture (Metz et al. 2005). In an opti-mal capturing case, where additional energy and emissionscan be avoided, both measures will be equal.1 The IPCC rec-ommends the cost of avoidance especially for complete
carbon capture and storage (CCS) systems and less for captureonly analysis (Metz et al. 2005). For the market perspective ofthis paper, the value of the commodity CO2 is however moreimportant. Moreover, it is recommended, that any utilizationtechnology should be accompanied by an LCA that measuresthe full ecologic impact of all production steps.
Unfortunately, the two measures are often commingled inthe literature, so that a clear differentiation is not always possi-ble. The preferred cost estimate of this study is the cost of CO2
captured. Deviating cost measures were included where neces-sary. As described above, the cost of CO2 avoided are poten-tially higher than the capture costs since the reduced emissionsin the denominator are smaller than the captured emissions formost capture systems. The difference depends on the additionalamounts of CO2 emissions caused by the capturing efforts andhow they are accounted for. This cost difference is expected toincrease more or less proportionally with the efforts that arenecessary for capture at the respective sources. Thus, forsources with higher capture costs, the difference in costs ofcapture and avoidance should be larger. Moreover, even if ameasure is clearly and consistently selected in an assessment,varying assumptions and system boundaries limit the possibil-ity of comparing cost data across studies (Metz et al. 2005).Instead, a comparisonwould onlymake sense, if the calculationmethods and underlying assumptions were fully transparentand either consistent or could be aligned. To improve the mea-surement quality and comparability of capture costs—within asingle study as well as across studies—the reference systemswith and without capture should ideally be based on the sameassumptions. Firstly, general conditions such as reference year,region, and type of data (real or hypothetical) should be iden-tical at best. Secondly, the technical and economical parameterssuch as production process, plant size, fuel type, energy cost,and efficiency standards should be comparable. Especially themeasuring of capital costs which can strongly influence thecapture costs should be consistent.
In a cross-technology comparison, meeting these standardsis often not possible. Especially, when emerging technologiesand future scenarios are evaluated, reliable and consistent datacan be scarce. Instead, a more heuristic approach must beadopted and the best available data analyzed. Thus, this papersummarizes the recent techno-economic literature on carboncapture in order to establish a large-scale picture of CO2 supplyin the near-term. A secondary database for the largest industrialCO2 emitting sources is established in Table 2 that gathers themost recent and reliable cost data available. The presentedmeasures and assumptions are heterogeneous and the datashould be considered as estimates and benchmark values forbest practice processes. To maximize cost data quality, recentpeer-reviewed as well as broader government studies were pref-erably selected. Other studies were included to fill data gaps.The origin and relative assumptions of the capture cost studiesare detailed in Table 2 as far as they were disclosed. Since
1 This constraint only applies to the capturing system and its referenceplant, as well as for CO2 storage. If further process steps of CO2 utiliza-tion are included, the relationship of the two measures can vary in alldirections. For example, through raw material substitution or processefficiency improvements the amount of CO2 avoided can be larger thanthe CO2 captured. An LCA permits a thorough environmental assessmentof utilization options.
Environ Sci Pollut Res (2016) 23:22226–22241 22231

capture from coal- and natural gas-fired power plants has beendiscussed the most extensively in the literature, the summarizedaverage costs from the IEA study seem a reliable data source.Moreover, the capture costs for the higher concentrated sourcesof ammonia, hydrogen, and natural gas as well as cement pro-duction derived from the annually updated assumptions of USEnergy Information Agency (EIA) seem a reliable data sourcefor the purpose of analysis even though the data regionallycover only the USA. For the other potential sources of CO2,less research has been performed and average cost data are notavailable. Thus, recent peer-reviewed techno-economic studieshave been included for capture from iron and steel, refineries,bioenergy, fermentation, and aluminum production. For cap-ture from ethylene production a non-governmental, non-peerreviewed data source was included.
The original data have been adjusted slightly to allow for acommon depiction in € per tonne on a 2014 basis. Firstly, costdata in US$ have been converted to € based on Oanda ex-change rates2 from the end of the respective year of data ref-erence. Then, data that were older than 2014 were adjustedwith the annual Chemical Engineering Plant Cost Index(CEPCI). The CEPCI is a composite index that reflects thedevelopment of equipment, construction labor, buildings andengineering and supervision costs over time since the 1960s(Chem. Eng. 2008; Chem. Eng. 2015a; Jenkins 2015;Mignard 2014). Thus, it helps to correct for changing econom-ic conditions for chemical plants over time while slightlyadjusting the original cost data from older reference years.
Evaluation of potential CO2 supply
Based on the presented data in Tables 1 and 2, a benchmarkCO2 supply base can be established as a merit order and in-sights on the feasibility of selected utilization scenarios can bederived. The benchmark CO2 supply is based on the bestpractice minimum capture costs. Upper limit or maximumcosts are not presented since it is assumed that a variety ofprocesses exist that could lead to even higher capture coststhan those presented in Table 2. The supply cost function thuscan be described by formula (3) that sorts and aggregates thecapturable quantities of the potential sources (qi) according totheir benchmark capture costs (pi):
p qð Þ ¼ pi ∀ q ∈iqi−1; qi
ið3Þ
For the space U as the union of all intervals
⋃ni¼1 qi−1; qið �
withi= rank of CO2emitting source
n=number of ranked sourcespi=benchmark capture cost of source ranked in ith posi-
tion; in € per tonne;p1≤p2≤…≤pnqi=aggregated capturable emissions of sources ranked≤ -
i; in Mt/yearFor the following considerations, the scenarios will be split
in a near-term view of up to 10 years and a long-term horizonof more than 10 years. This differentiation is considered usefulfor technology development since it is a common assumptionthat new industrial technologies can grow from lab to com-mercial scale within 10 years. For near-term scenarios, thepresented current volumes and costs of CO2 capture seem anadequate estimate. For future volumes of CO2 emissions, nu-merous scenarios exist for different policy scenarios and timehorizons, most notably those of the IPCC and the IEA. Futurecapture costs will vary depending on changing overall eco-nomic conditions and energy prices. Improved technologicalefficiency and performance usually decreases costs over timewhen the technologies are deployed (Finkenrath 2011).Assuming that capture technologies are advanced further inthe future, at stable economic conditions current benchmarkcosts can likely be lowered or at least maintained.
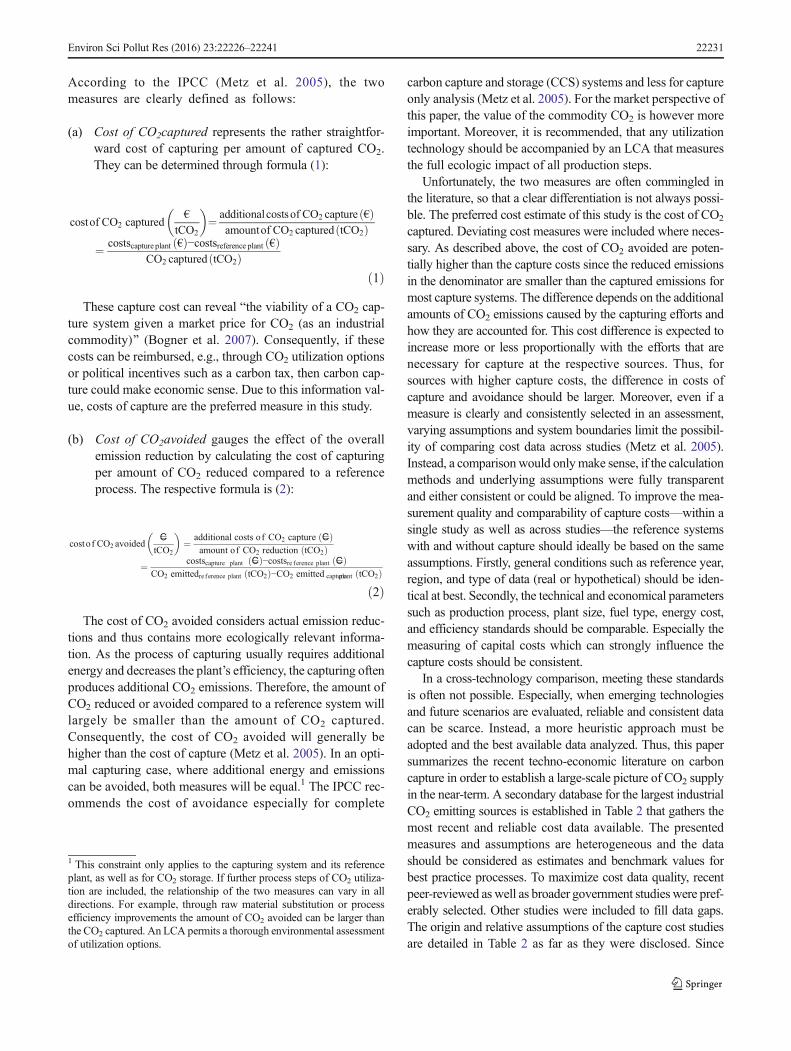
As assigned in Table 1, the CO2 point sources can be di-vided into four major groups of emitters:
I. High purity sources
For certain industrial processes such as ammonia produc-tion, the CO2 emitted is very pure and capture requires onlysmall additional efforts (IEA 2011 and UNIDO 2011).Therefore, these processes yield relatively cheap CO2 as anoutput. These high-concentration sources represent onlyapprox. 2 % of the 12.7 Gt capturable point source emissions(see Fig. 1). Today, capture of CO2 is an established processpredominantly in hydrogen, ammonia, and natural gas purifi-cation plants as they allow for comparatively cost efficientCO2 separation (Wilcox 2012). While raw natural gas cancontain CO2 in different concentrations depending on the re-spective source, the processing of the gas to achieve pipelinequality often includes carbon dioxide separation (Baker andLokhandwala 2008).
II. Fossil-based power generation
The largest CO2 emitting group—the combustion of coaland gas for power generation—currently is responsible forapprox. 76 % of the 12.7 Gt capturable emissions from pointsources (see Fig. 1). However, CO2 capture at power plants isoften connected to significant efficiency losses of approx. 10–30 % of the output energy (de Coninck and Benson 2014;Finkenrath 2011). Consequently, coal and natural gas powerplants currently lack business incentives for large-scale
2 The Oanda currency converter is available at http://www.oanda.com/currency/converter.
22232 Environ Sci Pollut Res (2016) 23:22226–22241
capture. If CCS was incentivized by political regulation (e.g.via emission performance standards) power companies couldstart to implement capture technologies for new plants andpossibly retrofits. For power plants, economies of scale canplay an important role for lowering capital and operating cap-ture costs per tonne.
III. Large industrial emitters
Large industrial CO2 emitting processes together currentlymake up for approx. 22 % of the 12.7 Gt capturable emissionsfrom point sources (see Fig. 1). They include the production ofindustrial materials such as iron and steel, cement, aluminumas well as refineries. As these processes emit CO2 in differentquantities and qualities, CO2 capture at such plants is alsoconnected to varying efficiency penalties and benchmarkcosts. Moreover, a large number of other industrialmanufacturing plants are potential candidates for CO2 capture.Often, they are comparatively smaller than power plants(Bennaceur et al. 2008; Faulstich et al. 2009; Weikl andSchmidt 2010). Thus, economies of scale can bemore difficultto achieve. For example, waste incineration so far has barelybeen analyzed in regard to CO2 capture although reusing suchCO2 would conceptually close resource cycles. The compar-atively small size of the incinerators however entails highercapture costs per tonne than those of other CO2 sources(Faulstich et al. 2009).
IV. Natural wells
It must be noted, that part of the current market is coveredby CO2 from natural wells instead of recovered CO2 emis-sions (Aresta and Dibenedetto 2010). For example, in theUSA, approx. 45 Mt of CO2 from natural reservoirs are cur-rently used in enhanced oil or gas recovery (EOR/EGR)(Wilcox 2012). The cost of natural CO2 is connected to theoil price (US EIA 2014) and relatively low at 15–20 €/t due toits often rather high purity (Aresta and Dibenedetto 2010).However, assuming that CCU technologies must be measuredin regard to their environmental performance, the use of nat-ural CO2 carries certain disadvantages. Extracting CO2 that isnaturally stored underground for the purpose of using it in theproduction of fuels and materials will result in higher totalemissions than when using CO2 that is emitted anyway, e.g.,by an industrial plant. Thus, it is recommended to replace CO2
from natural wells currently in use with recovered CO2 to
achieve a net emission reduction (Aresta and Dibenedetto2010; Metz et al. 2005). Since this paper focuses on recoveredCO2 emissions, CO2 from natural sources is consequently notfurther included in the presented data.
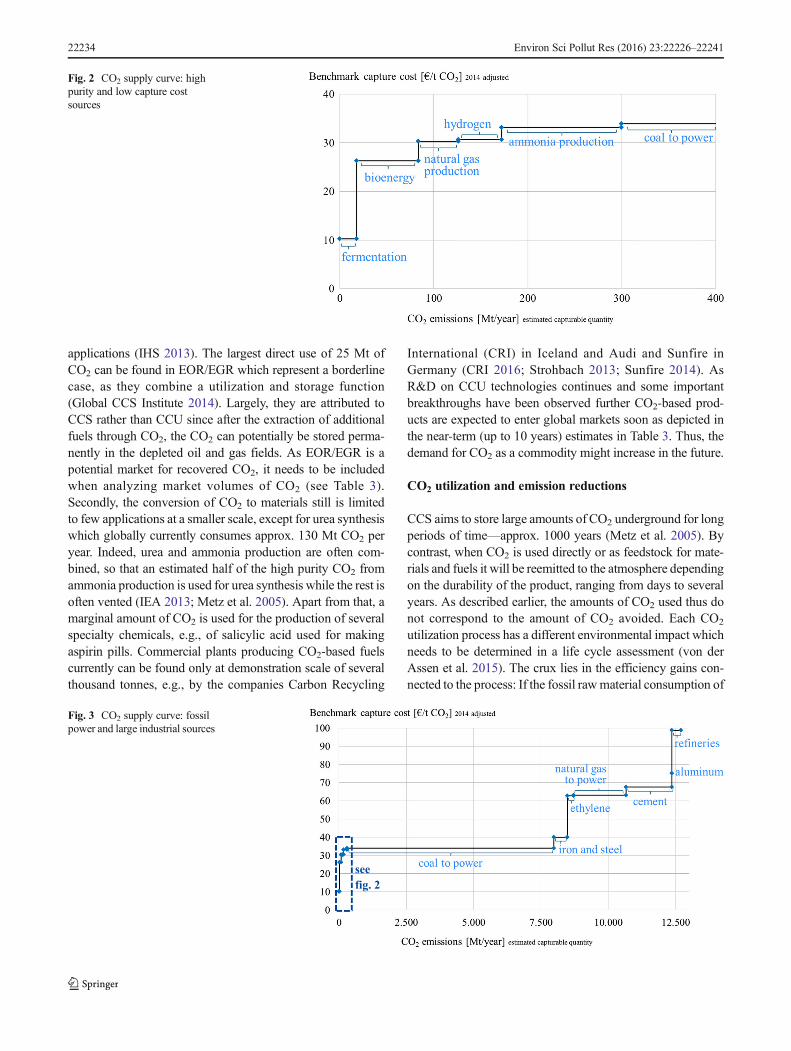
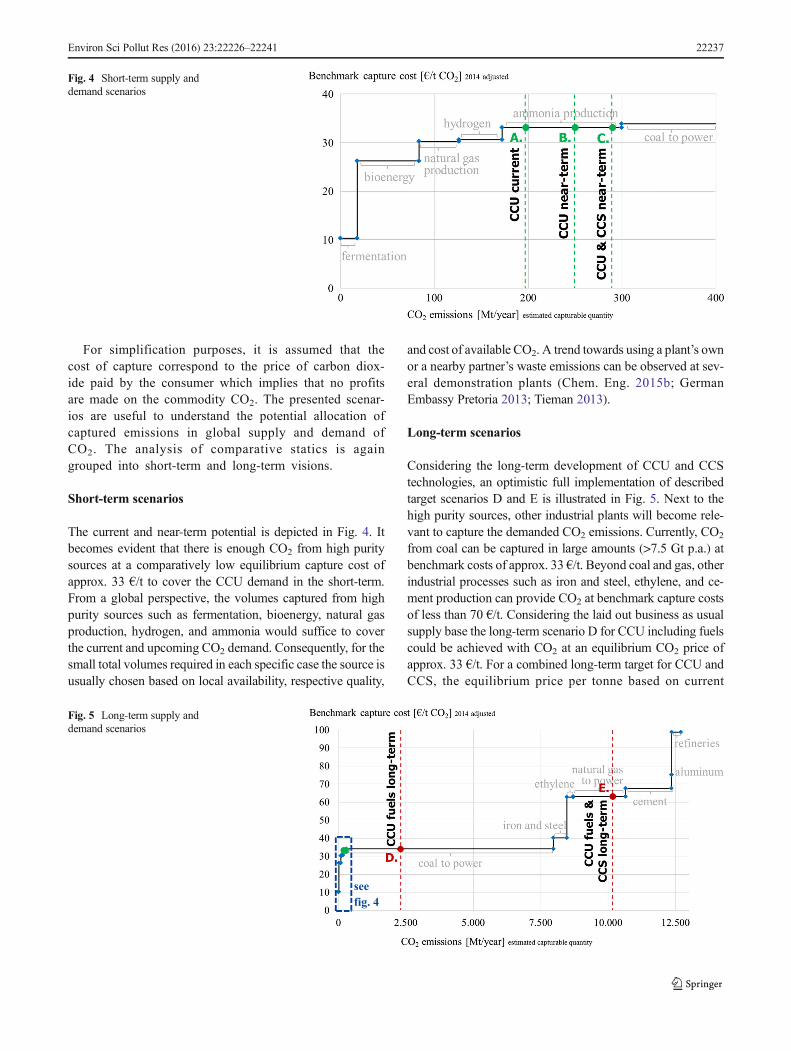
Based on the presented emission and cost data a potentialsupply curve for the commodity CO2 is established in Figs. 2and 3. The low cost sources represent largely the high purityemitters (group I) and are detailed in Fig. 2. These can collec-tively provide approx. 300 Mt of CO2 at a benchmark capturecost of approx. 33 €/t or less. The aggregated capturable CO2
supply of 12.7 Gt CO2 from all listed point sources isdisplayed in Fig. 3. Coal power plants can provide largeamounts of CO2 at relatively low benchmark capture costsof approx. 34 €/t. Nevertheless, even if coal power was phasedout in the future, several other industrial processes wouldcause large amounts of CO2 emissions that can be capturedat benchmark costs below 100 €/t. Such a supply curve canalso be designed for a single plant where different processesemit CO2 at various capture costs, as exemplified in vanStraelen et al. (2010).
Demand side: carbon dioxide capture and utilization
The idea of using CO2 as feedstock is as old as the chemicalindustry (Aresta and Dibenedetto 2010), but so far very fewapplications have been realized. The conversion of CO2 with acatalyst evolved in the 1970s, when chemical engineers firstsucceeded in developing catalysis processes inspired by na-ture’s CO2 conversion cycles (Aresta and Dibenedetto 2010;Aresta et al. 2013). Due to the oil crises at that time, thediscovery of alternative feedstock to lower the dependencyof fossil resources was economically very attractive. Withrising political and public awareness on climate change a largefield of research has developed around possibilities to reduceindustrial CO2 emissions. Accordingly, technological researchon CCU technologies slowly but surely has gained momen-tum in the last decades.
CO2 can either be used directly or as feedstock for a varietyof products. Overall, approx. 222 Mt of the commodity areused in industrial applications worldwide (see current est.volumes in Table 3). Firstly, direct utilization of liquid orgaseous carbon dioxide usually requires a very high purityespecially in the food and beverage industry which currentlyconsumes approx. 11 Mt CO2 per year. Furthermore, around6 Mt CO2 are used as process gas in various industrial
0% 10% 20% 30% 40% 50% 60% 70% 80% 90% 100%
II fossil-based power generation III large industrial I
76% 22% 2Fig. 1 Groups of capturable CO2
emissions from large industrialpoint sources (based on Table 1,100 % correspond to 12.7 GtCO2)
Environ Sci Pollut Res (2016) 23:22226–22241 22233
applications (IHS 2013). The largest direct use of 25 Mt ofCO2 can be found in EOR/EGR which represent a borderlinecase, as they combine a utilization and storage function(Global CCS Institute 2014). Largely, they are attributed toCCS rather than CCU since after the extraction of additionalfuels through CO2, the CO2 can potentially be stored perma-nently in the depleted oil and gas fields. As EOR/EGR is apotential market for recovered CO2, it needs to be includedwhen analyzing market volumes of CO2 (see Table 3).Secondly, the conversion of CO2 to materials still is limitedto few applications at a smaller scale, except for urea synthesiswhich globally currently consumes approx. 130 Mt CO2 peryear. Indeed, urea and ammonia production are often com-bined, so that an estimated half of the high purity CO2 fromammonia production is used for urea synthesis while the rest isoften vented (IEA 2013; Metz et al. 2005). Apart from that, amarginal amount of CO2 is used for the production of severalspecialty chemicals, e.g., of salicylic acid used for makingaspirin pills. Commercial plants producing CO2-based fuelscurrently can be found only at demonstration scale of severalthousand tonnes, e.g., by the companies Carbon Recycling
International (CRI) in Iceland and Audi and Sunfire inGermany (CRI 2016; Strohbach 2013; Sunfire 2014). AsR&D on CCU technologies continues and some importantbreakthroughs have been observed further CO2-based prod-ucts are expected to enter global markets soon as depicted inthe near-term (up to 10 years) estimates in Table 3. Thus, thedemand for CO2 as a commodity might increase in the future.
CO2 utilization and emission reductions
CCS aims to store large amounts of CO2 underground for longperiods of time—approx. 1000 years (Metz et al. 2005). Bycontrast, when CO2 is used directly or as feedstock for mate-rials and fuels it will be reemitted to the atmosphere dependingon the durability of the product, ranging from days to severalyears. As described earlier, the amounts of CO2 used thus donot correspond to the amount of CO2 avoided. Each CO2
utilization process has a different environmental impact whichneeds to be determined in a life cycle assessment (von derAssen et al. 2015). The crux lies in the efficiency gains con-nected to the process: If the fossil rawmaterial consumption of
Fig. 2 CO2 supply curve: highpurity and low capture costsources
see
fig. 2
Fig. 3 CO2 supply curve: fossilpower and large industrial sources
22234 Environ Sci Pollut Res (2016) 23:22226–22241

a production process can be reduced by the introduction of aCO2-based process the environmental balance can be positive.A recent example illustrates how for polyols used for the pro-duction of foams up to 3 t of CO2 emissions can be avoidedper tonne of CO2 used compared to a conventional productionprocess (von der Assen and Bardow 2014). Hence, despite theshort durability of CO2 utilization compared to storage thereis an unknown overall mitigation potential that can pos-sibly be significantly larger than the volumes of CO2
utilized. However, for a market perspective, the volumesof the commodity CO2 that can be captured and usedneed to be matched. A judgment in regard to mitigationpotential is not possible on that basis. While CCS is arecognized emission reduction instrument and commonlyaccounted for in existing carbon management schemesCO2 utilization per se is not accounted as direct emis-sion reduction. If CCU can lead to reductions in fossilraw material use it is possible that CCU indirectly
affects emission accounting just as other efficiencymeasures.
Evaluation of potential CO2 demand
The presented status quo of CO2 utilization has demonstratedthe limited demand for the commodity CO2. However, ongo-ing worldwide CCU-related research covers a diverse array ofutilization options. In the best case Brecycling of CO2 fromanthropogenic sources provides a renewable, inexhaustiblecarbon source and could allow the continued use of derivedcarbon fuels in an environmentally friendly, carbon neutralway^ (Mikkelsen et al. 2010). Even in direct utilization inno-vations are possible that go beyond the substitution of fossilfeedstock. As currently shown by the CO2-based dry cleaninginnovation of the US company CO2 Nexus large-scale drycleaning with CO2 could potentially lead to economic andenvironmental benefits by replacing and reducing the
Table 3 Current and near-term markets of CO2 utilization (based on Aresta et al. (2013) if not indicated otherwise)
Product/application Current est. volumesa Near-term est. volumesb
In kt p.a. CO2 Product CO2 Product
Direct utilization 42,400 42,400
Beverage carbonationc 2900 2900 2900d 2900d
Food packagingc 8200 8200 8200d 8200d
Industrial gasc 6300 6300 6300d 6300d
Oil and gas recovery (EOR/EGR)e 25,000 7–23 % of oil reserve, <5 % of gas reservef 25.000d 7–23 % of oil reserve, <5 % of gas reservef
Materials 167,515 212,400
Urea 114,000 155,000 132,000 180,000
Inorganic carbonates 50,000 200,000 70,000 250,000
Formaldehyde 3500 21,000 5000 25,000
PC (polycarbonates) 10 4000 1000 5000
Carbonates 5 200 500 2000
Acrylates 0 2500 1500 3000
Carbamates 0 5300 1000 6000
Formic acid 0 600 900 1000
PUR (polyurethanes) 0 8000 500 10,000
Fuels 12,510 20,000
Methanol 8000 50,000 10,000 60,000
DME (dimethyl ether) 3000 11,400 >5000 >20,000
TBME (tertiary butyl methyl ether) 1500 30,000 3000 40,000
Algae to biodiesel 10 5 2000 1000
Total 222,425 274,800
a Current data is based on the 2013 estimates from Aresta et al. (2013)b Near-term data is based on the former 2016 estimates from Aresta et al. (2013) and includes CCU technologies that could be implemented within thenext 10 yearsc Data from IHS (2013), worldwide data without Latin America and Asia except Japand Estimated as constant by the author, not included in the cited original literaturee Data from Global CCS Institute (2014)f Estimate from (Metz et al. 2005)
Environ Sci Pollut Res (2016) 23:22226–22241 22235

consumption of a combination of valuable raw materials suchas water, natural gas, and energy (Madsen et al. 2014). At thesame time, replacing existing refrigerants with CO2 as a stan-dard coolant in automobile air conditioning systems is current-ly considered at the European Commission (EurActiv.com2013; Malvicino 2011). Consequently, even when the CO2
is directly used it can potentially substitute various substancesthat are hazardous or have a higher climate impact (Aresta andDibenedetto 2010).
Overall, future estimates for the potential of CO2 utilizationin the literature vary, but all range around the same maximumpotential. For chemical materials, the estimated large-scalepotential is around 200 Mt CO2 p.a. (212 Mt est. by Arestaet al. (2013), 200 Mt by Mikkelsen et al. (2010), 180 Mt est.by VCI (2009), and 115 Mt est. by Metz et al. (2005)). Bycontrast, the estimated large-scale potential for fuel productionwith CO2 is much bigger with approx. 2 Gt CO2 p.a. (VCI2009). Altogether, large-scale CCU can hence potentially re-quire a maximum of 5–6 % of the estimated 37 Gt of anthro-pogenic CO2 emissions (Le Quéré et al. 2014). In order tobuild a potential demand for the commodity CO2, next tothe utilization potential the storage potential must also be tak-en into account. Thus, CCS targets of the IEA will also beincluded in the scenarios (IEA 2013). Since EOR/EGR isusually considered as storage, it will be attributed to theCCS and not the CCU scenarios in this study. For direct uti-lization no long-term estimates exist, but due to the limitedvolumes currently required even significant demand changesare expected to have a minor impact on overall CO2 demand.Consequently, the following five demand scenarios wereidentified:
A. CCU current
This scenario represents the current (2013 est.) CO2
demand presented in Table 3. The aggregate CO2 de-mand amounts to approx. 200 Mt CO2 excludingEOR/EGR.
B. CCU near-term
This scenario includes the expected near-term devel-opment of CO2 utilization over the next 10 years basedon the near-term scenario of Table 3. Next to a contin-ued direct utilization of approx. 17 Mt p.a. (excludingEOR/EGR) the production of some CCU-based fuelsconsumes an estimated 20 Mt of CO2 and the aggregat-ed demand for CO2 amounts to 250 Mt p.a. Similardemand scenarios of mixed CCU material and fuel ac-tivities have also been projected in the range of250–350 Mt by Quadrelli and Centi (2011) and 300–400 Mt by Aresta and Dibenedetto (2010) for the me-dium-term.
C. CCU and CCS near-term
This scenario combines the projected shorter-term devel-opment of 250 Mt CO2 used with 40 Mt CO2 stored (CarbonVisuals 2014). A combined 290Mt CO2 thus depict a realisticdemand for CO2 in the near-term of up to 10 years.
D. CCU fuels long-term
This scenario illustrates a large-scale potential of CO2 uti-lization including a transformation of the fuels sector to syn-thetic CO2-based fuels. Due to the relatively low current pricesof fossil energy, the transition away from fossil fuels is a largerendeavor however that will take much more than 10 years toimplement. Implementing this scenario would be connected tosevere infrastructure investments in particular in regard to re-newable energy and fuel refineries and thus requires strongpolitical efforts. Consequently, this scenario serves rather asan optimistic long-term vision of CCU with 2300 Mt of CO2
(250 Mt for materials and direct use and 2050 Mt for fuelproduction (VCI 2009).
E. CCU fuels and CCS long-term
The combination of the 2300Mt CO2 of scenario D and the2050 target for CCS deployment according to the IEA (2013)of 7870 Mt CO2 provides a long-term overall potential de-mand of combined use and storage of more than 10 Gt CO2.
In summary, scenarios A, B, and C represent realistic, near-term scenarios that show a potential demand of 200–300 MtCO2 and represent less than 1 % of anthropogenic emissionswhile scenarios D and E with 2–10 Gt show an optimistic,long-term potential of materials, fuels, and storage and con-sume potentially 5–27 % of the current estimated anthropo-genic emissions of 37 Gt (Le Quéré et al. 2014).
Supply and demand scenarios
As a next step, the merit order of supply of CO2 from indus-trial point sources will be matched with the described demanddevelopments for CCU and CCS. For this, the discussed cur-rent and potential demand volumes (d) for scenarios A to E arecombined with the supply of CO2 in order to determine theequilibrium best practice benchmark capture prices (p*) foreach scenario. These are determined by applying formula (4)to the presented data.
p* dð Þ ¼ p dð Þ ¼ pi f or d ∈iqi−1;qi
ið4Þ
withd=current and potential demand volumes for scenarios A to Ep*=equilibrium best practice benchmark capture prices
22236 Environ Sci Pollut Res (2016) 23:22226–22241
For simplification purposes, it is assumed that thecost of capture correspond to the price of carbon diox-ide paid by the consumer which implies that no profitsare made on the commodity CO2. The presented scenar-ios are useful to understand the potential allocation ofcaptured emissions in global supply and demand ofCO2. The analysis of comparative statics is againgrouped into short-term and long-term visions.
Short-term scenarios
The current and near-term potential is depicted in Fig. 4. Itbecomes evident that there is enough CO2 from high puritysources at a comparatively low equilibrium capture cost ofapprox. 33 €/t to cover the CCU demand in the short-term.From a global perspective, the volumes captured from highpurity sources such as fermentation, bioenergy, natural gasproduction, hydrogen, and ammonia would suffice to coverthe current and upcoming CO2 demand. Consequently, for thesmall total volumes required in each specific case the source isusually chosen based on local availability, respective quality,
and cost of available CO2. A trend towards using a plant’s ownor a nearby partner’s waste emissions can be observed at sev-eral demonstration plants (Chem. Eng. 2015b; GermanEmbassy Pretoria 2013; Tieman 2013).
Long-term scenarios
Considering the long-term development of CCU and CCStechnologies, an optimistic full implementation of describedtarget scenarios D and E is illustrated in Fig. 5. Next to thehigh purity sources, other industrial plants will become rele-vant to capture the demanded CO2 emissions. Currently, CO2
from coal can be captured in large amounts (>7.5 Gt p.a.) atbenchmark costs of approx. 33 €/t. Beyond coal and gas, otherindustrial processes such as iron and steel, ethylene, and ce-ment production can provide CO2 at benchmark capture costsof less than 70 €/t. Considering the laid out business as usualsupply base the long-term scenario D for CCU including fuelscould be achieved with CO2 at an equilibrium CO2 price ofapprox. 33 €/t. For a combined long-term target for CCU andCCS, the equilibrium price per tonne based on current
Fig. 4 Short-term supply anddemand scenarios
see
fig. 4
Fig. 5 Long-term supply anddemand scenarios
Environ Sci Pollut Res (2016) 23:22226–22241 22237
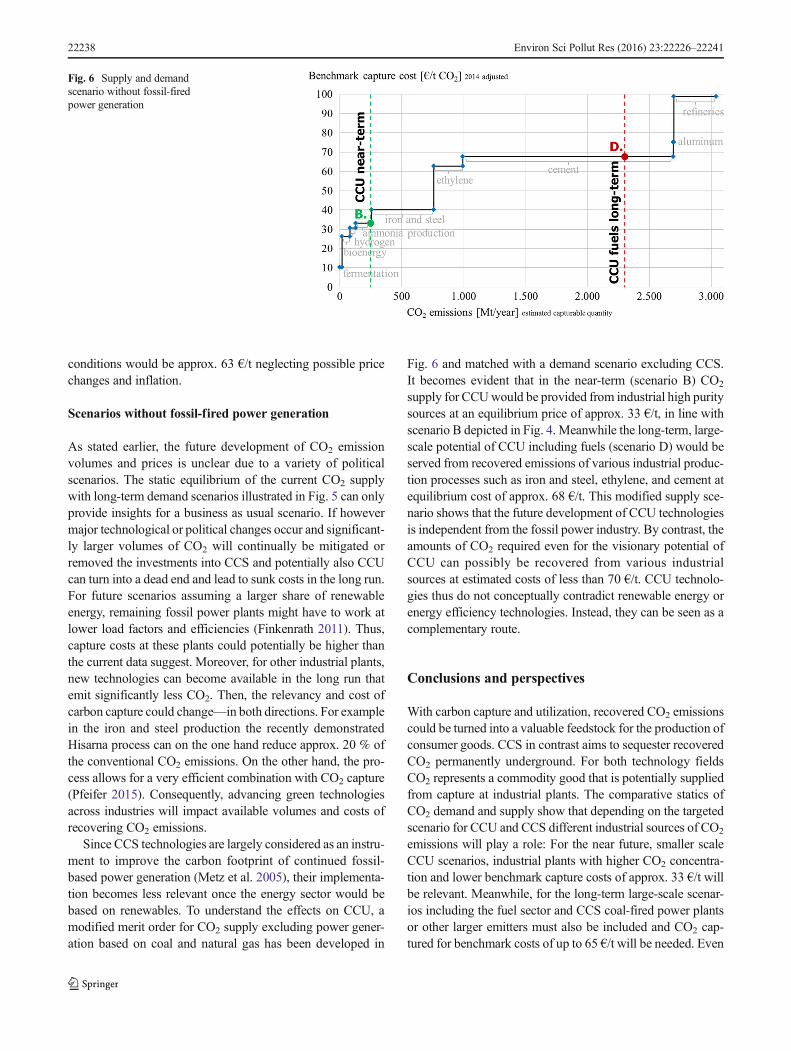
conditions would be approx. 63 €/t neglecting possible pricechanges and inflation.
Scenarios without fossil-fired power generation
As stated earlier, the future development of CO2 emissionvolumes and prices is unclear due to a variety of politicalscenarios. The static equilibrium of the current CO2 supplywith long-term demand scenarios illustrated in Fig. 5 can onlyprovide insights for a business as usual scenario. If howevermajor technological or political changes occur and significant-ly larger volumes of CO2 will continually be mitigated orremoved the investments into CCS and potentially also CCUcan turn into a dead end and lead to sunk costs in the long run.For future scenarios assuming a larger share of renewableenergy, remaining fossil power plants might have to work atlower load factors and efficiencies (Finkenrath 2011). Thus,capture costs at these plants could potentially be higher thanthe current data suggest. Moreover, for other industrial plants,new technologies can become available in the long run thatemit significantly less CO2. Then, the relevancy and cost ofcarbon capture could change—in both directions. For examplein the iron and steel production the recently demonstratedHisarna process can on the one hand reduce approx. 20 % ofthe conventional CO2 emissions. On the other hand, the pro-cess allows for a very efficient combination with CO2 capture(Pfeifer 2015). Consequently, advancing green technologiesacross industries will impact available volumes and costs ofrecovering CO2 emissions.
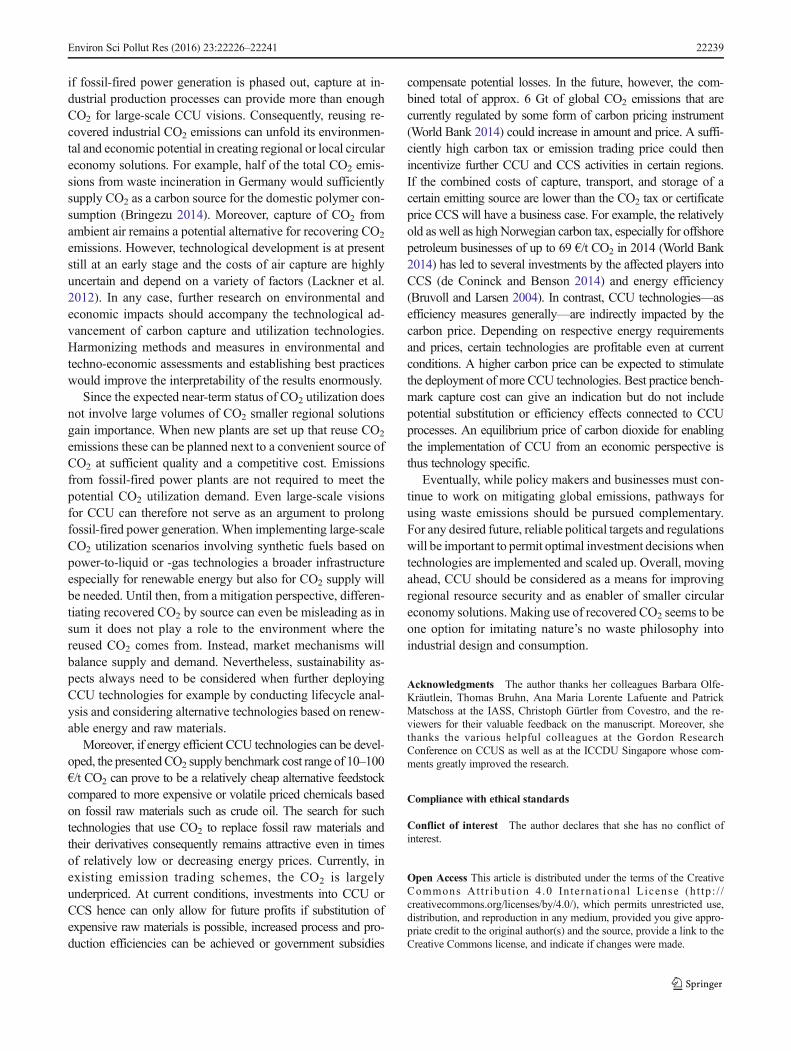
Since CCS technologies are largely considered as an instru-ment to improve the carbon footprint of continued fossil-based power generation (Metz et al. 2005), their implementa-tion becomes less relevant once the energy sector would bebased on renewables. To understand the effects on CCU, amodified merit order for CO2 supply excluding power gener-ation based on coal and natural gas has been developed in
Fig. 6 and matched with a demand scenario excluding CCS.It becomes evident that in the near-term (scenario B) CO2
supply for CCUwould be provided from industrial high puritysources at an equilibrium price of approx. 33 €/t, in line withscenario B depicted in Fig. 4. Meanwhile the long-term, large-scale potential of CCU including fuels (scenario D) would beserved from recovered emissions of various industrial produc-tion processes such as iron and steel, ethylene, and cement atequilibrium cost of approx. 68 €/t. This modified supply sce-nario shows that the future development of CCU technologiesis independent from the fossil power industry. By contrast, theamounts of CO2 required even for the visionary potential ofCCU can possibly be recovered from various industrialsources at estimated costs of less than 70 €/t. CCU technolo-gies thus do not conceptually contradict renewable energy orenergy efficiency technologies. Instead, they can be seen as acomplementary route.
Conclusions and perspectives
With carbon capture and utilization, recovered CO2 emissionscould be turned into a valuable feedstock for the production ofconsumer goods. CCS in contrast aims to sequester recoveredCO2 permanently underground. For both technology fieldsCO2 represents a commodity good that is potentially suppliedfrom capture at industrial plants. The comparative statics ofCO2 demand and supply show that depending on the targetedscenario for CCU and CCS different industrial sources of CO2
emissions will play a role: For the near future, smaller scaleCCU scenarios, industrial plants with higher CO2 concentra-tion and lower benchmark capture costs of approx. 33 €/t willbe relevant. Meanwhile, for the long-term large-scale scenar-ios including the fuel sector and CCS coal-fired power plantsor other larger emitters must also be included and CO2 cap-tured for benchmark costs of up to 65 €/t will be needed. Even
Fig. 6 Supply and demandscenario without fossil-firedpower generation
22238 Environ Sci Pollut Res (2016) 23:22226–22241
if fossil-fired power generation is phased out, capture at in-dustrial production processes can provide more than enoughCO2 for large-scale CCU visions. Consequently, reusing re-covered industrial CO2 emissions can unfold its environmen-tal and economic potential in creating regional or local circulareconomy solutions. For example, half of the total CO2 emis-sions from waste incineration in Germany would sufficientlysupply CO2 as a carbon source for the domestic polymer con-sumption (Bringezu 2014). Moreover, capture of CO2 fromambient air remains a potential alternative for recovering CO2
emissions. However, technological development is at presentstill at an early stage and the costs of air capture are highlyuncertain and depend on a variety of factors (Lackner et al.2012). In any case, further research on environmental andeconomic impacts should accompany the technological ad-vancement of carbon capture and utilization technologies.Harmonizing methods and measures in environmental andtechno-economic assessments and establishing best practiceswould improve the interpretability of the results enormously.
Since the expected near-term status of CO2 utilization doesnot involve large volumes of CO2 smaller regional solutionsgain importance. When new plants are set up that reuse CO2
emissions these can be planned next to a convenient source ofCO2 at sufficient quality and a competitive cost. Emissionsfrom fossil-fired power plants are not required to meet thepotential CO2 utilization demand. Even large-scale visionsfor CCU can therefore not serve as an argument to prolongfossil-fired power generation. When implementing large-scaleCO2 utilization scenarios involving synthetic fuels based onpower-to-liquid or -gas technologies a broader infrastructureespecially for renewable energy but also for CO2 supply willbe needed. Until then, from a mitigation perspective, differen-tiating recovered CO2 by source can even be misleading as insum it does not play a role to the environment where thereused CO2 comes from. Instead, market mechanisms willbalance supply and demand. Nevertheless, sustainability as-pects always need to be considered when further deployingCCU technologies for example by conducting lifecycle anal-ysis and considering alternative technologies based on renew-able energy and raw materials.
Moreover, if energy efficient CCU technologies can be devel-oped, the presentedCO2 supply benchmark cost range of 10–100€/t CO2 can prove to be a relatively cheap alternative feedstockcompared to more expensive or volatile priced chemicals basedon fossil raw materials such as crude oil. The search for suchtechnologies that use CO2 to replace fossil raw materials andtheir derivatives consequently remains attractive even in timesof relatively low or decreasing energy prices. Currently, inexisting emission trading schemes, the CO2 is largelyunderpriced. At current conditions, investments into CCU orCCS hence can only allow for future profits if substitution ofexpensive raw materials is possible, increased process and pro-duction efficiencies can be achieved or government subsidies
compensate potential losses. In the future, however, the com-bined total of approx. 6 Gt of global CO2 emissions that arecurrently regulated by some form of carbon pricing instrument(World Bank 2014) could increase in amount and price. A suffi-ciently high carbon tax or emission trading price could thenincentivize further CCU and CCS activities in certain regions.If the combined costs of capture, transport, and storage of acertain emitting source are lower than the CO2 tax or certificateprice CCS will have a business case. For example, the relativelyold as well as high Norwegian carbon tax, especially for offshorepetroleum businesses of up to 69 €/t CO2 in 2014 (World Bank2014) has led to several investments by the affected players intoCCS (de Coninck and Benson 2014) and energy efficiency(Bruvoll and Larsen 2004). In contrast, CCU technologies—asefficiency measures generally—are indirectly impacted by thecarbon price. Depending on respective energy requirementsand prices, certain technologies are profitable even at currentconditions. A higher carbon price can be expected to stimulatethe deployment of more CCU technologies. Best practice bench-mark capture cost can give an indication but do not includepotential substitution or efficiency effects connected to CCUprocesses. An equilibrium price of carbon dioxide for enablingthe implementation of CCU from an economic perspective isthus technology specific.
Eventually, while policy makers and businesses must con-tinue to work on mitigating global emissions, pathways forusing waste emissions should be pursued complementary.For any desired future, reliable political targets and regulationswill be important to permit optimal investment decisions whentechnologies are implemented and scaled up. Overall, movingahead, CCU should be considered as a means for improvingregional resource security and as enabler of smaller circulareconomy solutions. Making use of recovered CO2 seems to beone option for imitating nature’s no waste philosophy intoindustrial design and consumption.
Acknowledgments The author thanks her colleagues Barbara Olfe-Kräutlein, Thomas Bruhn, Ana Maria Lorente Lafuente and PatrickMatschoss at the IASS, Christoph Gürtler from Covestro, and the re-viewers for their valuable feedback on the manuscript. Moreover, shethanks the various helpful colleagues at the Gordon ResearchConference on CCUS as well as at the ICCDU Singapore whose com-ments greatly improved the research.
Compliance with ethical standards
Conflict of interest The author declares that she has no conflict ofinterest.
Open Access This article is distributed under the terms of the CreativeCommons At t r ibut ion 4 .0 In te rna t ional License (h t tp : / /creativecommons.org/licenses/by/4.0/), which permits unrestricted use,distribution, and reproduction in any medium, provided you give appro-priate credit to the original author(s) and the source, provide a link to theCreative Commons license, and indicate if changes were made.
Environ Sci Pollut Res (2016) 23:22226–22241 22239
References
Aresta M, Dibenedetto A (2010) Industrial utilization of carbon dioxide(CO2). In: Maroto-Valer MM (ed) Developments and innovation incarbon dioxide (CO2) capture and storage technology: Volume 2:Carbon dioxide (CO2) storage and utilisation, vol 2. WoodheadPublishing, Great Abington, pp 377–410
Aresta M, Dibenedetto A, Angelini A (2013) The changing paradigm inCO2 utilization. Journal of CO2 Utilization 3:65–73. doi:10.1016/j.jcou.2013.08.001
Baker RW, Lokhandwala K (2008) Natural gas processing with mem-branes: an overview. Ind Eng Chem Res 47:2109–2121. doi:10.1021/ie071083w
Bennaceur K, Gielen D, Kerr T, TamC (2008) CO2 capture and storage: akey carbon abatement option, Energy Technology Analysis. OECD/IEA, Paris
Bogner J et al (2007) Waste management. In: Metz B, Davidson OR,Bosch PR, Dave R, Meyer LA (eds) Climate Change 2007:Mitigation, Contribution of working group III to the fourth assess-ment report of the Intergovernmental Panel on Climate Change.Cambridge University Press, Cambridge, pp 585–618
Bringezu S (2014) Carbon recycling for renewable materials and energysupply: recent trends, long-term options, and challenges for researchand development. J Ind Ecol 18:327–340. doi:10.1111/jiec.12099
Bruvoll A, Larsen BM (2004) Greenhouse gas emissions in Norway: docarbon taxes work? Energy Policy 32:493–505. doi:10.1016/S0301-4215(03)00151-4
California Carbon Dashboard (2015) Carbon price. California CarbonDashboard., http://calcarbondash.org/. Accessed August 27, 2015
Carbon Visuals (2014) CCS: a 2 degree solution: a film by carbon vi-suals—methodology, WBCSD., http://wbcsdservers.org/web/wbcsdfiles/ClimateEnergy/WBCSD_CCS_film_methodology.pdf.Accessed May 27, 2015
Chem. Eng. (2008) Chemical Engineering Plant Cost Index (CEPCI).Chem Eng January 2008:60
Chem. Eng. (2015a) Chemical Engineering Plant Cost Index (CEPCI).Chem Eng January 2015:64. http://www.chemengonline.com/issues/2015-01
Chem. Eng. (2015b) Polymer produced from CO2 waste gas makes com-mercial debut. http://www.chemengonline.com/polymer-produced-co2-waste-gas-makes-commercial-debut/. Accessed27 Aug 2015
CRI (2016) World’s largest CO2 methanol plant. http://carbonrecycling.is/projects-1/. Accessed 21 May 2016
de Coninck H, Benson SM (2014) Carbon dioxide capture and storage:issues and prospects. Annu Rev Env Resour 39:243–270. doi:10.1146/annurev-environ-032112-095222
EEX (2015) Market data: EEX Primary auction phase 3. EuropeanEnergy Exchange (EEX). http://www.eex.com/en/market-data#/market-data. Accessed August 27, 2015
EurActiv.com (2013) Volkswagen follows Daimler in opting for CO2
refrigerant. EurActiv.com/Reuters. http://www.euractiv.com/energy-efficiency/volkswagen-rules-honeywell-dupon-news-518389. Accessed August 28, 2015
Faulstich M, Leipprand A, Eggenstein U (2009) Relevance of CCS tech-nology for waste incineration. In: Bilitewski B, Urban AI, FaulstichM (eds) Thermic waste treatment, vol 14. Kassel University Press,Kassel, pp 73–86 (in German)
Federal Ministry of Education and Research (2014) Technologies forsustainability and climate protection—Chemical processes and useof CO2: Federal Ministry of Education and Research funding pro-gramme information brochure. Federal Ministry of Education andResearch. http://www.chemieundco2.de/_media/technologies_for_sustainability_climate_protection.pdf. Accessed August 25, 2015
Finkenrath M (2011) Cost and performance of carbon dioxide capturefrom power generation. OECD/ IEA. http://www.iea.org/publications/freepublications/publication/costperf_ccs_powergen.pdf. Accessed January 27, 2015
German Embassy Pretoria (2013) LANXESS commissions CO2 concen-tration unit at Newcastle site in South Africa. German Missions inSouth Africa, Lesotho and Swaziland. http://www.southafrica.diplo.de/Vertretung/suedafrika/en/__pr/2__Embassy/2013/4thQ/10-Lanxess.html. Accessed January 21, 2015
Global CCS Institute (2014) Status of CCS project database. http://www.globalccsinstitute.com/projects/status-ccs-project-database.Accessed 22 May 2015
IEA (2013) Technology roadmap: Carbon capture and storage—2013 edi-tion. OECD/ IEA. http://www.iea.org/publications/freepublications/publication/technologyroadmapcarboncaptureandstorage.pdf.Accessed May 27, 2015
IEA (2014) CO2 emissions from fuel combustion: highlights. OECD/IEA. https://www.iea.org/publications/freepublications/publication/CO2EmissionsFromFuelCombustionHighlights2014.pdf. AccessedAugust 20, 2015
IEA, UNIDO (2011) Technology roadmap: carbon capture and storage inindustrial applications. OECD/IEA/UNIDO. http://www.iea.org/publications/freepublications/publication/ccs_industry.pdf.Accessed December 15, 2014
IHS (2013) Carbon dioxide. Chemical Economics Handbook. IHS,Englewood
Jenkins S (2015) Economic indicators: CEPCI. http://www.chemengonline.com/economic-indicators-cepci/?printmode=1.Accessed August 14, 2015
Jilvero H, Mathisen A, Eldrup N-H, Normann F, Johnsson F, Müller GI,Melaaen MC (2014) Techno-economic analysis of carbon capture atan aluminum production plant—comparison of post-combustioncapture using MEA and ammonia. Energy Procedia 63:6590–6601. doi:10.1016/j.egypro.2014.11.695
Jordal K et al (2014) Feeding a gas turbine with aluminum plant exhaustfor increased CO2 concentration in capture plant. Energy Procedia51:411–420. doi:10.1016/j.egypro.2015.03.055
Kuramochi T, Ramírez A, Turkenburg W, Faaij A (2011) Techno-economic assessment and comparison of CO2 capture technologiesfor industrial processes: preliminary results for the iron and steelsector. Energy Procedia 4:1981–1988. doi:10.1016/j.egypro.2011.02.079
Kurokawa H, Shirasaki Y, Yasuda I (2011) Energy-efficient dis-tributed carbon capture in hydrogen production from naturalgas. Energy Procedia 4:674–680. doi:10.1016/j.egypro.2011.01.104
Lackner KS, Brennan S, Matter JM, Park A-HA, Wright A, van derZwaan B (2012) The urgency of the development of CO2 capturefrom ambient air. Proceedings of the National Academy of Sciences109:13156–13162. doi:10.1073/pnas.1108765109
Le Quéré C et al (2014) Global carbon budget 2014. Earth SystemScience Data Discussions 7:521–610. doi:10.5194/essdd-7-521-2014
Madsen S, Normile-Elzinga E, Kinsman R (2014) CO2‐based cleaning ofcommercial textiles: The world’s first CO2 solution for cleanroomtext i les . CO2 Nexus Inc . ht tp : / /www.energy.ca .gov/2014publications/CEC-500-2014-083/CEC-500-2014-083.pdf.Accessed August 26, 2015
Malvicino C (2011) Final report summary - B-COOL (Low cost and highefficiency CO2 mobile air conditioning system for lower segmentcars). European Commission. http://cordis.europa.eu/result/rcn/46813_en.html. Accessed August 28, 2015
Metz B, Davidson O, De Coninck H, Loos M, Meyer L (2005) IPCCspecial report on carbon dioxide capture and storage. CambridgeUniversity Press. http://www.ipcc.ch/pdf/special-reports/srccs/srccs_wholereport.pdf. Accessed February 11, 2015
22240 Environ Sci Pollut Res (2016) 23:22226–22241
Mignard D (2014) Correlating the chemical engineering plant cost indexwith macro-economic indicators. Chemical Engineering Researchand Design 92:285–294. doi:10.1016/j.cherd.2013.07.022
Mikkelsen M, Jorgensen M, Krebs FC (2010) The teraton challenge. Areview of fixation and transformation of carbon dioxide. Energy &Environmental Science 3:43–81. doi:10.1039/B912904A
Möllersten K, Yan J, R Moreira J (2003) Potential market niches forbiomass energy with CO2 capture and storage—opportunities forenergy supply with negative CO2 emissions. Biomass Bioenerg25:273–285. doi:10.1016/S0961-9534(03)00013-8
Mueller-Langer F, Tzimas E, Kaltschmitt M, Peteves S (2007) Techno-economic assessment of hydrogen production processes for the hy-drogen economy for the short and medium term. Int J HydrogenEnerg 32:3797–3810. doi:10.1016/j.ijhydene.2007.05.027
Pfeifer H (2015) Iron and steel industry. In: Fischedick M, Görner K,Thomeczek M (eds) CO2: Capture, storage, utilization: Holisticevaluation for the energy sector and industry. Springer, Berlin, pp375–384 (in German)
Quadrelli EA, Centi G (2011) Green carbon dioxide. ChemSusChem 4:1179–1181. doi:10.1002/cssc.201100518
Strohbach O (2013) World premiere: Audi opened power-to-gas facility.Audi. http://www.volkswagenag.com/content/vwcorp/info_center/en/themes/2013/06/Audi_opens_power_to_gas_facility.html.Accessed August 24, 2015
Sunfire (2014) Sunfire presents power-to-liquids. http://www.sunfire.de/wp-content/uploads/Sunfire-PM-2014-05-Einweihung-PtL_final_EN.pdf. Accessed August 24, 2015
Tieman R (2013) Chemicals: science views waste in role as raw materialof the future. http://www.ft.com/cms/s/0/2ef57b06-2c26-11e3-acf4-00144feab7de.html#axzz3PS8ZsD8B. Accessed January 21, 2015
US DOE (n.d.) Innovative concepts for beneficial reuse of carbon diox-ide. U.S. Department of Energy. http://energy.gov/fe/innovative-concepts-beneficial-reuse-carbon-dioxide-0. Accessed January 20,2015
US EIA (2014) Assumptions to the annual energy outlook 2014. U.S.Department of Energy. http://www.eia.gov/forecasts/aeo/assumptions/pdf/0554(2014).pdf. Accessed November 19, 2014
van Straelen J, Geuzebroek F, Goodchild N, Protopapas G, Mahony L(2010) CO2 capture for refineries, a practical approach. Int J GreenhGas Con 4:316–320. doi:10.1016/j.ijggc.2009.09.022
VCI, DECHEMA (2009) Position paper utilisation and storage of CO2.DECHEMA. http:/ /www.dechema.de/dechema_media/Posi t ionspapier_co2_engl isch-p-2965.pdf . AccessedDecember 12, 2014
von der Assen N, Bardow A (2014) Life cycle assessment of polyols forpolyurethane production using CO2 as feedstock: insights from anindustrial case study. Green Chem 16:3272–3280. doi:10.1039/c4gc00513a
von der Assen N, Jung J, Bardow A (2013) Life-cycle assessment ofcarbon dioxide capture and utilization: avoiding the pitfalls. EnergEnviron Sci 6:2721–2734. doi:10.1039/c3ee41151f
von der Assen N, Lorente Lafuente AM, Peters M, Bardow A (2015)Environmental assessment of CO2 capture and utilisation. In:Armstrong K, Styring P, Quadrelli EA (eds) Carbon dioxideutilisation. Elsevier, Amsterdam, pp 45–56
Weikl MC, Schmidt G (2010) Carbon capture in cracking furnaces. In:AIChE 2010 Spring Meeting & 6th Global Congress on ProcessSafety, San Antonio, 2010
Wilcox J (2012) Carbon capture. Springer, New YorkWorld Bank (2014) State and trends of carbon pricing 2014. World Bank
Group. http://www-wds.worldbank.org/external/default/WDSContentServer/WDSP/IB/2015/06/01/090224b0828bcd9e/1_0/Rendered/PDF/State0and0trends0of0carbon0pricing02014.pdf.Accessed August 28, 2015
World Economic Forum (2014) Towards the circular economy: acceler-ating the scale-up across global supply chains. World EconomicForum. ht tp : / /www3.wefo rum.org /docs /WEF_ENV_TowardsCircularEconomy_Report_2014.pdf. Accessed November28, 2014
Environ Sci Pollut Res (2016) 23:22226–22241 22241