Economics of a new jet fuel pipeline from Vopak terminal
24
Public version Economics of a new jet fuel pipeline from Vopak terminal An analysis of the economics of a new pipeline Prepared for Gilbert & Tobin Lawyers February 2012
Transcript of Economics of a new jet fuel pipeline from Vopak terminal
Public version
Economics of a new jet fuel
pipeline from Vopak terminal
An analysis of the economics of a new pipeline
Prepared for Gilbert & Tobin Lawyers
February 2012

Reliance and Disclaimer
The professional analysis and advice in this report has been prepared by ACIL Tasman for the exclusive use of the
party or parties to whom it is addressed (the addressee) and for the purposes specified in it. This report is supplied
in good faith and reflects the knowledge, expertise and experience of the consultants involved. The report must not
be published, quoted or disseminated to any other party without ACIL Tasman’s prior written consent. ACIL
Tasman accepts no responsibility whatsoever for any loss occasioned by any person acting or refraining from action
as a result of reliance on the report, other than the addressee.
In conducting the analysis in this report ACIL Tasman has endeavoured to use what it considers is the best
information available at the date of publication, including information supplied by the addressee. Unless stated
otherwise, ACIL Tasman does not warrant the accuracy of any forecast or prediction in the report. Although ACIL
Tasman exercises reasonable care when making forecasts or predictions, factors in the process, such as future market
behaviour, are inherently uncertain and cannot be forecast or predicted reliably.
ACIL Tasman shall not be liable in respect of any claim arising out of the failure of a client investment to perform to
the advantage of the client or to the advantage of the client to the degree suggested or assumed in any advice or
forecast given by ACIL Tasman.
ACIL Tasman Pty Ltd
ABN 68 102 652 148 Internet www.aciltasman.com.au
Melbourne (Head Office) Level 4, 114 William Street Melbourne VIC 3000
Telephone (+61 3) 9604 4400 Facsimile (+61 3) 9604 4455 Email [email protected]
Brisbane Level 15, 127 Creek Street Brisbane QLD 4000 GPO Box 32 Brisbane QLD 4001
Telephone (+61 7) 3009 8700 Facsimile (+61 7) 3009 8799 Email [email protected]
Canberra Level 2, 33 Ainslie Place Canberra City ACT 2600 GPO Box 1322 Canberra ACT 2601
Telephone (+61 2) 6103 8200 Facsimile (+61 2) 6103 8233 Email [email protected]
Perth Centa Building C2, 118 Railway Street West Perth WA 6005
Telephone (+61 8) 9449 9600 Facsimile (+61 8) 9322 3955 Email [email protected]
Sydney PO Box 1554 Double Bay NSW 1360
Telephone (+61 2) 9389 7842 Facsimile (+61 2) 8080 8142 Email [email protected]
For information on this report
Please contact:
Alan Smart Telephone (02) 6103 8201 Mobile 0404 822 312 Email [email protected]
Contributing team members
Sue Jaffer

Economics of a new jet fuel pipeline from Vopak terminal
Introduction and Summary of Conclusions i
Contents
1 Introduction and Summary of Conclusions 1
2 Commercial approaches to investment in pipelines 4
2.1 Investment criteria 4
2.2 Approaches to setting price 5
2.3 Approach adopted in this analysis 7
3 Future demand 8
3.1 The nature of demand and supply for the JUHI 8
3.2 Demand and supply projections 9
3.2.1 Demand 9
4 Economics of new pipeline 14
4.1.1 Conceptual approach 14
4.2 Assumptions 15
4.2.1 Capital and operating expenditures 15
4.2.2 Demand projections 16
4.2.3 Other parameters 16
4.3 Results 16
5 Findings 18
A References A-1
B Résumé for Alan Smart B-1
List of figures
Figure 1 MDQ and ACQ 6
Figure 2 Demand and infrastructure capacity 9
Figure 3 Demand and pipeline capacity (Qantas estimates) 10
Figure 4 Projections of jet fuel demand 11
Figure 5 Pipeline capacity 12
List of tables
Table 1 Demand projections from Working Group report 10
Table 2 Estimate of maximum pipeline capacity 12
Table 3 Impact of new pipeline on peak day demand for existing pipelines 13
Table 4 Cost per ML (ACQ) and initial contract – base scenarios 16
Table 5 Cost per ML (ACQ) and initial contract - 17
Table 6 Payback periods 17

Economics of a new jet fuel pipeline from Vopak terminal
Introduction and Summary of Conclusions 1
1 Introduction and Summary of Conclusions
This report has been prepared by Alan Smart, Principal Consultant of ACIL Tasman Pty Ltd with the
assistance of Sue Jaffer, Senior Consultant with ACIL Tasman. In preparing this report these
consultants have read and understood practice note CM7 and to the best of their knowledge have
complied with the practice note.
We have been asked by Gilbert and Tobin to consider whether, based on the information available to
the National Competition Council (NCC) in this matter, it is economic to duplicate the Caltex Jet Fuel
Pipeline from the Vopak Terminal to the Sydney Airport JUHI.
ACIL Tasman has substantial experience in modelling the costs and economic feasibility of new
pipeline and other investments in the fuel supply chain as well as in other industries. Alan Smart is
qualified in engineering and economics and has extensive experience in economic and financial
evaluation of energy projects. Details of Alan’s background and experience are at Attachment B to this
report.
It is understood that it is accepted by NCC that when the Caltex Jet Fuel Pipeline (as expanded by
reason of current investment proposals) and the Shell Jet Fuel Pipeline reach full capacity, it will be
necessary (and hence economic) to duplicate the Caltex Jet Fuel Pipeline.
However, it is understood that in its Draft Recommendation, the NCC considered that it would be
uneconomic to duplicate the Caltex Jet Fuel Pipeline in the interim period, by reason of the presence of
spare capacity on the Caltex and Shell Jet Fuel Pipelines.
To this end, this report examines when the existing capacity will become fully utilised, and whether it
would be economic for another person to build a new pipeline from the Vopak Terminal in advance of
the satiation of capacity, taking into account the information available on:
• the cost of building and operating a new pipeline;
• the profile of forecast new demand.
Comparison of required peak demand (or throughput) against existing capacity is used to identify when
new capacity needs to come on-stream. The NCC has concluded that new capacity would be required
by 2025 based on average demand or throughput. However, when peak throughput requirements are
considered, in order to meet the replenishment requirements of the JUHI, the information available
indicates that existing pipeline peak capacity will be insufficient from around 2019 and additional
capacity will be required from that date.
One scenario is considered, whereby new capacity is built over the 2012 to 2013 period and comes on-
stream in 2014. The analysis identifies the cost (held constant in real terms) sufficient for an investor to
recover (either through their participation as a supplier of jet fuel at Sydney Airport or through charges
for pipeline access to other suppliers of jet fuel at Sydney Airport) all costs of a new pipeline, including
an allowance for a return on capital and a return of capital. This is done using an analysis of levelised
cost. Levelised cost is a tool widely used for investment analysis, both for ranking alternative projects
Economics of a new jet fuel pipeline from Vopak terminal
Introduction and Summary of Conclusions 2
and for providing an indication of the price at which the service provision becomes economic. By
showing that the levelised cost of a new pipeline, and hence the price required to be charged for
providing transportation services, is comparable with existing alternatives, the analysis shows that it
would be economic to develop a new pipeline.
Our base line analysis is undertaken by reference to the transport of jet fuel from the Vopak Terminal
to the Sydney JUHI. We understand that Vopak customers currently transport approximately ML
per annum through the Caltex Jet Fuel Pipeline. It is this minimum volume that would be available for
a new pipeline in the event that access was withheld from the Caltex Jet Fuel Pipeline. We have then
added additional volumes based on the conservative assumption that the new pipeline only obtains
incremental volumes after the Caltex and Shell Jet Fuel Pipelines reach full capacity.
Under this base line analysis, the levelised cost is cents per litre calculated over 30 years. This
levelised cost is lower than the current transport charge through the Caltex Jet Fuel Pipeline and hence
it would be economic for a supplier of jet fuel at Sydney Airport to bear this cost and still be
competitive.
While payback period calculations are not normally used in investment decisions of this nature they are
sometimes used as a rule of thumb indicator to compare different investment options. The payback
period for the base case is 14 years.
For the purpose of calculating the cash flows, we have limited the throughput that can be captured by
the new pipeline to 40 per cent of total demand over the longer term. This is considered a conservative
assumption as the existing pipelines would be at full capacity and competition could only come from
additional investment in new pipelines, storage or trucking capability. Under this base line scenario, the
share of total throughput of jet fuel to Sydney Airport starts in the early years at of total demand
and rises over the life of the pipeline to 40% of total demand.
We have then conducted further analysis, by testing other scenarios. We have:
• tested the starting level volume and share of fuel throughput that would be required in order to
deliver a competitive transport cost, against transport charges over the Caltex Jet Fuel Pipeline (in
the order of cents per litre). Our modelling shows that a starting volume of ML per day,
or approximately ML per year, (a % share of total average throughput of 9.5 ML per day in
2014) is required in order to be able to sustain a levelised cost of cents per litre;
• tested the payback period for the pipeline for lower and higher initial volume share assumption.
Starting with an initial volume of 0.5 ML per day and increasing this in steps to ML per day.
Payback periods range from 15 years to 14 respectively1.
Given the above results, having regard to our experience in assessing the cost and economic viability of
investments in the fuel supply chain and in other industries, we consider that, on the information
available, it would be economic (ie that is viable) for another person to duplicate the Caltex Jet Fuel
Pipeline from the Vopak Terminal to the JUHI starting from 2014.
1 Calculation of payback periods is not generally used as investment criteria for pipeline investments but is provided for
illustrative purposes.

Economics of a new jet fuel pipeline from Vopak terminal
Introduction and Summary of Conclusions 3
We note that this is not a prediction that such economic duplication is necessarily likely, particularly
where any person seeking to transport jet fuel to the JUHI can access the Caltex Jet Fuel Pipeline as
well as fuel delivered by road transport.
However, in principle it would not be necessary for another customer seeking to transport jet fuel from
the Vopak Terminal to the JUHI to utilise the Caltex Jet Fuel Pipeline in order to compete for the sale
of jet fuel at Sydney Airport. It would be viable to build another pipeline and still remain competitive in
the supply of jet fuel at Sydney Airport.
Economics of a new jet fuel pipeline from Vopak terminal
Commercial approaches to investment in pipelines 4
2 Commercial approaches to investment in pipelines
2.1 Investment criteria
Oil and gas steel pipelines have long operating lives, typically 50 years. Pumps, valves and related
supporting equipment typically have shorter lives. Typically pumps will have asset lives of around 20
years. There are well established standards for maintaining and operating steel pipelines and providing
maintenance is properly implemented longer periods of operation are not uncommon.
Investors in pipeline infrastructure of this type expect to recover costs over the longer term, usually the
life of the asset. Finance for such assets is long term, sourced either off balance sheet for companies
with substantial financial reserves or through investment finance for smaller companies. Such assets
also exhibit the lower end of the risk range and corresponding lower returns attracting investors such
interested in longer term lower risk returns.
Investors in oil and gas pipelines also generally seek longer term contractual arrangements of three
years or more to in part underwrite the investment required. A minimum of five years is increasingly
becoming the norm. They take into account forecast demand growth in evaluating the investment and
may even allow for some speculative growth in demand. Examples of such investments include the
Tasmanian Gas Pipeline running from Victoria to Tasmania and the Eastern Gas Pipeline from Sale to
Sydney.
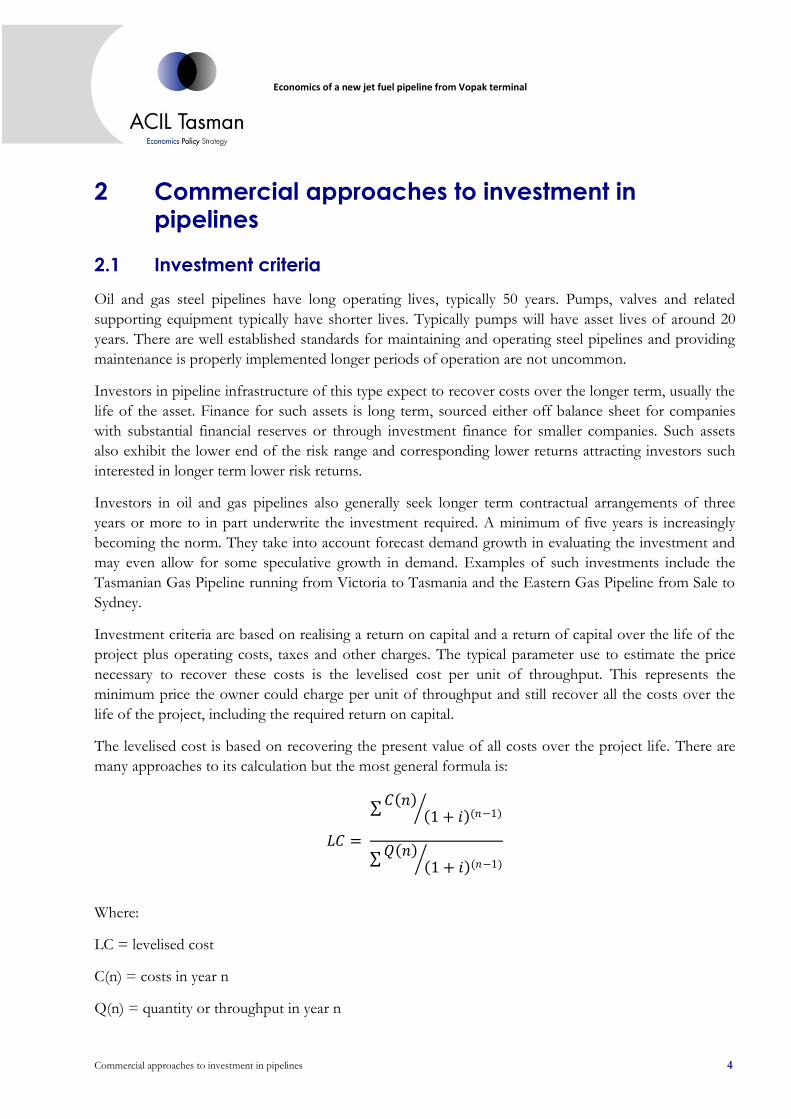
Investment criteria are based on realising a return on capital and a return of capital over the life of the
project plus operating costs, taxes and other charges. The typical parameter use to estimate the price
necessary to recover these costs is the levelised cost per unit of throughput. This represents the
minimum price the owner could charge per unit of throughput and still recover all the costs over the
life of the project, including the required return on capital.
The levelised cost is based on recovering the present value of all costs over the project life. There are
many approaches to its calculation but the most general formula is:
𝐿𝐶 =
𝐶 𝑛 1 + 𝑖 (𝑛−1)
𝑄 𝑛 1 + 𝑖 (𝑛−1)
Where:
LC = levelised cost
C(n) = costs in year n
Q(n) = quantity or throughput in year n
Economics of a new jet fuel pipeline from Vopak terminal
Commercial approaches to investment in pipelines 5
i = weighted average cost of capital
n = project year
2.2 Approaches to setting price
Price setting for oil and gas pipelines sometimes needs to take into account the fact that the flow
through a pipeline varies within a day and from day to day throughout each year. Peak flows are the
main driver of the size of a pipeline. The diameter of the pipe needs to be sufficient to take the
maximum flow that will occur in the peak day of the year. If the flow is not uniform, it means that for
some of the time, the pipeline is not full. At those times not all of the pipeline’s capital is being fully
utilised.
In contract terms the peak daily demand is generally referred to as the Maximum Daily Quantity
(MDQ) and the average demand is referred to as the Average Contract Quantity (ACQ), which can be
either expressed in terms of average throughput per day or per year. The concept of peak demand
(MDQ) and average annual demand (ACQ) is illustrated in Figure 2. This is not intended to represent
the patterns of supply of jet fuel to the JUHI. It shows however how a peak flow requirement relates to
an average flow requirement.
For pipelines that have periodic peak flow requirements that are not required all the time, throughput
varies from low to high depending on the demand at a given time. At periods away from the peak flows
are lower and the average annual throughput (ACQ) is lower than the peak requirement (MDQ). While
the MDQ must be met when it is needed, at other times the pipeline is not full and has spare capacity.

Economics of a new jet fuel pipeline from Vopak terminal
Commercial approaches to investment in pipelines 6
Figure 1 MDQ and ACQ
Note: Diagram is for illustrative purposes and is not intended to represent the pattern of flows that would apply for the Jet Fuel Pipelines Source: ACIL Tasman
MDQ also determines the time when pipeline capacity needs to be expanded. If the MDQ is higher
than the ACQ, it follows that at the point where additional pipeline capacity is required; there will still
be some spare capacity when expressed on an ACQ basis. The only way this spare capacity can be
utilised is if any additional demand is not required at peak times.
It is understood that in order to replenish storage at the JUHI it is necessary to run the pipelines at a
higher rate than the average rate of demand. This higher rate is equivalent to a peak rate or MDQ. This
is a characteristic of the supply requirements of the JUHI.
In pipeline systems the ratio of ACQ to MDQ is referred to the load factor. In the JUHI pipeline
system, the peak requirement is 1.2 times the typical requirement (Sydney Jet Fuel Infrastructure
Working Group, 30 April 2010, p. 34). This is equivalent to a load factor of around 0.83. However the
typical requirement is about 6 per cent higher than the average annual daily requirement which is the
focus of this analysis2. The load factor expressed in terms of average annual daily requirement to peak
daily requirement to is thus 0.79.
2 In the Joint Working Report the typical daily requirement varies from around 6 per cent above the average daily
requirement in the early years to around 3 per cent higher in the later years.
FML/day
FTime
Average daily flow(ACQ)
Peak flow(MDQ)
Period when replenshment occurs
Periods when JUHI storages draw down
Economics of a new jet fuel pipeline from Vopak terminal
Commercial approaches to investment in pipelines 7
Some distribution pipeline systems charge on an ACQ or throughput basis. This means that, for
pipelines with a load factor less than 1, the price per litre includes an allowance for capital invested to
ensure that MDQ can be met when necessary.
In situations, however, it is common for energy pipelines to charge on an ACQ basis plus an MDQ
basis to cover the need to reserve capacity for peak days. The latter is sometimes referred to as a
capacity reservation charge. In other words, the MDQ price is a charge to reserve capacity whether it is
used or not.
2.3 Approach adopted in this analysis
ACIL Tasman has been provided with a comparative transport charge through the Caltex Jet Fuel
Pipeline on a cent per litre basis. In order to compare the levelised costs, the cost calculations in this
analysis have been undertaken on the basis of an ACQ throughput. The levelised cost will necessarily
include capital costs necessary to ensure that the MDQ can be delivered, so that the levelised cost
incorporates both the ACQ and MDQ components as described above.
Economics of a new jet fuel pipeline from Vopak terminal
Future demand 8
3 Future demand
The future demand projections have been based on those provided in the report of the Sydney Jet Fuel
Working Group released in April 2010 (Sydney Jet Fuel Infrastructure Working Group, 30 April 2010).
The working group report provided projections to 2029 and in order to extend the economic analysis
to 30 years jet fuel demand was assumed continue to grow but at a lower rate than in the years leading
up to 2029.
3.1 The nature of demand and supply for the JUHI
The current arrangements for supplying jet fuel to Sydney Airport are outlined in the Working Group
report and are not repeated here. However understanding the relationship between peak and average
daily demand is important to understanding the economics of a new pipeline.
The Working Group report points out that peak daily demand equals 1.2 times typical daily demand,
allowing for the need to replenish storage at the JUHI. At the present time the JUHI operators aim to
hold at least 2 days’ supply in storage at the airport. ACIL Tasman understands that the peak daily
demand is generally met by scheduling throughput through the Caltex Jet Fuel Pipeline, although it
could also be achieved in part by increasing throughput through the Shell Jet Fuel Pipeline.
The demand and capacity outlook was summarised in a chart provided by Gilbert & Tobin in its letter
to the NCC dated 29 November 2011. I understand that an updated chart has been prepared for
submission to the NCC, which is shown in Figure 2. This chart includes the Working Group report
demand projections. ACIL Tasman has adopted the Working Group’s demand forecasts for this
analysis.
For the purpose of most of this analysis ACIL Tasman has not included the capacity that can be
provided from trucking. Trucking in its own right may well be a competitive alternative facility to
provide transport from the Vopak Terminal to the JUHI, which I have not assessed for the purposes of
this analysis.
If trucking was a competitive alternative to pipeline transport from the Vopak Terminal to the JUHI,
then presumably that would address the question as to whether there was an economically viable
alternative to the Caltex Jet Fuel Pipeline and it would not be necessary to assess whether a new
pipeline was viable. In effect, the analysis in this report is relevant, if it is assumed that trucking is not a
competitive alternative to pipeline transport. For this reason, trucking alternatives have not been
included in the analysis as a reasonable and appropriate simplification for the purpose of modelling.

Economics of a new jet fuel pipeline from Vopak terminal
Future demand 9
Figure 2 Demand and infrastructure capacity3
Note : The “Sprint rate” is the theoretical maximum capability of all existing supply infrastructure to transport jet fuel to Sydney Airport.4 This capability may be used to ensure daily and busy day demands are met.
Data source: Gilbert + Tobin, 13 February 2012
3.2 Demand and supply projections
3.2.1 Demand
The Sydney Jet Fuel Working Group prepared projections of demand for jet fuel at Sydney Airport to
2029. The projections are summarised in Table 1.
3 For the sake of simplicity, the Caltex Stage 2 Upgrade is indicated to come on at the beginning of 2012, although it will
likely be available later that year. In addition, while 100% utilisation of the Shell Jet Fuel Pipeline is available now (as shown in the diagram), that capacity is likely to be there on an ongoing basis following the closure of the Clyde refinery in mid-2013.
4 For example, prior to the Caltex Stage 2 Upgrade, the sprint rate would be the sum of 7.9 ML per day (using Vopak’s pumps) and 3.9 ML per day (being the maximum capacity of the Shell Jet Fuel Pipeline).
Shell Jet Fuel Pipeline (100% utilisation)
Caltex Upgrade (Stage 1)
Caltex Upgrade (Stage 2)
Trucking
0
5
10
15
20
25
2009 2010 2011 2012 2013 2014 2015 2016 2017 2018 2019 2020 2021 2022 2023 2024 2025 2026 2027 2028 2029 2030
Cap
acit
y to
Syd
ne
y JU
HI
(ML/
day
)
Year
Daily demand Busy day demand Minimum replenishment rate
Sprint rate# Vopak Upgrade
New PipelineShell Upgrade
Shell Jet Fuel Pipeline (existing utilisation with refinery constraint)
Caltex Jet Fuel Pipeline (Pre stage 1)
fburke
Rectangle
fburke
Rectangle

Economics of a new jet fuel pipeline from Vopak terminal
Future demand 10
Table 1 Demand projections from Working Group report
2009 2014 2019 2024 2029
Average ML/year 2,450 3,472 3,926 4,864 5,644
Normal day ML/day 6.71 9.51 10.76 13.33 15.46
Average annual growth rate %
7.2% 2.5% 4.4% 3.0%
Busy day ML/day 6.71 10.45 11.82 14.25 16.30
Average annual growth rate %
9.3% 2.5% 3.8% 2.7%
Required minimum replenishment rate (Peak day) ML/day 8.65 12.10 13.68 16.64 19.16
Average annual growth rate %
6.9% 2.5% 4.0% 2.9%
Note: The minimum replenishment rate is 1.2 x the typical rate. The typical rate is the normal day rate plus one standard deviation. The figures in the Jet Fuel report provide the replenishment. Data source: (Sydney Jet Fuel Infrastructure Working Group, 30 April 2010, p. 31)
These projections were adopted in the figure provided by Qantas in its submission and cited in the
Council’s draft report. I understand that Caltex has attempted to recreate the Qantas graph with some
amendments and added the replenishment rate and this is reproduced in Figure 3.
Figure 3 Demand and pipeline capacity (Qantas estimates)
Source: (Qantas, 21 November 2011)
It is important to note that the minimum replenishment rate represents the peak rate of transfer
required to maintain supply over time which is similar to the MDQ. The lower demand lines represent
the daily demand which is calculated in the Working Group report as the average annual demand which
is equivalent to an ACQ.
It would be incorrect therefore to conclude that the lower lines in the chart indicate that spare capacity
could exist until 2024 (corresponding to the point where the low demand line crosses the capacity line).
4
6
8
10
12
14
16
18
20
20
11
20
12
20
13
20
14
20
15
20
16
20
17
20
18
20
19
20
20
20
21
20
22
20
23
20
24
20
25
20
26
20
27
20
28
20
29
20
30
Mill
ion
Lit
res
pe
r D
ay
Year
Sydney Jet Fuel Demand vs Pipeline Capacity
Pipeline capacity - Clyde conversion
Pipeline capacity - Clyde Conversion and CaltexPhase 2A Upgrade
Pipeline Capacity - Clyde Conversion and Caltex 2A& B Upgrade
JFIWG Demand (High)
JFIWG Demand (Low)
Minimum replenishment rate
Economics of a new jet fuel pipeline from Vopak terminal
Future demand 11
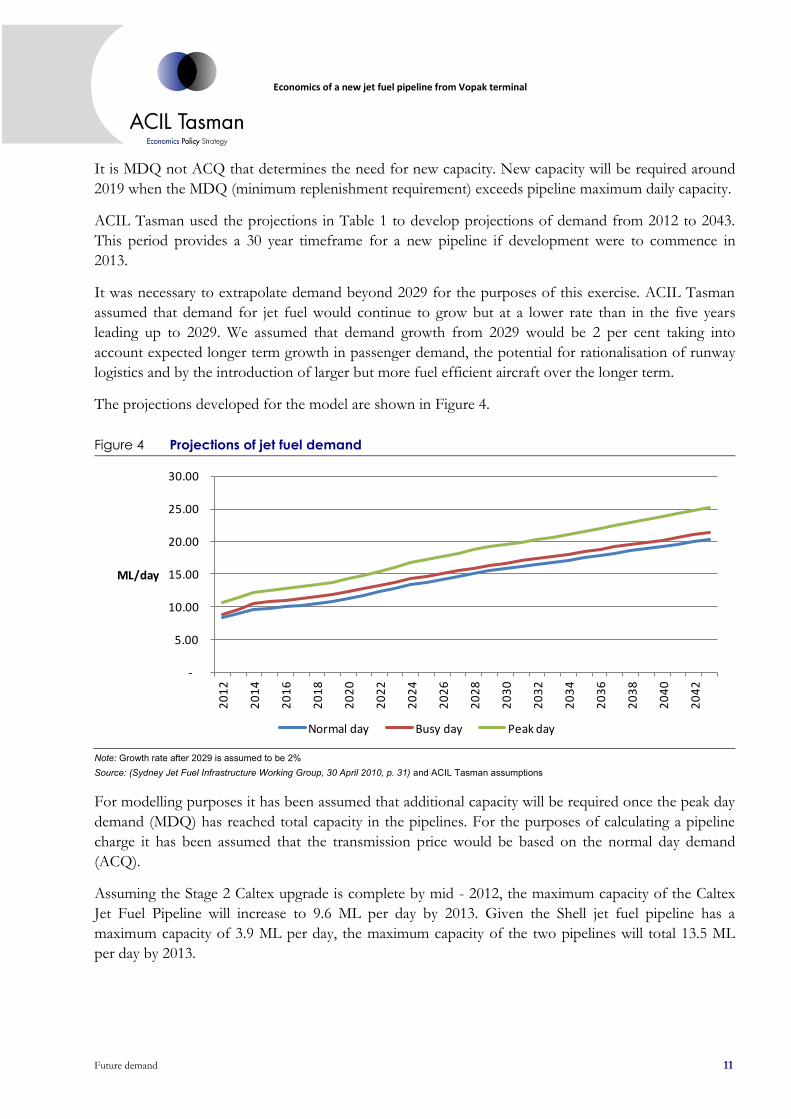
It is MDQ not ACQ that determines the need for new capacity. New capacity will be required around
2019 when the MDQ (minimum replenishment requirement) exceeds pipeline maximum daily capacity.
ACIL Tasman used the projections in Table 1 to develop projections of demand from 2012 to 2043.
This period provides a 30 year timeframe for a new pipeline if development were to commence in
2013.
It was necessary to extrapolate demand beyond 2029 for the purposes of this exercise. ACIL Tasman
assumed that demand for jet fuel would continue to grow but at a lower rate than in the five years
leading up to 2029. We assumed that demand growth from 2029 would be 2 per cent taking into
account expected longer term growth in passenger demand, the potential for rationalisation of runway
logistics and by the introduction of larger but more fuel efficient aircraft over the longer term.
The projections developed for the model are shown in Figure 4.
Figure 4 Projections of jet fuel demand
Note: Growth rate after 2029 is assumed to be 2% Source: (Sydney Jet Fuel Infrastructure Working Group, 30 April 2010, p. 31) and ACIL Tasman assumptions
For modelling purposes it has been assumed that additional capacity will be required once the peak day
demand (MDQ) has reached total capacity in the pipelines. For the purposes of calculating a pipeline
charge it has been assumed that the transmission price would be based on the normal day demand
(ACQ).
Assuming the Stage 2 Caltex upgrade is complete by mid - 2012, the maximum capacity of the Caltex
Jet Fuel Pipeline will increase to 9.6 ML per day by 2013. Given the Shell jet fuel pipeline has a
maximum capacity of 3.9 ML per day, the maximum capacity of the two pipelines will total 13.5 ML
per day by 2013.
-
5.00
10.00
15.00
20.00
25.00
30.00
20
12
20
14
20
16
20
18
20
20
20
22
20
24
20
26
20
28
20
30
20
32
20
34
20
36
20
38
20
40
20
42
ML/day
Normal day Busy day Peak day

Economics of a new jet fuel pipeline from Vopak terminal
Future demand 12
Table 2 Estimate of maximum pipeline capacity
Shell Pipeline Caltex pipeline Total
ML/day ML/day ML/day
2012 3.9 7.9 11.8
2013 3.9 9.6 13.5
2014 3.9 9.6 13.5
2015 3.9 9.6 13.5
Data source: (Caltex Australia, 21 November 2011)
The pipeline capacity and throughput estimates are shown in Figure 5.
Figure 5 Pipeline capacity
Note: Pipeline capacity includes existing Shell and Caltex capacity, plus the second upgrade to the Caltex pipeline. Capacities sourced from SJFIWG, p24 and 25 Source: ACIL Tasman
The diagram shows that additional pipeline capacity will be required from 2019 to meet peak demand.
We understand the issue raised by the NCC is whether it would be economic to duplicate the Caltex Jet
Fuel Pipeline to transport jet fuel from the Vopak Terminal to the Sydney JUHI. We understand that
the current volume of jet fuel throughput from the Vopak Terminal which is transported via the Caltex
Jet Fuel Pipeline is approximately ML per annum which would equate to approximately ML
per day on average. There may be additional volumes transported by truck at certain times which could
also be available for a new pipeline. This has not been factored into the analysis
A throughput of ML per annum represents approximately % of the total fuel projected to be
transported to the Sydney Airport JUHI in 2014. With a load factor of 0.79 this would result in a peak
demand of ML/day. If the Vopak demand were transferred to a new pipeline from the Caltex
pipeline it would free up ML per day of peak capacity on the Caltex pipeline. As a result of this,
the year in which the existing pipelines would become fully committed would move from 2019 to
(see Table 3).
-
5.00
10.00
15.00
20.00
25.00
30.00
20
13
20
15
20
17
20
19
20
21
20
23
20
25
20
27
20
29
20
31
20
33
20
35
20
37
20
39
20
41
20
43
ML/day
Peak day Pipeline capacity Normal day

Economics of a new jet fuel pipeline from Vopak terminal
Future demand 13
Table 3 Impact of new pipeline on peak day demand for existing pipelines
2016 2017 2018 2019 2020 2021 2022 2023
Peak day ML/day 12.71
13.02
13.35
13.68
14.23
14.80
15.39
16.00
Existing pipeline capacity
13.50
13.50
13.50
13.50
13.50
13.50
13.50
13.50
Note: Orange shaded cells represent time at which existing pipeline capacity becomes fully committed Data source: ACIL Tasman
This delay has been taken into account in calculations for the economics of a new pipeline.

Economics of a new jet fuel pipeline from Vopak terminal
Economics of new pipeline 14
4 Economics of new pipeline
4.1.1 Conceptual approach
In this report ACIL Tasman has examined the economics of an investment in a new pipeline from the
Vopak Terminal at Port Botany to the Sydney Airport JUHI in the period prior to 2020 when current
projections indicate that additional peak capacity will be required.
In reality the owners of the existing pipelines and a new investor are only competitors for demand
growth where the existing pipelines have spare capacity. A new pipeline could seek to compete for
additional capacity or, alternatively, once the Caltex and Shell Jet Fuel Pipelines are at full capacity it
could simply take the unmet demand for throughput.
It would not be unreasonable for a potential new investor to consider investing before 2019 if there
were available volumes of jet fuel that could be transported through its pipeline in the interim period
before the other pipelines reach full peak capacity and where that puts it in the best position to capture
additional throughput once the other pipelines reach full capacity.
Given the object of the assessment, that is whether it would be economic for any person to develop
another pipeline from the Vopak Terminal to the JUHI, it is has been assumed that some customers are
not able to gain access to the Caltex pipeline to meet growing demand needs.
Further, this appears to be the relevant focus, as we understand the issue in this matter is declared
access to the Caltex Jet Fuel Pipeline. If access to that pipeline was not available to users of the Vopak
Terminal, then the question is whether it would be viable to build a new pipeline to cater for them.
A person seeking to invest in a new pipeline in this case would have available to it the Vopak volumes,
and fuel suppliers/airlines would have an interest in taking transport through the pipeline provided that
it could offer pricing that was sufficiently competitive with the costs of the alternative Caltex Jet Fuel
Pipeline that they could viably compete in the supply of jet fuel at Sydney Airport.
In this scenario, it would be rational for fuel suppliers or airlines to contract for capacity on a new
pipeline. The demand projections indicate that the Caltex (and Shell) pipelines will be at full peak
capacity in the early 2020’s depending on the initial market share that the new pipeline can attract. By
the time the new contracts have expired it is likely that the Caltex and Shell pipelines will be at full
peaking capacity.
A new investor would need to assess the potential for a new pipeline to capture future growth in
demand once the existing pipelines are at full peak capacity. The new investor would know that if they
did invest earlier, it is highly likely that they would have the advantage in securing net growth in
demand over the other pipelines, whose facilities were at full capacity (and either could not be
expanded or would require further capital investment to expand).
For the purpose of analysis therefore ACIL Tasman has examined a scenario where a new investor can
secure a 5 year commitment to transport jet fuel via its pipeline from the existing Vopak Terminal users

Economics of a new jet fuel pipeline from Vopak terminal
Economics of new pipeline 15
to commence in 2014 for ML per day average demand. The contract arrangements could provide
that the contract would be rolled over at the end of the period subject to price review. As noted above,
this is a starting level share of fuel transport to the JUHI of per cent of average annual demand in
2014.
The pipeline investor would then, conservatively, only seek to secure demand growth beyond to
support the investment5. After this date the new pipeline does not need to win volumes away from the
Caltex or Shell Jet Fuel Pipelines to increase throughput. The investor considers that the only
competition at that time would be from construction of new pipelines by competitors as existing
pipelines will have reached full peak capacity by that time. The investor may also consider that there
would be a competitive advantage from a pre-emptive investment in a new pipeline from the Vopak
Terminal to the JUHI at Sydney Airport.
We have conducted further analysis in which:
• We have fixed the levelised cost at a figure which is competitively below the alternative transport
charges on the Caltex Jet Fuel Pipeline in order to determine the minimum initial share of the fuel
volumes sufficient to be able to recover that cost, assuming conservatively that the pipeline only
attracts incremental volumes above the full capacity of the Caltex and Shell Jet Fuel Pipelines;
• We have relaxed the conservative assumption that the pipeline only subsequently attracts
incremental volumes above the full capacity of the Caltex and Shell Jet Fuel Pipelines in further
analysis and assumed that the pipeline does seek to win an additional share of volumes over time
away from the other pipelines. We have assumed that the investor seeks to move to a position
where its pipeline would ultimately transport up to 40% of total volumes.
4.2 Assumptions
4.2.1 Capital and operating expenditures
The capital cost of the new pipeline is assumed to be at the top end of the range assumed by the
Sydney Jet Fuel Infrastructure Working Group. The Working Group report estimated that a new
pipeline would cost between $50 million and $60 million in 2008 prices6. For this exercise ACIL
Tasman adopted the higher figure which was then indexed to 2011 prices using the All Australian Cities
CPI, bringing total capital expenditure to $65 million.
Capital expenditure was assumed to be spread over two years commencing in 2012 and concluding in
2013. It was assumed that the pipeline would be commissioned at the beginning of 2014.
Operating expenditures have been based on estimates for comparable pipelines. Adjustments have
been made for distance, pumping requirements and maintenance differences. Operating costs of
cents per litre were used to calculate total operating costs in each year.
5 See Table 3
6 SJFIWG Report, p41
Economics of a new jet fuel pipeline from Vopak terminal
Economics of new pipeline 16
4.2.2 Demand projections
The demand projections are set out above in Section 3. As discussed, peak demand (assessed as 1.2
times typical demand) was used to determine the year in which existing capacity would become fully
utilitised. Average demand was used for the basis of calculating levelised cost, i.e. for pricing purposes.
4.2.3 Other parameters
The analysis was undertaken in pre-tax terms, using pre-tax cash flows combined with a real pre-tax
cost of capital of 10%. This was based on recent regulatory decisions for gas pipelines adjusting for a
higher risk profile in the jet fuel market.
The discounted cash flow analysis used cash flows over a 30 year period, and incorporated a salvage
value at the end of the period. For the purpose of calculating a salvage value, gross capital value was
depreciated each year on a straight line basis, assuming a life of 50 years for the pipeline.
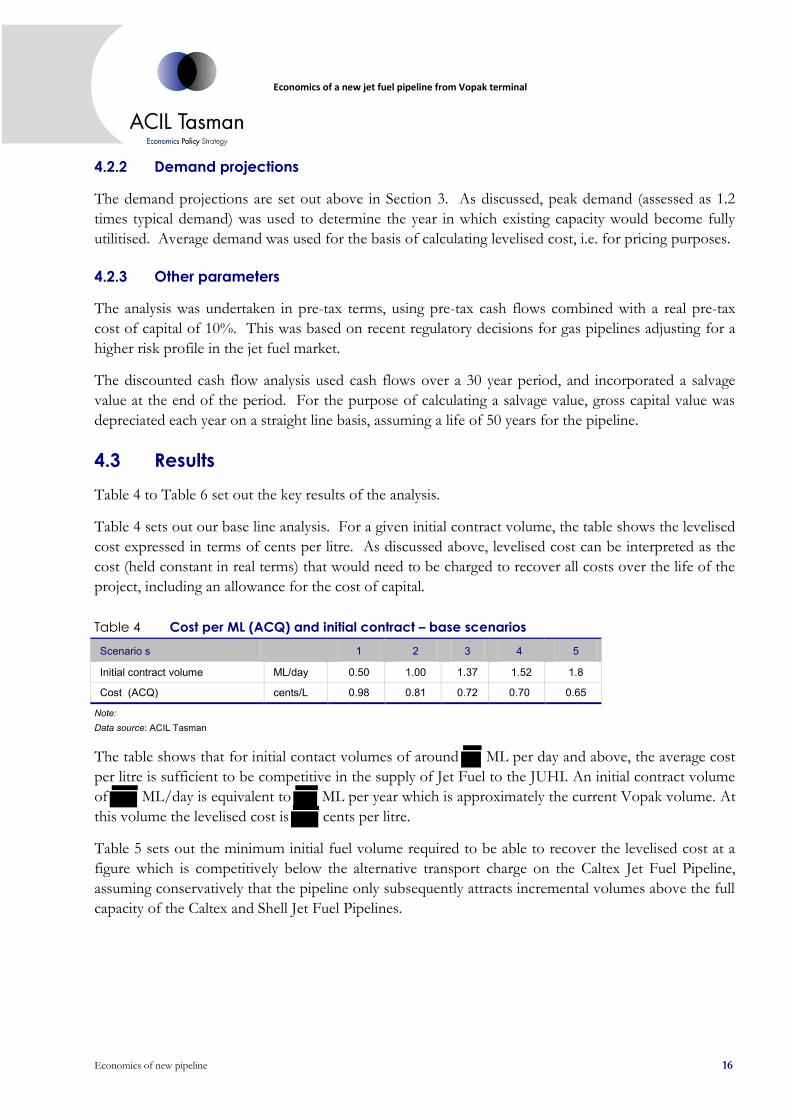
4.3 Results
Table 4 to Table 6 set out the key results of the analysis.
Table 4 sets out our base line analysis. For a given initial contract volume, the table shows the levelised
cost expressed in terms of cents per litre. As discussed above, levelised cost can be interpreted as the
cost (held constant in real terms) that would need to be charged to recover all costs over the life of the
project, including an allowance for the cost of capital.
Table 4 Cost per ML (ACQ) and initial contract – base scenarios
Scenario s
1 2 3 4 5
Initial contract volume ML/day 0.50 1.00 1.37 1.52 1.8
Cost (ACQ) cents/L 0.98 0.81 0.72 0.70 0.65
Note: Data source: ACIL Tasman
The table shows that for initial contact volumes of around ML per day and above, the average cost
per litre is sufficient to be competitive in the supply of Jet Fuel to the JUHI. An initial contract volume
of ML/day is equivalent to ML per year which is approximately the current Vopak volume. At
this volume the levelised cost is cents per litre.
Table 5 sets out the minimum initial fuel volume required to be able to recover the levelised cost at a
figure which is competitively below the alternative transport charge on the Caltex Jet Fuel Pipeline,
assuming conservatively that the pipeline only subsequently attracts incremental volumes above the full
capacity of the Caltex and Shell Jet Fuel Pipelines.
Economics of a new jet fuel pipeline from Vopak terminal
Economics of new pipeline 17
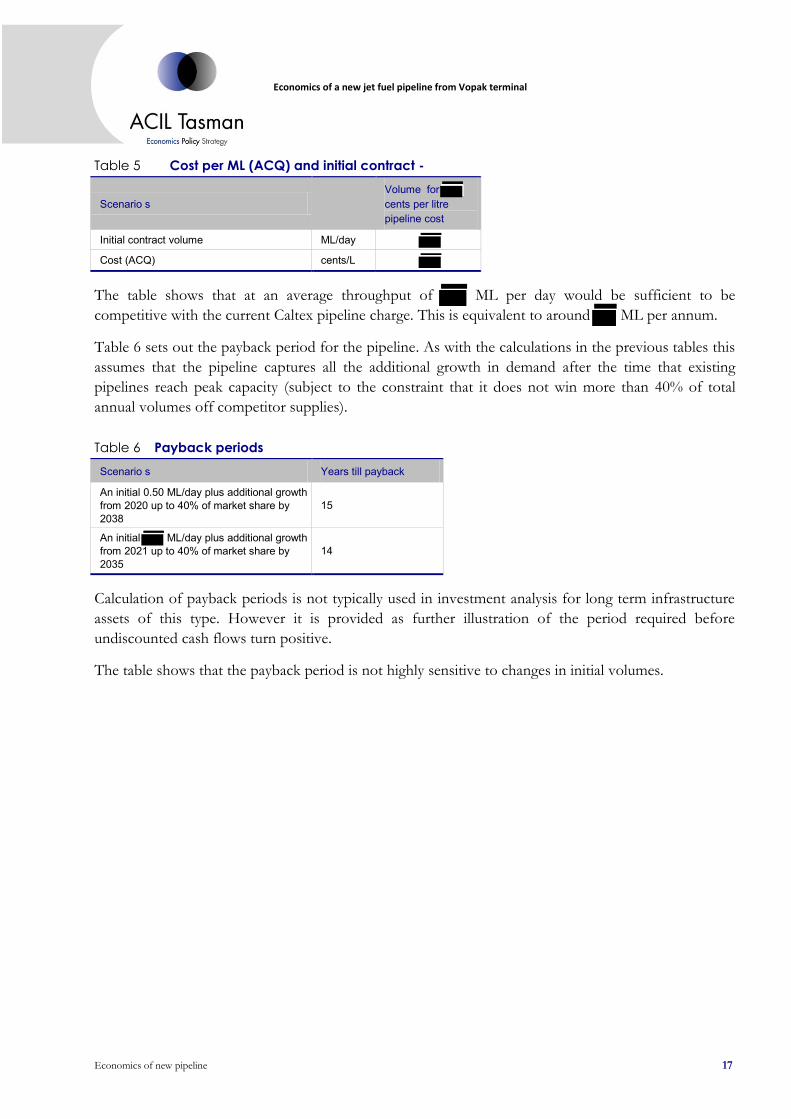
Table 5 Cost per ML (ACQ) and initial contract -
Scenario s
Volume for cents per litre pipeline cost
Initial contract volume ML/day
Cost (ACQ) cents/L
The table shows that at an average throughput of ML per day would be sufficient to be
competitive with the current Caltex pipeline charge. This is equivalent to around ML per annum.
Table 6 sets out the payback period for the pipeline. As with the calculations in the previous tables this
assumes that the pipeline captures all the additional growth in demand after the time that existing
pipelines reach peak capacity (subject to the constraint that it does not win more than 40% of total
annual volumes off competitor supplies).
Table 6 Payback periods
Scenario s Years till payback
An initial 0.50 ML/day plus additional growth from 2020 up to 40% of market share by 2038
15
An initial ML/day plus additional growth from 2021 up to 40% of market share by 2035
14
Calculation of payback periods is not typically used in investment analysis for long term infrastructure
assets of this type. However it is provided as further illustration of the period required before
undiscounted cash flows turn positive.
The table shows that the payback period is not highly sensitive to changes in initial volumes.
Economics of a new jet fuel pipeline from Vopak terminal
Findings 18
5 Findings
A new pipeline commissioned in 2014 would be economic for initial volumes of at least per day
assuming that the new pipeline could capture additional demand growth after the existing pipelines
have reached peak capacity and assuming an ultimate cap of 40 per cent of total average demand.
Given the above results, having regard to our experience in assessing the cost and economic viability of
investments in the fuel supply chain and in other industries, we consider that, on the information
available, it would be economic (ie that is viable) for another person to duplicate the Caltex Jet Fuel
Pipeline from the Vopak Terminal to the JUHI starting from 2014.
We note that this is not a prediction that such economic duplication is necessarily likely, particularly
where any person seeking to transport jet fuel to the JUHI can access the Caltex Jet Fuel Pipeline (or
potentially truck jet fuel). However, in our view, it is not necessary for another customer seeking to
transport jet fuel from the Vopak Terminal to the JUHI to utilise the Caltex Jet Fuel Pipeline in order
to compete for the sale of jet fuel at Sydney Airport as it would be viable to build another pipeline prior
to 2019 and still remain competitive in the supply of jet fuel at Sydney Airport.
We note that this analysis has been based on an assumption that the peak demand for supply to the
JUHI remains at 1.2 times the typical daily demand. We have not explored other avenues to address
peak demand constraints including the impact of on-site storage or options such as trucking.
With these qualifications we believe that we have made all the inquiries appropriate in the time available
and that no relevant matters of significance have, to the best of our knowledge, been withheld.
Economics of a new jet fuel pipeline from Vopak terminal
References A-1
A References Caltex Australia. (21 November 2011). Submission by Caltex Australia to the National Competition Council . Sydney.
Gilbert & Tobin. (29 November 2011). Letter to National Competition Councildated 29 November 2011. Sydney.
National Competition Council. (16 December 2011). Jet Fuel Supply Infrastructure at Sydney Airport. National Competition Council.
Qantas. (21 November 2011). Qantas Group submission to the National Competition Council. Sydney: Qantas.
Sydney Jet Fuel Infrastructure Working Group. (30 April 2010). Infrastructure for the provision of jet fuel to Sydney Airport - final report. Canberra.
Economics of a new jet fuel pipeline from Vopak terminal
Résumé for Alan Smart B-1
B Résumé for Alan Smart
Alan Smart is the Marketing Director and Principal Consultant working in the Canberra office of ACIL
Tasman. He advises economics policy and strategy in the energy, water and resources sectors and also
specialises in geospatial economics.
Alan consults in energy and water markets and has authored a number of prominent reports on energy
and water markets, energy resources and infrastructure in recent years. He has undertaken major
economic impact studies including cost benefit analyses and general equilibrium modelling. He also
lectures in power economics and project evaluation at Curtin Business School.
Alan has extensive experience in the oil and gas sector and in the economics of the oil supply chain and
energy pipelines. He undertook an audit of petroleum import infrastructure in 2008 and has also
undertaken economic analysis of oil import terminals and gas pipelines. He was gas market adviser to
Marubeni Corporation, DBReef and Osaka Gas on gas market and regulation in relation to gas pipeline
assets in Australia and New Zealand.
Alan has extensive experience providing advice to government and industry on gas market
developments in Australia and New Zealand. He recently advised the Department of Resources Energy
and Tourism on gas and oil price forecasts for a working group on alternative fuels.
Prior to entering consulting in 1998, Alan had over seventeen years’ experience as a senior executive in
the Commonwealth Government in the energy, water and agriculture. His appointments were in senior
policy advising roles as well as in business operations including Chief Executive of the Pipeline
Authority and Executive Director of the Timor Gap Joint Authority.
Alan has qualifications in engineering and economics and is a Fellow of the Institution of Engineers
Australia. He is a Member of the Board of the Tasmanian Economic Regulator and Chairman of the
Spatial Industry Business Association.
Relevant assignments
• The economics of offshore exploration programs administered by the Department of Resources
Energy and Tourism (2011-12)
• Market forecasts and regulatory issues in the gas sector for due diligence associated with
acquisitions for Osaka Gas, Marubeni Corporation and RREEF Infrastructure (2011)
• Economics of oil import terminals in the Gladstone region for Gilbert and Tobin Lawyers on
behalf of Caltex Australia Limited (2011)
• Liquid fuels vulnerability assessment for the Department of Resources Energy and Tourism (2011).
• An assessment of the adequacy of petroleum stocks in Australia for the Department of Resources
Energy and Tourism (2011)
• The economics of water use in mining for Rio Tinto (2010-11)
Economics of a new jet fuel pipeline from Vopak terminal
Résumé for Alan Smart B-2
• Market forecasts and regulatory risk for gas pipeline infrastructure in Australia and New Zealand
for Osaka Gas (2010)
• The economics of mining and petroleum projects in NSW for the NSW Minerals Council (2010)
• Two reports on the economics of geoscience and geospatial information for Geoscience Australia –
2010
• The value of Earth observation from space for the CRD for Spatial Information 2010
• The value of geospatial information for local government in England and Wales 2010 – Alan Smart
directed this project
• Electricity generation costs and water for the National Water Commission (2009) – Alan Smart
directed this project
• The economics of pre competitive geoscience for the NSW Geological Survey – Alan Smart
directed this project
• Regulatory arrangements for retail gas in Western Australia for the Office of Energy (2010)
• Review of pricing policies for the Public Sector Mapping Authority (2009)
• An audit of Petroleum Import Infrastructure for the Department of Industry Tourism and
Resources (2008)
• Review of the economics of water use efficiency in the Murray Darling Basin for the Crane Group
(2008)
• The economics of water in electricity generation for the National Water Commission (2006)
• A review of the Liquid Fuels Emergency Act 1984 for the National Oil Supplies Advisory
Committee (2004)