Economics 270c - Econometrics Laboratory, UC …webfac/emiguel/e270c_s09/lecture15.pdfEconomics 270c...
51
1 Economics 270c Graduate Development Economics Professor Ted Miguel Department of Economics University of California, Berkeley
Transcript of Economics 270c - Econometrics Laboratory, UC …webfac/emiguel/e270c_s09/lecture15.pdfEconomics 270c...

1
Economics 270cGraduate Development Economics
Professor Ted MiguelDepartment of Economics
University of California, Berkeley

2
Economics 270cGraduate Development Economics
Lecture 15 – May 5, 2009

3Economics 270c: Lecture 15 333333
Macroeconomic growth empiricsLecture 1: Global patterns of economic growth and development (1/20)Lecture 2: Inequality and growth (1/27)The political economy of developmentLecture 3: History and institutions (2/3)Lecture 4: Corruption (2/10)Lecture 5: Patronage politics (2/17)Lecture 6: Democracy and development (2/24)Lecture 7: War and Economic Development (3/3)Lecture 8: Economic Theories of Conflict (3/10) – Guest lecture by Gerard PadroHuman resourcesLecture 9: Human capital and income growth (3/17)Lecture 10: Increasing human capital (3/31)Lecture 11: Labor markets and migration (4/7)Lecture 12: Health and nutrition (4/14)Lecture 13: The demand for health (4/21)Other topicsLecture 14: Environment and development (4/28)Lecture 15: Resource allocation and firm productivity (5/5)Additional topics for the development economics field exam-- Ethnic and social divisions-- The Economics of HIV/AIDS

4Economics 270c: Lecture 15 444444
• Grading:Four referee reports – 40%
Two problem sets – 20%Graded problem set 2 passed back soon
Research proposal – 30%Due today (Tuesday May 5)
Class participation – 10%
After lecture today – pizza and beer/soda at LaValls after class (4 pm)

5Economics 270c: Lecture 15 55

6
(1) Credit, firms and economic development(2) De Mel, McKenzie, Woodruff (2008) on the returns to
capital in Sri Lanka micro-enterprises(3) Hsieh and Klenow (2008) on the misallocation of capital
/ subsidies in China and India
Lecture 15 outline
7
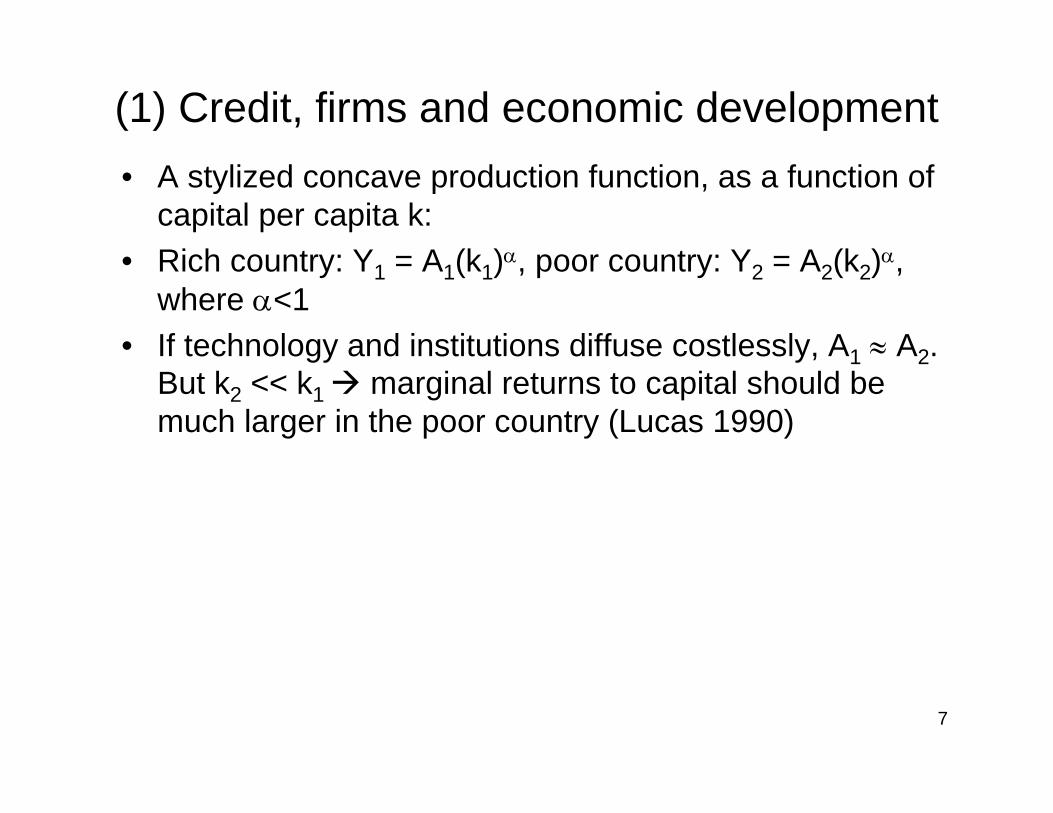
(1) Credit, firms and economic development• A stylized concave production function, as a function of
capital per capita k:• Rich country: Y1 = A1(k1)α, poor country: Y2 = A2(k2)α,
where α<1• If technology and institutions diffuse costlessly, A1 ≈ A2.
But k2 << k1 marginal returns to capital should be much larger in the poor country (Lucas 1990)

8
(1) Credit, firms and economic development• A stylized concave production function, as a function of
capital per capita k:• Rich country: Y1 = A1(k1)α, poor country: Y2 = A2(k2)α,
where α<1• If technology and institutions diffuse costlessly, A1 ≈ A2.
But k2 << k1 marginal returns to capital should be much larger in the poor country (Lucas 1990)
• We know from earlier in the course that A1 ≠ A2. So the relative return to capital in poor countries is ambiguous-- Suggestive evidence: real interest rates are high in poor countries (but is just the product of financial regulation?); micro-finance institution claims of large returns for small enterprises, especially to women

9
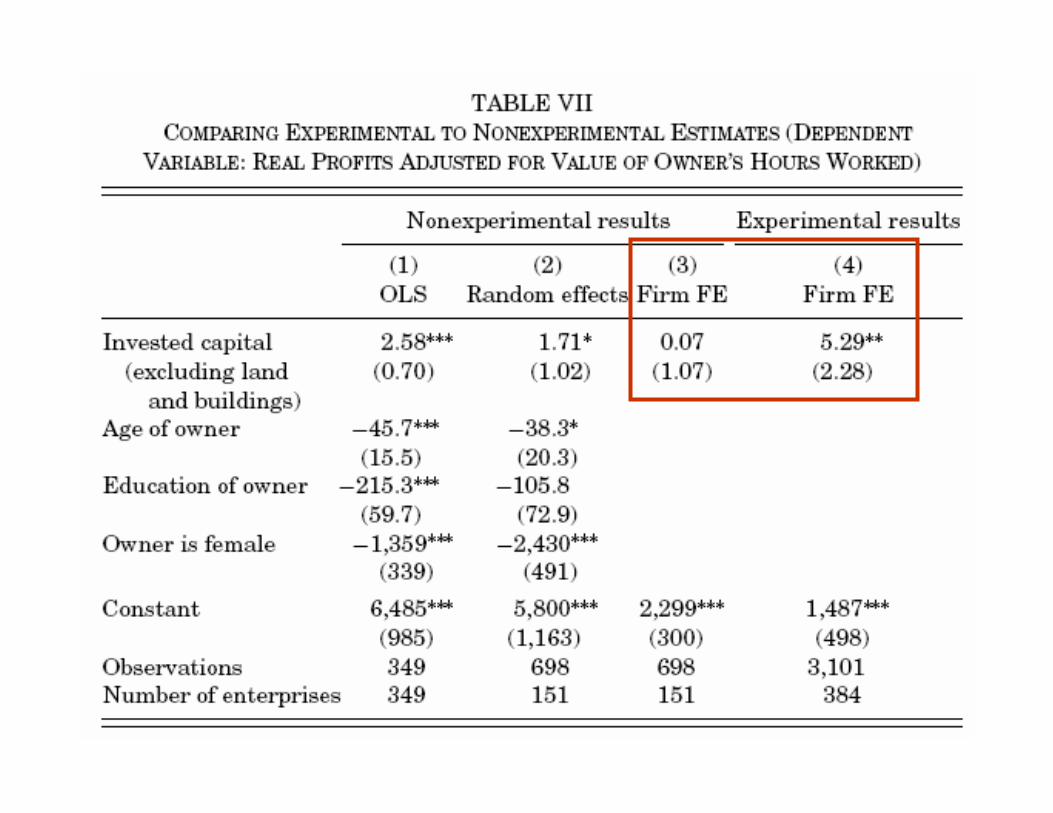
(2) De Mel, McKenzie, and Woodruff (2008)• What are the returns to capital for small firms in less
developed countries?-- Empirical difficulties include endogenous investment: if higher productivity owners (θi) gain access to more capital, the regression of profits on capital will be biased-- Highlights the need for exogenous variation in capital, as well as firm fixed effects (to capture unobserved differences across firms)
• Existing non-experimental studies have high estimated returns: Udry and Anagol (2006) at 50-250% per year for Ghanaian farmers, Banerjee and Duflo at 74-100% for Indian firms, McKenzie and Woodruff (2008) at 40-360% per year for small Mexican firms. But how reliable?
10
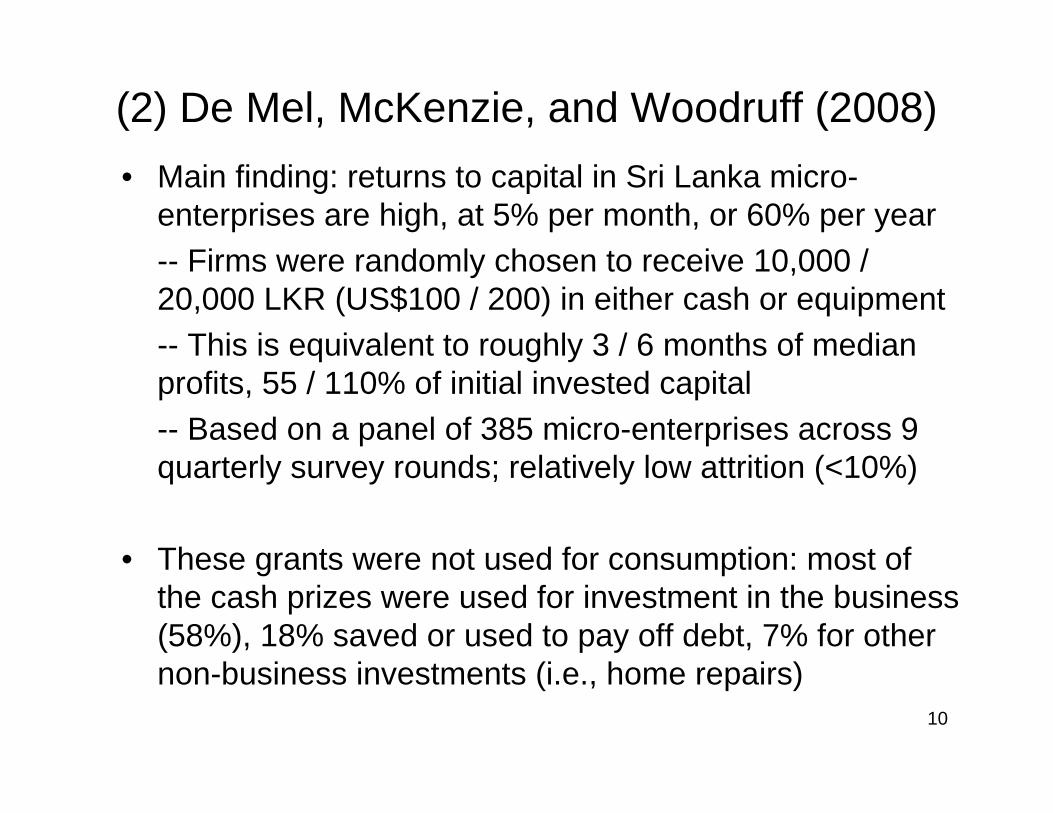
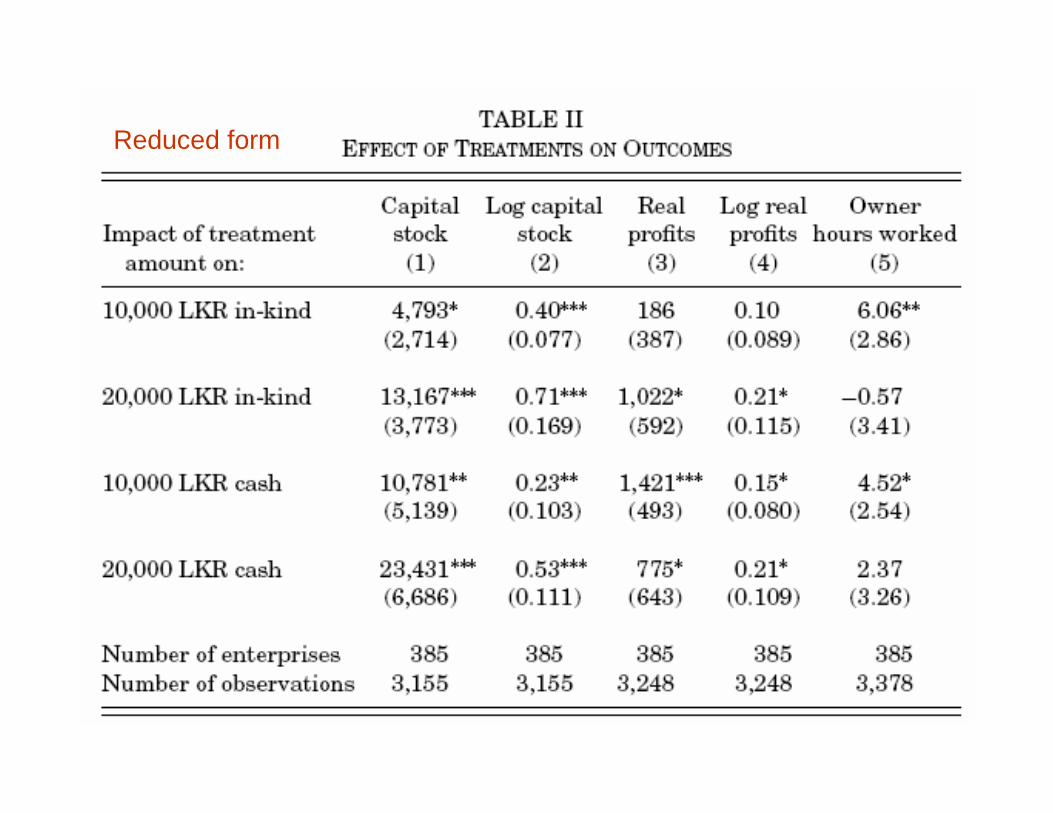
(2) De Mel, McKenzie, and Woodruff (2008)• Main finding: returns to capital in Sri Lanka micro-
enterprises are high, at 5% per month, or 60% per year-- Firms were randomly chosen to receive 10,000 / 20,000 LKR (US$100 / 200) in either cash or equipment-- This is equivalent to roughly 3 / 6 months of median profits, 55 / 110% of initial invested capital-- Based on a panel of 385 micro-enterprises across 9 quarterly survey rounds; relatively low attrition (<10%)
• These grants were not used for consumption: most of the cash prizes were used for investment in the business (58%), 18% saved or used to pay off debt, 7% for other non-business investments (i.e., home repairs)
11

12

13
(2) De Mel, McKenzie, and Woodruff (2008)• What drives variation in the returns to capital?• The firm production function: Yi = f(Ki,θi), where Ki is
capital and θi is a characteristic of firm i that makes capital more productive (e.g., owner ability),
02
>∂∂
∂
iiKfθ

14
(2) De Mel, McKenzie, and Woodruff (2008)• What drives variation in the returns to capital?• The firm production function: Yi = f(Ki,θi), where Ki is
capital and θi is a characteristic of firm i that makes capital more productive (e.g., owner ability),
• Benchmark case: perfect credit and insurance markets: f′(Ki,θi) = r for all firms, where r is the market interest rate-- The marginal return to capital is the same for all firms, but higher productivity firms are larger in equilibrium:θi > θj K*
i > K*j
-- Imperfect credit/insurance markets could lead marginal products to exceed the market interest rate (below)
02
>∂∂
∂
iiKfθ

15
Capital stock, Ki
Output, Yif(K,θ2), θ2 > θ1
f(K,θ1)f′=r
K1* K2
*
16
17
Reduced form

18
Reduced form

19
Structural / IV

20
(2) De Mel, McKenzie, and Woodruff (2008)• Perfect insurance market, missing credit market case• Two issues:
(1) Access to capital differs across groups of firms. E.g., female and male owned firms face different interest rates. If females have less access, rfemale > rmale and thus (conditional on θ) f′(Kfemale,θ) > f′(Kmale,θ) Kfemale < Kmale
(2) Ability θ is (only partially) unobserved by lenders. At a given capital stock K, θ2 > θ1 f′(K,θ2) > f′(K,θ1)
• Implications of missing credit markets: firms with (1) worse access to credit or (2) better unobserved ability have higher marginal returns to capital

21
(2) De Mel, McKenzie, and Woodruff (2008)• Perfect credit market, missing insurance market case• Now let production be risky: Yi = εif(Ki,θi), where the
productivity or demand shock εi ∈ (0,+∞), E(εi)=1-- Imagine risk averse micro-enterprise owners producing for household consumption
• Risk averse households will choose to set the capital stock such that f′(Ki,θi) > r, so Ki < K*
• Implications of missing insurance markets: firms with (1) more risk averse owners or (2) more variable productivity shocks ε have higher marginal returns to capital

22

23

24

25
26
27
(2) De Mel, McKenzie, and Woodruff (2008)• What are the returns to capital for small firms in less
developed countries?-- They appear to be very high! 60% per year-- Much higher for male-run than female-run firms. Is this due to the prior expansion of micro-credit for women? Or due to gender differences in θ in this population?-- External validity: the authors have experimental evidence from Mexico of high returns to capital there
28
(2) De Mel, McKenzie, and Woodruff (2008)• What are the returns to capital for small firms in less
developed countries?-- They appear to be very high! 60% per year-- Much higher for male-run than female-run firms. Is this due to the prior expansion of micro-credit for women? Or due to gender differences in θ in this population?-- External validity: the authors have experimental evidence from Mexico of high returns to capital there
• This raises new puzzles: Why don’t more firms self-finance investment from retained earnings? Why can’t financial institutions get capital in the hands of these enterprises and share the surplus? Why aren’t all of us investing in Sri Lankan micro-enterprises?

29
30
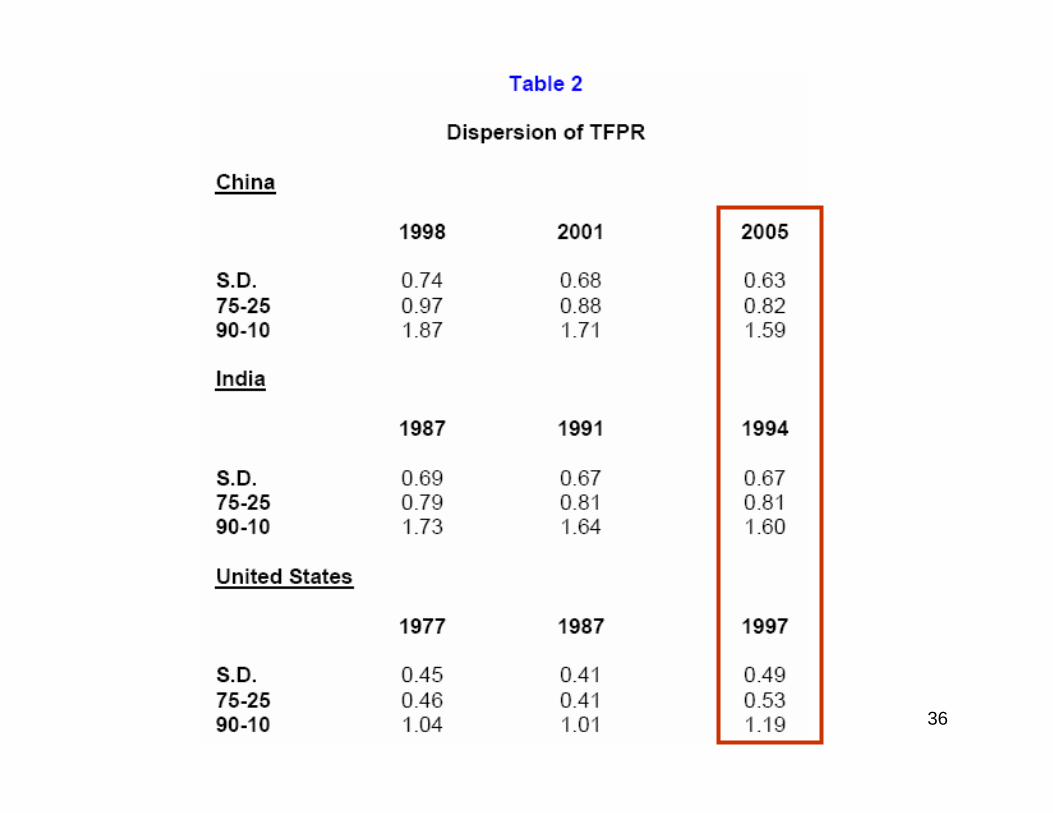
(3) Hsieh and Klenow (2008)• Another take on the question of whether returns to
capital are high for firms in less developed countries• The answer is yes – and no. In China and India, there is
tremendous dispersion in firm marginal revenue products (revenue products account for prices and production)-- If credit, insurance and other markets were well-functioning, MRPs would be equalized across firms
• This paper models how firm-specific distortions in the allocation of capital (τK) and subsidies/taxes (τY) leads to dispersion in MRPs, and quantifies how this misallocation of resources affects aggregate TFP-- Compare China and India to U.S. firms

31
(3) Hsieh and Klenow (2008)• Model of monopolistic competition with heterogeneous
firms. Production for firm i in sector s: Ysi = AsiKsiαLsi
1-α, where the firm specific productivity parameter is Asi
-- With Cobb-Douglas marginal products are proportional to average products

32
(3) Hsieh and Klenow (2008)• Model of monopolistic competition with heterogeneous
firms. Production for firm i in sector s: Ysi = AsiKsiαLsi
1-α, where the firm specific productivity parameter is Asi
-- With Cobb-Douglas marginal products are proportional to average products
• Industry s output is the CES aggregate of Msdifferentiated products, where σ/(σ-1) is the mark-up (and σ = 3 is a conservative assumption)
• Firm profits: πsi = (1–τYsi)PsiYsi – wLsi – (1+τKsi)RKsi
1
1
1 −
=
−
⎟⎟⎠
⎞⎜⎜⎝
⎛= ∑
σσ
σσ
sM
i sis YY
33
(3) Hsieh and Klenow (2008)• Marginal revenue product is proportion to the revenue to
capital ratio, equivalent to: MRPKsi ∝ R(1+τKsi)/(1–τYsi)
• Marginal revenue product of capital is increasing in the distortions faced in the credit market (τKsi, essentially higher interest rates) and increasing in the tax rate τYsi-- Same intuition as Sri Lankan firms: marginal revenue products are high for constrained or disadvantaged firms
34
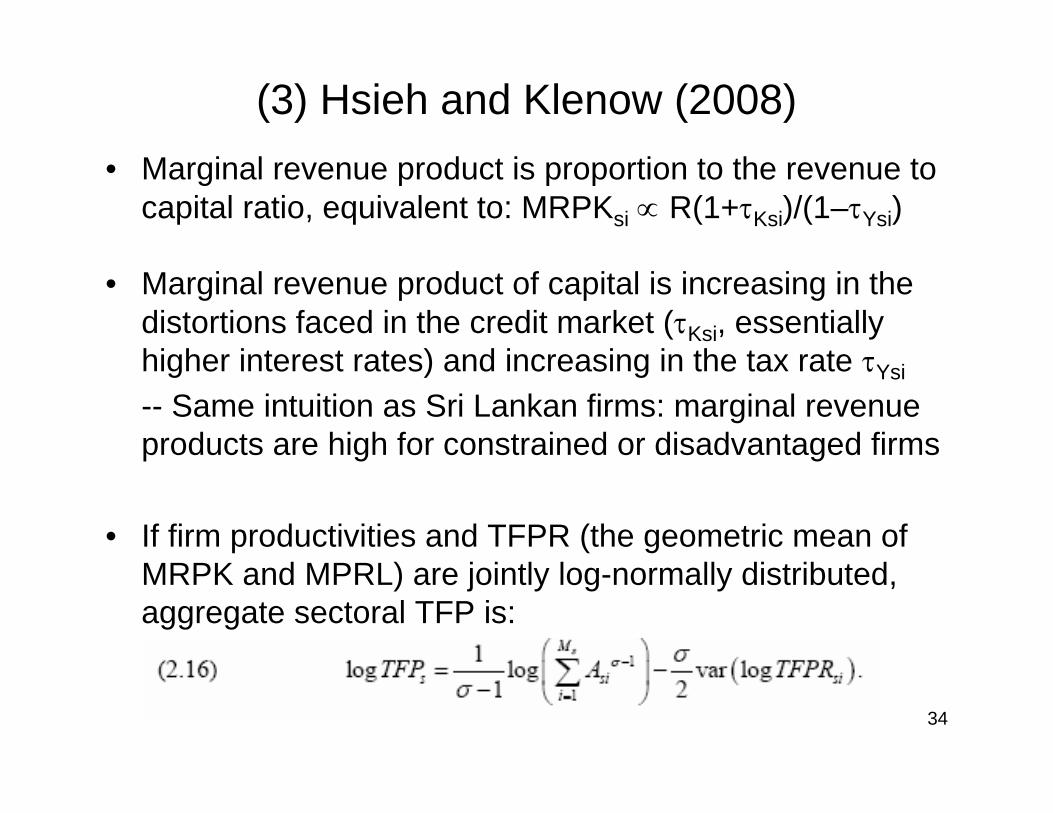
(3) Hsieh and Klenow (2008)• Marginal revenue product is proportion to the revenue to
capital ratio, equivalent to: MRPKsi ∝ R(1+τKsi)/(1–τYsi)
• Marginal revenue product of capital is increasing in the distortions faced in the credit market (τKsi, essentially higher interest rates) and increasing in the tax rate τYsi
-- Same intuition as Sri Lankan firms: marginal revenue products are high for constrained or disadvantaged firms
• If firm productivities and TFPR (the geometric mean of MRPK and MPRL) are jointly log-normally distributed, aggregate sectoral TFP is:
35
(3) Hsieh and Klenow (2008)• Massive data efforts for all three countries: firm census
data, months/years of work processing the data-- India: 40,000 plants per year, 1987-88 to 1994-95-- China: 100,000 to 200,000 plants per year, 1998-2005-- US: 160,000 plants, 1977, 1982, 1987, 1992, 1997
• Consider the same narrowly-defined 4-digit industries across all three countries (sector capital shares from US data, as the most “undistorted” benchmark case)-- Some TFPR dispersion within sectors is inevitable due to measurements error or adjustment costs. Again the U.S. serves as a benchmark
36

37

38
39

40
41

42

43

44

45
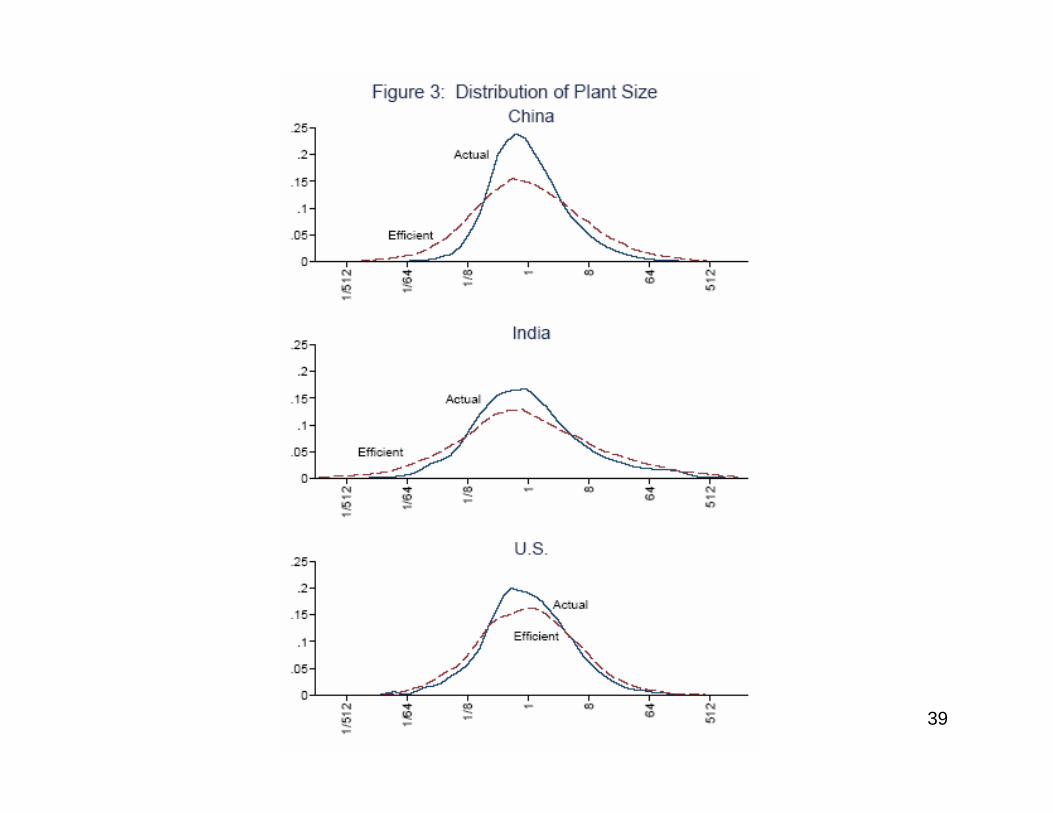
(3) Hsieh and Klenow (2008)• The misallocation of capital and subsidies across firms in
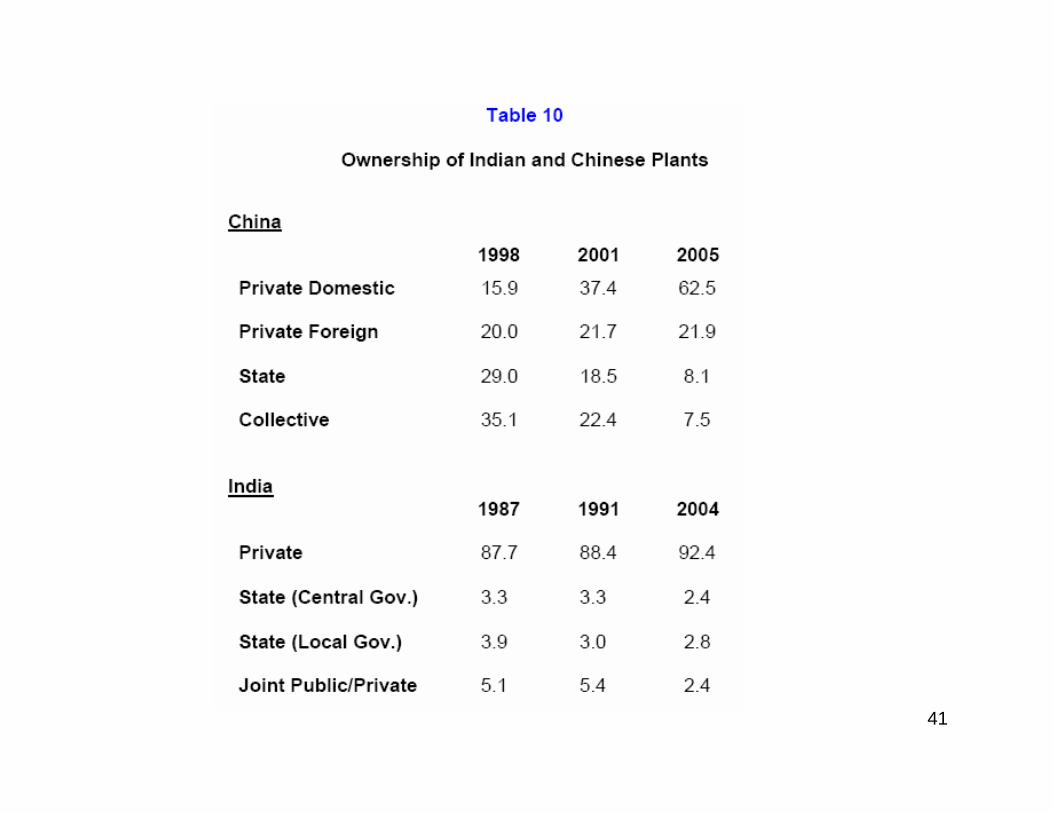
China and India appears to lead large drops in aggregate manufacturing TFP in those economies, relative to the U.S. benchmark-- Chinese state firms appear to benefit from distortions, but market reforms, especially since the mid-1990s, led to rapid improvement in allocative efficiency-- As of 1994-1995, large Indian firms seem particularly constrained, i.e., have high marginal revenue products. Data limitations mean we cannot test whether Indian manufacturing has undergone similar changes.
• One view of development: the emergence of institutions to match capital to high return activities, free of political interference, ethnic/regional favoritism, or cronyism

46Economics 270c: Lecture 15 46
Whiteboard #1

47Economics 270c: Lecture 15 47
Whiteboard #2

48Economics 270c: Lecture 15 48
Whiteboard #3

49Economics 270c: Lecture 15 49
Whiteboard #4

50Economics 270c: Lecture 15 50
Whiteboard #5

51Economics 270c: Lecture 11 51