Economics 141 Professor Kletzer Spring 2017 Homework 4 ...
11
1. Use production function and MPK diagrams to examine Turkey and the EU. Assume that Turkey and the EU have different production functions q f(k) where q is out- put per worker and k is capital per worker. Let q Ak 1/3 . Assume that the produc- tivity level A in Turkey is lower than A in the EU. a. Draw a production function diagram (with output per worker y as a function of capital per worker k) and MPK diagram (MPK versus k) for the EU. (Hint: Be sure to draw the two diagrams with the production function directly above the MPK diagram so that the level of capital per worker k is consistent on your two diagrams.) Answer: See the following diagram. b. For now, assume capital cannot flow freely in and out of Turkey. On the same di- agrams, plot Turkish production function and MPK curves, assuming that the productivity level A in Turkey is half the EU level and that Turkish MPK exceeds EU MPK. Label the EU position in each chart EU and the label the Turkish po- sition T1. Answer: See the following diagram. c. Assume capital can now flow freely between Turkey and the EU and the rest of the world and that EU is already at the point where MPK r*. Label r* on the vertical axis of the MPK diagram. Assume no risk premium. What will Turkey’s capital per worker level k be? Label this outcome point T2 in each diagram. Will Turkey converge to the EU level of q? Explain. Answer: See the following diagram. Turkey’s capital per worker will rise once capital flows freely between the two regions but it will still remain below the capital per worker in the EU.This is because, initially,Turkey’s high MPK will at- tract capital from abroad, increasing output per worker in Turkey. But a lower productivity level in Turkey requires a lower capital per worker in Turkey for the marginal productivity in the two regions to be equal. In equilibrium, Turkey's capital per worker and output per worker will be lower than that in the EU. Economics 141 UCSC Professor Kletzer Spring 2017 Homework 4 Answer Key q q 2 q EU k 2 k T k EU q T A T1 T2 k k T and q T rise, but q T q EU . T T MPK T MPK k 2 k T k EU r* MPK R A T2 T1 k Capital flows into Turkey from EU, k T rises, and q T rises, but q T q EU . T
Transcript of Economics 141 Professor Kletzer Spring 2017 Homework 4 ...

1. Use production function and MPK diagrams to examine Turkey and the EU. Assumethat Turkey and the EU have different production functions q � f(k) where q is out-put per worker and k is capital per worker. Let q � Ak1/3. Assume that the produc-tivity level A in Turkey is lower than A in the EU.
a. Draw a production function diagram (with output per worker y as a function ofcapital per worker k) and MPK diagram (MPK versus k) for the EU. (Hint: Besure to draw the two diagrams with the production function directly above theMPK diagram so that the level of capital per worker k is consistent on your twodiagrams.)
Answer: See the following diagram.
b. For now, assume capital cannot flow freely in and out of Turkey. On the same di-agrams, plot Turkish production function and MPK curves, assuming that theproductivity level A in Turkey is half the EU level and that Turkish MPK exceedsEU MPK. Label the EU position in each chart EU and the label the Turkish po-sition T1.
Answer: See the following diagram.
c. Assume capital can now flow freely between Turkey and the EU and the rest ofthe world and that EU is already at the point where MPK � r*. Label r* on thevertical axis of the MPK diagram. Assume no risk premium. What will Turkey’scapital per worker level k be? Label this outcome point T2 in each diagram. WillTurkey converge to the EU level of q? Explain.
Answer: See the following diagram. Turkey’s capital per worker will rise oncecapital flows freely between the two regions but it will still remain below thecapital per worker in the EU. This is because, initially, Turkey’s high MPK will at-tract capital from abroad, increasing output per worker in Turkey. But a lowerproductivity level in Turkey requires a lower capital per worker in Turkey for themarginal productivity in the two regions to be equal. In equilibrium, Turkey'scapital per worker and output per worker will be lower than that in the EU.
Economics141UCSC
ProfessorKletzerSpring2017
Homework4 Answer Key
q
q2
qEU
k2kT kEU
qT
A
T1
T2
k
kT and qT rise, but qT � qEU.
T
T
MPKT
MPK
k2kT kEU
r* � MPKRA
T2
T1
k
Capital flows into Turkeyfrom EU, kT rises, and qTrises, but qT � qEU.
T

2. Use the IS-LM-FX graphs and words to answer each question. The Mexican pesofloats against the US dollar.
(a) In 2007-08, the US suffered a rapid fall in aggregate demand. Assuming no changes in policy in either the US or Mexico, how does this shock affect the exchange rate of the peso against the dollar and Mexico’s output, consumption, investment and trade balance?
Answer: The US contraction reduces US output and interest rate given the supply of money. The fall in the US interest rate causes the dollar to depreciate given the interest rate for Mexico. The peso appreciates against the dollar. This is shown in the IS-LM-FX diagram:
i DR, FR
US IS-LM Y FX E
The appreciation of the peso reduces the trade balance for Mexico falls (because the peso appreciates in real terms with sticky prices). As shown above, US output falls in recession. The fall in US GDP reduces demand for Mexican exports and reduces the trade balance for Mexico. Both the exchange rate effect (expenditure switching) and the foreign demand effect reduce the trade balance for Mexico:
𝑇𝐵 = 𝑇𝐵!!/$!!"!!!"#$%
,𝑌 − 𝑇,𝑌∗ − 𝑇∗ .
As shown in the IS-LM diagram for Mexico below, the IS curve for Mexico shifts inward as aggregate demand for Mexican output falls with the trade balance. Mexico’s GDP and interest rate fall.
i
LM
IS
DR
FR
LM
Mexico IS-LM Y
IS

The fall in Mexico’s interest rate partially offsets the depreciation of the dollar against the peso as shown by the shift of the FR line in the FX diagram. Consumption in Mexico falls because GDP falls, and the fall in interest rates raises investment for given GDP. The trade balance (TB) falls.
(b) In late 2015, the Fed raised US interest rates. Imagine this was a significant increase. How should this change in monetary policy affect current and expected exchange rates and Mexico’s output, consumption, investment and trade balance?
Answer: The rise in US interest rates shifts the LM curve up for the US and the DR line up in the FX diagram for the exchange rate of the dollar against the peso. The dollar appreciates against the peso, and the peso depreciates against the dollar. US GDP falls as the US interest rate rises.
i DR,FR
US IS-LM Y FX E
E is the exchange rate of dollars for pesos.
For Mexico, the depreciation of the peso against the dollar tends to increase Mexico’s trade balance. The fall in US output tends to lower Mexico’s trade balance. If the expenditure switching is more important than the income effect on export demand, then Mexico’s trade balance improves; if it is less important, then Mexico’s trade balance decreases. An improvement in the trade balance for Mexico raises Mexican GDP and raises the interest rate a bit for Mexico. The FX diagram above shows the upward shift in the FX curve.
IS
LM
DR
FR
i
MexicoIS-LM Y
LM
IS
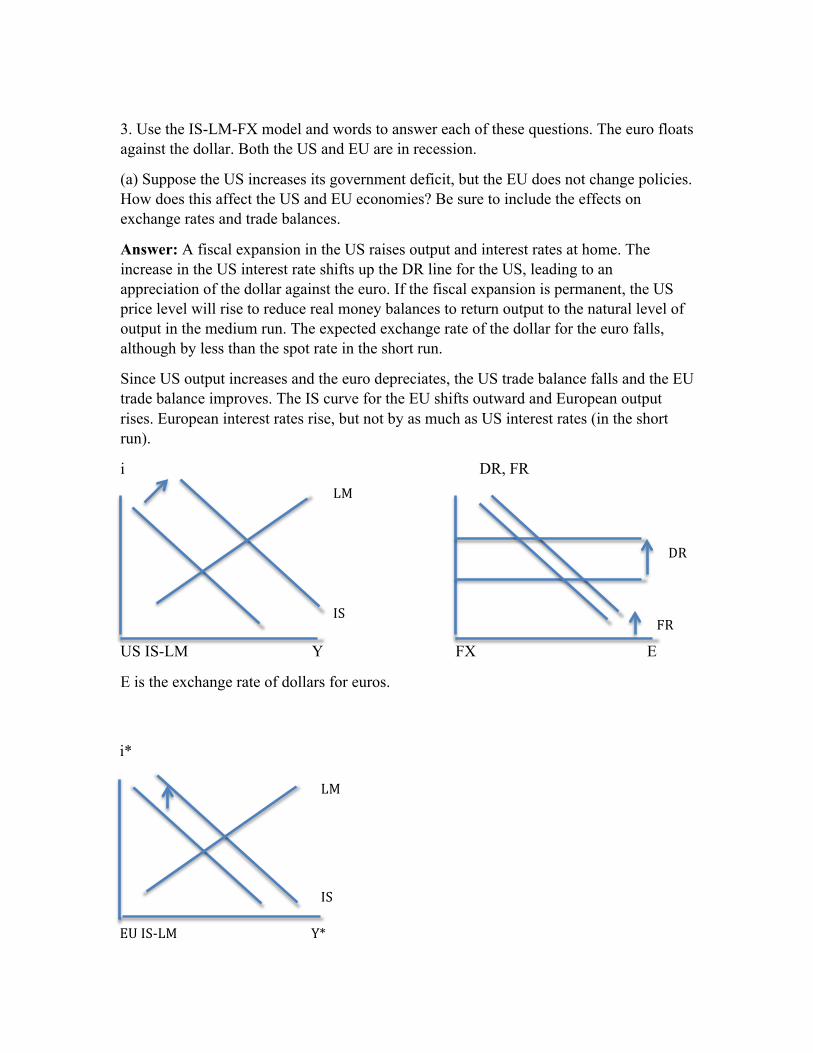
3. Use the IS-LM-FX model and words to answer each of these questions. The euro floatsagainst the dollar. Both the US and EU are in recession.
(a) Suppose the US increases its government deficit, but the EU does not change policies. How does this affect the US and EU economies? Be sure to include the effects on exchange rates and trade balances.
Answer: A fiscal expansion in the US raises output and interest rates at home. The increase in the US interest rate shifts up the DR line for the US, leading to an appreciation of the dollar against the euro. If the fiscal expansion is permanent, the US price level will rise to reduce real money balances to return output to the natural level of output in the medium run. The expected exchange rate of the dollar for the euro falls, although by less than the spot rate in the short run.
Since US output increases and the euro depreciates, the US trade balance falls and the EU trade balance improves. The IS curve for the EU shifts outward and European output rises. European interest rates rise, but not by as much as US interest rates (in the short run).
i DR, FR
US IS-LM Y FX E
E is the exchange rate of dollars for euros.
IS
LM
DR
FR
i*
EUIS-LM Y*
LM
IS

(b) Who benefits from the US fiscal expansion in the EU? Do export and import competing industries? Do consumers? How about in the US? Explain your answers.
Answer: In the short run, European exporters and importing competing producers realize higher demand for their outputs due to the depreciation of the euro and rise in foreign (US) demand for imports. The EU interest rate rises, so producers of investment goods experience a net fall in demand if investment demand only depends on interest rates. However, if investment also depends on output, then the effect on capital goods producers is ambiguous. EU consumers benefit as consumption rises with output, although their expenditures switch away from foreign goods towards home goods.
In the US, consumers benefit from higher income and switch some expenditure away from home goods toward imports. Exporters and import competing producers face a decrease in demand.
Exporter and import competing producer revenues rise in Europe and fall in the US under normal conditions (that is, when the Marshall-Lerner condition holds as described in the appendix to Chapter 7).
(c) Suppose EU policymakers care about export and import competing industries. How should EU fiscal authorities respond to the US fiscal expansion? What happens to the exchange rate and to EU and US trade balances?
Answer: EU policy makers will want the euro to depreciate. If the fiscal expansion in the US raised EU output above the natural level, then the EU will want to reduce the government budget deficit (a fiscal contraction in Europe). This would bring EU output back to the natural level of output and reduce European interest rates. If EU output is below the natural level, then the EU will want the ECB to loosen monetary policy lowering European interest rates and depreciating the euro. Depreciating the euro further against the dollar raises demand for EU exports and import competing goods further worsening the US trade balance.
(d) Explain why a cooperative policy in which both the EU and US undertake fiscal expansions can make everyone better off in recession. Explain why unilateral policy (only the US expands) can help some and hurt others, hence be politically costly.
Answer: Suppose both the EU and US are in recession. Unilateral fiscal expansion in the US raises US and EU aggregate demand. The EU benefits from a positive externality of the US expansion through the trade balance. The rise is demand for EU exports comes from both the rise in US disposable income and expenditure switching towards EU goods as the dollar appreciates against the euro. Therefore, the US only realizes part of the total benefit of a US fiscal expansion. This should lead the US to underutilize fiscal policy in recovery from the recession.
Cooperative fiscal policy in a recession impacting both the US and EU would require the US and EU to take fiscal expansions at the same time. Each would contribute to a fiscal expansion that benefits both. From the US perspective, unilateral fiscal expansion hurts traded goods industries. In a noncooperative policy, the EU beggars its neighbor. Under a cooperative policy, both regions realize an expansion but with less expenditure switching. When the EU and US adopt cooperative fiscal expansions, the exchange rate does not change as much (with symmetric economies and recessions, it may not change at all).
4. Assume that initially the IS curve is given by
IS1: Y � 12 � 1.5T � 30i � 2Gand that the price level P is 1, and the LM curve is given by
LM1: M � Y(1 � i )The home central bank uses the interest rate as its policy instrument. Initially, thehome interest rate equals the foreign interest rate of 10% or 0.1. Taxes and govern-ment spending both equal 2. Call this case 1.a. According to the IS1 curve, what is the level of output Y? Assume this is the de-
sired full employment level of output.Answer: IS: Y � 12 � 1.5(2) � 30(0.1) � 2(2) � 10
b. According to the LM1 curve, at this level of output, what is the level of the homemoney supply?Answer: LM: M � 10(1 � 0.1) � 9
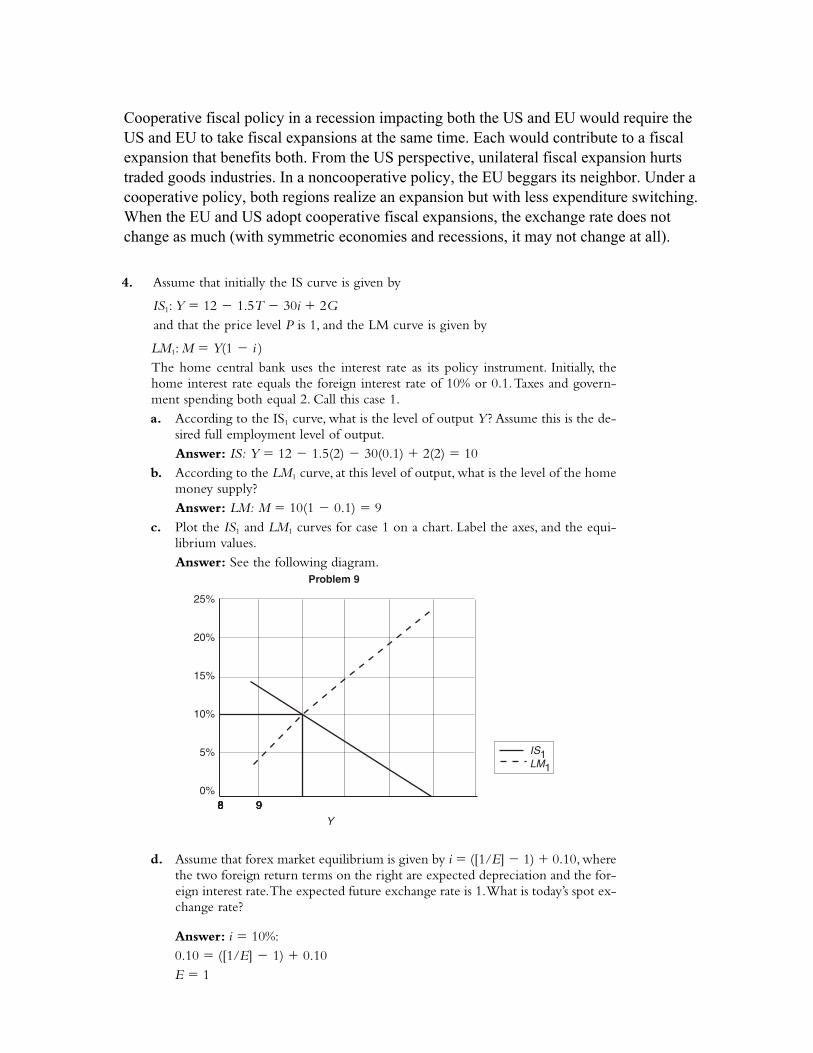
c. Plot the IS1 and LM1 curves for case 1 on a chart. Label the axes, and the equi-librium values.Answer: See the following diagram.
25%
20%
15%
10%
5%
0% 999998888888
Y
Problem 9
IS1LM1
d. Assume that forex market equilibrium is given by i � ([1/E] � 1) � 0.10, wherethe two foreign return terms on the right are expected depreciation and the for-eign interest rate. The expected future exchange rate is 1. What is today’s spot ex-change rate?
Answer: i � 10%:0.10 � ([1/E] � 1) � 0.10E � 1

e. There is now a foreign demand shock, such that the IS curve shifts left by 1.5units at all levels of the interest rate, and the new IS curve is given byIS2: Y � 10.5 � 1.5T � 30i � 2GThe government asks the central bank to stabilize the economy at full employ-ment. To stabilize and return output back to the desired level, according to thisnew IS curve, by how much must the interest rate be lowered from its initial levelof 0.1? (Assume taxes and government spending remain at 2.) Call this case 2.Answer: Plug the desired value of output (Y � 10) into the new IS curve tofind the implied interest rate, i2:(10) � 10.5 � 1.5(2) � 30i � 2(2)10 � 11.5� 30i30i � 1.5i � 0.05 � 5%
f. At the new lower interest rate and at full employment, on the new LM curve(LM2), what is the new level of the money supply?Answer: Plug the output and interest rate from (e) into the LM curve to find M:M � 10(1 � 0.05) � 9.5The money supply must increase from 9 to 9.5 to achieve the desired decreasein the interest rate from 10% to 5%.
g. According to the forex market equilibrium, what is the new level of the spot ex-change rate? How large is the depreciation of the home currency?Answer: Plug the new interest rate into the UIP condition:0.05 � (1/E � 1) � 0.10�0.05 � 1/E � 11/E � 0.95E � 1.053The nominal exchange rate will increase from 1 to 1.053 when the money sup-ply increases. The currency depreciates by 5.3% (� [1.053 � 1]/1).
h. Plot the new IS2 and LM2 curves for case 2 on a chart. Label the axes, and theequilibrium values.Answer: See the diagram below.
25%
20%
15%
10%
5%
0%8888888 99999
Y
ISLMNew IS–IS2New LM–LM2

i. Return to (e). Now assume that the central bank refuses to change the interestrate from 10%. In this case, what is the new level of output? What is the moneysupply? And if the government decides to use fiscal policy instead to stabilizeoutput, then according to the new IS curve, by how much must governmentspending be increased to achieve this goal? Call this case 3.
Answer: If the central bank wishes to keep i � i1 � 10%, then we can find theimplied level of output from the new IS curve:
Y � 10.5 � 1.5(2) � 30(0.10) � 2(2) � 8.5
From the LM curve we can find the money supply in this case:
M � 8.5(1 � 0.10) � 7.65
The money supply must decrease from 9 to 7.65 to keep the interest rate un-changed.
If the government wants to stabilize output by adjusting government spending(at a fixed interest rate of 10%), we can use the new IS curve to find the impliedvalue of G:
10 � 10.5 � 1.5(2) � 30(0.10) � 2G
G � 2.75
Therefore, G must increase from 2 to 2.75 to offset the effects of the foreign de-mand shock.
j. Plot the new IS3 and LM3 curves for case 3 on a chart. Label the axes and theequilibrium values.
Answer: See the figure below. IS ' and LM ' indicate the IS and LM curves whenIS curve has the same shock as in part (e) and the central bank still keeps the in-terest rate at 10%. This is the case discussed in part (i). Notice that once the gov-ernment increases spending, the central bank will increase the money supplyfrom 7.65 to 9 as the interest rate rises with increase in government spending. IS3
and LM3 are the same as IS1 and LM1 for part (c).i
IS3IS
LM3
LM �
A CB
i1 10%
8.5 10 Y
�

5. Many countries experiencing high and rising inflation, or even hyperinflation, willadopt a fixed exchange rate regime. Discuss the potential costs and benefits of a fixedexchange rate regime in this case. Comment on fiscal discipline, seigniorage, and ex-pected future inflation.
Answer: Hyperinflations are the result of excessive printing of money, usually be-cause fiscal policy makers lack the resources or will to raise taxes or issue debt with-out monetizing the deficit. For these countries, a fixed exchange rate regime may bedesirable to serve as a nominal anchor in the absence of monetary policy indepen-dence/discipline. The benefits of fixing may be greater in these countries as they canbenefit from a reduced inflation and fiscal discipline. In general, there is apolitical/economic cost of abandoning a fixed exchange rate regime and thereforefixing exchange rates also commands fiscal discipline. If the country’s decision toadopt a fixed exchange rate is viewed as credible by the rest of the world, it may re-duce inflation expectations and interest rates, and make the transition to lower infla-tion somewhat less painful.
6. In the late 1970s, several countries in Latin America, notably Mexico, Brazil, and Ar-gentina, had accumulated large external debt burdens. A significant share of this debtwas denominated in U.S. dollars. The United States pursued contractionary monetarypolicy from 1979 to 1982, raising dollar interest rates. How would this affect the valueof the Latin American currencies relative to the U.S. dollar? How would this affecttheir external debt in local currency terms? If these countries had wanted to preventa change in their external debt, what would have been the appropriate policy re-sponse, and what would have been the drawbacks?
Answer: Contractionary monetary policy in the United States would lead to an in-crease in the U.S. interest rates and an appreciation of the dollar relative to other cur-rencies. The value of dollar-denominated liabilities (in local currency terms) will in-crease, and therefore reduce external wealth in Latin America (assuming a smallerportion of external assets are dollar-denominated). The rise of U.S. interest rateswould also increase the size of interest payments for Latin American countries. To pre-vent the decrease in external wealth, countries would have had to follow the UnitedStates and reduce their money supplies to boost domestic interest rates and preventthe depreciation in their local currencies against the dollar. The drawback of this re-sponse is that it would require a contraction in output, pushing output below its de-sired level.
7.. he effects of the global financial crisis on Iceland and Ireland were similar, but thepolicy responses were very different. To illustrate this, consider two countries that have pegged their currencies to the euro. Both countries experience large capital inflows that fund real estate purchases. This results in a sharp rise in domestic household debt and a housing bubble for each country. For simplicity, assume that Iceland uses the krona, and Ireland uses the punt (fictional, but helpful). (Diagrams will be useful.)
(a) Explain how a sudden collapse in the real price of housing affect national wealth for either country. How does this wealth effect shift aggregate demand?
Answer: The sudden collapse of the real price of housing reduces real national wealth. You should think of this as a sudden drop in the value of domestic capital. As national wealth decreases, we expect consumption to decrease, reducing aggregate demand, and leading to a decrease in GDP in the short run (under sticky prices). In an IS-LM diagram, the IS curve shifts inward.

(b) Suppose Ireland keeps the punt fixed to the euro. How does the collapse of the housing bubble affect Irish GDP? Do Irish interest rates or inflation change in the short run?
Answer: If Ireland keeps its currency, the punt, fixed to the euro, then the Irish interest rate is fixed equal to the Eurozone interest rate. The fall in Irish aggregate demand reduces Irish GDP without as shown in the IS-LM (equivalently, IS-MP) diagram:
i DR, FR
Ireland IS-LM Y FX E
E is the exchange rate of Irish punts for euro
Irish GDP falls much more than if Ireland fixed the supply of money instead of pegging the punt to the euro. The Irish interest rate does not change; Irish inflation does not change in the short run (prices are sticky).
c. Suppose Iceland lets the krona float following the collapse of its bubble. Explain theeffects of the bubble on Iceland’s GDP, exchange rate of the krona to the euro, and on Icelandic interest rates and inflation.
Answer: When the housing bubble bursts, aggregate demand falls in Iceland, and the Icelandic IS curve shifts inward. If Iceland lets the krona float after the housing bubble
IS
DR
FR
MP
bursts, then the Icelandic central bank can increase the supply of krona. The LM curve for Iceland shifts outward, lowering interest rates for Iceland, and shifting Iceland’s DR curve in the FX diagram. The krona depreciates against the euro (as shown in the IS-LM-FX diagram below). This leads to a rise in GDP for Iceland relative to what it was or would have been if Iceland remained pegged to the euro.

i DR,FR
Iceland IS-LM Y FX E
E is the exchange rate of Icelandic krona for euro.
The krona depreciates as Iceland’s interest rates fall, and its output rises. Inflation does not change in the short run, and will not change in the long run because Iceland only needs to increase its money supply, not the growth rate of its money supply.
d. Over the long run, Ireland keeps the punt fixed to the euro. How must Irish pricesadjust in returning to full employment? What could the Ireland do to ease its adjustment back to the long run?
Answer: If Ireland keeps the punt fixed the euro, Irish output needs to rise towards full employment output in the long run. With the punt fixed to the euro, Ireland cannot use monetary policy (and expansion) to lower interest rates to raise GDP. The adjustment back to the long run requires the real exchange rate for Ireland to depreciate. As the real exchange rate depreciates, the IS curve will shift outward, raising output to full employment output at the given Eurozone interest rate. The real exchange rate is given by
𝑞 = !!/€!!"#!!"#$%&'
.Because𝐸!/€isfixedandthepricelevelfortheEurozoneisgiven,the
IrishpricelevelmustfallrelativetotheEurozonepriceleveltoachievearealdepreciation.Thus,intheadjustmentbacktofullemployment,IrishinflationmustfallrelativetoEurozoneinflation.
LM
IS
DR
FR