Economical Mixtures to Reduce Both the Thermal and ...bentz/Economical_Mixtures.pdf1 Reducing...
24
Reducing Thermal and Autogenous Shrinkage Contributions to Early-Age Cracking 1 2 3 4 5 6 7 8 9 10 11 12 13 14 15 16 17 18 19 20 21 22 23 24 25 26 27 28 29 Dale P. Bentz Max A. Peltz Building and Fire Research Laboratory National Institute of Standards and Technology 100 Bureau Drive Stop 8615 Gaithersburg, MD 20899-8615 USA Abstract Early-age cracking continues to be a significant problem for new concrete construction. Two of the major contributors to such cracking are the heat released by cement hydration during the first few days of curing and the autogenous shrinkage that often occurs during the same timeframe. In this paper, three potential alternatives for reducing these contributions by modifying the concrete mixture proportions are investigated, namely increasing the water-to- cement ratio, utilizing a coarser cement, or replacing a portion of the portland cement with a coarse limestone powder. Each alternative reduces the heat generated per unit volume by either reducing the volumetric cement content or its early-age reactivity, and reduces autogenous shrinkage by increasing the interparticle spacing between grains in the three-dimensional microstructure. These reductions are quantified for paste and mortar systems by measuring their semi-adiabatic temperature rise and autogenous deformation, along with measurements of compressive strength to indicate the strength tradeoff that will be experienced in reducing the risk of early-age cracking. These mixtures each have the additional advantage that they should result in a cost savings in comparison to an initial (control) mixture. Introduction Despite efforts to avoid it, many concrete structures crack, often at early ages. 1 In fact, for a variety of reasons, high-performance concretes are often more susceptible to early age cracking than the concretes that were placed fifty years ago. 2,3 These reasons include their 1
Transcript of Economical Mixtures to Reduce Both the Thermal and ...bentz/Economical_Mixtures.pdf1 Reducing...
Reducing Thermal and Autogenous Shrinkage Contributions to Early-Age Cracking 1 2 3 4 5 6 7 8 9
10 11 12
13
14
15
16
17
18
19
20
21
22
23
24
25
26
27
28
29
Dale P. Bentz Max A. Peltz
Building and Fire Research Laboratory National Institute of Standards and Technology
100 Bureau Drive Stop 8615 Gaithersburg, MD 20899-8615 USA
Abstract
Early-age cracking continues to be a significant problem for new concrete construction.
Two of the major contributors to such cracking are the heat released by cement hydration during
the first few days of curing and the autogenous shrinkage that often occurs during the same
timeframe. In this paper, three potential alternatives for reducing these contributions by
modifying the concrete mixture proportions are investigated, namely increasing the water-to-
cement ratio, utilizing a coarser cement, or replacing a portion of the portland cement with a
coarse limestone powder. Each alternative reduces the heat generated per unit volume by either
reducing the volumetric cement content or its early-age reactivity, and reduces autogenous
shrinkage by increasing the interparticle spacing between grains in the three-dimensional
microstructure. These reductions are quantified for paste and mortar systems by measuring their
semi-adiabatic temperature rise and autogenous deformation, along with measurements of
compressive strength to indicate the strength tradeoff that will be experienced in reducing the
risk of early-age cracking. These mixtures each have the additional advantage that they should
result in a cost savings in comparison to an initial (control) mixture.
Introduction
Despite efforts to avoid it, many concrete structures crack, often at early ages.1 In fact,
for a variety of reasons, high-performance concretes are often more susceptible to early age
cracking than the concretes that were placed fifty years ago.2,3 These reasons include their
1
1
2
3
4
5
6
7
8
9
10
11
12
13
14
15
16
17
18
19
20
21
22
23
typically higher cement contents, the use of finer (and finer) cements with higher tricalcium
silicate and alkali contents, and the formation of a denser paste matrix via the reduction of water-
to-cementitious materials ratio (w/cm) and the addition of fine pozzolans such as silica fume.4,5
One indication of the magnitude of the early-age cracking problem is that there are now viable
mitigation strategies that are being actively marketed by chemical admixture, lightweight
aggregate, and specialty cement suppliers. Such strategies include the utilization of a shrinkage-
reducing admixture (SRA) to reduce autogenous shrinkage,6,7 the incorporation of internal curing
via pre-wetted lightweight aggregates,8 and the use of expansive cements.9 Each of these
strategies reduces autogenous shrinkage and may even result in an autogenous expansion at early
ages, but none of them directly addresses the heat released by hydration that will lead to a
temperature rise and fall that may exacerbate early-age cracking. For example, internal curing
may actually increase early-age hydration rates thus increasing this heat release, but fortunately,
the additional thermal (heat) capacity of the internal curing water may reduce the temperature
rise produced by a given amount of heat release. Additionally, each of these three technically
viable solutions will generally increase the cost of the concrete mixture.
Two key physical parameters influencing the heat generation and autogenous
deformation of cement pastes are surface area and interparticle spacing. Early-age reactivity and
heat release will generally be proportional to the former, while the latter will control the size of
the pores emptied (and thus the stresses generated) during the early-age self-desiccation that may
occur due to the chemical shrinkage that accompanies the cement hydration reactions.10 While
SRAs reduce autogenous shrinkage by lowering the surface tension of the pore solution and
internal curing provides mitigation by avoiding self-desiccation of the hydrating cement paste as
the larger pores in the lightweight aggregate reservoirs empty instead, a third approach to
2
1
2
3
4
5
6
7
8
9
10
11
12
13
14
15
16
17
18
19
20
21
22
23
decreasing early-age cracking susceptibility would be to modify the physical geometry of the
initial cement paste microstructure. In this paper, three distinct methods for “coarsening” the
initial spatial distribution of cement particles will be investigated, namely the use of a coarser
ground cement, an increase in the water-to-cement mass ratio (w/c), and the replacement of a
fraction of the cement by a (coarse) limestone powder. To conserve cement and energy, the
ASTM C150 Standard Specification for Portland Cement11 currently permits a 5 % limestone
addition to portland cement, and the Canadian Standards Association is considering raising this
value to 10 % or 15 %. It will be shown that each of these three methods can reduce both the
thermal and autogenous deformation contributions to early-age cracking. In addition, each of
these should potentially offer a cost advantage over the control mixture that is being modified. It
is recognized that there are other viable approaches to achieve the goals of cost reduction
concurrent with reduced early-age cracking, such as the development of high-volume fly ash
concretes for sustainable development.12
Research Significance
While concretes are designed to meet strength requirements and to promote long term
durability of concrete structures, both of these can be compromised if the concrete cracks at early
ages. Early-age cracking is a complex process that depends on materials, construction practices,
structural loads, and environmental conditions.13 The potential of a given concrete mixture for
such cracking can be analyzed by measurement of a variety of early-age properties such as
(semi)adiabatic temperature rise and autogenous deformation.13,14 When a mixture exhibits a
“high” potential for such cracking, modifications to its mixture proportions may be required to
reduce this potential. In this paper, three such modifications that focus on modifying the surface
area and interparticle spacing of the particles comprising the cementitious matrix component of
3
the concrete are quantitatively examined. Each modification also has the potential to reduce the
materials cost of the concrete. The results will provide guidance to designers in making the
necessary modifications to reduce the probability of early-age cracking of a given concrete
mixture.
1
2
3
4
5
6
7
8
9
10
11
12
13
14
15
16
17
18
19
20
21
Experimental
Two Type I/II cements of widely different fineness were obtained from Lehigh Portland
Cement Co. and two limestone powders (94 % CaCO3) were obtained from OMYA, a calcium
carbonate supplier.A The chemical and physical characteristics of the cements are summarized
in Table 1. They are quite similar in chemical composition except for the coarser cement having
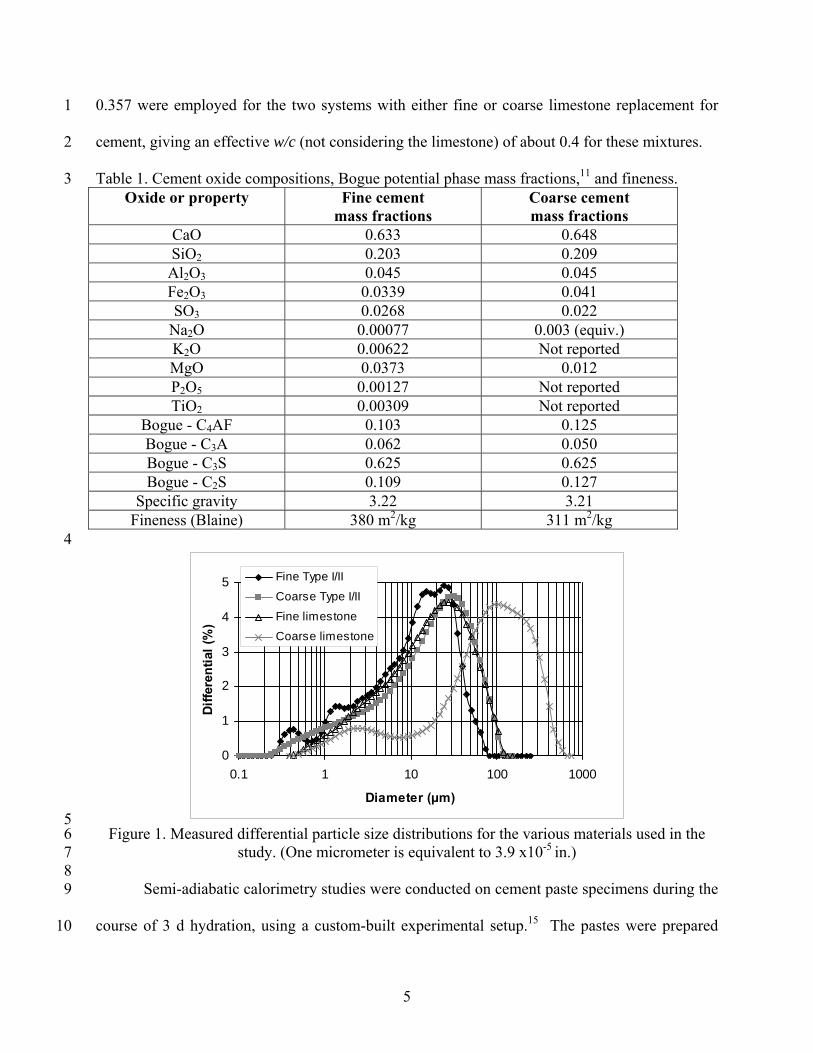
a lower total alkali content. The measured particle size distributions of all four powders are
provided in Figure 1. A specific gravity of 2.71, as supplied by the manufacturer, was used for
the limestone in proportioning the mortar mixtures.
For this study, specimens prepared using the finer cement with a w/c = 0.35 were selected
as the control system. Several possible variations from this control were investigated to quantify
their effects on strength development, semi-adiabatic temperature rise, and autogenous
deformation. These included the substitution of the coarser cement for the finer one, an increase
in w/c to 0.4 for the fine cement, and replacing a portion of the fine cement with either a fine or a
coarse limestone. Due to the differences in specific gravity between limestone and cement, the
limestone replacement was conducted so as to maintain the same volumetric ratio of water to
solid powders in the various mixtures. Thus, a 10.2 % replacement by mass (about 12 % by
volume) of limestone for cement and a water-to-cementitious materials mass ratio (w/cm) of
A Certain commercial products are identified in this paper to specify the materials used and procedures employed. In no case does such identification imply endorsement by the National Institute of Standards and Technology, nor does it indicate that the products are necessarily the best available for the purpose.
4
1
2
3
0.357 were employed for the two systems with either fine or coarse limestone replacement for
cement, giving an effective w/c (not considering the limestone) of about 0.4 for these mixtures.
Table 1. Cement oxide compositions, Bogue potential phase mass fractions,11 and fineness. Oxide or property Fine cement
mass fractions Coarse cement mass fractions
CaO 0.633 0.648 SiO2 0.203 0.209 Al2O3 0.045 0.045 Fe2O3 0.0339 0.041 SO3 0.0268 0.022
Na2O 0.00077 0.003 (equiv.) K2O 0.00622 Not reported MgO 0.0373 0.012 P2O5 0.00127 Not reported TiO2 0.00309 Not reported
Bogue - C4AF 0.103 0.125 Bogue - C3A 0.062 0.050 Bogue - C3S 0.625 0.625 Bogue - C2S 0.109 0.127
Specific gravity 3.22 3.21 Fineness (Blaine) 380 m2/kg 311 m2/kg
4
0
1
2
3
4
5
0.1 1 10 100 1000
Diameter (μm)
Diffe
rent
ial (
%)
Fine Type I/II
Coarse Type I/II
Fine limestoneCoarse limestone
5 6 7 8 9
10
Figure 1. Measured differential particle size distributions for the various materials used in the study. (One micrometer is equivalent to 3.9 x10⁻⁵ in.)
Semi-adiabatic calorimetry studies were conducted on cement paste specimens during the
course of 3 d hydration, using a custom-built experimental setup.15 The pastes were prepared
5
1
2
3
4
5
6
7
8
9
10
11
12
13
14
15
16
17
18
19
20
21
22
23
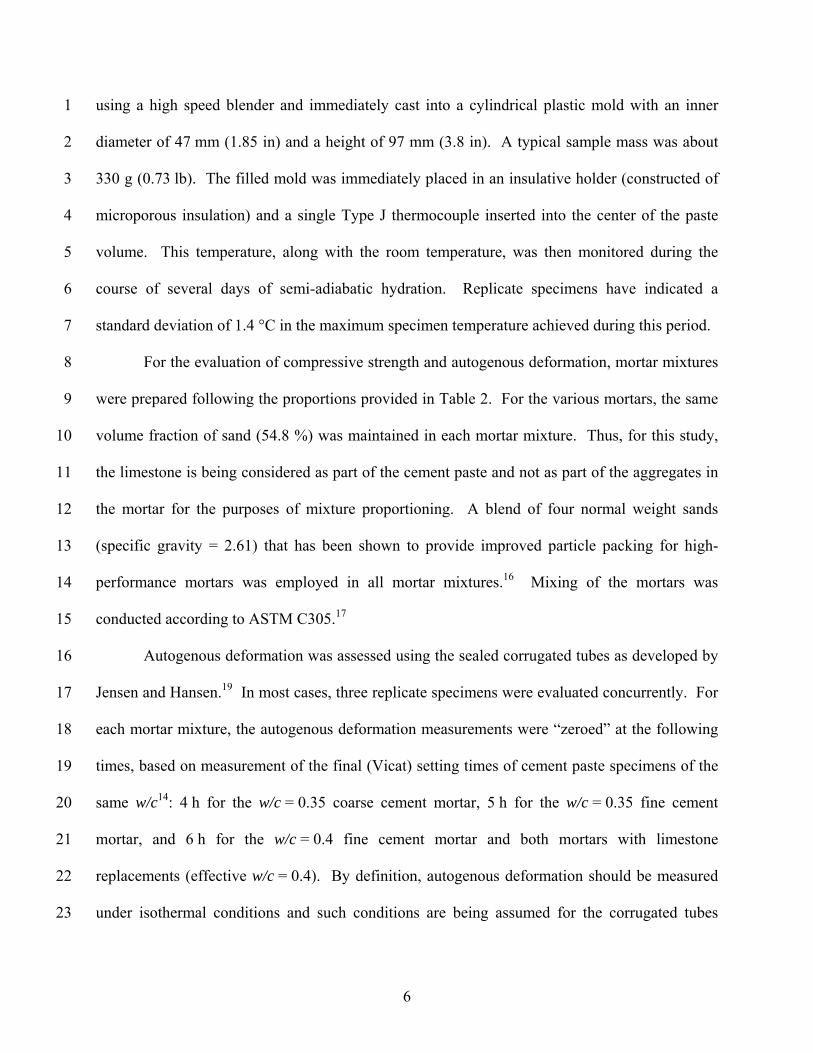
using a high speed blender and immediately cast into a cylindrical plastic mold with an inner
diameter of 47 mm (1.85 in) and a height of 97 mm (3.8 in). A typical sample mass was about
330 g (0.73 lb). The filled mold was immediately placed in an insulative holder (constructed of
microporous insulation) and a single Type J thermocouple inserted into the center of the paste
volume. This temperature, along with the room temperature, was then monitored during the
course of several days of semi-adiabatic hydration. Replicate specimens have indicated a
standard deviation of 1.4 °C in the maximum specimen temperature achieved during this period.
For the evaluation of compressive strength and autogenous deformation, mortar mixtures
were prepared following the proportions provided in Table 2. For the various mortars, the same
volume fraction of sand (54.8 %) was maintained in each mortar mixture. Thus, for this study,
the limestone is being considered as part of the cement paste and not as part of the aggregates in
the mortar for the purposes of mixture proportioning. A blend of four normal weight sands
(specific gravity = 2.61) that has been shown to provide improved particle packing for high-
performance mortars was employed in all mortar mixtures.16 Mixing of the mortars was
conducted according to ASTM C305.17
Autogenous deformation was assessed using the sealed corrugated tubes as developed by
Jensen and Hansen.19 In most cases, three replicate specimens were evaluated concurrently. For
each mortar mixture, the autogenous deformation measurements were “zeroed” at the following
times, based on measurement of the final (Vicat) setting times of cement paste specimens of the
same w/c14: 4 h for the w/c = 0.35 coarse cement mortar, 5 h for the w/c = 0.35 fine cement
mortar, and 6 h for the w/c = 0.4 fine cement mortar and both mortars with limestone
replacements (effective w/c = 0.4). By definition, autogenous deformation should be measured
under isothermal conditions and such conditions are being assumed for the corrugated tubes
6
1
2
3
4
employed in this study. In reality, as stated in the draft ASTM standard being developed for this
technique, “Typical maximum temperature increase in the center of the test specimen, due to
heat of hydration of cement paste or mortar, is 2 °C.”
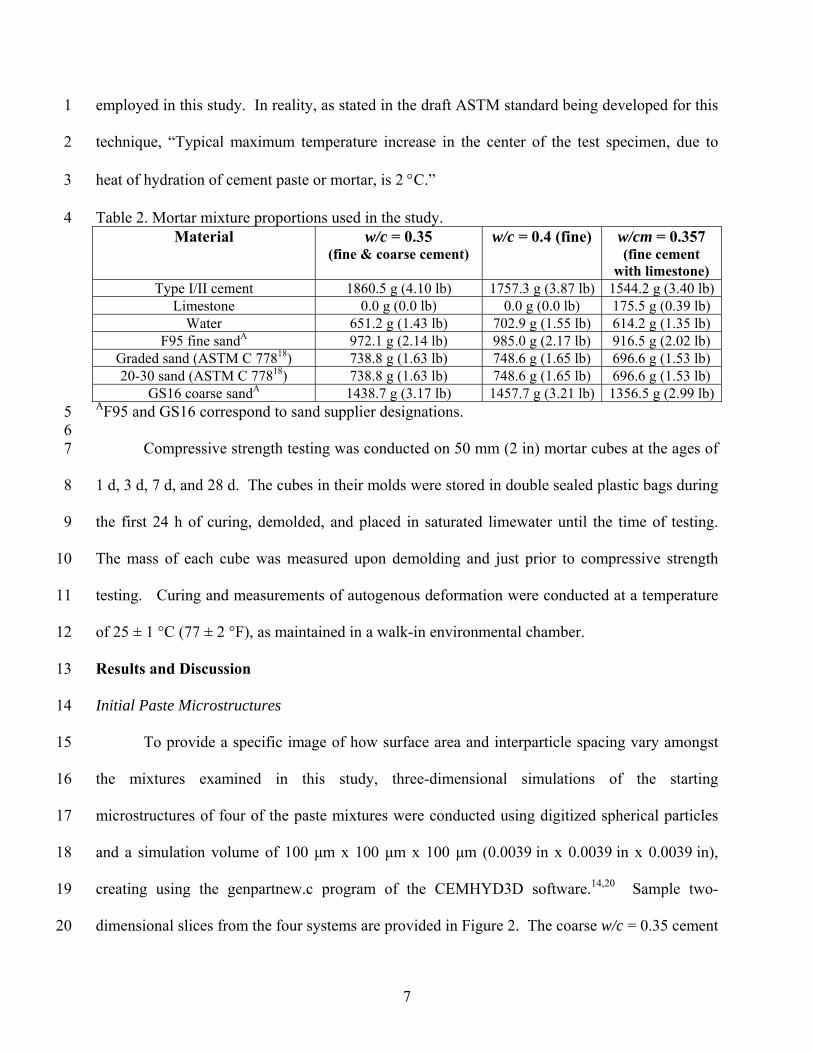
Table 2. Mortar mixture proportions used in the study. Material w/c = 0.35
(fine & coarse cement) w/c = 0.4 (fine) w/cm = 0.357
(fine cement with limestone)
Type I/II cement 1860.5 g (4.10 lb) 1757.3 g (3.87 lb) 1544.2 g (3.40 lb)Limestone 0.0 g (0.0 lb) 0.0 g (0.0 lb) 175.5 g (0.39 lb)
Water 651.2 g (1.43 lb) 702.9 g (1.55 lb) 614.2 g (1.35 lb) F95 fine sandA 972.1 g (2.14 lb) 985.0 g (2.17 lb) 916.5 g (2.02 lb)
Graded sand (ASTM C 77818) 738.8 g (1.63 lb) 748.6 g (1.65 lb) 696.6 g (1.53 lb) 20-30 sand (ASTM C 77818) 738.8 g (1.63 lb) 748.6 g (1.65 lb) 696.6 g (1.53 lb)
GS16 coarse sandA 1438.7 g (3.17 lb) 1457.7 g (3.21 lb) 1356.5 g (2.99 lb)AF95 and GS16 correspond to sand supplier designations. 5
6 7
8
9
10
11
12
13
14
15
16
17
18
19
20
Compressive strength testing was conducted on 50 mm (2 in) mortar cubes at the ages of
1 d, 3 d, 7 d, and 28 d. The cubes in their molds were stored in double sealed plastic bags during
the first 24 h of curing, demolded, and placed in saturated limewater until the time of testing.
The mass of each cube was measured upon demolding and just prior to compressive strength
testing. Curing and measurements of autogenous deformation were conducted at a temperature
of 25 ± 1 °C (77 ± 2 °F), as maintained in a walk-in environmental chamber.
Results and Discussion
Initial Paste Microstructures
To provide a specific image of how surface area and interparticle spacing vary amongst
the mixtures examined in this study, three-dimensional simulations of the starting
microstructures of four of the paste mixtures were conducted using digitized spherical particles
and a simulation volume of 100 μm x 100 μm x 100 μm (0.0039 in x 0.0039 in x 0.0039 in),
creating using the genpartnew.c program of the CEMHYD3D software.14,20 Sample two-
dimensional slices from the four systems are provided in Figure 2. The coarse w/c = 0.35 cement
7
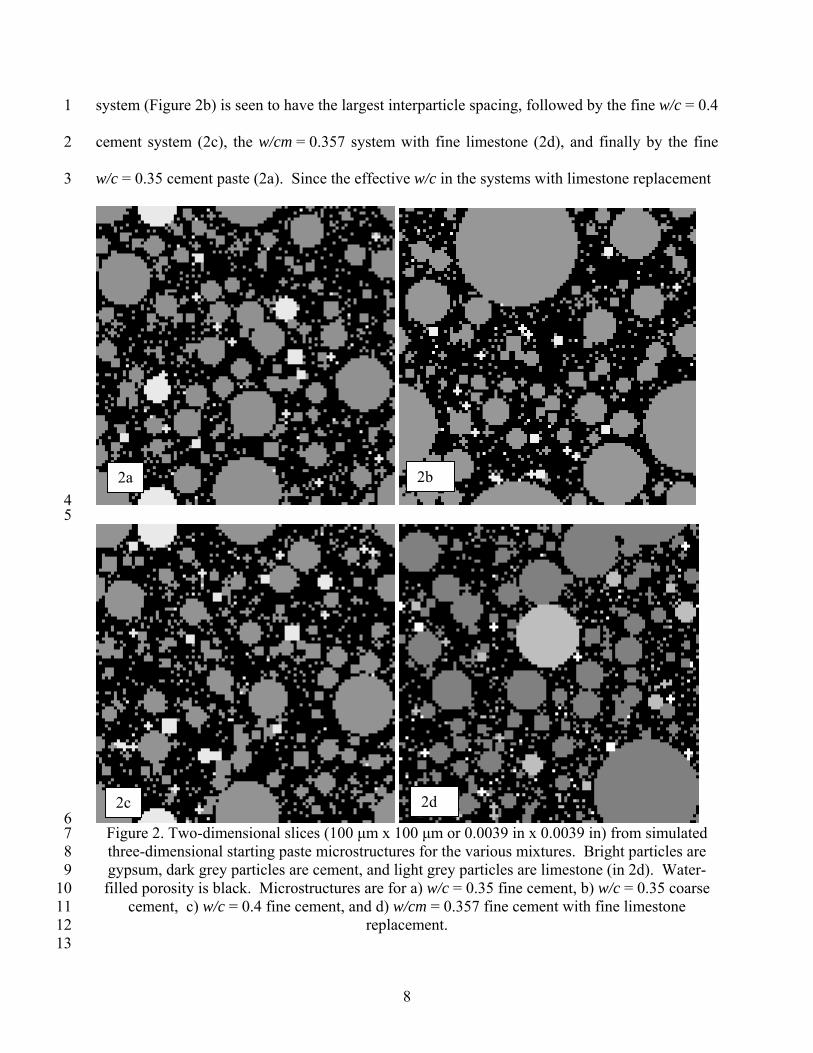
system (Figure 2b) is seen to have the largest interparticle spacing, followed by the fine w/c = 0.4
cement system (2c), the w/cm = 0.357 system with fine limestone (2d), and finally by the fine
w/c = 0.35 cement paste (2a). Since the effective w/c in the systems with limestone replacement
1
2
3
2b 2a
4 5
2d2c
6 7 8 9
10 11 12 13
Figure 2. Two-dimensional slices (100 μm x 100 μm or 0.0039 in x 0.0039 in) from simulated three-dimensional starting paste microstructures for the various mixtures. Bright particles are gypsum, dark grey particles are cement, and light grey particles are limestone (in 2d). Water-filled porosity is black. Microstructures are for a) w/c = 0.35 fine cement, b) w/c = 0.35 coarse
cement, c) w/c = 0.4 fine cement, and d) w/cm = 0.357 fine cement with fine limestone replacement.
8
1
2
3
4
5
6
7
8
9
10
11
12
13
is about 0.4, the spacing in the system with the coarser limestone filler (not shown in Figure 2)
would be expected to be similar to that of Figure 2c, assuming that the “cement paste” occupies
space between the relatively larger limestone particles and neglecting any interfacial transition
zones that may form around the larger limestone particles.
Compressive Strengths
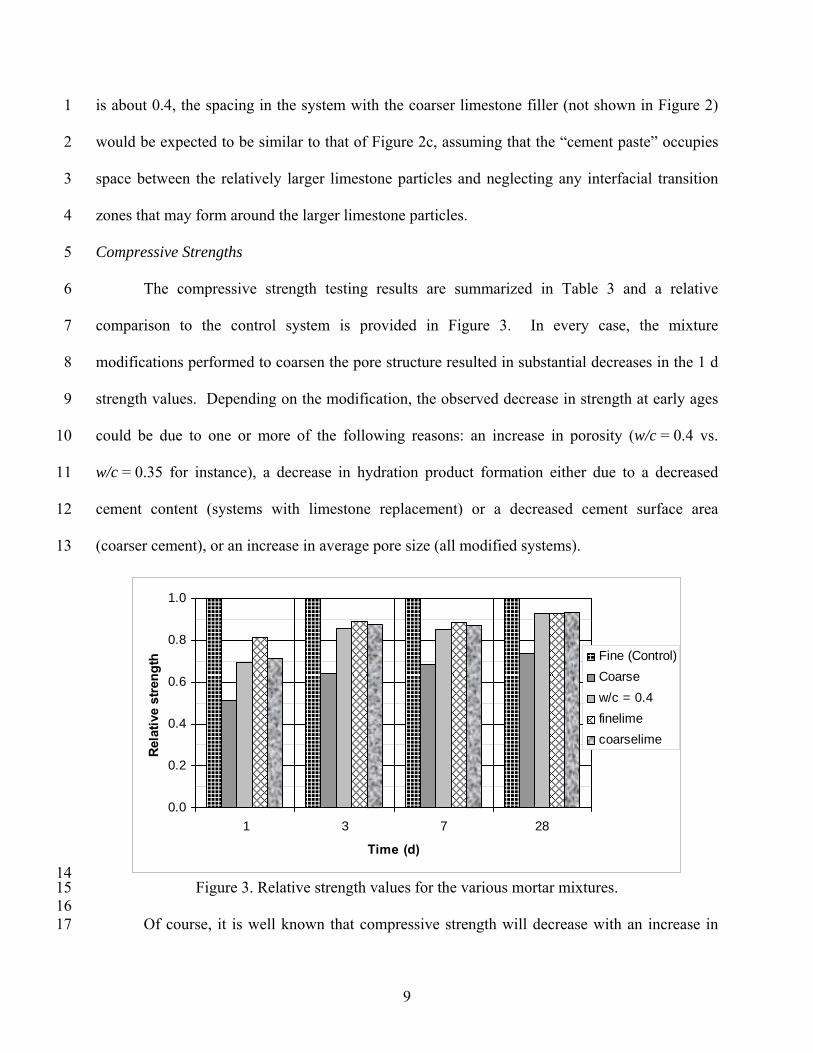
The compressive strength testing results are summarized in Table 3 and a relative
comparison to the control system is provided in Figure 3. In every case, the mixture
modifications performed to coarsen the pore structure resulted in substantial decreases in the 1 d
strength values. Depending on the modification, the observed decrease in strength at early ages
could be due to one or more of the following reasons: an increase in porosity (w/c = 0.4 vs.
w/c = 0.35 for instance), a decrease in hydration product formation either due to a decreased
cement content (systems with limestone replacement) or a decreased cement surface area
(coarser cement), or an increase in average pore size (all modified systems).
0.0
0.2
0.4
0.6
0.8
1.0
1 3 7 28
Time (d)
Rel
ativ
e st
reng
th Fine (Control)Coarsew/c = 0.4finelimecoarselime
14 15 16 17
Figure 3. Relative strength values for the various mortar mixtures.
Of course, it is well known that compressive strength will decrease with an increase in
9
10
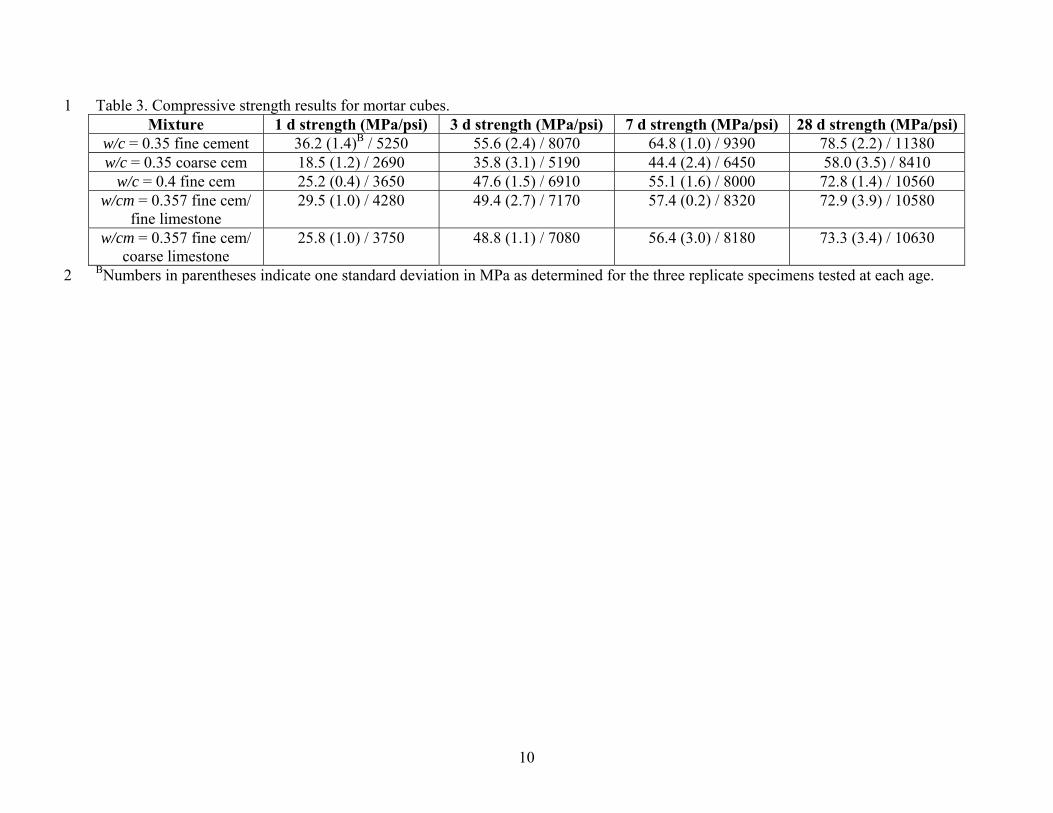
1 Table 3. Compressive strength results for mortar cubes. Mixture 1 d strength (MPa/psi) 3 d strength (MPa/psi) 7 d strength (MPa/psi) 28 d strength (MPa/psi)
w/c = 0.35 fine cement 36.2 (1.4)B / 5250 55.6 (2.4) / 8070 64.8 (1.0) / 9390 78.5 (2.2) / 11380 w/c = 0.35 coarse cem 18.5 (1.2) / 2690 35.8 (3.1) / 5190 44.4 (2.4) / 6450 58.0 (3.5) / 8410
w/c = 0.4 fine cem 25.2 (0.4) / 3650 47.6 (1.5) / 6910 55.1 (1.6) / 8000 72.8 (1.4) / 10560 w/cm = 0.357 fine cem/
fine limestone 29.5 (1.0) / 4280 49.4 (2.7) / 7170 57.4 (0.2) / 8320 72.9 (3.9) / 10580
w/cm = 0.357 fine cem/ coarse limestone
25.8 (1.0) / 3750 48.8 (1.1) / 7080 56.4 (3.0) / 8180 73.3 (3.4) / 10630
BNumbers in parentheses indicate one standard deviation in MPa as determined for the three replicate specimens tested at each age. 2
11
1
2
3
4
5
6
7
8
9
10
11
12
13
14
15
16
17
18
19
20
21
22
23
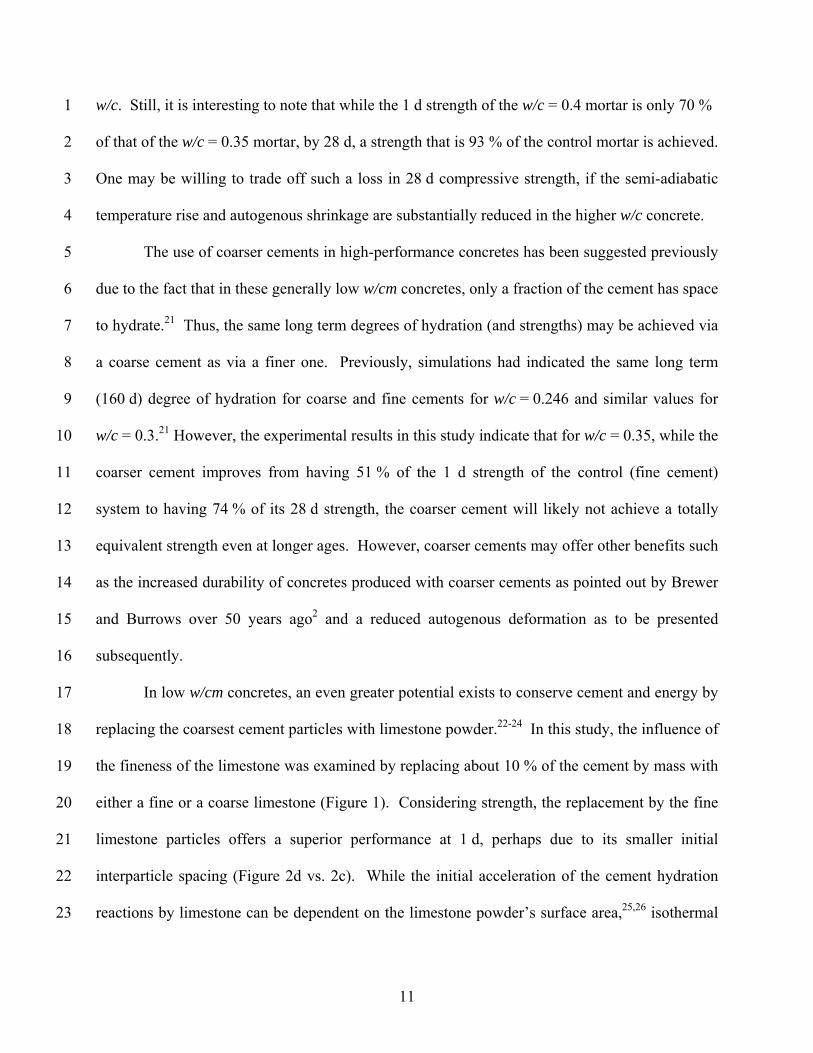
w/c. Still, it is interesting to note that while the 1 d strength of the w/c = 0.4 mortar is only 70 %
of that of the w/c = 0.35 mortar, by 28 d, a strength that is 93 % of the control mortar is achieved.
One may be willing to trade off such a loss in 28 d compressive strength, if the semi-adiabatic
temperature rise and autogenous shrinkage are substantially reduced in the higher w/c concrete.
The use of coarser cements in high-performance concretes has been suggested previously
due to the fact that in these generally low w/cm concretes, only a fraction of the cement has space
to hydrate.21 Thus, the same long term degrees of hydration (and strengths) may be achieved via
a coarse cement as via a finer one. Previously, simulations had indicated the same long term
(160 d) degree of hydration for coarse and fine cements for w/c = 0.246 and similar values for
w/c = 0.3.21 However, the experimental results in this study indicate that for w/c = 0.35, while the
coarser cement improves from having 51 % of the 1 d strength of the control (fine cement)
system to having 74 % of its 28 d strength, the coarser cement will likely not achieve a totally
equivalent strength even at longer ages. However, coarser cements may offer other benefits such
as the increased durability of concretes produced with coarser cements as pointed out by Brewer
and Burrows over 50 years ago2 and a reduced autogenous deformation as to be presented
subsequently.
In low w/cm concretes, an even greater potential exists to conserve cement and energy by
replacing the coarsest cement particles with limestone powder.22-24 In this study, the influence of
the fineness of the limestone was examined by replacing about 10 % of the cement by mass with
either a fine or a coarse limestone (Figure 1). Considering strength, the replacement by the fine
limestone particles offers a superior performance at 1 d, perhaps due to its smaller initial
interparticle spacing (Figure 2d vs. 2c). While the initial acceleration of the cement hydration
reactions by limestone can be dependent on the limestone powder’s surface area,25,26 isothermal
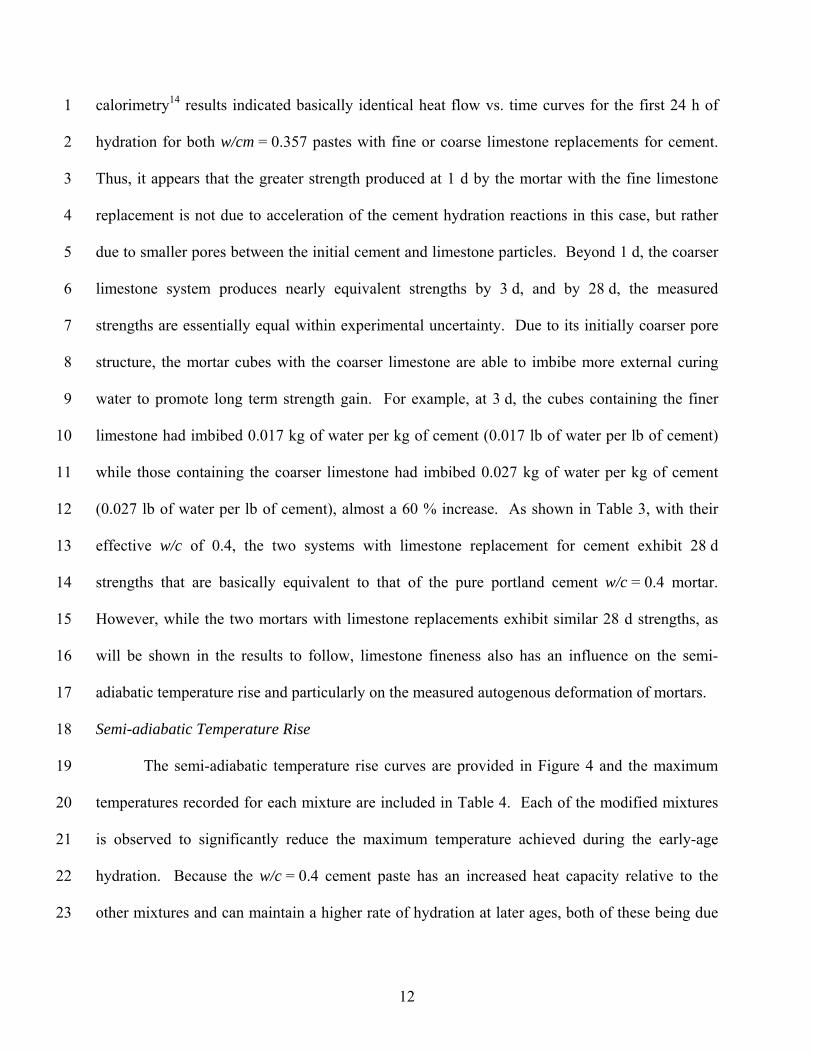
calorimetry14 results indicated basically identical heat flow vs. time curves for the first 24 h of
hydration for both w/cm = 0.357 pastes with fine or coarse limestone replacements for cement.
Thus, it appears that the greater strength produced at 1 d by the mortar with the fine limestone
replacement is not due to acceleration of the cement hydration reactions in this case, but rather
due to smaller pores between the initial cement and limestone particles. Beyond 1 d, the coarser
limestone system produces nearly equivalent strengths by 3 d, and by 28 d, the measured
strengths are essentially equal within experimental uncertainty. Due to its initially coarser pore
structure, the mortar cubes with the coarser limestone are able to imbibe more external curing
water to promote long term strength gain. For example, at 3 d, the cubes containing the finer
limestone had imbibed 0.017 kg of water per kg of cement (0.017 lb of water per lb of cement)
while those containing the coarser limestone had imbibed 0.027 kg of water per kg of cement
(0.027 lb of water per lb of cement), almost a 60 % increase. As shown in Table 3, with their
effective w/c of 0.4, the two systems with limestone replacement for cement exhibit 28 d
strengths that are basically equivalent to that of the pure portland cement w/c = 0.4 mortar.
However, while the two mortars with limestone replacements exhibit similar 28 d strengths, as
will be shown in the results to follow, limestone fineness also has an influence on the semi-
adiabatic temperature rise and particularly on the measured autogenous deformation of mortars.
1
2
3
4
5
6
7
8
9
10
11
12
13
14
15
16
17
18
19
20
21
22
23
Semi-adiabatic Temperature Rise
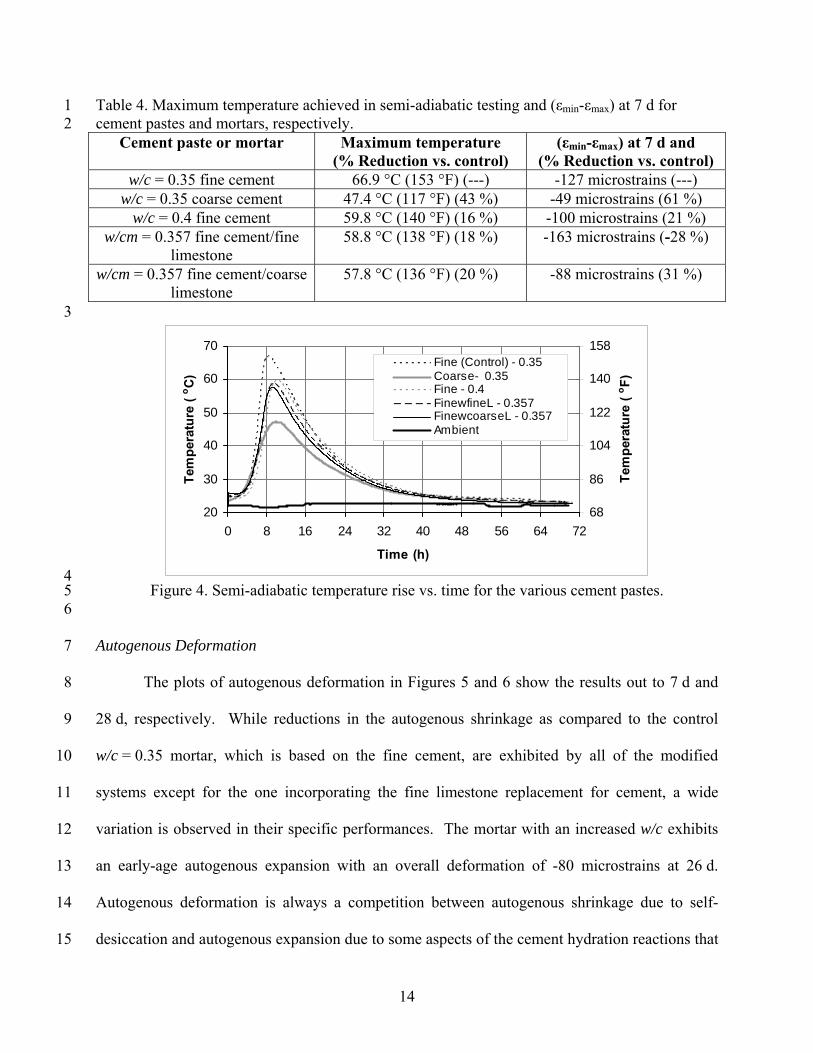
The semi-adiabatic temperature rise curves are provided in Figure 4 and the maximum
temperatures recorded for each mixture are included in Table 4. Each of the modified mixtures
is observed to significantly reduce the maximum temperature achieved during the early-age
hydration. Because the w/c = 0.4 cement paste has an increased heat capacity relative to the
other mixtures and can maintain a higher rate of hydration at later ages, both of these being due
12
1
2
3
4
5
6
7
8
9
10
11
12
13
14
15
16
17
18
19
20
21
22
23
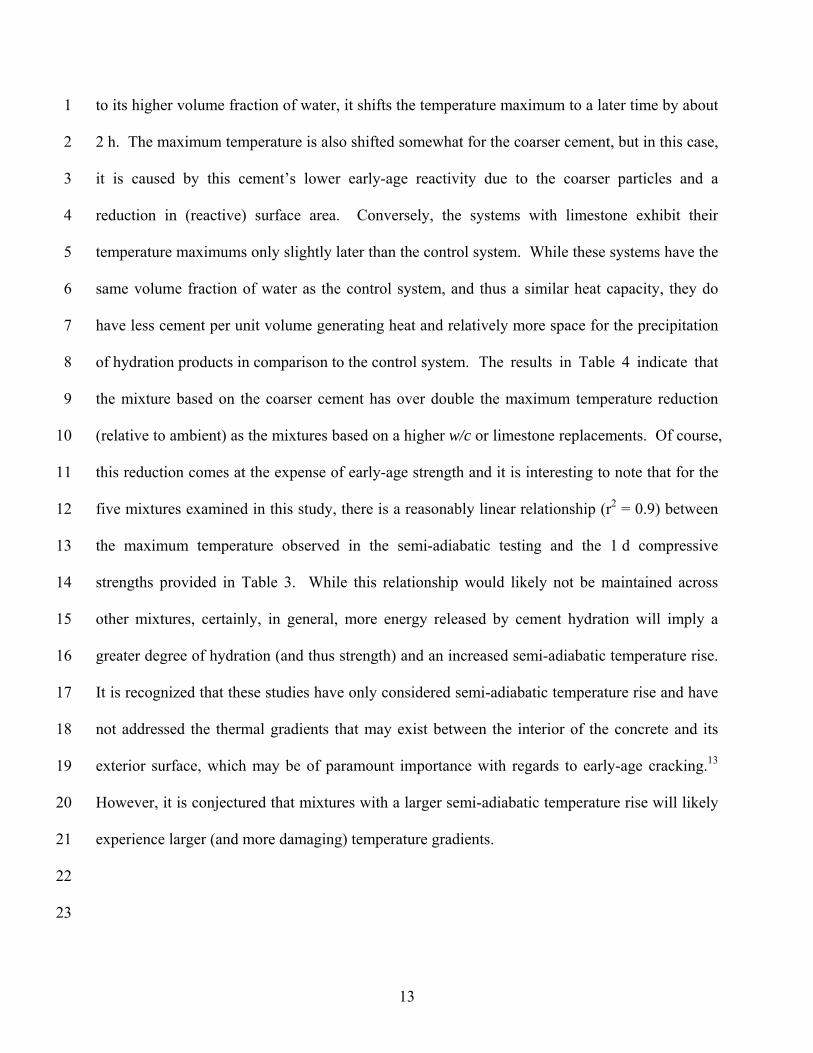
to its higher volume fraction of water, it shifts the temperature maximum to a later time by about
2 h. The maximum temperature is also shifted somewhat for the coarser cement, but in this case,
it is caused by this cement’s lower early-age reactivity due to the coarser particles and a
reduction in (reactive) surface area. Conversely, the systems with limestone exhibit their
temperature maximums only slightly later than the control system. While these systems have the
same volume fraction of water as the control system, and thus a similar heat capacity, they do
have less cement per unit volume generating heat and relatively more space for the precipitation
of hydration products in comparison to the control system. The results in Table 4 indicate that
the mixture based on the coarser cement has over double the maximum temperature reduction
(relative to ambient) as the mixtures based on a higher w/c or limestone replacements. Of course,
this reduction comes at the expense of early-age strength and it is interesting to note that for the
five mixtures examined in this study, there is a reasonably linear relationship (r2 = 0.9) between
the maximum temperature observed in the semi-adiabatic testing and the 1 d compressive
strengths provided in Table 3. While this relationship would likely not be maintained across
other mixtures, certainly, in general, more energy released by cement hydration will imply a
greater degree of hydration (and thus strength) and an increased semi-adiabatic temperature rise.
It is recognized that these studies have only considered semi-adiabatic temperature rise and have
not addressed the thermal gradients that may exist between the interior of the concrete and its
exterior surface, which may be of paramount importance with regards to early-age cracking.13
However, it is conjectured that mixtures with a larger semi-adiabatic temperature rise will likely
experience larger (and more damaging) temperature gradients.
13
1 2
Table 4. Maximum temperature achieved in semi-adiabatic testing and (εmin-εmax) at 7 d for cement pastes and mortars, respectively.
Cement paste or mortar Maximum temperature (% Reduction vs. control)
(εmin-εmax) at 7 d and (% Reduction vs. control)
w/c = 0.35 fine cement 66.9 °C (153 °F) (---) -127 microstrains (---) w/c = 0.35 coarse cement 47.4 °C (117 °F) (43 %) -49 microstrains (61 %)
w/c = 0.4 fine cement 59.8 °C (140 °F) (16 %) -100 microstrains (21 %) w/cm = 0.357 fine cement/fine
limestone 58.8 °C (138 °F) (18 %) -163 microstrains (-28 %)
w/cm = 0.357 fine cement/coarse limestone
57.8 °C (136 °F) (20 %) -88 microstrains (31 %)
3
20
30
40
50
60
70
0 8 16 24 32 40 48 56 64 72
Time (h)
Tem
pera
ture
(o C
)
68
86
104
122
140
158
Tem
pera
ture
(o F)
Fine (Control) - 0.35Coarse- 0.35Fine - 0.4FinewfineL - 0.357FinewcoarseL - 0.357Ambient
4 5 6
7
8
9
10
11
12
13
14
15
Figure 4. Semi-adiabatic temperature rise vs. time for the various cement pastes.
Autogenous Deformation
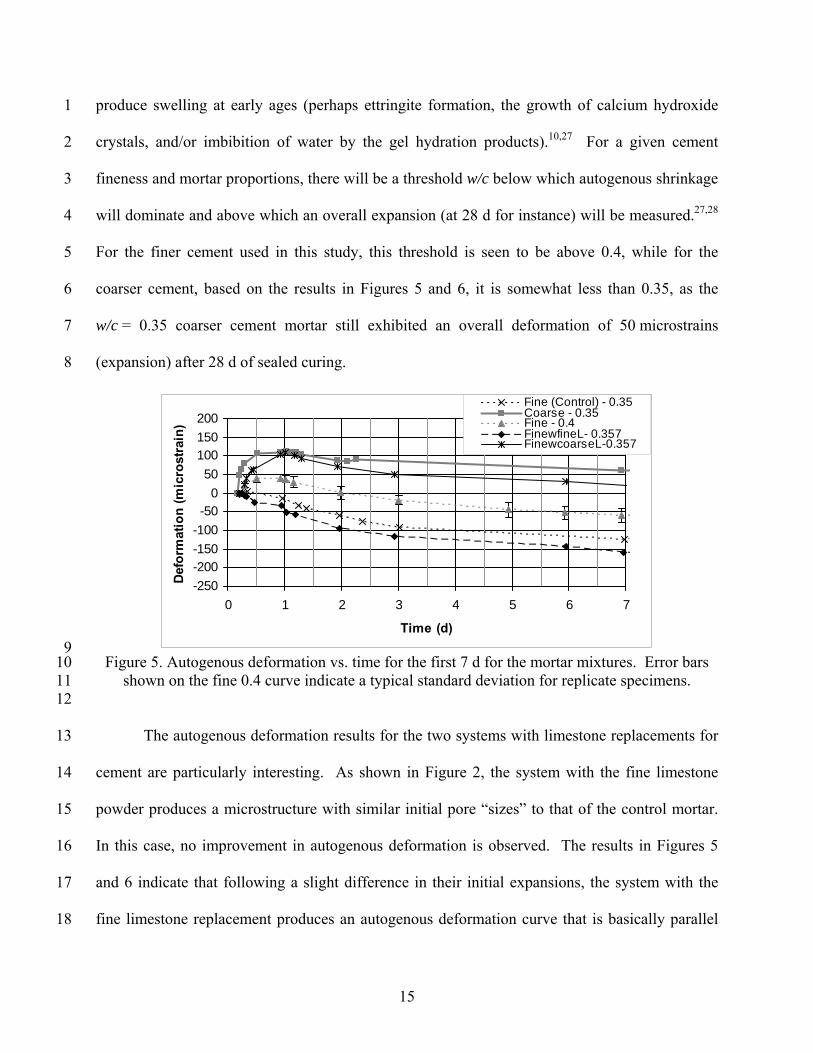
The plots of autogenous deformation in Figures 5 and 6 show the results out to 7 d and
28 d, respectively. While reductions in the autogenous shrinkage as compared to the control
w/c = 0.35 mortar, which is based on the fine cement, are exhibited by all of the modified
systems except for the one incorporating the fine limestone replacement for cement, a wide
variation is observed in their specific performances. The mortar with an increased w/c exhibits
an early-age autogenous expansion with an overall deformation of -80 microstrains at 26 d.
Autogenous deformation is always a competition between autogenous shrinkage due to self-
desiccation and autogenous expansion due to some aspects of the cement hydration reactions that
14
1
2
3
4
5
6
7
8
produce swelling at early ages (perhaps ettringite formation, the growth of calcium hydroxide
crystals, and/or imbibition of water by the gel hydration products).10,27 For a given cement
fineness and mortar proportions, there will be a threshold w/c below which autogenous shrinkage
will dominate and above which an overall expansion (at 28 d for instance) will be measured.27,28
For the finer cement used in this study, this threshold is seen to be above 0.4, while for the
coarser cement, based on the results in Figures 5 and 6, it is somewhat less than 0.35, as the
w/c = 0.35 coarser cement mortar still exhibited an overall deformation of 50 microstrains
(expansion) after 28 d of sealed curing.
-250-200-150-100-50
050
100150200
0 1 2 3 4 5 6 7
Time (d)
Def
orm
atio
n (m
icro
stra
in)
Fine (Control) - 0.35Coarse - 0.35Fine - 0.4FinewfineL- 0.357FinewcoarseL-0.357
9 10 11 12
13
14
15
16
17
18
Figure 5. Autogenous deformation vs. time for the first 7 d for the mortar mixtures. Error bars shown on the fine 0.4 curve indicate a typical standard deviation for replicate specimens.
The autogenous deformation results for the two systems with limestone replacements for
cement are particularly interesting. As shown in Figure 2, the system with the fine limestone
powder produces a microstructure with similar initial pore “sizes” to that of the control mortar.
In this case, no improvement in autogenous deformation is observed. The results in Figures 5
and 6 indicate that following a slight difference in their initial expansions, the system with the
fine limestone replacement produces an autogenous deformation curve that is basically parallel
15
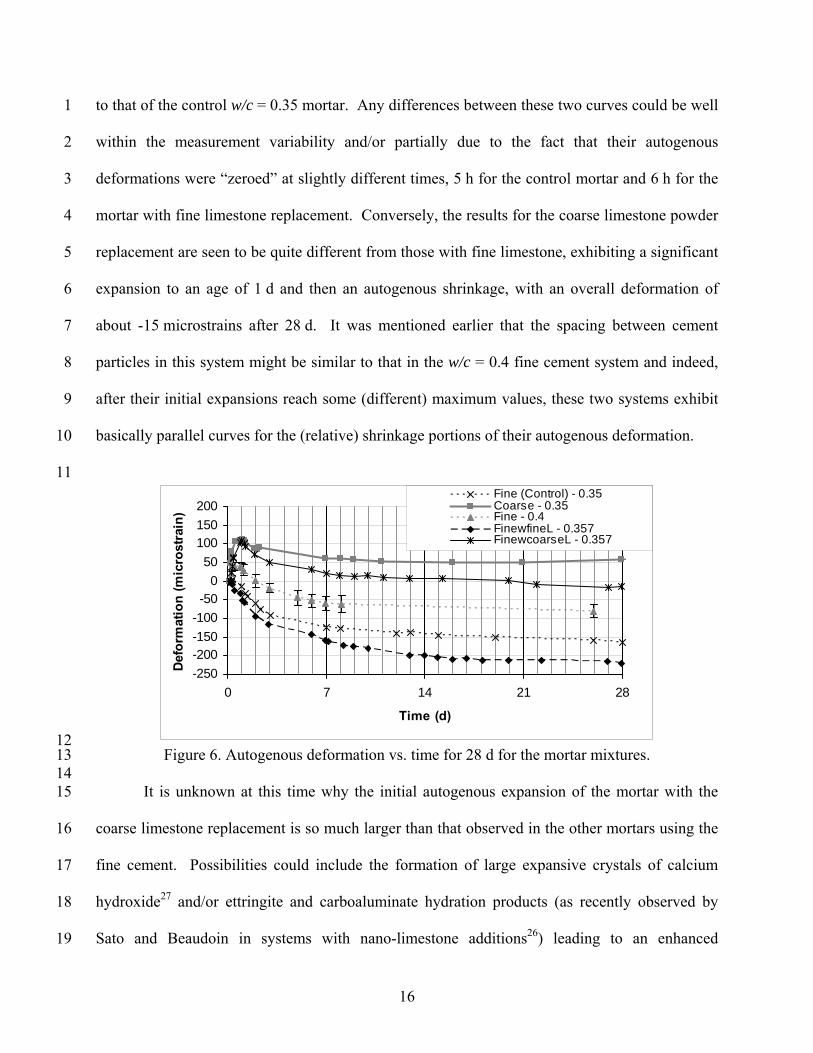
to that of the control w/c = 0.35 mortar. Any differences between these two curves could be well
within the measurement variability and/or partially due to the fact that their autogenous
deformations were “zeroed” at slightly different times, 5 h for the control mortar and 6 h for the
mortar with fine limestone replacement. Conversely, the results for the coarse limestone powder
replacement are seen to be quite different from those with fine limestone, exhibiting a significant
expansion to an age of 1 d and then an autogenous shrinkage, with an overall deformation of
about -15 microstrains after 28 d. It was mentioned earlier that the spacing between cement
particles in this system might be similar to that in the w/c = 0.4 fine cement system and indeed,
after their initial expansions reach some (different) maximum values, these two systems exhibit
basically parallel curves for the (relative) shrinkage portions of their autogenous deformation.
1
2
3
4
5
6
7
8
9
10
11
-250-200-150-100-50
050
100150200
0 7 14 21 28
Time (d)
Def
orm
atio
n (m
icro
stra
in)
Fine (Control) - 0.35Coarse - 0.35Fine - 0.4FinewfineL - 0.357FinewcoarseL - 0.357
12 13 14 15
16
17
18
19
Figure 6. Autogenous deformation vs. time for 28 d for the mortar mixtures. It is unknown at this time why the initial autogenous expansion of the mortar with the
coarse limestone replacement is so much larger than that observed in the other mortars using the
fine cement. Possibilities could include the formation of large expansive crystals of calcium
hydroxide27 and/or ettringite and carboaluminate hydration products (as recently observed by
Sato and Beaudoin in systems with nano-limestone additions26) leading to an enhanced
16
1
2
3
4
5
6
7
8
9
10
11
12
13
14
15
16
17
18
19
20
21
22
expansion, or perhaps a more uniform distribution of gel hydration products on both the cement
and limestone grains leading to a greater expansion of the paste during water imbibition by this
gel. The system with the finer limestone replacement, with its smaller initial pore sizes, might
not provide sufficient space for the formation of such large crystals and any enhanced expansion
of the gel hydration products could be offset by the large shrinkage strains generated as these
much smaller pores empty during self-desiccation in this system (Figure 2d). Clearly, further
research is needed in this area.
Recently, Cusson29 has advocated the utilization of the (net) difference between the
maximum (peak) and minimum (post peak) deformations achieved during the first 7 d of curing
as an effective measure of the risk of cracking in a concrete structure, as a concrete typically
reaches a zero-stress state sometime after the peak (expansion) is achieved, but prior to the
autogenous deformation returning to zero (or achieving its minimum value). Beyond this zero-
stress time, tensile stresses develop and build and may ultimately lead to early-age cracking if the
tensile strength of the concrete is exceeded at any time.13,29 For the five mixtures examined in
this study, these values of net autogenous shrinkage, (εmin-εmax), are provided in Table 4. In
terms of this performance parameter, the ranking of the mixtures would be: (1) the coarser
cement with w/c = 0.35, (2) the fine cement with the coarse limestone replacement, (3) the fine
cement with w/c = 0.4, (4) the fine cement with w/c = 0.35, and (5) the fine cement with the fine
limestone replacement. If this performance criteria were considered to be the critical measure
for autogenous deformation contributions to early-age cracking, as indicated in Table 4, the
coarser cement would provide the best performance for reducing both the thermal and
autogenous deformation contributions to early-age cracking.
17
1
2
3
4
5
6
7
8 9
10
11
12
13
14
15
16
17
18
19
20
21
22
23
It is important to note that the results with the coarse limestone replacement presented in
this paper have been obtained by blending a coarser limestone powder with a finer cement. Such
a distribution of these two materials, for instance, would be unlikely to be obtained by
intergrinding a softer limestone with a harder cement clinker, a procedure that is often currently
employed within the cement industry. The coarser limestone contributes to an increase in the
initial interparticle spacing of the blended cement that reduces the autogenous deformation at
early ages, while not dramatically impacting 28 d strength.
Potential Costs and Durability It is always important to consider the cost implications of any modifications to mixture
proportions, since unit costs are the bottom line that drives much of construction today.
Fortunately, in this case, it is projected that each of these three different mixture modifications
will result in a materials cost reduction. For example, by increasing w/c from 0.35 to 0.4 at a
fixed paste volume fraction, the volume of cement utilized will be reduced by 7 %. As cement is
generally the most expensive component of the concrete mixture (neglecting admixture costs),
the overall concrete cost should be reduced by at least several percent. While the utilization of a
coarser cement doesn’t in itself reduce cement consumption, it should reduce the energy costs
involved in grinding the cement to the needed fineness. As indicated earlier, the mixtures with
limestone replacement will result in a 12 % reduction in the volume of cement per unit volume
of concrete, and may potentially offer the largest cost savings, depending on the cost of the
limestone powder. And, of course, if these mixture modifications reduce early-age cracking,
leading to an increase in concrete durability, the life-cycle costs of any concrete structures
produced with these mixtures could be dramatically reduced.
18
1
2
3
4
5
6
7
8
9
10
11
12
13
14
15
16
17
18
19
20
21
22
23
Still, it is natural to question what will be the long term durability implications of these
mixture modifications. While there is no question that each of the modifications is “coarsening”
the early-age pore structure and that a coarser pore structure often implies lower durability due to
higher transport rates, the “ultimate” pore structures of these mixtures achieved at and beyond
28 days of hydration could be quite similar, as exemplified by the convergence of their 28 d
compressive strengths. While one frowns (and some even cringe) upon using strength as a
durability measure, most durability properties do exhibit a very good correlation to strength for
mixtures that do not vary too widely.30 Thus, if equivalent or nearly equivalent strengths are
achieved at 28 d for these mixtures with relatively minor modifications from the control systems,
equivalent durability might be expected. Of course, one must keep in mind chemical issues
specific to the materials being employed, such as the thaumasite form of sulfate attack31,32 in the
systems containing limestone replacements for cement.
There has always been and will continue to be a delicate balance between early-age
strength development and the likelihood of early-age cracking.33 Currently, the pendulum has
perhaps swung too far in the direction of high early-age strengths. The mixture modifications
examined in this study can hopefully assist in moving it back towards center with equal emphasis
on strength and early-age cracking.
Conclusions
High early-age strength often correlates with a high semi-adiabatic temperature rise and
an increased autogenous shrinkage. By modifying the initial geometry of the cement particles,
specifically their surface area and interparticle spacing, both of these contributions to early-age
cracking can be reduced. Three possible modifications are an increase in w/c, the utilization of a
coarser cement, or the replacement of part of the cement by a coarse limestone powder. While
19
1
2
3
4
5
6
7
8
9
10
11
12
13 14 15
16
17
18
19
20
21
22
23
24
these modifications do reduce early-age strength significantly, in several cases, the reduction in
28 d strength is below 10 %. The coarser cement offers the largest benefit in terms of reducing
semi-adiabatic temperature rise and effective autogenous shrinkage at 7 d, but also produces the
lowest strength mortars at all ages tested. The replacement of about 10 % by mass of the cement
by a coarse limestone produced a mortar with an overall autogenous deformation near zero at
28 d and a net autogenous shrinkage of -88 microstrains at 7 d, and may be the most economical
and sustainable of the three modifications. An increase in w/c reduced both autogenous
shrinkage and semi-adiabatic temperature rise and can be easily achieved without obtaining any
additional materials.
Acknowledgements
The authors would like to thank the Lehigh Portland Cement Co. and OMYA for
providing materials for this study.
REFERENCES
1) Burrows, R.W., “The Visible and Invisible Cracking of Concrete,” Monograph No. 11,
American Concrete Institute, Farmington Hills, MI, 1998.
2) Brewer, H.W., and Burrows, R.W., “Coarse-Ground Cement Makes More Durable Concrete,”
Journal of the American Concrete Institute, 22 (5), 353-360, 1951.
3) RILEM, Early Age Cracking in Cementitious Systems (TC 181-EAS), edited by A. Bentur.
RILEM report 25, RILEM Publications S.A.R.L., 2003, 337p.
4) Burrows, R.W., Kepler, W.F., Hurcomb, D., Schaffer, J., and Sellers, G., “Three Simple Tests
for Selecting Low-Crack Cement,” Cement and Concrete Composites, 26 (5), 509-519, 2004.
5) Jensen, O.M., and Hansen, P.F., “Autogenous Deformation and Change of Relative Humidity
in Silica Fume-Modified Cement Paste,” ACI Materials Journal, 93 (6), 539-543, 1996.
20
1
2
3
4
5
6
7
8
9
10
11
12
13
14
15
16
17
18
19
20
21
22
6) Bentz, D.P., Geiker, M.R., and Hansen, K.K., “Shrinkage-Reducing Admixtures and Early
Age Desiccation in Cement Pastes and Mortars,” Cement and Concrete Research, 31 (7), 1075-
1085, 2001.
7) Rongbing, B., and Jian, S., “Synthesis and Evaluation of Shrinkage-Reducing Admixtures for
Cementitious Materials,” Cement and Concrete Research, 35 (3), 445-448, 2005.
8) Bentz, D.P., Lura, P., and Roberts, J.W., “Mixture Proportioning for Internal Curing,”
Concrete International, 27 (2), 35-40, 2005.
9) Nagataki, S., and Gomi, H., “Expansive Admixtures,” Cement and Concrete Composites, 20,
163-170, 1998.
10) Bentz, D.P., Jensen, O.M., Hansen, K.K., Olesen, J.F., Stang, H., and Haecker, C.J.,
“Influence of Cement Particle-Size Distribution on Early Age Autogenous Strains and Stresses in
Cement-Based Materials,” Journal of the American Ceramic Society, 84 (1), 129-135, 2001.
11) ASTM C 150-07, “Standard Specification for Portland Cement,” ASTM International, West
Conshohocken, PA, 2007.
12) Mehta, P.K., “High-Performance, High-Volume Fly Ash Concrete For Sustainable
Development,” in Proceedings of the International Workshop on Sustainable Development and
Concrete Technology, Beijing, China, 2004, pp. 3-14.
13) Early-Age Cracking: Causes, Measurements, and Mitigation, State-of-the-art report of ACI
Committee 231, American Concrete Institute, Farmington Hills, MI, in review.
14) Bentz, D.P., Sant, G., and Weiss, W.J., “Early-Age Properties of Cement-Based Materials: I.
Influence of Cement Fineness,” accepted by ASCE Journal of Materials in Civil Engineering,
2008.
21
1
2
3
4
5
6
7
8
9
10
11
12
13
14
15
16
17
18
19
20
21
22
15) Bentz, D.P., and Turpin, R., “Potential Applications of Phase Change Materials in Concrete
Technology,” Cement and Concrete Composites, 29, 527-532, 2007.
16) Ferraris, C.F., unpublished results, 2000.
17) ASTM C 305-99, “Standard Practice for Mechanical Mixing of Hydraulic Cement Pastes and
Mortars of Plastic Consistency,” ASTM International, West Conshohocken, PA, 1999.
18) ASTM C 778-05, “Standard Specification for Standard Sand,” ASTM International, West
Conshohocken, PA, 2005.
19) Jensen, O.M., and Hansen, P.F., “A Dilatometer for Measuring Autogenous Deformation in
Hardening Portland Cement Paste,” Materials and Structures, 28, 406-409, 1995.
20) Bentz, D.P., “CEMHYD3D: A Three-Dimensional Cement Hydration and Microstructure
Development Modeling Package. Version 3.0,” NISTIR 7232, U.S. Department of Commerce,
June 2005.
21) Bentz, D.P., and Haecker, C.J., “An Argument for Using Coarse Cements in High
Performance Concretes,” Cement and Concrete Research, 29 (4), 615-618, 1999.
22) Bonavetti, V., Donza, H., Menendez, G., Cabrera, O., and Irassar, E.F., “Limestone Filler
Cement in Low w/c Concrete : A Rational Use of Energy,” Cement and Concrete Research, 33
865-871, 2003.
23) Bentz, D.P., and Conway, J.T., “Computer Modelling of the Replacement of “Coarse”
Cement Particles by Inert Fillers in Low w/c Ratio Concretes: Hydration and Strength,” Cement
and Concrete Research, 31 (3), 503-506, 2001.
24) Bentz, D.P., “Replacement of “Coarse” Cement Particles by Inert Fillers in Low w/c Ratio
Concretes II: Experimental Validation,” Cement and Concrete Research, 35 (1), 185-188, 2005.
22
1
2
3
4
5
6
7
8
9
10
11
12
13
14
15
16
17
18
19
20
21
22
25) Bentz, D.P., “Modeling the Influence of Limestone Filler on Cement Hydration Using
CEMHYD3D,” Cement and Concrete Composites, 28 (2), 124-129, 2006.
26) Sato, T., and Beaudoin, J.J., “The Effect of Nano-sized CaCO3 Addition on the Hydration of
Cement Paste Containing High Volumes of Fly Ash,” in Proceedings of the 12th International
Congress on the Chemistry of Cement, 2007, 12 pp.
27) Baroghel-Bouny, V., Mounanga, P., Khelidj, A., Loukili, A., and Rafai, N., “Autogenous
Deformation of Cement Pastes Part II. W/C Effects, Micro-Macro Correlations, and Threshold
Values,” Cement and Concrete Research, 36, 123-136, 2006.
28) Bentz, D.P., Peltz, M.A., and Winpigler, J., “Early-Age Properties of Cement-Based
Materials: II. Influence of Water-to-Cement Ratio,” submitted to ASCE Journal of Materials in
Civil Engineering, 2007.
29) Cusson, D., “Effect of Blended Cements on Efficiency of Internal Curing of HPC,” ACI-SP,
Internal Curing of High-Performance Concretes: Laboratory and Field Experiences, American
Concrete Institute, Farmington Hills, MI, 2007.
30) Dhir, R.K., Limbachiya, M.C., McCarthy, M.J., and Chanipanich, A., “Evaluation of
Portland Limestone Cements for Use in Concrete Construction,” Materials and Structures, 40,
459-473, 2007.
31) Hartshorn, S.A., Sharp, J.H., and Swamy, R.N., “Thaumasite Formation in Portland-
Limestone Cement Pastes,” Cement and Concrete Research, 29 (8), 1331-1340, 1999.
32) Irassar, E.F., Bonavetti, V.L., Trezza, M.A., and Gonzalez, M.A., “Thaumasite Formation in
Limestone Filler Cements Exposed to Sodium Sulphate Solution at 20 ºC,” Cement and Concrete
Composites, 27 (1), 77-84, 2005.
23
24
1
2
33) Mehta, P.K., and Burrows, R.W., “Building Durable Structures in the 21st Century,”
Concrete International, 23, 57-63, 2001.