Economic Update - World Banksiteresources.worldbank.org/INTAFRICA/Resources/257994... · v This...
72
Economic Update THE WORLD BANK GROUP AFRICA REGION POVERTY REDUCTION & ECONOMIC MANAGEMENT JULY 2012 ISSUE 3 South Africa Focus on Inequality of Opportunity
-
Upload
vuongtuyen -
Category
Documents
-
view
213 -
download
0
Transcript of Economic Update - World Banksiteresources.worldbank.org/INTAFRICA/Resources/257994... · v This...

Economic UpdateTH
E W
OR
LD
BA
NK
GR
OU
P A
FRIC
A RE
GION
POVE
RTY
REDU
CTIO
N &
ECONO
MIC
MAN
AGEM
ENT
JULy
20
12
Is
sU
E 3
South Africa
Focus on Inequality of Opportunity
South Africa issue3 cover 0719.indd 1-2 7/19/12 5:27 PM

South Africa issue3 cover 0719.indd 3-4 7/19/12 5:27 PM

Economic UpdateSouth Africa
Focus on Inequality of Opportunity
© 2012 The International Bank for Reconstruction and Development/THE WORLD BANK1818 H Street NWWashington, DC 20433USA
All rights reserved
This report was prepared by the staff of the Africa Region Poverty Reduction and Economic Man-agement. The findings, interpretations, and conclusions expressed herein are those of the authors and do not necessarily reflect the views of the World Bank’s Board of Executive Directors or the countries they represent.
Photos by John Hogg/World Bank.
The report was designed, edited, and typeset by Communications Development Incorporated,Washington, DC.

iii
Acknowledgments vForeword vi
Executive summary vii
Section 1 Recent economic developments 1Global economic prospects 1Recent trends in South Africa 5Economic outlook for South Africa 11Risks to the outlook 12
Section 2 The state of human opportunity in South Africa 15Opportunities among children 18Inequality in labor market opportunities 30Conclusions 38
Annex A Illustrating the Human Opportunity Index with a simple example 41Annex B Three key properties of the Human Opportunity Index 42Annex C Estimating the Human Opportunity Index from household survey data 43Annex D Opportunities and circumstances for children 44Annex E Inequality in employment opportunities 46
Notes 47
References 53
Boxes2.1 The Human Opportunity Index 182.2 Measuring inequality of opportunity 232.3 Contrasting opportunities of three children 30
Figures1.1 Daily sovereign credit default swap rates since January 2010 11.2 South Africa has been an exception in the global equity market sell-off 21.3 Gross capital flows to developing regions have fallen 21.4 Global currency movements in May 31.5 Declining Purchasing Managers’ Indices indicate a manufacturing contraction 31.6 Commodity prices have declined as global economic uncertainty increases 51.7 Change in GDP growth, fiscal balance, and general government gross debt between 2007
and 2011 9
Contents

S o u t h A f r i c A E c o n o m i c U p d a t E — F o c U s o n i n E q U a l i t y o F o p p o r t U n i t y
iv
1.8 Core and headline Consumer Price Index inflation and Producer Price Index inflation, 2009–12 10
1.9 Current account, trade balance, and terms of trade, 2007–12 111.10 Bond and equity purchases by nonresidents 111.11 South Africa’s industrial production growth is highly correlated to developments in
Europe 131.12 Percentage deviation in GDP growth in 2012 from baseline in the event of a further
escalation in the Eurozone crisis 141.13 Commodity exporters to be hardest hit by a 20 percent decline in metal and mineral
prices 142.1 GDP per capita and the Gini index for consumption 152.2 Income sources by deciles 162.3 Growth incidence curves for South Africa, 1995–2005 162.4 School attendance (ages 10–14) 202.5 Finished primary school on time 212.6 Access to safe water on site 212.7 Access to improved sanitation 222.8 Access to electricity 222.9 D-Indices and HOIs for some key opportunities for South African children, 2010 232.10 Change in the HOI and decomposition of changes, 2002–10 242.11 Average annual change in the HOI for finishing primary school on time 252.12 Average annual change in the HOI for access to safe water on site 252.13 Average annual change in the HOI for access to improved sanitation 262.14 Average annual change in the HOI for access to electricity 262.15 Contribution of circumstances to overall inequality, 2010 272.16 Snapshot of the vulnerability profile 282.17 Inequality-adjusted coverage and inequality between groups differentiated by circumstances,
education, and age 322.18 D-Index and inequality-adjusted coverage by employment, circa 2008 332.19 Decomposition of sources of inequality 332.20 How circumstances contribute to inequality 342.21 Profiles of top quintile and bottom quintile by probability, 2012 342.22 D-Index and inequality-adjusted coverage by location, 2008 and 2012 352.23 Decomposition of sources of inequality, 2008 and 2012 352.24 Inequality-adjusted coverage and D-Index for workers of different age groups, 2008 and
2012 362.25 Decomposition of sources of inequality by age group 37
Tables1.1 The global outlook in summary 41.2 GDP growth by main sectors (gross value added), 2008–2012q1 61.3 Gross domestic expenditure growth by component, 2008–2012q1 71.4 Labor market transition matrices 81.5 Consolidated government fiscal framework, 2010/11–2014/15 91.6 Macroeconomic outlook, 2008–14 12D1 What constitutes opportunities for South African children? 44D2 What constitutes circumstances in the analysis of children’s opportunities? 45D3 HOI, D-Index, and coverage for 2002, 2005, and 2010 45E1 Definition of variables to measure “opportunities” in labor market 46E2 Definition of circumstances and characteristics in labor market 46

v
This edition was prepared by a core team com-prising Fernando Im and Sandeep Mahajan (Co-Task Team Leaders), Allen Dennis, Sailesh Tiwari, Alejandro Hoyos Suarez, Shabana Mitra, and Phindile Ngwenya. Ambar Narayan (Lead Economist, PRMPR) was a special guest co-author, leading the work on inequality of opportunity, the focus topic for this issue. Peer reviewers are John Newman (Lead Poverty Spe-cialist, SASEP) and Jose Molinas Vega (Senior Economist, LCSPP). The report was prepared under the overall guidance of Ruth Kagia and Asad Alam (respectively, former and current
Country Directors for South Africa) and John Panzer (Sector Manager, AFTP1).
The team is grateful for comments from Claus Astrup, McDonald Benjamin, Haroon Bhorat (University of Cape Town), Andrew Dabalen, Shantayanan Devarajan, Quy-Toan Do, Patrick Kabuya, Jose Antonio Leiva, Gladys Lopez-Acevedo, Konstantin Makrelov (National Treasury), Jaime Saavedra, Philip Schuler, Marco Scuriatti, and Simi Siwisa.
A team at Communications Development Incorporated, led by Bruce Ross-Larson, edited, proofread, and laid out the report.
Acknowledgments

The World Bank is pleased to present the third South Africa Economic Update, with a focus on inequality of opportunity.
In keeping with the earlier format, the report has two parts. Section 1 provides an eco-nomic update and assesses the challenges and near-term prospects facing the South African economy. In particular, it looks at the impli-cations for South Africa of the resurgence of uncertainty in global financial markets, the surge in capital flows to safe-haven assets, the continuing Eurozone crisis, and signs of slow-down in some of the large emerging market economies.
Section 2 focuses on inequality of opportu-nity in South Africa. For the first time, using innovative techniques, this section presents an analysis of the interlinked inequality of oppor-tunities for children and for access to employ-ment. Every society has a degree of inequality
of outcomes that reflects differences in innate human capabilities, effort, education, experi-ence, and skills. But a recognized goal for pub-lic policy is to ensure at least the equality of opportunity for every individual in a country. Many countries have used this new approach to develop targeted policies to promote such equality of opportunity and to monitor and evaluate the success of public programs.
We hope that the evidence-based analysis presented here will promote debate and spur new thinking on how the challenge of high inequality can be addressed in South Africa, and how the lives of all of its people can be improved.
Asad AlamCountry Director for South Africa
The World Bank
Foreword
vi

vii
World GDP growth is set to fall from 2.7 percent in 2011 to 2.5 percent in 2012, with a sharper decline projected in developing countries. The turmoil of recent months is estimated to have knocked 0.2 percentage points from the annual growth in the Eurozone, now projected to contract 0.3 percent this year. Growth is expected to slow by close to 2 percentage points in both China and India and hold at just under 3 percent in Brazil. These drags on growth are expected to ease somewhat, and global growth should strengthen during 2013 and 2014. Even so, both developing country and high-income country GDP will grow less quickly than during this century’s precrisis years.
South Africa’s GDP growth, which showed nascent signs of strengthening in the latter part of 2011, could not maintain the momen-tum. The slowdown in 2012q1 was under-pinned by a sharp decline in mining output and an almost across-the-board growth slow-down in services (finance being the excep-tion). These more than offset the marked pickup in manufacturing and a turnaround in agriculture, which posted its first growth in five quarters. The manufacturing pickup—striking given the weak economic outlook of the Eurozone, South Africa’s largest des-tination for manufacturing exports—likely reflected the recovery that began in 2011q4 following a sharp decline in the preceding two quarters because of industrial action in mid-2011: 2012q1 output was only 0.4 percent higher than in 2011q1. Manufacturing, min-ing, and agriculture production remains below
precrisis 2008 levels, indicating only partial recovery in these sectors.
Against the prospects of a noticeably weaker global economy than envisaged at the time of the November 2011 Economic Update, medium-term growth projections for South Africa have been revised downward. GDP growth is projected at 2.5 percent in 2012, lower than the 3.1 percent forecast in the Novem-ber 2011 update and the 2.7 percent forecast in the 2012 Budget. The main reason for the lower projection is the further slowdown in the European Union and in China, the two main export destinations for South Africa. An eas-ing of global financial market tensions would contribute to a pickup in global demand, which should support gradual acceleration of growth in South Africa toward its potential of 3.5 percent. An important constraint on a faster pickup in growth is likely to be bottlenecks in electricity supply, which is already rubbing against peak demand.
The major downside risks remain tied to how the situation in Europe unfolds. Europe is South Africa’s largest export market, so industrial production growth in the two econ-omies is strongly correlated. The form that an escalation of the crisis might take in the cur-rent economic context, if one occurs, is very uncertain—partly because it is impossible to predict what exactly might trigger it, and partly because the powerful forces unleashed could easily take a route very different from the one foreseen by standard economic reasoning.
Executive summary

S o u t h A f r i c A E c o n o m i c U p d a t E — F o c U s o n i n E q U a l i t y o F o p p o r t U n i t y
viii
Lower commodity prices present another downside risk. With much of the recent increase in commodity prices driven by strong demand from Asia (particularly China), a cooling of the Chinese economy beyond pro-jections, coupled with weak demand from Europe, would dampen commodity prices, hit-ting South Africa’s growth prospects. Of devel-oping countries, South Africa would be among the 10 countries to be hit most by the drop in commodity prices. Indeed, simulation results show GDP growth to fall by some 1.7 percent-age points.
An upside risk for South Africa and other developing countries is the possibility of a stronger recovery in global demand than embedded in the current baseline. While less likely, this could come from an improvement in market sentiment, perhaps due to additional progress on the reform agenda or to better-than-anticipated outturns in high-income countries. For developing countries such as South Africa where some postcrisis slack remains, a stronger than expected recovery in demand could be absorbed fairly easily and converted into improved living conditions and lower unemployment.
The state of human opportunity in South AfricaWhile GDP growth—if modest by global com-parisons—has averaged a credible 3.2 percent a year since 1995 (1.6 percent per capita), it has proven insufficient to absorb the wave of new entrants to the labor market from dismantling apartheid’s barriers. The potential for growth has been held back by industrial concentration, skill shortages, labor market rigidities, and chronically low savings and investment rates—the latter, despite the fairly high and improving rates of return to capital.
Growth has also been highly uneven in its distribution, perpetuating inequality and exclusion. With an income Gini of around 0.70 in 2008 and consumption Gini of 0.63 in 2009, South Africa stands as one of the most unequal countries in the world. The top decile of the population accounts for 58 percent of the coun-try’s income, while the bottom decile accounts for 0.5 percent and the bottom half less than 8 percent. In large part, this is an enduring
legacy of the apartheid system, which denied the non-whites (especially Africans) the chance to accumulate capital in any form—land, finance, skills, education, or social networks.
At the heart of high inequality lies the inabil-ity to create employment opportunities on a large enough scale. Unemployment stands at 25.2 percent (33.0 percent, including “discour-aged” workers), among the world’s highest. No surprise then that despite an almost 30 percent increase in per capita GDP since the late 1990s, reductions in poverty have been modest at best.
This would have been untenable without the growing social assistance grants. Noncontribu-tory and means-tested (except for foster care) financial transfers from the budget account for more than 70 percent of the income of the bot-tom quintile (up from 15 percent in 1993 and 29 percent in 2000). With the social grants, the entire spectrum of population ranked by income percentiles saw income growth between 1995 and 2005. But without the grants as part of income, those below the 40th percentile saw a significant decline in their income. In other words, without the grants, two-fifths of the population would have seen its income decline in the first decade after apartheid.
Even after accounting for the equalizing role of social assistance, income inequality remains extraordinarily high. To reduce it to more reasonable levels over the long run, social assistance is clearly not enough and needs to be complemented by other initiatives. These would include a special focus on human capital development, particularly among children and youths.
Social consensus and policy action can become more likely when the sources of inequality are decomposed and the issue is framed around the notion of equity rather than equality. A girl (let’s call her Thandiwe) born in the township of Tembisa outside Johannesburg to a single, uneducated mother earning R2,000 a month and with four other siblings should have an equal shot at becoming a doctor or an engineer as a boy (let’s call him Andries) with one sibling, born in a two-parent household in Sandton, Johannesburg. And so should a girl (let’s call her Nothando), born in a family with similar characteristics as Thandiwe’s, but living in the rural area of Eshowe in Kwa-Zulu Natal.
Growth has also
been highly uneven
in its distribution,
perpetuating
inequality and
exclusion
ix
Opportunities among
children in South
Africa vary widely
across different types
of goods and services
What would it take to equalize Nothando’s, Thandiwe’s, and Andries’s chances of success in life? Ample research shows that access to a basic set of goods and services during child-hood can be an important (if far from perfect) predictor of future outcomes, including edu-cation achievements and earnings. Access to quality basic services such as education, health care, essential infrastructure (like water, sani-tation, and electricity), and early childhood development provides an individual, irrespec-tive of background, the opportunity to advance and reach his or her human potential.
Analyzing such opportunities for children in South Africa can help better understand the nature and causes of inequality of outcomes observed among adults. Opportunities among children can also be reliable predictors of eco-nomic mobility across generations and over time. For instance, if access to economic oppor-tunities, in the form of jobs (and earnings), credit, and ownership of land and financial assets is correlated with the circumstances of an individual (such as race and location of resi-dence), it reinforces the link between children’s circumstances and their opportunities in life.
Opportunities among children Basic opportunities are defined here as a sub-set of goods and services for children, such as access to education, safe water on site, or elec-tricity, that are critical in determining opportu-nities for economic advancement in life. These either are already affordable by society at large, or could be in the near future, given the avail-able technology. Universal provision of basic opportunities is a valid and realistic social goal.
Opportunities among children are mea-sured in this report by the Human Opportu-nity Index (HOI), which is the coverage rate of a particular basic service adjusted by how equi-tably the service is distributed among groups differentiated by circumstances. In discount-ing inequitable access, the HOI reflects how personal circumstances—for which children cannot be held accountable—affect their basic opportunities. This means that two societies with the same coverage rate for any service can have different HOIs if citizen access to that ser-vice in one society is determined to a greater extent by gender, race, family background, or
any other personal circumstance beyond their control and considered by society to be an unjust source of exclusion.
For South Africa, the circumstances are per-sonal and family-related: gender of the child; ethnicity; household composition—presence of the spouse of the household head in the house-hold, total number of children ages 0–16 in the household, and whether both parents live in the household; education of the household head; other household head characteristics—gender and age of the head; orphan status—whether both parents are alive; and location of the household—urban townships, informal settlements, other urban areas, or rural areas. Note that, in covering the townships and infor-mal settlements, a broad brush overlooks their remarkable variety in size, population density, length of time since establishment, rural or urban location, and distance from major urban centers.
The opportunities considered are those that enable South African children to realize their productive potential directly, by enhanc-ing their human capital and creating a safe phsyical environment, and indirectly, by pro-viding access to infrastructure amenities that help ensure a decent quality of life and facili-tate the accumulation of human capital. The human development component of opportu-nities comprises exposure to early childhood development programs (children ages 0–4 years), school enrollment (at ages 6–11 years and 12–15 years), timely completion of primary school (ages 13–15), adequacy of school infra-structure and teachers (as reported by parents), and having health insurance.
The main findings. Opportunities among chil-dren in South Africa vary widely across dif-ferent types of goods and services. Some opportunities, such as school attendance for children under age 16 and access to telecom-munications, are nearly universal with an HOI above 90 percent. Others are well below uni-versal (an HOI of around 60 percent or below) and distributed with high inequality among children of different circumstances, as for hav-ing health insurance, access to safe water on site and improved sanitation, and adequate space without overcrowding—and finishing

S o u t h A f r i c A E c o n o m i c U p d a t E — F o c U s o n i n E q U a l i t y o F o p p o r t U n i t y
x
Close to 70 percent
of the bottom
income quintile was
unemployed in 2008
primary school (13–15-year-olds). Still, other opportunities—such as access to ECD pro-grams, safety in the neighborhood, and access to electricity—are well below universal, but have low to moderate inequality attributable to circumstances.
In international comparisons, South Africa fares well on school attendance but ranks below most comparators on the HOI for com-pleting primary school on time and access to safe water on site, improved sanitation, and even electricity. Trends suggest improvements, but the gaps with other countries are generally not closing. Except for electricity, where South Africa’s average annual progress has been exceptional, the progress on the other four dimensions puts it in the bottom half of inter-national comparators.
Inequality of opportunity among children in South Africa is shaped to a varying degree by different types of circumstances. Whether a child lives in a township/informal settlement or a rural area as opposed to other urban area, and education of the household head con-tribute the most to inequality of opportunity in most cases where inequality is moderate or high. Location is particularly important for opportunities related to infrastructure; and education of the household head contribute the most to inequality in finishing primary school on time and having health insurance, underscoring the lock of the family’s socio-economic background on children’s future. Gender of the child contributes appreciably to inequality only in finishing primary school on time. Ethnicity contributes to inequality in all opportunities, but does not rank among the top two contributors for any. This implies not that race- and gender-based disparities are not important, but that race and gender are not the most important factors by themselves when the role of other circumstances (some corre-lated to race and gender in the first place) are taken into account.
The overall picture is therefore mixed. On the positive side, South Africa has achieved near-universal access to primary education, a necessary first step for equalizing opportunities among children and an important success for the education system to build on. The meteoric rise in access to telecommunications—from
an HOI of around 30 in 2002 to more than 90 in 2010—and a big increase in the HOI for electricity are other milestones in improving opportunities for children in South Africa.
Major challenges are the limited and unequal access to safe water on site and improved sanitation and the opportunity to finish primary school on time or be exposed to ECD programs, along with the general lack of physical safety—all of which create the con-ditions for children to develop their human potential. The research literature is rich with evidence linking childhood opportunities to future success. Preschoolers with low cognitive development have lower school achievement and earn lower wages in adulthood. And early childhood education has substantial long-term impacts, ranging from adult earnings to retirement savings. Access to safe water and improved sanitation are particularly critical inputs for child health, a determinant of nutri-tion status.
Inequality in labor market opportunitiesThe ability of individuals to find jobs com-mensurate with their qualifications—irrespec-tive of circumstances—is crucial for economic mobility and reductions in inequality. This is especially true in South Africa, with its chroni-cally high unemployment. Two key facts bring out the impact of exclusion from labor markets on income inequality in South Africa. First, close to 70 percent of the bottom income quin-tile was unemployed in 2008. Second, even those employed face sharp disparities in wage earnings based on race, gender, location, and union membership.
In analyzing inequality in labor market sta-tus and its links to individual circumstances, this section uses a modified version of the approach in the previous section. The analysis here provides a rough but nonetheless intui-tive measure of the inequality between groups of working-age adults differentiated by various attributes. It allows an assessment of the contri-bution of circumstances (as opposed to that of acquired or innate characteristics such as edu-cation and age) to inequality between groups in the labor market.
Three definitions of a desirable employment status are used for the analysis. Working-age

xi
The employment
situation appears
to be particularly
challenging for
young workers and
residents of townships,
informal settlements,
and rural areas
adults (ages 15–64) are considered to have desirable employment if they: • Have a job (any job), as opposed to being
unemployed or discouraged from seeking employment.
• Are employed full-time, as opposed to being unemployed, underemployed, or discouraged.
• Are employed in the formal nonagricultural sector, as opposed to being employed in the informal sector outside agriculture. The first two definitions are closely aligned
with the common notions of unemployment and underemployment. The third definition is restricted to a sample of only those who are employed in the nonagricultural sector.
Two types of individual attributes are con-sidered: circumstances (gender, ethnicity, and location—urban township and informal settle-ments, other urban, or rural) and characteris-tics (education and age of the worker). Unlike gender and ethnicity, location is somewhat debatable as a circumstance because working-age individuals have some control over where they live. In practice, however, spatial mobility is restricted by cost considerations, (lack of) social networks, and cultural and family ties. In South Africa particularly, mobility out of rural areas and townships and informal settlements is fairly restricted because of historical reasons, most affecting the poorest.
The list of circumstances is shorter than that for children because of data constraints, such as the lack of information about paren-tal characteristics for working-age adults. The characteristics of education and age of the indi-vidual are included as (imperfect) measures of acquired qualifications and experience. The contribution of circumstances to inequal-ity would indicate the extent of inequality of opportunity in the labor market—the part of inequality, produced by conditions in the labor market, which is not explained by qualifica-tions acquired by the individual.
The main findings. Given its high unemployment rates, it is not surprising that South Africa does much worse on labor market opportunities than other middle-income countries. It is still interesting and telling, however, that its rela-tive performance is explained not only by too
few jobs, but also by the inequality that persists between different groups in their access to these few jobs. Reflecting the adverse effects of the global financial crisis, the inequality-adjusted coverage fell for finding employment between the first quarters of 2008 and 2012. In part, this reflected fewer supply of jobs on account of the global crisis. But this was also because of a rise in inequality between groups, which cannot be attributed to the global crisis.
The causes of inequality in labor markets have changed in the past four years. The con-tribution of education has increased, while that of circumstances of gender and ethnicity has fallen slightly. Where a person seeking employ-ment lives, however, matters more now than it did four years ago.
The rising importance of education carries its own challenges: the disadvantages conferred by unequal opportunities in education earlier in life are an increasingly consequential stum-bling block to the social and economic mobility of individuals, for whom having a job is crucial. For employment in the formal sector outside agriculture, a measure of quality jobs with some stability, education accounts for more than half the inequality in employment, the contribution having risen 8 percentage points in four years. The particularly strong impact of education on the likelihood of having a for-mal sector job points to a high and rising skills premium in the labor market, confirming find-ings in the literature. The wage inequality from the skills premium is a key driver of income inequality in South Africa.
The employment situation appears to be particularly challenging for young workers and residents of townships, informal settle-ments, and rural areas. An individual’s age is an unusually large contributor to inequality in employment in South Africa, more than for many other middle-income countries, with the odds increasingly stacked against the youngest workers. Inequality of opportunity, the part of inequality attributable to circumstances that an individual has little or no control over, is also higher among young workers than among older workers. Thus not only do young workers face a disadvantage in the labor market due to their age, they also compete for jobs in a market seemingly more “unfair” in allocating

S o u t h A f r i c A E c o n o m i c U p d a t E — F o c U s o n i n E q U a l i t y o F o p p o r t U n i t y
xii
The presence of
multiple deprivations
points to the need
for policy programs
in different sectors
(health and education,
for example) to
coordinate closely
opportunities among the young: a young per-son’s chances of having a job, a full-time job or formal sector job, seem to depend more on cir-cumstances beyond their control than the skills they have acquired.
In addition to being young and living in cer-tain locations, being a woman and non-white still matters, increasing the likelihood of being unemployed or underemployed significantly (over and above any impact of these attributes on education).
In some ways, the contributions of specific circumstances to inequality in the labor mar-ket (like race and location) could be overstated here, since circumstances related to parental socioeconomic background, which are likely to be correlated with these attributes, are missing from the analysis due to a lack of data. With-out clear evidence, the contributions of race and location are best interpreted as reflect-ing socioeconomic factors, including (but not exclusively) race and location, in explaining inequality in the labor market.
ConclusionsAn equitable society would not allow circum-stances over which the individual has no con-trol to influence her or his basic opportunities after birth. Whether a person is born a boy or a girl, black or white, in a township or leafy suburb, to an educated and well-off parent or otherwise should not be relevant to reaching his or her full potential: ideally, only the per-son’s effort, innate talent, choices in life, and, to an extent, sheer luck, would be the influ-encing forces. This is at the core of the equal-ity of opportunity principle, which provides a powerful platform for the formulation of social and economic policy—one of the rare policy goals on which a political consensus is easier to achieve.
As with any other policy, an intuitive and objective measure of progress is crucial. The development of the human opportunity index, extensively presented in this report for various childhood and employment related opportu-nities, has helped fulfill this requirement for the equality of opportunity objective. Together with a robust data gathering and monitor-ing and evaluation system, the HOI can help improve the targeting and efficacy of social
policy. Making use of it, a number of coun-tries in Latin America, including Brazil and Peru, have begun confronting their inherent inequalities with proactive and increasingly well-targeted social policies, with positive ini-tial results. South Africa, with its entrenched inequality inextricably linked to its people’s varied circumstances, has a chance to forge a similar path of policy correction.
Extraneous circumstances that a child is born into (ethnicity, location, gender, and family background) were found in this report to variably affect the child’s access to basic opportunities in South Africa. Moreover, some of the circumstances (location and eth-nicity in particular) are also important for inequality in employment opportunities later in the child’s life. This raises the prospect of a vicious cycle of adverse circumstances that compounds inequalities over multiple stages in life, and over the lives of multiple genera-tions. A rural black African girl, for example, growing up with far fewer opportunities to develop to her full potential is also less likely to find employment opportunities as a young adult. Put differently, the child with disadvan-tageous circumstances not only has to work harder to overcome the disadvantages, but having done so, finds that these reemerge when seeking employment as an adult. More-over, the disadvantages do not stop with one person—they get transmitted across generations.
How to break through this vicious, self-per-petuating cycle of inequality in South Africa? To be sure, that would involve leveling the play-ing field in the quality of education children get and the employment opportunities they face as young adults, irrespective of location, gender, or ethnicity. Paying special attention to the water, sanitation, and health care needs of rural areas and townships, and overcrowding in townships would also be important.
Policy design needs to recognize that chil-dren of certain circumstances are vulnerable to deprivations in multiple dimensions simul-taneously. For example, black South Africans living in rural areas, and with household heads who did not complete primary schooling, are much more likely not to complete primary school, be exposed to an ECD program, or
xiii
have access to health insurance. The presence of multiple deprivations points to the need for policy programs in different sectors (health and education, for example) to coordinate closely in order to achieve better efficiency and the best results.
Of course, there are no simple, elegant pol-icy solutions in the quest for equity. One impor-tant lesson from international experience is
that a dynamic system involving policy experi-mentation (from incentives for training and hiring of young workers to monitorable and incentive-based delivery of public services), backed by rigorous impact evaluation and greater participation of communities in the actual delivery of basic public service delivery and in the feedback loops for policymakers, is crucial.


1
SECTION 1
Recent economic developments
Global economic prospectsThe resurgence of uncertainty in global finan-cial markets that began in early May 2012 has dampened the nascent global economic recovery shaping up in the first four months of the year.1 The renewed market nervousness, which has since subsided, caused the price of risk to spike upward globally. Signs of slowdown in the large emerging market economies, particularly China, also contributed to the global economic distress. Large-scale deleveraging of western banks and ongoing fiscal consolidation in high-income countries further add to the global headwinds that will moderate growth. Significantly, the large emerging market economies have greatly compressed macroeconomic policy space to buf-fer the latest round of external shocks.
Increased Eurozone jitters have reversed earlier improvements in market sentimentMarkets have been in heightened turmoil since early May. First, tensions rose sharply, sparked by fiscal slippages, banking downgrades, and political uncertainties in the Eurozone, where measures of financial market tension, such as credit default swap rates, rose close to their peaks in the fall of 2011 (figure 1.1). Some calm was then restored with coordinated action by EU governments to provide relief to undercapitalized banks and debt-laden member states. Credit default swap rates for most developing countries followed a similar pattern.
Global equities suffered a sharp sell-off in May and June (South Africa being a notable
Figure Daily sovereign credit default swap rates since January 2010
1.1
0
100
200
300
400
500
July2012
Jan.2012
July2011
Jan.2011
July2010
Jan.2010
East Asia & Paci�c Europe & Central AsiaLatin America & Caribbean Middle East & North Africa
Basi
s po
ints
Source: World Bank DEC Prospects Group; Datastream.

S o u t h A f r i c A E c o n o m i c U p d a t E — F o c U s o n i n E q U a l i t y o F o p p o r t U n i t y
2
Capital flows to
developing countries
picked up slightly
in June after falling
sharply in May
due to renewed
Eurozone tensions
exception), wiping out $5.9 trillion in valua-tion, giving up almost all of the gains over the preceding four months (figure 1.2). With a flight to safety amid heightened risk aversion, yields on high-spread economies have been driven up, while those of safe-haven assets declined.
Capital flows to developing countries picked up slightly in June after falling sharply in May due to renewed Eurozone tensions. Gross capi-tal f lows to developing countries fell 45 per-cent in May from the previous month. Bond issuance by developing countries declined most, largely due to a 62 percent (m/m) drop in corporate borrowing (figure 1.3).2 Equity placements fell to $5.3 billion in May on lower activity in China and Brazil. Year-to-date equity
f lows were down 36 percent in May, as the number of IPO deals in the first five months of the year fell to 43 (raising $5.4 billion) from 79 ($17.4 billion) in the previous year. Overall bank lending remains subdued, but it has been surprisingly resilient in recent months despite rising external market volatility and deleverag-ing. Capital flows over the first six months of the year were 23 percent below the same period in 2011.
A surge in capital flows to safe-haven assets caused the U.S. dollar to appreciate sharply against most other currencies in May (figure 1.4). But much of the change reflects a strong dollar, not weak local currencies. For example, in May the euro fell 6.6 percent against the dol-lar, but on a trade-weighted basis it fell only
Figure Gross capital f lows to developing regions have fallen
1.3
0
20
40
60
June2012
Jan.2012
June2011
Jan.2011
Perc
ent
Equities (new issues) Syndicated bank lending Bond issuance Total �ows
Note: Bars represent two-month moving averages of reported flows. Line shows raw unsmoothed data for the total of those flows. Source: Dealogic; World Bank DEC Prospects Group.
Figure South Africa has been an exception in the global equity market sell-off
1.2
–10
0
10
20
SouthAfrica
JapanGermanyUnitedStates
Maturemarkets
BRICsEmergingmarkets
Perc
ent
Year to date Q1 Q2
Source: Bloomberg data.

3
Industrial production
has weakened and
business confidence
has taken a beating
since the start of
the second quarter
3 percent. Overall, developing country curren-cies fell about 2.9 percent in nominal effective terms (about 40 percent of their depreciation against the dollar), with commodity exporters down about 3.6 percent, against 2.5 percent for countries not relying heavily on commodity exports.
While financial market turmoil has receded somewhat in recent weeks, progress has been slow in addressing some of the underlying problems of the Eurozone. The lack (or slow pace) of fiscal convergence, the competitive-ness differentials across countries of the com-mon currency area, and the need to contain sovereign country borrowing costs to guaran-tee debt sustainability in the medium and long runs remain the main unresolved challenges.
Renewed tensions will add to headwinds and keep global GDP gains modestIndustrial production has weakened and busi-ness confidence has taken a beating since the start of the second quarter. Global industrial production decelerated to 2.1 percent annual-ized growth in May compared with 7.8 percent in the previous month; industrial production in the Eurozone fell 7 percent in May. The global Purchasing Managers’ Index (PMI) descended into sub-50 territory, suggesting that global man-ufacturing output shrank in June, with all eco-nomic regions weakening (except China, whose official PMI improved slightly; figure 1.5). The decline in sentiment is consistent with a scenario where firms and consumers are holding back on spending because of greater uncertainty.
Figure Global currency movements in May
1.4
0 3 6 9 12 15Poland
NamibiaRussian Federation
New ZealandSouth Africa
HungaryMexico
IndiaGermany
CroatiaChile
BotswanaBrazil
BulgariaSwaziland
SpainSweden
SwitzerlandItaly
Local currency unit/US$ Nominal effective exchange rate
Source: World Bank DEC Prospects Group.
Figure Declining Purchasing Managers’ Indices indicate a manufacturing contraction
1.5
40
45
50
55
60
June2012
May2012
Apr.2012
Mar.2012
Feb.2012
Jan.2012
Dec.2011
Nov.2011
Oct.2011
Sep.2011
Aug.2011
Jul.2011
June2011
May2011
Apr.2011
Mar.2011
Feb.2011
Jan.2011
China (of�cial) South Africa EurozoneOther developing countries Other high-income countries
Purc
hasi
ng M
anag
ers’
Inde
x
Note: A Purchasing Managers’ Index greater than 50 implies expansion.Source: Haver Analytics; Markit; World Bank DEC Prospects Group.

S o u t h A f r i c A E c o n o m i c U p d a t E — F o c U s o n i n E q U a l i t y o F o p p o r t U n i t y
4
Both developing
country and high-
income country
GDP will grow less
quickly than during
this century’s
precrisis years
The fresh worries, emanating mostly from the unresolved sovereign debt and banking crises in Europe, are exacerbated by signs of slowdown in the large emerging market econ-omies, particularly China, that have run up against capacity constraints and have much more limited macroeconomic policy space to counter external shocks than at the start of the global financial crisis.3 Large-scale deleverag-ing of western banks and ongoing fiscal con-solidation in high-income countries further add to the global headwinds that will moder-ate growth.
World GDP growth is set to fall from 2.7 percent in 2011 (and 4.0 percent in 2010) to
2.5 percent in 2012, with a sharper decline projected in developing countries (table 1.1). The turmoil of recent months is estimated to have knocked 0.2 percentage points from the annual growth in the Eurozone, now pro-jected to contract 0.3 percent this year. Growth is expected to slow by close to 2 percentage points in both China and India and hold at just under 3 percent in Brazil (compared with 7.5 percent in 2010). These drags on growth are expected to ease somewhat, and global growth should strengthen during 2013 and 2014. Even so, both developing country and high-income country GDP will grow less quickly than during this century’s precrisis years.
Table The global outlook in summary
1.1 (percent change from previous year, unless otherwise indicated)
Indicator 2010 2011 2012f 2013f 2014f
Global conditions
World trade volume (GNFS) 13.0 6.1 5.3 7.0 7.7
Consumer prices
G-7 countriesa,b 1.2 2.4 1.9 1.8 2.0
Commodity prices (US$ terms)
Nonoil commodities 22.5 20.7 –8.5 –2.2 –3.1
Oil price (US$ per barrel)c 79.0 104.0 106.6 103.0 102.4
Oil price (percent change) 28.0 31.6 2.5 –3.4 –0.6
Manufactures unit export valued 3.3 8.9 0.9 1.2 1.5
Interest rates
US$, 6-month (percent) 0.5 0.5 0.7 0.8 1.1
€, 6-month (percent) 1.0 1.6 1.0 1.1 1.4
Real GDP growthe
World 4.1 2.7 2.5 3.0 3.3
Memo item: worldf 5.1 3.7 3.3 3.9 4.2
High income 3.0 1.6 1.4 1.9 2.3
OECD countries 2.9 1.4 1.3 1.8 2.2
Eurozone 1.8 1.6 –0.3 0.7 1.4
Japan 4.5 –0.7 2.4 1.5 1.5
United States 3.0 1.7 2.1 2.4 2.8
Non-OECD countries 7.4 4.8 3.6 4.3 4.1
Developing countries 7.4 6.1 5.3 5.9 6.0
Sub-Saharan Africa 5.0 4.7 5.0 5.3 5.2
South Africa 2.9 3.1 2.5 3.2 3.5
Memorandum items
Developing countries
Excluding transition countries 7.8 6.4 5.5 6.1 6.2
Excluding China and India 5.6 4.4 3.6 4.3 4.5
PPP = power purchasing parity; f = forecast.a. Canada, France, Germany, Italy, Japan, the United Kingdom, and the United States.b. In local currency, aggregated using 2005 GDP weights.c. Simple average of Dubai, Brent, and West Texas Intermediate.d. Unit value index of manufactured exports from major economies, expressed in U.S. dollars.e. Aggregate growth rates calculated using constant 2005 dollars GDP weights.f. Calculated using 2005 PPP weights.Source: World Bank.

5
GDP growth, which
showed nascent signs
of strengthening in the
latter part of 2011,
could not maintain
the momentum
If global conditions deteriorate, developing countries will be hit hard and are unlikely to bounce back as quickly as they did from the 2008/09 crisis. Although a resolution of the tensions implicit in the baseline is still the most likely outcome, a sharp deterioration of condi-tions cannot be ruled out. While the precise nature of such a scenario is difficult to predict, developing countries could be expected to take a large hit. Simulations at the World Bank sug-gest that developing country GDP could decline relative to baseline by more than 4 percentage points in some regions, with commodity prices, remittances, tourism, trade, finance, and inter-national business confidence all mechanisms for transmitting the tribulations of the high-income world to developing countries. (The possible impact on South Africa is discussed in the risks to the outlook section.)
Commodity prices have softened as global economic uncertainty increasedEurozone tensions and global growth con-cerns have added to the downward pressure on commodity prices. After strengthening in the first quarter of 2012, most commodity prices have since retreated below their end-2011 lev-els (figure 1.6). The fall of prices was particu-larly sharp in May as the European debt crisis intensified and China’s growth slowed. The initial easing in prices occurred even as global economic activity was firming, but it has been accentuated with financial market tensions and weak growth expectations. As of July 3,
international crude oil prices were $25 lower than their first quarter highs, and copper and aluminum prices were down 10 percent and 16 percent, respectively. Food prices fell less due to tightness in edible oils and to weather con-cerns. Part of the recent decline in commodity prices also reflects the appreciation of the U.S. dollar.
Recent trends in South Africa
Fragile growth momentumGDP growth, which showed nascent signs of strengthening in the latter part of 2011, could not maintain the momentum. The slowdown in 2012q1 was underpinned by a sharp decline in mining output and an almost across-the-board growth slowdown in ser-vices (finance being the exception; table 1.2). These more than offset the marked pickup in manufacturing and a turnaround in agri-culture, which posted its first growth in five quarters. The manufacturing pickup—strik-ing given the weak economic outlook of the Eurozone, South Africa’s largest destination for manufacturing exports—likely reflected the recovery that began in 2011q4 following a sharp decline in the preceding two quar-ters because of industrial action in mid-2011: 2012q1 output was only 0.4 percent higher than in 2011q1. Mining activity was affected by industrial action, safety stoppages, weak exter-nal demand, and electricity demand manage-ment drive by Eskom.4 A doubling of growth
Figure Commodity prices have declined as global economic uncertainty increases
1.6
0
50
100
150
200
250
Jan.2012
Jan.2011
Jan.2010
Jan.2009
Jan.2008
Jan.2007
Jan.2006
Jan.2005
Agriculture Energy Metals and minerals
US$
pri
ces
(200
5 =
100
)
Source: World Bank.

S o u t h A f r i c A E c o n o m i c U p d a t E — F o c U s o n i n E q U a l i t y o F o p p o r t U n i t y
6
Manufacturing, the
mainstay of growth
in the first quarter,
appears to be faltering
in construction (3.8 percent q/q seasonally adjusted annual rate, or saar) also contributed to the robust economic performance posted by the secondary sector. Manufacturing, mining, and agriculture production remains below precrisis 2008 levels, indicating only partial recovery in these sectors.
More recent output trends exhibit growing vulnerabilities of the real economy. Manu-facturing, the mainstay of growth in the first quarter, appears to be faltering, as reflected in June’s 5.4 point decline in the PMI to 48.2, its lowest value since August 2011. A below-50 rat-ing usually reflects contraction in the sector. In addition to the weaker external demand, the decline in the PMI also reflects softening domestic demand, highlighted by a sharp 10 percent decline in the new sales orders compo-nent of the PMI. The global growth concerns noted earlier do not bode well for commodity prices or mining prospects (see section on risks to the outlook).
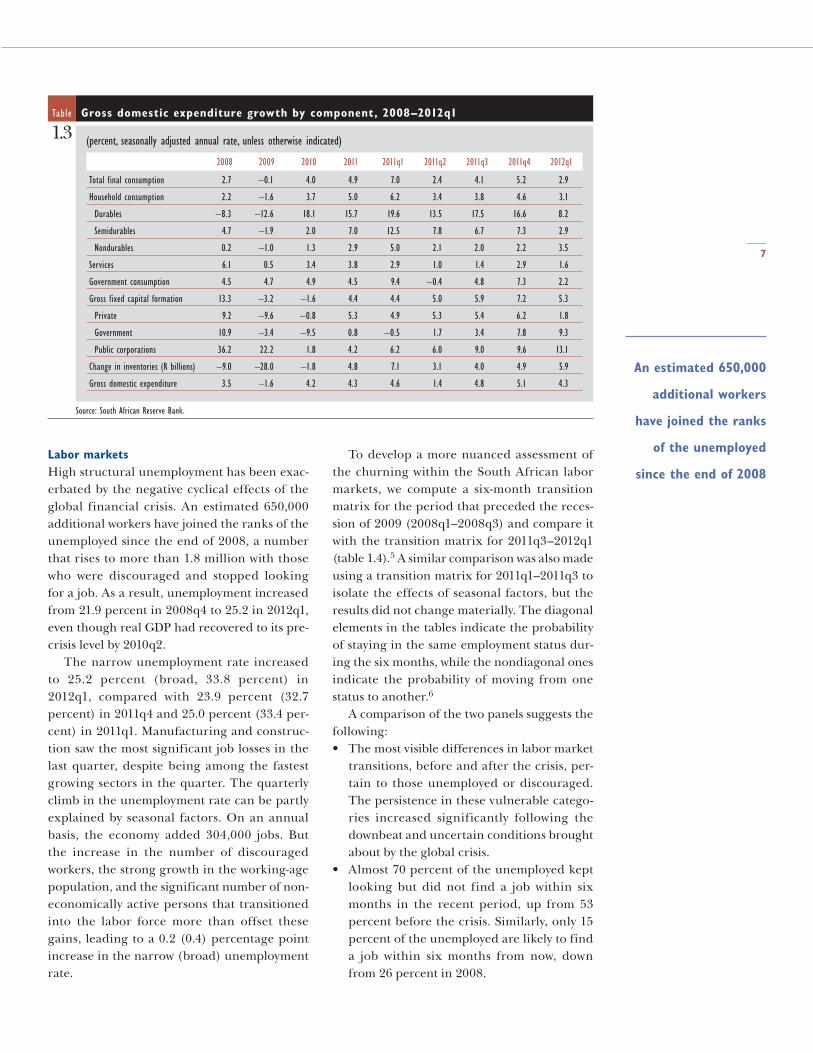
Gross domestic expenditure growth mod-erated to 4.3 percent q/q saar in 2012q1, as final consumption and investment expendi-ture posted slower rates of increase (table 1.3). Household consumption expenditure growth fell fractionally short of the growth of real household disposable income, resulting in a marginal fall in the ratio of household debt
to disposable income (to 74.7 percent). Stag-nant employment prospects (see next section) and the negative effects of the global situation on consumer confidence, purchasing power (potentially through the exchange rate and headline inf lation), and household wealth (through asset and housing prices) are likely to weigh on consumer purchasing decisions mov-ing forward. This can be already observed in the moderation in retail sales and the sharp plunge in business confidence in the retail sec-tor (from 61 in 2011q1 to 39 in 2012q2, accord-ing to the RMB/BER Business Confidence Index).
Gross fixed capital formation remained strong despite losing some momentum in 2012q1. There were wide variations among the different components, as the increase in the growth of capital outlays by the government and public corporations (mainly by Eskom and Transnet) partly buffered the steep slowdown of capital formation by private enterprises. Moreover, the bleak global economic out-look, the recent downward trend in commod-ity prices, the fragile nature of the domestic economic recovery, and the drop in business confidence signal little hope for a surge in investment, especially since capacity utilization in the manufacturing sector is still below pre-crisis levels.
Table GDP growth by main sectors (gross value added), 2008–2012q1
1.2 (percent, seasonally adjusted annual rate)
2008 2009 2010 2011 2011q1 2011q2 2011q3 2011q4 2012q1
Primary sector –0.1 –4.2 4.0 0.0 –4.7 –6.0 –14.7 –1.0 –11.2
Agriculture 16.1 –1.5 0.5 –0.4 –4.8 –9.5 –6.9 –5.0 3.4
Mining –5.6 –5.4 5.5 0.2 –4.6 –4.5 –17.8 0.7 –16.8
Secondary sector 2.9 –6.9 4.3 2.1 10.1 –6.5 –0.5 3.5 6.4
Manufacturing 2.6 –10.1 5.4 2.4 12.8 –8.8 –0.7 4.2 7.7
Electricity –3.1 –1.4 1.7 1.3 3.1 1.0 –2.6 1.2 –0.1
Construction 8.5 7.8 0.9 0.8 1.2 0.8 1.8 1.9 3.8
Tertiary sector 4.6 1.0 2.3 3.6 3.8 4.0 4.2 3.5 3.0
Wholesale and retail 1.0 –1.2 3.5 4.4 2.4 5.2 6.1 5.2 3.0
Transport 4.0 0.9 2.0 3.3 4.1 4.3 2.3 2.9 2.5
Finance 7.4 1.0 2.0 3.5 5.3 2.7 4.5 2.3 4.1
Government services 4.5 3.8 2.7 3.9 3.1 5.1 4.2 4.4 2.3
Personal services 3.9 –0.9 –0.1 2.4 2.6 2.8 2.5 3.0 1.7
GDP growth 3.6 –1.5 2.9 3.1 4.6 1.0 1.7 3.2 2.7
Source: South African Reserve Bank.
7
An estimated 650,000
additional workers
have joined the ranks
of the unemployed
since the end of 2008Labor marketsHigh structural unemployment has been exac-erbated by the negative cyclical effects of the global financial crisis. An estimated 650,000 additional workers have joined the ranks of the unemployed since the end of 2008, a number that rises to more than 1.8 million with those who were discouraged and stopped looking for a job. As a result, unemployment increased from 21.9 percent in 2008q4 to 25.2 in 2012q1, even though real GDP had recovered to its pre-crisis level by 2010q2.
The narrow unemployment rate increased to 25.2 percent (broad, 33.8 percent) in 2012q1, compared with 23.9 percent (32.7 percent) in 2011q4 and 25.0 percent (33.4 per-cent) in 2011q1. Manufacturing and construc-tion saw the most significant job losses in the last quarter, despite being among the fastest growing sectors in the quarter. The quarterly climb in the unemployment rate can be partly explained by seasonal factors. On an annual basis, the economy added 304,000 jobs. But the increase in the number of discouraged workers, the strong growth in the working-age population, and the significant number of non-economically active persons that transitioned into the labor force more than offset these gains, leading to a 0.2 (0.4) percentage point increase in the narrow (broad) unemployment rate.
To develop a more nuanced assessment of the churning within the South African labor markets, we compute a six-month transition matrix for the period that preceded the reces-sion of 2009 (2008q1–2008q3) and compare it with the transition matrix for 2011q3–2012q1 (table 1.4).5 A similar comparison was also made using a transition matrix for 2011q1–2011q3 to isolate the effects of seasonal factors, but the results did not change materially. The diagonal elements in the tables indicate the probability of staying in the same employment status dur-ing the six months, while the nondiagonal ones indicate the probability of moving from one status to another.6
A comparison of the two panels suggests the following:• The most visible differences in labor market
transitions, before and after the crisis, per-tain to those unemployed or discouraged. The persistence in these vulnerable catego-ries increased significantly following the downbeat and uncertain conditions brought about by the global crisis.
• Almost 70 percent of the unemployed kept looking but did not find a job within six months in the recent period, up from 53 percent before the crisis. Similarly, only 15 percent of the unemployed are likely to find a job within six months from now, down from 26 percent in 2008.
Table Gross domestic expenditure growth by component, 2008–2012q1
1.3 (percent, seasonally adjusted annual rate, unless otherwise indicated)
2008 2009 2010 2011 2011q1 2011q2 2011q3 2011q4 2012q1
Total final consumption 2.7 –0.1 4.0 4.9 7.0 2.4 4.1 5.2 2.9
Household consumption 2.2 –1.6 3.7 5.0 6.2 3.4 3.8 4.6 3.1
Durables –8.3 –12.6 18.1 15.7 19.6 13.5 17.5 16.6 8.2
Semidurables 4.7 –1.9 2.0 7.0 12.5 7.8 6.7 7.3 2.9
Nondurables 0.2 –1.0 1.3 2.9 5.0 2.1 2.0 2.2 3.5
Services 6.1 0.5 3.4 3.8 2.9 1.0 1.4 2.9 1.6
Government consumption 4.5 4.7 4.9 4.5 9.4 –0.4 4.8 7.3 2.2
Gross fixed capital formation 13.3 –3.2 –1.6 4.4 4.4 5.0 5.9 7.2 5.3
Private 9.2 –9.6 –0.8 5.3 4.9 5.3 5.4 6.2 1.8
Government 10.9 –3.4 –9.5 0.8 –0.5 1.7 3.4 7.8 9.3
Public corporations 36.2 22.2 1.8 4.2 6.2 6.0 9.0 9.6 13.1
Change in inventories (R billions) –9.0 –28.0 –1.8 4.8 7.1 3.1 4.0 4.9 5.9
Gross domestic expenditure 3.5 –1.6 4.2 4.3 4.6 1.4 4.8 5.1 4.3
Source: South African Reserve Bank.

S o u t h A f r i c A E c o n o m i c U p d a t E — F o c U s o n i n E q U a l i t y o F o p p o r t U n i t y
8
Deficit and public
sector borrowing
targets were lowered
somewhat to fully
restore market
confidence
• The probability of a discouraged worker finding a job fell by more than 6 percentage points from an already low 15 percent in the previous period. Persistence in this category (that is, the chances of a discouraged worker remaining in that category) increased 70 percent. The discouraged worker’s chances of moving to unemployment also fell almost 40 percent, reflecting less motivation to begin looking for a job.
• The transitions from being employed to other statuses (unemployed, discouraged, and other inactive) remained similar before and after the crisis, reflecting relative stabil-ity in the position of those already holding a job. The probability of staying employed after six months was slightly lower in the pre-crisis period relative to the recent period.
Fiscal policyFiscal policy in South Africa (as elsewhere) is required to walk a very fine line. On the one hand, the fragile domestic economic recovery, closely tied to the uncertain global situation, takes away the possibility of a rapid rollback of the countercyclical fiscal stance in recent-year budgets. Major infrastructural shortfalls persist, requiring stepped-up budgetary inter-vention together with greater private partici-pation enabled by necessary institutional and regulatory reforms. South Africa’s high unem-ployment and an unfinished agenda for public service delivery (see the focus on inequality of opportunity) cannot be resolved through higher
public expenditures, but the situation makes it politically hard to cut back social spending. On the other hand, bond markets—the mainstay of budget financing for South Africa—are jit-tery worldwide, and credit rating agencies are taking an increasingly dim view of countries with records of persistent budget deficits and debt accumulation, especially if combined with a level of policy and political uncertainty. This unpleasant reality was brought home to South Africa by recent outlook downgrades—from stable to negative—by Fitch, Moody’s, and S&P.
Predictably shaped by these forces, the 2012 Budget carried few elements of surprise (table 1.5). Deficit and public sector borrow-ing targets were lowered somewhat to fully restore market confidence. Social expenditures remained the dominant component of spend-ing. And the increase in infrastructure spend-ing over the 2012/13–2014/15 MTEF period was kept at under 5 percent compared with the MTEF cycle in the previous budget. Recogniz-ing the shortfalls in the municipalities’ capacity to carry out infrastructure spending, the bud-get highlighted a proposed Cities Support Pro-gramme, currently under Cabinet review, that would put metropolitan authorities in charge of spatial planning, public transport, and managing the provision of utilities, backed by robust capacity-building support. A careful and phased implementation (over 14 years) of the much-debated national health insurance frame-work was announced, subject to careful evalua-tion of its financial viability. The budget carried
Table Labor market transition matrices
1.4 (percent)
2011q3–2012q1
Employed Unemployed Discouraged Other inactive
Employed 91.4 4.0 1.3 3.2
Unemployed 15.1 69.2 4.6 11.1
Discouraged 9.0 13.0 57.1 20.9
Other inactive 3.1 7.0 4.8 85.0
2008q1–2008q3
Employed Unemployed Discouraged Other inactive
Employed 88.7 5.1 1.1 5.1
Unemployed 25.9 52.8 3.9 18.0
Discouraged 15.4 21.1 33.7 29.7
Other inactive 5.5 7.1 2.5 85.0
Source: Quarterly Labour Force Surveys (2008q1 and 2012q1).

9
Inflationary pressures
have receded in recent
months, helped by a
moderation in global
food and petrol
price increases
a welcome thrust on measures to strengthen the government’s financial management systems (especially those related to procurement, con-tract management, and supply chain manage-ment) for better value for money.
For 2011/12, preliminary estimates of rev-enue collection were R4 billion higher than the revenue estimates in the 2012 Budget (R743 billion), while preliminary estimates of govern-ment spending were R4 billion lower than the estimates set in the 2012 Budget (R968 billion), resulting in a revised budget deficit of 4.5 per-cent of GDP, 0.3 percentage points lower than previously envisaged.
As in other emerging markets, South Africa’s fiscal space has been curtailed after adopting a countercyclical stance in recent-year bud-gets. General government gross debt increased by more than 10 percentage points of GDP
between 2007 and 2011 (figure 1.7). Although enabled by the relatively favorable position, this was a much more pronounced increase than the other BRICS and several other upper middle-income countries. The fiscal stance remains sustainable overall, but lack of prog-ress in addressing structural problems that con-tribute to high unemployment and inequality, low growth, and festering elements of political uncertainty have led to a more cautious assess-ment of the fiscal position by market analysts.
InflationInflationary pressures have receded in recent months, helped by a moderation in global food and petrol price increases. After hitting the upper threshold (6 percent) of the inflation tar-get band in October 2011—and remaining at or above that for six months—headline Consumer
Table Consolidated government f iscal framework, 2010/11–2014/15
1.5 (percent of GDP, unless otherwise indicated)
Outcome MTBPS Budget Budget forecast
2010/11 2011/12 2012/13 2012/13 2013/14 2014/15
Revenue 27.5 27.7 27.0 27.4 27.8 28.0
Expenditure 31.7 32.5 32.2 32.1 31.7 31.0
Budget balance –4.2 –4.8 –5.2 –4.6 –4.0 –3.0
Interest cost 2.4 2.6 2.7 2.7 2.8 2.7
Public sector borrowing requirement 6.5 7.1 7.8 7.1 6.2 5.0
Total net government debt 29.7 33.3 36.7 36.0 37.8 38.5
Southern African Customs Union transfers (R millions) 17,906 21,763 38,983 42,151 37,245 41,416
Source: National Treasury of the Republic of South Africa, 2012 Budget.
FigureChange in GDP growth, f iscal balance, and general government gross debt between 2007 and 2011
1.7
–10
0
10
20
IndiaBrazilRussianFederation
BRICsUppermiddle-income
countries
ChinaSouthAfrica
Perc
ent
GDP growth (percent) General government General government budget balance (percent of GDP) gross debt (percent of GDP)
Source: IMF World Economic Outlook, April 2012; staff estimates.

S o u t h A f r i c A E c o n o m i c U p d a t E — F o c U s o n i n E q U a l i t y o F o p p o r t U n i t y
10
Greater uncertainty
emanating from
the Eurozone would
lead to spikes
of risk aversion,
higher volatility of
the exchange rate,
and potentially a
further depreciation
of the rand
Price Index inflation fell to 5.5 percent (y/y) in June (figure 1.8). Food and petrol infla-tion, which account for roughly 18 percent of the consumption basket, declined from 11 and 30 percent (y/y) in October to 6.0 and 14.2 per-cent in June, respectively. Producer price infla-tion also subsided over the same period, falling to single-digit annual increases. A similar down-ward trend can be observed in the Kagiso PMI price index. After remaining in the low 70s in the previous four months, 10 index points below the monthly average recorded in the last quarter of 2011, the Kagiso price index fell to 65.1 in June, also suggesting a moderation of input costs in the manufacturing sector.
South Africa’s inflation outlook remains subject to domestic and global risks. On the one hand, inflationary pressures have thus far orig-inated on the supply side, mostly from global commodity prices. Demand-driven inflation-ary pressures have remained subdued, as the domestic economy is yet to fully recover from the 2009 recession and capacity utilization in the manufacturing sector remains below the levels before the global financial crisis (79.9 percent in 2012q1, compared with 85.3 percent in 2007q1). A deteriorating global economic outlook is also likely to restrain domestic con-sumer and business confidence, further damp-ening prices through lower external demand (with the Eurozone still being South Africa’s major trading partner and the main recipi-ent of its manufactured goods). Moreover,
heightened uncertainty and weaker global growth prospects go hand-in-hand with lower international oil and commodity prices. On the other hand, greater uncertainty emanating from the Eurozone would lead to spikes of risk aversion, higher volatility of the exchange rate, and potentially a further depreciation of the rand. Depending on several factors, this may lead to increases in imported good prices and second-round effects (see box 1.1 on exchange rate pass-through in South Africa in the South African Economic Update of November 2011). On balance, the risks to the inflation outlook have abated in recent months. Together with the weakened growth outlook, this justifies the South African Reserve Bank’s July 19 decision to lower the repurchase rate from 6.0 percent to a record low 5.5 percent, its first interest rate cut in 20 months.
External sectorThe current account deficit rose to 4.9 percent of GDP in 2012q1 from 3.6 percent in 2011q4 as the deficits in the trade account and in the services, income, and current transfers account widened (figure 1.9). The deficit in the trade account edged higher in 2012q1, rising to 1.4 percent of GDP and reinforcing the downward trend that started in 2011q1. The terms of trade maintained in 2012q1 the downward trend that started in early 2011 as increases in inter-national oil prices outpaced the increases in nonoil commodity prices. The services, income,
FigureCore and headline Consumer Price Index inflation and Producer Price Index inflation, 2009–12
1.8
0
5
10
15
20
May 2012Jan. 2012Jan. 2011Jan. 2010Jan. 2009–40
–20
0
20
40
Perc
ent
Headline CPI in�ation
Food Excluding food, nonalcoholic beverages, petrol, and energy
PetrolPPI in�ation for domestic output
Percent
Source: Statistics South Africa.

11
GDP growth is
projected at
2.5 percent in 2012,
lower than the
3.1 percent forecast
in the November
2011 update and the
2.7 percent forecast
in the 2012 Budget
and current transfers account also deteriorated due to higher net dividend payments to nonres-idents, reinforcing the net effect on the current account and, thus, the country’s dependence on foreign savings.
As noted earlier, risk aversion has spiked in recent months, leading to a general flight to safety, with lower capital flows in general to developing countries and widespread deprecia-tion of emerging market exchange rates against the dollar. Against this backdrop, the South African rand has also weakened against the dol-lar, reaching levels not seen since 2011q4. Bond and equity f lows have recovered somewhat from their plunge in the latter part of May, but remain below the levels in April 2012.
Economic outlook for South AfricaAgainst the prospects of a noticeably weaker global economy than envisaged at the time of the previous Economic Update in Novem-ber 2011, medium-term growth projections for South Africa have been revised downward (table 1.6). GDP growth is projected at 2.5 per-cent in 2012, lower than the 3.1 percent fore-cast in the November 2011 update and the 2.7 percent forecast in the 2012 Budget. The main reason for the lower projection is the further slowdown in the European Union and in China, the two main export destinations for South Africa. Under the baseline assump-tions applied here, the current global finan-cial market tensions would ease somewhat
Figure Current account, trade balance, and terms of trade, 2007–12
1.9
–10
–5
0
5
Perc
ent Percent
Trade balance Savings to investment rate Current account balance Terms of trade, including gold
100
110
120
130
January2012
January2011
January2010
January2009
January2008
January2007
Source: South African Reserve Bank 2012; staff calculations.
Figure Bond and equity purchases by nonresidents
1.10
-200
-100
0
100
200
US$
mill
ions
Rand/U
S$ exchange rate
Bonds Equities Rand/US$Bonds and equities exchange rate
6
7
8
9
10
June 25,2012
May2012
Mar.2012
Jan.2012
Nov.2011
Sept.2011
July 19,2011
Source: Citigroup; Johannesburg Stock Exchange; staff calculations.

S o u t h A f r i c A E c o n o m i c U p d a t E — F o c U s o n i n E q U a l i t y o F o p p o r t U n i t y
12
Domestic demand,
particularly consumer
spending, will continue
to be an important
driver of growth
in 2013 and 2014, contributing to a pickup in global demand, which should support gradual acceleration of growth in South Africa toward its potential GDP growth of 3.5 percent. An important constraint on a faster pickup in growth is likely to be bottlenecks in electricity supply, which is already rubbing against peak demand and will continue to do so until fresh large-scale generation capacity comes onboard and Eskom’s demand-side management mea-sures for greater energy efficiency take firmer root.
Domestic demand, particularly consumer spending, will continue to be an important driver of growth—albeit at a less forceful pace than previously envisaged. Consumer spend-ing will continue to be supported by robust wage increases, historically low interest rates, and expanded access to unsecured credit. Retail sales, an indicator of the strength of consumer spending, were up 5.9 percent (y/y) in 2012q1. But there are signs of a moderation in 2012q2, as picked up by a sharp decline in the RMB/BER Business Confidence Index for the retail sector. Persistent high unemploy-ment, elevated consumer debt, and stable or declining housing prices will put a check on the expansion in consumer spending. After two years of negative growth, private invest-ment expanded 4.4 percent in 2011. The fragile domestic economic outlook, the deteri-orating business conditions, the excess capac-ity still prevailing in the manufacturing sector, and the weak external demand do not provide a supportive environment for private invest-ment. So, private investment is projected to moderate in 2012, offset only partly by higher
capital spending by the government and pub-lic corporations.
Consistent with the public sector’s ambi-tious plans to boost spending on infrastruc-ture projects, and with persistent pressures to increase social spending, government spend-ing will remain critical over the first two years of the forecast period. But the planned fiscal consolidation would tend to reduce govern-ment spending’s contribution to growth in the medium term. Due to weak demand from Europe, slowing demand from Asia, and strong import growth, net exports will place a drag on growth in 2012. However, a pickup in global demand in the outer years of the forecast should support an increase in export growth in those years.
Risks to the outlookThe major downside risks remain tied to how the situation in Europe unfolds. Europe is South Africa’s largest export market, so indus-trial production growth in the two economies is strongly correlated (0.78; figure 1.11).
The form that an escalation of the crisis might take in the current economic context, if one occurs, is very uncertain—partly because it is impossible to predict what exactly might trig-ger it, and partly because the powerful forces unleashed could easily take a route very dif-ferent from the one foreseen by standard eco-nomic reasoning.
With that caveat, for purely illustration pur-poses, two hypothetical downside scenarios are considered here.• Scenario 1. The first scenario assumes a
serious credit squeeze faced by one or two
Table Macroeconomic outlook, 2008–14
1.6 (percent change, unless otherwise indicated)
2008 2009 2010 2011 2012 2013 2014
Real GDP growth 3.6 –1.5 2.9 3.1 2.5 3.2 3.5
Household consumption 2.2 –1.6 3.7 4.9 3.4 3.5 3.7
Government consumption 4.5 4.7 4.9 4.6 4.1 4.1 4.1
Gross fixed investment 13.3 –3.2 –1.6 4.3 3.8 4.2 5.0
Exports, GNFS 1.8 –19.5 4.5 6.0 2.4 5.0 5.5
Imports, GNFS 1.5 –17.4 9.6 9.4 6.8 6.8 7.9
Headline CPI 9.9 7.1 4.3 5.0 6.0 5.3 5.1
Current account balance (percent of GDP) –7.2 –4.0 –2.8 –3.3 –4.3 –4.7 –4.8
Source: Staff calculations; National Treasury of the Republic of South Africa estimates and projections.

13
South Africa’s large
current account deficit
continues to be a
downward risk to
the growth outlook
small Eurozone economies, but an other-wise fairly orderly resolution to the crisis that limits contagion from spilling beyond these economies. Although the scenario assumes that borrowing costs increase in other European countries and that banks tighten lending conditions due to losses in the directly affected economies and to heightened uncertainty and risk aversion, the banking stress is contained and does not spread to the rest of the high-income world. The main direct transmission chan-nel to the rest of the world (including South Africa) would be through weaker demand for its exports. However, the indi-rect channels of transmission arising from the confidence effects are likely to be even stronger—with precautionary savings among firms increasing and heightened risk aversion delaying spending by firms. As a result, both consumer and investment demand would decline.
• Scenario 2. This scenario assumes a disorderly resolution to the crisis. A freezing of credit is assumed to spread to two larger Eurozone economies, generating similar declines in GDP and imports of these economies. Euro-zone GDP is assumed to fall 8.5 percent rela-tive to the baseline in 2013, pushing the rest of the world into a deep recession.Simulations of the two scenarios show a
major potential impact on South Africa, with
the deceleration in its GDP growth much sharper than in other large developing coun-tries (figure 1.12). Under Scenario 1, 1.5 per-centage points would be shaved off South Africa’s GDP growth in 2012 relative to the baseline growth of 2.5 percent. Under Sce-nario 2, some 2.2 percentage points would be taken off GDP growth in 2012.
Lower commodity prices present another downside risk. With much of the recent increase in commodity prices driven by strong demand from Asia (particularly China), a cooling of the Chinese economy beyond pro-jections, coupled with weak demand from Europe, would dampen commodity prices, hitting South Africa’s growth prospects. To evaluate this, the impact of a 20 percent fall in nonoil commodity prices is simulated (figure 1.13). Once again, among developing coun-tries, South Africa is among the 10 countries to be hit most by the drop in commodity prices. Indeed, the results show GDP growth to fall by some 1.7 percentage points.
South Africa’s large current account defi-cit (reflecting low domestic savings), financed mostly through portfolio flows, continues to be a downward risk to the growth outlook. A dis-orderly resolution of the Eurozone crisis may heighten volatility in financial markets and dry up capital inflows, with portfolio flows mostly affected by swings in market sentiment. Greater volatility in the rand exchange rate—and a
FigureSouth Africa’s industrial production growth is highly correlated to developments in Europe
1.11 (industrial production volumes, 3m/3m seasonally adjusted annual rate)
–40
–30
–20
–10
0
10
20
30
Jan.2012
Jan.2011
Jan.2010
Jan.2009
Jan.2008
Jan.2007
Jan.2006
Jan.2005
South Africa Eurozone
Perc
ent
Source: World Bank; Datastream.

S o u t h A f r i c A E c o n o m i c U p d a t E — F o c U s o n i n E q U a l i t y o F o p p o r t U n i t y
14
An upside risk for
South Africa and other
developing countries
is the possibility of
a stronger recovery
in global demand
sharp correction in domestic absorption and the current account—would likely drag down the fragile domestic economic recovery. More than 20 percent of total gross fixed capital formation was financed by nonresidents in 2012q1, up from 14 percent in 2011q4, showing the domestic economy’s increased vulnerability to capital flow reversals.
An upside risk for South Africa and other developing countries is the possibility of a stronger recovery in global demand than
embedded in the current baseline. While less likely, this could come from an improvement in market sentiment, perhaps due to additional progress on the reform agenda or to better-than-anticipated outturns in high-income countries. For developing countries such as South Africa where some postcrisis slack remains, a stronger than expected recovery in demand could be absorbed fairly easily and converted into improved living conditions and lower unemployment.
FigurePercentage deviation in GDP growth in 2012 from baseline in the event of a further escalation in the Eurozone crisis
1.12
–3.0
–2.5
–2.0
–1.5
–1.0
–0.5
0.0
RussianFederation
SouthAfrica
ChinaTurkeyNigeriaMalaysiaIndiaBrazilKenya
Perc
ent
Small crisis Big crisis
Source: World Bank.
FigureCommodity exporters to be hardest hit by a 20 percent decline in metal and mineral prices
1.13
–8 –6 –4 –2 0
NamibiaSwaziland
BeninColombia
UgandaSouth Africa
BoliviaUzbekistan
ChileBelize
Kyrgyz RepublicArgentina
UruguayParaguay
Percent deviation from GDP forecast in 2013
Source: World Bank.
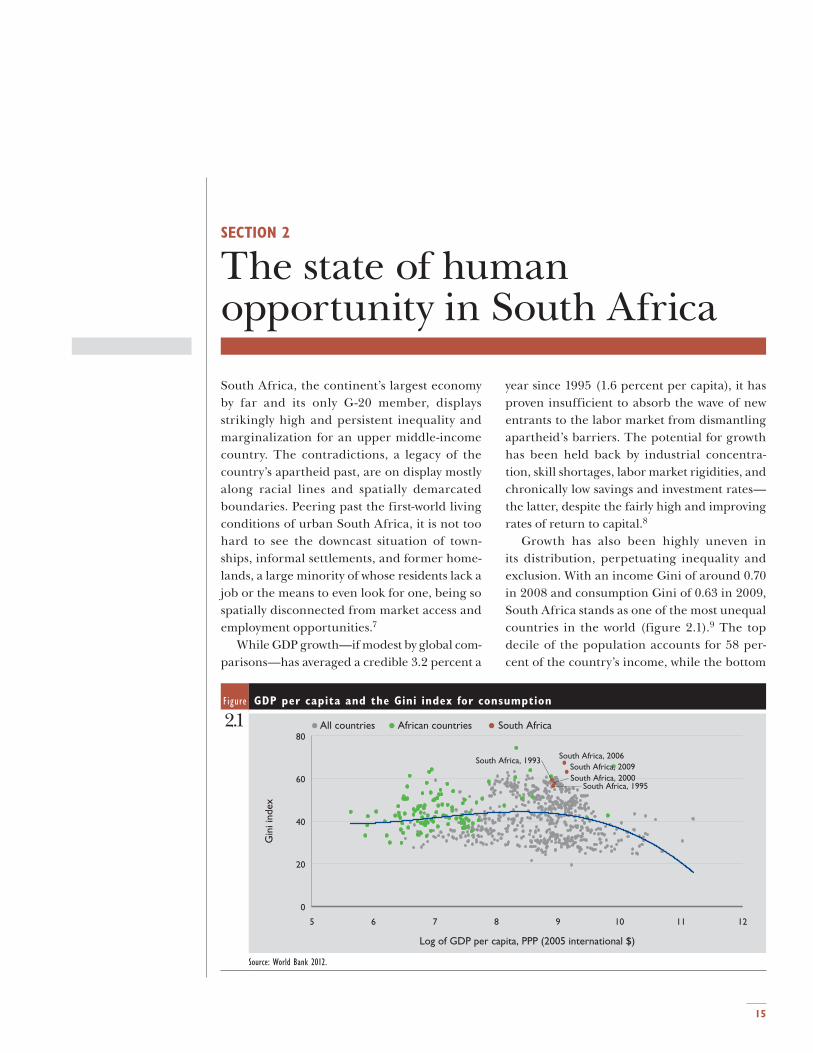
15
SECTION 2
The state of human opportunity in South Africa
South Africa, the continent’s largest economy by far and its only G-20 member, displays strikingly high and persistent inequality and marginalization for an upper middle-income country. The contradictions, a legacy of the country’s apartheid past, are on display mostly along racial lines and spatially demarcated boundaries. Peering past the first-world living conditions of urban South Africa, it is not too hard to see the downcast situation of town-ships, informal settlements, and former home-lands, a large minority of whose residents lack a job or the means to even look for one, being so spatially disconnected from market access and employment opportunities.7
While GDP growth—if modest by global com-parisons—has averaged a credible 3.2 percent a
year since 1995 (1.6 percent per capita), it has proven insufficient to absorb the wave of new entrants to the labor market from dismantling apartheid’s barriers. The potential for growth has been held back by industrial concentra-tion, skill shortages, labor market rigidities, and chronically low savings and investment rates—the latter, despite the fairly high and improving rates of return to capital.8
Growth has also been highly uneven in its distribution, perpetuating inequality and exclusion. With an income Gini of around 0.70 in 2008 and consumption Gini of 0.63 in 2009, South Africa stands as one of the most unequal countries in the world (figure 2.1).9 The top decile of the population accounts for 58 per-cent of the country’s income, while the bottom
Figure GDP per capita and the Gini index for consumption
2.1
5 6 7 8 9 10 11 12
0
20
40
60
80
Gin
i ind
ex
Log of GDP per capita, PPP (2005 international $)
South Africa, 1993
South Africa, 1995South Africa, 2000
South Africa, 2006South Africa, 2009
All countries African countries South Africa
Source: World Bank 2012.

S o u t h A f r i c A E c o n o m i c U p d a t E — F o c U s o n i n E q U a l i t y o F o p p o r t U n i t y
16
At the heart of
high inequality lies
the inability to
create employment
opportunities on a
large enough scale
decile accounts for 0.5 percent and the bottom half less than 8 percent.10 In large part, this is an enduring legacy of the apartheid system, which denied the non-whites (especially Afri-cans) the chance to accumulate capital in any form—land, finance, skills, education, or social networks.
At the heart of high inequality lies the inabil-ity to create employment opportunities on a large enough scale.11 Unemployment stands at 25.2 percent (33.0 percent, including “discour-aged” workers), among the world’s highest. No surprise then that despite an almost 30 percent increase in per capita GDP since the late 1990s, reductions in poverty have been modest at best.12
This would have been untenable without the growing social assistance grants (figure 2.2).13
Noncontributory and means-tested (except for foster care) financial transfers from the budget account for more than 70 percent of the income of the bottom quintile (up from 15 percent in 1993 and 29 percent in 2000).14 With the social grants, the entire spectrum of population ranked by income percentiles saw income growth between 1995 and 2005 (figure 2.3). But without the grants as part of income, those below the 40th percentile saw a signifi-cant decline in their income. In other words, without the grants, two-fifths of the population would have seen its income decline in the first decade after apartheid.15
Even after accounting for the equalizing role of social assistance, income inequality remains extraordinarily high.16 To reduce it to
Figure Growth incidence curves for South Africa, 1995–2005
2.3
–20
–10
0
10
20
100806040200
Including social grants Excluding social grants
Ann
ual g
row
th in
per
cap
ita in
com
e (p
erce
nt)
Poorest percentile by per capita income (percent)
Source: Bhorat and van der Westhuizen 2011.
Figure Income sources by deciles
2.2
0
20
40
60
80
100
Perc
ent
Labor market Remittances Capital Government Other
TopSecondThirdFourthFifthSixthSeventhEighthNinthBottom
Quintile
Source: Leibbrandt and others 2010.

17
Social consensus and
policy action can
become more likely
when the issue is
framed around the
notion of equity
rather than equality
more reasonable levels over the long run, social assistance is clearly not enough and needs to be complemented by other initiatives. These would include a special focus on human capital development, particularly among children and youths.
The high and possibly rising patterns of inequality predictably polarize the political and economic debate in the country. While the perils of an unequal society are univer-sally acknowledged, the notion of unfairness requiring policy intervention rarely finds con-sensus. Some argue, with justification, that individuals cannot and should not be rewarded equally irrespective of their effort, choices in life (whether to pursue higher education, for example), or innate talent. If a person works harder than another, it is only fair that that person be suitably compensated; the same for someone who happens to be more talented than another.
There is much broader agreement on the notion that predetermined circumstances such as gender, ethnicity, place of birth, or family origins should not play a role in determining people’s economic, social, and political success. In other words, a person should not have fewer opportunities in life just because she is a girl or just because she is born of a certain color. This is the core principle behind the concept of equality of opportunity—the framework in this report for South Africa.17
Social consensus and policy action can become more likely when the sources of inequality are decomposed and the issue is framed around the notion of equity rather than equality. A girl (let’s call her Thandiwe) born in the township of Tembisa outside Johannesburg to a single, uneducated mother earning R2,000 a month and with four other siblings should have an equal shot at becoming a doctor or an engineer as a boy (let’s call him Andries) with one sibling, born in a two-parent household in Sandton, Johannesburg (see box 2.3 below). And so should a girl (let’s call her Nothando), born in a family with similar char-acteristics as Thandiwe’s, but living in the rural area of Eshowe in Kwa-Zulu Natal.
What would it take to equalize Nothando’s, Thandiwe’s, and Andries’s chances of success in life? Ample research shows that access to a
basic set of goods and services during child-hood can be an important (if far from perfect) predictor of future outcomes, including edu-cation achievements and earnings. Access to quality basic services such as education, health care, essential infrastructure (like water, sani-tation, and electricity), and early childhood development provides an individual, irrespec-tive of background, the opportunity to advance and reach his or her human potential.
Analyzing such opportunities for children in South Africa can help better understand the nature and causes of inequality of outcomes observed among adults. Opportunities among children can also be reliable predictors of eco-nomic mobility across generations and over time. For instance, if access to economic oppor-tunities, in the form of jobs (and earnings), credit, and ownership of land and financial assets is correlated with the circumstances of an individual (such as race and location of resi-dence), it reinforces the link between children’s circumstances and their opportunities in life.
Until recently, framing the debate in such terms had not been possible in developing countries because of lack of an intuitive mea-sure of equality of opportunity among chil-dren (akin to the Gini coefficient) that could be readily applied to the data typically avail-able in a developing country. New techniques such as the Human Opportunity Index (HOI) at the World Bank in partnership with others, and their application in the Latin America and Caribbean region in the last decade, have helped fill some of that gap (box 2.1). This report applies some of these techniques to bet-ter understand the underpinnings of inequal-ity in South Africa.
The first part of this focus section limits the list of opportunities to those provided to an individual in childhood. For a child, opportu-nities are synonymous with access to (and use of) basic goods or services, such as basic educa-tion, health, safe water on site, and improved sanitation, while “individual effort” is mostly irrelevant, because the family, society, or the government (and not the child herself) are responsible for ensuring whether she will have access to them. The focus on children also has implications for public policy. Academic research has found interventions that equalize

S o u t h A f r i c A E c o n o m i c U p d a t E — F o c U s o n i n E q U a l i t y o F o p p o r t U n i t y
18
Interventions that
equalize opportunities
earlier in life are much
more cost-effective
and successful than
those later in life
opportunities earlier in life to be much more cost-effective and successful than those later in life.18
The report poses three key questions for the equality of opportunities among South African children:• What is the status of South African chil-
dren’s access to basic opportunities (educa-tion, health, water, sanitation, and so on) in coverage and distribution among children of different circumstances?
• How has South African children’s access to opportunities changed over time, and to what extent is the change attributable to changes in the scale and inequality of coverage?
• What circumstances shape inequality of opportunity in South Africa and, conse-quently, what are the profiles of the most vulnerable groups among South African children?The second part of the focus section exam-
ines inequality of opportunities in employment, which encompasses a number of dimensions (in addition to the basic opportunities in child-hood)—including employment, earnings, assets, and credit—that perpetuate inequality
across generations. Of these, only employ-ment is covered in the second part, because of data limitations for the other dimensions and the centrality of high unemployment in South Africa. The results on opportunities in employ-ment are less definitive than those for children and need to be treated with caution, due to the conceptual difficulties in measuring inequal-ity of opportunity among adults with the data limitations in South Africa.
The main questions posed in the second part are:• What is the status of opportunities in the
South Africa labor market in coverage and inequality, and how have these changed over time?
• What are the “contributions” of circum-stances relative to acquired attributes to inequality in employment status, such as education and age (or experience)?
• How do labor market opportunities vary among different subgroups of the population?
Opportunities among childrenBasic opportunities here are defined as a sub-set of goods and services for children, such as
Box The Human Opportunity Index
2.1 The academic literature offers a number of ways to measure inequality of opportunity. Among these, our purpose is best served by a scalar measure easily computable from the typical data available in developing countries. Developed by Bank staff in collabora-tion with external researchers, the Human Opportunity Index (HOI) is an intuitive measure of a society’s progress toward the equi-table provision of opportunities for all children.1 It has been used in two regional reports in Latin America, a study (in draft) for 20 Sub-Saharan countries, and numerous studies conducted (or in progress) for countries around the world. The focus of most stud-ies has been children, with some applications to labor markets in recent studies.
The HOI measures in a single indicator the coverage rate of a particular service, adjusted by how equitably the available services are distributed among groups differentiated by circumstance. Its construction involves aggregating circumstance-specific coverage rates in a scalar measure that increases with overall coverage and decreases with the differences in coverage among groups with different sets of circumstances. The index runs from 0 to 100. A society that has universal coverage in a particular opportunity (say, primary school enrollment) would score 100. By contrast, a society that has an average primary enrollment of 50 percent that is unequally distributed in favor of children of certain circumstances (say, urban children) will have an HOI below 50, with the exact value depend-ing on how unequal enrollment is among children of different circumstances (see annex A). The measure also has a number of desirable and intuitive properties (see annex B).
All results are subject to the caveat that the HOI is estimated for a specified list of the circumstances, which could change if this list were to change. But the HOI for any opportunity cannot be higher if more circumstances are added to the existing list. Thus if a society wants to measure equality of opportunity for a larger number of circumstances (and groups) than considered here, the HOI here will serve as an upper bound to the “true” HOI that would take all circumstances into account. To compute the HOI for a certain opportunity for the children of a country, household survey data are essential, with information at the individual (child) and household level.
Note:1. Barros and others 2009.

19
Access to education,
safe water on site,
and electricity are
critical in determining
opportunities
for economic
advancement in life
access to education, safe water on site, or elec-tricity, that are critical in determining opportu-nities for economic advancement in life. These either are already affordable by society at large, or could be in the near future, given the avail-able technology. Universal provision of basic opportunities is a valid and realistic social goal.
Opportunities among children are mea-sured in this report by the Human Opportu-nity Index (HOI), which is the coverage rate of a particular basic service adjusted by how equi-tably the service is distributed among groups differentiated by circumstances. In discount-ing inequitable access, the HOI reflects how personal circumstances—for which children cannot be held accountable—affect their basic opportunities. This means that two societies with the same coverage rate for any service can have different HOIs if citizen access to that ser-vice in one society is determined to a greater extent by gender, race, family background, or any other personal circumstance beyond their control and considered by society to be an unjust source of exclusion.19
The HOI therefore is a unique representa-tion of progress toward universal coverage of basic opportunities and the fairness of allocat-ing those opportunities, in a single indicator.20 It brings equity to the forefront of policy-making with an operational measure to track progress.
What determines the choice of the circum-stances to be taken into account? There are no universal selection criteria. The determination is best made by societal consensus based on what the society considers, for ethical reasons, as characteristics that should not interfere with access to basic goods and services. From a prac-tical point of view, the choice inevitably is also guided by the kinds of data available, particu-larly nationally representative household sur-vey data that is essential for the analysis.21
For South Africa, the circumstances are personal and family-related: gender of the child; ethnicity; household composition—pres-ence of the spouse of the household head in the household, total number of children ages 0–16 in the household, and whether both par-ents live in the household; education of the household head; other household head charac-teristics—gender and age of the head; orphan
status—whether both parents are alive; and location of the household—urban townships, informal settlements, other urban areas, or rural areas.22 Note that, in covering the town-ships and informal settlements, a broad brush overlooks their remarkable variety in size, pop-ulation density, length of time since establish-ment, rural or urban location, and distance from major urban centers.
The opportunities considered are those that enable South African children to realize their productive potential directly, by enhancing their human capital and creating a safe physi-cal environment, and indirectly, by providing access to infrastructure amenities that help ensure a decent quality of life and facilitate the accumulation of human capital (see annex D for details).23 The human development compo-nent of opportunities comprises exposure to early childhood development programs (chil-dren ages 0–4 years), school enrollment (at ages 6–11 and 12–15), timely completion of pri-mary school (ages 13–15), adequacy of school infrastructure and teachers (as reported by parents), and having health insurance. Objec-tive measures of student achievement or quality of learning were not available.
Exposure to early childhood development (ECD) is a valuable (if partial) measure of cognitive inputs early in a child’s development process, which research has shown to have long-term impacts on learning.24
Having health insurance, an indirect mea-sure of access to quality health services, has recently received considerable policy attention in South Africa with the envisaged National Health Insurance program. Ideally, this mea-sure would be complemented with more mean-ingful data on child health in South Africa such as nutritional outcomes, access to preven-tive care, and access to pre- and postnatal care for mothers, which are absent in the dataset for this analysis. A child’s physical well-being also depends on access to safe water on site and improved sanitation.
Infrastructure services include access to electricity, safe water on site, and improved sanitation and living in households that are not overcrowded—all critical for a safe, stable, and a stimulating childhood. Access to safe water on site, for example, is known to reduce

S o u t h A f r i c A E c o n o m i c U p d a t E — F o c U s o n i n E q U a l i t y o F o p p o r t U n i t y
20
South Africa does
extremely well in
terms of school
attendance for
children ages 10–14
the risk of water-borne diseases, the leading cause of illness and undernourishment in children, which in turn affect their education outcomes and earning potential.25 Electricity enables nighttime reading and is a healthier source of energy than fuel, and it opens up access to other opportunities, such as sources of information (radio, television, and Inter-net). Improved sanitation reduces the risk of illness. Overcrowding has detrimental effects on mental health, social relationships at home, and child care.26 Access to telecommunications enhances exposure to information, the ability to communicate, and even access to such ser-vices as health care and education.
The opportunity to grow up in a safe neigh-borhood is important for a child’s cognitive and psychological development. The salience of safety in the socioeconomic fabric of the country is perhaps best illustrated by the fact that crime and theft were regarded as the top five problematic factors of doing business in South Africa—more important than access to finance, infrastructure, and tax regulations.27
Unsafe areas also tend not to have quality schools, hospitals, and other such amenities.
What is the status of South African children’s access to basic opportunities?It is useful to begin by comparing South Afri-can children’s status with that of peers in other
developing countries, including many with similar levels of development. Recognizing the limited coverage of similar analysis for other countries, the comparisons are restricted to Latin America and a few large African coun-tries and to five measures of opportunity, with five HOIs and the associated inequality of access measured by the dissimilarity index (D-Index; figures 2.4–2.8 and box 2.2).
South Africa does extremely well in terms of school attendance for children ages 10–14, where its HOI exceeds that of almost all the comparator countries and the D-Index is rela-tively small (see figure 2.4). However, in a com-parison of school performance (completion of primary school on time), South Africa is sur-passed by a comfortable margin by most of its Latin American peers: in fact, it is more in line with the other African countries and the poor-est Latin American countries, in terms of a high D-Index and relatively low HOI (see figure 2.5).
The HOIs for access to safe water on site and improved sanitation show that South Africa, though superior to the other African countries, is well behind most Latin American countries except for the poorest ones. For example, on access to safe water and improved sanitation, South Africa’s HOIs are on par with those for El Salvador and Honduras, respectively, with comparable D-Indices. In other words, children’s access to safe water and improved
Figure School attendance (ages 10–14)
2.4
0
25
50
75
100
Perc
ent Percent
D-Index HOISo
uth
Afr
ica
(201
0)
Ken
ya (
2008
–09)
Nam
ibia
(20
06–0
7)
Zim
babw
e (2
010–
11)
Zam
bia
(200
7)
Gha
na (
2008
)
Nig
eria
(20
08)
Chi
le (
2006
)
Braz
il (2
008)
Arg
entin
a (2
008)
Dom
inic
an R
epub
lic (
2008
)
Cos
ta R
ica
(200
9)
Peru
(20
08)
Uru
guay
(20
08)
Ven
ezue
la, R
B (2
005)
Jam
aica
(20
02)
Col
ombi
a (2
008)
Mex
ico
(200
8)
Para
guay
(20
08)
Pana
ma
(200
3)
El S
alva
dor
(200
7)
Ecua
dor
(200
6)
Nic
arag
ua (
2005
)
Hon
dura
s (2
006)
Gua
tem
ala
(200
6)
0
5
10
15
20
Source: Authors’ calculations based on General Household Surveys (2002 and 2010) for South Africa; national household surveys for Latin America and the Caribbean countries; and Demographic and Health Surveys for African countries.

21
The HOIs for access to
safe water on site and
improved sanitation
show that South
Africa is well behind
most Latin American
countries except for
the poorest ones
sanitation is lower and much more influenced by circumstances in South Africa than most Latin American countries, including Brazil.
South Africa does relatively better on access to electricity, but still ranks below a majority of these countries on HOI. While coverage is not universal in South Africa, a low D-Index indi-cates that existing coverage is equitably distrib-uted across children of different circumstances.
In the international comparisons, only a limited set of circumstances—gender, family structure, socioeconomic status of parents, and location—and opportunities was used due to data limitations for the other countries and the need to ensure comparability. These are now expanded to cover the full range of informa-tion available for South Africa for a deeper look at the country.
Figure Finished primary school on time
2.5
0
25
50
75
100
0
10
20
30
40
Sout
h A
fric
a (2
010)
Zim
babw
e (2
010–
11)
Nam
ibia
(20
06–0
7)
Ken
ya (
2008
–09)
Nig
eria
(20
08)
Gha
na (
2008
)
Zam
bia
(200
7)
Jam
aica
(20
02)
Mex
ico
(200
8)
Arg
entin
a (2
008)
Chi
le (
2006
)
Ecua
dor
(200
6)
Uru
guay
(20
08)
Peru
(20
08)
Ven
ezue
la, R
B (2
005)
Pana
ma
(200
3)
Col
ombi
a (2
008)
Cos
ta R
ica
(200
9)
Para
guay
(20
08)
Dom
inic
an R
epub
lic (
2008
)
Hon
dura
s (2
006)
El S
alva
dor
(200
7)
Nic
arag
ua (
2005
)
Braz
il (2
008)
Gua
tem
ala
(200
6)
Perc
ent Percent
D-Index HOI
Source: Authors’ calculations based on General Household Surveys (2002 and 2010) for South Africa; national household surveys for Latin America and the Caribbean countries; and Demographic and Health Surveys for African countries.
Figure Access to safe water on site
2.6
0
25
50
75
100
0
20
40
60
80
Sout
h A
fric
a (2
010)
Nam
ibia
(20
06–0
7)
Zim
babw
e (2
010–
11)
Ken
ya (
2008
–09)
Zam
bia
(200
7)
Gha
na (
2008
)
Nig
eria
(20
08)
Arg
entin
a (2
008)
Cos
ta R
ica
(200
9)
Chi
le (
2006
)
Uru
guay
(20
08)
Ven
ezue
la, R
B (2
005)
Braz
il (2
008)
Mex
ico
(200
8)
Dom
inic
an R
epub
lic (
2008
)
Ecua
dor
(200
6)
Para
guay
(20
08)
Gua
tem
ala
(200
6)
Col
ombi
a (2
008)
Pana
ma
(200
3)
Peru
(20
08)
Jam
aica
(20
02)
El S
alva
dor
(200
7)
Hon
dura
s (2
006)
Nic
arag
ua (
2005
)
Perc
ent Percent
D-Index HOI
Source: Authors’ calculations based on General Household Surveys (2002 and 2010) for South Africa; national household surveys for Latin America and the Caribbean countries; and Demographic and Health Surveys for African countries.

S o u t h A f r i c A E c o n o m i c U p d a t E — F o c U s o n i n E q U a l i t y o F o p p o r t U n i t y
22
The high coverage
rates conceal variable
quality of education,
widely recognized
to be a major issue
in South Africa
Several features of South African children’s access to opportunity stand out (figure 2.9). On the positive side, as noted, the country is very close to universal coverage in primary education, with almost uniformly high school attendance and healthy measures of opportuni-ties for school infrastructure and numbers of teachers. For each of these opportunities, there is little inequality in accessing them, evident from the extremely low D-Indices.
The high coverage rates nevertheless con-ceal variable quality of education, widely recog-nized to be a major issue in South Africa. The issues of quality are brought out by standard-ized international test scores that consistently rank South Africa low relative to global com-parators.28,29 The survey data for this analysis do not cover test scores for children.30 When an indirect (and imperfect) measure of school per-formance is used—whether a child completed
Figure Access to improved sanitation
2.7
0
25
50
75
100
0
20
40
60
80
Sout
h A
fric
a (2
010)
Nam
ibia
(20
06–0
7)
Zim
babw
e (2
010–
11)
Zam
bia
(200
7)
Nig
eria
(20
08)
Gha
na (
2008
)
Ken
ya (
2008
–09)
Uru
guay
(20
08)
Cos
ta R
ica
(200
9)
Chi
le (
2006
)
Ven
ezue
la, R
B (2
005)
Braz
il (2
008)
Col
ombi
a (2
008)
Mex
ico
(200
8)
Arg
entin
a (2
008)
Peru
(20
08)
Ecua
dor
(200
6)
Para
guay
(20
08)
Dom
inic
an R
epub
lic (
2008
)
Nic
arag
ua (
2005
)
Pana
ma
(200
3)
Jam
aica
(20
02)
Hon
dura
s (2
006)
Gua
tem
ala
(200
6)
El S
alva
dor
(200
7)
Perc
ent Percent
D-Index HOI
Source: Authors’ calculations based on General Household Surveys (2002 and 2010) for South Africa; national household surveys for Latin America and the Caribbean countries; and Demographic and Health Surveys for African countries.
Figure Access to electricity
2.8
0
25
50
75
100
0
20
40
60
80
Sout
h A
fric
a (2
010)
Gha
na (
2008
)
Nig
eria
(20
08)
Nam
ibia
(20
06–0
7)
Zim
babw
e (2
010–
11)
Zam
bia
(200
7)
Ken
ya (
2008
–09)
Col
ombi
a (2
008)
Arg
entin
a (2
008)
Chi
le (
2006
)
Cos
ta R
ica
(200
9)
Ven
ezue
la, R
B (2
005)
Uru
guay
(20
08)
Mex
ico
(200
8)
Braz
il (2
008)
Dom
inic
an R
epub
lic (
2008
)
Para
guay
(20
08)
Ecua
dor
(200
6)
El S
alva
dor
(200
7)
Jam
aica
(20
02)
Peru
(20
08)
Gua
tem
ala
(200
6)
Pana
ma
(200
3)
Hon
dura
s (2
006)
Nic
arag
ua (
2005
)
Perc
ent Percent
D-Index HOI
Source: Authors’ calculations based on General Household Surveys (2002 and 2010) for South Africa; national household surveys for Latin America and the Caribbean countries; and Demographic and Health Surveys for African countries.

23
Opportunities are
limited in exposure
of children to any
kind of ECD program
between ages 0 and
4 and the chances for
a child to be covered
by health insurance
primary school on time—the result is similarly discouraging, with an HOI of only 51 percent. The D-Index for finishing primary school on time (at 10 percent) indicates some disadvan-tage among certain groups because of their circumstances. Delaying completion of (or fail-ing to complete) primary school has important bearing on lifetime educational attainment of a child and thus represents significant disad-vantages for opportunities in later life.
Opportunities are also limited in the two other human development–related areas: expo-sure of children to any kind of ECD program between ages 0 and 4 and the chances for a child to be covered by health insurance. The D-Index is extremely high at 47 percent for the latter, reflecting the major role of extra-neous circumstances in children’s access to health care.
For infrastructure services, except telecom-munications, inequalities are generally high, evidenced by a D-Index that varies between 6 percent (access to electricity) and 23 percent (access to safe water on site). The opportunity to live and grow up in a household with access to safe water on site, for example, is limited to 63 percent of children ages 0–15, with close to a quarter of those opportunities being inequitably allocated among circumstance groups (D-Index of 23 percent), which produces an HOI of 48 per-cent. Access to improved sanitation is similarly limited, with only 67 percent of children living in households that have either a flush toilet (con-nected to public sewerage or a septic tank) or a chemical toilet or pit latrine. A high D-Index of 18 percent again suggests that the access to this opportunity is influenced by the children’s cir-cumstances, resulting in a low HOI of 55 percent.
Figure HOIs and D-Indices for some key opportunities for South African children, 2010
2.9
0
20
40
60
80
100
Perc
ent
HOI
Percent
D-Index
0
10
20
30
40
50
Scho
ol a
tten
danc
e (a
ges
6–11
)
Scho
ol a
tten
danc
e (a
ges
12–1
5)
Ade
quat
e te
ache
rs in
sch
ool
Acc
ess
to t
elec
omm
unic
atio
ns
Ade
quat
e in
form
atio
n in
sch
ool
Acc
ess
to e
lect
rici
ty
Safe
loca
tion
ECD
exp
osur
e
Acc
ess
to im
prov
ed s
anita
tion
Goo
d en
viro
nmen
tal
Fini
sh p
rim
ary
scho
ol o
n tim
e (a
ges
13–1
5)
No
over
crow
ding
Acc
ess
to s
afe
wat
er o
n si
te
Hav
e he
alth
insu
ranc
e
Source: Authors’ calculations based on General Household Survey (2010).
Box Measuring inequality of opportunity
2.2 The dissimilarity index (D-Index) is the measure of inequality of opportunity used in the analysis. It is the ratio of the penalty due to inequality to the coverage rate of a particular basic good or service. Intuitively, the D-Index measures the share of available opportunities that needs to be reallocated across circumstance groups in order to achieve equality of opportunity. A D-Index above 5 percent indicates non-negligible inequality of opportunity, and one above 10 can be considered problematic for policymaking.

S o u t h A f r i c A E c o n o m i c U p d a t E — F o c U s o n i n E q U a l i t y o F o p p o r t U n i t y
24
The most noticeable
progress appears to
have been in access to
improved sanitation,
electricity, and
telecommunications
A significant proportion of children ages 0–15 years (36 percent) live in areas not con-sidered safe. A D-Index of 4 percent produces an HOI (61 percent), not very different from the coverage rate. So, an overall lack of per-ceived safety is the problem, as opposed to high inequality, in how these conditions affect chil-dren of different circumstances.
How has South African children’s access to opportunities changed over time?The HOIs for South Africa are well short of universal coverage in many cases and generally are either at par with or behind comparator countries in Latin America, a region marked by high inequality. But have the HOIs improved over time? They appear to have measurably improved for each of the opportunities since the early 2000s, if with sharp variations in their progress (figure 2.10).31
The most noticeable progress appears to have been in access to improved sanitation, electricity, and telecommunications—for which the HOI increased by more than 50 percent-age points—and adequate infrastructure in school (as reported by parents). Opportunities corresponding to access to safe water on site, access to health insurance, school attendance for 12–15-year-olds, having adequate teachers
in school, and growing up in households that are not overcrowded showed much more mod-est gains.
Changes in the HOI are decomposed into a composition effect, scale effect, and equal-ization effect (see figure 2.10). The first refers to the change in the distribution of circum-stances that can be the result of broad demo-graphic changes, economic growth, or social progress. The second refers to proportional or parallel changes in coverage rates for all groups, perhaps as a result of a broad-based public policy. The third signifies a change in the coverage rate for the vulnerable groups for a given overall coverage, indicating the equity trend in society, perhaps as a result of targeted policies.
For the opportunities with the largest improvements, most of the gains were driven by the scale effect—a general expansion of the coverage rate of services across children of all circumstances. But for the opportunities of improved sanitation and telecommunications, an appreciable gain was also driven by the equalization effect with opportunities improv-ing more than proportionately for the weaker circumstance groups. The composition effect was small in most cases, highlighting the slow-moving changes in the relative circumstances
Figure Change in the HOI and decomposition of changes, 2002–10
2.10
0
10
20
30
40
50
60
70
Perc
enta
ge p
oint
cha
nge
Equalization Scale Composition Total change (2002–10)
Acc
ess
to t
elec
omun
icat
ions
Acc
ess
to im
prov
ed s
anita
tion
Ade
quat
e in
fras
truc
ture
in s
choo
l
Acc
ess
to e
lect
rici
ty
Scho
ol a
tten
danc
e (a
ges
6–11
)
Fini
sh p
rim
ary
scho
ol o
n tim
e
Acc
ess
to s
afe
wat
er o
n sit
e
No
over
crow
ding
Ade
quat
e te
ache
rs in
sch
ool
Scho
ol a
tten
danc
e (a
ges
12–1
5)
Hav
e he
alth
insu
ranc
e
Source: Authors’ calculations based on General Household Surveys (2002 and 2010).
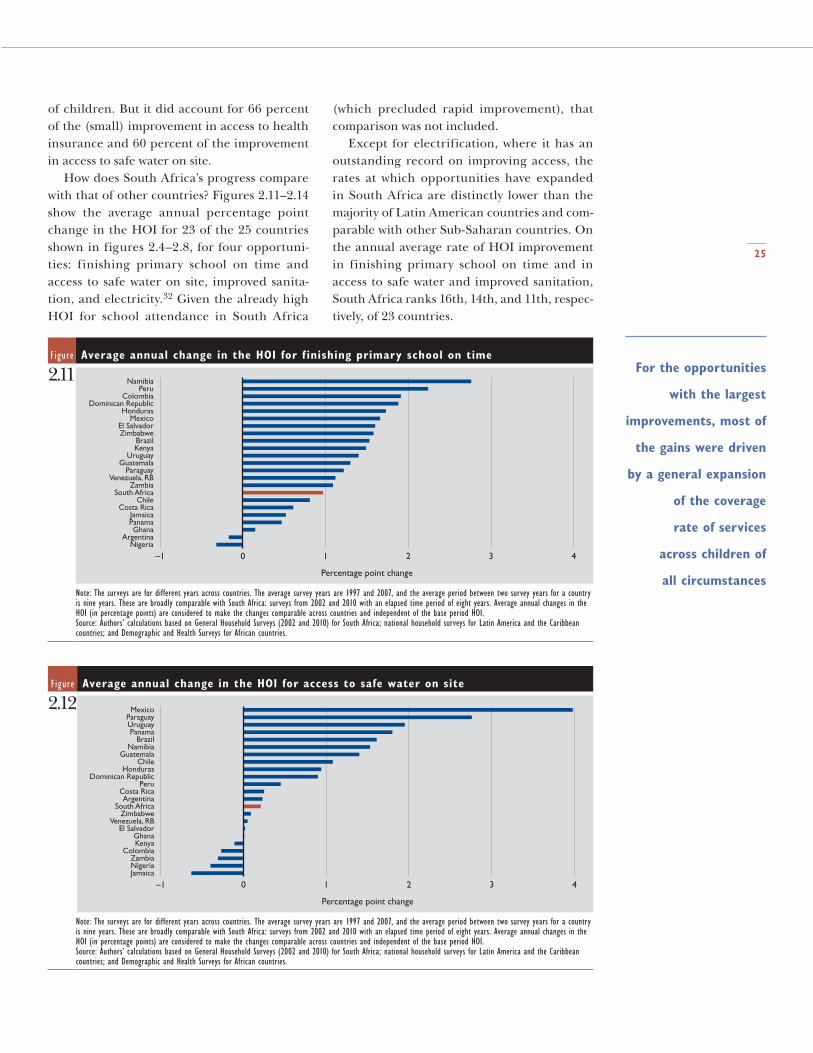
25
For the opportunities
with the largest
improvements, most of
the gains were driven
by a general expansion
of the coverage
rate of services
across children of
all circumstances
of children. But it did account for 66 percent of the (small) improvement in access to health insurance and 60 percent of the improvement in access to safe water on site.
How does South Africa’s progress compare with that of other countries? Figures 2.11–2.14 show the average annual percentage point change in the HOI for 23 of the 25 countries shown in figures 2.4–2.8, for four opportuni-ties: finishing primary school on time and access to safe water on site, improved sanita-tion, and electricity.32 Given the already high HOI for school attendance in South Africa
(which precluded rapid improvement), that comparison was not included.
Except for electrification, where it has an outstanding record on improving access, the rates at which opportunities have expanded in South Africa are distinctly lower than the majority of Latin American countries and com-parable with other Sub-Saharan countries. On the annual average rate of HOI improvement in finishing primary school on time and in access to safe water and improved sanitation, South Africa ranks 16th, 14th, and 11th, respec-tively, of 23 countries.
Figure Average annual change in the HOI for f inishing primary school on time
2.11
Percentage point change
–1 0 1 2 3 4Nigeria
ArgentinaGhana
PanamaJamaica
Costa RicaChile
South AfricaZambia
Venezuela, RBParaguay
GuatemalaUruguay
KenyaBrazil
ZimbabweEl Salvador
MexicoHonduras
Dominican RepublicColombia
PeruNamibia
Note: The surveys are for different years across countries. The average survey years are 1997 and 2007, and the average period between two survey years for a country is nine years. These are broadly comparable with South Africa: surveys from 2002 and 2010 with an elapsed time period of eight years. Average annual changes in the HOI (in percentage points) are considered to make the changes comparable across countries and independent of the base period HOI.Source: Authors’ calculations based on General Household Surveys (2002 and 2010) for South Africa; national household surveys for Latin America and the Caribbean countries; and Demographic and Health Surveys for African countries.
Figure Average annual change in the HOI for access to safe water on site
2.12
Percentage point change
–1 0 1 2 3 4JamaicaNigeriaZambia
ColombiaKenyaGhana
El SalvadorVenezuela, RB
ZimbabweSouth Africa
ArgentinaCosta Rica
PeruDominican Republic
HondurasChile
GuatemalaNamibia
BrazilPanama
UruguayParaguayMexico
Note: The surveys are for different years across countries. The average survey years are 1997 and 2007, and the average period between two survey years for a country is nine years. These are broadly comparable with South Africa: surveys from 2002 and 2010 with an elapsed time period of eight years. Average annual changes in the HOI (in percentage points) are considered to make the changes comparable across countries and independent of the base period HOI.Source: Authors’ calculations based on General Household Surveys (2002 and 2010) for South Africa; national household surveys for Latin America and the Caribbean countries; and Demographic and Health Surveys for African countries.

S o u t h A f r i c A E c o n o m i c U p d a t E — F o c U s o n i n E q U a l i t y o F o p p o r t U n i t y
26
The importance of
location is particularly
pronounced for
opportunities related
to infrastructure
variables
What circumstances shape inequality of opportunity in South Africa?For the opportunity of finishing primary schooling (13–15-year-olds), the D-Index of overall inequality of opportunity is 10 percent, more than half explained by the education of the household head and the gender of the child (figure 2.15).33,34 Note that decompositions are shown only for the seven opportunities for which the D-Index is 5 percent or higher, the level at which the measure generally becomes of policy concern.
Location of the household (whether a child lives in a township and informal settlement
or a rural area as opposed to other urban area) and education of the household head (a broad proxy for the socioeconomic status of the household) contribute most to inequality of opportunity. The importance of location is particularly pronounced for opportunities related to infrastructure variables such as access to safe water on site, improved sanita-tion, and electricity, ref lecting the disad-vantaged situations of rural areas and the townships and informal settlements. Education of the household head accounts for a sizable share of inequality in finishing primary school on time, having health insurance, exposure to
Figure Average annual change in the HOI for access to improved sanitation
2.13
Percentage point change
–1 0 1 2 3 4Honduras
ZambiaKenya
NigeriaUruguay
ZimbabweEl Salvador
GhanaPanamaJamaica
Venezuela, RBNamibia
South AfricaArgentinaColombiaParaguay
Dominican RepublicGuatemalaCosta Rica
ChileMexico
PeruBrazil
Note: The surveys are for different years across countries. The average survey years are 1997 and 2007, and the average period between two survey years for a country is nine years. These are broadly comparable with South Africa: surveys from 2002 and 2010 with an elapsed time period of eight years. Average annual changes in the HOI (in percentage points) are considered to make the changes comparable across countries and independent of the base period HOI.Source: Authors’ calculations based on General Household Surveys (2002 and 2010) for South Africa; national household surveys for Latin America and the Caribbean countries; and Demographic and Health Surveys for African countries.
Figure Average annual change in the HOI for access to electricity
2.14
Percentage point change
–1 0 1 2 3 4Zambia
Venezuela, RBArgentina
NigeriaKenya
UruguayZimbabweCosta Rica
MexicoNamibia
HondurasChile
PanamaBrazil
ParaguayColombia
Dominican RepublicPeru
GuatemalaGhana
JamaicaEl Salvador
South Africa
Note: The surveys are for different years across countries. The average survey years are 1997 and 2007, and the average period between two survey years for a country is nine years. These are broadly comparable with South Africa: surveys from 2002 and 2010 with an elapsed time period of eight years. Average annual changes in the HOI (in percentage points) are considered to make the changes comparable across countries and independent of the base period HOI.Source: Authors’ calculations based on General Household Surveys (2002 and 2010) for South Africa; national household surveys for Latin America and the Caribbean countries; and Demographic and Health Surveys for African countries.

27
The children most
vulnerable to not
completing primary
school, getting ECD
exposure, and not
having access to
safe water on site
are overwhelmingly
black Africans
ECD programs, and access to infrastructure (particularly electricity and adequate space in the house), underscoring the lock of the fam-ily’s socioeconomic background on children’s future.
Household composition—whether both parents of the child live at home and the total number of children up to the age of 16 who live in the same household—intuitively enough features most prominently for the opportunity to grow up in a house with no overcrowding. Ethnicity contributes to inequality in all oppor-tunities but does not rank among the top two contributors to inequality to any. Gender of the child contributes to inequality only for finish-ing primary school on time. That gender has such a limited role in explaining inequality in accessing infrastructure facilities is not surpris-ing, given that access is measured at the house-hold level (and not the individual child’s). Orphanhood—tragically common in South Africa—appears to matter little in its contribu-tion to inequality of opportunity.
These decompositions should not be taken to imply that race- and gender-based dispari-ties are not important. Rather, race and gender
are less important by themselves when other circumstances (which may be shaped by race and gender in the first place) are taken into account. This also implies that many of the apparent racial and gender gaps in opportuni-ties for children in South Africa today could be narrowed if opportunities could be equalized across groups differentiated by socioeconomic status and, above all, location.
Profiles of some vulnerable groups of South African children. Figure 2.16 profiles some of the vul-nerable groups of children for a select group of opportunities. For each opportunity, com-parisons are made between children in the low-est quintile (bottom 20 percent) and those in the highest quintile (top 20 percent) for their chances of accessing a service. For ease of pre-sentation, only three of the circumstances are highlighted: location, ethnicity, and education of the household head.
The children most vulnerable to not com-pleting primary school, getting ECD expo-sure, and not having access to safe water on site are overwhelmingly black Africans, under household heads who have either no education
Figure Contribution of circumstances to overall inequality, 2010
2.15 (decompositions of D-Index greater than 5 percent)
0
20
40
60
80
100
Mar
gina
l con
trib
utio
ns (
perc
ent)
Percent
Gender Ethnicity Household compositionOrphan status Education of the household headOther household characteristics Location D-Index
0
10
20
30
40
50
Hav
e he
alth
insu
ranc
e
Acc
ess
to s
afe
wat
er o
n sit
e
Acc
ess
to im
prov
ed s
anita
tion
No
over
crow
ding
Fini
sh p
rim
ary
Acc
ess
to e
lect
rici
ty
ECD
exp
osur
e
Safe
loca
tion
Acc
ess
to t
elec
omun
icat
ions
Ade
quat
e in
fras
truc
ture
in s
choo
l
Ade
quat
e te
ache
rs in
sch
ool
Scho
ol a
tten
danc
e (a
ges
12–1
5)
Scho
ol a
tten
danc
e (a
ges
6–11
)
Source: Authors’ calculations based on General Household Survey (2010).
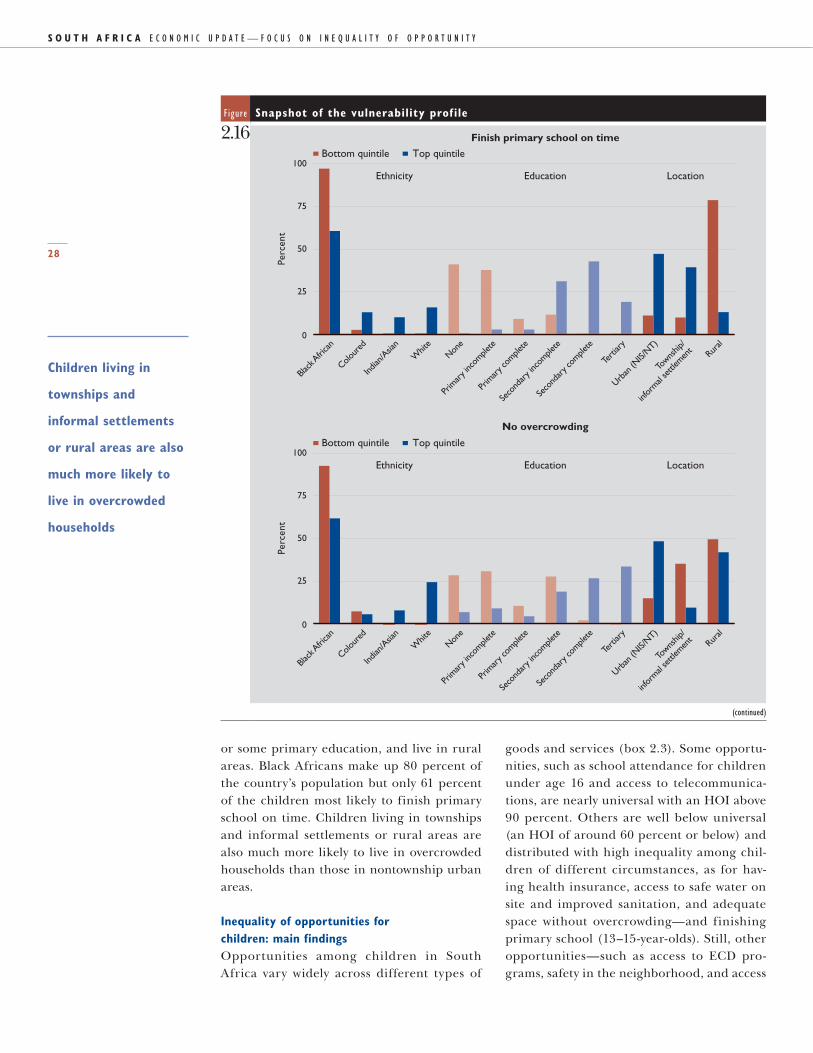
S o u t h A f r i c A E c o n o m i c U p d a t E — F o c U s o n i n E q U a l i t y o F o p p o r t U n i t y
28
Children living in
townships and
informal settlements
or rural areas are also
much more likely to
live in overcrowded
households
or some primary education, and live in rural areas. Black Africans make up 80 percent of the country’s population but only 61 percent of the children most likely to finish primary school on time. Children living in townships and informal settlements or rural areas are also much more likely to live in overcrowded households than those in nontownship urban areas.
Inequality of opportunities for children: main findingsOpportunities among children in South Africa vary widely across different types of
goods and services (box 2.3). Some opportu-nities, such as school attendance for children under age 16 and access to telecommunica-tions, are nearly universal with an HOI above 90 percent. Others are well below universal (an HOI of around 60 percent or below) and distributed with high inequality among chil-dren of different circumstances, as for hav-ing health insurance, access to safe water on site and improved sanitation, and adequate space without overcrowding—and finishing primary school (13–15-year-olds). Still, other opportunities—such as access to ECD pro-grams, safety in the neighborhood, and access
Figure Snapshot of the vulnerability profile
2.16
0
25
50
75
100
Perc
ent
Ethnicity Education
Finish primary school on time
Location
Bottom quintile Top quintile
Rural
Towns
hip/
infor
mal se
ttlem
ent
Urban
(NIS/
NT)
Terti
ary
Seco
ndar
y com
plete
Seco
ndar
y inc
omple
te
Prim
ary c
omple
te
Prim
ary i
ncom
plete
None
Whit
e
Indian
/Asia
n
Colour
ed
Black
Afri
can
0
25
50
75
100
Perc
ent
Bottom quintile Top quintile
Rural
Towns
hip/
infor
mal se
ttlem
ent
Urban
(NIS/
NT)
Terti
ary
Seco
ndar
y com
plete
Seco
ndar
y inc
omple
te
Prim
ary c
omple
te
Prim
ary i
ncom
plete
None
Whit
e
Indian
/Asia
n
Colour
ed
Black
Afri
can
Ethnicity
No overcrowding
Education Location
(continued)

29
South Africa
has achieved
near-universal access
to primary education,
a necessary first
step for equalizing
opportunities
among children
to electricity—are well below universal but have low to moderate inequality attributable to circumstances.
In international comparisons, South Africa fares well on school attendance but ranks below most comparators on the HOIs for finishing primary school on time and access to safe water on site, improved sanitation, and even electric-ity. Trends suggest improvements, but the gaps with other countries are generally not closing. Except for electricity, where South Africa’s aver-age annual progress has been exceptional, the progress on access to safe water and improved sanitation and on finishing primary school on
time puts it in the bottom half of international comparators.
The overall picture is therefore mixed. On the positive side, South Africa has achieved near-universal access to primary education, a necessary first step for equalizing oppor-tunities among children and an important success for the education system to build on. The meteoric rise in access to telecommunica-tions—from an HOI of around 30 in 2002 to more than 90 in 2010—and a big increase in the HOI for electricity are other milestones in improving opportunities for children in South Africa.
Figure Snapshot of the vulnerability profile (continued)
2.16
0
25
50
75
100
Perc
ent
Bottom quintile Top quintile
Rural
Towns
hip/
infor
mal se
ttlem
ent
Urban
(NIS/
NT)
Terti
ary
Seco
ndar
y com
plete
Seco
ndar
y inc
omple
te
Prim
ary c
omple
te
Prim
ary i
ncom
plete
None
Whit
e
Indian
/Asia
n
Colour
ed
Black
Afri
can
Ethnicity Education
Access to safe water on site
Location
0
25
50
75
100
Perc
ent
Bottom quintile Top quintile
Rural
Towns
hip/
infor
mal se
ttlem
ent
Urban
(NIS/
NT)
Terti
ary
Seco
ndar
y com
plete
Seco
ndar
y inc
omple
te
Prim
ary c
omple
te
Prim
ary i
ncom
plete
None
Whit
e
Indian
/Asia
n
Colour
ed
Black
Afri
can
Ethnicity Education
ECD exposure
Location
NIS/NT = noninformal settlement and nontownship.Source: Authors’ calculations based on General Household Survey (2010).

S o u t h A f r i c A E c o n o m i c U p d a t E — F o c U s o n i n E q U a l i t y o F o p p o r t U n i t y
30
Access to safe water
and improved
sanitation are
particularly critical
inputs for child health
Major challenges are the limited and unequal access to safe water on site and improved sanitation and the opportunity to finish primary school on time or be exposed to ECD programs, along with the general lack of physical safety—all of which create the con-ditions for children to develop their human potential. The research literature is rich with evidence linking childhood opportunities to future success. Preschoolers with low cognitive development have lower school achievement and earn lower wages in adulthood.35 And early childhood education has substantial long-term impacts, ranging from adult earnings to retirement savings.36 Access to safe water and improved sanitation are particularly critical inputs for child health, a determinant of nutri-tion status.
Inequality in labor market opportunitiesThe ability of individuals to find jobs com-mensurate with their qualifications—irrespec-tive of circumstances—is crucial for economic mobility and reductions in inequality. This is especially true in South Africa, with its chroni-cally high unemployment. Two key facts bring out the impact of exclusion from labor markets on income inequality in South Africa. First, close to 70 percent of the bottom income quin-tile was unemployed in 2008.37 Second, even those employed face sharp disparities in wage earnings based on race, gender, location, and union membership.
In analyzing inequality in labor market sta-tus and its links to individual circumstances, this section uses a modified version of the approach in the previous section.38,39 The
Box Contrasting opportunities of three children
2.3 Thandiwe and Nothando are black African girls, growing up in households headed by individuals with no education. Thandiwe lives in an urban township and Nothando in a village. Andries is a white boy, living in a household headed by someone who completed secondary education and in an urban area that is not a township or informal settlement. How does their access to basic opportu-nities in life differ?
It seems that both Thandiwe’s and Nothando’s chance of attending school up to the age of 15 are pretty high and just as good as Andries’s, a major achievement of post-apartheid South Africa (see box figure). But compared with Andries, they have lower chance of finishing primary school by age 15, having exposure to an early childhood development (ECD) program by age 4, and living in a safe environment with adequate space in the household. Their chance of having health insurance is virtually zero, compared with more than 60 percent for Andries, and their access to most measures of physical infrastructure, such as telephones, electricity, safe water on site, and improved sanitation, falls short.
Thandiwe and Nothando’s opportunities also vary greatly relative to each other, even though they are similar in all respects other than where they reside. For access to safe water on site, improved sanitation, and electricity, Thandiwe has a large advantage over Nothando, reflecting the vast gap in these services between urban townships/informal settlements and rural areas. For the opportuni-ties of primary school completion and access to ECD and telecommunications, Thandiwe has a small advantage over Nothando. Living in a township, however, puts Thandiwe at a disadvantage compared with Nothando in terms of a safe environment and adequate living space.
0.0 0.2 0.4 0.6 0.8 1.0
Have health insurance
Access to safe water on site
Access to improved sanitation
Finish primary school on time
No overcrowding
ECD exposure
Access to electricity
Safe location
Access to telecomunications
School attendance (ages 6–11)
School attendance (ages 12–15)
Nothando Thandiwe Andries
Probability of access to the opportunity
Source: Authors’ calculations based on General Household Survey (2010).

31
The ability of
individuals to find jobs
commensurate with
their qualifications—
irrespective of
circumstances—
is crucial for
economic mobility
and reductions
in inequality
analysis provides a rough but nonetheless intui-tive measure of the inequality between groups of working-age adults differentiated by various attributes. It allows an assessment of the contri-bution of circumstances (as opposed to that of acquired or innate characteristics such as edu-cation and age) to inequality of opportunity in the labor market.
Three definitions of a desirable employ-ment status are used for the analysis. Working-age adults (ages 15–64) are considered to have desirable employment if they (annex E):• Have a job (any job), as opposed to being
unemployed or discouraged from seeking employment.
• Are employed full-time, as opposed to being unemployed, underemployed, or discouraged.
• Are employed in the formal nonagricultural sector, as opposed to being employed in the informal sector outside agriculture.The first two definitions are closely aligned
with the common notions of unemployment and underemployment. The third definition is restricted to a sample of only those who are employed in the nonagricultural sector. The first two definitions are thus driven by what an individual considers desirable. To be unemployed (or underemployed), for example, is a less desirable outcome only for those who would like to be employed (or employed full-time). For the third definition, the assumption is that having a formal sector job is the pre-ferred status for those employed outside agri-culture, which seems reasonable.
Two types of individual attributes are con-sidered: circumstances (gender, ethnicity, and location—urban townships and informal settle-ments, other urban, or rural) and characteristics (education and age of the worker). The defini-tion of circumstances, as in the previous section, is clearly satisfied by gender and ethnicity. Loca-tion is more debatable as a circumstance because working-age individuals have some control over where they live. In practice, however, spatial mobility is restricted by cost considerations, (lack of) social networks, and cultural and family ties. In South Africa particularly, mobility out of rural areas and townships and informal settlements is fairly restricted because of historical reasons, most affecting the poorest.40
The list of circumstances is shorter than that for children because of data constraints, such as the lack of information about paren-tal characteristics for working-age adults. In addition to the circumstances, the characteris-tics of education and age of the individual are included as (imperfect) measures of acquired qualifications and experience.
What is the status of opportunities in the South African labor market?The relationship between circumstances and having a desirable employment status (under the three definitions here) can work through two channels: a direct effect (belonging to a particular race or gender group can affect the likelihood of getting a job just by virtue of these circumstances), and an indirect effect (circumstances can also influence the educa-tion, choices, and efforts of a person, which in turn influences the likelihood of getting a job). The analysis below will focus on the first chan-nel to assess inequality of opportunity in the labor market, due to conditions in that market.
Figure 2.17 summarizes the levels and changes in employment status and inequal-ity between 2008 and 2012, using comparable Quarterly Labour Force Survey data for both periods. The bars show an inequality-adjusted coverage (IAC) rate, and the lines show inequality between groups with varied char-acteristics. The IAC is analogous to the HOIs computed for children, with the crucial dif-ference being that the IAC and the inequality measure (or D-Index) are based on not just cir-cumstances—gender, ethnicity, and location—but also education and age.41
Thus the D-Index here reflects inequality between groups attributable to the direct effect of circumstances and differences in education and age. And it can be interpreted as the per-centage of total jobs that need to be reallocated across groups for all groups to have identical coverage rates. Differences in education, in turn, can arise from two types of effects: that of innate talent and effort, and the indirect effect of circumstances on education—likely to have occurred at an earlier stage of an individual’s life and not related to conditions in the labor market. The direct contribution of circum-stances to inequality, which can be attributed

S o u t h A f r i c A E c o n o m i c U p d a t E — F o c U s o n i n E q U a l i t y o F o p p o r t U n i t y
32
Among the
circumstances, location
appears to contribute
most to inequality
in employment
status, followed by
ethnicity and gender
to distortions in the labor market, would be an estimate of inequality of opportunity in the labor market.
The key facts that emerge:• The IAC (or opportunity) for being
employed fell between 2008 and 2012, while IACs for full-time employment and formal employment in nonagriculture improved slightly. Even as the employment situation worsened, those employed are now less likely to be underemployed and those employed outside agriculture are more likely to have formal employment.
• The fall in IAC for employment between 2008 and 2012 is due to a fall in the coverage rate and a rise in inequality. While the cov-erage rate declined from 72 to 66 percent during this time, between-group inequality increased—where the groups are differenti-ated by education, age, and circumstances.
• Inequality between groups in full-time employment increased from 2008 to 2012.
South Africa compared with other middle-income countries. For an international comparison, simi-lar IACs for employment are shown for 17 other middle-income countries in Latin America and the Caribbean and Europe and Central Asia. South Africa (13th among the 18 countries in per capita GDP) was ranked the lowest by IAC of employment and had the worst between-group inequality linked to finding a job (figure 2.18).42 In other words, an individual’s chances of
finding a job were not only the lowest in South Africa, but they were also the most strongly asso-ciated with education, age, and circumstances.43
What are the contributions of circumstances relative to acquired attributes to inequality in employment status?To unpack the nature of inequality in the labor market, overall inequality is decomposed into the contributions of education, age, and the direct effect of circumstances (which, as noted earlier, is distinct from the indirect effect through education).44 In most cases, more than half the between-group inequality is from the education and age attributes: this is the more acceptable part of the inequality because it is based on attributes (experience and skills) that should matter for rewards in job markets (figure 2.19). The remaining (unacceptable part of) inequality is attributable directly to circumstances—an estimate of inequality of opportunity in the labor market. The direct contribution of circumstances to inequality has fallen or remained unchanged in the past four years, while that of education has increased, most significantly for employment in the for-mal sector outside agriculture.
Among the circumstances, location appears to contribute most to inequality in employment status, followed by ethnicity and gender (figure 2.20). Between 2008 and 2012, the relative con-tribution of location to inequality in employment and full-time employment increased, while there
FigureInequality-adjusted coverage and inequality between groups differentiated by circumstances, education, and age
2.17
0
25
50
75
100
Employed in formal sector(nonagriculture)
Employed full-timeEmployed
Ineq
ualit
y-ad
just
ed c
over
age
(per
cent
)
D-Index (percent)
2008 2012 2008 2012
0
4
8
12
16
Note: The inequality-adjusted coverage for formal sector employment is higher than for the other two categories because it reflects the situation of only those who are employed whereas the other two categories encompass the entire labor force (with or without employment).Source: Authors’ calculations based on Quarterly Labour Force Surveys (2008q1 and 2012q1).

33
Being a non-white
young female,
educated below
secondary level, and
living in rural areas or
in urban townships or
informal settlements
appears to define the
vulnerability of being
employed or being
employed full-time
were small declines in that of ethnicity and gen-der. Employment in the formal nonagricultural sector stands out as the case where gender has little or no contribution to inequality between groups, while ethnicity and location contribute more than for the other two cases.
Profiles of inequality in employment opportunity. Figure 2.21 profiles the most and least vulnera-ble groups for their chances of being employed under the three employment categories. Being a non-white young female, educated below
secondary level, and living in rural areas or in urban townships or informal settlements appears to define the vulnerability of being employed or being employed full-time. Employ-ment in the formal sector shows no pattern by gender or age, but sharp differences appear by education, ethnicity, and location.45 Differ-entiating by location, rural residents have the highest vulnerability and are even less likely to be employed or employed full-time than town-ship residents. Among those already employed, rural workers have almost zero likelihood of
Figure D-Index and inequality-adjusted coverage by employment, circa 2008
2.18
0
20
40
60
80
100
Perc
ent
Inequality-adjusted coverage
Percent
D-Index
0
3
6
9
12
15
Ecua
dor
Bela
rus
Mex
ico
Rus
sian
Fed
erat
ion
Chi
le
Peru
Vene
zuel
a, R
B
Arg
entin
a
Braz
il
Dom
inic
an R
epub
lic
Ukr
aine
Bulg
aria
Kaz
akhs
tan
Serb
ia
Col
ombi
a
Rom
ania
Turk
ey
Sout
h A
fric
a
Note: Computed using similar but not identical definitions of circumstances across countries. Results for Latin America and the Caribbean and Europe and Central Asia may not match those from Quarterly Labour Force Surveys from the same countries.Source: Authors’ calculations based on Latino Barometro (2008) for Latin America and the Caribbean countries; Life in Transition Surveys (2006) for Europe and Central Asian countries; and Quarterly Labour Force Survey (2008q1) for South Africa.
Figure Decomposition of sources of inequality
2.19
0 20 40 60 80 100
2012
2008
2012
2008
2012
2008
Empl
oyed
info
rmal
sec
tor
(non
agri
cultu
re)
Empl
oyed
full-
time
Empl
oyed
Circumstances Age Education
Percent
Note: The contribution of each circumstance is expressed as percent of total between-group inequality measured by the D-Index.Source: Authors’ calculations based on Quarterly Labour Force Surveys (2008q1 and 2012q1).

S o u t h A f r i c A E c o n o m i c U p d a t E — F o c U s o n i n E q U a l i t y o F o p p o r t U n i t y
34
The chances of finding
employment for a
township and informal
settlement resident
and especially a rural
resident do not stack
up favorably against
a compatriot living in
other urban areas
working in the formal sector outside agricul-ture, while township workers fare far better.
How do labor market opportunities vary among different subgroups of the population?
Location. How does the place of residence affect employment prospects in South Africa? Clearly, the chances of finding employment for a township and informal settlement resident and especially a rural resident do not stack up favorably against a compatriot living in other
urban areas (figure 2.22).46 This suggests that unemployment and underemployment are much more serious in townships and informal settlements and particularly rural areas.
Inequality between groups in employment (measured by the D-Index) and full-time employment is high across the urban land-scape, with the bias again stronger against resi-dents of townships and informal settlements. Inequality between groups is extremely high in rural areas (much higher than in urban areas), and it got significantly worse for employment
Figure How circumstances contribute to inequality
2.20
0
10
20
30
201220082012200820122008
Ineq
ualit
y-ad
just
ed c
over
age
(per
cent
)
Percent
Gender Ethnicity Location D-Index
0
5
10
15
Employed in formal sector(nonagriculture)
Employed full-timeEmployed
Note: The contribution of each circumstance is expressed as percent of total between-group inequality measured by the D-Index.Source: Authors’ calculations based on Quarterly Labour Force Surveys (2008q1 and 2012q1).
Figure Profiles of top quintile and bottom quintile by probability, 2012
2.21
0
25
50
75
100Employment Full-time employment
Employment in formal sector(nonagriculture)
Bottom quintile Top quintile
Perc
ent
Age
(av
erag
e)
Belo
w s
econ
dary
edu
catio
n
Rur
al
TS
or IS
Non
-whi
te
Fem
ale
0
25
50
75
100
Age
(av
erag
e)
Belo
w s
econ
dary
edu
catio
n
Rur
al
TS
or IS
Non
-whi
te
Fem
ale
0
25
50
75
100
Age
(av
erag
e)
Belo
w s
econ
dary
edu
catio
n
Rur
al
TS
or IS
Non
-whi
te
Fem
ale
TS = township; IS = informal settlementNote: “Probability” refers to probability of having an opportunity, defined as “employment,” “full-time employment,” and “employment” in formal sector (for those employed outside agriculture).Source: Authors’ calculations based on Quarterly Labour Force Surveys (2012q1).

35
For residents of urban
townships, informal
settlements, and rural
areas, age appears
to be the biggest
factor in explaining
the inequality in
their access to
employment and
full-time employment
and full-time employment between 2008 and 2012.
For residents of urban townships, informal settlements, and rural areas, age appears to be the biggest factor in explaining the inequal-ity (D-Index) between groups in their access
to employment and full-time employment, an especially difficult situation for the township and rural youth (figure 2.23). Education and gender are a distant second. For having a for-mal sector nonagricultural job (among those already employed), the role of education has
Figure D-Index and inequality-adjusted coverage by location, 2008 and 2012
2.22
0
25
50
75
100
0
5
10
15
20
Perc
ent Percent
Employed in formal sector(nonagriculture)
Employed full-timeEmployed
201220122012 200820082008
Rur
al
Urb
an T
S/IS
Urb
an n
on-T
S/IS
Rur
al
Urb
an T
S/IS
Urb
an n
on-T
S/IS
Rur
al
Urb
an T
S/IS
Urb
an n
on-T
S/IS
Rur
al
Urb
an T
S/IS
Urb
an n
on-T
S/IS
Rur
al
Urb
an T
S/IS
Urb
an n
on-T
S/IS
Rur
al
Urb
an T
S/IS
Urb
an n
on-T
S/IS
D-Index Inequality-adjusted coverage
TS = township; IS = informal settlementNote: Circumstances/characteristics are gender, ethnicity, education, and age. The D-Index refers to between-group inequality (groups differentiated by gender, ethnicity, education, and age) among TS/IS or non-TS/IS workers.Source: Authors’ calculations based on Quarterly Labour Force Surveys (2008q1 and 2012q1).
Figure Decomposition of sources of inequality, 2008 and 2012
2.23
0
20
40
60
80
100
Perc
ent
Education Age Ethnicity Gender
Employed in formal sector(nonagriculture)
Employed full-timeEmployed
201220122012 200820082008
Rur
al
Urb
an T
S/IS
Urb
an n
on-T
S/IS
Rur
al
Urb
an T
S/IS
Urb
an n
on-T
S/IS
Rur
al
Urb
an T
S/IS
Urb
an n
on-T
S/IS
Rur
al
Urb
an T
S/IS
Urb
an n
on-T
S/IS
Rur
al
Urb
an T
S/IS
Urb
an n
on-T
S/IS
Rur
al
Urb
an T
S/IS
Urb
an n
on-T
S/IS
TS = township; IS = informal settlementNote: Circumstances/characteristics are gender, ethnicity, education, and age. Columns show the percentage contribution of every circumstance/characteristic to the D-Index (between-group inequality among groups differentiated by gender, ethnicity, education, and age) for each type of worker.Source: Authors’ calculations based on Quarterly Labour Force Surveys (2008q1 and 2012q1).
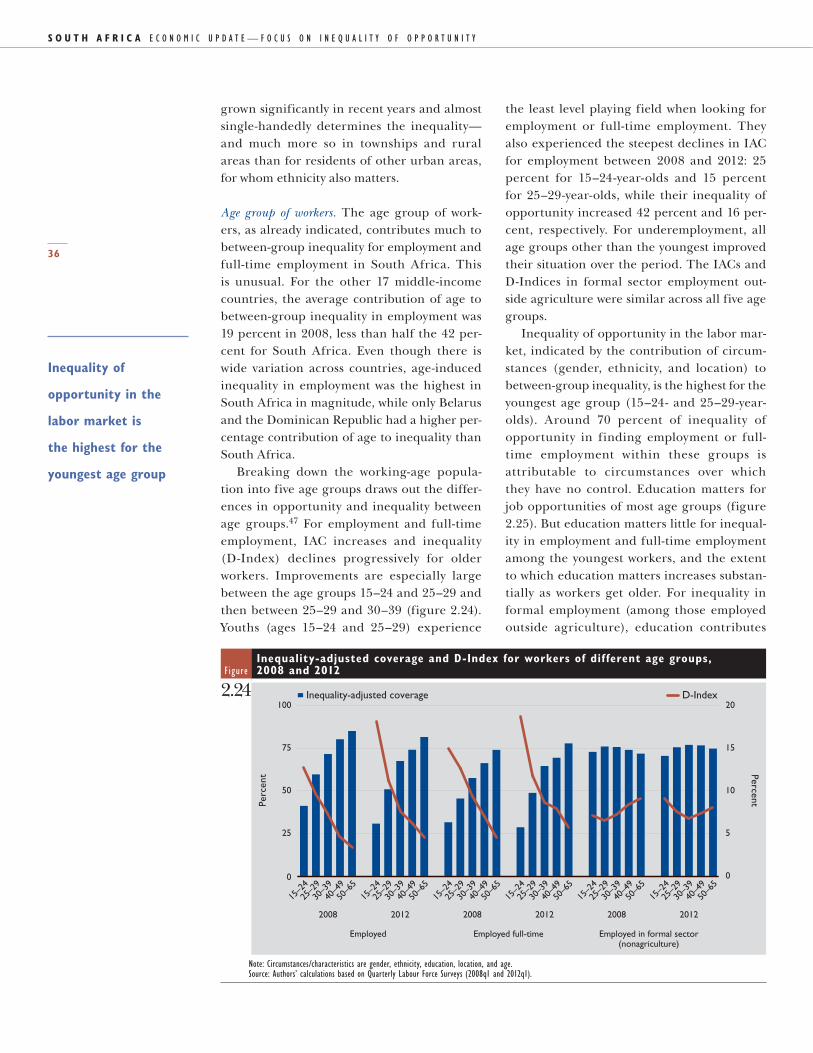
S o u t h A f r i c A E c o n o m i c U p d a t E — F o c U s o n i n E q U a l i t y o F o p p o r t U n i t y
36
Inequality of
opportunity in the
labor market is
the highest for the
youngest age group
grown significantly in recent years and almost single-handedly determines the inequality—and much more so in townships and rural areas than for residents of other urban areas, for whom ethnicity also matters.
Age group of workers. The age group of work-ers, as already indicated, contributes much to between-group inequality for employment and full-time employment in South Africa. This is unusual. For the other 17 middle-income countries, the average contribution of age to between-group inequality in employment was 19 percent in 2008, less than half the 42 per-cent for South Africa. Even though there is wide variation across countries, age-induced inequality in employment was the highest in South Africa in magnitude, while only Belarus and the Dominican Republic had a higher per-centage contribution of age to inequality than South Africa.
Breaking down the working-age popula-tion into five age groups draws out the differ-ences in opportunity and inequality between age groups.47 For employment and full-time employment, IAC increases and inequality (D-Index) declines progressively for older workers. Improvements are especially large between the age groups 15–24 and 25–29 and then between 25–29 and 30–39 (figure 2.24). Youths (ages 15–24 and 25–29) experience
the least level playing field when looking for employment or full-time employment. They also experienced the steepest declines in IAC for employment between 2008 and 2012: 25 percent for 15–24-year-olds and 15 percent for 25–29-year-olds, while their inequality of opportunity increased 42 percent and 16 per-cent, respectively. For underemployment, all age groups other than the youngest improved their situation over the period. The IACs and D-Indices in formal sector employment out-side agriculture were similar across all five age groups.
Inequality of opportunity in the labor mar-ket, indicated by the contribution of circum-stances (gender, ethnicity, and location) to between-group inequality, is the highest for the youngest age group (15–24- and 25–29-year-olds). Around 70 percent of inequality of opportunity in finding employment or full-time employment within these groups is attributable to circumstances over which they have no control. Education matters for job opportunities of most age groups (figure 2.25). But education matters little for inequal-ity in employment and full-time employment among the youngest workers, and the extent to which education matters increases substan-tially as workers get older. For inequality in formal employment (among those employed outside agriculture), education contributes
FigureInequality-adjusted coverage and D-Index for workers of different age groups, 2008 and 2012
2.24
0
25
50
75
100
Perc
ent Percent
Inequality-adjusted coverage D-Index
0
5
10
15
20
20122012 200820082008 2012
Employed in formal sector(nonagriculture)
Employed full-timeEmployed
50–6
540
–49
30–3
925
–29
15–2
450
–65
40–4
930
–39
25–2
915
–24
50–6
540
–49
30–3
925
–29
15–2
450
–65
40–4
930
–39
25–2
915
–24
50–6
540
–49
30–3
925
–29
15–2
450
–65
40–4
930
–39
25–2
915
–24
Note: Circumstances/characteristics are gender, ethnicity, education, location, and age.Source: Authors’ calculations based on Quarterly Labour Force Surveys (2008q1 and 2012q1).

37
Among circumstances,
location matters the
most across the board,
followed by ethnicity
and then gender
significantly to inequality for all age groups, but again matters the least for the youngest age group.
Thus the opportunities of employment and full-time employment seem to be the least meritocratic for workers below age 30, with meritocracy improving progressively with age. Even though inequality of opportunity is gener-ally lower (and meritocracy higher) for formal employment outside agriculture (among those already employed), the age divide in inequal-ity of opportunity persists here as well: circum-stances matter the most for the youngest age group. Among circumstances, location matters the most across the board, followed by ethnic-ity and then gender. Interestingly, even among the group of youngest workers, differences in age matters substantially for the chance of being employed and employed full-time.
Inequality of employment opportunities: main findingsGiven its high unemployment rates, it is not surprising that South Africa does much worse on labor market opportunities than other mid-dle-income countries. It is still interesting and telling, however, that its relative performance is explained not only by too few jobs, but also by the inequality that persists between differ-ent groups in their access to these few jobs. Reflecting the adverse effects of the global financial crisis, the inequality-adjusted cover-age fell for finding employment. In part, this
reflected fewer supply of jobs on account of the global crisis. But this was also because of a rise in inequality between groups, which cannot be attributed to the global crisis.
The causes of inequality in labor markets have changed in the past four years. The con-tribution of education has increased, while that of circumstances of gender and ethnicity has fallen slightly. Where a person seeking employ-ment lives, however, matters more now than it did four years ago.
The rising importance of education carries its own challenges: the disadvantages conferred by unequal opportunities in education earlier in life are an increasingly consequential stum-bling block to the social and economic mobility of individuals, for whom having a job is crucial. For employment in the formal sector outside agriculture, a measure of quality jobs with some stability, education accounts for more than half the inequality in employment, the contribution having risen 8 percentage points in four years. The particularly strong impact of education on the likelihood of having a formal sector job points to a high and rising skills pre-mium in the labor market, confirming findings in the literature.48 The wage inequality from the skills premium is a key driver of income inequality in South Africa.
The employment situation appears to be particularly challenging for young workers and residents of townships, informal settle-ments, and rural areas. An individual’s age is
Figure Decomposition of sources of inequality by age group
2.25
0
20
40
60
80
100
50–6540–4930–3925–2915–2450–6540–4930–3925–2915–2450–6540–4930–3925–2915–24
Perc
ent
Education Age Location Ethnicity Gender
Employed in formal sector(nonagriculture)
Employed full-timeEmployed
Note: Circumstances/characteristics are gender, ethnicity, education, and age. Columns show the percentage contribution of every circumstance/characteristic to D-Index, for each age group.Source: Authors’ calculations based on Quarterly Labour Force Surveys (2008q1 and 2012q1).

S o u t h A f r i c A E c o n o m i c U p d a t E — F o c U s o n i n E q U a l i t y o F o p p o r t U n i t y
38
Whether a person
is born a boy or a
girl, black or white,
in a township or
leafy suburb, to an
educated and well-off
parent or otherwise
should not be relevant
to reaching his or
her full potential
an unusually large contributor to inequality in employment in South Africa, more than for many other middle-income countries, with the odds increasingly stacked against the youngest workers. Inequality of opportunity, the part of inequality attributable to circumstances that an individual has little or no control over, is also higher among young workers than among older workers. Thus not only do young workers face a disadvantage in the labor market due to their age, they also compete for jobs in a market seemingly more “unfair” in allocating opportunities among the young: a young per-son’s chances of having a job, a full-time job, or a formal sector job seem to depend more on circumstances beyond their control than the skills they have acquired.
In addition to being young and living in cer-tain locations, being a woman and non-white still matters, increasing the likelihood of being unemployed or underemployed significantly (over and above any impact of these attributes on education).
It is sobering to note that inequality of opportunity in employment—the part of inequality attributable to circumstances—would be higher than what is estimated here if the indirect effect of circumstances through education were also taken into account. The analysis here focused on inequality produced in the labor market and did not take into account the unequal distribution of opportu-nities earlier in life (such as timely completion of schooling or ECD exposure) that matter for human capital formation and are also affected by these circumstances.
In some ways, the contributions of specific circumstances (like race and location) to inequality in the labor market could also be overstated here, since circumstances related to parental socioeconomic background, which are likely to be correlated with these attributes, are missing from the analysis due to a lack of data. Recall that gender and race had a smaller contribution to inequality of opportunity for children once the contributions of other fac-tors, including socioeconomic attributes of the child’s family and parents, were accounted for. Without clear evidence, the contributions of race and location are best interpreted as reflecting socioeconomic factors, including
(but not exclusively) race and location, in explaining inequality in the labor market.
ConclusionsAn equitable society would not allow circum-stances over which the individual has no control to influence her or his basic opportunities after birth. Whether a person is born a boy or a girl, black or white, in a township or leafy suburb, to an educated and well-off parent or otherwise should not be relevant to reaching his or her full potential: ideally, only the person’s effort, innate talent, choices in life, and, to an extent, sheer luck, would be the influencing forces. This is at the core of the equality of opportunity principle, which provides a powerful platform for the formulation of social and economic policy—one of the rare policy goals on which a political consensus is easier to achieve.
As with any other policy, an intuitive and objective measure of progress is crucial. The development of the human opportunity index, extensively presented in this report for various childhood- and employment-related oppor-tunities, has helped fulfill this requirement for the equality of opportunity objective. The HOI is a powerful tool to measure and track a society’s progress on equitable distribution of basic opportunities. Together with a robust data gathering and monitoring and evalua-tion system, it can help improve the targeting and efficacy of social policy. Making use of it, a number of countries in Latin America, includ-ing Brazil and Peru, have begun confronting their inherent inequalities with proactive and increasingly well-targeted social policies, with positive initial results. South Africa, with its entrenched inequality inextricably linked to its people’s varied circumstances, has a chance to forge a similar path of policy correction.
Extraneous circumstances that a child is born into (ethnicity, location, gender, and family background) were found in this report to variably affect the child’s access to basic opportunities in South Africa. Moreover, some of the circumstances (location and eth-nicity in particular) are also important for inequality in employment opportunities later in the child’s life. This raises the prospect of a vicious cycle of adverse circumstances that compounds inequalities over multiple stages in

39
There are no simple,
elegant policy
solutions in the
quest for equity
life, and over the lives of multiple generations. A rural black African girl, for example, grow-ing up with far fewer opportunities to develop to her full potential is also less likely to find employment opportunities as a young adult. Put differently, the child with disadvantageous circumstances not only has to work harder to overcome the disadvantages, but having done so, finds that these reemerge when seeking employment as an adult. Moreover, the disad-vantages do not stop with one person—they get transmitted across generations.
How to break through this vicious, self-per-petuating cycle of inequality in South Africa? To be sure, that would involve leveling the play-ing field in the quality of education children get and the employment opportunities they face as young adults, irrespective of location, gender, or ethnicity. Paying special attention to the water, sanitation, and health care needs of rural areas and townships and to overcrowding in townships would also be important.
Policy design needs to recognize that chil-dren of certain circumstances are vulnerable
to deprivations in multiple dimensions simul-taneously. For example, black South Africans living in rural areas, and with household heads who did not complete primary schooling, are much more likely not to complete primary school, be exposed to an ECD program, or have access to health insurance. The presence of multiple deprivations points to the need for policy programs in different sectors (health and education, for example) to coordinate closely in order to achieve better efficiency and the best results.
Of course, there are no simple, elegant policy solutions in the quest for equity. One important lesson from international experi-ence is that a dynamic system involving policy experimentation (from incentives for training and hiring of young workers to monitorable and incentive-based delivery of public services), backed by rigorous impact evaluation and greater participation of communities in the actual delivery of basic public service delivery and in the feedback loops for policymakers, is crucial.


41
ANNEx A
Illustrating the Human Opportunity Index with a simple example
Consider two societies A and B in which half the population lives in rural areas and the other half in urban areas. Now consider a basic opportunity such as access to primary educa-tion. Say that 50 percent of all children go to school in both societies. Looking at the over-all coverage, they both will appear similarly placed. But suppose we also know that in soci-ety A, no rural child attends a school; while in society B, 50 percent of both rural and urban children attend school. The Human Opportu-nity Index (HOI) discounts the coverage rate of 50 percent by imposing a “penalty” when access is more unequal based on circumstances such as location.
The imposed “penalty” can be interpreted as the share of the total number of opportunities that need to be redistributed to ensure equita-ble access based on the equality of opportunity principle. In society A, this will constitute “real-locating” 25 percent of total enrollments from urban children to rural children. Therefore, the penalty would be 25 percent and the HOI, which is the coverage minus the penalty, would equal 25 percent. For society B, there is no inequality based on location, and the penalty is zero. This implies that the HOI is 50 percent, or equal to the coverage. So, based on the equality of opportunity criteria, society B is more equal than society A, even though average enrollment rate is the same in both societies.

42
First, it is sensitive to scale—if access improves for all groups by, say, a factor of k (additively or multiplicatively), then the Human Opportu-nity Index (HOI) changes by the same factor k. Second, it rewards Pareto improvement—if the coverage rate improves for one circumstance-group without decreasing coverage rates for the remaining groups, the HOI will rise. Third, the measure will always improve if access changes in a way that the more vulnerable groups (groups with coverage rates lower than the overall coverage rate) have higher access.
An important caveat is that this measure is sensitive to the set of circumstances chosen for analysis. But this is mitigated by an additional property that is highly desirable given that it is seldom possible to identify all relevant circum-stances for any population and opportunity: the HOI will not be higher if more circum-stances are added to the existing set of circum-stances in the analysis. This implies that the computed inequality serves as a lower bound to the “actual” inequality where all circumstances of interest could be included in the analysis.
ANNEx B
Three key properties of the Human Opportunity Index
Source: Barros, Molinas Vega, and Saavedra 2010.

43
ANNEx C
Estimating the Human Opportunity Index from household survey data
To construct the HOI, we need to obtain the conditional probabilities of access to oppor-tunities for each child based on the circum-stances. To do so, we can estimate a logistic model, linear in the parameters β, where event I corresponds to accessing the opportunity (such as safe water), and x the set of circum-stances (such as gender of the child and educa-tion and gender of the head of the household).
An important caveat to the logistic estima-tion model is that the list of regressors does not include any interaction terms between
circumstances (such as between parental education and location). Given the number of circumstances (all are dummy variables), limited sample sizes, and the large number of countries and opportunities for which these regressions have to be run, including inter-actions would lead to intractable problems in at least some cases. The interaction terms are thus omitted, even though translating the exact definition of the D-Index to the logis-tic regression model would require including these terms.
Source: Barros, Molinas Vega, and Saavedra 2010.

44
ANNEx D
Opportunities and circumstances for children
Table What constitutes opportunities for South African children?
D1Opportunities Description
Human development
School attendance (ages 6–11) Currently attending educational institution for children ages 6–11
School attendance (ages 12–15) Currently attending educational institution for children ages 12–15
Finish primary school on time (ages 13–15)
Completed primary (seventh grade) education for children ages 13–15
Adequate infrastructure in school No lack of books and no facilities in bad conditions (parental responses)
Adequate teachers in school Teacher quality not poor, no lack of teachers, and no classes too large/too many learners (parental responses)
ECD exposure Exposed to an early childhood development program in any way for children ages 0–4
Have health insurance Covered by a medical aid or medical benefit scheme or other private health insurance for children ages 0–16
Basic infrastructure
No overcrowding Equal or below 1.5 person per room for children ages 0–16
Access to safe water on site Source of drinking water is piped water (dwelling or yard), borehole, or rainwater for children ages 0–16
Access to improved sanitation Type of toilet facility is flush toilet (public sewerage or septic tank), chemical toilet, or pit latrine/toilet with ventilation pipe (in the yard or dwelling) for children ages 0–16
Access to electricity The household has a connection to the MAINS electricity supply for children ages 0–16
Access to telecommunications Access to a telephone or cell phone in the household for children ages 0–16
Security
Safe location Members of the household feel very safe or rather safe living here
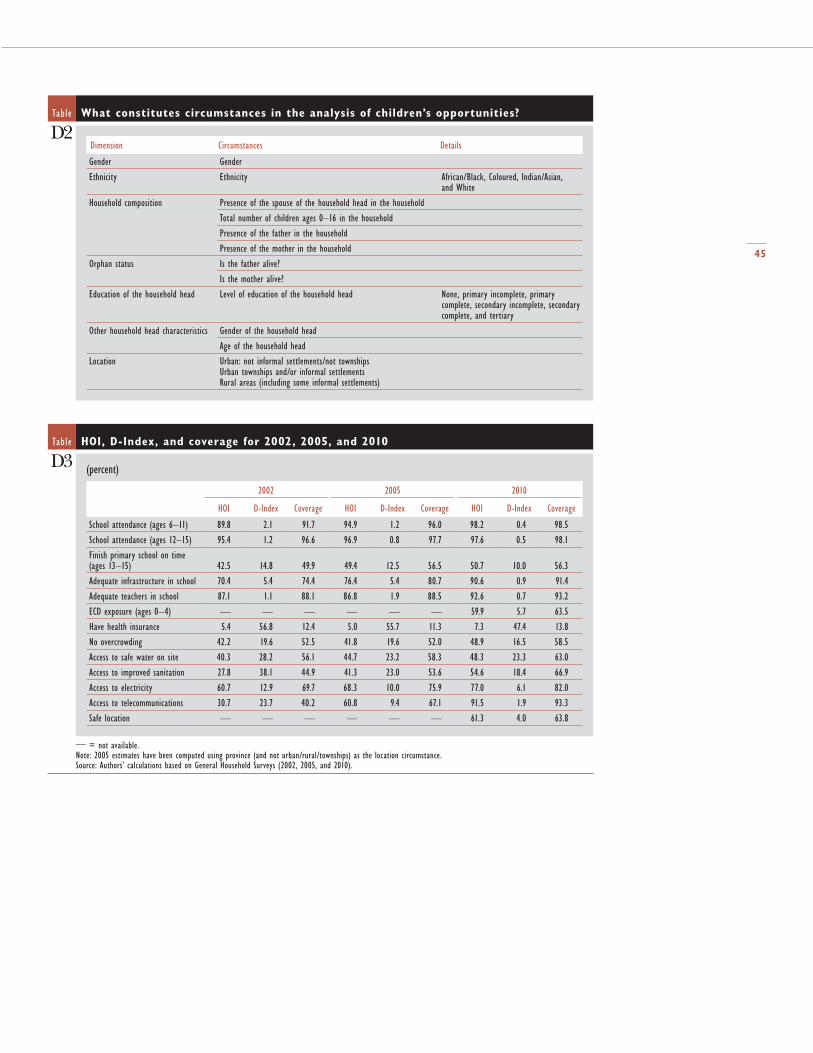
45
Table What constitutes circumstances in the analysis of children’s opportunities?
D2Dimension Circumstances Details
Gender Gender
Ethnicity Ethnicity African/Black, Coloured, Indian/Asian, and White
Household composition Presence of the spouse of the household head in the household
Total number of children ages 0–16 in the household
Presence of the father in the household
Presence of the mother in the household
Orphan status Is the father alive?
Is the mother alive?
Education of the household head Level of education of the household head None, primary incomplete, primary complete, secondary incomplete, secondary complete, and tertiary
Other household head characteristics Gender of the household head
Age of the household head
Location Urban: not informal settlements/not townshipsUrban townships and/or informal settlementsRural areas (including some informal settlements)
Table HOI, D-Index, and coverage for 2002, 2005, and 2010
D3 (percent)
2002 2005 2010
HOI D-Index Coverage HOI D-Index Coverage HOI D-Index Coverage
School attendance (ages 6–11) 89.8 2.1 91.7 94.9 1.2 96.0 98.2 0.4 98.5
School attendance (ages 12–15) 95.4 1.2 96.6 96.9 0.8 97.7 97.6 0.5 98.1
Finish primary school on time (ages 13–15) 42.5 14.8 49.9 49.4 12.5 56.5 50.7 10.0 56.3
Adequate infrastructure in school 70.4 5.4 74.4 76.4 5.4 80.7 90.6 0.9 91.4
Adequate teachers in school 87.1 1.1 88.1 86.8 1.9 88.5 92.6 0.7 93.2
ECD exposure (ages 0–4) — — — — — — 59.9 5.7 63.5
Have health insurance 5.4 56.8 12.4 5.0 55.7 11.3 7.3 47.4 13.8
No overcrowding 42.2 19.6 52.5 41.8 19.6 52.0 48.9 16.5 58.5
Access to safe water on site 40.3 28.2 56.1 44.7 23.2 58.3 48.3 23.3 63.0
Access to improved sanitation 27.8 38.1 44.9 41.3 23.0 53.6 54.6 18.4 66.9
Access to electricity 60.7 12.9 69.7 68.3 10.0 75.9 77.0 6.1 82.0
Access to telecommunications 30.7 23.7 40.2 60.8 9.4 67.1 91.5 1.9 93.3
Safe location — — — — — — 61.3 4.0 63.8
— = not available.Note: 2005 estimates have been computed using province (and not urban/rural/townships) as the location circumstance.Source: Authors’ calculations based on General Household Surveys (2002, 2005, and 2010).

46
ANNEx E
Inequality in employment opportunities
Table Definition of variables to measure “opportunities” in labor market
E1Status Universe of workers Desirable labor market status Less desirable labor market status
Free from unemployment or employed
Those in labor force (employed, unemployed, or discouraged)
Employed part-time or full-time Unemployed or discouraged from participation in labor market
Free from underemployment or employed full-time
Those in labor force (employed, unemployed, or discouraged)
Employed for 35 hours a week or more Underemployed, unemployed, or discouraged from participation in labor market
Employment in the formal sector (nonagricultural workers)
In the age group 15–64, those who are employed in the nonagricultural sectors
Employees in firms with more than five employees or firms who deduct income tax from salaries. Or employers, own account workers, and persons helping unpaid in their household business, who are registered for either income tax or value-added tax
Employed in the nonagricultural sector, but not in a firm or as an employer who meets the definition of formality
Note: All variables refer to the working-age group of ages 15–64. “Underemployed” refers to those who are working less than 35 hours a week and looking for full-time employment.
Table Definition of circumstances and characteristics in labor market
E2Circumstances
Gender Male/female
Ethnicity African/Black, Coloured, Indian/Asian, and White
Location Urban: not informal settlements/not townships; urban townships and/or informal settlements; and rural areas (including some informal settlements)
Characteristics
Education of the worker None, primary incomplete, primary complete, secondary incomplete, secondary complete, and tertiary
Age of the worker Number of years

47
1. This section on global economic prospects draws on parts of the June 2012 Global Economic Prospects report prepared by the Development Economics group of the World Bank. The full report is acces-sible at http://siteresources.worldbank.org/INTPROSPECTS/Resources/334934 -1322593305595/8287139-1339427993716/GEPJune2012_Full_Report.pdf.
2. In part this reflects the fact that develop-ing country borrowers (especially corpo-rates) had issued international bonds at a record pace up until April, taking advan-tage of low funding costs and robust inves-tor appetite for emerging market debt.
3. South Africa and the rest of the region do not face the capacity constraint problem, with manufacturing capacity utilization running at 80 percent and severe unem-ployment rates.
4. South African Reserve Bank 2012.5. We use the fact that sample for each Quar-
terly Labour Force Survey is divided into four subgroups called rotation groups, with one of these groups being rotated each quarter. This implies that roughly half of the households will be available in the sample after six months, which will allow us to examine the flows from a given employment status to another. The match-ing process to construct the transition matrices was done using the household’s unique identification number, the worker age, the race, and the gender—and for those observations that were inconclusive
we also used the relevant variable for the person’s education attainment.
6. The employment categories are: employed, unemployed, discouraged worker, and other inactive. We constrain the sample to the working-age population (15–64) and to those observations that we were able to match.
7. Townships and informal settlements, far removed as they are, are also ill-served by any form of public transportation, having thus to rely largely on private taxis that charge a hefty amount—on average close to 20–30 percent of the daily minimum wage for a round trip to work by some accounts.
8. World Bank 2011b.9. The literature finds that roughly half
the overall inequality is generated by between-race inequality, with the within-race inequality contributing the other half. There is a weaker consensus on the contribution of the two components to the increase in inequality since apartheid. Leibbrandt and others (2010) find that the contribution of inequality between racial groups fell over 1993–2008 while that of the inequality within racial groups increased. Bhorat and van der Westhuizen (2011) find the opposite trends for the two subcomponents for the 1995–2005 period.
10. Leibbrandt and others (2010), based on 2008 National Income Dynamics Survey.
11. Wage income contributes to more than 85 percent to the overall income inequality (Leibbrandt and others 2010).
Notes

S o u t h A f r i c A E c o n o m i c U p d a t E — F o c U s o n i n E q U a l i t y o F o p p o r t U n i t y
48
12. Bhorat and van der Westhuizen (2011) report that over 1995–2005 poverty reduc-tion was much more pronounced at a lower poverty line, suggesting that those in deeper poverty experienced more signifi-cant income gains. Leibbrandt and others (2010) argue that while the pace of poverty reduction over 1993–2008 was modest, the depth of poverty measure saw a much more noticeable improvement, again sug-gesting that those at the lower end saw faster improvement.
13. The grants—whose main components are the Child Support Grant, State Old Age Pension Grant, the Disability Grant, and the Foster Care Grant—have increased in coverage from 3 million recipients (7 per-cent) in 1997 to more than 16 million in 2012 (32 percent), with the amount as a share of GDP increasing from 2.5 percent in 1996/97 to 4.0 percent in 2011/12.
14. Leibbrandt and others 2010.15. Bhorat and van der Westhuizen 2011.16. Bhorat and van der Westhuizen (2011)
find that in 2005 income Gini would increase from 0.72 (including social assis-tance grants) to 0.77 (without the grant incomes).
17. Perhaps most important for the pro-posed work are the contributions of John Roemer, whose 1998 work Equality of Oppor-tunity was the first to formalize an equality of opportunity principle (Roemer 1998).
18. See, for example, Chetty and others (2010) for evidence that early childhood educa-tion has substantial long-term impacts, ranging from adult earnings to retirement savings. Child malnutrition has also been shown to generate life-long learning diffi-culties, poor health, and lower productiv-ity and earnings over a lifetime (Alderman and others 2001; Hoddinott and others 2008).
19. Barros and others 2009; Barros, Molinas Vega, and Saavedra 2010.
20. Barros and others 2009; Barros, Molinas Vega, and Saavedra 2010.
21. For South Africa, we rely on data from the General Household Surveys (2002, 2005, and 2010), as it is representative of the population, available for and comparable
over multiple years, and covers relevant topics. It is an annual household survey specifically designed to measure various aspects of living conditions of households and conducted regularly by Statistics South Africa since 2002. And it covers six broad areas: education, health and social development, housing, household access to services and facilities, food security, and agriculture.
22. For 2005, households could not be mapped to townships so the location variable refers simply to the nine regions of the country. While this makes the 2005 results not quite comparable for those of 2002 and 2010, comparisons over time are possible since differences in the definition of one cir-cumstance are unlikely to affect the HOI in a significant way. Results for all years are shown in annex table D.3, while the main report refers to results from 2002 and 2010 only.
23. For an example of how opportunities in other countries are chosen, see the case of Côte d’Ivoire in Abras, Cuesta, and others (2012).
24. Barnett (1995) reviews 36 studies of proj-ects and large-scale public programs (including preschool education, Head Start, child care, and home-visiting pro-grams) to examine their long-term effects on children of low-income families. According to him, ECD programs can produce large short-term benefits for chil-dren on IQ and sizable long-term effects on school achievement, grade retention, placement in special education, and social adjustment.
25. Cabral, Lucas, and Gordon (2009) find that the main health threat posed by drinking unsafe water is infectious diar-rhea—the leading cause of mortality for children under age 5 and estimated to cause 1.5 million deaths a year. Jalan and Ravallion (2003) find that the prevalence and duration of diarrhea among children under 5 in rural India are significantly lower on average for families with piped water than for those without it. Alderman and others (2011) show that private behav-ioral choices and policies that affect the

49
health and nutrition of children in rural Pakistan have important effects on school enrollment and thus on eventual produc-tivity. Improved nutrition increases enroll-ments, and more so for girls, thus closing a portion of the gender gap.
26. For example, Gove, Hughes, and Galle (1979) in their study on Chicago.
27. World Economic Forum 2011.28. World Bank 2011a.29. The Global Competitiveness Report 2011–2012
ranks South Africa 127 of 142 on the Qual-ity of Primary Education index, 133 on the Quality of Educational System index, and 138 on the Quality of Math and Science Education index (World Economic Forum 2011).
30. Information on parents’ own subjective appraisal of the adequacy of infrastructure and teachers in the schools their wards attend, which the surveys do have, is far from ideal for assessing the opportunity of quality education. More than 90 percent of the parents whose children were enrolled in primary schools in 2010 appear to have been satisfied with the level of teaching and physical infrastructure in schools with the HOIs being fairly similar to the cover-age rate (implying low inequality).
31. Note we can also analyze changes between 2002 and 2005 and 2005 and 2010. But given the problems with comparability between results from 2005 and the other years due to differences in the location variable, we focus on changes from 2002 to 2010 in the main text. Annex table D.3 presents results for all three years.
32. The surveys are for different years across countries. The ranges for survey years are 1994–2002 (average of 1997) and 2002–11 (average of 2007). The average period between two survey years for a country is nine years. All these are broadly com-parable with South Africa (surveys from 2002 and 2010, and time period of eight years). As before, we revert to the analysis of a smaller subset of opportunities using a smaller set of circumstances for the sake of comparability.
33. The same charts for 2002 and 2005 are presented in annex D.
34. These decompositions are based on a Shapley Value approach, which essen-tially estimates the contribution of each circumstance to the D-Index as the mar-ginal change (increase) in the value of the D-Index when the circumstance is added to all possible combinations of other cir-cumstances. It involves taking the weighted average of all marginal contributions when the kth variable is added to all pos-sible combinations of the other variables. See Hoyos and Narayan (2011) and Abras, Cuesta, and others (2012) for theory and applications.
35. Currie and Thomas 1999; Case and Pax-son 2006.
36. Chetty and others 2010.37. Leibbrandt and others 2010.38. See Abras, Hoyos, and others (2012) for
a detailed discussion and application of this approach, which is conceptually simi-lar to other approaches in the academic literature on inequality of opportunity. They infer inequality of opportunity from a distribution of outcomes among individ-uals of different “types” (defined by their circumstances), where such inequality is typically measured as the between-group inequality across these types, distinct from inequality within each type. For an exam-ple and a discussion of recent literature, see Ferreira, Gignoux, and Aran (2011) and Ferreira and Gignoux (2011). In our case, the outcome (job status) is different from the typical variables (income, con-sumption) used in the literature, in that it is a discrete variable. This necessitates the use of a modified HOI-type index, which incorporates the D-Index that is essentially a measure of between-group inequality.
39. The analysis in this section is subject to a number of caveats (also see Abras, Hoyos, and others 2012). The main challenges relate to the lack of information on paren-tal characteristics of working-age individu-als from labor force surveys; and that the observed outcomes in the labor market are an equilibrium phenomenon, which does not contain information about the indi-vidual’s preferences and reservation wage, the effort that he or she puts into finding

S o u t h A f r i c A E c o n o m i c U p d a t E — F o c U s o n i n E q U a l i t y o F o p p o r t U n i t y
50
a job, unobserved attributes like talent and initiative, and even (in a reliable way) the quality of the job. Information on wages or earnings, which would help to some extent, is absent from the recent Quarterly Labour Force Survey data available to us. The approach we adopt addresses in part some of these issues, but the results are best seen as indicative and suggesting cor-relations as opposed to direction or causal-ity of effects.
40. Gelderblom (2007), reviewing the literature on migration in South Africa, concludes that constraints associated with the costs and risks of migration are high for the poor and especially high among those in more distant areas, far from transport and tele-communication links, with a more recent history of labor migration, and thus weakly developed social networks. It also applies more particularly to the poorest, whose net-works will be more weakly developed.
41. The results—particularly the changes over time and across opportunities—look similar when IAC and the D-Index are estimated based on circumstances (gen-der, ethnicity, and location) only and not education and age. (Results are available on request.) The levels of IAC (D-Index) are generally higher (lower) in this case, compared with those in figure 2.17, since the number of groups is smaller. Unlike figure 2.17, these results do not distinguish between the direct and indirect effects of circumstances on inequality and reflect both channels of effect: distortions in the labor market and the influence of cir-cumstances on education that would have occurred prior to an individual entering the labor market.
42. The average per capita GDP (purchasing power parity) in 2010 of the 17 comparator countries was around $12,280, compared with $10,565 for South Africa, making it a reasonable (if slightly richer) comparator group on average.
43. While countries with higher employment tend to have lower inequality between groups, the magnitude by which South Africa’s inequality exceeds that of its com-parators is still striking.
44. For the decomposition, we use the Shapley method discussed earlier.
45. The results from decompositions and pro-files should be interpreted with caution due to the caveats mentioned earlier. The problem created by the short list of cir-cumstances is especially important to high-light. The fact that potentially important circumstances are missing—like parental education and income/wealth—implies that the “contribution” of ethnicity and location to inequality (likely to be corre-lated with parental education and wealth) will at least partly reflect that of the miss-ing circumstances. This would mean that the role of these circumstances would overestimate their “true” contribution to inequality. So, while the profiles and contributions to inequality fairly reflect how each attribute contributes to inequal-ity between the groups defined by these attributes, there may well be other attri-butes that are important, if they could be included in the analysis.
46. An important caveat to the results for the subgroups in this section (by location or age) is that the IAC measure used here (algebraically identical to HOI, which is based on circumstances only) is not subgroup-consistent. This implies that the IAC for the working-age population, for any measure of employment, is not an average of the IACs for the subgroups (by location or age). An alternate mea-sure of opportunities, the Geometric HOI (GHOI) has the property of sub-group consistency, but it is less intuitive and harder to understand and represent graphically (Barros and others 2010). Rather than using a different measure altogether for doing the subgroup analy-sis, we have opted to continue using the original HOI-type measure. This makes little difference to the conclusions, for the IACs using the GHOI methodology are highly correlated with the original IACs. The IACs using GHOI method are avail-able upon request.
47. Four of these groups constitute 20–22 percent of the working-age population, whereas the oldest group constitutes about

51
15 percent—making the groups quite com-parable in size.
48. Using data from 1995 to 2002, Bhorat (2004) found unemployment to be higher for low educational attainment groups. Bhorat, van der Westhuizen, and Jacobs (2009) found evidence in favor of a ris-ing skills premium and argued that a shift from the primary and secondary sectors to the tertiary sector has driven the increased demand for skilled labor, boosting the
relative wages of skilled workers between 1995 and 2005. In 1995 and 2005, the share of wage income in total income was much higher for those in the top four deciles than for the bottom deciles (Bho-rat, van der Westhuizen, and Jacobs 2009). While highly skilled workers, concen-trated among the better-off households, were rewarded with high wages, lower and unskilled workers were either poorly paid or unable to find employment.


53
Abras, A., J. Cuesta, A. Hoyos, and A. Narayan. 2012. “Equality of Opportunities and Fiscal Incidence in Côte d’Ivoire.” Policy Research Working Paper 6048, World Bank, Washing-ton, DC.
Abras, A., A. Hoyos, A. Narayan, and S. Tiwari. 2012. “Inequality of Opportunities in the Labor Market: Evidence from Life in Tran-sition Surveys in Europe and Central Asia.” Background Paper for the World Develop-ment Report 2013, World Bank, Washington, DC.
Alderman, H., J. Behrman, V. Lavy, and R. Menon. 2001. “Child Health and School Enrollment: A Longitudinal Analysis.” The Journal of Human Resources 36 (1): 185–205.
Barnett, W. Steven. 1995. “Long-Term effects of early childhood programs on cognitive and school outcomes.” The Future of Children 5 (3): 25–50.
Barros, R., J. R. Molinas Vega, and J. Saavedra. 2010. “Measuring Progress Toward Basic Opportunities for All.” Brazilian Review of Econometrics 30 (2).
Barros, R., F. Ferreira, J. Molinas Vega, and J. Saavedra. 2009. Measuring Inequality of Oppor-tunities in Latin American and the Caribbean. Washington, DC: World Bank.
Bhorat, H. 2004. “Labour Market Challenges in the Post-Apartheid South Africa.” South Afri-can Journal of Economics 72 (5): 940–77.
Bhorat, H., and M. Oosthuizen. 2009. “Deter-minants of Grade 12 Pass Rates in the Post-Apartheid South African Schooling System.” Journal of African Economies 18 (4): 634–66.
Bhorat, H., and C. van der Westhuizen. 2011. “Pro-poor Growth and Social Protection in South Africa: Exploring the Interactions.” Input paper prepared for the National Plan-ning Commission.
Bhorat, H., C. van der Westhuizen, and T. Jacobs. 2009. “Income and Non-Income Inequality in Post-Apartheid South Africa: What are the Drivers and Possible Policy Interventions?” DPRU Working Paper 09/138. University of Cape Town, Develop ment Policy Research Unit, Cape Town, South Africa.
Cabral, C., P. Lucas, and D. Gordon. 2009. “Esti-mating the Health Impacts of Unsafe Drink-ing Water in Developing Country Contexts.” Aquatest Working Paper No. 01. Aquatest 2 Project, Water and Health Research Centre, University of Bristol, UK.
Case, A., and C. Paxson. 2006. “Stature and Status: Height, Ability, and Labor Market Outcomes.” NBER Working Papers 12466, National Bureau of Economic Research, Cambridge, MA.
Chetty, R., J. Friedman, N. Hilger, E. Saez, D. Schanzenbach, and D. Yagan. 2010. “How Does Your Kindergarten Classroom Affect Your Earnings? Evidence from Proj-ect STAR.” NBER Working Paper 16381, National Bureau of Economic Research, Cambridge, MA.
Currie, J., and D. Thomas. 1999. “Does Head Start Help Hispanic Children?” Journal of Public Economics 74 (2): 235–62.
Ferreira, F., and J. Gignoux. 2011. “The Mea-surement of Inequality of Opportunity:
References

S o u t h A f r i c A E c o n o m i c U p d a t E — F o c U s o n i n E q U a l i t y o F o p p o r t U n i t y
54
Theory and an Application to Latin Amer-ica.” Review of Income and Wealth 57 (4): 622–57.
Ferreira, F., J. Gignoux, and M. Aran. 2011. “Measuring Inequality of Opportunity with Imperfect Data: The Case of Turkey.” Journal of Economic Inequality 9 (4): 651–80.
Gelderblom, D. 2007. “Does Poverty Constrain Migration in South Africa? Evidence, Expla-nations and Implications.” Development South-ern Africa 24 (2): 241–55.
Gove, W., M. Hughes, and O. Galle. 1979. “Overcrowding in the Home: an Empiri-cal Investigation of its Possible Pathological Consequences.” American Sociological Review 44 (February): 59–80.
Hoddinott, J., J. Maluccio, J. Behrman, R. Flores, and R. Martorell. 2008. “The Impact of Nutri-tion during Early Childhood on Income, Hours Worked, and Wages of Guatemalan Adults.” The Lancet 371 (February): 411–16.
Hoyos, A., and A. Narayan. 2011. “Inequality of Opportunities among Children: How Much Does Gender Matter?” Background Paper for World Development Report 2012, World Bank, Washington, DC.
Jalan, J., and M. Ravallion. 2003. “Does Piped Water Reduce Diarrhea for Children in Rural India?” Journal of Econometrics 112 (1): 153–73.
Leibbrandt, M., I. Woolard, H. McEwen, and C. Koep. 2010. “Employment and Inequality Outcomes in South Africa.” Southern Africa Labour and Development Research Unit and School of Economics, University of Cape Town.
Roemer, J. 1998. Equality of Opportunity. Cam-bridge, MA: Harvard University Press.
South African Reserve Bank. 2012. Quarterly Bulletin: June 2012. Pretoria.
World Bank. 2011a. Accountability in Public Ser-vices in South Africa: Selected Issues. Washing-ton, DC.
World Bank. 2011b. South Africa Economic Update: Focus on Savings, Investment, and Inclu-sive Growth. July 2011 Issue. Washington, DC.
World Bank. 2012. World Development Indicators 2012. Washington, DC.
World Economic Forum. 2011. The Global Com-petitiveness Report 2011–2012. Geneva. www3.weforum.org/docs/WEF_GCR_Report_ 2011-12.pdf.

Economic Update
TH
E W
OR
LD
BA
NK
GR
OU
P A
FRIC
A RE
GION
POVE
RTY
REDU
CTIO
N &
ECONO
MIC
MAN
AGEM
ENT
JULy
20
12
Is
sU
E 3
South Africa
Focus on Inequality of Opportunity
South Africa issue3 cover 0719.indd 1-2 7/19/12 5:27 PM

South Africa issue3 cover 0719.indd 3-4 7/19/12 5:27 PM