
economic trends 2020spring forecast of · March interim economic assessment, the OECD predicts 2.4%...
54
spring forecast of economic trends 2020
Transcript of economic trends 2020spring forecast of · March interim economic assessment, the OECD predicts 2.4%...

spri
ng fo
reca
st o
f ec
onom
ic tr
ends
202
0

spring forecast of economic trends 2008

Spring Forecast of Economic Trends 2020 (Pomladanska napoved gospodarskih gibanj 2020)
Publisher: UMAR, Ljubljana, Gregorčičeva 27Responsible person: Marijana Bednaš, MSC, director
Editor: Tanja Kosi Antolič, PhD
Authors (listed alphabetically):Barbara Bratuž Ferk, MSc, Urška Brodar, Lejla Fajić, Marjan Hafner, MSc, Matevž Hribernik, MSc, Katarina Ivas, MSc, Mojca Koprivnikar Šušteršič, Mateja Kovač, MSc, Janez Kušar, MSc, Andrej Kuštrin, MSc, Urška Lušina, MSc, Jože Markič, PhD, Tina Nenadič, MSc, Mitja Perko, MSc, Jure Povšnar, Denis Rogan, MSc, Dragica Šuc, MSc, Tina Šušteršič Golob, PhD, Branka Tavčar, Ana Vidrih, MSc
Editorial board: Marijana Bednaš, MSc, Lejla Fajić, Alenka Kajzer, PhD, Rotija Kmet Zupančič, MSc, Janez Kušar, MSc
Figures, statistical appendix, DTP: Bibijana Cirman Naglič, Mojca Bizjak
Print: Eurograf d.o.o.Circulation: 105 copies
Ljubljana, March 2020
ISSN 2536-3646 (print)ISSN 2536-3654 (pdf)
©2020, Institute of Macroeconomic Analysis and DevelopmentThe contents of this publication may be reproduced in whole or in part provided that the source is acknowledged.


3Spring forecast of economic trends 2020
Contents Summary ...................................................................................................................................................... 4
1. Assumptions of the Spring Forecast of Economic Trends 2020 .............................. 9
2. Forecast of economic developments in Slovenia ......................................................... 11 2.1. Gross domestic product ............................................................................................................. 112.2. Employment and unemployment ......................................................................................... 132.3. Wages................................................................................................................................................. 142.4. Inflation ............................................................................................................................................. 15
3. Risks to the forecast ................................................................................................................... 16
4. Output gap and potential GDP growth ............................................................................ 17
5. Analysis: Developments in the automotive industry and their impacts on Slovenian industry ...................................................................................................................... 19
Appendix: Assessing the forecasting performance ............................................................... 23
Statistical appendix ............................................................................................................................... 27

4 Spring forecast of economic trends 2020
The Spring Forecast was made at the time when the coronavirus was spreading in many countries and when the first cases of infection were being confirmed in Slovenia; the economic impact of the virus is currently difficult to predict due to uncertainty about the spread and how it will be tackled. The situation is changing from day to day. In addition to the uncertainty and unpredictability of (the size) of the outbreak and the duration of the epidemic, it is also not yet known how it will be addressed at individual stages by the economy and various economic policies, including at the EU level. Due to the many unknowns, the central scenario of the forecast assumes that the coronavirus spread in China and in European countries will peak in the first half of this year before gradually stabilising in the second half. Similarly restrictive assumptions were also adopted by the EC and the OECD in their latest forecasts that served as the basis for our assumptions regarding economic growth in main trading partners. Economic growth in the euro area is thus projected to slow this year (from 1.2% to 0.8%) and then recover in the next two (to 1.2% and 1.3% respectively).
In the event of a gradual containment and control of the coronavirus spread in the second half of the year, economic growth will ease to 1.5% this year before rising somewhat in the next two (to 2.2%). The slowdown in real GDP growth for the third consecutive year in 2020 will largely be a consequence of lower economic growth in trading partners and increased uncertainty. Both will, at least partly, reflect the coronavirus spread and, in particular, the containment measures. Assuming that the virus spread is contained and stemmed both at home and abroad, export and import growth will be about halved this year, while (business) investment will be somewhat lower than last year amid the many uncertainties. Under the assumption that the situation gradually stabilises in the second half of this year, economic growth will be slightly higher in 2021 and 2022 than in 2020. Owing to stronger growth in foreign demand, we expect a gradual rebound in export and import growth next year, while investment will increase again as uncertainty declines. In 2020–2022 private and government consumption will further contribute to GDP growth. The contribution of household consumption, however, is expected to decline as growth in employment and wages and, in turn, growth in disposable household income will slow compared to last year. The contribution of net exports to GDP growth will gradually fall and turn neutral at the end of the forecast period. The current account surplus will remain high (at just over 6%).
Employment growth will be easing in the 2020–2022 period under the baseline scenario; wage growth will also be somewhat lower than last year. The slowdown in employment growth will reflect lower growth in economic activity than in previous years and, increasingly, the decline in the domestic population aged 20 to 64 years. Assuming that the situation in Europe and at home stabilises in the second half of this year, employment growth will remain high. Labour shortages will be partly alleviated by a positive net migration flow and further growth in the labour market activity rate. The number of unemployed persons, which was already close the pre-crisis bottom last year, will continue to drop, albeit more and more slowly. The growth of the average wage will be somewhat lower in 2020–2022 than last year as a consequence of lower growth in economic activity. It will be supported not only by limited labour supply, but also by legislative changes in the area of the minimum wage and the implementation of agreements with public sector trade unions.
Summary

5Spring forecast of economic trends 2020
Inflation in 2020 will remain similar to that in the last two years (1.7%) before rising somewhat in 2021–2022. Prices of services and food will continue to grow. The contribution of the still modest growth of non-energy goods prices to inflation will gradually rise. Given that energy prices will be somewhat lower this year than in 2019 (according to market expectations at the time of the forecast), the further strengthening of core inflation will not yet be reflected in significantly higher headline inflation in 2020. Headline inflation is expected to increase moderately only next year (to 2.2%), when no negative contribution from energy prices is expected.
If the coronavirus epidemic in Slovenia and other EU countries continues for a longer time and the situation does not stabilise in the second half of this year, economic growth this year and in 2021 will be lower than forecast; additionally, growth may also decline if some of the other risks materialise. The downside risks to economic growth include at least the following: (i) possible new US protectionist measures, which could (among other things) be aimed at raising tariffs on car and car part imports to the US, (ii) an increase in Chinese imports from the US on account of lower imports from other trading partners, (iii) a significant increase in trade barriers between the EU and UK as of 2021, when the transition period during which economic cooperation will remain unchanged comes to an end, and (iv) climate change and related environmental measures, which could affect growth in individual activities in the short term.
We are closely monitoring the economic situation in Slovenia and globally and will update the forecast as necessary.

6 Spring forecast of economic trends 2020
The Spring Forecast is based on statistical data, information and adopted measures known at the cut-off date of 5 March 2020.
Forecast of Slovenia’s main macroeconomic aggregates
2019
Spring forecast(March 2020)
2020 2021 2022
GROSS DOMESTIC PRODUCT
GDP, real growth (%) 2.4 1.5 2.2 2.2
GDP, nominal growth (%) 4.9 3.7 4.3 4.2
GDP in EUR billion, current prices 48.0 49.8 51.9 54.1
Exports of goods and services, real growth in % 4.4 2.4 4.2 4.1
Imports of goods and services, real growth in % 4.2 2.3 4.3 4.6
External balance of goods and services (contribution to growth in pps) 0.5 0.3 0.3 0.0
Private consumption, real growth in % 2.7 2.0 1.7 1.7
Government consumption, real growth in % 1.6 1.6 1.3 1.2
Gross fixed capital formation, real growth in % 3.2 -1.0 4.0 6.0
Change in inventories and valuables (contribution to growth in pps) -0.4 0.0 0.0 0.0
EMPLOYMENT, EARNINGS AND PRODUCTIVITY
Employment according to the SNA, growth in % 2.4 1.1 0.7 0.5
Number of registered unemployed, annual average (in '000) 74.2 72.0 70.1 67.4
Registered unemployment rate in % 7.7 7.4 7.1 6.8
ILO unemployment rate in % 4.5 4.2 4.0 3.8
Gross earnings per employee, nominal growth in % 4.3 3.8 3.7 4.0
Gross earnings per employee, real growth in % 2.7 2.1 1.5 1.9
- private sector 2.2 2.3 1.3 1.9
- public sector 3.7 1.9 1.7 1.9
Labour productivity (GDP per employee), real growth in % 0.1 0.4 1.5 1.7
BALANCE OF PAYMENTS STATISTICS
Current account balance in EUR billon 3.2 3.4 3.5 3.4
- as a % of GDP 6.6 6.8 6.8 6.3
PRICES AND EFFECTIVE EXCHANGE RATE
Inflation (Dec/Dec) in % 1.9 2.0 2.2 2.0
Inflation (annual average), % 1.6 1.7 2.2 2.0
Real effective exchange rate deflated by unit labour costs 1.2 1.2 0.1 0.3
ASSUMPTIONS
Foreign demand (imports of trading partners), real growth in % 2.6 2.1 3.0 3.1
GDP in the euro area, real growth in % 1.5 0.8 1.2 1.3
Oil price (Brent crude, USD/barrel) 64.3 55.8 55.0 55.1
Non-energy commodity prices (USD), growth -3.6 3.2 2.5 2.4
USD/EUR exchange rate 1.120 1.098 1.097 1.097
Source: For 2019 SURS, BoS, ECB and EIA; for 2020–2022 IMAD forecasts.
spri
ng fo
reca
st
of e
cono
mic
tren
ds 2
020


9Spring forecast of economic trends 2020
1. Assumptions of the Spring Forecast of Economic Trends 2020
The outbreak and spread of the coronavirus have dampened the first signs of stabilisation of global economic growth, which is set to slow further this year. This year global economic growth will be lower than last year, particularly due to the coronavirus outbreak and measures to contain its spread; to what extent this will affect individual countries and sectors is difficult to assess due to the unpredictability of the spread and the duration of the epidemic. Sentiment indicators, which started to indicate signs of stabilisation at the end of last year, fell noticeably after the outbreak of the coronavirus in China and its spread to many other countries (in Europe particularly to Italy). Global economic prospects deteriorated significantly with the weakening of global trade and industrial production following the outbreak of the epidemic. The coronavirus outbreak and the containment measures have disrupted or interrupted the supply of some goods from China, which, given the deep integration of the Chinese economy into global value chains, is affecting producers all over the world.
The Chinese economy accounts for around 17% of global GDP and is the largest exporter of intermediate goods and a major importer of many raw materials. In addition to industry, the coronavirus epidemic is also having a significant negative impact on tourism and transport and logistic operations. In the baseline scenario of its March interim economic assessment, the OECD predicts 2.4% global economic growth for this year, which is 0.5 pps lower than last year and lower than projected in November, i.e. before the virus outbreak. However, with data on the number of infections across countries changing daily, the forecasts of international institutions may already be outdated when they are released. This points to extremely high uncertainty in assessing the
consequences of the epidemic, as also emphasised by other international institutions.1
Our spring forecast is based on the latest forecasts by international institutions for Slovenia’s trading partners, which take into account the impact of the coronavirus epidemic on the Chinese and, particularly indirectly, other economies and predict a slowdown in euro area economic growth for this year. Economic growth in the euro area already slowed quite noticeably in the last quarter of 2019; activity will also remain weak in the first quarter of this year due to the situation in the global economy and significant uncertainties regarding the coronavirus spread and external trade relations. Exports and industrial and investment activity are falling in particular, which, despite relatively robust private consumption amid the still favourable labour market conditions, will be reflected in more modest GDP growth in the euro area this year. Considering the latest OECD and EC forecasts, we assume 0.8% euro area GDP growth for this year (0.4 pps lower than last year) and a strengthening of growth to 1.2% for next year. On main export markets outside the euro area, this year’s economic growth is set to slow but remain relatively robust. Russia’s growth should remain modest this year due to lower oil prices and lower Chinese demand for raw materials. The
assumptions regarding economic growth in most major trading partners are lower than in the autumn forecast for the entire forecast period, but particularly for this year. At the same time, they are subject to significant downside risks. Besides the further coronavirus spread, these
1 On 4 March 2020, the International Monetary Fund Director, Kristalina Georgieva, stressed that, because of the coronavirus spread, global economic growth would slow and be lower than last year, but that the extent of the fall and the economic impact of the coronavirus remained unclear. Similarly, European Commissioner Paolo Gentiloni warned at the beginning of March that, due to the many unknowns, it was too early to asses the economic impact of the coronavirus at this stage and that the expectations about a rapid recovery (of economic links and activities) which were part of the assumptions of the European Commission winter forecast (February 2020) may prove overly optimistic.
Table 1: Assumptions of the forecast for economic growth in Slovenia’s main trading partners
2019
2020 2021 2022
Real growth rates, in % September 2019 March 2020 September 2019 March 2020 March 2020
EU 1.5 1.2 1.0 1.3 1.4 1.5
Euro area 1.2 1.1 0.8 1.2 1.2 1.3
Germany 0.6 1.1 0.7 1.2 1.0 1.2
Italy 0.3 0.5 0.0 0.6 0.5 0.7
Austria 1.6 1.5 1.1 1.5 1.3 1.4
France 1.3 1.2 0.9 1.3 1.3 1.3
Croatia 2.9 2.6 2.3 2.5 2.3 2.2
Russia 1.0 1.9 1.2 1.8 1.3 1.5
Source: For 2019, Eurostat; OECD Interim Economic Outlook, March 2020; Consensus Forecasts (for Croatia); for other years Consensus Forecasts, February 2020; Eastern Consensus Forecasts, February 2020; EC Winter Forecast, February 2020; Focus Economics, March 2020; IMF World Economic Outlook, January 2020; IMAD estimate.

10 Spring forecast of economic trends 2020
include at least possible new US protectionist measures, increased Chinese imports from the US on account of lower imports from other trading partners, and a significant increase in trade barriers between the EU and UK as of 2021, when the transition period during which economic cooperation will remain unchanged comes to an end (for more on risks see Section 3).
The forecast is based on the technical assumption that (in line with market expectations) the oil price falls this year and remains relatively stable in the next two and the technical assumption of moderate growth in euro prices of non-energy commodities.2 Based on price developments at the beginning of the year and prices on futures markets, the technical assumption for the average Brent Crude price underlying the forecast for 2020 is USD 55.8 per barrel, which is a significant decline on the previous year (by 13.3%). Euro prices of oil will also be significantly lower (by 11.7%), taking into account
2 The oil price assumption is based on the average futures prices and the USD/EUR exchange rates between 1 and 13 February 2020. The assumption for non-energy commodity prices is made on the basis of ECB data and estimates available up to 13 February 2020.
20
30
40
50
60
70
80
90
100
110
120
130
20
30
40
50
60
70
80
90
100
110
120
130
Jan
11
Jan
12
Jan
13
Jan
14
Jan
15
Jan
16
Jan
17
Jan
18
Jan
19
Jan
20
Jan
21
EUR
per
barr
el
Inde
x 20
10=
100
Non-energy commodities in EURBrent crude in EUR (right axis)
Source: ECB, EIA; calculations by IMAD. Note: The line indicates the annual average taking into account the assumption of the forecast.
Figure 2: Oil and non-energy commodity prices
-1.0
-0.5
0.0
0.5
1.0
1.5
2.0
2.5
3.0
2012 2013 2014 2015 2016 2017 2018 2019 2020 2021 2022
predpostavka
Real
GD
P gr
owth
, in
%
Source: Eurostat; assumption by IMAD.Assumption
Figure 1: GDP in the euro area
the technical assumption for the EUR/USD exchange rate.3 The technical assumption regarding non-energy commodity prices means an increase in dollar prices of 3.2% this year and of around 2.5% in the next two. In euro prices the increase will be somewhat more pronounced.
3 The assumed USD/EUR exchange rate for the period after 13 February is equal to the average exchange rate between 1 and 13 February 2020.
Table 2: Assumptions for oil and non-energy commodity prices and the USD/EUR exchange rate
2019
2020 2021 2022
September 2019 March 2020 September 2019 March 2020 March 2020
Brent crude price, in USD 64.3 57.4 55.8 56.5 55.0 55.1
Brent crude price, in EUR 57.5 51.5 50.8 50.7 50.2 50.2
Non-energy commodity prices (USD), growth*, in % -3.6 2.1 3.2 1.5 2.5 2.4
USD/EUR exchange rate 1.120 1.115 1.098 1.115 1.097 1.097
Source: EIA, IMF, ECB; IMAD estimate. Note: the assumptions are based on the average prices between 1 and 13 February 2020. * Composition of euro area imports.

11Spring forecast of economic trends 2020
2 Forecast of economic developments in Slovenia
2.1 Gross domestic product
Last year real GDP increased further, but its 2.4% growth was considerably lower than in the previous two years (4.8% and 4.1% respectively), reflecting weaker growth in exports and investment, which even declined in the last quarter of the year. Stable growth in household consumption, underpinned by the still strong employment growth and growth in wages and social transfers continued to contribute to growth. Export growth slowed in circumstances of very weak growth in global trade and waning GDP growth in trading partners. This, together with significant uncertainty internationally (regarding external trade relations and economic prospects), was reflected in a significant deceleration of growth in investment in machinery and equipment; lower growth than in 2018 was also recorded for construction investment. Towards the end of the year the slowdown in export and industrial production growth started to spill over more visibly into the service sector. Consistent with these developments, import growth also slowed last year, the contribution of net exports to GDP growth thus being positive (0.5 pps). Last year’s GDP growth was below the long-term average (2.7%4) and lower than our autumn forecast (2.8%), which, as pointed out at the time of its preparation, was subject to significant downside risks. This was a consequence of (i) lower growth in investment, including construction investment, which declined in the last quarter despite several relatively favourable construction statistics; (ii) lower growth in private consumption, which was revised down with the latest release for the previous year5 (which changed the starting point for 2019) and slowed more than expected towards the end of the year; and (iii) greater deceleration in global trade than projected in the forecasts of international institutions at that time6 and hence lower growth in the export-oriented sector.7 GDP growth in
4 The average annual real GDP growth rates for 1996–2019. 5 On 28 February SURS released new data for GDP in 2018, which
significantly deviate from those released before the Autumn Forecast 2019 in terms of GDP growth structure. The growth of exports and, particularly, imports was revised down in line with the autumn revision of balance of payments data (see next note). Among domestic consumption categories, for 2018 the estimate of real growth in private consumption was lowered the most, by 0.6 pps (from 3.4% to 2.8%). An upward revision of the contribution of external trade balance to GDP growth (by 0.4 pps) was balanced out by a downward revision in domestic consumption components, so the data for GDP growth remained unchanged.
6 For example, while in the interim summer forecast in July 2019 the European Commission expected 1.6% world import growth outside the EU, the estimated growth rate in the interim winter 2020 forecast is only 0.4%.
7 Lower export growth in 2019 than forecast in the autumn is, in addition to lower growth in foreign demand, also a consequence of the revision of balance of payments data on exports (and imports). With the revision of these data after the autumn forecast, part of re-exports where no change of ownership has taken place (when crossing the border) was excluded from external trade flows. If this part of exports, which increased significantly in 2019, is excluded, export growth is
-40
-30
-20
-10
0
10
20
-80
-60
-40
-20
0
20
40
Q1
05
Q1
06
Q1
07
Q1
08
Q1
09
Q1
10
Q1
11
Q1
12
Q1
13
Q1
14
Q1
15
Q1
16
Q1
17
Q1
18
Q1
19
Q1
20*
Equi
libriu
m v
alue
, in
pps
Equi
libriu
m v
alue
, in
pps
Source: SURS; calculations by IMAD. Note: The value for Q1 20 is the average for January and February.
Consumer confidenceConfidence in constructionConfidence in manufacturingConfidence in service activitiesConfidence in retail tradeEconomic sentiment (right axis)
Figure 4: Business and consumer confidence in the economy
Slovenia nevertheless still exceeded GDP growth in the EU as a whole (1.3%).
This year economic growth will continue, totalling 1.5%, but this forecast is crucially dependent on the assumption that the coronavirus spread is contained in the second half of the year. The forecast has been made at the time of the coronavirus spread in neighbouring countries, particularly Italy, and confirmation of the first
significantly lower than before the revision (see Slovenian Economic Mirror, No. 8/2019, p. 9).
-4
-3
-2
-1
0
1
2
3
4
5
6
-20
-16
-12
-8
-4
0
4
8
12
16
20
24
Q1
13
Q1
14
Q1
15
Q1
16
Q1
17
Q1
18
Q1
19
Year
-on-
year
gro
wth
, in
%, 4
-qua
rter
mov
ing
aver
ages
Year
-on-
year
gro
wth
, in
%, 4
-qua
rter
mov
ing
aver
ages
Source: SURS; calculations by IMAD.
Final domestic consumption Gross capital formation
Exports of goods and services GDP (right axis)
Figure 3: Year-on-year growth in GDP and selected components

12 Spring forecast of economic trends 2020
cases of infection in Slovenia. With the situation changing on a daily basis, it is very difficult to assess how the virus will spread and how it will affect the economy. In our baseline scenario, we, like other institutions,8 assume that the coronavirus spread in China and Europe will peak in the first half of this year, before stabilising in the second (for risks associated with this assumption see Section 3). Under this assumption, economic growth will continue in 2020 (1.5%) but will be lower than last year (2.4%) and lower than projected in the autumn forecast (3.0%). A further deceleration of growth will largely be due to cooling economic growth in trading partners9 and a prolonged period of significant uncertainty in the global environment. This will be strongly related to the coronavirus outbreak, which will be felt the most by
8 See for example the OECD forecast published on 2 March 2020 and the forecast of the Dutch CPB published on 3 March 2020.
9 Partly as a result of weaker international trade and global growth and partly due to structural challenges in the European (car) industry.
activities that are closely integrated into global value chains and international trade (the broader car industry, tourism, and transport and logistics). Export and import growth will thus be almost halved this year, while business and hence total investment10 will be somewhat lower than last year. Household consumption will continue to rise, though at a slower pace than in previous years due to weaker employment growth and higher uncertainty. All of this will be reflected not only in a further slowdown of growth in manufacturing activities, but also in lower growth in value added in service activities. If the coronavirus continues to spread, GDP growth will very likely be lower than forecast. Growth could be weaker still if any other negative risks materialise (see Section 3).
10 For 2020 we expect lower investment in machinery and equipment and also lower investment in non-residential buildings and structures than last year. Housing investment will continue to increase.
-3
-2
-1
0
1
2
3
4
5
2011
2012
2013
2014
2015
2016
2017
2018
2019
2020
2021
2022
napoved
Con
trib
utio
n to
GD
P gr
owth
, in
pps
Source: SURS; forecast by IMAD.
Manufacturing (C) Construction (F)Market services (G–N, R, S, T) Non-market services (O–Q)Other (A, B, D, E) Value added
Forecast
Figure 6: Contributions of growth in value added to GDP growth by activity
-4
-2
0
2
4
6
-10
-5
0
5
10
15
2011
2012
2013
2014
2015
2016
2017
2018
2019
2020
2021
2022
napoved
Real
GD
P ch
ange
, in
%
Con
trib
utio
ns t
o ch
ange
, in
pps
Source: SURS; 2020–2022 forecast by IMAD.
Private consumption Government consumptionGross fixed capital formation Change in inventories and val.Exports of goods and services Imports of goods and servicesReal GDP change (right axis)
Forecast
Figure5: Contributions of expenditure components to GDP growth
Table 3: Forecast for economic growth
Real growth rates (%) 2019
2020 2021 2022
September 2019 March 2020 September 2019 March 2020 March 2020
Gross domestic product 2.4 3.0 1.5 2.7 2.2 2.2
Exports 4.4 5.0 2.4 4.8 4.2 4.1
Imports 4.2 5.8 2.3 5.5 4.3 4.6
External balance of goods and services (contribution to growth in pps) 0.5 -0.2 0.3 -0.2 0.3 0.0
Private consumption 2.7 2.7 2.0 2.2 1.7 1.7
Government consumption 1.6 1.7 1.6 1.4 1.3 1.2
Gross fixed capital formation 3.2 6.8 -1.0 7.0 4.0 6.0
Change in inventories and valuables (contribution to growth in pps) -0.4 0.0 0.0 0.0 0.0 0.0
Source: SURS; 2020–2022 forecast by IMAD.Note: * The forecast takes into account the difference in the number of working days between years, which is significant in 2020 (an increase of 6).

13Spring forecast of economic trends 2020
If the virus spread is gradually stemmed this year, economic growth in 2021–2022 will be somewhat higher (2.2%) than this year. Assuming that the virus spread is gradually contained globally and at home and uncertainty decreases, GDP growth will be somewhat higher from next year onwards. Owing to stronger growth in foreign demand, export and import growth is expected to rebound slightly, while investment will increase again in the next two years after this year’s slight decline. This will be attributable not only to rising demand and lower uncertainties, but also to the continuation of very favourable borrowing conditions. Private and government consumption will continue to contribute to growth. Household consumption will be rising more and more slowly, however, as the growth of historically high employment and hence of disposable household income will moderate (see Section 2.2). The contribution of net exports to GDP growth will fall gradually, turning neutral by the end of the forecast period.
2.2 Employment and unemployment
Last year employment growth11 remained relatively high, while unemployment declined further. Reflecting slower growth in economic activity, employment growth moderated gradually last year. Nevertheless, employment, reaching the highest level on record, increased in almost12 all private sector activities, again the most in construction (7.9%) and transportation and storage activities (4.9%). The share of enterprises facing a shortage of appropriately skilled workers in fact declined somewhat in the recent period, but it remained relatively high, particularly in labour-intensive industries, where it was often cited as a factor limiting activities. Employment growth in the recent period has thus been due mainly to the hiring of foreign nationals13 and partly to the increased labour market participation of those who previously had not been actively seeking employment.14 Amid the low unemployment rate (the ILO unemployment rate being very close to the pre-crisis bottom in 2019, at 4.5%), the
11 Employment according to the national accounts statistics.12 The sectors where employment was down year on year are agriculture
and financial and insurance activities. In the latter employment has in fact been falling since 2010.
13 In 2019 the number of employed foreign nationals increased by 19.5% and the number of employed Slovenian citizens by 0.9%. The share of foreigners in the total number of employed persons was 11.2% (up 1.6 pps year on year). Foreign nationals contributed around 70% to total employment growth year on year. Growth in the number of employed foreigners started to increase in 2014 as a consequence of strong activity growth in sectors that typically stand out in the share of foreign workers (such as construction, administrative and support service activities, transportation and storage, accommodation and food service activities, and manufacturing). Demand for (foreign) labour coincides with a high positive net migration flow (more people entering than living Slovenia), which totalled 14,081 persons in the first three quarters of last year.
14 The activity rate (the number of persons who are either employed or are actively seeking employment as a percentage of the working-age population) rose by 0.7 pps in the 20–64 age group in the first three quarter of last year and stood at 80.1%, being the highest thus far. This was, however, also due to changes in the age structure of the population, such as the transition of young, employed, age groups to older age groups (see also the “Dealing with Labour Shortages” chapter in IMAD's publication Economic Issues 2019).
decline in the number of unemployed also moderated last year. This continued in the first two months this year. Overall, 77,484 persons were registered as unemployed at the end of February, 4.1% fewer than in the same period of last year.
In 2020–2022 employment growth will gradually moderate. More modest prospects over the short term are also indicated by somewhat lower values of the expected employment indicator. The baseline assumption is that the situation in Europe and at home stabilises in the second half of this year, so that
-30
-20
-10
0
10
20
30
40
Q1
11
Q1
12
Q1
13
Q1
14
Q1
15
Q1
16
Q1
17
Q1
18
Q1
19
Year
-on-
year
cha
nge
in '0
00
Source: SURS; calculations by IMAD. Note: Employment according to national accounts.
Public services Non-tradable servicesTradable services (GHI) ConstructionIndustry AgricultureTotal
Figure 7: Change in employment with contributions from activities
100
150
200
250
300
350
400
450
500
15-24 years 25-34 years 35-49 years 50-64 years 65-74 years
Num
ber
in '0
00
Source: Eurostat, SURS; calculations by IMAD.
2008 2013 2018 2023
Figure 8: Population (15–74 years) by age group

14 Spring forecast of economic trends 2020
employment should remain high. We estimate that labour demand will remain a driving factor for attracting foreign workers in the medium term and that the activity rate will continue to increase, particularly among younger and older people. Amid the slowdown in economic activity growth, both will cushion somewhat the further decline in the size of the domestic population aged 20 to 64 years. The number of unemployed persons will continue to fall this year and in the next two, although more and more slowly, given the low number of the unemployed and their less favourable structure (a high share of those who are less employable for various reasons). Labour market conditions will therefore become an increasingly significant barrier to value added growth.
2.3 Wages
Last year wage growth strengthened mainly due to higher growth in the public sector. The higher total growth of the average gross wage was attributable to the accelerated wage growth in the government sector as a consequence of wage rises agreed with trade unions at the end of 2018 and regular promotions and also to some extent to the increase in the minimum wage at the beginning of the year. In the private sector wage growth remained similar to that in 2018, reflecting a shortage of appropriately skilled workers and good business results. Wage growth in the private sector has otherwise been moving roughly in line with main macroeconomic factors (inflation, unemployment and labour productivity) in recent years.
In 2020–2022 wage growth will be somewhat lower than last year; in addition to growth in economic activity and limited labour supply, it will be supported by the agreements with public sector trade unions15 and legislative changes. In the private sector, this year’s growth of the average gross wage will be similar to that last year. At the beginning of the year it will be more
15 The agreed changes refer, inter alia, to the classification of jobs into higher pay grades, the payment of performance-related bonuses (for regular work and increased workload) and a permanent move of the payment of promotions to December of each year.
-2
0
2
4
6
2011
2012
2013
2014
2015
2016
2017
2018
2019
2020
2021
2022
napoved
Year
-on-
year
nom
inal
gro
wth
, in
%
Source: SURS; calculations and forecast by IMAD.
Gross wage per employee Productivity
Forecast
Figure 9: Average gross wage per employee and productivity
Table 4: Forecasts for employment and unemployment
In % 2019
2020 2021 2022
September 2020 March 2020 September 2019 March 2020 March 2020
Employment according to the SNA, growth 2.4 1.4 1.1 0.8 0.7 0.5
Number of registered unemployed, annual average, in '000 74.2 70.8 72.0 67.6 69.8 67.4
Registered unemployment rate 7.7 7.2 7.4 6.9 7.1 6.8
ILO unemployment rate 4.5 4.0 4.2 3.8 4.0 3.8
Source: SURS; 2020–2022 forecast by IMAD.
Table 5: Forecast for average gross wage per employee
Growth rates, in % 2019
2020 2021 2022
September 2019 March 2020 September 2019 March 2020 March 2020
Gross wage per employee – nominal 4.3 5.1 3.8 4.9 3.7 4.0
- private sector 3.9 5.2 4.0 4.8 3.6 4.0
- public sector 5.4 5.0 3.6 4.9 4.0 4.0
Gross wage per employee – real 2.7 3.1 2.1 2.5 1.5 1.9
- private sector 2.2 3.2 2.3 2.5 1.3 1.9
- public sector 3.7 3.0 1.9 2.6 1.7 1.9
Source: SURS; 2020–2022 forecast by IMAD.

15Spring forecast of economic trends 2020
2.4 Inflation
Inflation in 2020 will remain similar to that in the last two years (1.7%) before rising somewhat in 2021–2022. Year-on-year consumer price growth averaged 1.6% last year, which is similar to 2018; almost two thirds of growth derived from prices of services, while a small contribution also came from higher food and energy prices. In the first two months of this year inflation rose to around 2% under the impact of stronger growth in prices of (unprocessed) food. In the year as a whole, we expect further year-on-year growth for prices of services and food and a gradual strengthening of the still low growth in prices of non-energy commodities. Given the technical assumption (see Section 1) of somewhat lower energy prices than last year, the further strengthening of core inflation will not yet be reflected in notably higher headline inflation (1.7%) this year. Headline inflation will increase moderately next year (to 2.2%), when the contribution from energy prices is no longer expected to be negative. Price growth will be attributable to a further increase in consumption and also to cost pressures, which
noticeably affected particularly by the increase in the minimum wage and the exemption of all remaining wage supplements from the minimum wage.16 In the next two years growth will remain moderate,17 which, despite a further gradual decline in unemployment and the still relatively high labour shortages, will be a consequence of relatively low growth in economic activity and modest productivity growth. Growth in the public sector will arise, particularly this year, mainly from the adopted agreements. To some extent it will also be due to the consecutive increases in the minimum wage. Total wage growth will otherwise be limited slightly by the hiring of foreign workers, which is most common in activities with below-average wages, which is reducing the average wage. Wage growth is no longer expected to lag behind productivity growth.
16 The Act Amending the Minimum Wage Act (ZMinP), adopted in December 2018, set the level of the minimum wage for the next period. According to the ZMinP, the minimum wage was raised to 886.63 euros on 1 January 2019 and to 940.58 euros on 1 January 2020 and all remaining supplements were exempted from the minimum wage. We assess that the increase in the minimum wage and the exemption of supplements could contribute around 1 pp to growth in the average gross wage in 2020.
17 The Act Amending the Minimum Wage Act, adopted in December 2018, also provides that, as of 2021, the minimum wage shall be calculated by a formula which ties the level of the minimum wage to minimal living costs – the minimum net wage should be at least 20% and not more than 40% higher than the minimum living costs (in 2016 these were estimated at 613 euros).
-2
-1
0
1
2
3
4
Jan
11
Jan
12
Jan
13
Jan
14
Jan
15
Jan
16
Jan
17
Jan
18
Jan
19
Jan
20
Year
-on-
year
gro
wth
, in
%, 3
-mon
th m
ovin
g av
erag
e
Source: SURS.
InflationInflation excl. food and non-alcoholic beverages, fuels and energyServicesGoods
Figure 10: Year-on-year consumer price growth
will be partly related to further growth in unit labour costs. The forecast assumes a gradual moderation of growth in service and food prices and a slight strengthening of the modest growth in prices of non-energy industrial goods.
-1.0
-0.5
0.0
0.5
1.0
1.5
2.0
2.5
3.0
2011
2012
2013
2014
2015
2016
2017
2018
2019
2020
2021
2022
napoved
In %
(an
nual
ave
rage
)
Source: SURS, IMAD forecast.
Inflation (CPI)
Core inflation (CPI excluding energy and unprocessed food)
Forecast
Figure 11: Headline and core inflation
Table 6: Inflation forecast
In % 2019
2020 2021 2022
September 2019 March 2020 September 2019 March 2020 March 2020
Inflation – Dec/Dec 1.9 2.2 2.0 2.3 2.2 2.0
Inflation – annual average 1.6 2.0 1.7 2.3 2.2 2.0
Source: SURS; 2020–2022 forecast by IMAD.

16 Spring forecast of economic trends 2020
3 Risks to the forecastThe spring forecast was made at the time of the coronavirus outbreak in neighbouring countries and Slovenia, whose evolution and economic impact is very difficult to predict at this stage. Since the virus, which broke out in China, spread to neighbouring countries (particularly Italy) and the first cases of infection were confirmed in Slovenia, the situation has been changing from day to day. The economic consequences of the coronavirus spread are therefore difficult or practically impossible to assess.18 In the central scenario of the forecast we therefore assume that the coronavirus spread in China and Europe, including Slovenia, peaks in the first half of this year and the situation stabilises in the second half of the year. In the baseline scenario of its interim economic assessment published at the beginning of March, the OECD predicts that the virus will be contained in the first quarter of 2020 but that its impacts will also be felt in the second quarter of the year, particularly on non-financial markets and commodity markets and in the form of increased uncertainty. With the situation rapidly changing, the OECD also made an alternative forecast scenario, suggesting that global economic growth in 2020 could be 1.5 pps lower than under the central scenario.
If the coronavirus epidemic in Slovenia and other countries lasts longer and certain other possible downside risks materialise, economic growth this year and next could be lower than predicted. With the coronavirus epidemic lasting longer and continuing to spread and if the situation does not stabilise in the second half of this year, the projected economic growth could also be jeopardised by other factors. These include a possible introduction of new protectionist measures by the US, such as raising tariffs on car and car part imports or imposing new barriers to trade and technological cooperation with China. The tensions between the world’s two largest economies, the US and China, have otherwise eased in recent months as the first part of the trade deal was signed. The latter however poses a new risk to the EU economies in the form of a possible decline in exports to China, as, according to the agreement, China should significantly increase its imports from the US, which could lead to a decline in its imports from other trading partners. Following the UK’s withdrawal from the EU in January this year, economic cooperation between the two trading partners will remain unchanged until the end of 2020; if no agreement is reached by the end of the transition period (i.e. by 2021), the barriers
18 In addition to the uncertainty and unpredictability of the spread, the duration of the epidemic, responses of the economy and economic policies, behaviour of the population and impacts on the functioning of the health and school systems, data on Slovenian enterprises’ reliance on global value chains would also be necessary for the assessment. The virus outbreak interrupted global value chains and the question is to what extent and how quickly they will be restored and how easily, if at all, intermediate products can be substituted. All of this affects not only production, but also companies’ investment decisions. These data are not yet available and are probably changing on a daily basis.
to cooperation may increase significantly, which could, particularly indirectly, negatively affect economic growth in Slovenia. Another downside risk to growth is climate change and related measures; with the transition to a more sustainable model of economic development, these measures may significantly alter the situation in certain activities in the short term (for example in the car industry).
There are also some, although significantly fewer, upside risks to economic growth in the coming years. Economic growth could be higher than forecast in the event of a rapid containment of the coronavirus spread and the concurrent absence of increases in international trade barriers and other negative shocks. This would lower uncertainty, which would improve economic sentiment internationally and in Slovenia and boost investment and growth in production and final consumption.
We are monitoring the economic situation in Slovenia and globally and will update the forecast as necessary.

17Spring forecast of economic trends 2020
estimates based on the Spring Forecast, which was made in conditions of extremely high uncertainty regarding the coronavirus spread and related measures, indicate that, while Slovenia’s output gap is in positive territory, it will decline gradually in 2020–2022 (from last year’s 3.0% to 1.7% by the end of the forecast period). The cooling of the economy is also suggested by signs of a moderation of the rapid price growth on the property market and lower values of capacity utilisation and labour shortage indicators amid lower growth in manufacturing and service sector activity. Wage growth in the private sector remains moderate, as do other financial and price
4 Output gap and potential GDP growth
Potential GDP growth,19 assessed on the basis of the Spring Forecast, which is subject to significant uncertainties and negative risks, should moderate gradually in 2020–2022 as a consequence, among other things, of unfavourable demographic trends. It is set to average around 2.4% in the forecast period, which is more than in the last ten-year period, when the effects of the crisis were evident.20 The greatest contribution to potential growth in the forecast period will still be made by total factor productivity (1.3 pps), whose growth is expected to be similar to that before the previous crisis. With rising investment, the contribution of capital will increase gradually during this period, but it will remain significantly lower on average (at 0.6 pps) than in the longer period before the crisis,21 given the low investment volume in the several-year period following its onset. Labour will contribute 0.6 pps on average to potential growth in the forecast period, but by 2022 its contribution will diminish noticeably under the impact of a further decline in the number of people aged 20–64. The increase in the activity rate will continue to positively affect potential growth, but its contribution will drop significantly towards the end of the forecast period, since the possibilities for increasing employment are limited. The natural unemployment rate will be lower than before the crisis over the entire forecast period.
The estimate of the output gap, which is beginning to close, and several other indicators indicate a mature phase of economic growth, which is easing particularly under the impact of lower growth in foreign demand and significant uncertainty regarding the spread and consequences of the coronavirus. The
19 From a macroeconomic perspective, potential GDP is an indicator which shows the output an economy can achieve without creating inflationary pressure (i.e. by overheating). The actual output (actual GDP) can be above the level of the potential output of an economy (potential GDP), which causes an increase in inflation. The difference between actual and potential GDP expressed as a percentage of potential GDP is referred to as a country’s output gap. The output gap is difficult to assess, its size and dynamics being subject to a range of uncertainties: potential GDP cannot be observed directly, while actual GDP is subject to historical data revisions. IMAD calculates potential GDP growth by a production function method which does not differ from the European Commission’s method in its essential attributes. The method assumes that potential GDP can be represented by a combination of production factors: labour (this is dependent on demographic factors, the activity rate and the natural unemployment rate), capital and total factor productivity. The disparities between potential GDP or output gap calculations by IMAD and the EC are largely due to the differences in i) the lengths of the forecast periods (IMAD T+5, the EC T+2), ii) the forecasts of macroeconomic indicators, and iii) certain input data (IMAD uses the August revision of SURS data and updated demographic projections calculated by a microsimulation model by the IER (source: SURS); in the series of data on employment according to national accounts statistics, IMAD’s calculations also take into account a correction for the break in the data series in 2002).
20 The long-term effect of the crisis is still reflected in a lower level of potential GDP (see Figure 13).
21 The contribution of capital to potential GDP growth in the 2000–2008 period, when it was also relatively stable, averaged 1.7 pps.
0
1
2
3
4
2000
2001
2002
2003
2004
2005
2006
2007
2008
2009
2010
2011
2012
2013
2014
2015
2016
2017
2018
2019
2020
2021
2022
Pote
ntia
l G
DP
grow
th,
in %
Source: SURS; calculations by IMAD and the EC.
IMAD (March 2020). EC (November 2019)IMAD (September 2019)
Figure 12: Potential GDP change, a comparison of IMAD and EC calculations
60
80
100
120
140
160
2000
2001
2002
2003
2004
2005
2006
2007
2008
2009
2010
2011
2012
2013
2014
2015
2016
2017
2018
2019
2020
2021
2022
Inde
x, p
oten
tial
GD
P 20
07=
100
Source: SURS; calculations by IMAD.
Potential GDP – trend growth (1999–2005 average) Potential GDPGDP
Figure 13: GDP, potential GDP and potential GDP without the crisis (with growth since 2007 equalling the average growth in 1999–2005)

18 Spring forecast of economic trends 2020
indicators such as inflation and growth in the volume of bank loans to the private sector. The current account surplus remains high (at over 6% of GDP), which mainly reflects the relatively low investment volume and moderate private consumption.
-0.5
0.0
0.5
1.0
1.5
2.0
2.5
3.0
3.5
4.0
2000
2001
2002
2003
2004
2005
2006
2007
2008
2009
2010
2011
2012
2013
2014
2015
2016
2017
2018
2019
2020
2021
2022
Con
trib
utio
ns t
o po
tent
ial
GD
P gr
owth
, in
pps
Source: calculations by IMAD.
LabourCapitalTotal factor productivityPotential GDP growth
Figure 14: Contributions of individual components to potential GDP growth
-8-7-6-5-4-3-2-1012345678
2000
2001
2002
2003
2004
2005
2006
2007
2008
2009
2010
2011
2012
2013
2014
2015
2016
2017
2018
2019
2020
2021
2022
Out
put
gap,
as
a %
of p
oten
tial
GD
P
Source: SURS; calculations by IMAD and the EC.
IMAD (March 2020) EC (November 2019)IMAD (September 2019)
Figure 15: Output gap, a comparison of IMAD and EC calculations

19Spring forecast of economic trends 2020
The recession in the EU automotive industry started mainly as a consequence of production standstills related to the adjustment to the new standards for measuring exhaust emissions, while its continuation was, in addition to limitations on the supply side, to a great extent attributable to moderating motor vehicle demand. The decline in C29 production in the EU in the third quarter of 2018 was largely related to the bottlenecks on the supply side related to the introduction of new exhaust emission measurement standards (WLTP24); they were particularly pronounced for German manufacturers. The effect of this measure was mostly temporary, while the further decline in production in 2019 was mainly related to the moderation of motor vehicle demand. At the same time, production remained limited by various supply-side factors.25 Global sales (new light motor vehicle registrations) decreased in 2018 and 2019 after several years of growth, which was also reflected in lower road vehicle exports from the EU. Exports to non-EU countries, which had already declined slightly in 2018 (–0.5% year on year), fell further in the first 11 months of
24 WLTP (Worldwide Harmonised Light Vehicle Test Procedure), which measures fuel consumption and CO2, CO, HC, NOx and particle emissions, entered into force in the EU on 1 September 2018 following a one-year transition period. From that date, all new passenger cars must be tested according to WLTP (an exception was made for a limited number of vehicles already in stock, which had to be sold by 1 January 2019). The introduction of WLTP was triggered, among other things, by the “dieselgate” scandal, which officially began in the US in September 2015. In the EU, where individual Member States also launched investigations into emission and fuel consumption measurements, sales growth in 2016 declined somewhat.
25 Motor vehicle production is weighed down by financial and other burdens associated with adapting to technological change and the (expected) tightening of environmental standards (including, for example, banning diesel vehicles from city centres), and most likely by the consequences of the "dieselgate” scandal, whose final cost for car manufacturers (violators) is not yet known (lawsuits related to customer compensation are still ongoing).
5 Analysis: Developments in the automotive industry and their impacts on Slovenian industry
Since mid-2018 production volume in the EU automotive industry has been shrinking, mainly due to a decline in Germany, though production has also fallen notably in several other old Member States. Cumulatively, the production of motor vehicles, trailers and semi-trailers (according to NACE Rev 2 Section C, Division 2922 – the automotive industry in a narrow sense) declined roughly by one eighth between mid-2018 and the end of 2019.23 The decline was due mainly to a fall in production in Germany (by around a fifth), which creates almost half of the total value added in this industry in the EU, and, to some extent, to production declines in Italy, the United Kingdom, France and some other (mainly old) Member States. In many new Member States, production in the automotive industry had stagnated or increased at a much slower pace since the middle of 2018, following several years of rapid growth, while in the last months of 2019 it started to decline gradually. In Slovenia, production in the C29 sector fell somewhat in the second half of 2018 after the surge in 2017 (related to the start of production of a new car model in a large exporting company), before recovering in the last months of 2019 to the same level as before this decline.
22 Division C29 includes: (i) manufacture of motor vehicles, (ii) manufacture of bodies (coachwork) for motor vehicles, manufacture of trailers and semi-trailers, (iii) manufacture of electrical and electronic equipment for motor vehicles, and (iv) manufacture of other parts and accessories for motor vehicles.
23 Production volume decline is assessed on the basis of Eurostat’s seasonally adjusted quarterly data.
-20
-15
-10
-5
0
5
10
15
20
Hun
gar
yA
ust
ria
Lith
uan
iaBu
lgar
iaBe
lgiu
mPo
rtu
gal
Pola
ndG
reec
eRo
man
iaSl
oven
iaC
zech
R.
Spai
nSw
eden
Fran
ceLa
tvia
Net
herla
nds
Esto
nia
EU-2
8U
. Kin
gdom Ital
yG
erm
any
Den
mar
k
Year
-on-
year
gro
wth
, in
%
H2 2018 2019
Source: Eurostat; calculations by IMAD. Note: Working-day adjusted data, for SI original data.
Figure 17: Year-on-year growth in output volume in the automotive industry (C29) in EU Member States
0
20
40
60
80
100
120
140
160
180
Jan
05
Jan
06
Jan
07
Jan
08
Jan
09
Jan
10
Jan
11
Jan
12
Jan
13
Jan
14
Jan
15
Jan
16
Jan
17
Jan
18
Jan
19
Prod
uctio
n vo
lum
e in
dex
(201
5=10
0)
EU* EU-15 excluding Germany*Germany NMS*Slovenia
Source: Eurostat, SURS; IMAD calculation of seasonally adjusted data for Slovenia. Note: * without Luxembourg, Finland, Croatia, Malta and Slovakia.
Figure 16: Output volume in the automotive industry (C29) in Slovenia and EU Member States

20 Spring forecast of economic trends 2020
2019 (–3.9% year on year), largely owing to lower exports to Turkey and China26 but also to somewhat lower exports to the US. The volume of intra-EU exports between Member States was also somewhat lower year on year in the first 11 months of 2019 (–1.9%); accounting for almost three quarters of the total EU road vehicle exports, intra-EU exports made roughly the same contribution to their decline as EU exports outside the EU. The moderating demand for motor vehicles manufactured in the EU is related to the following factors: (i) cyclical movements, i.e. slower global economic growth, which decelerated also under the impact of increases in international trade barriers, and (ii) structural changes in the industry, such as EU countries’ efforts to reduce the carbon footprint of transport (reflected in lower diesel car sales,27 where European manufacturers have a significant share, and in rising demand for electric cars28 and increased use of other forms of mobility29), a shift in consumer preferences (in favour of SUVs30) and, to some extent, the development of the sharing economy (car-pooling and ride-sharing).
Despite the expected partial recovery of growth in global car sales in the medium term, the EU car industry is confronted by significant challenges.
26 The decline in demand from China, whose lower economic growth is partly a consequence of the trade war with the US and related uncertainties, is also attributable to restrictions on loans and the removal of tax incentives for electric vehicle purchases in the middle of 2019.
27 According to ACEA, the share of diesel cars in new passenger cars in the EU declined from 54% to 30.5% between 2014 and 2019. In 2019 new diesel car sales in the EU declined almost by 14%.
28 In 2019 electric vehicles still accounted for only 3.0% of all new passenger cars sold in the EU (hybrid vehicles 5.9%), but their number increased by 53.5% compared to 2018 (the number of hybrid vehicles somewhat less).
29 Public transport, in cities also bikes and (electric) scooters. 30 German car manufacturers traditionally more established in the
production of sedans and station wagons.
Growth in demand for light vehicles (including passenger cars) is not yet expected to rebound in 2020,31 while next year it will be partly restored due to higher demand from less developed countries, according to LMC Automotive forecasts. Major challenges for European car manufacturers, in addition to the tightening of environmental standards, also include the further digitisation of the automotive industry and new types of mobility (car-pooling and shared rides, autonomous vehicle development, and so forth), all of which may lead to a decline in the number of jobs in this industry in the EU in the long run. In the forecast period, the car industry will also be exposed to significant uncertainties and risks, such as (i) the impact of the coronavirus epidemic on supply chains, (ii) the substitution of part of China’s imports from the EU by imports from the US, which should increase significantly in 2020 and 2021 according to the latest trade deal between the two countries, (iii) a possible increase in tariffs on imports of cars and car parts to the US, and (iv) a further tightening of environmental standards and thus possible tax changes.
Firms that cooperate in motor vehicle production directly or indirectly as suppliers contribute significantly to exports, employment and value added creation in Slovenia. The C29 industry accounts for 19% of the value of total goods exports, 8% of manufacturing value added and 7% of employment in the manufacturing sector. In the EU as a whole, the latter two shares are even slightly higher, reflecting the importance of this sector in Germany and the Czech Republic, Hungary and Slovakia (around 20% of value added in all
31 For light commercial vehicles up to 6 tonnes, LMC Automotive expects stagnation (–0.3%); ACEA, the European Automobile Manufacturers’ Association representing European motor vehicle manufacturers, expects a 2% fall in new passenger car registrations in the EU and no growth on the US and Chinese markets.
0
500
1,000
1,500
2,000
2,500
3,000
3,500
2000
2001
2002
2003
2004
2005
2006
2007
2008
2009
2010
2011
2012
2013
2014
2015
2016
2017
2018
I-XI 2
018
I-XI 2
019
Expo
rt vo
lum
e in
mill
ion
kg
Source: Eurostat; calculations by IMAD.
US China RussiaTurkey Switzerland Japan
Figure 19: Road vehicle exports from the EU to the largest non-EU markets
0
50
100
150
200
250
300
2000
2001
2002
2003
2004
2005
2006
2007
2008
2009
2010
2011
2012
2013
2014
2015
2016
2017
2018
I-XI 2
018
I-XI 2
019
Volu
me
inde
x 20
00=1
00
Source: Eurostat; calculations by IMAD. Note: Share in total EU-28 exports in 2018.
Outside the EU-28 (27% of exports*)
Inside the EU-28 (73% of exports*)
Figure 18: Road vehicle exports from the EU

21Spring forecast of economic trends 2020
manufacturing activities and around 8% of employment). However, the importance of the automotive industry goes well beyond these figures, as the automotive industry is a major consumer of steel, iron, aluminium, glass, textiles, computer chips and rubber. Value added more than triples (see Table 7) if the value added that is created by the C29 sector in Slovenia and incorporated in Slovenian exports is combined with the value added of (intermediate) products that Slovenian companies in other industries (metals, rubber, textiles, chemicals, etc.) directly or indirectly supply to foreign companies in the C29 sector (i.e. basically to motor vehicle manufacturers). Calculated in this way, the value added of the Slovenian economy that is linked to the global C29 sector or the global motor vehicle market through exports represents around 13.6% of the domestic value added embodied in Slovenia’s total exports and almost 6% of total GDP (for comparison, the share of all manufacturing activities in GDP is around 20%). The exposure of individual sectors in Slovenia to the global C29 industry is illustrated in Figure 22. Most of it results from Slovenian companies’ direct or indirect deliveries to the C29 sector in other EU Member States (row c in Table 7).
-9
-6
-3
0
3
6
9
12
15
18
-60
-40
-20
0
20
40
60
80
100
120
2000
2001
2002
2003
2004
2005
2006
2007
2008
2009
2010
2011
2012
2013
2014
2015
2016
2017
2018
2019
2020
2021
2022
2023
2024
2025
napoved
Ann
ual
grow
th in
num
ber,
in %
Num
ber
of v
ehic
les,
in m
illio
n*
Source: LCM Automotive. Note: *Mostly first registrations of light vehicles (up to 6 tonnes).
Annual sales volume*Growth in global sales, in % (right axis)Growth in Western Europe sales, in % (right axis)
Forecast
Figure 20: Movements of global light vehicle sales
0
10
20
30
40
50
60
70
80
90
100
2014 2015 2016 2017 2018 2019
Shar
e in
the
tota
l num
ber
of re
gist
ratio
ns,
in %
Source: ACEA; calculations by IMAD. Note: * Gas, fuel cell, LPG and E85 vehicles.
Petrol Diesel Electric Hybrid Other*
Figure 21: Structure of new passenger car registrations in the EU
Table 7: Estimation of value added of the export-oriented part of the Slovenian automotive industry in a narrower and a broader sense, 2014
NACE code Industry description Category Value in EUR million
Share of total domestic value added in exports, in %
Share in GDP, in %
a C29 Manufacture of motor vehicles, trailers and semi-trailers
Value added of industry C29 in total Slovenian exports 576.1 4.3 1.8
b Total economy except industry C29
Value added in exports (supplies) to industry C29 in all countries of the world
1,258.5 9.3 3.9
c Total economy except industry C29
Value added in exports (supplies) to industry C29 in the EU-28 891.1 6.6 2.8
a+b Automotive industry (estimation) Value added 1,834.6 13.5 5.7
Source: WIOD data; IMAD calculations.
13.0
7.2 6.1 5.8 5.5 4.8 3.8 3.1 2.6 2.5
18.119.9
25.2
4.8
16.1
9.9
5.4 4.9 4.7
8.9
0
5
10
15
20
25
30
C25
C22
C24
G46
C28
C27
H49
D35
M69
-M70 C20
In %
Source: WIOD data (2014); calculations by IMAD.
Share in total domestic VA content in exports to C29 industryin all countries of the worldShare in VA of industry
Note: C25 – Manufacture of fabricated metal products, except machinery and equipment; C22 – Manufacture of rubber and plastic products; C24 – Manufacture of basic metals; G46 – Wholesale trade, except motor vehicles and motorcycles; C28 – Manufacture of machinery and equpment; C27 – Manufacture of electrical equipment; H49 – Land transport and transport via pipelines; D35 – Electricity, gas and steam supply; M69–M70 –Legal and accounting activitiees; Activities of head offices, management consultancy activities; C20 – Manufacture of chemicals and chemical products.
Figure 22: Value added of Slovenian industries resulting from their exports to the global C29 industry, 2014

22 Spring forecast of economic trends 2020
-0.6
-0.5
-0.4
-0.3
-0.2
-0.1
0.0
0 4 8 12 16 20 24 28 32 36 40
Resp
onse
, in
%
Month after the shock
Source: IMAD's model estimates based on SURS, Eurostat and CPB data.
Figure 23: Impulse responses of manufacturing output volume to a 1% negative shock in the euro area automotive industry (C29)
-0.5
-0.4
-0.3
-0.2
-0.1
0.0
0.1
0 4 8 12 16 20 24 28 32 36 40
Resp
onse
, in
%
Month after the shock
Source: IMAD's model estimates based on SURS, Eurostat and CPB data.
Figure 24: Impulse responses of real turnover in service activities to a 1% negative shock in the euro area automotive industry (C29)
The estimates of the VAR model show visible spillovers of shocks in the euro area C29 sector into activity in both the manufacturing and service sectors in Slovenia in the last two decades. The Slovenian manufacturing sector is closely integrated into the European (particularly German) automotive supply chain and therefore highly vulnerable to fluctuations in euro area motor vehicle production. The negative effects of the decline in motor vehicle production are also spilling over into other parts of the economy. We assessed the extent to which they were transferred into the entire manufacturing and service sectors in the past by means of a vector autoregression model (VAR), which can be written in a reduced form as . The vector of endogenous variables includes two blocks: (i) an external block with two variables – the volume of world imports without the euro area and the volume of production in the C29 sector in the euro area – and (ii) a domestic block with three variables – output volume in Slovenian manufacturing, real turnover in Slovenian service activities and the real effective exchange rate for Slovenia (deflated by the HICP). The model assumes exogeneity of the external block, meaning that international developments are independent from developments in the small Slovenian economy.32 Seasonally adjusted variables, enter the model as log values, as all variables are integrated of order 1. The model is estimated on monthly data for the period from May 2000 to October 2019. The model is statistically appropriate. In line with the Schwarz criterion, it includes two time lags (t = 1, 2). The results of the assessment indicate that a 1% decline (increase) in euro area C29 sector output on average led to a 0.35% decline (increase) in Slovenia’s manufacturing output in the analysed period; the full effect took approximately one year to occur. Real turnover in service activities, as expected, responded slightly less intensely, by a 0.25% decline (increase); the full effect materialised after a slightly longer lag, two years after the shock.
32 The identification of the structural model parameters is based on a Cholesky decomposition of the variance–covariance matrix of residuals of the reduced model estimated by the method of least squares. In determining the order of the variables (the external block variables preceding the domestic block variables – in the order as in the text), we assumed that economic developments in the euro area and the rest of the world do not respond (immediately) to developments in the small Slovenian economy, while a relationship in the opposite direction exists (a similar approach was used by Sosa 2008, the IMF, and Cheung and Westermann 2001). Restrictions resulting from the precisely determined order of the variables in the model refer only to period t, i.e. to immediate effects. For domestic shocks, we additionally introduced zero long-term restrictions (i.e. for all time lags) for their impact on external variables (see, for example, Sosa 2008), thus reducing the number of estimated model parameters and increasing the precision of estimates.
𝑌𝑌𝑡𝑡 = 𝐵𝐵(𝐿𝐿)𝑌𝑌𝑡𝑡−1 + 𝑢𝑢𝑡𝑡𝑌𝑌
𝑌𝑌𝑡𝑡 = 𝐵𝐵(𝐿𝐿)𝑌𝑌𝑡𝑡−1 + 𝑢𝑢𝑡𝑡𝑌𝑌

23Spring forecast of economic trends 2020
period analysed. Institutions that release their forecasts at a later time have an advantage in terms of information, which can be manifested in smaller forecasting errors. For this reason, we compared the forecasting accuracy of institutions using a new, less biased method37 based on the calculation of an adjusted mean absolute error
37 We used this method for the first time in the Autumn Forecast of Economic Trends 2018 (see Section 5). For a detailed description of the method, see Andersson, M. K., Aranki, T., and Reslow, A. (2017). “Adjusting for Information Content when Comparing Forecast Performance”. Journal of Forecasting, 36(7), 784–794.
Appendix
1 Assessing forecasting performance
1.1 Methodology
IMAD regularly assesses the accuracy of its forecasts in comparison with other institutions33 that publish forecasts of economic trends for Slovenia. The analysis, which captures the latest data for 2019, covers the forecasts34 for two key macroeconomic variables: real economic growth and average annual inflation. The movement of the actual values of the two variables over time is shown in Figure 25. The assessment of forecasting performance is based on a comparison of the forecast values with the first statistical annual estimates using various statistical measures of accuracy35. In the following paragraphs we present a comparison of the size of errors made by individual institutions in their 2018–2019 forecasts for 2019, followed by an assessment of the performance of IMAD forecasts for the period after 1997. The last part includes a comparative analysis of the forecasting performance of six institutions, where the analysed period is from 2002 to 2019, the longest period for which forecasts of all the institutions are available.36
For a less biased comparison of institutions’ forecasting performance, the impact of the time when the forecast was released must be excluded from the comparison. As is evident from Figure 26, in 2019 most institutions published their forecasts after the release of the quarterly data for GDP (for the last quarter of the previous year or the second quarter of the current year) at a later time than IMAD. This was the case in the entire
33 In addition to the forecasts made by the Institute of Macroeconomic Analysis and Development (IMAD), the analysis covers forecasts by the Bank of Slovenia (BoS), the Chamber of Commerce and Industry of Slovenia (CCIS), and, among international institutions, the European Commission (EC), the International Monetary Fund (IMF), Wiener Institut fuer Internationale Wirtschaftsvergleiche (WIIW), and, for the last few years, the Organisation for Economic Co-operation and Development (OECD) and Consensus Economics.
34 Spring forecasts for the year ahead (SFt+1), autumn forecasts for the year ahead (AFt+1), spring forecasts for the current year (SFt) and autumn forecasts for the current year (AFt).
35 The arithmetic mean mean absolute
error root mean square error
standardised mean absolute error
and standardised root mean square error
where the designations of variables and symbols
have the following meanings: actual value, forecast, standard
deviation and number of forecasts. For detailed results see the Statistical Appendix.
36 Excluding the OECD and Consensus Economics, as their forecasts for Slovenia have only been available since 2009.
-8
-6
-4
-2
0
2
4
6
8
10
1997
1998
1999
2000
2001
2002
2003
2004
2005
2006
2007
2008
2009
2010
2011
2012
2013
2014
2015
2016
2017
2018
2019
Cha
nge,
in %
Source: SURS.
GDP (real) Inflation (average annual)
Figure 25: Movement of variables analysed
BoS
EC
IMF
IMAD
BoS
EC
IMF
OECD
Consensus Economics *
OECD
IMAD
CCIS
WIIW
WIIW CCISConsensus
Economics *
Dec
Nov
Oct
Sep
Aug
Jul
Jun
May
Apr
Mar
Feb
Jan
Source: Forecasts of individual institutions.
Figure 26: Timeline of forecasts released by individual institutions in 2019
(
( ),
( ),
𝑠𝑠𝑠𝑠𝑠𝑠𝑠𝑠𝑠𝑠𝑠𝑠 𝑠 𝑀𝑀𝑀𝑀𝑀𝑀𝑠𝑠𝑠𝑠(𝑅𝑅𝑡𝑡)
( ), 𝑅𝑅 𝑃𝑃 𝑠𝑠𝑠𝑠
𝑇𝑇

24 Spring forecast of economic trends 2020
of moderating growth in foreign demand, and hovered around 2.9% on average, 0.5 pps above the actual value of 2.4%. The most accurate last forecasts for 2019 were made by the BoS and the EC (errors of 0.2 pps), while the errors of other institutions ranged between 0.4 and 0.7 pps; IMAD was at the lowest limit of this interval, with an error of 0.4 pps
The forecasts of inflation for 2019 by most institutions were also higher than the actual inflation figures. In their forecasts from 2018, most institutions expected a continuation of moderate inflation at around or just above 2% in 2019. Their forecasts were mainly based on expectations regarding further growth in domestic demand. In 2019 most institutions revised their forecasts slightly downwards, which was mainly due to weaker indicators for the external environment. The latest inflation forecasts, from autumn 2019, stabilised at a level close to 1.8%, with all institutions (except the BoS) slightly overestimating actual inflation, which was ultimately 1.6% (CPI) and 1.7% (HICP). A totally accurate last forecast was made by the BoS (released in December 2019); IMAD’s error was 0.2 pps, which is comparable to other institutions that forecast CPI inflation.
(the adjusted MAE statistic), which eliminates the timing effect. The adjusted MAE statistic is calculated by an econometric model which assumes that the absolute forecast error is dependent on the amount of information available to the forecasting institution when preparing the forecast, the general forecasting ability of the institution (i.e. individual or fixed effects), and also the fact that some years are more difficult to forecast. The estimated individual (fixed) effects of this model can then be interpreted as adjusted absolute forecast errors.
1.2 Outcomes
All institutions overestimated real economic growth in their forecasts for 2019. In their spring forecasts from 2018, the institutions predicted 3.5% economic growth on average in 2019, expecting it to be underpinned by both domestic demand and relatively favourable export activity. The lowest economic growth was forecast by the CCIS (2.8%) and the highest by the BoS and the OECD (3.9%). Until spring 2019, the forecasts of all institutions (except the CCIS) still persisted with a figure above 3%. In their autumn forecasts from 2019, the forecasts of most institutions declined below 3%, mainly as a consequence
Table 8: Errors in real GDP growth forecasts for 2019, by forecasting institution
Realisation: 2.4 %
Spring forecast from 2018 (SFt+1)
Autumn forecast from 2018 (AFt+1)
Spring forecast from 2019 (SFt)
Autumn forecast from 2019 (AFt)
Forecast Error in pps Forecast Error in pps Forecast Error in pps Forecast Error in pps
IMAD 3.8 1.4 3.7 1.3 3.4 1.0 2.8 0.4
BoS 3.9 1.5 3.4 1.0 3.2 0.8 2.6 0.2
CCIS 2.8 0.4 3.5 1.1 2.9 0.5 2.9 0.5
EC 3.6 1.2 3.3 0.9 3.1 0.7 2.6 0.2
IMF 3.2 0.8 3.4 1.0 3.4 1.0 2.9 0.5
WIIW 3.5 1.1 3.6 1.2 3.2 0.8 2.9 0.5
OECD 3.9 1.5 3.6 1.2 3.4 1.0 3.1 0.7
Consensus Economics 3.3 0.9 3.4 1.0 3.3 0.9 3.1 0.7
Source: Forecasts by individual institutions; calculations by IMAD. Note: Negative values of errors indicate an underestimation, while positive values indicate an overestimation of actual trends.
Table 9: Errors in average annual inflation forecasts for 2019, by forecasting institution
Realisation: CPI: 1.6 %HICP: 1.7%
Spring forecast from 2018 (SFt+1)
Autumn forecast from 2018 (AFt+1)
Spring forecast from 2019 (SFt)
Autumn forecast from 2019 (AFt)
Forecast Error in pps Forecast Error in pps Forecast Error in pps Forecast Error in pps
IMAD 1.9 0.3 2.1 0.5 1.6 0 1.8 0.2
BoS* 2.2 0.5 2.2 0.5 1.7 0 1.7 0
CCIS 2.2 0.6 2.2 0.6 1.9 0.3 1.8 0.2
EC* 2.0 0.3 2.3 0.6 1.8 0.1 1.8 0.1
IMF 2.0 0.4 2.0 0.4 1.4 -0.2 1.8 0.2
WIIW* 1.8 0.1 2.0 0.3 1.8 0.1 1.8 0.1
OECD* 2.7 1.0 2.2 0.5 1.4 -0.3 1.8 0.1
Consensus 1.9 0.3 1.9 0.3 1.7 0.1 1.7 0.1
Source: Forecasts by individual institutions; calculations by IMAD. Notes: * The forecasts by the BoS, EC, WIIW and OECD refer to HICP inflation. Negative values of errors indicate an underestimation, while positive values indicate an overestimation of actual trends.

25Spring forecast of economic trends 2020
forecasts for real GDP growth was 1.93 pps in SFt+1 and 1.63 pps in AFt+1; in SFt in AFt it amounted to 1.04 pps and 0.52 pps respectively. The mean absolute errors in the forecasts for inflation were somewhat smaller,39 1.02 pps in SFt+1, 0.91 pps in AFt+1, 0.42 pps in SFt and 0.19 pps in AFt. Somewhat larger errors were observed particularly in the forecasts for real GDP growth over a shorter time horizon (for example in 2002–2019), which is mainly due to larger errors during the period of the economic and financial crisis and later in the transition into the phase of recovery, when forecasting was more difficult due to greater uncertainty (see Figure 27). Moreover, a detailed examination of errors in IMAD forecasts also shows that in both real economic growth and average annual inflation absolute errors decline with the shortening of the forecast horizon, meaning that IMAD forecasts effectively take into account all new information available at the time of the preparation of each new forecast.
In comparing the forecasting reliability of institutions, it is necessary to consider the time when the forecast was released. The time of release can have a significant impact on accuracy, as a forecast released later in the year may include new information, which can result in smaller forecast errors. This new information may involve new data on indicator movements, revisions of already released data and also changes in the assumptions about developments in the international environment, the last representing a significant element of uncertainty for an open economy such as Slovenia’s. In recent years fiscal policy guidelines and fiscal consolidation measures have also become a significant factor to consider when
39 The same conclusions can also be drawn based on the calculation of the standardised MAE and RSME statistics, which are more appropriate for direct comparisons of the accuracy of individual variables.
In IMAD forecasts, no major systematic deviations from actual values have been observed over a longer time horizon. In assessing the forecasting performance, it is necessary to focus on a longer time horizon. Below we first assess the performance of IMAD forecasts for real GDP growth and average annual inflation in the period after 1997. This assessment is followed by a comparison of the forecasting accuracy among institutions using a method that excludes the impact of the time when the forecast was prepared/released. The first characteristic by way of which the forecasting performance can be assessed is the forecast bias. A forecast is biased when it systematically under- or over-estimates the actual value of the projected variable. The forecast bias is determined by the sign in front of the mean error of the forecast. The calculations show that in the 1997–2019 period, IMAD slightly overestimated real GDP growth in SFt+1 and AFt+1, which is evident from the positive values of mean forecast errors (0.60 pps and 0.40 pps respectively). The values of mean errors for real GDP growth in SFt and AFt are insignificant (0.08 pps and –0.06 pps respectively), meaning that the forecasts are not biased. The forecasts for average annual inflation are not biased either, the mean error of all forecasts being only –0.02 pps.
The accuracy of IMAD forecasts increases with the shortening of the forecast horizon. Another important factor in assessing the forecasting reliability is the accuracy of the forecast, which is determined by calculating the mean absolute error (MAE)38 (this should be as small as possible over a longer time horizon). Between 1997 and 2019, the mean absolute error in IMAD
38 Another measure is the RMSE, which penalises large errors, as these are less desirable.
0.0
0.5
1.0
1.5
2.0
2.5
SPt+1 AF t+1 SP t AF t
Erro
r, in
pps
Source: IMAD forecasts. Note: *Excluding 2009, 2011, 2012 and 2014.
1997-2019 2002-20191997–2019 (excluding the crisis*) 2002–2019 (excluding the crisis*)
Figure 27: Mean absolute errors in IMAD forecasts for real GDP growth (left) and average annual inflation (right)
0.0
0.2
0.4
0.6
0.8
1.0
1.2
SPt+1 AF t+1 SP t AF t
Erro
r, in
pps
Source: IMAD forecasts. Note: *Excluding 2009, 2011, 2012 and 2014.
1997-2019 2002-20191997–2019 (excluding the crisis*) 2002–2019 (excluding the crisis*)
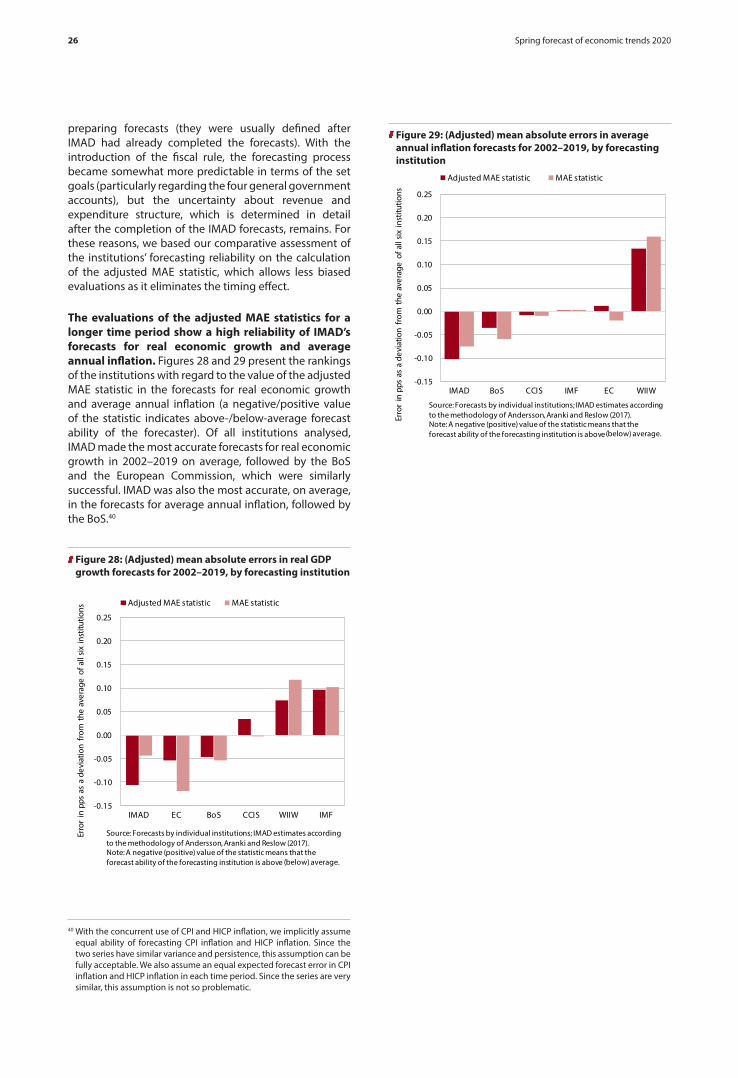
26 Spring forecast of economic trends 2020
preparing forecasts (they were usually defined after IMAD had already completed the forecasts). With the introduction of the fiscal rule, the forecasting process became somewhat more predictable in terms of the set goals (particularly regarding the four general government accounts), but the uncertainty about revenue and expenditure structure, which is determined in detail after the completion of the IMAD forecasts, remains. For these reasons, we based our comparative assessment of the institutions’ forecasting reliability on the calculation of the adjusted MAE statistic, which allows less biased evaluations as it eliminates the timing effect.
The evaluations of the adjusted MAE statistics for a longer time period show a high reliability of IMAD’s forecasts for real economic growth and average annual inflation. Figures 28 and 29 present the rankings of the institutions with regard to the value of the adjusted MAE statistic in the forecasts for real economic growth and average annual inflation (a negative/positive value of the statistic indicates above-/below-average forecast ability of the forecaster). Of all institutions analysed, IMAD made the most accurate forecasts for real economic growth in 2002–2019 on average, followed by the BoS and the European Commission, which were similarly successful. IMAD was also the most accurate, on average, in the forecasts for average annual inflation, followed by the BoS.40
40 With the concurrent use of CPI and HICP inflation, we implicitly assume equal ability of forecasting CPI inflation and HICP inflation. Since the two series have similar variance and persistence, this assumption can be fully acceptable. We also assume an equal expected forecast error in CPI inflation and HICP inflation in each time period. Since the series are very similar, this assumption is not so problematic.
-0.15
-0.10
-0.05
0.00
0.05
0.10
0.15
0.20
0.25
IMAD EC BoS CCIS WIIW IMF
Adjusted MAE statistic MAE statistic
Erro
r in
pps
as
a de
viat
ion
from
the
ave
rage
of a
ll si
x in
stitu
tions
Source: Forecasts by individual institutions; IMAD estimates according to the methodology of Andersson, Aranki and Reslow (2017). Note: A negative (positive) value of the statistic means that the forecast ability of the forecasting institution is above (below) average.
Figure 28: (Adjusted) mean absolute errors in real GDP growth forecasts for 2002–2019, by forecasting institution
-0.15
-0.10
-0.05
0.00
0.05
0.10
0.15
0.20
0.25
IMAD BoS CCIS IMF EC WIIW
Adjusted MAE statistic MAE statistic
Source: Forecasts by individual institutions; IMAD estimates according to the methodology of Andersson, Aranki and Reslow (2017). Note: A negative (positive) value of the statistic means that the forecast ability of the forecasting institution is above
Erro
r in
pps
as
a de
viat
ion
from
the
ave
rage
of a
ll si
x in
stitu
tions
(below) average.
Figure 29: (Adjusted) mean absolute errors in average annual inflation forecasts for 2002–2019, by forecasting institution

stat
isti
cal a
ppen
dix

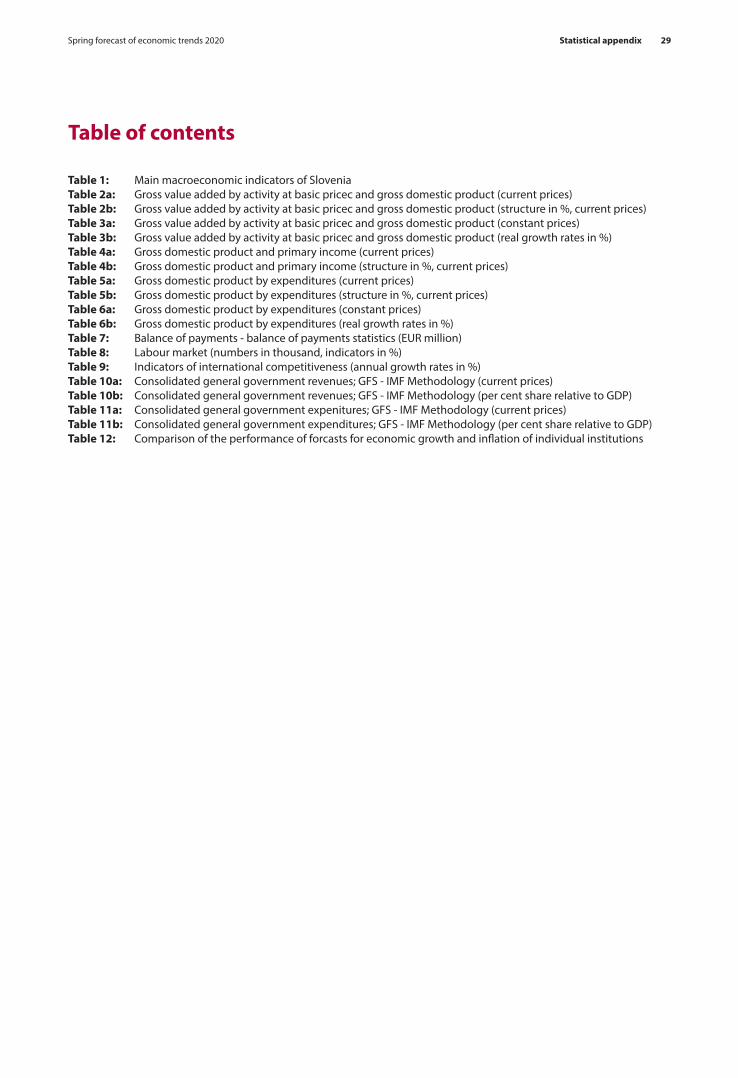
Statistical appendix 29Spring forecast of economic trends 2020
Table of contents
Table 1: Main macroeconomic indicators of SloveniaTable 2a: Gross value added by activity at basic pricec and gross domestic product (current prices)Table 2b: Gross value added by activity at basic pricec and gross domestic product (structure in %, current prices)Table 3a: Gross value added by activity at basic pricec and gross domestic product (constant prices)Table 3b: Gross value added by activity at basic pricec and gross domestic product (real growth rates in %)Table 4a: Gross domestic product and primary income (current prices)Table 4b: Gross domestic product and primary income (structure in %, current prices)Table 5a: Gross domestic product by expenditures (current prices)Table 5b: Gross domestic product by expenditures (structure in %, current prices)Table 6a: Gross domestic product by expenditures (constant prices)Table 6b: Gross domestic product by expenditures (real growth rates in %)Table 7: Balance of payments - balance of payments statistics (EUR million)Table 8: Labour market (numbers in thousand, indicators in %)Table 9: Indicators of international competitiveness (annual growth rates in %)Table 10a: Consolidated general government revenues; GFS - IMF Methodology (current prices)Table 10b: Consolidated general government revenues; GFS - IMF Methodology (per cent share relative to GDP)Table 11a: Consolidated general government expenitures; GFS - IMF Methodology (current prices)Table 11b: Consolidated general government expenditures; GFS - IMF Methodology (per cent share relative to GDP)Table 12: Comparison of the performance of forcasts for economic growth and inflation of individual institutions

Statistical appendix30 Spring forecast of economic trends 2020
Table 1: Main macroeconomic indicators of Slovenia Real growth rates in %, unless otherwise indicated
2012 2013 2014 2015 2016 2017 2018 20192020 2021 2022
forecast
GROSS DOMESTIC PRODUCT -2.6 -1.0 2.8 2.2 3.1 4.8 4.1 2.4 1.5 2.2 2.2
GDP in EUR m* (current prices, fixed exchange rate 2007) 36,253 36,454 37,634 38,853 40,367 42,987 45,755 48,007 49,761 51,886 54,091
GDP per capita in EUR (current prices and at current exchange rate) 17,626 17,700 18,253 18,830 19,551 20,809 22,083 22,983 23,657 24,560 25,525
GDP per capita in USD (current prices and at current exchange rate) 22,646 23,508 24,249 20,892 21,641 23,508 26,080 25,729 25,975 26,943 28,001
GDP per capita (PPS)1 22,000 22,000 22,800 23,800 24,200 25,500 26,900
GDP per capita (PPS EU28=100)1 82 82 82 82 83 85 87
EMPLOYMENT AND PRODUCTIVITY
Employment according to National Accounts -0.9 -1.1 0.4 1.3 1.8 3.0 3.2 2.4 1.1 0.7 0.5
Registered unemployed (annual average in thousand) 110.2 119.8 120.1 112.7 103.2 88.6 78.5 74.2 72.0 69.8 67.4
Rate of registered unemployment in % 12.0 13.1 13.1 12.3 11.2 9.5 8.2 7.7 7.4 7.1 6.8
Rate of unemployment by ILO in % 8.9 10.1 9.7 9.0 8.0 6.6 5.1 4.5 4.2 4.0 3.8
Labour productivity (GDP per employee) -1.7 0.1 2.4 0.9 1.3 1.8 0.9 0.1 0.4 1.5 1.7
WAGES
Gross wage per employee - nominal growth in % 0.1 -0.2 1.1 1.0 1.8 2.7 3.4 4.3 3.8 3.7 4.0
Private sector activities 0.5 0.6 1.4 0.5 1.7 2.9 4.0 3.9 4.0 3.6 4.0
Public service activities -0.9 -1.3 0.9 2.1 2.3 2.9 3.0 5.4 3.6 4.0 4.0
Gross wage per employee - real growth in % -2.5 -1.9 0.9 1.5 2.0 1.3 1.6 2.7 2.1 1.5 1.9
Private sector activities -2.0 -1.2 1.2 1.0 1.8 1.5 2.3 2.2 2.3 1.3 1.9
Public service activities -3.4 -3.0 0.7 2.6 2.4 1.5 1.3 3.7 1.9 1.7 1.9
INTERNATIONAL TRADE
Exports of goods and services 0.5 3.1 6.0 4.7 6.5 10.5 6.1 4.4 2.4 4.2 4.1
Exports of goods 0.4 3.3 6.3 5.3 6.2 10.6 5.8 4.4 2.6 3.9 3.9
Exports of services 1.1 2.0 5.0 2.4 7.7 10.2 7.4 4.2 1.5 5.1 4.7
Imports of goods and services -3.5 2.1 4.2 4.3 6.7 10.1 6.6 4.2 2.3 4.3 4.6
Imports of goods -4.3 2.9 3.8 5.1 7.0 10.4 7.3 4.6 2.3 4.1 4.5
Imports of services 1.0 -2.3 6.1 0.1 4.7 8.6 3.0 2.0 2.4 5.2 4.9

Statistical appendix 31Spring forecast of economic trends 2020
Table 1: Main macroeconomic indicators of Slovenia - continue Real growth rates in %, unless otherwise indicated
2012 2013 2014 2015 2016 2017 2018 20192020 2021 2022
forecast
BALANCE OF PAYMENTS STATISTICS
Current account balance in EUR m 479 1,204 1,924 1,482 1,942 2,635 2,593 3,159 3,372 3,521 3,396
- As a per cent share relative to GDP 1.3 3.3 5.1 3.8 4.8 6.1 5.7 6.6 6.8 6.8 6.3
External balance of goods and services in EUR m 1,138 2,130 2,636 3,110 3,462 3,820 3,807 4,349 4,589 4,708 4,646
- As a per cent share relative to GDP 3.1 5.8 7.0 8.0 8.6 8.9 8.3 9.1 9.2 9.1 8.6
FINAL DOMESTIC DEMAND
Final consumption -2.2 -3.4 1.1 2.1 3.9 1.5 2.9 2.4 1.9 1.6 1.6
As a % of GDP 77.8 75.7 73.9 72.8 73.0 71.0 70.2 70.1 70.5 70.4 70.1
in which:
Private consumption -2.2 -3.9 1.6 2.0 4.4 2.0 2.8 2.7 2.0 1.7 1.7
As a % of GDP 57.5 56.1 55.0 54.0 53.9 52.5 51.9 51.7 51.9 51.7 51.4
Government consumption -2.4 -2.0 -0.2 2.3 2.5 0.3 3.2 1.6 1.6 1.3 1.2
As a % of GDP 20.4 19.6 18.9 18.8 19.1 18.4 18.3 18.4 18.6 18.7 18.7
Gross fixed capital formation -8.5 3.4 -0.1 -1.2 -3.7 10.4 9.1 3.2 -1.0 4.0 6.0
As a % of GDP 19.0 19.6 19.1 18.7 17.4 18.3 19.2 19.3 18.8 19.2 19.9
EXCHANGE RATE AND PRICES
Ratio of USD to EUR 1.286 1.328 1.329 1.110 1.107 1.129 1.181 1.120 1.098 1.097 1.097
Real effective exchange rate - deflated by CPI2 -1.2 1.2 -0.2 -4.2 0.3 0.4 0.8 -0.2 0.1 0.6 0.2
Inflation (end of the year), %3 2.7 0.7 0.2 -0.4 0.5 1.7 1.4 1.9 2.0 2.2 2.0
Inflation (year average), %3 2.6 1.8 0.2 -0.5 -0.1 1.4 1.7 1.6 1.7 2.2 2.0
Brent Crude Oil Price USD / barrel 111.7 108.6 98.9 52.4 44.8 54.3 71.0 64.3 55.8 55.0 55.1
Source of data: SURS, BS, Eurostat, calculations and forecasts by IMAD.1 Measured in purchasing power standard. 2 Growth in value denotes real appreciation of national currency and vice versa. 3 Consumer price index.
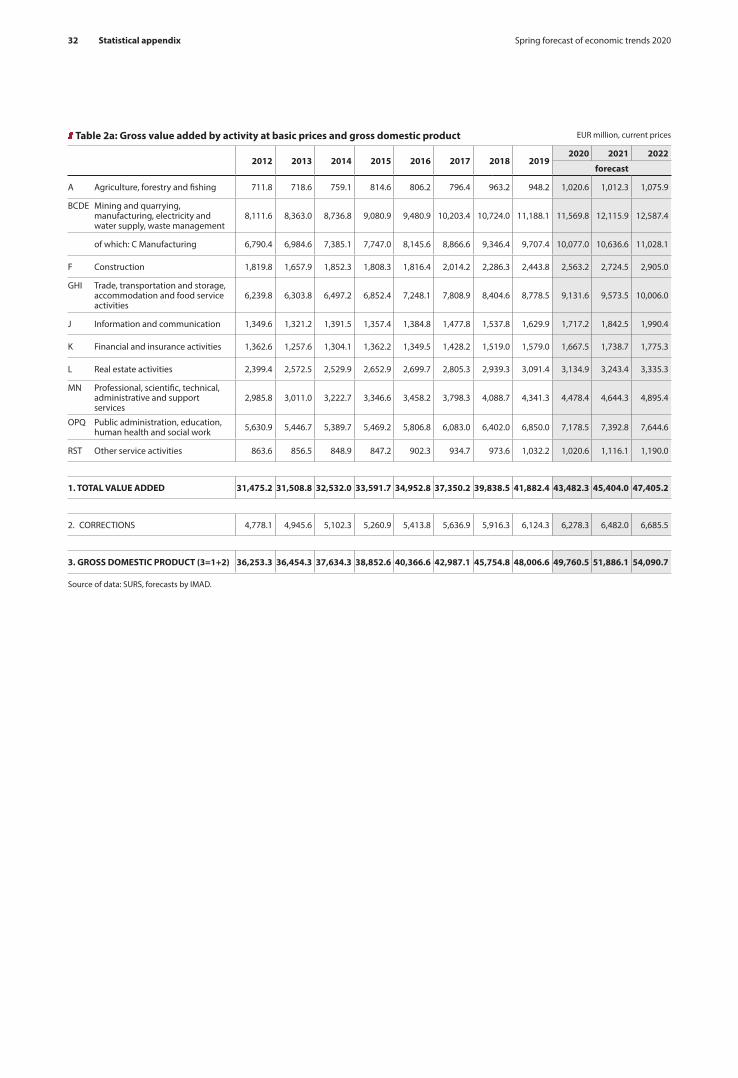
Statistical appendix32 Spring forecast of economic trends 2020
Table 2a: Gross value added by activity at basic prices and gross domestic product EUR million, current prices
2012 2013 2014 2015 2016 2017 2018 20192020 2021 2022
forecast
A Agriculture, forestry and fishing 711.8 718.6 759.1 814.6 806.2 796.4 963.2 948.2 1,020.6 1,012.3 1,075.9
BCDE Mining and quarrying, manufacturing, electricity and water supply, waste management
8,111.6 8,363.0 8,736.8 9,080.9 9,480.9 10,203.4 10,724.0 11,188.1 11,569.8 12,115.9 12,587.4
of which: C Manufacturing 6,790.4 6,984.6 7,385.1 7,747.0 8,145.6 8,866.6 9,346.4 9,707.4 10,077.0 10,636.6 11,028.1
F Construction 1,819.8 1,657.9 1,852.3 1,808.3 1,816.4 2,014.2 2,286.3 2,443.8 2,563.2 2,724.5 2,905.0
GHI Trade, transportation and storage, accommodation and food service activities
6,239.8 6,303.8 6,497.2 6,852.4 7,248.1 7,808.9 8,404.6 8,778.5 9,131.6 9,573.5 10,006.0
J Information and communication 1,349.6 1,321.2 1,391.5 1,357.4 1,384.8 1,477.8 1,537.8 1,629.9 1,717.2 1,842.5 1,990.4
K Financial and insurance activities 1,362.6 1,257.6 1,304.1 1,362.2 1,349.5 1,428.2 1,519.0 1,579.0 1,667.5 1,738.7 1,775.3
L Real estate activities 2,399.4 2,572.5 2,529.9 2,652.9 2,699.7 2,805.3 2,939.3 3,091.4 3,134.9 3,243.4 3,335.3
MN Professional, scientific, technical, administrative and support services
2,985.8 3,011.0 3,222.7 3,346.6 3,458.2 3,798.3 4,088.7 4,341.3 4,478.4 4,644.3 4,895.4
OPQ Public administration, education, human health and social work 5,630.9 5,446.7 5,389.7 5,469.2 5,806.8 6,083.0 6,402.0 6,850.0 7,178.5 7,392.8 7,644.6
RST Other service activities 863.6 856.5 848.9 847.2 902.3 934.7 973.6 1,032.2 1,020.6 1,116.1 1,190.0
1. TOTAL VALUE ADDED 31,475.2 31,508.8 32,532.0 33,591.7 34,952.8 37,350.2 39,838.5 41,882.4 43,482.3 45,404.0 47,405.2
2. CORRECTIONS 4,778.1 4,945.6 5,102.3 5,260.9 5,413.8 5,636.9 5,916.3 6,124.3 6,278.3 6,482.0 6,685.5
3. GROSS DOMESTIC PRODUCT (3=1+2) 36,253.3 36,454.3 37,634.3 38,852.6 40,366.6 42,987.1 45,754.8 48,006.6 49,760.5 51,886.1 54,090.7
Source of data: SURS, forecasts by IMAD.

Statistical appendix 33Spring forecast of economic trends 2020
Table 2b: Gross value added by activity at basic prices and gross domestic product Structure in %, current prices
2012 2013 2014 2015 2016 2017 2018 20192020 2021 2022
forecast
A Agriculture, forestry and fishing 2.0 2.0 2.0 2.1 2.0 1.9 2.1 2.0 2.1 2.0 2.0
BCDE Mining and quarrying, manufacturing, electricity and water supply, waste management
22.4 22.9 23.2 23.4 23.5 23.7 23.4 23.3 23.3 23.4 23.3
of which: C Manufacturing 18.7 19.2 19.6 19.9 20.2 20.6 20.4 20.2 20.3 20.5 20.4
F Construction 5.0 4.5 4.9 4.7 4.5 4.7 5.0 5.1 5.2 5.3 5.4
GHI Trade, transportation and storage, accommodation and food service activities
17.2 17.3 17.3 17.6 18.0 18.2 18.4 18.3 18.4 18.5 18.5
J Information and communication 3.7 3.6 3.7 3.5 3.4 3.4 3.4 3.4 3.5 3.6 3.7
K Financial and insurance activities 3.8 3.4 3.5 3.5 3.3 3.3 3.3 3.3 3.4 3.4 3.3
L Real estate activities 6.6 7.1 6.7 6.8 6.7 6.5 6.4 6.4 6.3 6.3 6.2
MN Professional, scientific, technical, administrative and support services 8.2 8.3 8.6 8.6 8.6 8.8 8.9 9.0 9.0 9.0 9.1
OPQ Public administration, education, human health and social work 15.5 14.9 14.3 14.1 14.4 14.2 14.0 14.3 14.4 14.2 14.1
RST Other service activities 2.4 2.3 2.3 2.2 2.2 2.2 2.1 2.2 2.1 2.2 2.2
1. TOTAL VALUE ADDED 86.8 86.4 86.4 86.5 86.6 86.9 87.1 87.2 87.4 87.5 87.6
2. CORRECTIONS 13.2 13.6 13.6 13.5 13.4 13.1 12.9 12.8 12.6 12.5 12.4
3. GROSS DOMESTIC PRODUCT (3=1+2) 100.0 100.0 100.0 100.0 100.0 100.0 100.0 100.0 100.0 100.0 100.0
Source of data: SURS, forecasts by IMAD.

Statistical appendix34 Spring forecast of economic trends 2020
Table 3a: Gross value added by activity at basic prices and gross domestic product EUR million
constant previous year prices constant prices
2012 2013 2014 2015 2016 2017 2018 20192020 2021 2022
forecast
A Agriculture, forestry and fishing 736.4 704.8 733.0 858.7 819.4 785.1 895.6 917.9 986.1 996.5 1,006.4
BCDE Mining and quarrying, manufacturing, electricity and water supply, waste management
7,860.3 8,078.2 8,695.4 8,891.7 9,505.6 10,212.9 10,570.9 11,034.2 11,333.5 11,622.5 11,913.1
of which: C Manufacturing 6,555.4 6,740.2 7,300.8 7,593.1 8,140.6 8,841.0 9,183.1 9,701.0 9,843.3 10,109.1 10,382.0
F Construction 1,743.4 1,652.1 1,820.9 1,792.9 1,747.4 1,967.2 2,174.7 2,379.1 2,500.0 2,601.3 2,731.3
GHI Trade, transportation and storage, accommodation and food service activities
6,154.5 6,261.0 6,522.2 6,858.4 7,229.7 7,707.8 8,276.7 8,690.0 8,875.1 9,083.6 9,301.6
J Information and communication 1,323.3 1,366.6 1,383.8 1,419.0 1,348.2 1,445.4 1,541.7 1,573.8 1,686.9 1,763.7 1,851.9
K Financial and insurance activities 1,587.4 1,325.1 1,239.6 1,261.4 1,406.0 1,342.8 1,417.3 1,562.6 1,623.2 1,669.5 1,711.2
L Real estate activities 2,477.5 2,409.6 2,605.0 2,534.5 2,662.5 2,729.8 2,823.0 2,970.0 3,122.3 3,155.1 3,186.6
MN Professional, scientific, technical, administrative and support services 3,010.2 2,999.7 3,287.1 3,373.6 3,447.2 3,722.2 4,034.6 4,156.9 4,406.4 4,496.8 4,600.2
OPQ Public administration, education, human health and social work 5,772.8 5,592.5 5,460.5 5,400.5 5,593.2 5,927.7 6,181.0 6,510.2 6,945.9 7,032.7 7,110.1
RST Other service activities 863.3 865.8 847.1 842.5 893.0 915.6 949.1 997.6 1,044.6 1,061.8 1,078.8
1. TOTAL VALUE ADDED 31,529.3 31,255.6 32,594.5 33,233.0 34,652.2 36,756.2 38,864.4 40,792.2 42,524.1 43,483.5 44,491.3
2. CORRECTIONS 4,551.1 4,624.6 4,868.9 5,233.0 5,413.3 5,561.5 5,892.9 6,080.4 6,203.6 6,298.2 6,392.4
3. GROSS DOMESTIC PRODUCT (3=1+2) 36,080.4 35,880.1 37,463.4 38,466.0 40,065.5 42,317.6 44,757.4 46,872.6 48,727.7 49,781.7 50,883.7
Source of data: SURS, forecasts by IMAD.

Statistical appendix 35Spring forecast of economic trends 2020
Table 3b: Gross value added by activity at basic prices and gross domestic product Real growth rates in %
2012 2013 2014 2015 2016 2017 2018 20192020 2021 2022
forecast
A Agriculture, forestry and fishing -7.3 -1.0 2.0 13.1 0.6 -2.6 12.5 -4.7 4.0 1.0 1.0
BCDE Mining and quarrying, manufacturing, electricity and water supply, waste management
-2.3 -0.4 4.0 1.8 4.7 7.7 3.6 2.9 1.3 2.5 2.5
of which: C Manufacturing -2.9 -0.7 4.5 2.8 5.1 8.5 3.6 3.8 1.4 2.7 2.7
F Construction -7.8 -9.2 9.8 -3.2 -3.4 8.3 8.0 4.1 2.3 4.0 5.0
GHI Trade, transportation and storage, accommodation and food service activities
-4.8 0.3 3.5 5.6 5.5 6.3 6.0 3.4 1.1 2.3 2.4
J Information and communication 0.2 1.4 4.7 2.0 -0.7 4.4 4.3 2.3 3.5 4.5 5.0
K Financial and insurance activities -3.9 -2.8 -1.4 -3.3 3.2 -0.5 -0.8 2.9 2.8 2.8 2.5
L Real estate activities 0.3 0.4 1.3 0.2 0.4 1.1 0.6 1.0 1.0 1.0 1.0
MN Professional, scientific, technical, administrative and support services -1.1 0.5 9.2 4.7 3.0 7.6 6.2 1.7 1.5 2.0 2.3
OPQ Public administration, education, human health and social work 1.3 -0.7 0.3 0.2 2.3 2.1 1.6 1.7 1.4 1.2 1.1
RST Other service activities -3.1 0.3 -1.1 -0.8 5.4 1.4 1.5 2.5 1.2 1.6 1.6
1. TOTAL VALUE ADDED -2.3 -0.7 3.4 2.2 3.2 5.2 4.1 2.4 1.5 2.3 2.3
2. CORRECTIONS -5.0 -3.2 -1.5 2.6 2.9 2.7 4.5 2.8 1.3 1.5 1.5
3. GROSS DOMESTIC PRODUCT (3=1+2) -2.6 -1.0 2.8 2.2 3.1 4.8 4.1 2.4 1.5 2.2 2.2
Source of data: SURS, forecasts by IMAD.
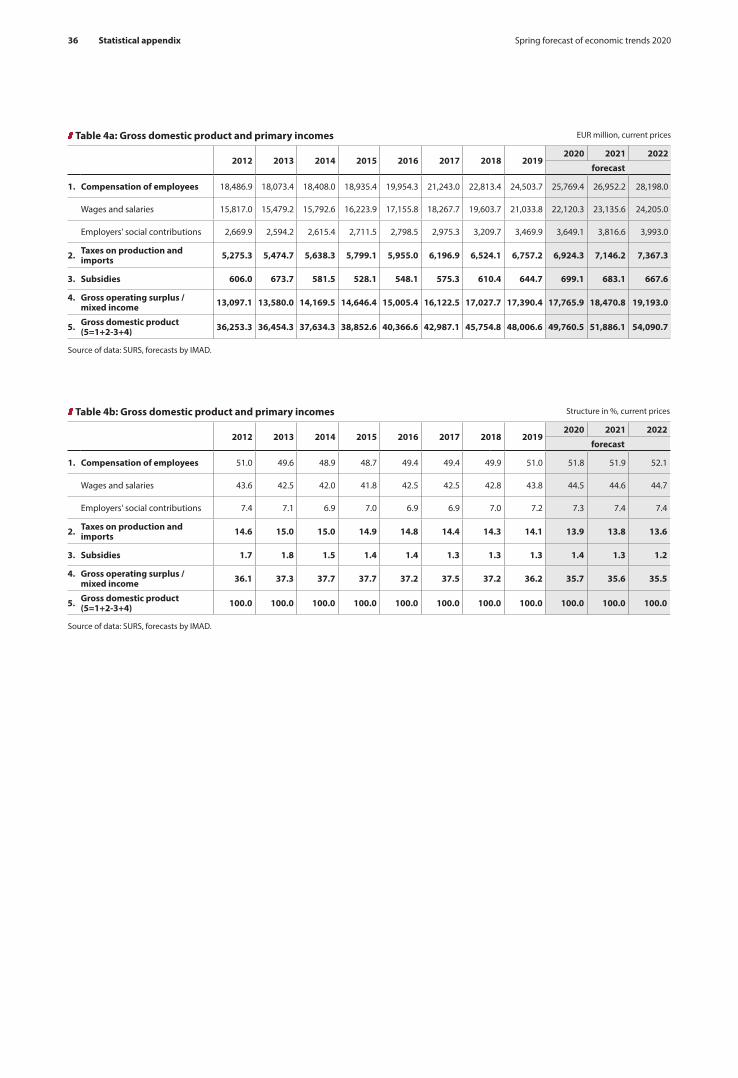
Statistical appendix36 Spring forecast of economic trends 2020
Table 4a: Gross domestic product and primary incomes EUR million, current prices
2012 2013 2014 2015 2016 2017 2018 20192020 2021 2022
forecast
1. Compensation of employees 18,486.9 18,073.4 18,408.0 18,935.4 19,954.3 21,243.0 22,813.4 24,503.7 25,769.4 26,952.2 28,198.0
Wages and salaries 15,817.0 15,479.2 15,792.6 16,223.9 17,155.8 18,267.7 19,603.7 21,033.8 22,120.3 23,135.6 24,205.0
Employers' social contributions 2,669.9 2,594.2 2,615.4 2,711.5 2,798.5 2,975.3 3,209.7 3,469.9 3,649.1 3,816.6 3,993.0
2. Taxes on production and imports 5,275.3 5,474.7 5,638.3 5,799.1 5,955.0 6,196.9 6,524.1 6,757.2 6,924.3 7,146.2 7,367.3
3. Subsidies 606.0 673.7 581.5 528.1 548.1 575.3 610.4 644.7 699.1 683.1 667.6
4. Gross operating surplus / mixed income 13,097.1 13,580.0 14,169.5 14,646.4 15,005.4 16,122.5 17,027.7 17,390.4 17,765.9 18,470.8 19,193.0
5. Gross domestic product (5=1+2-3+4) 36,253.3 36,454.3 37,634.3 38,852.6 40,366.6 42,987.1 45,754.8 48,006.6 49,760.5 51,886.1 54,090.7
Source of data: SURS, forecasts by IMAD.
Table 4b: Gross domestic product and primary incomes Structure in %, current prices
2012 2013 2014 2015 2016 2017 2018 20192020 2021 2022
forecast
1. Compensation of employees 51.0 49.6 48.9 48.7 49.4 49.4 49.9 51.0 51.8 51.9 52.1
Wages and salaries 43.6 42.5 42.0 41.8 42.5 42.5 42.8 43.8 44.5 44.6 44.7
Employers' social contributions 7.4 7.1 6.9 7.0 6.9 6.9 7.0 7.2 7.3 7.4 7.4
2. Taxes on production and imports 14.6 15.0 15.0 14.9 14.8 14.4 14.3 14.1 13.9 13.8 13.6
3. Subsidies 1.7 1.8 1.5 1.4 1.4 1.3 1.3 1.3 1.4 1.3 1.2
4. Gross operating surplus / mixed income 36.1 37.3 37.7 37.7 37.2 37.5 37.2 36.2 35.7 35.6 35.5
5. Gross domestic product (5=1+2-3+4) 100.0 100.0 100.0 100.0 100.0 100.0 100.0 100.0 100.0 100.0 100.0
Source of data: SURS, forecasts by IMAD.

Statistical appendix 37Spring forecast of economic trends 2020
Table 5a: Gross domestic product by expenditures EUR million, current prices
2012 2013 2014 2015 2016 2017 2018 20192020 2021 2022
forecast
1 GROSS DOMESTIC PRODUCT (1=4+5) 36,253.3 36,454.3 37,634.3 38,852.6 40,366.6 42,987.1 45,754.8 48,006.6 49,760.5 51,886.1 54,090.7
2 EXPORTS OF GOODS AND SERVICES 26,425.6 27,055.1 28,659.2 29,974.3 31,474.4 35,664.2 38,785.4 40,535.3 41,739.8 43,953.2 46,300.7
3 IMPORTS OF GOODS AND SERVICES 25,193.4 25,350.3 26,117.4 26,865.5 28,024.2 31,795.8 34,792.5 36,148.6 37,111.7 39,204.9 41,612.4
4 EXTERNAL BALANCE OF GOODS AND SERVICES (4=2-3) 1,232.2 1,704.8 2,541.7 3,108.8 3,450.2 3,868.4 3,992.9 4,386.7 4,628.0 4,748.3 4,688.3
5 TOTAL DOMESTIC CONSUMPTION (5=6+9) 35,021.1 34,749.5 35,092.6 35,743.8 36,916.3 39,118.7 41,761.9 43,619.9 45,132.5 47,137.8 49,402.4
6 FINAL CONSUMPTION (6=7+8) 28,220.3 27,609.3 27,801.3 28,298.3 29,472.8 30,499.4 32,139.6 33,669.3 35,079.7 36,503.5 37,943.1
7 PRIVATE CONSUMPTION 20,840.7 20,449.4 20,692.9 20,985.0 21,759.9 22,576.7 23,745.8 24,823.1 25,813.1 26,804.5 27,806.7
- Households 20,503.2 20,107.0 20,339.1 20,640.2 21,416.4 22,219.1 23,365.9 24,419.2 25,393.3 26,367.3 27,351.8
- NPISH's 337.5 342.4 353.8 344.8 343.5 357.6 379.9 403.9 419.8 437.2 454.9
8 GOVERNMENT CONSUMPTION 7,379.5 7,159.9 7,108.4 7,313.3 7,712.9 7,922.6 8,393.8 8,846.2 9,266.6 9,699.0 10,136.4
9 GROSS CAPITAL FORMATION (9=10+11) 6,800.8 7,140.2 7,291.3 7,445.6 7,443.6 8,619.3 9,622.3 9,950.6 10,052.8 10,634.3 11,459.3
10 GROSS FIXED CAPITAL FORMATION 6,899.6 7,157.3 7,191.0 7,247.8 7,019.4 7,874.7 8,771.0 9,266.7 9,362.1 9,950.8 10,779.9
11 CHANGES IN INVENTORIES AND VALUABLES -98.8 -17.1 100.3 197.8 424.2 744.7 851.4 683.9 690.6 683.4 679.4
Source of data: SURS, forecasts by IMAD.
Table 5b: Gross domestic product by expenditures Structure in %, current prices
2012 2013 2014 2015 2016 2017 2018 20192020 2021 2022
forecast
1 GROSS DOMESTIC PRODUCT (1=4+5) 100.0 100.0 100.0 100.0 100.0 100.0 100.0 100.0 100.0 100.0 100.0
2 EXPORTS OF GOODS AND SERVICES 72.9 74.2 76.2 77.1 78.0 83.0 84.8 84.4 83.9 84.7 85.6
3 IMPORTS OF GOODS AND SERVICES 69.5 69.5 69.4 69.1 69.4 74.0 76.0 75.3 74.6 75.6 76.9
4 EXTERNAL BALANCE OF GOODS AND SERVICES (4=2-3) 3.4 4.7 6.8 8.0 8.5 9.0 8.7 9.1 9.3 9.2 8.7
5 TOTAL DOMESTIC CONSUMPTION (5=6+9) 96.6 95.3 93.2 92.0 91.5 91.0 91.3 90.9 90.7 90.8 91.3
6 FINAL CONSUMPTION (6=7+8) 77.8 75.7 73.9 72.8 73.0 71.0 70.2 70.1 70.5 70.4 70.1
7 PRIVATE CONSUMPTION 57.5 56.1 55.0 54.0 53.9 52.5 51.9 51.7 51.9 51.7 51.4
- Households 56.6 55.2 54.0 53.1 53.1 51.7 51.1 50.9 51.0 50.8 50.6
- NPISH's 0.9 0.9 0.9 0.9 0.9 0.8 0.8 0.8 0.8 0.8 0.8
8 GOVERNMENT CONSUMPTION 20.4 19.6 18.9 18.8 19.1 18.4 18.3 18.4 18.6 18.7 18.7
9 GROSS CAPITAL FORMATION (9=10+11) 18.8 19.6 19.4 19.2 18.4 20.1 21.0 20.7 20.2 20.5 21.2
10 GROSS FIXED CAPITAL FORMATION 19.0 19.6 19.1 18.7 17.4 18.3 19.2 19.3 18.8 19.2 19.9
11 CHANGES IN INVENTORIES AND VALUABLES -0.3 0.0 0.3 0.5 1.1 1.7 1.9 1.4 1.4 1.3 1.3
Source of data: SURS, forecasts by IMAD.

Statistical appendix38 Spring forecast of economic trends 2020
Table 6a: Gross domestic product by expenditures EUR million
constant previous year prices constant 2019 prices
2012 2013 2014 2015 2016 2017 2018 20192020 2021 2022
forecast
1 GROSS DOMESTIC PRODUCT (1=4+5) 36,080.4 35,880.1 37,463.4 38,466.0 40,065.5 42,317.6 44,757.4 46,872.6 48,727.7 49,781.7 50,883.7
2 EXPORTS OF GOODS AND SERVICES 26,161.7 27,234.8 28,681.3 30,018.0 31,914.7 34,792.1 37,843.9 40,490.6 41,511.8 43,235.2 44,994.7
3 IMPORTS OF GOODS AND SERVICES 24,677.4 25,725.4 26,404.1 27,245.3 28,652.1 30,864.3 33,893.4 36,258.6 36,970.5 38,548.6 40,323.4
4 EXTERNAL BALANCE OF GOODS AND SERVICES (4=2-3) 1,484.3 1,509.4 2,277.2 2,772.6 3,262.5 3,927.8 3,950.5 4,232.0 4,541.4 4,686.6 4,671.3
5 TOTAL DOMESTIC CONSUMPTION (5=6+9) 34,596.2 34,370.7 35,186.3 35,693.4 36,803.0 38,389.8 40,806.9 42,640.6 44,186.3 45,095.1 46,212.4
6 FINAL CONSUMPTION (6=7+8) 27,931.8 27,255.5 27,923.8 28,387.8 29,392.6 29,919.1 31,385.2 32,901.4 34,323.9 34,872.7 35,421.3
7 PRIVATE CONSUMPTION 20,490.6 20,020.4 20,781.5 21,112.7 21,899.6 22,184.6 23,209.1 24,376.3 25,331.8 25,763.6 26,202.9
- Households 20,153.6 19,677.9 20,427.7 20,769.2 21,558.7 21,834.0 22,837.0 23,982.8 24,919.8 25,343.4 25,774.3
- NPISH's 337.0 342.5 353.8 343.5 340.9 350.6 372.1 393.5 412.0 420.2 428.6
8 GOVERNMENT CONSUMPTION 7,441.2 7,235.1 7,142.3 7,275.1 7,493.1 7,734.4 8,176.1 8,525.2 8,992.2 9,109.1 9,218.4
9 GROSS CAPITAL FORMATION (9=10+11) 6,664.3 7,115.3 7,262.4 7,305.6 7,410.3 8,470.7 9,421.7 9,739.2 9,862.4 10,222.4 10,791.1
10 GROSS FIXED CAPITAL FORMATION 6,759.2 7,136.3 7,152.8 7,103.8 6,980.2 7,747.0 8,589.0 9,054.4 9,178.6 9,545.7 10,118.5
11 CHANGES IN INVENTORIES AND VALUABLES -94.9 -21.0 109.6 201.8 430.1 723.7 832.7 684.8 683.8 676.7 672.7
Source of data: SURS, forecasts by IMAD.
Table 6b: Gross domestic product by expenditures Real growth rates in %
2012 2013 2014 2015 2016 2017 2018 20192020 2021 2022
forecast
1 GROSS DOMESTIC PRODUCT (1=4+5) -2.6 -1.0 2.8 2.2 3.1 4.8 4.1 2.4 1.5 2.2 2.2
2 EXPORTS OF GOODS AND SERVICES 0.5 3.1 6.0 4.7 6.5 10.5 6.1 4.4 2.4 4.2 4.1
3 IMPORTS OF GOODS AND SERVICES -3.5 2.1 4.2 4.3 6.7 10.1 6.6 4.2 2.3 4.3 4.6
4 EXTERNAL BALANCE OF GOODS AND SERVICES1 2.8 0.8 1.6 0.6 0.4 1.2 0.2 0.5 0.3 0.3 0.0
5 TOTAL DOMESTIC CONSUMPTION (5=6+9) -5.5 -1.9 1.3 1.7 3.0 4.0 4.3 2.1 1.3 2.1 2.5
6 FINAL CONSUMPTION (6=7+8) -2.2 -3.4 1.1 2.1 3.9 1.5 2.9 2.4 1.9 1.6 1.6
7 PRIVATE CONSUMPTION -2.2 -3.9 1.6 2.0 4.4 2.0 2.8 2.7 2.0 1.7 1.7
- Households -2.1 -4.0 1.6 2.1 4.5 1.9 2.8 2.6 2.0 1.7 1.7
- NPISH's -6.9 1.5 3.3 -2.9 -1.1 2.1 4.1 3.6 2.0 2.0 2.0
8 GOVERNMENT CONSUMPTION -2.4 -2.0 -0.2 2.3 2.5 0.3 3.2 1.6 1.6 1.3 1.2
9 GROSS CAPITAL FORMATION (9=10+11) -17.1 4.6 1.7 0.2 -0.5 13.8 9.3 1.2 -0.9 3.7 5.6
10 GROSS FIXED CAPITAL FORMATION -8.5 3.4 -0.1 -1.2 -3.7 10.4 9.1 3.2 -1.0 4.0 6.0
11 CHANGES IN INVENTORIES AND VALUABLES1 -2.0 0.2 0.3 0.3 0.6 0.7 0.2 -0.4 0.0 0.0 0.0
Source of data: SURS, forecasts by IMAD.Note: 1 Contribution to real GDP growth (percentage points).

Statistical appendix 39Spring forecast of economic trends 2020
Table 7: Balance of payments - balance of payments statistics EUR million
2012 2013 2014 2015 2016 2017 2018 20192020 2021 2022
forecast
I. CURRENT ACCOUNT 479 1,204 1,924 1,482 1,942 2,635 2,593 3,159 3,372 3,521 3,396
1. GOODS -81 708 1,181 1,476 1,536 1,579 1,128 1,333 1,526 1,440 1,192
1.1. Exports of goods 21,256 21,692 22,961 24,039 24,991 28,478 31,133 32,002 32,948 34,576 36,355
1.2. Imports of goods 21,337 20,984 21,780 22,563 23,454 26,899 30,005 30,669 31,422 33,136 35,163
2. SERVICES 1,220 1,422 1,454 1,634 1,925 2,241 2,678 3,016 3,063 3,268 3,453
2.1. Exports 5,151 5,368 5,699 5,940 6,501 7,288 7,963 8,526 8,784 9,370 9,938
- Transport 1,346 1,398 1,529 1,654 1,839 2,076 2,335 2,428 2,415 2,537 2,686
- Travel 2,053 2,094 2,140 2,162 2,271 2,523 2,704 2,754 2,711 2,862 2,986
- Other 1,752 1,877 2,030 2,124 2,391 2,689 2,924 3,344 3,657 3,971 4,266
2.2. Imports 3,932 3,946 4,245 4,306 4,575 5,047 5,285 5,510 5,721 6,103 6,485
- Transport 713 738 814 846 917 1,005 1,007 1,070 1,074 1,133 1,199
- Travel 1,065 1,068 1,119 1,109 1,176 1,322 1,389 1,383 1,374 1,463 1,541
- Other 2,153 2,140 2,311 2,351 2,482 2,720 2,889 3,057 3,273 3,507 3,745
1., 2. EXTERNAL BALANCE OF GOODS AND SERVICES 1,138 2,130 2,636 3,110 3,462 3,820 3,807 4,349 4,589 4,708 4,646
Exports of goods and services 26,407 27,060 28,660 29,979 31,491 35,766 39,097 40,528 41,732 43,946 46,294
Imports of goods and services 25,269 24,930 26,025 26,869 28,029 31,946 35,290 36,179 37,143 39,238 41,648
3. PRIMARY INCOME -585 -562 -437 -1,255 -1,139 -886 -807 -685 -650 -587 -595
3.1. Receipts 681 590 888 1,070 1,259 1,374 1,592 1,575 1,544 1,519 1,502
- Compensation of employees 166 205 238 302 355 378 454 450 465 475 480
- Investment 207 54 368 511 637 703 792 744 723 693 696
- Other primary income 309 331 282 258 267 293 345 382 356 351 326
3.2. Expenditure 1,266 1,152 1,325 2,326 2,398 2,260 2,399 2,261 2,194 2,105 2,097
- Compensation of employees 99 105 118 126 132 149 173 197 195 202 213
- Investment 1,097 917 1,063 2,057 2,081 1,929 2,022 1,853 1,792 1,685 1,650
- Other primary income 70 130 144 143 184 182 204 211 207 219 234
4. SECONDARY INCOME -74 -364 -274 -372 -381 -299 -406 -505 -567 -600 -655
4.1. Receipts 930 629 706 730 713 828 789 795 793 802 798
4.2. Expenditure 1,004 994 980 1,103 1,094 1,127 1,196 1,300 1,360 1,402 1,453
II. CAPITAL ACCOUNT 41 162 79 412 -303 -324 -225 -164
1. Non-produced non-financial assets -4 -10 -24 -37 -45 -76 -47 -6
2. Capital transfers 45 172 102 449 -258 -248 -178 -158
III. FINANCIAL ACCOUNT 21 1,619 2,273 1,774 1,187 2,088 2,527 2,263
1. Direct investment -466 -47 -584 -1,269 -864 -495 -933 -690
- Assets -439 24 155 292 434 570 362 540
- Liabilities 27 71 739 1,560 1,298 1,065 1,295 1,231
2. Portfolio investment 250 -4,097 -3,954 3,035 5,023 2,987 750 844
3 Financial derivatives 89 27 -51 -98 -270 -185 -86 -178
4. Other investment 178 5,731 6,773 219 -2,606 -308 2,743 2,251
4.1. Assets 557 912 4,801 -653 -2,221 -1,381 2,031 3,440
4.2. Liabilities 379 -4,819 -1,972 -872 385 -1,073 -713 1,190
5. Reserve assets -31 5 89 -113 -97 89 52 37
IV. NET ERRORS AND OMISSIONS -499 254 270 -120 -452 -223 158 -732
Source of data: BS, forecasts by IMAD.Note: The Slovenian Balance of Payments and International Investment Position conforms to the methodology of the the IMF’s 'Balance of Payments and International Investment Position Manual'.

Statistical appendix40 Spring forecast of economic trends 2020
Table 8: Labour market
2012 2013 2014 2015 2016 2017 2018 20192020 2021 2022
forecast
LABOUR SUPPLY
Activity rate (20-64 years, in %) 74.9 74.9 75.1 76.0 76.2 78.6 79.5 79.0 79.6 80.2 80.7
Active population (ILO definition - in thousands) 1,013 1,008 1,015 1,008 995 1,027 1,033 1,029 1,037 1,043 1,046
- yearly growth (in %) -0.6 -0.6 0.7 -0.7 -1.3 3.2 0.7 -0.5 0.8 0.6 0.3
EMPLOYMENT AND UNEMPLOYMENT
Employment (National accounts concept, in thousands) 938.3 927.7 931.7 943.9 960.7 989.4 1,020.7 1,045.0 1,057.0 1,064.3 1,069.3
- yearly growth (in %) -0.9 -1.1 0.4 1.3 1.8 3.0 3.2 2.4 1.1 0.7 0.5
Employment (ILO concept, in thousands) 923.7 906.0 917.0 917.6 915.1 959.0 980.5 982.8 993.6 1,001.5 1,006.5
- yearly growth (in %) -1.3 -1.9 1.2 0.1 -0.3 4.8 2.2 0.2 1.1 0.8 0.5
Employment rate (20-64 yeras, in %) 68.3 67.2 67.8 69.1 70.1 73.4 75.4 75.5 76.3 77.0 77.6
Formal employment (statistical register, in thousands) * 810.0 793.6 797.8 804.6 817.2 845.5 872.8 894.2 904.6 911.5 916.5
- yearly growth (in %) -1.7 -2.0 0.5 0.9 1.6 3.5 3.2 2.5 1.2 0.8 0.5
Paid employment (in thousands) 717.0 698.7 703.0 713.1 730.5 755.3 780.2 801.9 811.6 818.6 823.5
- yearly growth (in %) -1.6 -2.6 0.6 1.4 2.4 3.4 3.3 2.8 1.2 0.9 0.6
Self employed (in thousands) 93.0 94.9 94.8 91.6 86.7 90.2 92.6 92.3 93.0 93.0 93.0
- yearly growth (in %) -2.1 2.1 -0.1 -3.4 -5.3 4.0 2.7 -0.3 0.7 0.0 0.0
Unemployment (ILO concept, in thousands) 89.7 101.8 98.0 90.5 79.7 67.5 52.8 45.8 43.1 41.4 39.9
- yearly growth (in %) 7.7 13.5 -3.7 -7.7 -11.9 -15.3 -21.8 -13.3 -6.0 -4.0 -3.5
Unemployment (registered, in thousands) 110.2 119.8 120.1 112.7 103.2 88.6 78.5 74.2 72.0 69.8 67.4
- yearly growth (in %) -0.5 8.8 0.2 -6.1 -8.5 -14.1 -11.5 -5.5 -3.0 -3.0 -3.5
Unemployment rate (ILO concept, in %) 8.9 10.1 9.7 9.0 8.0 6.6 5.1 4.5 4.2 4.0 3.8
Unemployment rate (registered, in %) 12.0 13.1 13.1 12.3 11.2 9.5 8.2 7.7 7.4 7.1 6.8
Sources of data: SURS, ESS, Eurostat, forecasts by IMAD and Eurostat.Note: The figures for 2019 are IMAD’s estimate, as at the time of the preparation of the forecast detailed data (for age groups) were not yet available. The annual figure is a quarterly average.* According to the Statistical Register of Employment, including the estimate of self employed farmers.

Statistical appendix 41Spring forecast of economic trends 2020
Table 9: Indicators of international competitiveness annual growth rates in %
2012 2013 2014 2015 2016 2017 2018 20192020 2021 2022
forecast
Effective exchange rate1
Nominal -1.4 0.9 0.2 -3.1 1.0 0.5 0.7 -0.3 -0.4 0.0 0.0
Real - based on consumer prices -1.2 1.2 -0.2 -4.2 0.3 0.4 0.8 -0.2 0.1 0.6 0.2
Real - based on ULC in economy as a whole -3.0 0.0 -1.6 -3.6 1.0 0.0 0.5 1.2 1.2 0.1 0.3
Unit labour costs components
Nominal unit labour costs 0.7 0.4 -1.1 0.6 1.8 1.2 3.0 4.5 3.4 2.3 2.2
Compensation of employees per employee -1.0 0.5 1.2 1.5 3.1 3.0 3.9 4.5 3.8 3.7 4.0
Labour productivity, real 2 -1.7 0.1 2.3 0.9 1.3 1.8 0.9 0.1 0.4 1.5 1.7
Real unit labour costs 0.3 -1.2 -1.5 -0.4 1.0 -0.4 0.7 2.0 1.3 0.2 0.2
Labour productivity, nominal 3 -1.2 1.7 2.8 1.9 2.1 3.4 3.2 2.5 2.5 3.6 3.8
Sources of data: SURS national accounts statistics, ECB, OECD, Consensus Forecasts, European Comision, calculations and forecasts by IMAD.Notes: 1 Harmonised effective exchange rate - 37 group of trading partners; 19 extra Euro area and 18 Euro area countries; a rise in the value indicates appreciation and of national currency and vice versa. 2 GDP per employee (in constant prices); 3 GDP per employee (in current prices).

Statistical appendix42 Spring forecast of economic trends 2020
Table 10a: Consolidated general government revenues; GFS - IMF Methodology EUR million, current prices
CONSOLIDATED GENERAL GOVERNMENT REVENUES 2012 2013 2014 2015 2016 2017 2018 2019
I. T O T A L G E N E R A L G O V E R N M E N T R E V E N U E S 14,999 14,728 15,494 15,714 15,842 16,803 18,594 19,231
TAX REVENUES 13,118 12,648 13,193 13,746 14,240 15,162 16,225 17,178
TAXES ON INCOME AND PROFIT 2,657 2,137 2,386 2,585 2,681 2,967 3,296 3,614
Personal income tax 2,077 1,868 1,916 1,986 2,079 2,197 2,447 2,592
Corporate income tax 577 265 468 595 599 766 846 997
SOCIAL SECURITY CONTRIBUTIONS 5,244 5,127 5,272 5,474 5,721 6,092 6,550 7,020
TAXSES ON PAYROLL AND WORKFORCE 26 23 20 20 20 21 22 23
TAXES ON PROPERTY 234 254 245 238 256 274 278 296
DOMESTIC TAXES ON GOODS AND SERVICES 4,876 5,027 5,191 5,347 5,433 5,723 5,989 6,127
Value added tax 2,905 3,029 3,153 3,229 3,272 3,504 3,757 3,872
Excise duties 1,560 1,491 1,491 1,515 1,551 1,585 1,560 1,543
TAXES ON INTERN. TRADE AND TRANSACTIONS 83 77 78 82 82 83 90 99
OTHER TAXES -1 1 0 1 48 1 0 -1
NON-TAX REVENUES 912 989 1,184 956 963 1,089 1,351 1,114
CAPITAL REVENUES 63 67 53 96 96 91 153 136
DONATIONS RECEIVED 9 33 19 12 10 9 12 15
TRANSFERED REVENUES 52 53 5 21 51 52 56 57
RECEIPTS FROM THE EU BUDGET 845 938 1,040 882 481 399 797 731
Source of data: MF, Ministry of Finance Bulletin and Government Finance Accounts of the Republic of Slovenia, SURS.
Table 10b: Consolidated general government revenues; GFS - IMF Methodology per cent share relative to GDP
CONSOLIDATED GENERAL GOVERNMENT REVENUES 2012 2013 2014 2015 2016 2017 2018 2019
I. T O T A L G E N E R A L G O V E R N M E N T R E V E N U E S 41.4 40.4 41.2 40.4 39.2 39.1 40.6 40.1
TAX REVENUES 36.2 34.7 35.1 35.4 35.3 35.3 35.5 35.8
TAXES ON INCOME AND PROFIT 7.3 5.9 6.3 6.7 6.6 6.9 7.2 7.5
Personal income tax 5.7 5.1 5.1 5.1 5.1 5.1 5.3 5.4
Corporate income tax 1.6 0.7 1.2 1.5 1.5 1.8 1.8 2.1
SOCIAL SECURITY CONTRIBUTIONS 14.5 14.1 14.0 14.1 14.2 14.2 14.3 14.6
TAXSES ON PAYROLL AND WORKFORCE 0.1 0.1 0.1 0.1 0.0 0.0 0.0 0.0
TAXES ON PROPERTY 0.6 0.7 0.7 0.6 0.6 0.6 0.6 0.6
DOMESTIC TAXES ON GOODS AND SERVICES 13.5 13.8 13.8 13.8 13.5 13.3 13.1 12.8
Value added tax 8.0 8.3 8.4 8.3 8.1 8.2 8.2 8.1
Excise duties 4.3 4.1 4.0 3.9 3.8 3.7 3.4 3.2
TAXES ON INTERN. TRADE AND TRANSACTIONS 0.2 0.2 0.2 0.2 0.2 0.2 0.2 0.2
OTHER TAXES 0.0 0.0 0.0 0.0 0.1 0.0 0.0 0.0
NON-TAX REVENUES 2.5 2.7 3.1 2.5 2.4 2.5 3.0 2.3
CAPITAL REVENUES 0.2 0.2 0.1 0.2 0.2 0.2 0.3 0.3
DONATIONS RECEIVED 0.0 0.1 0.1 0.0 0.0 0.0 0.0 0.0
TRANSFERED REVENUES 0.1 0.1 0.0 0.1 0.1 0.1 0.1 0.1
RECEIPTS FROM THE EU BUDGET 2.3 2.6 2.8 2.3 1.2 0.9 1.7 1.5
Source of data: MF, Ministry of Finance Bulletin and Government Finance Accounts of the Republic of Slovenia, SURS.

Statistical appendix 43Spring forecast of economic trends 2020
Table 11a: Consolidated general government expenditure; GFS - IMF Methodology EUR million, current prices
CONSOLIDATED GENERAL GOVERNMENT EXPENDITURE 2012 2013 2014 2015 2016 2017 2018 2019
II. T O T A L E X P E N D I T U R E S 16,126 16,286 16,755 16,956 16,497 17,102 18,067 18,967
CURRENT EXPENDITURE 6,814 6,838 7,043 7,168 7,407 7,733 7,966 8,227
WAGES AND OTHER PERSONNEL EXPENDITURE 3,185 3,114 3,116 3,124 3,278 3,406 3,583 3,832
EMPLOYER'S SOCIAL SECURITY CONTRIBUTIONS 543 503 494 486 508 533 585 633
PURCHASES OF GOODS AND SERVICES 2,373 2,239 2,233 2,311 2,371 2,627 2,634 2,733
INTEREST PAYMENTS 648 840 1,097 1,043 1,074 985 868 791
RESERVES 65 143 103 204 176 183 297 238
CURRENT TRANSFERS 7,687 7,671 7,592 7,540 7,700 7,913 8,237 8,703
SUBSIDIES 503 520 467 399 397 425 444 468
TRANSFERS TO INDIVIDUALS AND HOUSEHOLDS 6,384 6,343 6,335 6,371 6,496 6,665 6,926 7,323
OTHER CURRENT TRANSFERS 800 809 789 770 807 822 867 912
CAPITAL EXPENDITURE AND TRANSFERS - TOTAL 1,235 1,351 1,717 1,815 962 1,078 1,432 1,527
CAPITAL EXPENDITURE 915 1,032 1,451 1,520 784 891 1,160 1,253
CAPITAL TRANSFERS 320 319 266 295 178 187 272 274
PAYMENTS TO THE EU BUDGET 390 425 403 433 427 378 433 510
III. GENERAL GOVERNMENT SURPLUS / DEFICIT (I. - II.) -1,127 -1,558 -1,261 -1,242 -654 -299 526 264
Source of data: MF, Ministry of Finance Bulletin and Government Finance Accounts of the Republic of Slovenia, SURS.
Table 11b: Consolidated general government expenditure; GFS - IMF Methodology Per cent share relative to GDP
CONSOLIDATED GENERAL GOVERNMENT EXPENDITURE 2012 2013 2014 2015 2016 2017 2018 2019
II. T O T A L E X P E N D I T U R E S 44.5 44.7 44.5 43.6 40.9 39.8 39.5 39.5
CURRENT EXPENDITURE 18.8 18.8 18.7 18.5 18.3 18.0 17.4 17.1
WAGES AND OTHER PERSONNEL EXPENDITURE 8.8 8.5 8.3 8.0 8.1 7.9 7.8 8.0
EMPLOYER'S SOCIAL SECURITY CONTRIBUTIONS 1.5 1.4 1.3 1.3 1.3 1.2 1.3 1.3
PURCHASES OF GOODS AND SERVICES 6.5 6.1 5.9 5.9 5.9 6.1 5.8 5.7
INTEREST PAYMENTS 1.8 2.3 2.9 2.7 2.7 2.3 1.9 1.6
RESERVES 0.2 0.4 0.3 0.5 0.4 0.4 0.7 0.5
CURRENT TRANSFERS 21.2 21.0 20.2 19.4 19.1 18.4 18.0 18.1
SUBSIDIES 1.4 1.4 1.2 1.0 1.0 1.0 1.0 1.0
TRANSFERS TO INDIVIDUALS AND HOUSEHOLDS 17.6 17.4 16.8 16.4 16.1 15.5 15.1 15.3
OTHER CURRENT TRANSFERS 2.2 2.2 2.1 2.0 2.0 1.9 1.9 1.9
CAPITAL EXPENDITURE AND TRANSFERS - TOTAL 3.4 3.7 4.6 4.7 2.4 2.5 3.1 3.2
CAPITAL EXPENDITURE 2.5 2.8 3.9 3.9 1.9 2.1 2.5 2.6
CAPITAL TRANSFERS 0.9 0.9 0.7 0.8 0.4 0.4 0.6 0.6
PAYMENTS TO THE EU BUDGET 1.1 1.2 1.1 1.1 1.1 0.9 0.9 1.1
III. GENERAL GOVERNMENT SURPLUS / DEFICIT (I. - II.) -3.1 -4.3 -3.4 -3.2 -1.6 -0.7 1.2 0.6
Source of data: MF, Ministry of Finance Bulletin and Government Finance Accounts of the Republic of Slovenia, SURS.

Statistical appendix44 Spring forecast of economic trends 2020
Table 12: Comparison of the performance of forecasts for economic growth and inflation of individual institutions
1.Mean Error, ME
Gross domestic product, real growth Inflation, annual average
SFt+1 AFt+1 SFt AFt SFt+1 AFt+1 SFt AFt
IMAD
2002-2012 1.73 1.49 0.48 0.22 -0.26 0.04 -0.39 0.13
2002-2013 1.78 1.34 0.38 0.09 -0.23 0.08 -0.33 0.14
2002-2014 1.45 0.98 0.18 0.04 -0.11 0.20 -0.30 0.13
2002-2015 1.19 0.81 0.14 0.02 0.02 0.27 -0.25 0.13
2002-2016 1.08 0.75 0.07 0.01 0.09 0.31 -0.25 0.13
2002-2017 0.85 0.57 -0.02 -0.03 0.07 0.29 -0.21 0.13
2002-2018 0.72 0.50 0.02 -0.04 0.06 0.26 -0.22 0.13
2002-2019 0.76 0.54 0.07 -0.01 0.07 0.27 -0.21 0.13
BoS
2002-2012 1.64 1.35 0.57 0.21 -0.39 -0.32 -0.28 0.06
2002-2013 1.64 1.27 0.46 0.07 -0.37 -0.27 -0.22 0.08
2002-2014 1.35 0.92 0.27 -0.02 -0.26 -0.14 -0.20 0.08
2002-2015 1.15 0.74 0.20 -0.04 -0.09 -0.03 -0.14 0.09
2002-2016 1.03 0.65 0.15 -0.05 0.00 0.05 -0.13 0.08
2002-2017 0.81 0.45 0.04 -0.07 -0.01 0.04 -0.11 0.07
2002-2018 0.68 0.41 0.05 -0.08 -0.03 0.00 -0.10 0.07
2002-2019 0.72 0.44 0.09 -0.07 0.00 0.03 -0.10 0.07
CCIS
2002-2012 1.66 1.29 0.50 0.15 -0.16 -0.11 -0.10 0.02
2002-2013 1.68 1.13 0.33 0.02 -0.14 -0.03 -0.05 0.03
2002-2014 1.35 0.75 0.13 -0.06 0.00 0.10 0.02 0.08
2002-2015 1.14 0.57 0.06 -0.09 0.15 0.24 0.06 0.08
2002-2016 1.01 0.49 0.03 -0.09 0.15 0.32 0.05 0.07
2002-2017 0.78 0.29 N/A N/A 0.13 0.29 N/A N/A
2002-2018 N/A N/A -0.01 -0.11 N/A N/A 0.06 0.08
2002-2019 0.78 0.29 0.02 -0.07 0.13 0.29 0.08 0.08
EC
2002-2012 1.48 1.25 0.44 0.05 -0.10 0.00 -0.14 0.09
2002-2013 1.51 1.11 0.33 -0.09 -0.11 0.03 -0.11 0.09
2002-2014 1.18 0.75 0.16 -0.10 -0.02 0.14 -0.07 0.09
2002-2015 0.99 0.61 0.11 -0.11 0.12 0.26 -0.01 0.09
2002-2016 0.90 0.53 0.05 -0.13 0.24 0.30 -0.01 0.10
2002-2017 0.68 0.34 -0.06 -0.14 0.22 0.28 -0.01 0.10
2002-2018 0.55 0.29 -0.05 -0.14 0.20 0.24 -0.01 0.10
2002-2019 0.59 0.33 -0.01 -0.12 0.21 0.26 -0.01 0.10
MDS
2002-2012 1.55 1.37 0.50 0.23 -0.20 -0.19 -0.38 -0.04
2002-2013 1.63 1.32 0.39 0.08 -0.18 -0.20 -0.35 0.01
2002-2014 1.42 0.91 0.18 -0.02 -0.04 -0.06 -0.24 0.03
2002-2015 1.18 0.74 0.11 -0.06 0.12 0.05 -0.22 0.04
2002-2016 1.06 0.64 0.06 -0.07 0.16 0.10 -0.19 0.02
2002-2017 0.81 0.40 -0.10 -0.13 0.12 0.07 -0.18 0.03
2002-2018 0.61 0.26 -0.12 -0.12 0.13 0.07 -0.17 0.05
2002-2019 0.62 0.30 -0.06 -0.08 0.15 0.08 -0.17 0.06
WIIW
2002-2012 1.48 1.25 0.44 0.05 -0.10 0.00 -0.14 0.09
2002-2013 1.51 1.11 0.33 -0.09 -0.11 0.03 -0.11 0.09
2002-2014 1.18 0.75 0.16 -0.10 -0.02 0.14 -0.07 0.09
2002-2015 0.99 0.61 0.11 -0.11 0.12 0.26 -0.01 0.09
2002-2016 0.90 0.53 0.05 -0.13 0.24 0.30 -0.01 0.10
2002-2017 0.68 0.34 -0.06 -0.14 0.22 0.28 -0.01 0.10
2002-2018 0.55 0.29 -0.05 -0.14 0.20 0.24 -0.01 0.10
2002-2019 0.59 0.33 -0.01 -0.12 0.21 0.26 -0.01 0.10

Statistical appendix 45Spring forecast of economic trends 2020
Table 12: Comparison of the performance of forecasts for economic growth and inflation of individual institutions
2.Mean Absolute Error, MAE
Gross domestic product, real growth Inflation, annual average
SFt+1 AFt+1 SFt AFt SFt+1 AFt+1 SFt AFt
IMAD
2002-2012 2.51 2.29 1.23 0.53 0.98 1.02 0.47 0.21
2002-2013 2.49 2.13 1.19 0.59 0.91 0.97 0.46 0.21
2002-2014 2.48 2.22 1.26 0.59 0.94 1.03 0.43 0.20
2002-2015 2.46 2.16 1.21 0.56 0.99 1.03 0.43 0.20
2002-2016 2.33 2.03 1.18 0.54 1.00 1.02 0.41 0.19
2002-2017 2.35 2.03 1.19 0.54 0.94 0.96 0.41 0.19
2002-2018 2.29 1.95 1.16 0.52 0.90 0.91 0.40 0.18
2002-2019 2.24 1.91 1.15 0.51 0.86 0.89 0.38 0.18
BoS
2002-2012 2.38 2.27 1.32 0.61 1.12 0.98 0.41 0.19
2002-2013 2.33 2.12 1.28 0.68 1.04 0.93 0.41 0.19
2002-2014 2.31 2.21 1.33 0.71 1.04 0.96 0.39 0.19
2002-2015 2.25 2.16 1.29 0.68 1.10 1.00 0.41 0.19
2002-2016 2.15 2.06 1.24 0.65 1.11 1.01 0.38 0.18
2002-2017 2.17 2.09 1.26 0.63 1.05 0.95 0.37 0.17
2002-2018 2.12 1.98 1.19 0.61 1.00 0.93 0.35 0.16
2002-2019 2.09 1.93 1.17 0.59 0.97 0.91 0.33 0.16
CCIS
2002-2012 2.41 2.13 1.30 0.61 1.04 1.00 0.40 0.13
2002-2013 2.36 2.00 1.32 0.68 0.96 0.98 0.41 0.13
2002-2014 2.37 2.15 1.39 0.71 1.02 1.04 0.45 0.17
2002-2015 2.32 2.11 1.35 0.69 1.09 1.11 0.46 0.16
2002-2016 2.21 2.02 1.29 0.65 1.03 1.13 0.43 0.15
2002-2017 2.25 2.06 N/A N/A 0.98 1.08 N/A N/A
2002-2018 N/A N/A 1.25 0.63 N/A N/A 0.41 0.16
2002-2019 2.25 2.06 1.21 0.62 0.98 1.08 0.41 0.16
EC
2002-2012 2.37 2.15 1.24 0.43 1.21 1.12 0.33 0.18
2002-2013 2.33 2.01 1.21 0.53 1.13 1.05 0.32 0.18
2002-2014 2.35 2.13 1.25 0.50 1.12 1.09 0.32 0.17
2002-2015 2.29 2.06 1.21 0.49 1.18 1.13 0.36 0.17
2002-2016 2.17 1.97 1.18 0.47 1.23 1.12 0.34 0.18
2002-2017 2.20 1.99 1.21 0.46 1.15 1.06 0.32 0.17
2002-2018 2.15 1.91 1.15 0.45 1.09 1.02 0.31 0.16
2002-2019 2.10 1.85 1.13 0.43 1.05 1.00 0.30 0.16
MDS
2002-2012 2.30 2.37 1.35 0.88 1.09 1.13 0.50 0.24
2002-2013 2.32 2.23 1.31 0.93 1.01 1.06 0.46 0.26
2002-2014 2.22 2.37 1.39 0.95 1.06 1.10 0.50 0.26
2002-2015 2.21 2.31 1.35 0.93 1.14 1.13 0.48 0.25
2002-2016 2.10 2.20 1.30 0.88 1.11 1.10 0.46 0.25
2002-2017 2.16 2.26 1.37 0.89 1.07 1.06 0.43 0.25
2002-2018 2.18 2.25 1.32 0.84 1.02 1.00 0.41 0.25
2002-2019 2.10 2.18 1.30 0.82 0.98 0.97 0.40 0.25
WIIW
2002-2012 2.37 2.15 1.24 0.43 1.21 1.12 0.33 0.18
2002-2013 2.33 2.01 1.21 0.53 1.13 1.05 0.32 0.18
2002-2014 2.35 2.13 1.25 0.50 1.12 1.09 0.32 0.17
2002-2015 2.29 2.06 1.21 0.49 1.18 1.13 0.36 0.17
2002-2016 2.17 1.97 1.18 0.47 1.23 1.12 0.34 0.18
2002-2017 2.20 1.99 1.21 0.46 1.15 1.06 0.32 0.17
2002-2018 2.15 1.91 1.15 0.45 1.09 1.02 0.31 0.16
2002-2019 2.10 1.85 1.13 0.43 1.05 1.00 0.30 0.16

Statistical appendix46 Spring forecast of economic trends 2020
Table 12: Comparison of the performance of forecasts for economic growth and inflation of individual institutions
3. Root Mean Square Error, RMSE
Gross domestic product, real growth Inflation, annual average
SFt+1 AFt+1 SFt AFt SFt+1 AFt+1 SFt AFt
IMAD
2002-2012 4.09 3.74 1.59 0.73 1.36 1.34 0.59 0.25
2002-2013 3.98 3.58 1.54 0.79 1.31 1.29 0.58 0.25
2002-2014 3.88 3.57 1.59 0.78 1.31 1.32 0.55 0.24
2002-2015 3.78 3.45 1.54 0.75 1.34 1.31 0.54 0.23
2002-2016 3.66 3.34 1.50 0.73 1.32 1.28 0.53 0.23
2002-2017 3.60 3.27 1.50 0.72 1.28 1.24 0.52 0.22
2002-2018 3.51 3.18 1.46 0.70 1.24 1.21 0.51 0.21
2002-2019 3.42 3.11 1.44 0.69 1.21 1.18 0.49 0.21
BoS
2002-2012 4.00 3.79 2.03 0.75 1.46 1.29 0.50 0.26
2002-2013 3.86 3.63 1.96 0.84 1.39 1.24 0.49 0.26
2002-2014 3.75 3.61 1.96 0.85 1.37 1.25 0.47 0.25
2002-2015 3.64 3.50 1.90 0.82 1.41 1.27 0.49 0.25
2002-2016 3.52 3.39 1.84 0.80 1.40 1.26 0.47 0.24
2002-2017 3.47 3.34 1.82 0.78 1.35 1.22 0.46 0.23
2002-2018 3.38 3.24 1.77 0.76 1.31 1.19 0.44 0.22
2002-2019 3.30 3.16 1.73 0.74 1.28 1.16 0.43 0.22
CCIS
2002-2012 4.05 3.67 1.89 0.72 1.45 1.27 0.52 0.14
2002-2013 3.91 3.51 1.86 0.81 1.39 1.24 0.52 0.14
2002-2014 3.82 3.55 1.90 0.83 1.42 1.28 0.56 0.24
2002-2015 3.71 3.45 1.84 0.81 1.48 1.35 0.56 0.23
2002-2016 3.59 3.34 1.79 0.78 1.43 1.36 0.54 0.22
2002-2017 3.55 3.30 N/A N/A 1.38 1.32 N/A N/A
2002-2018 N/A N/A 1.74 0.76 N/A N/A 0.52 0.22
2002-2019 3.55 3.30 1.69 0.75 1.38 1.32 0.51 0.22
EC
2002-2012 3.95 3.57 1.71 0.57 1.54 1.37 0.46 0.26
2002-2013 3.82 3.42 1.66 0.72 1.48 1.31 0.45 0.25
2002-2014 3.74 3.43 1.67 0.69 1.45 1.33 0.44 0.24
2002-2015 3.63 3.32 1.62 0.67 1.49 1.36 0.48 0.23
2002-2016 3.51 3.22 1.58 0.65 1.52 1.34 0.47 0.24
2002-2017 3.46 3.17 1.59 0.64 1.47 1.30 0.45 0.23
2002-2018 3.38 3.08 1.54 0.62 1.43 1.26 0.44 0.22
2002-2019 3.29 3.00 1.51 0.60 1.39 1.24 0.43 0.22
MDS
2002-2012 3.86 3.91 1.89 1.25 1.36 1.47 0.69 0.27
2002-2013 3.76 3.75 1.83 1.28 1.31 1.41 0.66 0.30
2002-2014 3.63 3.77 1.87 1.27 1.34 1.43 0.69 0.30
2002-2015 3.54 3.65 1.81 1.24 1.41 1.43 0.67 0.30
2002-2016 3.42 3.53 1.76 1.19 1.38 1.40 0.65 0.29
2002-2017 3.40 3.51 1.82 1.18 1.34 1.36 0.63 0.29
2002-2018 3.35 3.44 1.77 1.15 1.30 1.32 0.61 0.29
2002-2019 3.26 3.35 1.73 1.12 1.27 1.28 0.59 0.29
WIIW
2002-2012 3.95 3.57 1.71 0.57 1.54 1.37 0.46 0.26
2002-2013 3.82 3.42 1.66 0.72 1.48 1.31 0.45 0.25
2002-2014 3.74 3.43 1.67 0.69 1.45 1.33 0.44 0.24
2002-2015 3.63 3.32 1.62 0.67 1.49 1.36 0.48 0.23
2002-2016 3.51 3.22 1.58 0.65 1.52 1.34 0.47 0.24
2002-2017 3.46 3.17 1.59 0.64 1.47 1.30 0.45 0.23
2002-2018 3.38 3.08 1.54 0.62 1.43 1.26 0.44 0.22
2002-2019 3.29 3.00 1.51 0.60 1.39 1.24 0.43 0.22

Statistical appendix 47Spring forecast of economic trends 2020
Table 12: Comparison of the performance of forecasts for economic growth and inflation of individual institutions
4. Standardised Mean Absolute Error, stdMAE
Gross domestic product, real growth Inflation, annual average
SFt+1 AFt+1 SFt AFt SFt+1 AFt+1 SFt AFt
IMAD
2002-2012 0.63 0.57 0.31 0.13 0.49 0.51 0.23 0.10
2002-2013 0.64 0.54 0.30 0.15 0.46 0.49 0.23 0.11
2002-2014 0.66 0.59 0.34 0.16 0.45 0.49 0.21 0.10
2002-2015 0.68 0.59 0.33 0.16 0.45 0.47 0.19 0.09
2002-2016 0.67 0.58 0.34 0.15 0.44 0.45 0.18 0.09
2002-2017 0.68 0.58 0.34 0.16 0.43 0.43 0.19 0.08
2002-2018 0.67 0.57 0.34 0.15 0.42 0.42 0.19 0.08
2002-2019 0.67 0.58 0.35 0.15 0.41 0.42 0.18 0.09
BoS
2002-2012 0.59 0.57 0.33 0.15 0.73 0.50 0.21 0.09
2002-2013 0.59 0.54 0.33 0.17 0.69 0.48 0.21 0.10
2002-2014 0.61 0.59 0.35 0.19 0.64 0.47 0.19 0.09
2002-2015 0.62 0.60 0.35 0.19 0.60 0.45 0.18 0.08
2002-2016 0.61 0.59 0.35 0.19 0.58 0.44 0.17 0.08
2002-2017 0.62 0.60 0.36 0.18 0.56 0.43 0.17 0.08
2002-2018 0.62 0.58 0.35 0.18 0.56 0.43 0.16 0.08
2002-2019 0.63 0.58 0.35 0.18 0.56 0.43 0.16 0.07
CCIS
2002-2012 0.60 0.53 0.32 0.15 0.51 0.50 0.20 0.06
2002-2013 0.60 0.51 0.34 0.17 0.48 0.50 0.21 0.06
2002-2014 0.63 0.57 0.37 0.19 0.49 0.50 0.22 0.08
2002-2015 0.64 0.58 0.37 0.19 0.49 0.50 0.21 0.07
2002-2016 0.63 0.58 0.37 0.19 0.46 0.50 0.19 0.07
2002-2017 0.65 0.59 N/A N/A 0.45 0.49 N/A N/A
2002-2018 N/A N/A 0.36 0.18 N/A N/A 0.19 0.07
2002-2019 0.67 0.61 0.36 0.19 0.46 0.50 0.19 0.07
EC
2002-2012 0.59 0.54 0.31 0.11 0.62 0.57 0.17 0.09
2002-2013 0.59 0.51 0.31 0.13 0.59 0.54 0.17 0.09
2002-2014 0.63 0.57 0.33 0.13 0.55 0.54 0.16 0.08
2002-2015 0.63 0.57 0.33 0.13 0.53 0.51 0.16 0.08
2002-2016 0.62 0.56 0.34 0.14 0.54 0.49 0.15 0.08
2002-2017 0.63 0.57 0.35 0.13 0.52 0.48 0.15 0.08
2002-2018 0.63 0.56 0.34 0.13 0.51 0.47 0.14 0.07
2002-2019 0.63 0.56 0.34 0.13 0.50 0.47 0.14 0.08
MDS
2002-2012 0.57 0.59 0.34 0.22 0.54 0.56 0.25 0.12
2002-2013 0.59 0.57 0.34 0.24 0.51 0.53 0.23 0.13
2002-2014 0.59 0.63 0.37 0.25 0.51 0.53 0.24 0.13
2002-2015 0.61 0.64 0.37 0.26 0.51 0.51 0.22 0.11
2002-2016 0.60 0.63 0.37 0.25 0.49 0.49 0.20 0.11
2002-2017 0.62 0.65 0.39 0.26 0.48 0.48 0.20 0.11
2002-2018 0.64 0.66 0.39 0.24 0.48 0.47 0.19 0.12
2002-2019 0.63 0.66 0.39 0.25 0.47 0.46 0.19 0.12
WIIW
2002-2012 0.59 0.54 0.31 0.11 0.62 0.57 0.17 0.09
2002-2013 0.59 0.51 0.31 0.13 0.59 0.54 0.17 0.09
2002-2014 0.63 0.57 0.33 0.13 0.55 0.54 0.16 0.08
2002-2015 0.63 0.57 0.33 0.13 0.53 0.51 0.16 0.08
2002-2016 0.62 0.56 0.34 0.14 0.54 0.49 0.15 0.08
2002-2017 0.63 0.57 0.35 0.13 0.52 0.48 0.15 0.08
2002-2018 0.63 0.56 0.34 0.13 0.51 0.47 0.14 0.07
2002-2019 0.63 0.56 0.34 0.13 0.50 0.47 0.14 0.08

Statistical appendix48 Spring forecast of economic trends 2020
Table 12: Comparison of the performance of forecasts for economic growth and inflation of individual institutions
5. Standardised Root Mean Square Error, stdRMSE
Gross domestic product, real growth Inflation, annual average
SFt+1 AFt+1 SFt AFt SFt+1 AFt+1 SFt AFt
IMAD
2002-2012 1.02 0.93 0.40 0.18 0.68 0.66 0.29 0.12
2002-2013 1.02 0.91 0.39 0.20 0.66 0.65 0.29 0.12
2002-2014 1.03 0.95 0.42 0.21 0.63 0.63 0.27 0.11
2002-2015 1.04 0.95 0.43 0.21 0.60 0.59 0.24 0.10
2002-2016 1.04 0.95 0.43 0.21 0.58 0.57 0.23 0.10
2002-2017 1.04 0.94 0.43 0.21 0.58 0.56 0.23 0.10
2002-2018 1.02 0.93 0.43 0.20 0.58 0.56 0.24 0.10
2002-2019 1.03 0.94 0.43 0.21 0.58 0.56 0.23 0.10
BoS
2002-2012 1.00 0.95 0.51 0.19 0.95 0.66 0.25 0.13
2002-2013 0.99 0.93 0.50 0.21 0.93 0.65 0.25 0.13
2002-2014 1.00 0.96 0.52 0.23 0.84 0.62 0.23 0.12
2002-2015 1.00 0.97 0.52 0.23 0.76 0.57 0.22 0.11
2002-2016 1.01 0.97 0.53 0.23 0.73 0.55 0.21 0.10
2002-2017 1.00 0.96 0.52 0.22 0.73 0.55 0.21 0.10
2002-2018 0.99 0.95 0.52 0.22 0.73 0.55 0.21 0.10
2002-2019 0.99 0.95 0.52 0.22 0.73 0.55 0.21 0.10
CCIS
2002-2012 1.01 0.91 0.47 0.18 0.72 0.63 0.26 0.07
2002-2013 1.00 0.90 0.48 0.21 0.70 0.62 0.26 0.07
2002-2014 1.02 0.94 0.51 0.22 0.68 0.61 0.27 0.11
2002-2015 1.02 0.95 0.51 0.22 0.66 0.61 0.25 0.10
2002-2016 1.03 0.95 0.51 0.22 0.63 0.60 0.24 0.10
2002-2017 1.02 0.95 N/A N/A 0.63 0.60 N/A N/A
2002-2018 N/A N/A 0.50 0.22 N/A N/A 0.24 0.10
2002-2019 1.05 0.98 0.51 0.22 0.65 0.62 0.24 0.10
EC
2002-2012 0.99 0.89 0.43 0.14 0.79 0.70 0.24 0.13
2002-2013 0.98 0.87 0.42 0.18 0.77 0.68 0.23 0.13
2002-2014 1.00 0.91 0.45 0.18 0.71 0.66 0.22 0.12
2002-2015 1.00 0.92 0.45 0.19 0.67 0.62 0.22 0.11
2002-2016 1.00 0.92 0.45 0.19 0.67 0.59 0.21 0.10
2002-2017 1.00 0.91 0.46 0.18 0.66 0.59 0.20 0.10
2002-2018 0.99 0.90 0.45 0.18 0.66 0.59 0.20 0.10
2002-2019 0.99 0.90 0.45 0.18 0.66 0.59 0.20 0.10
MDS
2002-2012 0.96 0.97 0.47 0.31 0.68 0.73 0.34 0.14
2002-2013 0.96 0.96 0.47 0.33 0.66 0.71 0.33 0.15
2002-2014 0.97 1.00 0.50 0.34 0.64 0.68 0.33 0.15
2002-2015 0.98 1.01 0.50 0.34 0.64 0.65 0.30 0.13
2002-2016 0.98 1.01 0.50 0.34 0.61 0.62 0.29 0.13
2002-2017 0.98 1.01 0.52 0.34 0.61 0.61 0.28 0.13
2002-2018 0.98 1.01 0.52 0.34 0.61 0.61 0.28 0.14
2002-2019 0.98 1.01 0.52 0.34 0.60 0.61 0.28 0.14
WIIW
2002-2012 0.99 0.89 0.43 0.14 0.79 0.70 0.24 0.13
2002-2013 0.98 0.87 0.42 0.18 0.77 0.68 0.23 0.13
2002-2014 1.00 0.91 0.45 0.18 0.71 0.66 0.22 0.12
2002-2015 1.00 0.92 0.45 0.19 0.67 0.62 0.22 0.11
2002-2016 1.00 0.92 0.45 0.19 0.67 0.59 0.21 0.10
2002-2017 1.00 0.91 0.46 0.18 0.66 0.59 0.20 0.10
2002-2018 0.99 0.90 0.45 0.18 0.66 0.59 0.20 0.10
2002-2019 0.99 0.90 0.45 0.18 0.66 0.59 0.20 0.10

Statistical appendix 49Spring forecast of economic trends 2020
Table 12: Comparison of the performance of forecasts for economic growth and inflation of individual institutions
Notes:The assessment of the forecasting performance is based on data available at the time of the preparation of the Spring Forecast of Economic Trends 2020.Negative values in the tables indicate an underestimation, while positive values indicate an overestimation of actual trends.The BoS data for inflation forecasts SFt+1 cover the period from 2003 onwards.The CCIS forecast from 2017 for 2018 is not available. Abbreviations: SFt+1 – Spring forecast for the year ahead;AFt+1 – Autumn forecast for the year ahead;SFt – Spring forecast for the current year;AFt – Autumn Forecast for the current year;ME – Mean Error;MAE – Mean Absolute Error;RMSE – Root Mean Square Error;stdMAE – Standardised Mean Absolute Error;stdRMSE - Standardised Root Mean Square Error. Sources:Spring Report (various years). Ljubljana: IMAD.Autumn Report (various years). Ljubljana: IMAD.Spring Forecast of Economic Trends (various years). Ljubljana: IMAD.Spring Forecast of Economic Trends (various years). Ljubljana: IMAD.Implementation of Short-Term Monetary Policy Framework (2001–2003). Ljubljana: BoS.Monetary Policy Report (2004–2006). Ljubljana: BoS.Price Stability Report (2007-2012). Ljubljana: BoS.Economic and Financial Developments with Projections (2013–2015). Ljubljana: BoS.Macroeconomic Projections (2016–2019). Ljubljana: BoS.European Economic Forecast (2002–2019). Brussels: European Commission.World Economic Forecast (leta 2002–2019). Washington: IMF.Konjunkturna gibanja (2002–2019). Ljubljana: CCIS.Research Report (leta 2002–2007). Vienna: WIIW.wiiw Current Analyses and Forecasts (2008–2013). Vienna: WIIW.wiiw Forecast Report (2014–2019). Vienna: WIIW.
Acronyms50 Spring forecast of economic trends 2020
Acronyms
Acronyms in the text
ACEA – European Automobile Manufacturers Association, AF – Autumn forecast, BoS – Bank of Slovenia, CPB – Centraal Planbureau, CPI – consumer price index, EC – European Commission, ECB – European Central Bank, EIA – Energy Information Administration, ESS – Employment Service of Slovenia, EU – European union, EUR – Euro, GDP – Gross domestic product, GFS – Government Finance Statistics, HICP – Harmonised Index of Consumer Prices, IER – Institute for Economic Research, IMAD – Institute of Macroeconomic Analysis and Development, IMF – International Monetary Fund, LFS- Labour Force Survey, LPG – Liquefied Petroleum Gas, ME – Mean Error, MAE – Mean Absolute Error, MF – Ministry of Finance, NACE – Statistical classification of economic activities in the European Community, OECD – Organization for Economic Co-operation and Development, RMSE – Root Mean Square Error, SF – Spring forecast, SKD – Standard Classification of Activities, SURS – Statistical Office of the Republic of Slovenia, SUV – sport utility vehicle, TR – Current Account, UK – United Kingdom, USA– United States of America, USD – US Dollar, VAR – vector autoregression, WLTP – Worldwide Harmonised Light Vehicle Test Procedure.

pom
lada
nska
nap
oved
go
spod
arsk
ih g
iban
j 200
9

spring forecast of economic trends 2020


