ECONOMIC THEORY, APPLICATIONS AND ISSUESageconsearch.umn.edu/bitstream/90535/2/WP 31.pdf ·...
23
ISSN 1444-8890 ECONOMIC THEORY, APPLICATIONS AND ISSUES Working Paper No. 31 Tourism Development as a Dimension of Globalisation: Experiences and Policies of China and Australia by Clem Tisdell May 2004 THE UNIVERSITY OF QUEENSLAND
Transcript of ECONOMIC THEORY, APPLICATIONS AND ISSUESageconsearch.umn.edu/bitstream/90535/2/WP 31.pdf ·...

ISSN 1444-8890
ECONOMIC THEORY, APPLICATIONS AND ISSUES
Working Paper No. 31
Tourism Development as a Dimension of Globalisation: Experiences and
Policies of China and Australia
by
Clem Tisdell
May 2004
THE UNIVERSITY OF QUEENSLAND
ISSN 1444-8890 ECONOMIC THEORY, APPLICATIONS AND ISSUES
(Working Paper)
Working Paper No. 31
Tourism Development as a Dimension of Globalisation: Experiences and Policies of China and Australia1
by
Clem Tisdell2
May 2004
© All rights reserved
1 This is a draft chapter for Clem Tisdell (ed) Globalisation and World Economic Policies, Serials
Publications, Delhi, India 2 School of Economics, The University of Queensland, Brisbane QLD 4072, Australia
Email: [email protected]

` WORKING PAPERS IN THE SERIES, Economic Theory, Applications and Issues, are published by the School of Economics, University of Queensland, 4072, Australia. For more information write to Professor Clem Tisdell, School of Economics, University of Queensland, Brisbane 4072, Australia or email [email protected]
Tourism Development as a Dimension of Globalisation:
Experiences and Policies of China and Australia
Abstract
Both China and Australia have participated in the process of growing economic globalisation
in recent decades. This paper compares trends in the openness of China’s and Australia’s
economy in terms of international trade and foreign direct investment, and then examines
global trends in international tourism. This dimension of growing globalisation indicates an
accelerating trend in the second half of the 20th century. The article shows how China was
able to take advantage of this trend as a consequence of its economic reforms and opening up
to the outside world. A mini-case study of the expansion of China’s tourism industry and its
evolving policy framework is provided. Australia also has obtained significant growth in its
tourism industry in recent decades, particularly its international tourism sector. The reasons
for this are outlined and some comparisons are made between China’s and Australia’s
tourism industry. A discussion of the observed trends follows. It is argued that while growth
in inbound tourism has fostered economic growth, this has been obtained at the price of
increased economic vulnerability of this industry. It is speculated that while growing
globalisation of industry may promote economic growth, it also often has the unwelcome
effect of raising the economic vulnerability of industry
.

Tourism Development as a Dimension of Globalisation:
Experiences and Policies of China and Australia
1. Introduction
An important and visible dimension of growing globalisation has been the upsurge in
international tourism in recent decades. This has been a consequence of several factors. They
include rising populations with higher incomes, more leisure-time, falling real cost of travel
and reduced travel times as well as global media services that make individuals everywhere
more aware of the outside world. It can be argued that the upsurge in such travel is partly a
consequence of growing economic globalisation and also a contributor to it. Some circular
causation is present. Nevertheless, it would be wrong to believe (as discussed later) that
growing economic globalisation is the sole source of the worldwide expansion of
international tourism.
As mentioned in the opening chapter to this book, a rapid escalation in world economic
globalisation began around the mid-1970s measured by world exports (of goods plus
services) as a percentage of world GDP and this was reinforced in the mid-1980s, and
particularly after the early 1990s, by a massive increase in foreign direct investment as a
percentage of world GDP. From the mid-1970s onwards many countries, including China and
Australia, began altering their focus from inward-looking economic policies to outward-
looking ones.
There are, of course, many differences between Australia and China such as massive
differences in their size of populations, different historical experiences, cultural roots and so
on. China has a transitional economy but Australia does not. Australia is also ranked as a
higher income country but China is a lower income country. Nevertheless, all have been
subject to the globalisation process and at a general level, there are some similarities in policy
trends and in changes in their degree of economic openness. Both have also experienced and
upsurge in international tourism in recent decades as a dimension of their involvement in the
globalisation process.
In this chapter, trends in the degree of economic openness of these two nations are compared.
Then global trends in international tourism since the 1950s are presented and discussed. That
1

provides a background for considering trends in such tourism in China and in Australia. Most
attention is given to China’s changing tourism situation and alterations in its policies
affecting that situation. This leads on to comparisons between the Chinese and Australian
tourism industries. The chapter concludes with a discussion of issues involved in China’s and
Australia’s future development of international tourism, and with consideration of the
economic vulnerability of the tourism industry, particularly its international component.
2. Trends in the Comparative Openness of China’s and Australia’s Economy
Both China’s and Australia’s economy have become much more open during the two decades
1980 – 2000. However, as one would expect, the increase in the degree of openness of
China’s economy in this period was much more marked than in the Australian case.
Before China began its economic reforms in 1978, the Chinese economy was relatively
closed with most of its trade confined to the Communist bloc. Its economic reforms
proceeded step-by-step (slowly and methodically) after 1978. However, in line with the
philosophy of Deng Xiaoping, these always evolved towards greater use of market forces and
growing integration with the world economy. China had to transform from a centrally
planned economy to an economy increasingly directed by market forces. Major transition was
involved.
By contrast, Australia had a mixed economic system in the early 1980s with significant
protection of local industry from overseas competition. As pointed out in the earlier chapter
on Australia’s policy reactions to economic globalisation, Australia began economic reforms
in the 1980s designed to open up its economy to greater market competition but they did not
gather much momentum until the early 1990s.
As can be seen from Figure 1, China’s trade in goods and services as a proportion of its GDP
more than trebled between 1982 and 2002. In the same period, Australia’s openness using the
same measures rose by about 50 per cent. By the end of the 20th century, these economies
were about equally open on the basis of this measure whereas in the early 1980s, the
Australian economic was relatively much more involved in world trade than the Chinese
economy.
2

Figure 1: International Trade in Goods and Services (% of GDP), 1982-2002,
Australia and China
0
10
20
30
40
50
60
1982
1984
1986
1988
1990
1992
1994
1996
1998
2000
2002
%
Australia China
Source: Based on World Development Indicator (WDI), World Bank
In the early 1980s, Australia’s international trade in goods and services as a percentage of its
GDP was about twice the level of China’s but by the early 1990s, China was on par with
Australia in terms of this measure (See Figure 1). China has since then had an economy at
least ‘open’ as Australia’s, or more ‘open’, according to this indicator. Since the early 1980s,
the proportion of Australia’s GDP entering international trade has moved slowly but
persistently upwards. China sustained a fast rate of opening up until the mid-1990s and then
its proportion of GDP entering international trade fell and remained relatively stationary until
1999 (see Figure 1). Whether China’s entry to the WTO will give a new fillip to China’s
relative level of international trade remains to be seen but a strong upward trend is apparent
since 1999. Possibly China’s wish to join the WTO was in part motivated by the view that
this would provide a stimulus to its international trade.
Observe that because China’s GDP grew at a much faster rate than Australia’s, China’s
growth in absolute international trade in goods and services grew at a much faster rate than
Australia’s.
3

As a side point, it might be noted that international trade in goods accounts for a much higher
percentage of the GDP of Australia than China. Although this percentage has risen since the
early 1980s, both for Australia and China, the Australian upward trend has been steadier and
more persistent.
It may also be interesting to compare Foreign Direct Investment (FDI) net inflows of
Australia and China. Since the early 1990s, net inflows of FDI for China as a percentage of
its GDP have been much higher for China than Australia (see Figure 2). Since about the
early 1990s, FDI has on average been relatively more important in China as a source of gross
capital formation than Australia (see Figure 3). But FDI as a proportion of gross capital
formation in China declined after the mid-1990s. Again Chinese authorities may have had
some concerns about this and felt that its entry to the WTO and further economic reforms
might provide additional stimulus to FDI in China.
Figure 2: FDI, Net Inflows (% of GDP), 1981-2000, Australia and China
0
1
2
3
4
5
6
7
1981 1983 1985 1987 1989 1991 1993 1995 1997 1999
%
Australia China
Source: Based on World Development Indicators (WDI) Online, World Bank
4

Figure 3: FDI, Net Inflows (% of Gross Capital Formation), 1981-2000, Australia and
China
02468
10121416
1981 1983 1985 1987 1989 1991 1993 1995 1997 1999
%
Australia China
Source: Based on World Development Indicator (WDI) Online, World Bank.
In Chapter 1, it was noted that there was a large upsurge in global FDI as a proportion of
world GDP in the early 1990s. From Figure 2 it can be seen that China shared in that surge
but not Australia. In fact, FDI as a percentage of Australia’s GDP has been relatively
stationary since about 1986, showing, however, a slight downward trend and a similar pattern
can be observed in relation to net flows of FDI as a percentage of Australia’s gross capital
formation. Whereas globalisation provided a strong stimulus to FDI in China, a similar
stimulus does not appear, from Figures 2 and 3, to be present in the Australian case.
Nevertheless, both economies became much more open in the period 1980-2002, particularly
in relation to their international trade in goods and services. This was partly a reflection of
worldwide trends, and of specific policy measures adopted by both nations to liberalise their
economic systems and increase their participation in the international economy. During this
period, these nations also experienced substantial growth in their involvement in international
tourism. This is another feature of growing globalisation. Let us consider the global growth in
international tourism and then consider China’s and Australia’s position in that regard.
5

3. Growth in International Tourism Globally
There has been an amazing expansion in international tourism in the last half-century or so.
Not only has the number of international arrivals risen dramatically but even more
significantly there has been a tremendous rise in the percentage of international arrivals as a
percentage of world population. That is apparent from Table 1. In 1950 there were about 25
million such arrivals and in 2000, over 700 million. They are predicted to reach more that 1
billion by 2010. At the same time, the average relative frequency of involvement of the
world’s population in international travel has shown a strong upward trend. It rose from just
under one per cent in 1950 to over 11 per cent in 2000; a rise of 11 times its 1950 level.
Nevertheless, it should be borne in mind that most of this travel is accounted for by residents
foreign income countries (Tisdell, forthcoming a). Participation in international travel is
geographically very uneven and accounted mainly for by residents of higher income nations.
Table 1: International Tourist Arrivals in Relation to World Population, 1950-2010
Year International
Arrivals (‘000 persons)
World Population
(‘000 persons)
Percentage of International Arrivals of World
Population 1950 25282 2555360 0.99 1960 69320 3020112 2.30 1965 112863 3311621 3.41 1970 165787 3675076 4.51 1975 222290 4057284 5.48 1980 284282 4428422 6.42 1985 327570 4818994 6.80 1990 481134 5250661 9.16 1995 561860 5656213 9.93 2000 700789 6052847 11.58
2010 (*) 1006400 6812200 14.77 Sources:
1. The World Development Indicators (WDI) Online (for world population), World Bank 2. The World Tourism Organisation (WTO) yearbooks, various years (for international arrivals)
Note: The figures for 2010 are projections by the WTO and World Bank Figure 4 graphs international arrivals as a percentage of world population. It shows the strong
upward trend in international tourism in the modern era. Furthermore, it is distinctly
noticeable that this trend accelerated in the 1980s, and that the rate of increase has been
higher since economic globalisation has accelerated.
6

The general upward trend can be attributed to the attainment of high incomes by greater
numbers of the world population, greater available leisure-time for more people, lower real
costs of international travel and reduced travel times. These factors are quite important for
travel for leisure purposes.
Figure 4: International Arrivals as Percentage of World Population, 1950-2010
0
2
4
6
8
10
12
14
16
1950 1960 1965 1970 1975 1980 1985 1990 1995 2000 2005 2010Inte
rnat
iona
l Arri
vals
/ W
orld
Pop
ulat
ion
(%)
Source: Table 1 Note: The figures for 2005 and 2010 are projections by the WTO and World Bank
However, an important component of international travel is travel for business or professional
purposes. Growing foreign direct investment and greater international trade may be a long-
term stimulus to such travel. Therefore, the acceleration in economic globalisation, which
was very strong beginning in the mid-1980s, may have also played a role in the uplift in
international travel apparent from Figure 4.
Another influence in the 1990s was the consequence of the demise of centrally planned
communist systems. The nations involved were highly restrictive of their citizens travelling
abroad and of inbound travel. Most international travel of their citizens was restricted to the
Communist bloc and usually for professional or political purposes. Restrictions on
international travel have been much relaxed in these former centrally planned economies
since they have begun their transition to market-led economies. China’s experience provides
a striking example of a change in the direction of its international tourism policy (and tourism
policy generally) following its decision to embark its economic reforms.
7
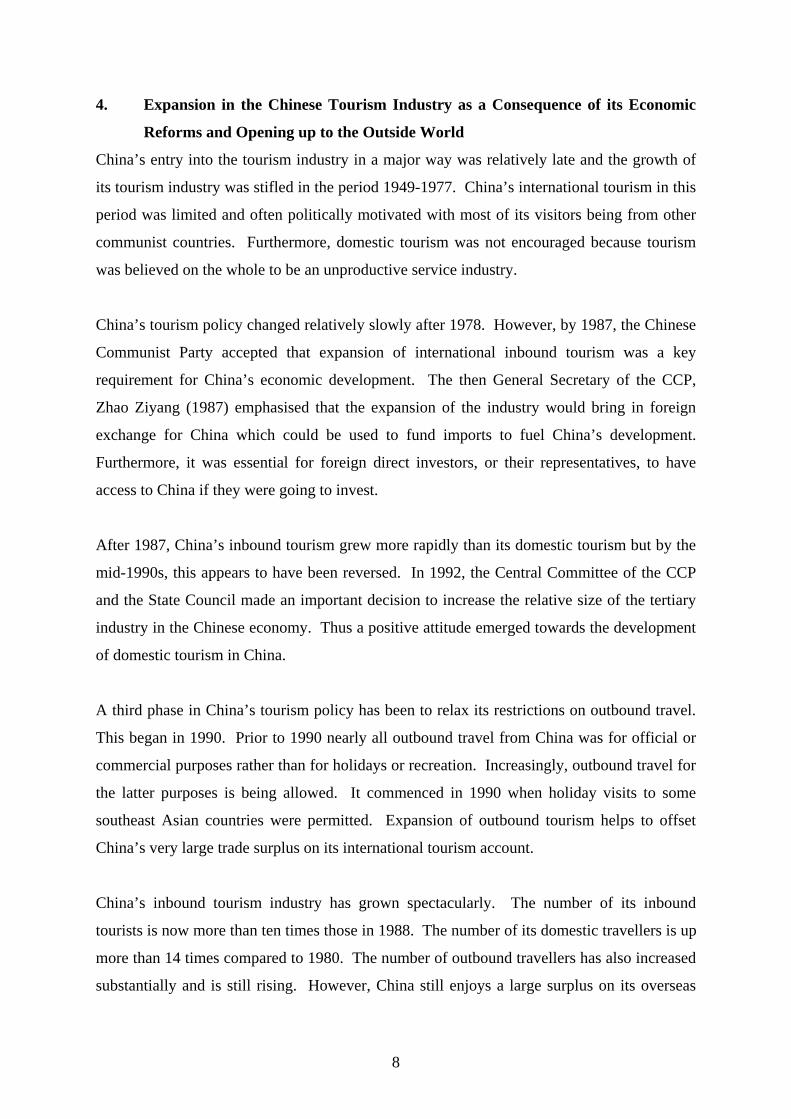
4. Expansion in the Chinese Tourism Industry as a Consequence of its Economic
Reforms and Opening up to the Outside World
China’s entry into the tourism industry in a major way was relatively late and the growth of
its tourism industry was stifled in the period 1949-1977. China’s international tourism in this
period was limited and often politically motivated with most of its visitors being from other
communist countries. Furthermore, domestic tourism was not encouraged because tourism
was believed on the whole to be an unproductive service industry.
China’s tourism policy changed relatively slowly after 1978. However, by 1987, the Chinese
Communist Party accepted that expansion of international inbound tourism was a key
requirement for China’s economic development. The then General Secretary of the CCP,
Zhao Ziyang (1987) emphasised that the expansion of the industry would bring in foreign
exchange for China which could be used to fund imports to fuel China’s development.
Furthermore, it was essential for foreign direct investors, or their representatives, to have
access to China if they were going to invest.
After 1987, China’s inbound tourism grew more rapidly than its domestic tourism but by the
mid-1990s, this appears to have been reversed. In 1992, the Central Committee of the CCP
and the State Council made an important decision to increase the relative size of the tertiary
industry in the Chinese economy. Thus a positive attitude emerged towards the development
of domestic tourism in China.
A third phase in China’s tourism policy has been to relax its restrictions on outbound travel.
This began in 1990. Prior to 1990 nearly all outbound travel from China was for official or
commercial purposes rather than for holidays or recreation. Increasingly, outbound travel for
the latter purposes is being allowed. It commenced in 1990 when holiday visits to some
southeast Asian countries were permitted. Expansion of outbound tourism helps to offset
China’s very large trade surplus on its international tourism account.
China’s inbound tourism industry has grown spectacularly. The number of its inbound
tourists is now more than ten times those in 1988. The number of its domestic travellers is up
more than 14 times compared to 1980. The number of outbound travellers has also increased
substantially and is still rising. However, China still enjoys a large surplus on its overseas
8
tourism account. The development of China’s inbound outlined in Wen and Tisdell (2001)
and so need not be covered here in detail.
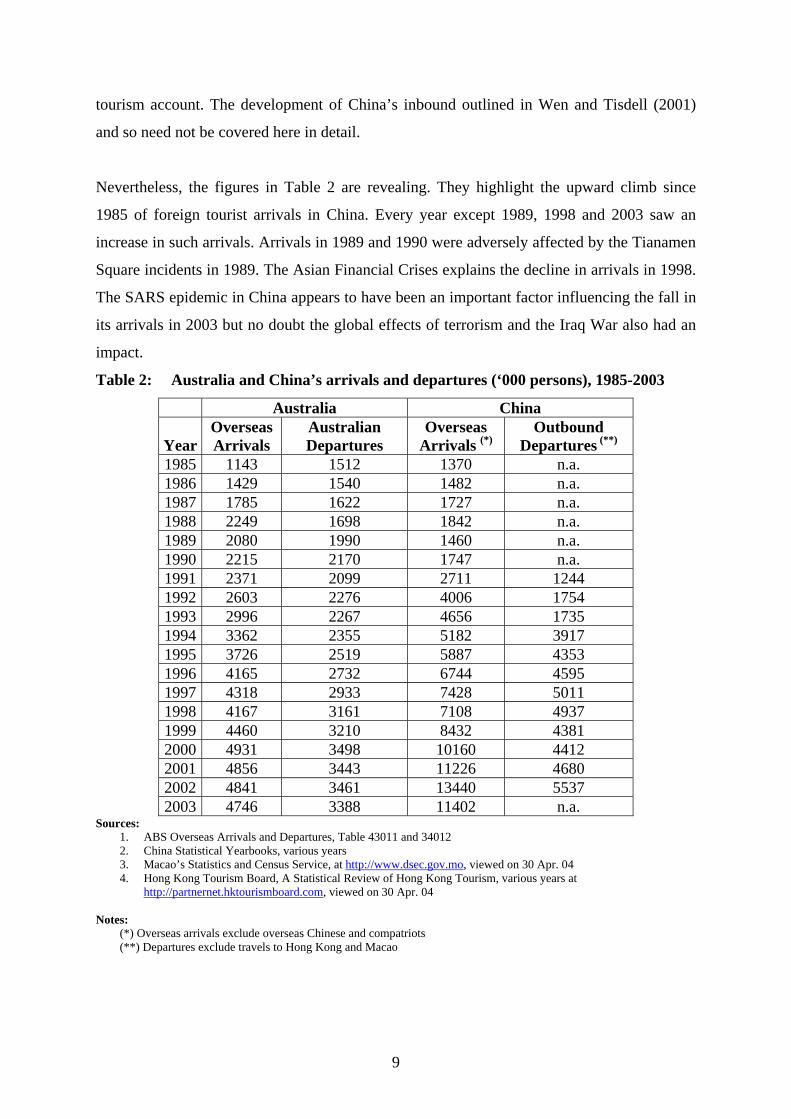
Nevertheless, the figures in Table 2 are revealing. They highlight the upward climb since
1985 of foreign tourist arrivals in China. Every year except 1989, 1998 and 2003 saw an
increase in such arrivals. Arrivals in 1989 and 1990 were adversely affected by the Tianamen
Square incidents in 1989. The Asian Financial Crises explains the decline in arrivals in 1998.
The SARS epidemic in China appears to have been an important factor influencing the fall in
its arrivals in 2003 but no doubt the global effects of terrorism and the Iraq War also had an
impact.
Table 2: Australia and China’s arrivals and departures (‘000 persons), 1985-2003
Australia China
Year Overseas Arrivals
Australian Departures
Overseas Arrivals (*)
Outbound Departures (**)
1985 1143 1512 1370 n.a. 1986 1429 1540 1482 n.a. 1987 1785 1622 1727 n.a. 1988 2249 1698 1842 n.a. 1989 2080 1990 1460 n.a. 1990 2215 2170 1747 n.a. 1991 2371 2099 2711 1244 1992 2603 2276 4006 1754 1993 2996 2267 4656 1735 1994 3362 2355 5182 3917 1995 3726 2519 5887 4353 1996 4165 2732 6744 4595 1997 4318 2933 7428 5011 1998 4167 3161 7108 4937 1999 4460 3210 8432 4381 2000 4931 3498 10160 4412 2001 4856 3443 11226 4680 2002 4841 3461 13440 5537 2003 4746 3388 11402 n.a.
Sources: 1. ABS Overseas Arrivals and Departures, Table 43011 and 34012 2. China Statistical Yearbooks, various years 3. Macao’s Statistics and Census Service, at http://www.dsec.gov.mo, viewed on 30 Apr. 04 4. Hong Kong Tourism Board, A Statistical Review of Hong Kong Tourism, various years at http://partnernet.hktourismboard.com, viewed on 30 Apr. 04
Notes:
(*) Overseas arrivals exclude overseas Chinese and compatriots (**) Departures exclude travels to Hong Kong and Macao
9

It can also be noted from Table 2 that in 1985 Australian and China had a comparable
number of tourist arrivals. However, by 2000 China had more than twice the number of
tourist arrivals of Australia. Again, while China’s tourist departures to foreign countries were
less than the number of Australia’s overseas tourist departures in 1991, by 1994 China
overtook Australia in this regard. Nevertheless, in proportion to their populations, Australia
has comparatively many more foreign tourist arrivals than China (Tisdell, forthcoming a) and
a much higher proportion of its population travels abroad every year.
Chinese departures showed substantial growth in the early 1990s but after 1994, relatively
slow growth, although overall there is an upward trend.
Figure 5 provides information about China’s inbound tourist arrivals of foreigners (excluding
Chinese from Hong Kong and Macao, and overseas Chinese) and about the departure of
Chinese for visits to foreign countries. Strong growth in foreign arrivals is apparent
throughout the period and this actually accelerated after 1998. The exception is 2003. The
substantial decline in 2003 may be largely explained by the SARS ‘epidemic’ in China.
Figure 5: China’s Inbound Arrivals of Foreigners and Outbound Departures to
Foreign Countries, 1991-2003
1,000
4,000
7,000
10,000
13,000
1991 1992 1993 1994 1995 1996 1997 1998 1999 2000 2001 2002 2003
1,000 persons
Overseas Arrivals Chinese Departures (not available for 2003)
Asian Financial
SARS
Sources:
1. China Statistical Yearbooks, various years 2. Macao’s Statistics and Census Service, at http://www.dsec.gov.mo, viewed on 30 Apr. 04 3. Hong Kong Tourism Board, A Statistical Review of Hong Kong Tourism, various years at http://partnernet.hktourismboard.com, viewed on 30 Apr. 04
Note: Overseas arrivals exclude overseas Chinese and compatriots. Departures exclude travels to Hong Kong and Macao
10

Despite the growth in foreign visits by Chinese, China still enjoys a major surplus of foreign
arrivals over foreign departures and, in fact, the gap widened after about 1997. China’s
surplus on its international tourism account will have increased significantly in recent years
because foreigners visiting China spend more per visit than Chinese visiting foreign
countries.
If short-term visits of Chinese to Hong Kong and Macau are counted as journeys abroad by
Chinese, then the growth in the number of Chinese travelling abroad is much increased.
However, it now seems more realistic to no longer regard these as foreign destinations (given
the changed status of Hong Kong and Macau). In 2000, about half of Chinese outbound
departures were to these destinations. Because of the high weight of these destinations in
China’s outbound tourism, growth in visits to these destinations may mask patterns of growth
to other outbound destinations. This can result in possible exaggeration of apparent and
predicted growth in China’s outbound tourism to foreign destinations. It is said, for example,
that “China has the potential to exert greater influence over the development of and
marketing of tourism destinations worldwide over the next decade than perhaps any other
country on the globe” (School of Travel Industry Management, University of Hawaii at
Manoa, 2003, p.1; King and McVey, 2003). However, more analysis of this possibility is
required. On the other hand, one should not ignore the change in Chinese policy which has
allowed expansion in foreign tourism by Chinese for leisure purposes.
In 2002, the World Tourism Organisation ranked China as number five in the world in terms
of inbound tourism arrivals and international tourism receipts. In less than two decades,
China went from being an insignificant player in world tourism to one of major significance.
5. Trends in Numbers of Australia’s International Tourism Arrivals and
Departures
Like China, Australia has shared in the increasing globalisation of tourism but unlike China
has never had any major restrictions on such tourism. Numbers of tourist arrivals and
departures 1985-2003 are graphed in Figure 6. Until the early 1990s, Australia tended to have
a deficit on its international tourism account, with departures of Australians on average
exceeding tourist arrivals from abroad. But in the 1990s this situation reversed and Australia
enjoyed a growing surplus on its international tourism account. The number of travellers
arriving from abroad increasing outstripped the number of Australians travelling abroad.
11

Factors contributing to the growth in number of tourist arrivals to Australia in the 1990s and
into the early 2000s included reductions in the real cost of travel and time involved in travel
to Australia. Rising incomes in East Asia also resulted in significant growth in the number of
East Asians journeying to Australia. The purchasing power of the Australian dollar was also
greater than currencies in the USA and most European countries during most of this period.
Figure 6: Australia’s Inbound Arrivals and Outbound Departures, 1985-2003
1000
2000
3000
4000
5000
6000
1985
1987
1989
1991
1993
1995
1997
1999
2001
2003
1,000 persons
Overseas Arrivals Australian Departures
Asian Financial Crisis
Olympics in
Sept. 11Hike in Australian exchange rate
Source: Based on ABS Overseas Arrivals and Departures, Table 34011 and Table 34012
Figure 6 can also be used to illustrate the vulnerability of overseas tourism to episodic or
relatively unpredictable events. For example, inbound tourism showed a marked decline in
1998 following the Asian financial crises of 1997. In 2000, the Olympic Games were held in
Sydney, Australia. This resulted in a peak in inbound tourism to Australia. Some reduction in
inbound tourism following this special event might have been expected in the following year.
However, the terrorist attacks of September 11, 2001, and subsequent terror attacks have been
amongst the factors contributing to a fall in Australia’s overseas arrivals since 2001. Fears
about SARS may have also contributed. It was a significant factor in the fall in arrivals of
foreigners in China in 2003, as noted earlier.
12
6. Some Comparisons between China’s Tourism Industry and Australia’s
Although China’s tourism industry is now very large by world standards, comparatively
speaking, it is much smaller than Australia’s. This is so if account is taken of the differences
in the size of populations of the two countries.
In 2002, Australia received about 4.8 million inbound tourists. In 2000, China received about
83 million inbound tourists of which 10 million were foreigners. However, China’s
population is more than 100 times that of Australia. Thus China would need more than 480
million inbound tourists to have a comparable situation to Australia. Like China, Australia
has had a large increase in inbound tourism in recent decades. For example, between 1993
and 2000, inbound tourist arrivals to Australia increased by more than 60 per cent.
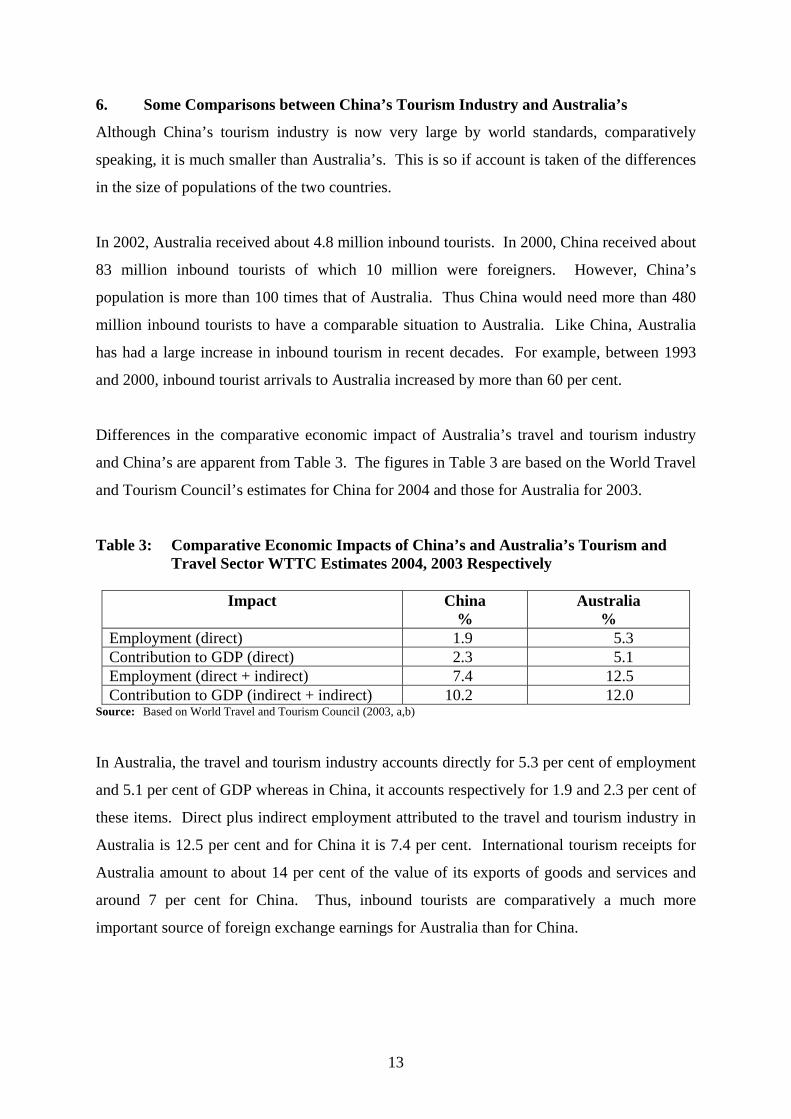
Differences in the comparative economic impact of Australia’s travel and tourism industry
and China’s are apparent from Table 3. The figures in Table 3 are based on the World Travel
and Tourism Council’s estimates for China for 2004 and those for Australia for 2003.
Table 3: Comparative Economic Impacts of China’s and Australia’s Tourism and Travel Sector WTTC Estimates 2004, 2003 Respectively
Impact China
% Australia
% Employment (direct) 1.9 5.3 Contribution to GDP (direct) 2.3 5.1 Employment (direct + indirect) 7.4 12.5 Contribution to GDP (indirect + indirect) 10.2 12.0
Source: Based on World Travel and Tourism Council (2003, a,b)
In Australia, the travel and tourism industry accounts directly for 5.3 per cent of employment
and 5.1 per cent of GDP whereas in China, it accounts respectively for 1.9 and 2.3 per cent of
these items. Direct plus indirect employment attributed to the travel and tourism industry in
Australia is 12.5 per cent and for China it is 7.4 per cent. International tourism receipts for
Australia amount to about 14 per cent of the value of its exports of goods and services and
around 7 per cent for China. Thus, inbound tourists are comparatively a much more
important source of foreign exchange earnings for Australia than for China.
13

7. Discussion
With the anticipated future growth in China’s tourism market, strong external pressures are
likely to be put on China to further liberalise its travel and tourism sector. For example,
WTTC (2003a, p.14) states that China should do more to encourage open markets and skies
and remove barriers to tourism growth. It recommends that China should ‘progressively
liberalise trade, transport and communications through international trading regimes such as
the World Trade Organisation’s General Agreement on Trade and Services’, and states that
“China must focus greater attention on liberalising its financial services policies in close
collaboration with key stakeholders who provide for the convenient conduct of consumption
associated with Travel and Tourism”.
Predictions of the WTCC (2003a) for growth in China’s travel and tourism sector are quite
bullish. WTTC predicts that in the decade to 2013, the direct travel and tourism component
of China’s GDP will show an average real increase of 10.9% per annum. Increases in
employment in China’s travel and tourism sector are expected to occur at an average rate of
3.8% per year. Thus, productivity in this sector will rise but its employment generation will
lag behind its growth in output generation. Nevertheless, it will continue to be a job-creating
sector rather than a jobless growth sector. There are increasing worries that some industrial
sectors of the economy are exhibiting jobless economic growth.
There has also been optimism about continuing growth in Australia’s tourism sector. For
example, in 2003, the Australian Tourism Forecasting Council predicted that in the period
2003-2012 the number of Australia’s inbound tourists would rise by 4.8% per annum on
average. As a result of this, the number of inbound tourists to Australia, was anticipated to
rise from 4.8 million in 2002 to approximately 7.8 million in 2012. But these predictions
were made prior to the recent hike in the value of the Australian dollar. If the dollar remains
at its current level, these predictions may not be realised.
Long-term predictions of levels of international tourism levels are fraught with difficulties.
For example, exchange rates can be volatile and difficult to predict on a long-term basis. In
China’s case, the United States wants it to appreciate the Renmembi. If this occurs it will
dampen demand for inbound tourism to China.
14

International tourism is also economically very vulnerable to episodic events such as wars,
civil disturbances, terrorism and outbreaks of natural disasters. In that regard, it appears
much more risky as an earner of foreign exchange than the export of material goods, even
though this is not riskless. International tourism requires the consumer to travel to the
country where the tourism commodities are to be consumed whereas the export of material
goods for consumption does not involve this. It is the personal commitment of travelling to a
foreign country to consume international tourism commodities that makes a high degree of
economic dependence on foreign tourism quite risky, even though there are ways in which
risk exposure can be reduced (Tisdell, 2003).
Like many other modern relatively capital-intensive industries in which facilities are
relatively specialised, most components of the travel and tourism sector face structural
vulnerability when the sector reaches a mature state. Substantial economies in utilisation of
capacity occur in the operation of hotels, airlines, airports and so on.
Typically sectors of the travel and tourism industry in a long-term competitive situation may
reach an equilibrium similar to that in Chamberlin’s monopolistically competitive model
(Chamberlin, 1950). If all are equally efficient, all will just earn a normal profit. If an
unexpected even occurs, such as a major terrorism attach, the demand for the services of all
firms falls and in the short run they will make large losses if they keep to a fixed price
equivalent to that which corresponded to their pre-existing long-run equilibrium. The loss is
made largely because of the steep rise in per unit costs when operating below capacity (see
Tisdell, forthcoming a). In order to minimise losses prices might be slashed so adding to the
economic difficulties of all in this sector.
Adjustment will eventually take place, but it will probably be more protracted and costlier
from an economics point of view if firms in the industry are fairly evenly matched in terms of
their competitiveness or economic efficiency rather than disparate in this regard. It may
indeed be an advantage for economic adjustment to have inequality in the economic
efficiency of firms (Tisdell, forthcoming b) although this would not be an advantage in a
long-run equilibrium. Because we do not live in a stationary world, it may not be a good idea
to ensure that all firms are equally efficient, for example, that all adopt the best or benchmark
practices. There may also be other reasons why economic diversity has economic value in an
15

evolving world (Tisdell and Seidl, forthcoming) and why we should strive for heterogeneity
rather than homogeneity of economic units.
8. Concluding Comments
Since commencing its economic reforms in 1978, China has become increasingly integrated
into the world economy as evidenced in this chapter. It has been able to take advantage of the
substantial growth that has occurred in international tourism globally. This is most apparent
from the high rate of growth it has achieved in its level of inbound tourism. In its early stages
of opening up to the outside world, this provided China with much needed foreign exchange
and assisted it in importing capital equipment and technology for it economic growth.
Commencing in the early 1990s, it has eased it restrictions on outbound travel by its citizens.
Nevertheless, China still enjoys a very large surplus on its international tourism account with
foreign countries.
In recent times, Australia’s economy has also become much more open, although the change
has not been as dramatic as in China’s case. Nevertheless, a major change did occur in
Australia’s international tourism sector. This sector has expanded markedly (partly as a result
of expanding tourist arrivals for Asia) and Australia has gone from a situation where it had a
deficit or near deficit on such tourism to one where it has a substantial surplus.
Both in the case of China and Australia, their tourism sectors have grown to become
important segments of their economies. The sector is, however, comparatively larger in
Australia’s case. Expansion of this sector has helped to foster economic growth in both
countries. Nevertheless, the tourism sector, especially its international segment, is extremely
vulnerable to unexpected shocks. It is often the case that enhanced economic growth obtained
by greater involvement of nations in the global economy is obtained at the cost of their
greater economic vulnerability.
Acknowledgements
This is an extended an improved version of a background paper prepared for a lecture to
visiting Master of Science (Managerial Economics) students from Nanyang Technological
University, Singapore, given at The University of Queensland in February 2004. I would like
to thank Viet (Vincent) Ngu Hoang for his research assistance.
16

References
Chamberlin, E. (1950) The Theory of Monopolistic Competition, 6th edition. Harvard University Press, Cambridge, Mass.
King, B. and McVey, M. (2003) China outbound, Travel and Tourism Analyst, 1: 1-32.
School of Travel Industry Management, University of Hawaii at Manoa (2003) Identifying and analysing the Chinese outbound market for Hawaii, Report for Hawaii Tourism Authority, State of Hawaii.
Tisdell, C. (2003) Fostering tourism to diversity and develop small economies: Brunei’s policies in a general context, Pacific Tourism Review, 6(2): 83-94.
Tisdell, C. (forthcoming a) A review of structural features of international tourism: economic influences and its vulnerability, Global Review of Business and Economic Research.
Tisdell, C. (forthcoming b) Economic competition and evolution: are there lessons from ecology?, Contemporary Economic Policy.
Tisdell, C. and Seidl, I. (forthcoming) Niches and economic competition: implications for economic efficiency, growth and diversity, Structural Change and Economic Dynamics.
Wen, J. J. and Tisdell, C. A. (2001) Tourism and China’s Development. World Scientific, Singapore.
World Travel and Tourism Council (WTTC) (2003a) The Impact of Travel and Tourism on Jobs and the Economy, China, and China, Hong Kong SAR, < http://www.wttc.org/>.
World Travel and Tourism Council (WTTC) (2003b) Australian Travel and Tourism, WTTC, < http://www.wttc.org/>.
Ziyang, Zhao (1987) Advance along the road of socialism with Chinese characteristics. In: Documents of the Thirteenth National Congress of the Communist Party of China (1987), Foreign Languages Press, Beijing.
17

ISSN 1444-8890 PREVIOUS WORKING PAPERS IN THE SERIES
ECONOMIC THEORY, APPLICATIONS AND ISSUES 1. Externalities, Thresholds and the Marketing of New Aquacultural Products: Theory and
Examples by Clem Tisdell, January 2001. 2. Concepts of Competition in Theory and Practice by Serge Svizzero and Clem Tisdell, February
2001. 3. Diversity, Globalisation and Market Stability by Laurence Laselle, Serge Svizzero and Clem
Tisdell, February 2001. 4. Globalisation, the Environment and Sustainability: EKC, Neo-Malthusian Concerns and the
WTO by Clem Tisdell, March 2001. 5. Globalization, Social Welfare, Labor Markets and Fiscal Competition by Clem Tisdell and Serge
Svizzero, May 2001. 6. Competition and Evolution in Economics and Ecology Compared by Clem Tisdell, May 2001. 7. The Political Economy of Globalisation: Processes involving the Role of Markets, Institutions
and Governance by Clem Tisdell, May 2001. 8. Niches and Economic Competition: Implications for Economic Efficiency, Growth and Diversity
by Clem Tisdell and Irmi Seidl, August 2001. 9. Socioeconomic Determinants of the Intra-Family Status of Wives in Rural India: An Extension
of Earlier Analysis by Clem Tisdell, Kartik Roy and Gopal Regmi, August 2001. 10. Reconciling Globalisation and Technological Change: Growing Income Inequalities and
Remedial Policies by Serge Svizzero and Clem Tisdell, October 2001. 11. Sustainability: Can it be Achieved? Is Economics the Bottom Line? by Clem Tisdell, October
2001. 12. Tourism as a Contributor to the Economic Diversification and Development of Small States: Its
Strengths, Weaknesses and Potential for Brunei by Clem Tisdell, March 2002. 13. Unequal Gains of Nations from Globalisation by Clem Tisdell, Serge Svizzero and Laurence
Laselle, May 2002. 14. The WTO and Labour Standards: Globalisation with Reference to India by Clem Tisdell, May
2002. 15. OLS and Tobit Analysis: When is Substitution Defensible Operationally? by Clevo Wilson and
Clem Tisdell, May 2002. 16. Market-Oriented Reforms in Bangladesh and their Impact on Poverty by Clem Tisdell and
Mohammad Alauddin, May 2002. 17. Economics and Tourism Development: Structural Features of Tourism and Economic Influences
on its Vulnerability by Clem Tisdell, June 2002. 18. A Western Perspective of Kautilya’s Arthasastra: Does it Provide a Basis for Economic Science?
by Clem Tisdell, January 2003. 19. The Efficient Public Provision of Commodities: Transaction Cost, Bounded Rationality and
Other Considerations. 20. Globalization, Social Welfare, and Labor Market Inequalities by Clem Tisdell and Serge
Svizzero, June 2003. 21. A Western Perspective on Kautilya’s ‘Arthasastra’ Does it Provide a Basis for Economic
Science?, by Clem Tisdell, June 2003. 22. Economic Competition and Evolution: Are There Lessons from Ecology? by Clem Tisdell, June
2003. 23. Outbound Business Travel Depends on Business Returns: Australian Evidence by Darrian
Collins and Clem Tisdell, August 2003. 24. China’s Reformed Science and Technology System: An Overview and Assessment by Zhicun
Gao and Clem Tisdell, August 2003. 25. Efficient Public Provision of Commodities: Transaction Costs, Bounded Rationality and Other
Considerations by Clem Tisdell, August 2003.
18
26. Television Production: Its Changing Global Location, the Product Cycle and China by Zhicun Gao and Clem Tisdell, January 2004.
27. Transaction Costs and Bounded Rationality – Implications for Public Administration and Economic Policy by Clem Tisdell, January 2004.
28. Economics of Business Learning: The Need for Broader Perspectives in Managerial Economics by Clem Tisdell, April 2004.
29. Linear Break-Even Analysis: When is it Applicable to a Business? By Clem Tisdell, April 2004. 30. Australia’s Economic Policies in an Era of Globalisation by Clem Tisdell, April 2004.
19


![Macro Economic Theory [Doyle]](https://static.fdocuments.net/doc/165x107/577d20151a28ab4e1e91f26d/macro-economic-theory-doyle.jpg)