Economic Survey - mfin.gov.mt · Economic Survey are provisional and subject to revision. ......
199
-
Upload
nguyenkhanh -
Category
Documents
-
view
224 -
download
0
Transcript of Economic Survey - mfin.gov.mt · Economic Survey are provisional and subject to revision. ......

Economic Survey October 2017
Economic Policy DepartmentMinistry for Finance
9th October, 2017

National Accounts estimates and other statistics which appear in this Economic Survey are provisional and subject to revision. Figures may not add up due to rounding.This document is based on statistical information available up to 18th September 2017.
The following symbols have been used throughout this document:
. . . to indicate that data are not available;
0 to indicate that the fi gure is zero;
- to indicate that data are not applicable or cannot be determined;
— to indicate that the fi gure is negligible;
Printed at the Government Press Price: €5.00
CIP Data
Economic Survey October 2017 / Economic Policy Department - Valletta : Ministry for Finance, 2017.
ISBN: 978-99957-58-22-6

Economic Survey October 2017 i
Contents
page
1. Executive Summary ........................................................................................................... 3
2. Economic Growth ..............................................................................................................11
2.1 International Context .............................................................................................11
2.2 Maltese Economy ...................................................................................................12
2.2.1 Private Final Consumption Expenditure ..............................................16
2.2.2 General Government Final Consumption Expenditure ..................16
2.2.3 Gross Capital Formation ............................................................................ 17
2.2.4 Foreign Demand and Supply ...................................................................182.3 Sectoral Contribution to Gross Value Added ..............................................192.4 Gross Domestic Product from the Income Approach ............................22
2.5 Gross National Income ........................................................................................24
3. Employment ......................................................................................................................29
3.1 Labour Market Developments ..........................................................................29
3.1.1 Recent Employment Trends .....................................................................29
3.1.2 Developments in the Unemployment Rate ........................................32
3.1.3 General Labour Market Developments in the Euro Area
and the EU ................................................................................................................34
3.2 Sectoral Employment ..........................................................................................37
3.3 Private Sector Employment...............................................................................40
3.4 Public Sector Employment................................................................................43
3.5 A Profi le of Registered Unemployed under Part I ................................... 44
3.6 Part-time Activity..................................................................................................47
4. Productive Activities ......................................................................................................53 4.1 Industrial Indicators.............................................................................................53 4.2 Manufacturing Performance ............................................................................54
4.2.1 Manufacture of Food and Beverages ..................................................55
4.2.2 Manufacture of Textiles, Wearing Apparel
and Leather Products............................................................................................55
4.2.3 Manufacture of Wood, Paper, Printing, Chemicals and Pharmaceutical Products ...................................................................................55

ii Economic Survey October 2017
4.2.4 Manufacture of Rubber, Plastic Products and Other
Non-Metallic Mineral Products ..........................................................................57
4.2.5 Manufacture of Computer, Electronic, Electrical Equipment
and Transport Equipment ...................................................................................58
4.2.6 Manufacture of Furniture, Other Manufacturing, Repair
and Installation of Machinery and Equipment.............................................58
4.3 Agriculture and Fisheries .................................................................................. 60
4.3.1 Agriculture ......................................................................................................61
4.3.2 Fisheries ..........................................................................................................63
5. Services Activities ............................................................................................................715.1 Tourism .......................................................................................................................71
5.1.1 Monthly Distribution....................................................................................72
5.1.2 Tourist Nationality........................................................................................75
5.1.3 Cruise Passengers........................................................................................76
5.1.4 Accommodation...........................................................................................78
5.1.5 Employment..................................................................................................80
5.1.6 Tourism Earnings.........................................................................................80
5.2 Regulatory Activity...............................................................................................82 5.2.1 Malta Financial Services Authority.......................................................82 5.2.2 Malta Gaming Authority...........................................................................84 5.2.3 Development and Investment Promotion .........................................87
6. Prices and Incomes.........................................................................................................93
6.1 Infl ation.....................................................................................................................94
6.1.1 International Comparison ...................................................................... 94
6.2 Retail Price Index and COLA ..........................................................................97
6.3 Sectoral Wages - Collective Agreements.................................................100
6.4 Sectoral Wages - Labour Force Survey.....................................................106
7. International Trade .......................................................................................................... 111
7.1 Exports of Goods ................................................................................................ 111
7.1.1 Geographical Distribution - Exports .................................................. 113
7.2 Imports of Goods.................................................................................................115
7.2.1 Geographical Distribution - Imports .................................................. 117
7.3 Trade Balance....................................................................................................... 119
7.3.1 Geographical Distribution - Trade Balance ..................................... 121

Economic Survey October 2017 iii
7.4 Balance of Payments...........................................................................................122 7.4.1 The Current Account ................................................................................. 122
7.4.1.1 The Goods and Services Account ............................................ 124
7.4.1.2 Primary Income................................................................................128
7.4.1.3 Secondary Income..........................................................................130
7.4.2 Capital Account............................................................................................131
7.4.3 The Financial Account and the Net International
Investment Position............................................................................................ 132
8. Financial Developments ..............................................................................................1378.1 Public Finance ...................................................................................................... 139
8.1.1 Revenue.......................................................................................................... 1398.1.2 Expenditure .................................................................................................. 1428.1.3 Recurrent Expenditure ............................................................................. 1438.1.4 Analysis of Recurrent Expenditure by Functional Classifi cation ...................................................................................1448.1.5 Capital Expenditure ................................................................................... 1468.1.6 International Comparison ....................................................................... 147
8.2 Monetary Developments .................................................................................. 155
8.2.1 Contribution of Resident MFIs to Euro Area Monetary
Aggregates..............................................................................................................155
8.2.2 Contribution of Resident MFIs to Counterparts to Euro Area
Monetary Aggregates .........................................................................................1588.2.3 The Money Market ..................................................................................... 1618.2.4 Deposit and Lending Rates ................................................................... 1668.2.5 The Capital Market .................................................................................... 167
8.3 Exchange Rate Developments ....................................................................... 169
Boxes3.1 Developments in Private Sector Employment in Manufacturing ............494.1 The Industrial Production Index ..........................................................................594.2 Economic Accounts for Agriculture 2016 ....................................................... 648.1 General Government Budgetary Developments .......................................... 153
iv Economic Survey October 2017
Tables2.1 GDP by Category of Expenditure ........................................................................142.2 GDP by Category of Expenditure - Percentage Changes ..........................152.3 Gross Fixed Capital Formation .............................................................................182.4 Sectoral Gross Value Added ................................................................................ 202.5 Gross Domestic Product from the Income Side ............................................242.6 Gross National Income ............................................................................................253.1 Labour Market Performance (Persons aged 15 and over) ........................ 303.2 Distribution of Employed Persons by Type of Employment in Main Occupation ...................................................................................................313.3 Employment Rates by Age ....................................................................................323.4 Unemployment Rates by Age ..............................................................................333.5 Employment Rates across EU ..............................................................................363.6 Labour Market Indicators .......................................................................................393.7 Private Sector Employment - Direct Production ...........................................413.8 Contribution to Growth in Private Sector Employment ..............................413.9 Private Sector Employment - Market Services ..............................................423.10 Contribution to Growth in Private Sector Employment.............................433.11 Public Sector Employment................................................................................... 443.12 Registered Unemployed ........................................................................................ 463.13 Registered Unemployed - by age distribution .............................................. 463.14 Registered Unemployed Classifi ed by Occupation .....................................473.15 Part-Time Employment ...........................................................................................484.1 Activity Indicators for Manufacturing ...............................................................564.2 Agricultural Indicators ............................................................................................614.3 Imports of Major Agricultural Commodities ...................................................625.1 Main Tourism Indicators ..........................................................................................725.2 Monthly Inbound Tourists ......................................................................................735.3 Quarterly Distribution of Inbound Tourists .....................................................755.4 Inbound Tourists by Country of Residence .....................................................775.5 Main Types of Tourist Accommodation ............................................................785.6 Monthly Accommodation Occupancy Rates ..................................................795.7 Expenditure from Inbound Tourism ....................................................................816.1 Harmonised Index of Consumer Prices (August 2017) ..............................956.2 Harmonised Index of Consumer Prices - Annual rate of change ...........966.3 Index by Commodity Group - Average for 12 months ................................986.4 Retail Price Index - 12-Month Moving Average Infl ation Rate .................986.5 Average Weekly Wages - August 2016 .......................................................... 1036.6 Average Weekly Wages - August 2017 ..........................................................1046.7 Percentage Growth in Average Weekly Wages ........................................... 1056.8 Average Annual Basic Salary...............................................................................106

Economic Survey October 2017 v
7.1 Commodity Breakdown of Exports ................................................................... 1127.2 Total Exports by Main Geographical Areas .................................................... 1147.3 Imports by Broad Economic Category ............................................................ 1157.4 Total Imports by Main Geographical Areas .................................................... 1187.5 Foreign Trade..... ....................................................................................................... 1207.6 Trade Balances with Various Countries............................................................ 1217.7 Balance of Payments - Goods, Services and Income Account (Net) .........................................................................................1257.8 Balance of Payments - Current Account ........................................................ 1307.9 Current, Capital and Financial Flows ................................................................ 1318.1 Government Revenue and Expenditure........................................................... 1388.2 General Government Net Lending (+) or Borrowing (-) ........................... 1488.3 General Government Gross Debt ....................................................................... 1498.4 Contribution of Resident MFIs to Euro Area Monetary Aggregates.....1568.5 Resident Deposits ................................................................................................... 1588.6 Contribution of Resident MFIs to Counterparts to Euro Area Monetary Aggregates ........................................................................1598.7 Credit to Other Residents - Loans by Economic Activity .........................1608.8 Government Stocks - Activity on the Secondary Market ......................... 1688.9 Selected Indicators of the Capital Market ...................................................... 169
Appendix Tables8.1 Government Revenue ..............................................................................................1748.2 Government Recurrent Expenditure ..................................................................1758.3 Government Expenditure by COFOG category ........................................... 177
Charts2.1 Quarterly Gross Domestic Product ......................................................................132.2 Contribution to Growth in Gross Value Added ................................................192.3 Compensation of Employees .................................................................................233.1 Harmonised Deseasonalised Unemployment Rate .......................................343.2 Employment Rates across EU - Jan-Mar 2016 - Jan-Mar 2017 .................353.3 Unemployment Rate across EU - Jan-Mar 2017 .............................................374.1 Sectoral Developments in GVA - Manufacturing ...........................................545.1 Inbound Tourists .........................................................................................................745.2 Tourist Market Shares ...............................................................................................765.3 Expenditure from Inbound Tourism .....................................................................816.1 Harmonised Index of Consumer Prices .............................................................967.1 Commodity Breakdown of Exports .................................................................... 112
vi Economic Survey October 2017
7.2 Imports of Goods ....................................................................................................... 1167.3 Foreign Trade ............................................................................................................. 1207.4 Current Account - as a per cent of GDP .......................................................... 1237.5 External Balance - as a per cent of GDP ..........................................................1257.6 Primary Income Balance - as a per cent of GDP............................................1288.1 Consolidated Fund Balance ................................................................................. 1398.2 Government Total Revenue ................................................................................1408.3 Government Total Expenditure ........................................................................... 1428.4 Expenditure by Functional Classifi cation ....................................................... 1458.5 Recurrent expenditure by COFOG category, January-August 2017.... 1468.6 Local Interest Rates and Margins ....................................................................... 1668.7 Euro Exchange Rate Movements........................................................................ 170
Statistical AnnexI. Population ................................................................................................................... 181II. Social Indicators ...................................................................................................... 182III. Factor Incomes in Gross National Income ..................................................... 183IV. Gross National Income and Expenditure ....................................................... 184V. Labour ......................................................................................................................... 185VI. Tourism ....................................................................................................................... 186VII. Foreign Trade ........................................................................................................... 187VIII. Balance of payments ............................................................................................. 188IX. Government Revenue and Expenditure ......................................................... 189X. Contribution of Resident MFIs to Euro Area Monetary Aggregates and Counterparts........................................................190

1. Excecutive Summary


Economic Survey October 2017 3
1. Executive SummaryA decade after the Great Recession, the global economy is showing signs of a broad, fi rming recovery. Indeed, global economic activity gained momentum in late 2016 and early 2017 and this is expected to persist, largely driven by the fragile recovery in emerging and developing economies as well as some fi rming in advanced economies.
The European economy has continued in its path towards full recovery for the fi fth consecutive year, with growth in 2016 reaching 1.8 per cent and 1.9 per cent in the Euro Area (EA) and the European Union (EU28) respectively. This positive momentum, supported primarily by domestic demand, continued also into 2017 and is now reaching all EU Member States. Indeed, during the fi rst half of 2017, the EA grew at a real rate of 2.1 per cent, while the EU28 grew at a real rate of 2.2 per cent. The EA headline infl ation rate is estimated to have peaked to 1.1 per cent in the same period, largely driven by energy prices and base eff ects. The unemployment rate averaged 9.9 per cent in the EA and 8.3 per cent in the EU28.
The European economy is set to continue growing at a rather steady pace over the course of 2017 and 2018. In its Spring 2017 macroeconomic forecasts, the European Commission expects the EA to grow by 1.7 per cent in 2017 and 1.8 per cent in 2018, and the EU28 to grow by 1.9 per cent in both years. Growth should continue to benefi t largely from a resilient domestic demand, a relatively competitive euro and a gradual improvement in world trade. Unemployment is set to continue on its downward trajectory, whilst infl ation is expected to continue rising in 2017 and to slow down in 2018 as the eff ect of rising oil prices subsides. At the same time, economic growth prospects remain clouded by elevated political and policy uncertainties including election outcomes, Brexit negotiations, the health of the banking sector, the persistent weakness of the Italian economy, the low infl ation and wage growth, continued net outfl ows of capital outside the EA and, more externally, the future United States (US) policies and broader geopolitical tensions.

4 Economic Survey October 2017
Following exceptional growth rates in 2014 and 2015, and robust growth in 2016, the Maltese economy continued to grow strongly in the fi rst half of 2017. Indeed, during this period, the Maltese economy grew at a nominal rate of 8.3 per cent, or a real rate of 6.3 per cent, outperforming the average growth rate registered in the EU28 and the EA in the same period. Growth was mostly the result of a larger contribution from the external side of the economy, as growth in exports was coupled by a decline in imports. On the other hand, the domestic side of the economy contributed negatively to growth in the fi rst half of 2017. This was mainly driven by a fall in gross fi xed capital formation, following the exceptional surge in investment in energy, transport and construction in recent years. Nevertheless, investment activity in the fi rst half of 2017 remains well above the historical average.
During the fi rst six months of the year, Gross Value Added (GVA) at basic prices increased by 8.3 per cent, which is attributable to increases in all sectors of the Maltese economy. Signifi cant increases were registered in the professional, scientific and technical activities sector, the arts, entertainment and recreation sector, the wholesale and retail, transportation and a ccommodation sector, and fi nancial services.
During the twelve months up to March 2017, the number of people participating in the labour market continued to increase. This positive development was coupled with declines in the unemployment rate, which stood at 4.2 per cent in the fi rst quarter of 2017, 0.7 percentage points below the rate observed during the comparable period of 2016. In line with past trends, employment growth has been mostly concentrated in the services sector. During the fi rst quarter of the year, employment growth stood at 2.9 per cent when compared to the previous comparable period, a rate that exceeds the EU28 and EA averages. The increase in employment refl ected an increase in both female and male employment, with the increase in female employment being more pronounced, refl ecting Government’s eff orts to increase the participation rate in this segment of the labour market. Most increases originated mainly in the private sector, particularly in activities related to professional, technical

Economic Survey October 2017 5
and administrative activities; and arts, entertainment and recreational activities, including gambling and betting activities.
The performance of the tourism industry continued to be buoyant in the fi rst seven months of 2017. Indicators point towards another good year for tourism, both in terms of inbound tourists and bed-nights spent in Malta, which in turn translate into high levels of tourist expenditure and employment creation. In the period January to July 2017, inbound tourism increased by 17.6 per cent, reaching 1,241,248 persons. Nights spent by inbound tourists increased by around 11.0 per cent, and expenditure from inbound tourists increased by 13.9 per cent. Average full-time employment in the accommodation and food services activities recorded an increase of almost 800 jobs during the fi rst quarter of 2017. The same applies for the performance in the cruise passenger industry, which was characterized by robust growth. Indeed, during the fi rst two quarters of 2017, cruise passenger arrivals, excluding the embarkations and the Maltese cruise passenger arrivals, increased by 12.2 per cent over the corresponding period of 2016.
In August 2017, the Harmonised Index of Consumer Prices (HICP) annual infl ation rate was 1.2 per cent. Between October 2016 and January 2017, infl ation increased from 0.5 per cent to 1.4 per cent, however, it declined to 1.0 per cent in June 2017. Meanwhile, the EA annual infl ation rate for August 2017 stood at 1.5 per cent.
The buoyant performance is also confirmed by sustained increases in wages. Indeed, according to the Labour Force Survey, the average annual basic salary for employees stood at €18,029 in the fi rst quarter of 2017, 5.7 per cent higher than the level recorded a year earlier. The average weekly wage, based on a sample of collective agreements, stood at €352.59 up by €7.38 or 2.1 per cent over the same period last year, with direct production and market services increasing by 1.7 per cent and 2.2 per cent, respectively.
In 2016, the General Government recorded a surplus of 1.0 per cent of Gross Domestic Product (GDP). During the eight months

6 Economic Survey October 2017
to August 2017, the diff erence between central Government recurrent revenue and total expenditure improved to €31.1 million - an improvement of €110.2 million when compared to the same period in the previous year. This improvement was mainly the result of higher tax revenues, mainly refl ecting the impact of stronger economic growth, as well as further effi ciency in revenue collection. Meanwhile, the public sector borrowing requirement decreased from €383.7 million to €60.3 million refl ecting developments in the sinking fund contribution and direct loan repayment.
As at the end of July 2017, Malta’s visible negative trade gap increased by €241 million, resulting in a negative trade balance of €2,080.6 million. Total exports of goods decreased by €736.9 million, thus exceeding the decrease in imports of €495.9 million and thus widening the trade defi cit. Nevertheless, in a context where the economy is becoming increasingly services oriented, an assessment of the state of external accounts must also incorporate developments in trade in services. Indeed, the current account surplus stood at 11.3 per cent of GDP, while in 2016, this balance stood at 2.6 per cent. This surplus was mainly driven by the goods and services balance, which stood at €797.8 million when compared to the €336.2 million recorded in 2016. The second element explaining the current account surplus is the positive secondary income account balance attributed to a decline in net payments on personal transfers. When considering the fi nancial account, net lending increased by €974.8 million, primarily due to the surge in net acquisition of fi nancial assets which outweighed the increase in net incurrence of liabilities. This was coupled with a positive reserve asset fi gure. As at June 2017, Malta’s net international investment position stood at €6.7 billion, with domestic assets exceeding liabilities.
In the fi rst seven months of 2017, overnight deposits contributed positively towards the increase in broad money (M3). Given the relatively low interest rate environment, depositors continued to hold higher levels of highly short-term liquid assets in the form of cash, while both deposits redeemable at notice up to three-months and deposits with agreed maturity up to two-years

Economic Survey October 2017 7
decreased in the period January-July 2017 when compared to a year earlier. The spread between weighted average deposit and lending rates experienced some fl uctuation during 2014 before edging down by the end of the year. Over the course of 2015 and up to January 2016, the spread level experienced a mild increase before declining again in the subsequent month and remaining relatively stable until April 2017. Meanwhile, the European Central Bank (ECB) rate dropped to 0 per cent in March 2016 and remained at this level thereafter. The spread level between weighted average deposit and lending rates dipped slightly again in May 2017 before edging mildly upwards until July 2017. The dynamics of such a stable spread level between lending and deposit rates, refl ects an overall marginal decrease in deposit rates and a corresponding minimal decline in lending rates from February 2016 onwards.


2. Economic Growth


Economic Survey October 2017 11
2. Economic Growth
2.1 International Context A decade after the great recession, the global economy is showing signs of a fi rming recovery. Indeed, global economic activity gained speed in late 2016 and early 2017 and this momentum is expected to continue. According to the International Monetary Fund’s (IMF) most recent updates of the World Economic Outlook (July 2017), global growth is projected to increase from an estimated 3.2 per cent in 2016 to 3.5 per cent in 2017 and then 3.6 per cent for 2018. In emerging market and developing economies, growth is predicted to recover, rising from 4.3 per cent in 2016 to 4.6 per cent in 2017, and 4.8 per cent in 2018, as activity in both commodity exporting and commodity importing economies continues to be robust. China and India are expected to continue growing at an average rate of 6.6 per cent and 7.5 per cent, respectively, over the forecasting period. Meanwhile, growth in advanced economies is expected to accelerate to 2.0 per cent in 2017, before moderating gradually in 2018-2019. In the United States (US), a moderate growth rate of 2.1 per cent is being projected for each of the next two years, this being clouded with the uncertainty emanating from the nature and timing of the US Administration’s fi scal policy changes.
The European economy has continued with its strengthening recovery, with growth in 2016 reaching 1.8 per cent and 1.9 per cent in the Euro Area (EA) and the European Union (EU28), respectively. Despite the political uncertainties and challenges it continues to face, growth in the EA was fuelled by accommodative monetary policy, a more competitive exchange rate and lower oil prices. This positive momentum continued also into 2017 and is now reaching all EU Member States. Indeed, the latest statistics confi rm that in the fi rst half of 2017, the EA grew at a real rate of 2.1 per cent, while the EU28 grew at a real rate of 2.2 per cent, both up by 0.1 percentage point from the same period of 2016. The EA headline infl ation rate is estimated to have peaked to 1.1 per cent in the same period, largely driven

12 Economic Survey October 2017
by energy prices and base eff ects. The average unemployment rate stood at 9.9 per cent in the EA and 8.3 per cent in the EU28, yet these fi gures mask substantial variations amongst European economies.
Looking ahead, the IMF and the European Commission expect the European economy to continue growing at a rather steady pace over the course of 2017 and 2018. Growth should continue to benefi t largely from a resilient domestic demand, and a gradual improvement in world trade. Unemployment is set to continue on its downward trend, while infl ation is forecasted to continue rising in 2017 and then to slow down in 2018, as the eff ect of rising oil prices diminishes. At the same time, economic growth prospects remain clouded by elevated political and policy uncertainties including election outcomes, the upcoming Brexit negotiations, the health of the banking sector, the persistent weakness of the Italian economy, the low infl ation and wage growth, continued net outfl ows of capital outside the EA and, more externally, the future US policies and broader geopolitical tensions.
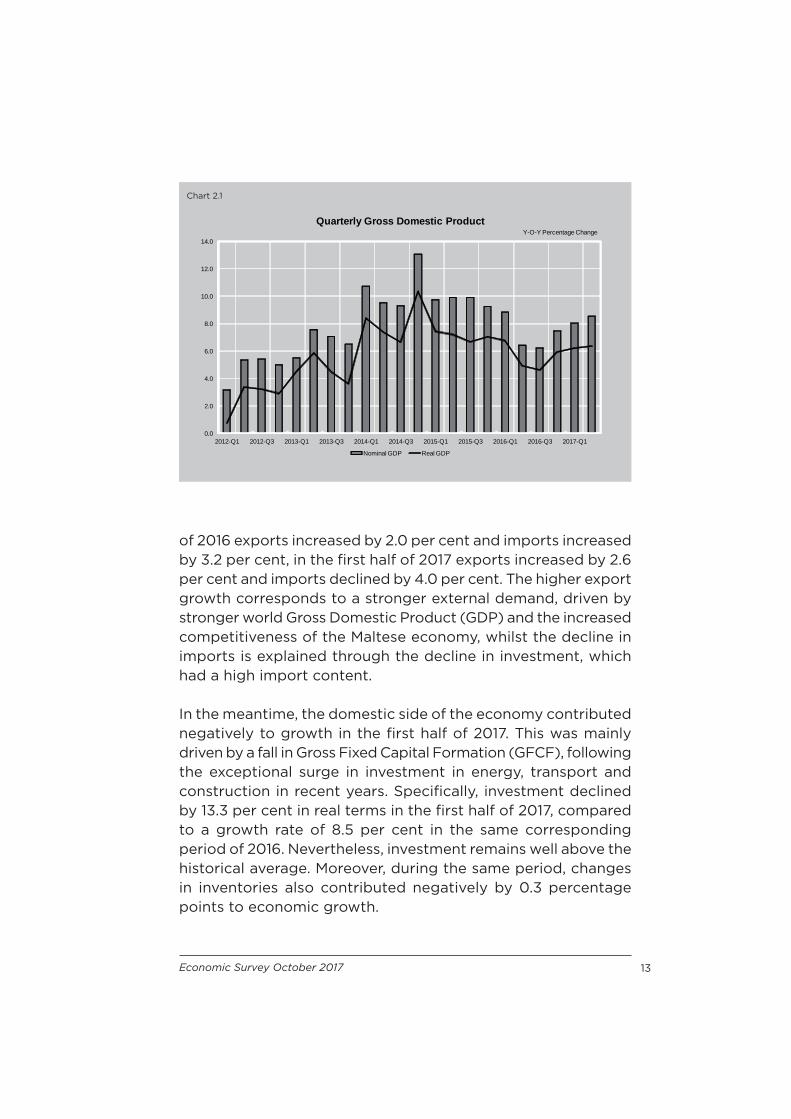
2.2 Maltese Economy Following exceptional growth rates recorded in 2014 and 2015, and robust growth in 2016, the Maltese economy continued to grow strongly in the fi rst half of 2017. Indeed, during this period, the Maltese economy grew at a nominal rate of 8.3 per cent, or a real rate of 6.3 per cent, outperforming the average growth rate registered in the EU28 and the EA in the same period. This performance also compares favourably to that registered in the same period of 2016. In fact, during the fi rst half of 2017, economic growth in real terms was 0.5 percentage points higher when compared to the fi rst half of 2016. Year-on-year economic growth rates are presented in Chart 2.1.
From the expenditure side, the positive economic performance in the fi rst half of 2017 was mostly the result of a larger contribution from the external side of the economy, as growth in exports was coupled by a decline in imports. Specifi cally, while in the fi rst half
Economic Survey October 2017 13
Chart 2.1
of 2016 exports increased by 2.0 per cent and imports increased by 3.2 per cent, in the fi rst half of 2017 exports increased by 2.6 per cent and imports declined by 4.0 per cent. The higher export growth corresponds to a stronger external demand, driven by stronger world Gross Domestic Product (GDP) and the increased competitiveness of the Maltese economy, whilst the decline in imports is explained through the decline in investment, which had a high import content. In the meantime, the domestic side of the economy contributed negatively to growth in the fi rst half of 2017. This was mainly driven by a fall in Gross Fixed Capital Formation (GFCF), following the exceptional surge in investment in energy, transport and construction in recent years. Specifi cally, investment declined by 13.3 per cent in real terms in the fi rst half of 2017, compared to a growth rate of 8.5 per cent in the same corresponding period of 2016. Nevertheless, investment remains well above the historical average. Moreover, during the same period, changes in inventories also contributed negatively by 0.3 percentage points to economic growth.
0.0
2.0
4.0
6.0
8.0
10.0
12.0
14.0
2012-Q1 2012-Q3 2013-Q1 2013-Q3 2014-Q1 2014-Q3 2015-Q1 2015-Q3 2016-Q1 2016-Q3 2017-Q1
Y-O-Y Percentage ChangeQuarterly Gross Domestic Product
Nominal GDP Real GDP
14 Economic Survey October 2017
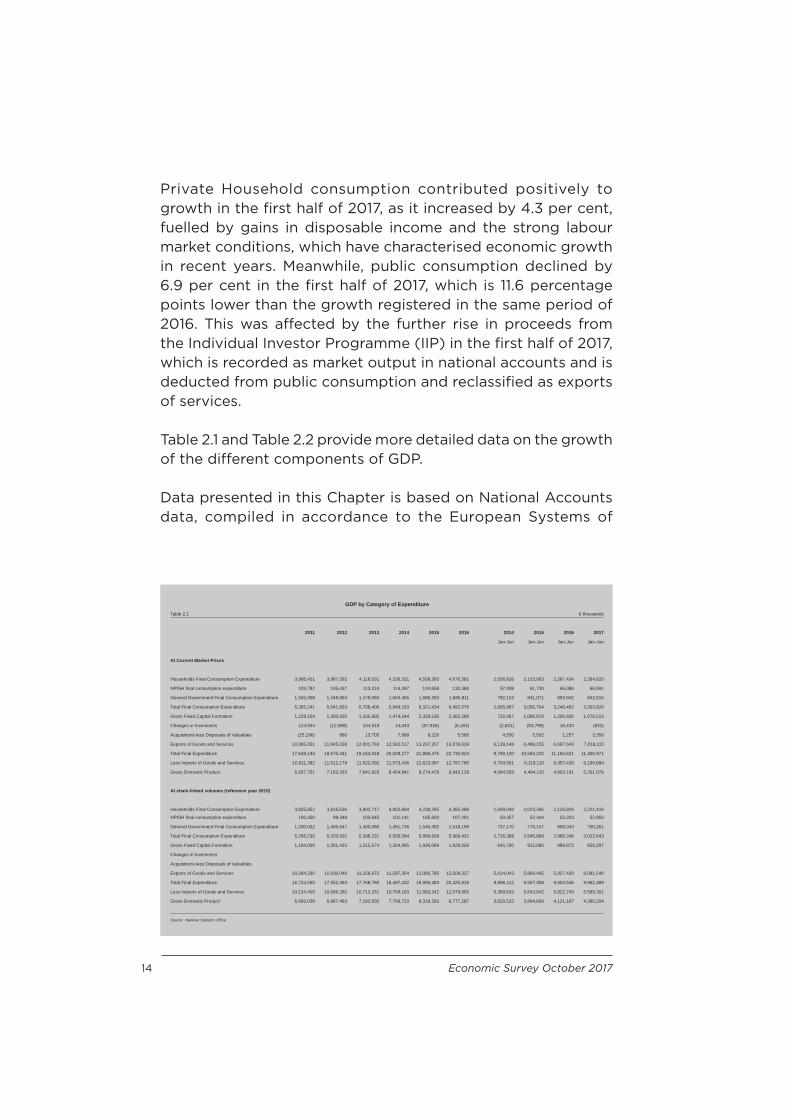
Private Household consumption contributed positively to growth in the fi rst half of 2017, as it increased by 4.3 per cent, fuelled by gains in disposable income and the strong labour market conditions, which have characterised economic growth in recent years. Meanwhile, public consumption declined by 6.9 per cent in the fi rst half of 2017, which is 11.6 percentage points lower than the growth registered in the same period of 2016. This was aff ected by the further rise in proceeds from the Individual Investor Programme (IIP) in the fi rst half of 2017, which is recorded as market output in national accounts and is deducted from public consumption and reclassifi ed as exports of services.
Table 2.1 and Table 2.2 provide more detailed data on the growth of the diff erent components of GDP.
Data presented in this Chapter is based on National Accounts data, compiled in accordance to the European Systems of
GDP by Category of ExpenditureTable 2.1 € thousands
2011 2012 2013 2014 2015 2016 2014 2015 2016 2017
Jan-Jun Jan-Jun Jan-Jun Jan-Jun
At Current Market Prices
Households Final Consumption Expenditure 3,906,451 3,987,592 4,116,031 4,230,321 4,508,383 4,676,381 2,056,826 2,153,903 2,287,434 2,394,620
NPISH fi nal consumption expenditure 103,782 105,437 113,310 114,397 124,658 130,384 57,008 61,730 65,086 66,591
General Government Final Consumption Expenditure 1,345,008 1,448,864 1,479,065 1,604,465 1,688,393 1,685,811 792,153 841,071 893,942 842,616
Total Final Consumption Expenditure 5,355,241 5,541,893 5,708,406 5,949,183 6,321,434 6,492,576 2,905,987 3,056,704 3,246,462 3,303,826
Gross Fixed Capital Formation 1,229,104 1,300,620 1,335,605 1,474,544 2,328,535 2,362,286 722,067 1,086,670 1,206,826 1,076,513
Changes in Inventories 124,934 (12,989) 104,519 14,043 (57,926) (8,163) (2,631) (53,799) 18,433 (833)
Acquisitions less Disposals of Valuables (25,196) 880 13,705 7,989 9,226 5,586 4,550 5,502 1,257 3,350
Exports of Goods and Services 10,965,051 11,845,038 12,001,783 12,582,517 13,297,207 13,878,639 6,139,148 6,488,155 6,687,643 7,018,115
Total Final Expenditure 17,649,134 18,675,441 19,164,018 20,028,277 21,898,475 22,730,924 9,769,120 10,583,232 11,160,621 11,400,971
Less Imports of Goods and Services 10,811,382 11,512,179 11,522,092 11,573,436 12,623,997 12,787,785 5,704,561 6,119,116 6,357,430 6,199,894
Gross Domestic Product 6,837,751 7,163,263 7,641,925 8,454,841 9,274,479 9,943,139 4,064,559 4,464,115 4,803,191 5,201,078
At chain-linked volumes (reference year 2010)
Households Final Consumption Expenditure 3,825,852 3,816,536 3,892,717 4,002,694 4,238,265 4,365,488 1,939,046 2,023,345 2,126,829 2,221,416
NPISH fi nal consumption expenditure 100,350 99,348 103,645 101,141 105,820 107,201 50,357 52,344 53,323 52,950
General Government Final Consumption Expenditure 1,330,032 1,405,647 1,400,086 1,491,736 1,546,492 1,518,199 737,170 770,157 806,043 750,261
Total Final Consumption Expenditure 5,256,235 5,320,932 5,396,231 5,595,094 5,889,609 5,988,432 2,726,368 2,845,868 2,986,246 3,022,643
Gross Fixed Capital Formation 1,184,000 1,201,415 1,215,574 1,304,985 1,936,089 1,928,056 645,700 912,085 989,872 858,297
Changes in Inventories
Acquisitions less Disposals of Valuables
Exports of Goods and Services 10,284,330 11,030,046 11,156,975 11,597,354 12,080,785 12,509,327 5,614,043 5,809,405 5,927,429 6,081,548
Total Final Expenditure 16,724,565 17,552,393 17,768,780 18,497,432 19,906,483 20,425,816 8,986,112 9,567,358 9,903,546 9,962,489
Less Imports of Goods and Services 10,134,405 10,686,282 10,713,251 10,769,183 11,583,342 11,679,905 5,368,633 5,643,842 5,822,749 5,589,301
Gross Domestic Product 6,693,038 6,867,483 7,183,002 7,769,723 8,318,393 8,777,287 3,629,515 3,894,668 4,121,187 4,380,204
Source: National Statistics Offi ce

Economic Survey October 2017 15
Accounts (ESA2010) methodology. This accounting framework enables comparability with EU Member States as well as a systematic and detailed description of the economy and its core components. GDP at current market prices is estimated by the National Statistics Offi ce (NSO) from the production side, involving the aggregation of the output of various productive sectors net of the cost of intermediate inputs. A reconciliation of the production side with estimates of expenditure on output produced is then carried out.
GDP by Category of ExpenditurePercentage Changes
Table 2.2
2012 2013 2014 2015 2016 2015 2016 2017
Jan-Jun Jan-Jun Jan-Jun
At Current Market Prices
Households Final Consumption Expenditure 2.1 3.2 2.8 6.6 3.7 4.7 6.2 4.7
NPISH fi nal consumption expenditure 1.6 7.5 1.0 9.0 4.6 8.3 5.4 2.3
General Government Final Consumption Expenditure 7.7 2.1 8.5 5.2 -0.2 6.2 6.3 -5.7
Total Final Consumption Expenditure 3.5 3.0 4.2 6.3 2.7 5.2 6.2 1.8
Gross Fixed Capital Formation 5.8 2.7 10.4 57.9 1.4 50.5 11.1 -10.8
Changes in Inventories
Acquisitions less Disposals of Valuables
Exports of Goods and Services 8.0 1.3 4.8 5.7 4.4 5.7 3.1 4.9
Total Final Expenditure 5.8 2.6 4.5 9.3 3.8 8.3 5.5 2.2
Less Imports of Goods and Services 6.5 0.1 0.4 9.1 1.3 7.3 3.9 -2.5
Gross Domestic Product 4.8 6.7 10.6 9.7 7.2 9.8 7.6 8.3
At chain-linked volumes (reference year 2010)
Households Final Consumption Expenditure -0.2 2.0 2.8 5.9 3.0 4.3 5.1 4.4
NPISH fi nal consumption expenditure -1.0 4.3 -2.4 4.6 1.3 3.9 1.9 -0.7
General Government Final Consumption Expenditure 5.7 -0.4 6.5 3.7 -1.8 4.5 4.7 -6.9
Total Final Consumption Expenditure 1.2 1.4 3.7 5.3 1.7 4.4 4.9 1.2
Gross Fixed Capital Formation 1.5 1.2 7.4 48.4 -0.4 41.3 8.5 -13.3
Changes in Inventories
Acquisitions less Disposals of Valuables
Exports of Goods and Services 7.3 1.2 3.9 4.2 3.5 3.5 2.0 2.6
Total Final Expenditure 4.9 1.2 4.1 7.6 2.6 6.5 3.5 0.6
Less Imports of Goods and Services 5.4 0.3 0.5 7.6 0.8 5.1 3.2 -4.0
Gross Domestic Product 2.6 4.6 8.2 7.1 5.5 7.3 5.8 6.3
Source: National Statistics Offi ce

16 Economic Survey October 2017
2.2.1 Private Final Consumption ExpenditureThe private fi nal consumption expenditure category defi ned as household fi nal consumption expenditure and non-profi t institutions serving households (NPISH) final consumption expenditure registered a real increase of 4.3 per cent in the fi rst half of 2017 compared with an increase of 5.0 per cent registered in the same period of 2016. In nominal terms, private final consumption grew by 4.6 per cent during the same comparable period. These increases were largely backed by favourable labour market conditions as well as by increases in real disposable income. These developments meant that the proportion of real private consumption to real GDP continued on its downward path. Indeed, in the fi rst half of 2017, the ratio stood at 51.9 per cent, down by 1.0 percentage point from that recorded in the fi rst half of 2016.
Growth in nominal private consumption in the fi rst half of 2017 was broadly distributed among all the diff erent expenditure categories. Double-digit growth rates were recorded in the expenditure on education (15.5 per cent), restaurants and hotels subcategory (12.0 per cent) and on clothing and footwear (11.6 per cent). Signifi cant increases were also recorded in the expenditure on miscellaneous goods and services (8.4 per cent), health (6.1 per cent) and housing, water, electricity, gas and other fuels (5.5 per cent).
2.2.2 General Government Final Consumption ExpenditureGeneral Government expenditure experienced a decline of 6.9 per cent in real terms during the fi rst six months of 2017. This marks a decrease of 11.6 percentage points compared to last year’s corresponding growth rate, which stood at 4.7 per cent. In nominal terms, General Government expenditure declined by 5.7 per cent. Lower public consumption was impacted by the surge in IIP proceeds particularly since the second half of 2016 and which has continued during the Survey period. These

Economic Survey October 2017 17
developments translated into a slightly lower ratio of General Government expenditure to real GDP than previously recorded. Indeed, as a ratio of GDP, General Government expenditure in the fi rst half of 2017 stood at 17.1 per cent as compared to 19.6 per cent in the same period of 2016.
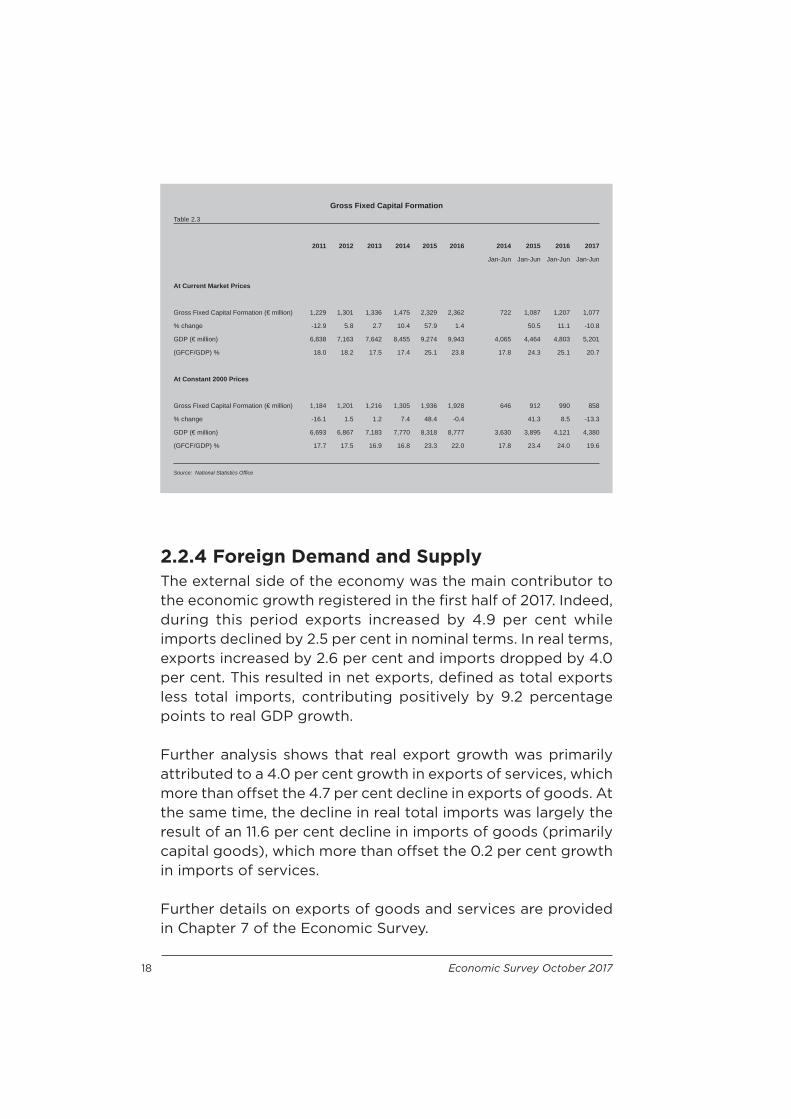
2.2.3 Gross Capital FormationGross Capital Formation comprises gross fi xed capital formation, changes in inventories and acquisitions less disposals of valuables. Of the two components, GFCF is the main component as it measures investment activity. In the fi rst half of 2017, GFCF declined by 10.8 per cent in nominal terms when compared to the same period last year, yet remains well above the historical average.
Such development reflects the phasing out of one-off equipment investments which resulted in a moderation from the extraordinary high growth rates of 50.5 per cent and 11.1 per cent recorded in the fi rst half of 2015 and 2016, respectively. The decline in GFCF in the fi rst half of 2017 was underpinned by a 12.7 per cent fall in private investment, which more than off set the 8.7 per cent growth in public investment during this period. Further analysis of the components of investment indicates that the decline was primarily driven by a fall in transport equipment investment (-91.4 per cent) following the surge in aviation investment registered last year. This decline more than off set the growth registered in the investment on construction (38.2 per cent), metal products and machinery (32.3 per cent) and intellectual property products (12.7 per cent).
In real terms, GFCF amounted to 19.6 per cent of GDP, which albeit lower than the 24.0 per cent share recorded for the same period of 2016, is still above historical averages. More information on GFCF is presented in Table 2.3.
18 Economic Survey October 2017
2.2.4 Foreign Demand and SupplyThe external side of the economy was the main contributor to the economic growth registered in the fi rst half of 2017. Indeed, during this period exports increased by 4.9 per cent while imports declined by 2.5 per cent in nominal terms. In real terms, exports increased by 2.6 per cent and imports dropped by 4.0 per cent. This resulted in net exports, defi ned as total exports less total imports, contributing positively by 9.2 percentage points to real GDP growth.
Further analysis shows that real export growth was primarily attributed to a 4.0 per cent growth in exports of services, which more than off set the 4.7 per cent decline in exports of goods. At the same time, the decline in real total imports was largely the result of an 11.6 per cent decline in imports of goods (primarily capital goods), which more than off set the 0.2 per cent growth in imports of services.
Further details on exports of goods and services are provided in Chapter 7 of the Economic Survey.
Gross Fixed Capital FormationTable 2.3
2011 2012 2013 2014 2015 2016 2014 2015 2016 2017
Jan-Jun Jan-Jun Jan-Jun Jan-Jun
At Current Market Prices
Gross Fixed Capital Formation (€ million) 1,229 1,301 1,336 1,475 2,329 2,362 722 1,087 1,207 1,077
% change -12.9 5.8 2.7 10.4 57.9 1.4 50.5 11.1 -10.8
GDP (€ million) 6,838 7,163 7,642 8,455 9,274 9,943 4,065 4,464 4,803 5,201
(GFCF/GDP) % 18.0 18.2 17.5 17.4 25.1 23.8 17.8 24.3 25.1 20.7
At Constant 2000 Prices
Gross Fixed Capital Formation (€ million) 1,184 1,201 1,216 1,305 1,936 1,928 646 912 990 858
% change -16.1 1.5 1.2 7.4 48.4 -0.4 41.3 8.5 -13.3
GDP (€ million) 6,693 6,867 7,183 7,770 8,318 8,777 3,630 3,895 4,121 4,380
(GFCF/GDP) % 17.7 17.5 16.9 16.8 23.3 22.0 17.8 23.4 24.0 19.6
Source: National Statistics Offi ce

Economic Survey October 2017 19
2.3 Sectoral Contribution to Gross Value AddedIn the fi rst six months of 2017, total Gross Value Added (GVA) increased by €352.9 million, equivalent to an increase of 8.3 per cent over the same period in 2016, to reach €4,610.5 million. The growth witnessed in GVA was attributable to increases registered in the majority of sub-sectors of the economy, with signifi cant increases registered in the Professional, Scientifi c and Technical activities sector, the Arts, Entertainment and Recreation sector, and the Wholesale and Retail, Transportation and Accommodation sector. The sectoral contributions to growth in GVA during the Survey period are confi rmed in Chart 2.2, whereas Table 2.4 shows the sectoral levels in GVA at basic prices.
In the fi rst half of 2017, the Professional, Scientifi c and Technical activities sector saw major growth in its GVA, increasing by 23.8 per cent or €123.9 million. This led to a 2.91 percentage points contribution to growth.
Chart 2.2
*Includes food services activities
**Includes quarrying
-1 0 1 2 3 4 5 6 7 8 9
Agriculture and fishing
Electricity, Water, & Manufacturing**
of which Manufacturing
Construction
Wholesale and retail, transportation and accommodation*
Information and Communication
Financial and Insurance Activities
Real estate activities
Professional, scientific and technical activities
Public administration, education & human health
Arts, entertainment and recreation
Gross Value Added
Percentage Points
Contribution to Growth in Gross Value Added
Jan-June 2017 Jan-June 2016

20 Economic Survey October 2017
The Arts, Entertainment and Recreation sector which includes the gaming industry, also saw signifi cant growth in its GVA, increasing by 9.9 per cent during the Survey period to reach a total GVA of €642.3 million. In turn, this sector contributed 1.36 percentage points to overall growth.
GVA classifi ed under the Wholesale and Retail, Transportation and Accommodation sector increased by 6.2 per cent or €54.0 million during the period under review, reaching €919.0 million. At a more disaggregated level, GVA at basic prices in the wholesale and retail trade sector in the fi rst six months of 2017 stood at €453.1 million, a rise of 4.8 per cent over the previous year. Increases were also registered in the transportation sector (4.7 per cent) and more signifi cantly in the accommodation sectors (12.2 per cent). This led to a total contribution of 1.27 percentage points towards growth.
Sectoral Gross Value Added(at basic prices)
Table 2.4 € million
2011 2012 2013 2014 2015 2016 2015 2016 2017
Jan-Jun Jan-Jun Jan-Jun
Agriculture, forestry and fi shing 95 94 91 96 105 118 44 49 51
Mining and quarrying; manufacturing; and utilities 871 818 843 864 891 927 452 472 480
of which Manufacturing 786 791 727 746 741 766 374 383 403
Construction 282 275 294 302 352 349 176 172 188 Wholesale and retail trade; repair of motor vehicles and motorcycles; transportation and storage; accommodation and food service activities
1,289 1,397 1,528 1,621 1,768 1,831 821 865 919
Information and Communication 368 374 370 476 532 588 257 283 306
Financial services 457 533 535 516 555 616 272 306 329
Real estate activities 370 373 382 383 440 477 217 235 235
Professional, scientifi c and technical activities; administrative and support service activities
569 651 730 858 984 1,109 466 520 644
Public administration and defence; compulsory social security; education; human health and social work activities
1,110 1,176 1,254 1,357 1,453 1,547 726 772 816
Arts, entertainment and recreation, repair of household goods and other services 545 586 689 947 1,075 1,176 535 584 642
Gross Value Added 5,956 6,276 6,717 7,420 8,155 8,738 3,967 4,257.6 4,610.5
Source: National Statistics Offi ce

Economic Survey October 2017 21
The Financial and Insurance Services sector witnessed a 7.4 per cent growth during the fi rst six months of 2017, to reach a total of €328.8 million. This led to a contribution towards growth of 0.53 percentage points.
The Manufacturing sector’s GVA growth rate continued to increase, growing by 5.2 per cent or €19.8 million in the fi rst six months of 2017, reaching €403.2 million. At a more detailed sectoral level, performance of the manufacturing sector was uneven at its various subsectors. Decreases in the GVA growth rates were registered in the pharmaceutical subsector (27.8 per cent), and the printing and reproduction of recorded media (11.6 per cent) and food (4.4 per cent) subsectors. However, these were off set by increases in the manufacture of computer, electronic and optical products, and increases in the electrical equipment (24.0 per cent), repair and installation of machinery and equipment (15.6 per cent) and rubber and plastics (10.8 per cent) subsectors. Consequently, a positive contribution of 0.46 percentage points towards the overall growth in GVA was registered by the manufacturing sector.
Public Administration and Defence; Compulsory Social Security; Education; Human Health and Social Work activities increased by €43.9 million over the Survey period, equivalent to 5.7 per cent, to reach a total GVA of €816.1 million. This resulted in a 1.03 percentage point contribution towards growth.
The Construction sector recorded growth in the fi rst six months of 2017, reversing the decline in 2016. Construction activities increased by €16.2 million, thus leading to a 0.38 percentage points contribution towards growth.
The Information and Communications sector also increased by €22.8 million, leading to a contribution to growth of 0.53 percentage points.
22 Economic Survey October 2017
2.4 Gross Domestic Product from the Income ApproachOn the income side, growth in the fi rst half of 2017 was due to positive income returns from both compensation of employees and gross operating income, as well as from net taxes.
In the fi rst half of 2017, compensation of employees, defi ned as the summation of wages and salaries and employers’ social security contributions, increased by 6.0 per cent to reach €2,185.4 million. This was primarily underlined by growth in employment as income per capita increased modestly during the Survey period. From a sectoral perspective, the largest percentage increase in compensation of employees over this period was recorded in the arts, entertainment and recreation subsector which increased by 20.2 per cent. The Professional, scientifi c and technical activities; administrative and support service activities and information and communication sectors increased their compensation substantially, increasing by 8.4 per cent and 8.1 per cent, respectively over the same period of 2016. The real estate and the construction sectors both registered an increase of over 5.0 per cent. Positive growth rates were also recorded in the majority of other sub-sectors, notably in the Public administration and defence; compulsory social security; education; human health and social work activities sector (5.1 per cent), the Construction sector (5.1 per cent), the Agriculture, forestry and fi shing sector (4.9 per cent), the Financial and insurance activities sector (4.4 per cent), the Wholesale and retail trade; repair of motor vehicles and motorcycles; transportation and storage; accommodation and food service activities sector (3.9 per cent) and fi nally the Mining and quarrying; manufacturing; electricity, gas, steam and air conditioning supply; water supply; sewerage, waste management and remediation activities sector (1.6 per cent). Developments in compensation of employees at market prices are displayed in Chart 2.3.
During the fi rst six months of 2017, the share of employee compensation to GDP at market prices decreased by 0.9

Economic Survey October 2017 23
Chart 2.3
0.0
1.0
2.0
3.0
4.0
5.0
6.0
7.0
8.0
9.0
2012-Q1 2012-Q3 2013-Q1 2013-Q3 2014-Q1 2014-Q3 2015-Q1 2015-Q3 2016-Q1 2016-Q3 2017-Q1
Y-O-Y Percentage Change
Compensation of Employees
percentage points to 42.0 per cent, as the growth rate of GDP exceeded the growth rate of compensation of employees.
During the period under review, gross operating surplus and mixed income increased by €234.3 million or 10.6 per cent during the fi rst half of 2017 compared to an increase of 8.0 per cent recorded during the same comparable period last year. This positive development meant that the ratio of gross operating surplus to GDP at market prices continued on its upward trajectory, reaching 47.0 per cent in the fi rst half of 2017. The stronger distribution of earnings to non-wage income is typical during an economic boom as profi t shares tend to be pro-cyclical and absorb much of the negative shock during recessionary periods.
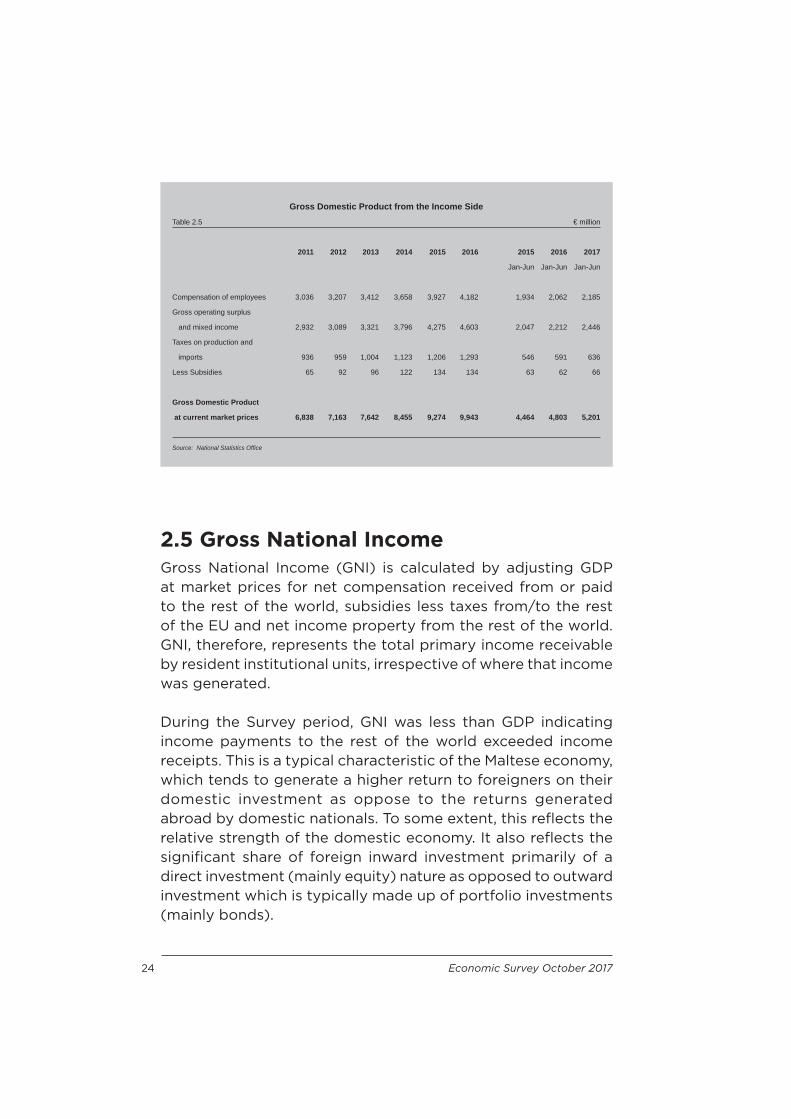
At the same time, taxes on production and imports increased by €44.4 million or 7.5 per cent, while subsidies increased by €3.8 million or 6.1 per cent over the levels recorded in the fi rst half of 2016. Consequently, net taxes increased by €40.6 million or 7.7 per cent during the fi rst half of 2017. Developments in nominal GDP from the Income Side Approach are presented in Table 2.5.
24 Economic Survey October 2017
2.5 Gross National IncomeGross National Income (GNI) is calculated by adjusting GDP at market prices for net compensation received from or paid to the rest of the world, subsidies less taxes from/to the rest of the EU and net income property from the rest of the world. GNI, therefore, represents the total primary income receivable by resident institutional units, irrespective of where that income was generated. During the Survey period, GNI was less than GDP indicating income payments to the rest of the world exceeded income receipts. This is a typical characteristic of the Maltese economy, which tends to generate a higher return to foreigners on their domestic investment as oppose to the returns generated abroad by domestic nationals. To some extent, this refl ects the relative strength of the domestic economy. It also refl ects the signifi cant share of foreign inward investment primarily of a direct investment (mainly equity) nature as opposed to outward investment which is typically made up of portfolio investments (mainly bonds).
Gross Domestic Product from the Income SideTable 2.5 € million
2011 2012 2013 2014 2015 2016 2015 2016 2017
Jan-Jun Jan-Jun Jan-Jun
Compensation of employees 3,036 3,207 3,412 3,658 3,927 4,182 1,934 2,062 2,185
Gross operating surplus
and mixed income 2,932 3,089 3,321 3,796 4,275 4,603 2,047 2,212 2,446
Taxes on production and
imports 936 959 1,004 1,123 1,206 1,293 546 591 636
Less Subsidies 65 92 96 122 134 134 63 62 66
Gross Domestic Product
at current market prices 6,838 7,163 7,642 8,455 9,274 9,943 4,464 4,803 5,201
Source: National Statistics Offi ce
Economic Survey October 2017 25
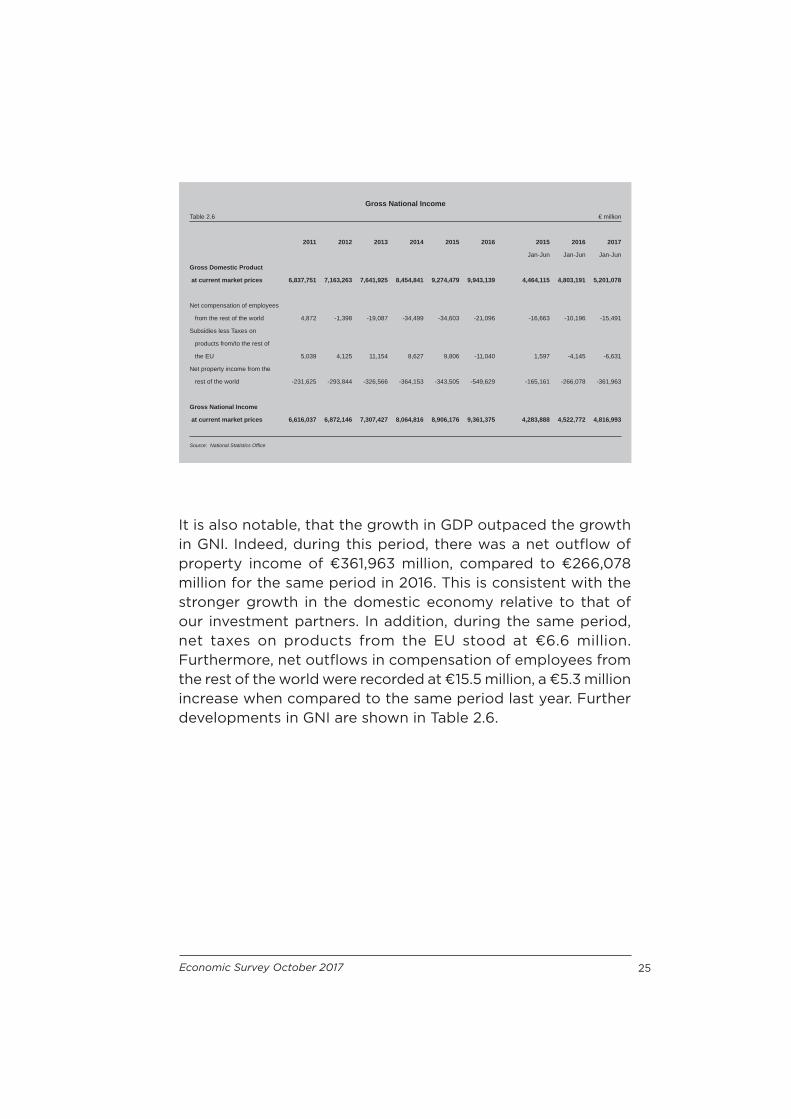
It is also notable, that the growth in GDP outpaced the growth in GNI. Indeed, during this period, there was a net outfl ow of property income of €361,963 million, compared to €266,078 million for the same period in 2016. This is consistent with the stronger growth in the domestic economy relative to that of our investment partners. In addition, during the same period, net taxes on products from the EU stood at €6.6 million. Furthermore, net outfl ows in compensation of employees from the rest of the world were recorded at €15.5 million, a €5.3 million increase when compared to the same period last year. Further developments in GNI are shown in Table 2.6.
Gross National IncomeTable 2.6 € million
2011 2012 2013 2014 2015 2016 2015 2016 2017
Jan-Jun Jan-Jun Jan-Jun
Gross Domestic Product
at current market prices 6,837,751 7,163,263 7,641,925 8,454,841 9,274,479 9,943,139 4,464,115 4,803,191 5,201,078
Net compensation of employees
from the rest of the world 4,872 -1,398 -19,087 -34,499 -34,603 -21,096 -16,663 -10,196 -15,491
Subsidies less Taxes on
products from/to the rest of
the EU 5,039 4,125 11,154 8,627 9,806 -11,040 1,597 -4,145 -6,631
Net property income from the
rest of the world -231,625 -293,844 -326,566 -364,153 -343,505 -549,629 -165,161 -266,078 -361,963
Gross National Income
at current market prices 6,616,037 6,872,146 7,307,427 8,064,816 8,906,176 9,361,375 4,283,888 4,522,772 4,816,993
Source: National Statistics Offi ce


3. Employment

Economic Survey October 2017 29
3. EmploymentThis Chapter presents an overview of developments in the labour market, covering the period 2014 to 2016 as well as the fi rst quarter of 2017. The aggregate indicators are based on the Labour Force Survey (LFS) since this allows for comparison across European Union (EU) Member States. Administrative records of Jobs Plus are utilised in order to analyse sectoral developments1.
3.1 Labour Market Developments Between March 2016 and March 2017, the number of people participating in the labour market continued to increase. This positive development was observed with declines in the unemployment rate. In line with past trends, employment growth has been mostly concentrated in the services sector.
3.1.1 Recent Employment TrendsAt the end of March 2017, the labour supply stood at 201,876, refl ecting an increase of 5,007 or 2.5 per cent over March 2016. Meanwhile, total employment increased by 6,279 or 3.4 per cent to reach 193,450 at the end of the quarter. This means that the positive trend noted in recent years was sustained in recent months. A summary of the main labour market indicators is outlined in Table 3.1.
The increase in employment refl ected an increase in female employment of 3,622 or 5.0 per cent, from 71,954 in the fi rst quarter of 2016 to 75,576 in the fi rst quarter of 2017, as well as an increase in male employment of 2,657 or 2.3 per cent to 117,874 in the fi rst quarter of 2017. As a result, male employment accounted for 60.9 per cent of total employment while female employment accounted for the remaining 39.1 per cent, an increase of 0.6 percentage points over last years’ percentage.
In the meantime, during the fi rst quarter of 2017, labour supply for females improved by 3,322 or 4.4 per cent to 79,139, while

30 Economic Survey October 2017
labour supply for men increased by 1,685 or 1.4 per cent. Employment growth was also in general sustained by women. It is pertinent to note, that during the fi rst quarter of 2017, the percentage increase of females in employment exceeded that in the labour force thus sustaining the underlying trend of a rising female employment rate. By the end of the fi rst quarter of this year, the unemployment rate stood at 4.2 per cent, 0.7 percentage points lower than that recorded in the fi rst quarter of 2016.
In the fi rst quarter of 2017, the share of full-time employment amounted to 85.7 per cent, registering an increase of 5,582 or 3.5 per cent over the corresponding period of the previous year.
Labour Market Performance (Persons aged 15 and over)Labour Force Survey
Table 3.1
2014 2015 2016 2016 2017Jan-Mar Jan-Mar
Labour Supply 192,984 197,182 201,329 196,869 201,876Male 119,166 121,589 122,467 121,052 122,737Female 73,818 75,593 78,862 75,817 79,139
Employment 181,796 186,897 192,807 187,171 193,450Male 111,913 115,315 117,975 115,217 117,874Female 69,883 71,582 74,832 71,954 75,576
Unemployment 11,188 10,285 8,522 9,698 8,426Male 7,253 6,274 4,492 5,835 4,863Female 3,935 4,011 4,030 3,863 3,563
Inactive Persons 164,342 164,916 165,180 165,761 166,456Male 59,060 59,172 60,955 60,585 61,983Female 105,282 105,744 104,225 105,176 104,473
Unemployment Rate 5.8 5.2 4.2 4.9 4.2Male 6.1 5.2 3.7 4.8 4.0Female 5.3 5.3 5.1 5.1 4.5
The methodology applied for annual estimates used by Eurostat is different than that used by the NSO thus the fi gures may differ slightly.
Source: National Statistics Offi ce

Economic Survey October 2017 31
Distribution of Employed Persons by Type of Employment in Main Occupation
Table 3.2
2014 2015 2016 2016 2017Jan-Mar Jan-Mar
Full-time job 151,683 156,844 163,714 160,160 165,742Full-time job with reduced hours job 5,327 5,104 5,127 4,964 5,022Part-time job 24,786 23,982 23,217 22,047 22,686
Total 181,796 185,930 192,058 187,171 193,450
Source: National Statistics Offi ce
Meanwhile, part-time employment registered an increase of 639 or 2.9 per cent during the same period under review. Overall, between 2014 and 2016, the employment contract distribution has remained fairly stable. More detailed data can be found in Table 3.2.
The employment rate (defined as the number of persons engaged in employment as a percentage of the population of working-age) stood at 65.9 per cent; following an increase of 1.5 percentage points over the fi rst quarter of 2017. As shown in Table 3.3, this refl ected an increase in both the female and male employment rate, with the increase in female employment rate outweighing that of males.
Turning to the age distribution of the employment rate, the highest employment rate (79.8 per cent) was observed in the age group 25-54, followed by the age groups 15-24 (45.5 per cent), and 55-64 (41.2 per cent). The youngest group exhibited the narrowest gender gap, while the older cohort had the widest gender gap in the employment rate.

32 Economic Survey October 2017
3.1.2 Developments in the Unemployment RateAccording to the LFS, during the fi rst quarter of 2017, the number of unemployed persons stood at 8,426, following a decrease of 1,272 when compared to the fi rst quarter a year earlier. Consequently, as shown in Table 3.4 the unemployment rate (defi ned as unemployed persons as a percentage of the labour force) decreased by 0.7 percentage points to 4.2 per cent when compared to the 4.9 per cent registered in the same period a year earlier. The observed developments registered between the fi rst quarter of 2016 and the same quarter of 2017, refl ect increases in job creation which exceeded the rising labour force participation,
Employment Rates by AgeTable 3.3 per cent
2014 2015 2016 2016 2017Jan-Mar Jan-Mar
Total (15-64) 62.4 63.9 65.8 64.3 65.9Male 74.9 76.2 78.3 76.9 78.0Female 49.5 51.0 52.7 51.2 53.1
15-24 46.2 45.6 46.1 45.0 45.5Male 45.7 45.9 48.4 46.0 49.0Female 46.8 45.2 43.8 44.0 42.0
25-54 75.9 77.4 78.8 77.7 79.8Male 90.6 91.3 92.5 92.1 91.9Female 60.6 62.9 64.3 62.6 66.9
55-64 37.8 40.4 44.1 42.0 41.2Male 55.7 58.9 61.8 59.3 59.7Female 19.9 21.9 26.4 24.4 22.2
The methodology applied to the activity and/or the employment rate used by Eurostat is different than that used by the NSO thus the fi gures may differ slightly.
Source: National Statistics Offi ce
Economic Survey October 2017 33
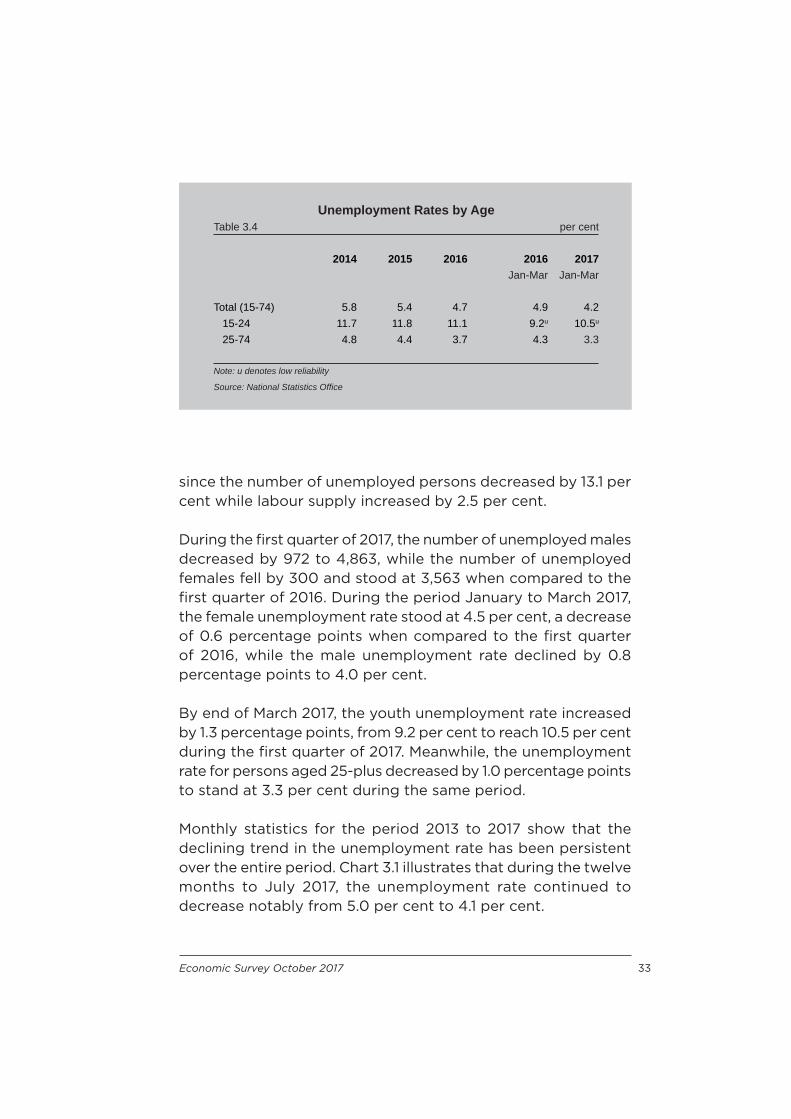
since the number of unemployed persons decreased by 13.1 per cent while labour supply increased by 2.5 per cent.
During the fi rst quarter of 2017, the number of unemployed males decreased by 972 to 4,863, while the number of unemployed females fell by 300 and stood at 3,563 when compared to the fi rst quarter of 2016. During the period January to March 2017, the female unemployment rate stood at 4.5 per cent, a decrease of 0.6 percentage points when compared to the fi rst quarter of 2016, while the male unemployment rate declined by 0.8 percentage points to 4.0 per cent.
By end of March 2017, the youth unemployment rate increased by 1.3 percentage points, from 9.2 per cent to reach 10.5 per cent during the fi rst quarter of 2017. Meanwhile, the unemployment rate for persons aged 25-plus decreased by 1.0 percentage points to stand at 3.3 per cent during the same period.
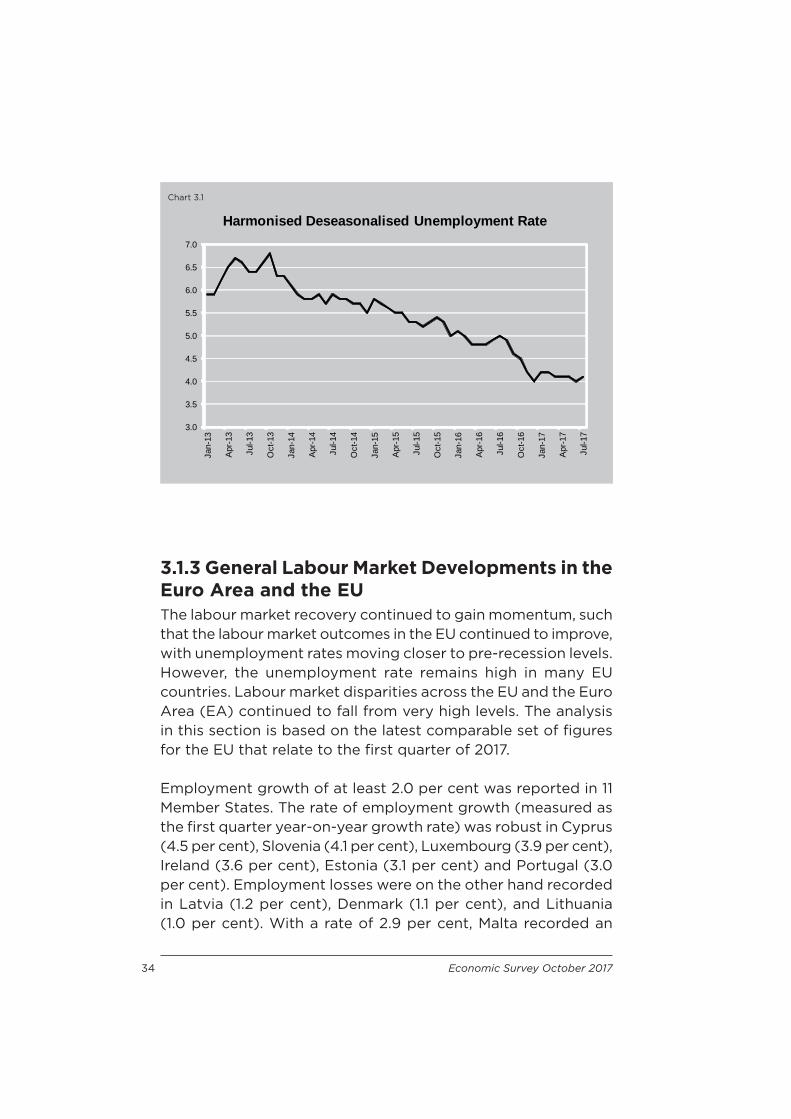
Monthly statistics for the period 2013 to 2017 show that the declining trend in the unemployment rate has been persistent over the entire period. Chart 3.1 illustrates that during the twelve months to July 2017, the unemployment rate continued to decrease notably from 5.0 per cent to 4.1 per cent.
Unemployment Rates by AgeTable 3.4 per cent
2014 2015 2016 2016 2017Jan-Mar Jan-Mar
Total (15-74) 5.8 5.4 4.7 4.9 4.215-24 11.7 11.8 11.1 9.2u 10.5u
25-74 4.8 4.4 3.7 4.3 3.3
Note: u denotes low reliability
Source: National Statistics Offi ce
34 Economic Survey October 2017
3.1.3 General Labour Market Developments in the Euro Area and the EUThe labour market recovery continued to gain momentum, such that the labour market outcomes in the EU continued to improve, with unemployment rates moving closer to pre-recession levels. However, the unemployment rate remains high in many EU countries. Labour market disparities across the EU and the Euro Area (EA) continued to fall from very high levels. The analysis in this section is based on the latest comparable set of fi gures for the EU that relate to the fi rst quarter of 2017.
Employment growth of at least 2.0 per cent was reported in 11 Member States. The rate of employment growth (measured as the fi rst quarter year-on-year growth rate) was robust in Cyprus (4.5 per cent), Slovenia (4.1 per cent), Luxembourg (3.9 per cent), Ireland (3.6 per cent), Estonia (3.1 per cent) and Portugal (3.0 per cent). Employment losses were on the other hand recorded in Latvia (1.2 per cent), Denmark (1.1 per cent), and Lithuania (1.0 per cent). With a rate of 2.9 per cent, Malta recorded an
Chart 3.1
3.0
3.5
4.0
4.5
5.0
5.5
6.0
6.5
7.0
Jan-
13
Apr
-13
Jul-1
3
Oct
-13
Jan-
14
Apr
-14
Jul-1
4
Oct
-14
Jan-
15
Apr
-15
Jul-1
5
Oct
-15
Jan-
16
Apr
-16
Jul-1
6
Oct
-16
Jan-
17
Apr
-17
Jul-1
7
Harmonised Deseasonalised Unemployment Rate
Economic Survey October 2017 35
employment growth rate higher than that of the EU28 (1.2 per cent) and EA (1.1 per cent) averages.
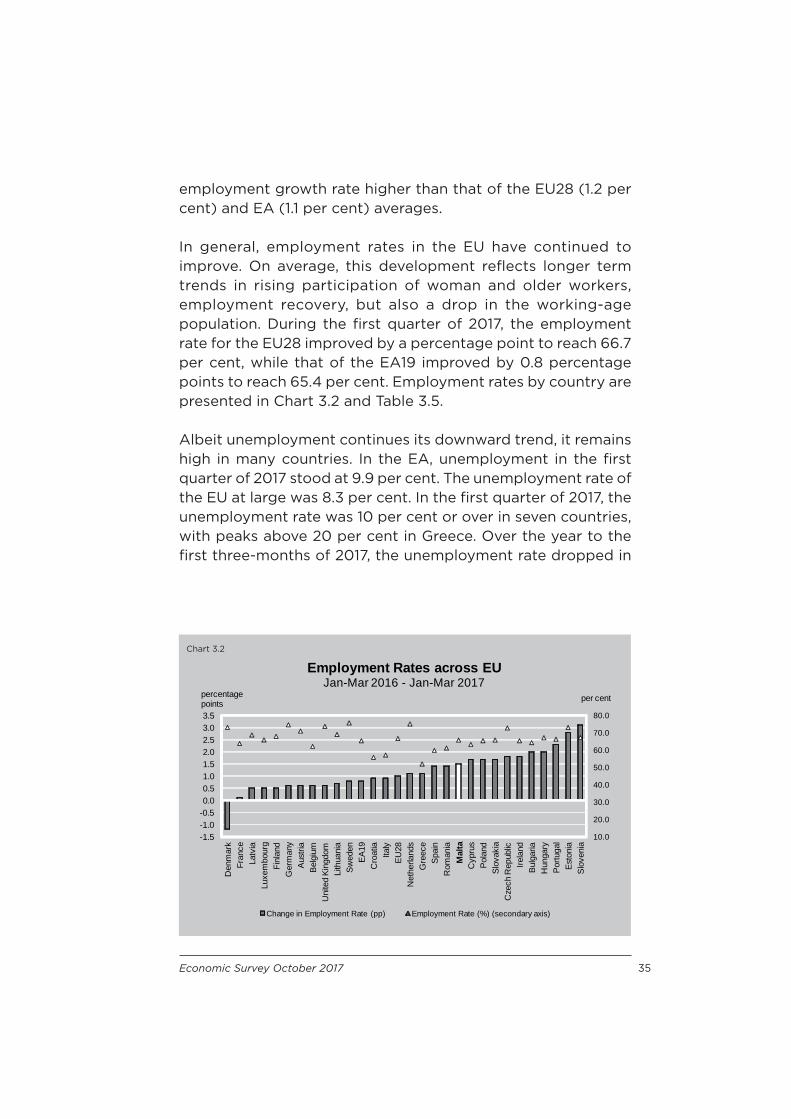
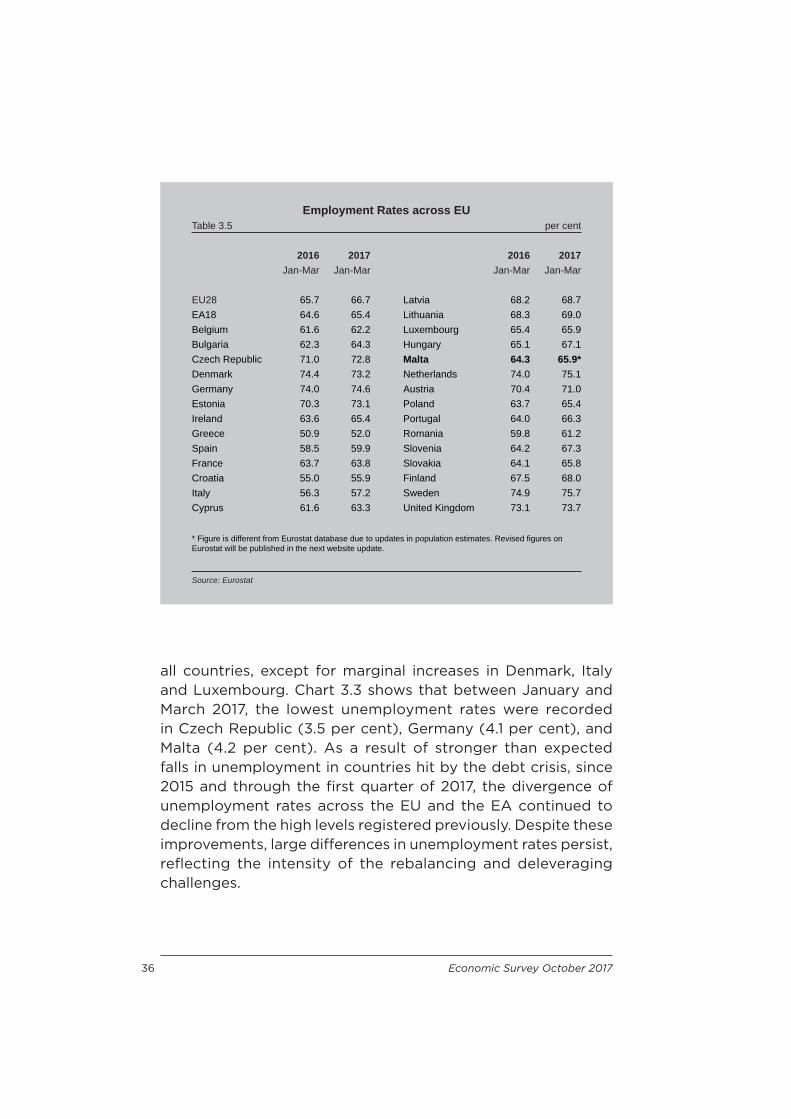
In general, employment rates in the EU have continued to improve. On average, this development refl ects longer term trends in rising participation of woman and older workers, employment recovery, but also a drop in the working-age population. During the fi rst quarter of 2017, the employment rate for the EU28 improved by a percentage point to reach 66.7 per cent, while that of the EA19 improved by 0.8 percentage points to reach 65.4 per cent. Employment rates by country are presented in Chart 3.2 and Table 3.5.
Albeit unemployment continues its downward trend, it remains high in many countries. In the EA, unemployment in the fi rst quarter of 2017 stood at 9.9 per cent. The unemployment rate of the EU at large was 8.3 per cent. In the fi rst quarter of 2017, the unemployment rate was 10 per cent or over in seven countries, with peaks above 20 per cent in Greece. Over the year to the fi rst three-months of 2017, the unemployment rate dropped in
Chart 3.2
10.0
20.0
30.0
40.0
50.0
60.0
70.0
80.0
-1.5-1.0-0.50.00.51.01.52.02.53.03.5
Den
mar
kFr
ance
Latv
iaLu
xem
bour
gFi
nlan
dG
erm
any
Aus
tria
Bel
gium
Uni
ted
Kin
gdom
Lith
uani
aS
wed
enE
A19
Cro
atia
Italy
EU
28N
ethe
rland
sG
reec
eS
pain
Rom
ania
Cyp
rus
Pol
and
Slo
vaki
aC
zech
Rep
ublic
Irela
ndB
ulga
riaH
unga
ryP
ortu
gal
Est
onia
Slo
veni
a
Employment Rates across EUJan-Mar 2016 - Jan-Mar 2017
Change in Employment Rate (pp) Employment Rate (%) (secondary axis)
percentage points
Mal
ta
per cent
36 Economic Survey October 2017
Employment Rates across EUTable 3.5 per cent
2016 2017 2016 2017Jan-Mar Jan-Mar Jan-Mar Jan-Mar
EU28 65.7 66.7 Latvia 68.2 68.7EA18 64.6 65.4 Lithuania 68.3 69.0Belgium 61.6 62.2 Luxembourg 65.4 65.9Bulgaria 62.3 64.3 Hungary 65.1 67.1Czech Republic 71.0 72.8 Malta 64.3 65.9*Denmark 74.4 73.2 Netherlands 74.0 75.1Germany 74.0 74.6 Austria 70.4 71.0Estonia 70.3 73.1 Poland 63.7 65.4Ireland 63.6 65.4 Portugal 64.0 66.3Greece 50.9 52.0 Romania 59.8 61.2Spain 58.5 59.9 Slovenia 64.2 67.3France 63.7 63.8 Slovakia 64.1 65.8Croatia 55.0 55.9 Finland 67.5 68.0Italy 56.3 57.2 Sweden 74.9 75.7Cyprus 61.6 63.3 United Kingdom 73.1 73.7
* Figure is different from Eurostat database due to updates in population estimates. Revised fi gures on Eurostat will be published in the next website update.
Source: Eurostat
all countries, except for marginal increases in Denmark, Italy and Luxembourg. Chart 3.3 shows that between January and March 2017, the lowest unemployment rates were recorded in Czech Republic (3.5 per cent), Germany (4.1 per cent), and Malta (4.2 per cent). As a result of stronger than expected falls in unemployment in countries hit by the debt crisis, since 2015 and through the fi rst quarter of 2017, the divergence of unemployment rates across the EU and the EA continued to decline from the high levels registered previously. Despite these improvements, large diff erences in unemployment rates persist, refl ecting the intensity of the rebalancing and deleveraging challenges.
Economic Survey October 2017 37
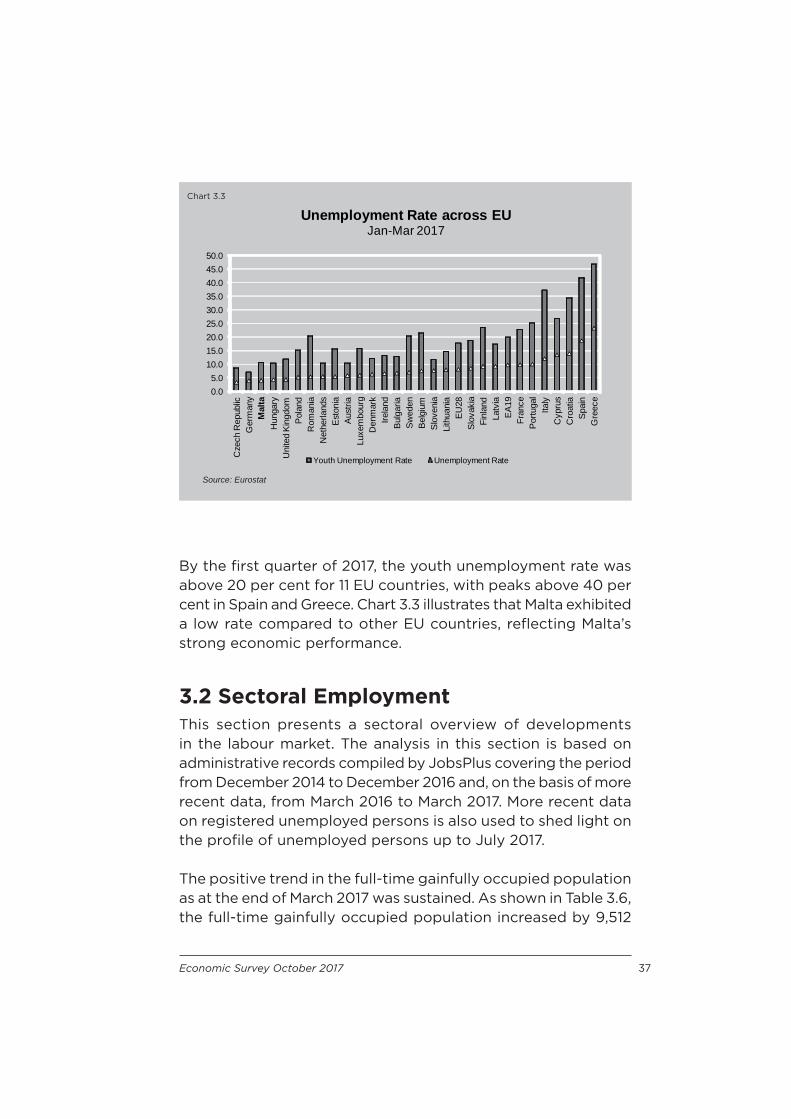
By the fi rst quarter of 2017, the youth unemployment rate was above 20 per cent for 11 EU countries, with peaks above 40 per cent in Spain and Greece. Chart 3.3 illustrates that Malta exhibited a low rate compared to other EU countries, refl ecting Malta’s strong economic performance.
3.2 Sectoral EmploymentThis section presents a sectoral overview of developments in the labour market. The analysis in this section is based on administrative records compiled by JobsPlus covering the period from December 2014 to December 2016 and, on the basis of more recent data, from March 2016 to March 2017. More recent data on registered unemployed persons is also used to shed light on the profi le of unemployed persons up to July 2017.
The positive trend in the full-time gainfully occupied population as at the end of March 2017 was sustained. As shown in Table 3.6, the full-time gainfully occupied population increased by 9,512
Chart 3.3
Source: Eurostat
0.05.0
10.015.020.025.030.035.040.045.050.0
Cze
ch R
epub
licG
erm
any
Hun
gary
Uni
ted
Kin
gdom
Pol
and
Rom
ania
Net
herla
nds
Est
onia
Aus
tria
Luxe
mbo
urg
Den
mar
kIre
land
Bul
garia
Sw
eden
Bel
gium
Slo
veni
aLi
thua
nia
EU
28S
lova
kia
Finl
and
Latv
iaE
A19
Fran
ceP
ortu
gal
Italy
Cyp
rus
Cro
atia
Spa
inG
reec
e
Unemployment Rate across EUJan-Mar 2017
Youth Unemployment Rate Unemployment Rate
Mal
ta

38 Economic Survey October 2017
or 5.3 per cent to reach 187,334 by the end of the fi rst quarter of 2017. During the year-long period March 2016 to March 2017, the private and public sector gainfully occupied population inclusive of temporary employees increased by 8,576 or 6.4 per cent and 936 or 2.1 per cent, respectively; thus underscoring that the increase in full-time employment was mainly driven by the private sector.
Overall, the observed developments over the year to March 2017 are in part a continuation of past trends. Indeed, during the period December 2014 to December 2016, total private and public sector employment expanded by 17,063 and 749, respectively. In March 2017, private sector employment accounted for 75.8 per cent of the total gainfully occupied while the share of public sector employment in the gainfully occupied population decreased by 0.8 percentage points to 24.2 per cent, when compared to March 2016.
Table 3.6 shows that during the year to March 2017 and throughout the three-year period to December 2016, the increase in full-time employment was mainly due to positive developments in market services. In fact, between March 2016 and March 2017 total employment in market services activities increased by 9,016 or 6.3 per cent, while the gainfully occupied population in direct production increased by 496 or 1.4 per cent, over the same period. These developments are in line with the trends noted in previous years. Indeed, between December 2014 and December 2016, employment in market services increased by 15,809 or 11.9 per cent, whilst gainfully occupied in direct production rose by 2,003 or 6.0 per cent, highlighting the fact that over the years Malta has become more services-oriented.
On a gender basis, the increase in the gainfully-occupied population recorded over recent years was in general driven by both males and females. In fact, during the year to March 2017, the male component in gainful employment increased by 4,688 or 4.2 per cent, while the female component rose by 4,824 or 7.3 per cent. Consequently, the share of males in full-time employment declined from 62.9 per cent to 62.2 per cent,
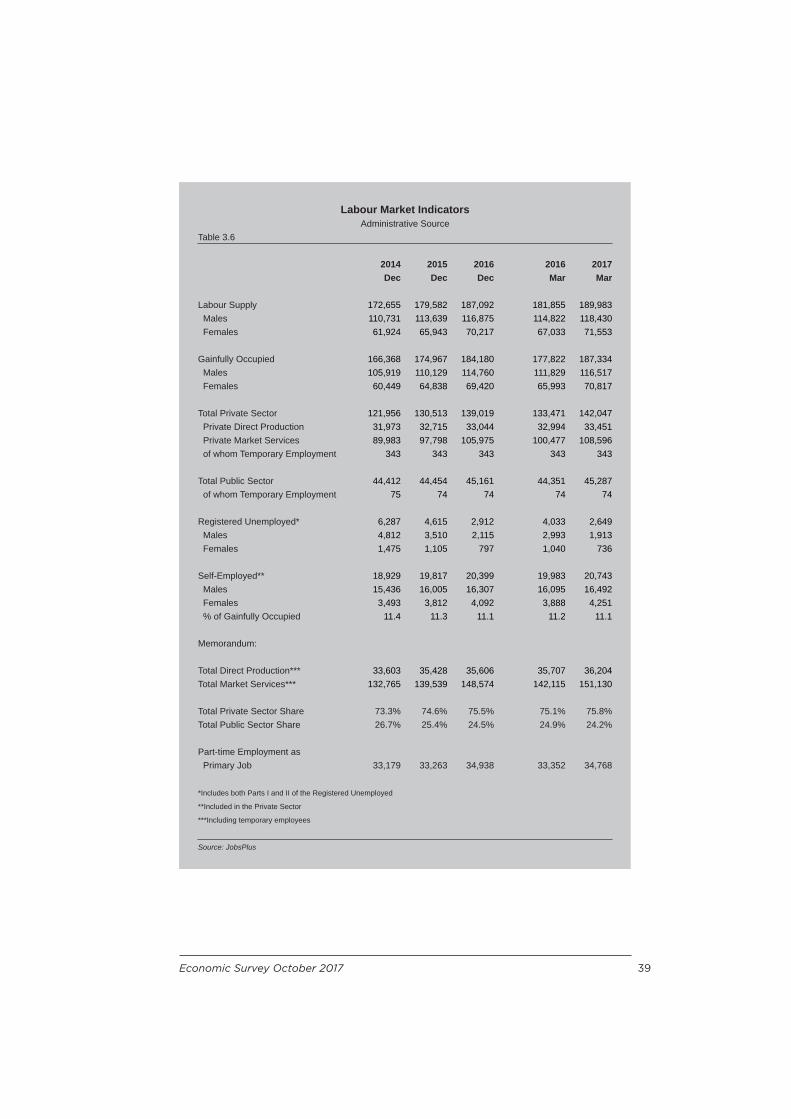
Economic Survey October 2017 39
Labour Market IndicatorsAdministrative Source
Table 3.6
2014 2015 2016 2016 2017Dec Dec Dec Mar Mar
Labour Supply 172,655 179,582 187,092 181,855 189,983 Males 110,731 113,639 116,875 114,822 118,430 Females 61,924 65,943 70,217 67,033 71,553
Gainfully Occupied 166,368 174,967 184,180 177,822 187,334 Males 105,919 110,129 114,760 111,829 116,517 Females 60,449 64,838 69,420 65,993 70,817
Total Private Sector 121,956 130,513 139,019 133,471 142,047 Private Direct Production 31,973 32,715 33,044 32,994 33,451 Private Market Services 89,983 97,798 105,975 100,477 108,596 of whom Temporary Employment 343 343 343 343 343
Total Public Sector 44,412 44,454 45,161 44,351 45,287 of whom Temporary Employment 75 74 74 74 74
Registered Unemployed* 6,287 4,615 2,912 4,033 2,649 Males 4,812 3,510 2,115 2,993 1,913 Females 1,475 1,105 797 1,040 736
Self-Employed** 18,929 19,817 20,399 19,983 20,743 Males 15,436 16,005 16,307 16,095 16,492 Females 3,493 3,812 4,092 3,888 4,251 % of Gainfully Occupied 11.4 11.3 11.1 11.2 11.1
Memorandum:
Total Direct Production*** 33,603 35,428 35,606 35,707 36,204Total Market Services*** 132,765 139,539 148,574 142,115 151,130
Total Private Sector Share 73.3% 74.6% 75.5% 75.1% 75.8%Total Public Sector Share 26.7% 25.4% 24.5% 24.9% 24.2%
Part-time Employment as Primary Job 33,179 33,263 34,938 33,352 34,768
*Includes both Parts I and II of the Registered Unemployed
**Included in the Private Sector
***Including temporary employees
Source: JobsPlus

40 Economic Survey October 2017
while the share of females in full-time employment rose from 37.1 per cent to 37.8 per cent.
The self-employed population stood at 20,743, reflecting increase of 760 or 3.8 per cent over March 2016 . The share of self-employed in the total gainfully occupied population has been stable over the past twelve months at 11.1 per cent, even if some marginal decreases in the share were recorded in relation to the rate reported in 2014. The increase in the number of self-employed originated both from males and females. The number of male self-employed stood at 16,492, refl ecting an increase of 397 or 2.5 per cent over March 2016. During the same period, the number of female self-employed increased by 363 or 9.3 per cent to stand at 4,251.
3.3 Private Sector EmploymentSectoral employment shifts over the period March 2016 to March 2017 and over the period 2014 to 2016 are towards services-orientated industries. The increase recorded in employment in the private sector (inclusive of temporary employees) over the one-year period March 2016 to March 2017 illustrates that the upward trend that followed during the past three years was also sustained in the recent months. This increase in private sector employment refl ected a signifi cant expansion in employment in the private market services category and to a lesser extent, an increase in employment in the private direct production activities category.
During the year to March 2017, as observed in Table 3.7, employment in private direct production stood at 33,451, an increase of 457 or 1.4 per cent over March 2016. Meanwhile, employment in private market services at the end of March 2017 stood at 108,596, an increase of 8,119 or 8.1 per cent over March 2016. This is shown in Table 3.9. Consequently, at the end of March 2017, the share of private direct production in total private sector employment stood at 23.5 per cent, a decrease of 1.2 percentage points over a year earlier. Meanwhile, by the end

Economic Survey October 2017 41
Private Sector Employment - Direct ProductionTable 3.7
2014 2015 2016 2016 2017Dec Dec Dec Mar Mar
Agriculture, forestry and fi shing 1,838 1,865 1,931 1,880 1,917Mining and Quarrying 365 381 365 380 372Manufacturing 20,334 20,486 20,534 20,640 20,727Electricity, gas, steam and air conditioning supply 6 23 40 25 54Water supply and waste management 339 368 348 364 355Construction 9,091 9,592 9,826 9,705 10,026
Total Employment in Direct Production 31,973 32,715 33,044 32,994 33,451
* Including temporary employees
Source: JobsPlus
Contribution to Growth in Private Sector Employment*Direct Production
Table 3.8 per cent
Dec-2015/ Dec-2016/ Mar-2017/Dec-14 Dec-15 Mar-2016
Agriculture, forestry and fi shing 0.1 0.2 0.1Mining and Quarrying 0.1 -0.0 -0.0Manufacturing 0.5 0.1 0.3Electricity, gas, steam and air conditioning supply 0.1 0.1 0.1Water supply and waste management 0.1 -0.1 -0.0Construction 1.6 0.7 1.0
Total 2.3 1.0 1.4
* Including temporary employees
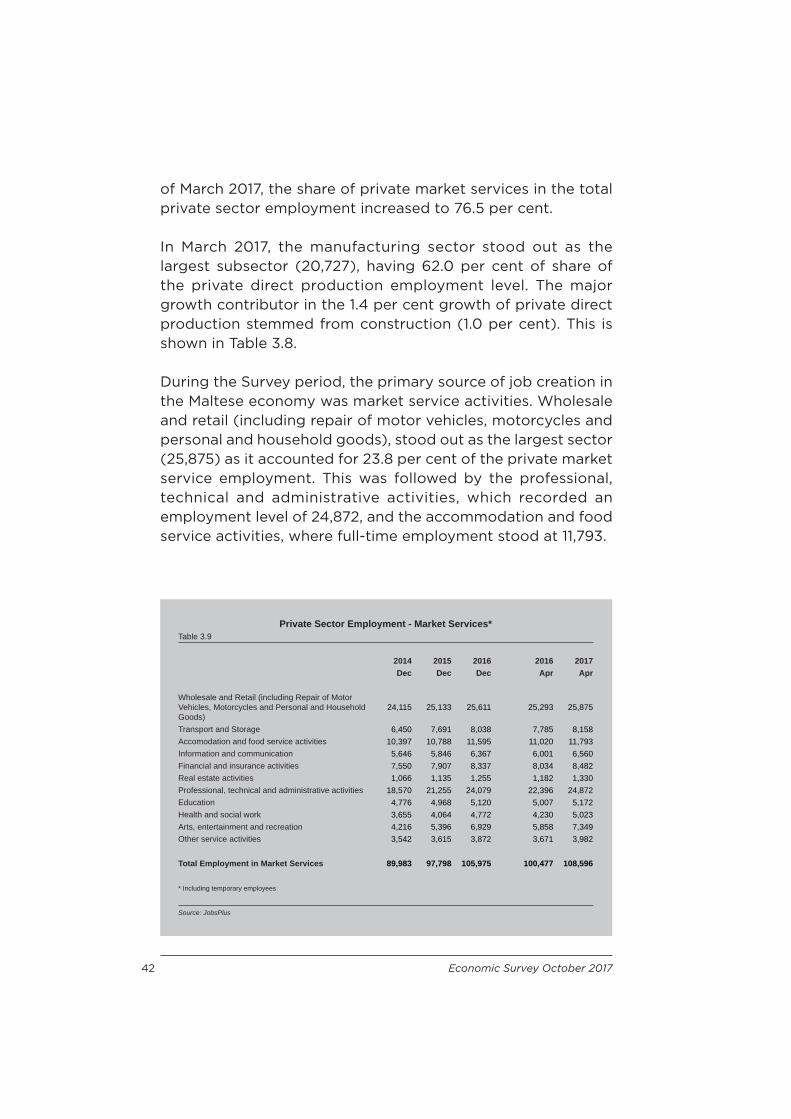
42 Economic Survey October 2017
Private Sector Employment - Market Services*Table 3.9
2014 2015 2016 2016 2017Dec Dec Dec Apr Apr
Wholesale and Retail (including Repair of Motor Vehicles, Motorcycles and Personal and Household Goods)
24,115 25,133 25,611 25,293 25,875
Transport and Storage 6,450 7,691 8,038 7,785 8,158Accomodation and food service activities 10,397 10,788 11,595 11,020 11,793Information and communication 5,646 5,846 6,367 6,001 6,560Financial and insurance activities 7,550 7,907 8,337 8,034 8,482Real estate activities 1,066 1,135 1,255 1,182 1,330Professional, technical and administrative activities 18,570 21,255 24,079 22,396 24,872Education 4,776 4,968 5,120 5,007 5,172Health and social work 3,655 4,064 4,772 4,230 5,023Arts, entertainment and recreation 4,216 5,396 6,929 5,858 7,349Other service activities 3,542 3,615 3,872 3,671 3,982
Total Employment in Market Services 89,983 97,798 105,975 100,477 108,596
* Including temporary employees
Source: JobsPlus
of March 2017, the share of private market services in the total private sector employment increased to 76.5 per cent.
In March 2017, the manufacturing sector stood out as the largest subsector (20,727), having 62.0 per cent of share of the private direct production employment level. The major growth contributor in the 1.4 per cent growth of private direct production stemmed from construction (1.0 per cent). This is shown in Table 3.8.
During the Survey period, the primary source of job creation in the Maltese economy was market service activities. Wholesale and retail (including repair of motor vehicles, motorcycles and personal and household goods), stood out as the largest sector (25,875) as it accounted for 23.8 per cent of the private market service employment. This was followed by the professional, technical and administrative activities, which recorded an employment level of 24,872, and the accommodation and food service activities, where full-time employment stood at 11,793.
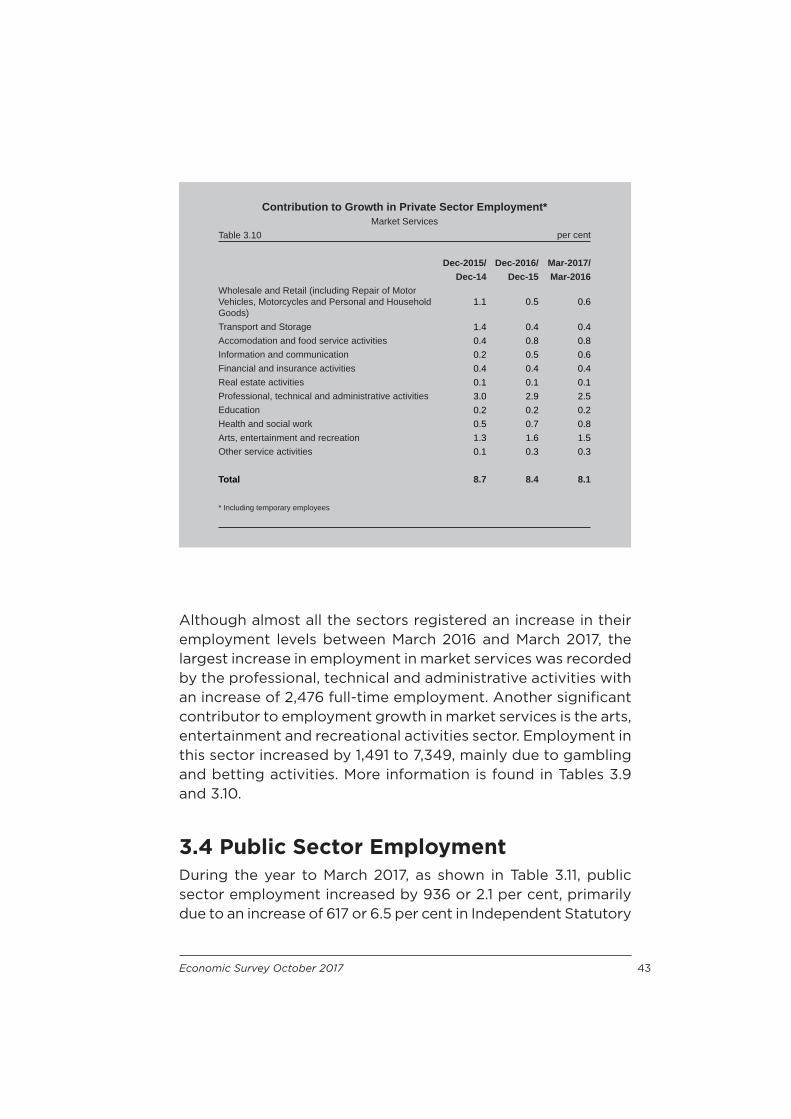
Economic Survey October 2017 43
Contribution to Growth in Private Sector Employment*Market Services
Table 3.10 per cent
Dec-2015/ Dec-2016/ Mar-2017/Dec-14 Dec-15 Mar-2016
Wholesale and Retail (including Repair of Motor Vehicles, Motorcycles and Personal and Household Goods)
1.1 0.5 0.6
Transport and Storage 1.4 0.4 0.4Accomodation and food service activities 0.4 0.8 0.8Information and communication 0.2 0.5 0.6Financial and insurance activities 0.4 0.4 0.4Real estate activities 0.1 0.1 0.1Professional, technical and administrative activities 3.0 2.9 2.5Education 0.2 0.2 0.2Health and social work 0.5 0.7 0.8Arts, entertainment and recreation 1.3 1.6 1.5Other service activities 0.1 0.3 0.3
Total 8.7 8.4 8.1
* Including temporary employees
Although almost all the sectors registered an increase in their employment levels between March 2016 and March 2017, the largest increase in employment in market services was recorded by the professional, technical and administrative activities with an increase of 2,476 full-time employment. Another signifi cant contributor to employment growth in market services is the arts, entertainment and recreational activities sector. Employment in this sector increased by 1,491 to 7,349, mainly due to gambling and betting activities. More information is found in Tables 3.9 and 3.10.
3.4 Public Sector EmploymentDuring the year to March 2017, as shown in Table 3.11, public sector employment increased by 936 or 2.1 per cent, primarily due to an increase of 617 or 6.5 per cent in Independent Statutory

44 Economic Survey October 2017
Bodies employees. A sectoral breakdown of public sector gainfully occupied shows that the increase is mainly attributed to developments in public administration and defence activities and education with some decreases in human health activities. These developments have been aff ected by the revisions to the economic activity classifi cation of government entities, departments and ministries carried out by JobsPlus.
3.5 A Profi le of Registered Unemployed under Part IThe analysis in this section focuses on the registered unemployed under Part I of the unemployment register. Part I of the register includes those who are eligible for work and registering with JobsPlus as jobless. By contrast, Part II includes those who have been dismissed from work due to disciplinary action, left work on their own free will, refused work or training opportunities or were struck off the register after an inspection by the law enforcement personnel.
Public Sector EmploymentTable 3.11
2014 2015 2016 2016 2017Dec Dec Dec Mar Mar
Government Departments 32,716 33,126 33,438 32,973 33,413Companies with public sector 2564 1907 1768 1,892 1,771 majority shareholdingIndependent Statutory Bodies 9,132 9,421 9,955 9,486 10,103
of which Temporary Employees 75 74 74 74 74
Total 44,412 44,454 45,161 44,351 45,287
* Including temporary employees
Source: JobsPlus

Economic Survey October 2017 45
At the end of July 2017, the number of registered unemployed persons under Part I of the Register stood at 2,246, as opposed to 3,049 recorded a year earlier. The decline in the number of unemployed persons was refl ected in both the male and female components. Whilst male unemployment declined by 887 to stand at 1,558, the female component decreased by 227 to stand at 688.
Unemployment register by duration of registration presented in Table 3.12 shows declines in all durations. Notable declines over the year to July 2017 were reported for persons registering for work under 6 months (-407), between 6 to 12 months (-220), over 2 years (-149), and between 1 to 2 years (-27). The share of persons registering for work for more than two years increased from 28.2 per cent to 31.6 per cent, while persons registering for work between 12 to 24 months increased from 14.4 per cent to 18.3 per cent. Meanwhile, the proportion of persons registering for work between 6 to 12 months decreased by 3.6 percentage points to 13.6 per cent, while the proportion of persons registered for work for less than six months decreased from 40.2 per cent to 36.5 per cent.
During the year ending July 2017, the share of youth unemployment, defi ned as those falling in the 16 to 24 age bracket, increased by 2.1 percentage points, from 8.5 per cent to 10.6 per cent, while the share of persons aged 49 or more, increased by 0.6 percentage points, to stand at 41.1 per cent as at July 2017. The share of those between 25 to 49 decreased by 2.7 percentage points to stand at 48.3 per cent in July 2017. Data is presented in Table 3.13.
Data for the registered unemployed classifi ed by occupation as at July 2017, is produced in Table 3.14. A decline was recorded in all occupations over the twelve months to July 2017. The largest drop in unemployment is attributable to the Professionals (200). Notable declines were also registered by crafts and related trade workers (149) and by services and sales workers (147). During the same period, a decrease was also noted in persons registering for clerks and support workers (107).

46 Economic Survey October 2017
Registered Unemployed*by age distribution
Table 3.13
Registered 16 - 24 years 25 - 49 years over 49 yearsUnemployed % % %
2012 (Dec) 6,291 15.8 52.3 32.02013 (Dec) 6,956 15.0 52.5 32.52014 (Dec) 5,889 11.9 52.0 36.12015 (Dec) 4,201 8.0 50.8 41.12016 (Dec) 2,712 11.0 50.1 38.8
2016 (Jul) 3,049 8.5 51.0 40.52017 (Jul) 2,246 10.6 48.3 41.1
*Includes only Part I of the Registered Unemployed
Source: JobsPlus
Registered Unemployed*Table 3.12
Registered under 6 months 6 - 12 months 12 - 24 months over 24 monthsUnemployed % % % %
2012 (Dec) 6,291 42.2 14.4 19.3 24.12013 (Dec) 6,956 38.4 13.3 21.1 27.32014 (Dec) 5,889 37.2 10.6 18.5 33.72015 (Dec) 4,201 37.5 9.2 16.0 37.42016 (Dec) 2,712 38.7 17.5 14.1 29.7
2016 (Jul) 3,049 40.2 17.2 14.4 28.22017 (Jul) 2,246 36.5 13.6 18.3 31.6
*Includes only Part I of the Registered Unemployed
Source: JobsPlus

Economic Survey October 2017 47
3.6 Part-time ActivityPart-time employment based on administrative data continued to increase, such that, at the end of March 2017 total part-time employment stood at 59,761, registering a signifi cant increase of 3,573 or 6.4 per cent when compared to the same month of 2016. As shown in Table 3.15, at the end of March 2017, part-time employment was composed of 31,368 males and 28,393 females.
Registered Unemployed Classifi ed by Occupation* at July 2017
Table 3.14
Part 1 only Registered Unemployed Percentage ShareMales Females Total Males Females Total
Elementary Occupations 142 31 173 9.1% 4.5% 7.7%Plant and machinery 107 33 140 6.9% 4.8% 6.2%operators and assemblersCrafts and related trade workers 238 10 248 15.3% 1.5% 11.0%Skilled agriculture, fi shery 99 0 99 6.4% 0.0% 4.4%and forestry workersServices and sales workers 205 137 342 13.2% 19.9% 15.2%Clerks and support workers 294 259 553 18.9% 37.6% 24.6%Technicians and Associate Professionals 190 128 318 12.2% 18.6% 14.2%Professionals 194 63 257 12.5% 9.2% 11.4%Managers 89 27 116 5.7% 3.9% 5.2%
Total 1,558 688 2,246 100% 100% 100%
Part 1 and Part 2 Registered Unemployed Percentage ShareMales Females Total Males Females Total
Elementary Occupations 160 33 193 9.2% 4.3% 7.7%Plant and machinery 120 36 156 6.9% 4.7% 6.2%operators and assemblersCrafts and related trade workers 258 13 271 14.9% 1.7% 10.8%Skilled agriculture, fi shery 101 0 101 5.8% 0.0% 4.0%and forestry workersServices and sales workers 228 155 383 13.1% 20.3% 15.3%Clerks and support workers 329 289 618 19.0% 37.8% 24.7%Technicians and Associate Professionals 219 140 359 12.6% 18.3% 14.4%Professionals 215 70 285 12.4% 9.2% 11.4%Managers 105 28 133 6.1% 3.7% 5.3%
Total 1,735 764 2,499 100% 100% 100%
Source: JobsPlus

48 Economic Survey October 2017
The number of part-timers holding a full-time job increased by 2,157 or 9.4 per cent over the level recorded in March 2016. The gender distribution shows that, both male and female part-timers holding a full-time job increased, with females registering a higher percentage increase (925 or 12.8 per cent) than males (1,232 or 7.9 per cent). Consequently, the share of males employed as part-timers holding a full-time job in total part-time employment decreased by a percentage point.
Compared to March 2016, the number of part-timers holding a part-time job as their primary occupation increased by 1,416 or 4.2 per cent. Again, statistics on the gender distribution show that, both male and female part-timers holding a part-time job increased by 789 or 5.7 per cent and 627 or 3.2 per cent to 14,522 and 20,246 respectively. Despite this, females continue to hold the largest share of persons holding part-time jobs as their primary occupation.
Part-Time EmploymentTable 3.15
2014 2015 2016 2016 2017Dec Dec Dec Mar Mar
Part-Timers holding a full-time job 22,462 22,801 24,312 22,836 24,993 Males 15,286 15,576 16,408 15,614 16,846 Females 7,176 7,225 7,904 7,222 8,147
Part-Timers as a primary job 33,179 33,263 34,938 33,352 34,768 Males 13,466 13,677 14,636 13,733 14,522 Females 19,713 19,586 20,302 19,619 20,246
Total Part-Time Employment 55,641 56,064 59,250 56,188 59,761 Males 28,752 29,253 31,044 29,347 31,368 Females 26,889 26,811 28,206 26,841 28,393
Source: JobsPlus

Economic Survey October 2017 49
Box 3.1
Developments in Private Sector Employment in Manufacturing
The manufacturing sector includes a wide range of production activities, from small-scale enterprises using traditional production techniques to large enterprises which can reap economies of scale. Over the past years, the Maltese economy has become increasingly service-oriented as the share of market services constitutes the major part of employment in total gainfully occupied population. Nevertheless, manufacturing is still considered important in terms of export market share and its contribution to the economic diversifi cation of Malta. Consequently, an analysis of the manufacturing sector as a whole sheds light on the diverse performance of the manufacturing industry, since it comprises a wide spectrum of activities within the non-fi nancial business sector.
The NACE division level classifi es the manufacturing sector into 24 diff erent subsectors. In March 2017, the largest subsectors in terms of private sector employment were the manufacturing n.e.c., manufacturing of food products, beverages and tobacco, the manufacturing of computer, electronic equipment and machinery, and the manufacturing of rubber, plastic and other non-metallic products.
Private Manufacturing Employment*Table 1
2014 2015 2016 2016 2017Dec Dec Dec Apr Apr
Mfg of Food Products, Beverages and Tobacco 3,389 3,458 3,398 3,436 3,424Mfg of Textiles and Leather Products 643 677 504 636 497Mfg of Wood and Printing 1,872 1,766 1,714 1,724 1,697Mfg of Coke, Chemical and Pharmaceutical Products 1,366 1,456 1,461 1,484 1,413Mfg of Rubber, Plastic and Other Non-Metallic Products 2,735 2,701 2,791 2,763 2,819Mfg of Basic Metals and Fabricated Metal Products 1,325 1,362 1,382 1,372 1,423Mfg of Computer, electronic equipment and machinery 3,180 3,186 3,159 3,193 3,210Mfg of Transport Equipment 1,159 1,203 1,214 1,250 1,238Mfg of Furniture 1,107 1,146 1,124 1,147 1,124Manufacturing n.e.c. 3,558 3,531 3,787 3,635 3,882
Total Manufacturing Employment 20,334 20,486 20,534 20,640 20,727
* Including temporary employees
Source: JobsPlus

50 Economic Survey October 2017
Footnote:
1 The LFS data is not directly comparable to statistics originating from the JobsPlus primarily due to diff erences in the defi nitions and methodology underpinning the two datasets.
Box 3.1 cont.
Table 1 shows that over the year to March 2017, employment in manufacturing increased by 87 individuals and mainly refl ected increases in the manufacturing n.e.c. (i.e. other manufacturing and the repair and installation of machinery and equipment) (247), and declines in employment in manufacturing of textiles and leather products (139).
Between December 2014 and December 2016, the most notable increases were recorded in manufacturing n.e.c. (229). Meanwhile, the manufacturing of wood and printing (-158) and the manufacturing of textiles and leather products (-139) accounted for the most signifi cant declines in the manufacturing sector over the same period.

4. Productive Activities

Economic Survey October 2017 53
4. Productive ActivitiesThis Chapter seeks to review recent economic developments within the industrial sector and includes an in-depth analysis of manufacturing, mining and quarrying, electricity, water supply, and the agriculture and fi sheries.
4.1 Industrial IndicatorsNational Accounts data compiled in accordance to the ESA2010 methodology shows that during the fi rst half of this year, the economy experienced broad based economic growth in all sectors. Growth was recorded in the primary, secondary and the tertiary sectors. Indeed, the industrial sector maintained an encouraging growth rate in its gross GVA of 5.7 per cent, with mining, quarrying and utilities registering double digit growth rates. The agriculture and fisheries sector and the manufacturing sector both recorded an increase of 5.2 per cent in GVA respectively during the same period. Employment in these sectors remained stable during the review period while the compensation of employees experienced an increase of 6.0 per cent with positive growth rates experienced in all the activities which comprise the industrial sector.
The analysis presented in the following sections is based on data pertinent to turnover and the wage bill that have been collected from a sample of approximately 400 enterprises. The derived indicators are subject to statistical sampling errors especially where the response rate is low. Thus, certain sub-sectors are not fully captured for the calculation of the industrial index. Furthermore, since data for Gross Value Added (GVA) represents National Accounts data compiled in accordance to the European Systems of Accounts (ESA2010) methodology, caution must be exercised before comparing the results derived from the questionnaire data to the national accounts data concepts such as GVA.

54 Economic Survey October 2017
The sample-based short-term industrial indicator registered a 2.6 per cent rise in industry turnover, underpinned by a rise of 2.8 per cent and 2.1 per cent in domestic sales and in exports, respectively. The wage bill increased by 1.1 per cent during the same period. These sample results are not refl ected in the National Accounts data as reported above.
4.2 Manufacturing PerformanceThe following section provides a detailed analysis of the performance of the main subsectors within the manufacturing sector during the fi rst seven months of this year, compared to developments recorded during the same period in 2016. It is pertinent to note that, while the reference period for short-term indicators is January-July, that for GVA comprises the fi rst six months of 2017. Furthermore, the fi gures for short-term indicators exclude the activity related to NACE sectors 12, 19 and 241. Chart 4.1 presents developments in GVA by sector of manufacturing for the fi rst half of 2017.
Chart 4.1
-30 -20 -10 0 10 20 30 40
of which:
Manufacture of Food and Beverages
Manufacture of Textiles, Wearing Apparel and Leather Products
Manufacture of Wood, Paper, Printing, Chemicals and Pharmaceutical Products
Manufacture of Rubber, Plastic Products and Other Non-Metallic Mineral Products
Manufacture of Computer, Electronic, Electrical Equipment and Transport Equipment
Manufacture of Furniture, Other Manufacturing, Repair and Installation of Machinery and Equipment
Sectoral Developments in GVA - Manufacturing
Jan-June 2017
Manufacturing

Economic Survey October 2017 55
4.2.1 Manufacture of Food and Beverages During the fi rst six months of 2017, GVA in the manufacture of food and beverages subsector decreased by 2.6 per cent.
Similarly, sampled turnover also declined by 2.6 per cent since the decline in exports outweighed the increase in domestic sales, while the wage bill increased by 1.3 per cent during the fi rst seven months of this year.
4.2.2 Manufacture of Textiles, Wearing Apparel and Leather ProductsThe GVA in the manufacture of textiles, wearing apparel and leather products subsector increased by 4.7 per cent during the January to June 2017 period, in contrast to a decline of 15.5 per cent that was recorded during the same period last year.
Sampled turnover registered a positive increase of 23.5 per cent during the fi rst seven months of this year, halting the decline that was recorded over recent years. This development was largely the result of a 27.5 per cent rise in exports, while domestic sales increased by 6.4 per cent during the same period. In contrast, the wage bill declined by 20.5 per cent.
4.2.3 Manufacture of Wood, Paper, Printing, Chemicals and Pharmaceutical ProductsGVA in the manufacture of wood, paper, printing, chemicals and pharmaceutical products subsector declined by 18.3 per cent during the January to June 2017 period.
Turnover during the fi rst seven months of this year followed a similar trend and fell by 18.7 per cent, being mainly the result of a 24.5 per cent decline in exports that outweighed the 2.5 per cent rise in domestic demand. During the same period, the wage bill declined by 3.9 per cent.

56 Economic Survey October 2017
Activity Indicators for Manufacturing(2010=100)
Table 4.1 % of growth indices
SECTORAL MANUFACTURING INDICES2014 2015 2016 2016(1) 2017(1)
Jan-Jul Jan-Jul
Manufacture of Food and Beverages
Gross Value Added 16.5 8.1 -1.4 2.1 -2.6 Turnover 0.9 3.5 -1.9 -1.4 -2.6 Domestic -0.8 1.7 1.7 2.3 1.0 Exports 7.0 10.1 -14.0 -11.6 -13.8
Wage Bill 4.7 6.4 1.6 0.5 1.3
Manufacture of Textiles, Wearing Apparel and Leather ProductsGross Value Added -22.4 2.5 -15.5 -15.5 4.7 Turnover -26.7 -3.4 -7.8 -17.3 23.5 Domestic 1.6 9.8 -9.6 0.5 6.4 Exports -28.6 -4.4 -6.6 -17.8 27.5
Wage Bill -14.0 -2.7 -15.9 -6.4 -20.5
Manufacture of Wood, Paper, Printing, Chemi-cals and Pharmaceutical ProductsGross Value Added 1.5 2.0 -5.8 -0.5 -18.3 Turnover -15.2 8.1 -6.2 -1.6 -18.7 Domestic -10.6 5.1 -3.6 0.3 2.5 Exports -16.9 9.2 -7.8 -1.8 -24.5
Wage Bill -4.3 -0.5 -5.2 -4.7 -3.9
Manufacture of Rubber, Plastic Products and Other Non-Metallic Mineral ProductsGross Value Added -10.0 4.8 9.6 14.3 5.6 Turnover 6.0 9.9 9.4 11.3 3.9 Domestic 11.3 10.0 11.8 14.6 2.0 Exports -1.6 6.0 5.8 5.8 8.4
Wage Bill 0.4 1.2 8.3 7.0 6.9
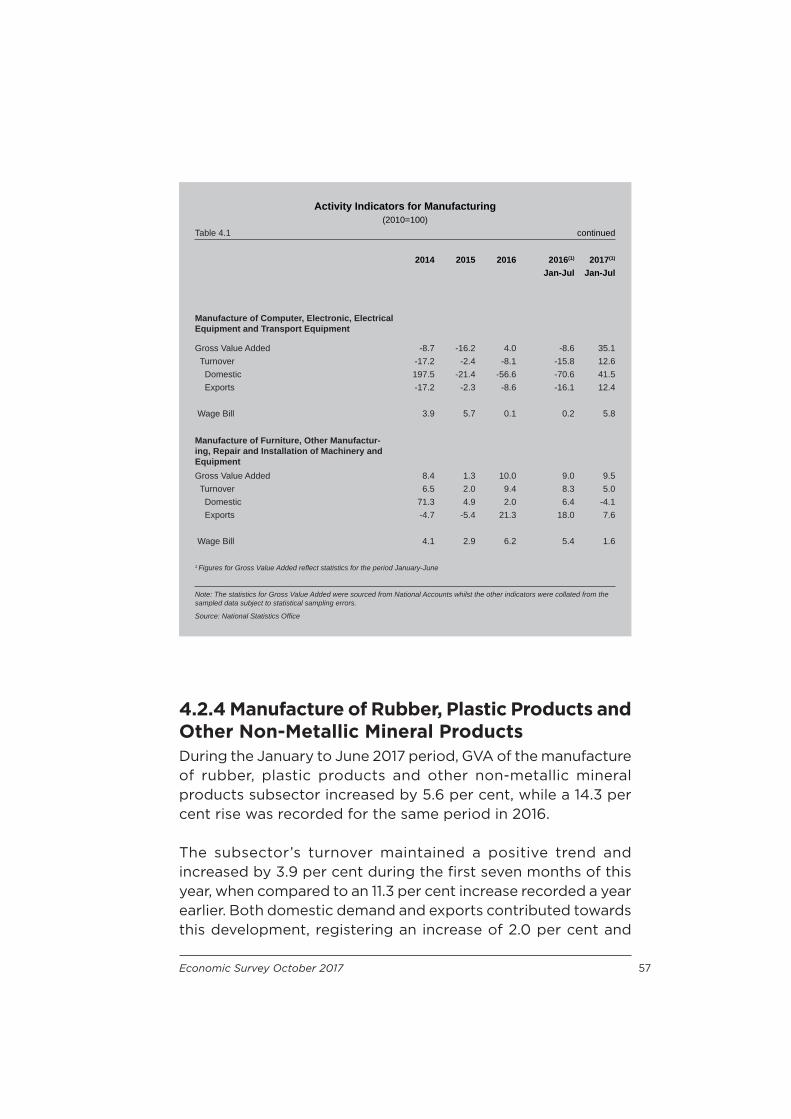
Economic Survey October 2017 57
Activity Indicators for Manufacturing(2010=100)
Table 4.1 continued
2014 2015 2016 2016(1) 2017(1)
Jan-Jul Jan-Jul
Manufacture of Computer, Electronic, Electrical Equipment and Transport Equipment
Gross Value Added -8.7 -16.2 4.0 -8.6 35.1 Turnover -17.2 -2.4 -8.1 -15.8 12.6 Domestic 197.5 -21.4 -56.6 -70.6 41.5 Exports -17.2 -2.3 -8.6 -16.1 12.4
Wage Bill 3.9 5.7 0.1 0.2 5.8
Manufacture of Furniture, Other Manufactur-ing, Repair and Installation of Machinery and EquipmentGross Value Added 8.4 1.3 10.0 9.0 9.5 Turnover 6.5 2.0 9.4 8.3 5.0 Domestic 71.3 4.9 2.0 6.4 -4.1 Exports -4.7 -5.4 21.3 18.0 7.6
Wage Bill 4.1 2.9 6.2 5.4 1.6
1 Figures for Gross Value Added refl ect statistics for the period January-June
Note: The statistics for Gross Value Added were sourced from National Accounts whilst the other indicators were collated from the sampled data subject to statistical sampling errors.
Source: National Statistics Offi ce
4.2.4 Manufacture of Rubber, Plastic Products and Other Non-Metallic Mineral ProductsDuring the January to June 2017 period, GVA of the manufacture of rubber, plastic products and other non-metallic mineral products subsector increased by 5.6 per cent, while a 14.3 per cent rise was recorded for the same period in 2016.
The subsector’s turnover maintained a positive trend and increased by 3.9 per cent during the fi rst seven months of this year, when compared to an 11.3 per cent increase recorded a year earlier. Both domestic demand and exports contributed towards this development, registering an increase of 2.0 per cent and
58 Economic Survey October 2017
8.4 per cent, respectively. Meanwhile, the sector’s wage bill also followed a positive trend, increasing by 6.9 per cent.
4.2.5 Manufacture of Computer, Electronic, Electrical Equipment and Transport EquipmentThe manufacture of computer, electronic, electrical equipment and transport equipment subsector is mainly export-oriented and is largely aff ected by global developments. GVA increased by 35.1 per cent during the fi rst six months of 2017 in contrast to a decline of 8.6 per cent that was recorded for the same period in 2016.
Sampled turnover in the sector registered an increase of 12.6 per cent during the fi rst seven months of this year, reversing the decline recorded over recent years. This was underpinned by higher exports (12.4 per cent) and higher domestic sales (41.5 per cent). Meanwhile, the wage bill increased by 5.8 per cent.
4.2.6 Manufacture of Furniture, Other Manufacturing, Repair and Installation of Machinery and EquipmentThe manufacture of furniture, other manufacturing, repair and installation of machinery and equipment subsector’s GVA increased by 9.5 per cent during the fi rst six months of 2017, following an increase of 9.0 per cent recorded a year earlier.
This performance was refl ected in turnover which rose by 5.0 per cent during the fi rst seven months of 2017, underpinned by an increase of 7.6 per cent in exports that outweighed a 4.1 per cent decline in domestic demand. The wage bill also increased by 1.6 per cent.

Economic Survey October 2017 59
Chart 1
Box 4.1
The Industrial Production Index
The Industrial Production Index measures economic activity based on a sample of 180 industrial enterprises. This indicator, whose index is compiled using 2010 as the base year, monitors the changes in the production of leading products.
During January-July 2017, the overall industrial production index increased by 4.2 per cent, when compared to a decline of 4.5 per cent recorded during the same period a year earlier. This improvement was underpinned by an increase in the production index of the manufacturing sector (4.6 per cent) and the electricity and water supply sector (3.1 per cent) that outweighed the decline recorded in the mining and quarrying sector (-12.9 per cent). Chart 1 depicts the change in the production indices of the main manufacturing subsectors during the fi rst seven months of 2017 when compared to those recorded a year earlier.
The manufacturing sector’s production index registered an increase of 4.6 per cent when compared to a decline of 5.6
-20 -15 -10 -5 0 5 10 15 20 25
of which:
Food products
Printing and reproduction of recorded media
Basic pharmaceutical products
Other non-metallic mineral products
Computer, electronic and optical products
Manufacture of motor vehicles, trailers and semi-trailers
Other manufacturing
Production Index
Annual change Jan-Jul 2017
per cent
Manufacturing
Electricity and water supply
Mining and quarrying
60 Economic Survey October 2017
4.3 Agriculture and FisheriesAgriculture and fi sheries have been a traditional sector in the Maltese islands for a long time, and to this day, they still contribute productively both in terms of growth in their own right, but also as a form of a tourism attraction and local delicacies. As such, this sector retains its importance, both because it supplies the local population with fresh local produce, but also because it adds to the local heritage. This sector’s positive impact on the environment also adds to its value, not least because of the importance of the effi cient and eff ective use of Malta’s limited natural resources as well as for the safeguarding of the local environment.
During the fi rst six months of 2017, the GVA of the agriculture and fi sheries sector increased by 5.2 per cent when compared to that registered in the same period in 2016. This notwithstanding, the contribution of this sector to GVA has remained stable at 1.1 per cent in view of increases in the GVA of other sectors of
Box 4.1 cont.
per cent recorded during the fi rst seven months of last year. Developments in the manufacturing sector’s production index mainly refl ect the increases that were recorded in a number of subsectors, namely, those recorded in the other non-metallic mineral products (21.2 per cent), computer, electronic and optical products (19.0 per cent), rubber and plastic products (15.9 per cent), textiles (14.3 per cent), other manufacturing (12.7 per cent), and the motor vehicles, trailers and semi-trailers (6.8 per cent) subsectors. On the other hand, declines in a number of subsectors impinged negatively on the manufacturing sector’s production index during the same period. Percentage declines were mainly recorded in the wearing apparel (25.0 per cent), leather and related products (21.5 per cent), basic pharmaceutical products and pharmaceutical preparations (17.9 per cent), food products (5.2 per cent) and furniture (2.7 per cent) subsectors.

Economic Survey October 2017 61
the economy. The contribution of this sector to total GVA was slightly lower than the average of 1.4 per cent registered in the period 2012 to 2016.
4.3.1 AgricultureIn the period January-August 2017, as presented in Table 4.2, beef slaughtering increased by 1.5 per cent over the same period of the previous year. In the meantime, during the fi rst eight months of 2017, pork slaughtering declined by 2.8 per cent over the same period of the previous year, which is the equivalent of 92 tonnes less. Broiler slaughter also fell in this same period, registering a decrease of 3.8 per cent or 98 tonnes. In total, meat production was 2.7 per cent lower between January and August 2017, a diff erence of 178 tonnes less than same period of 2016.
Agricultural IndicatorsTable 4.2
2016 2017Jan-Aug Jan-Aug
Slauthering (tonnes) Beef 751 762 Pork 3,281 3,190 Broilers 2,580 2,482
Fresh Fruit Price Index 137.8 123.8 Volume Index 79.7 96.7
Fresh Vegetables Price Index 119.6 122.9 Volume Index 102.1 95.6
Source: National Statistics Offi ce

62 Economic Survey October 2017
The production of vegetables decreased by 6.4 per cent in the fi rst eight months of 2017 compared to the same period last year. This decrease was the result of a decline in the production of almost all vegetables, except sugar melons, broad beans, green onions, water melons, and pumpkins.
With regards to fruit, the fi rst eight months of 2017 saw an increase of 21.3 per cent in the total fruit produced over the same period of the previous year. This overall increase can be mainly attributed to the increase in peaches and strawberries which, due to their share, had the highest eff ect on total volume of fresh fruit produced in the period January-August 2017 when compared to the same period of 2016. On the other hand, the main declines in the production of fruit in the period under review were recorded in relation to lemons, oranges and sweet oranges.
Imports of Major Agricultural CommoditiesTable 4.3 € million
2013 2014 2015 2016 2016 2017Jan-Jul Jan-Jul
Live Animals 0.28 0.21 0.31 0.30 0.25 0.14Meat and Edible Offals 49.57 51.56 53.80 54.07 29.70 32.57Fish 55.42 51.89 60.16 104.50 51.27 54.21Dairy Produce 44.37 45.12 45.91 46.05 26.55 28.02Edible Fruits and Nuts 33.68 34.51 35.22 39.90 21.22 21.10Cereals 44.33 36.87 30.10 28.96 18.80 14.40Preparations of Meat, Fish 42.67 45.89 45.20 46.57 26.22 29.69Sugar & Confectionery 23.87 21.10 20.86 21.57 13.82 12.73Cereal Prep. 57.90 59.79 62.66 63.57 34.94 35.12Veg. and Fruit Prep. 26.40 27.30 27.31 25.64 14.68 16.06Misc. Edible Prep. 33.49 38.30 38.96 37.86 22.72 23.01Beverages, Spirits, Vinegar 55.85 61.30 63.44 63.16 35.72 38.64Feeds 35.14 33.59 34.37 30.81 17.15 18.76
Total 502.97 507.42 518.30 562.95 313.05 324.46
Source: National Statistics Offi ce

Economic Survey October 2017 63
With regards to importation of agricultural products, which can be found in Table 4.3, total imports of agricultural commodities increased by 3.6 per cent in the fi rst seven months of 2017 over the same period of the previous year, which is equivalent to an increase of around €11.4 million. Imports in preparations of meat and fi sh increased by 13.2 per cent, equivalent to €3.5 million and these represented the largest positive contributor to the change in imports in the period under review. On the other hand, the importation of cereals saw a decline of 23.4 per cent, which is equivalent to a decline of €4.4 million.
4.3.2 FisheriesWhile Malta has a long history of fi shing tradition, overall, fi shing and aquacultures represent a relatively small share of the Maltese economy. Nonetheless, this activity provides the supply of factor inputs in other Maltese industries, supplies the local population with fresh fi sh and also exports the produce from local fi sh farms. Fish landings for the fi rst six months of 2017 amounted to a total of 611.9 tonnes of fi sh, representing a 7.5 per cent increase of the tonnage landed when compared to the fi rst six months of 2016. This increase was mainly the result of a rise of 57.0 tonnes in sword fi sh landings during the period January to June 2017. While most of the diff erent categories and types of fi sh saw an increase in landings in the fi rst six months of 2017, stone bass and other species were the only two categories that saw a decline in landings in the same period, declining by 4.4 and 16.3 per cent respectively. The value of fi sh landings in the fi rst six months of 2017 increased by €0.9 million when compared to the same period of the previous year.
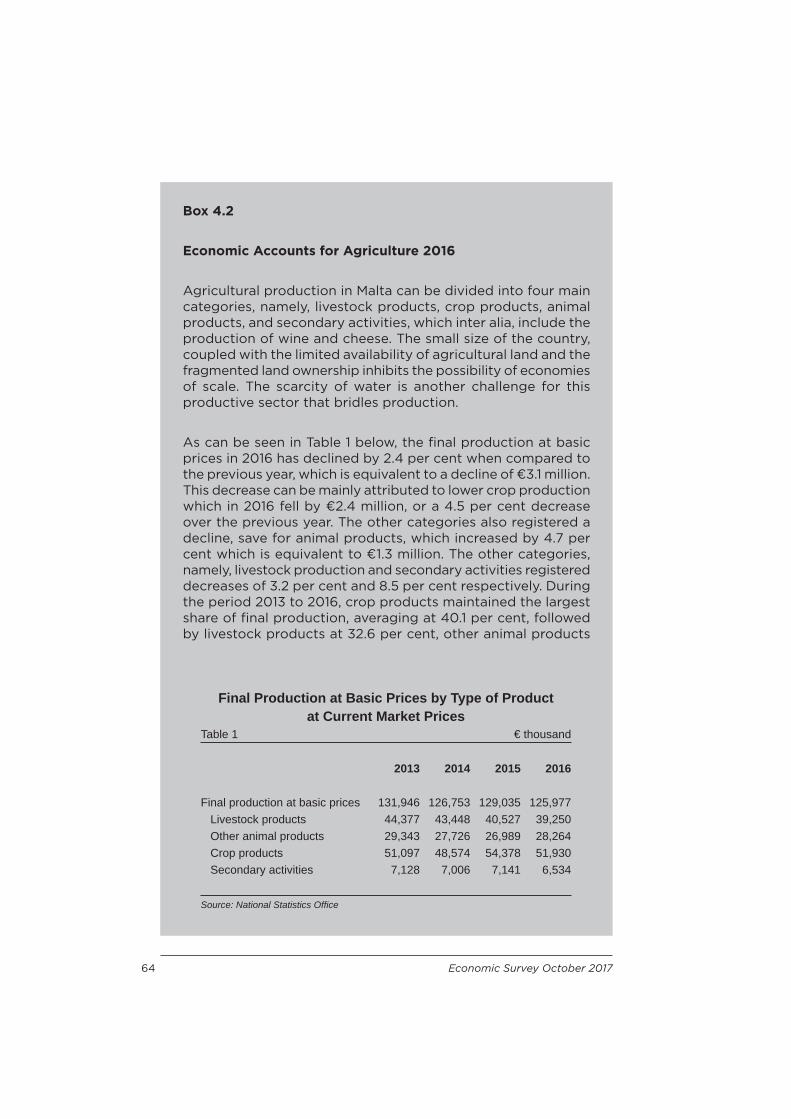
64 Economic Survey October 2017
Box 4.2
Economic Accounts for Agriculture 2016
Agricultural production in Malta can be divided into four main categories, namely, livestock products, crop products, animal products, and secondary activities, which inter alia, include the production of wine and cheese. The small size of the country, coupled with the limited availability of agricultural land and the fragmented land ownership inhibits the possibility of economies of scale. The scarcity of water is another challenge for this productive sector that bridles production.
As can be seen in Table 1 below, the fi nal production at basic prices in 2016 has declined by 2.4 per cent when compared to the previous year, which is equivalent to a decline of €3.1 million. This decrease can be mainly attributed to lower crop production which in 2016 fell by €2.4 million, or a 4.5 per cent decrease over the previous year. The other categories also registered a decline, save for animal products, which increased by 4.7 per cent which is equivalent to €1.3 million. The other categories, namely, livestock production and secondary activities registered decreases of 3.2 per cent and 8.5 per cent respectively. During the period 2013 to 2016, crop products maintained the largest share of fi nal production, averaging at 40.1 per cent, followed by livestock products at 32.6 per cent, other animal products
Final Production at Basic Prices by Type of Product at Current Market Prices
Table 1 € thousand
2013 2014 2015 2016
Final production at basic prices 131,946 126,753 129,035 125,977 Livestock products 44,377 43,448 40,527 39,250 Other animal products 29,343 27,726 26,989 28,264 Crop products 51,097 48,574 54,378 51,930 Secondary activities 7,128 7,006 7,141 6,534
Source: National Statistics Offi ce
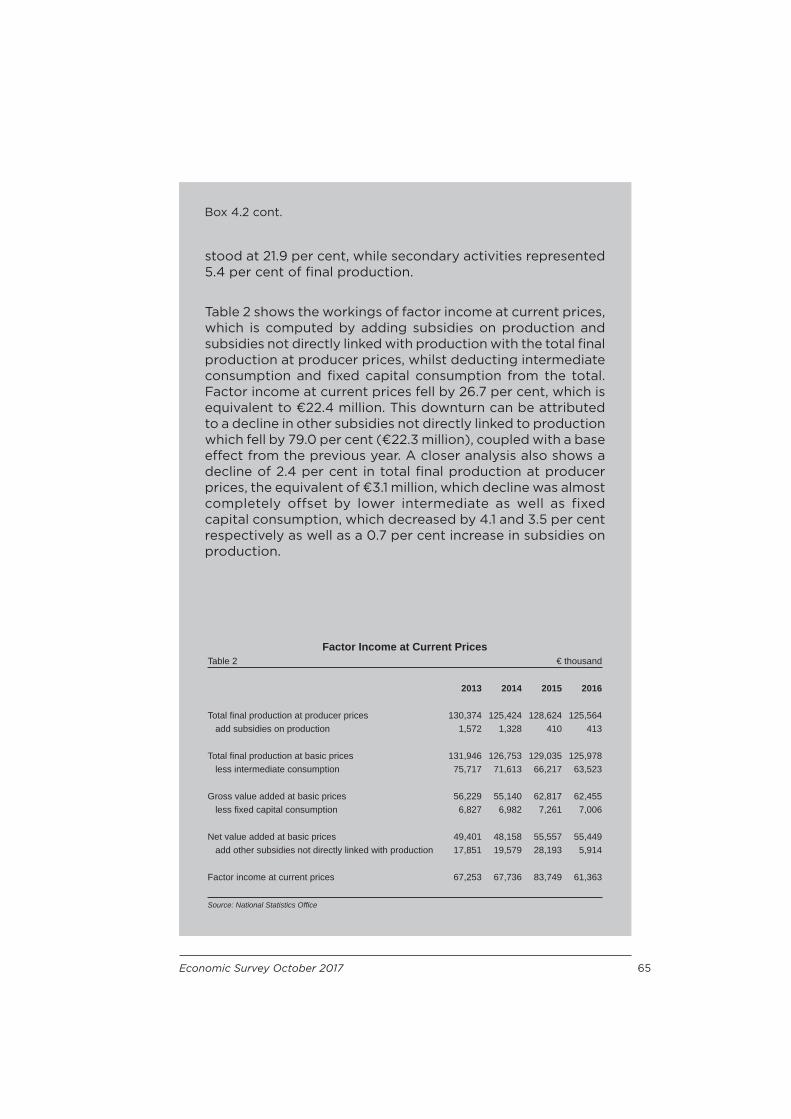
Economic Survey October 2017 65
Box 4.2 cont.
stood at 21.9 per cent, while secondary activities represented 5.4 per cent of fi nal production.
Table 2 shows the workings of factor income at current prices, which is computed by adding subsidies on production and subsidies not directly linked with production with the total fi nal production at producer prices, whilst deducting intermediate consumption and fi xed capital consumption from the total. Factor income at current prices fell by 26.7 per cent, which is equivalent to €22.4 million. This downturn can be attributed to a decline in other subsidies not directly linked to production which fell by 79.0 per cent (€22.3 million), coupled with a base eff ect from the previous year. A closer analysis also shows a decline of 2.4 per cent in total fi nal production at producer prices, the equivalent of €3.1 million, which decline was almost completely offset by lower intermediate as well as fixed capital consumption, which decreased by 4.1 and 3.5 per cent respectively as well as a 0.7 per cent increase in subsidies on production.
Factor Income at Current PricesTable 2 € thousand
2013 2014 2015 2016
Total fi nal production at producer prices 130,374 125,424 128,624 125,564 add subsidies on production 1,572 1,328 410 413
Total fi nal production at basic prices 131,946 126,753 129,035 125,978 less intermediate consumption 75,717 71,613 66,217 63,523
Gross value added at basic prices 56,229 55,140 62,817 62,455 less fi xed capital consumption 6,827 6,982 7,261 7,006
Net value added at basic prices 49,401 48,158 55,557 55,449 add other subsidies not directly linked with production 17,851 19,579 28,193 5,914
Factor income at current prices 67,253 67,736 83,749 61,363
Source: National Statistics Offi ce
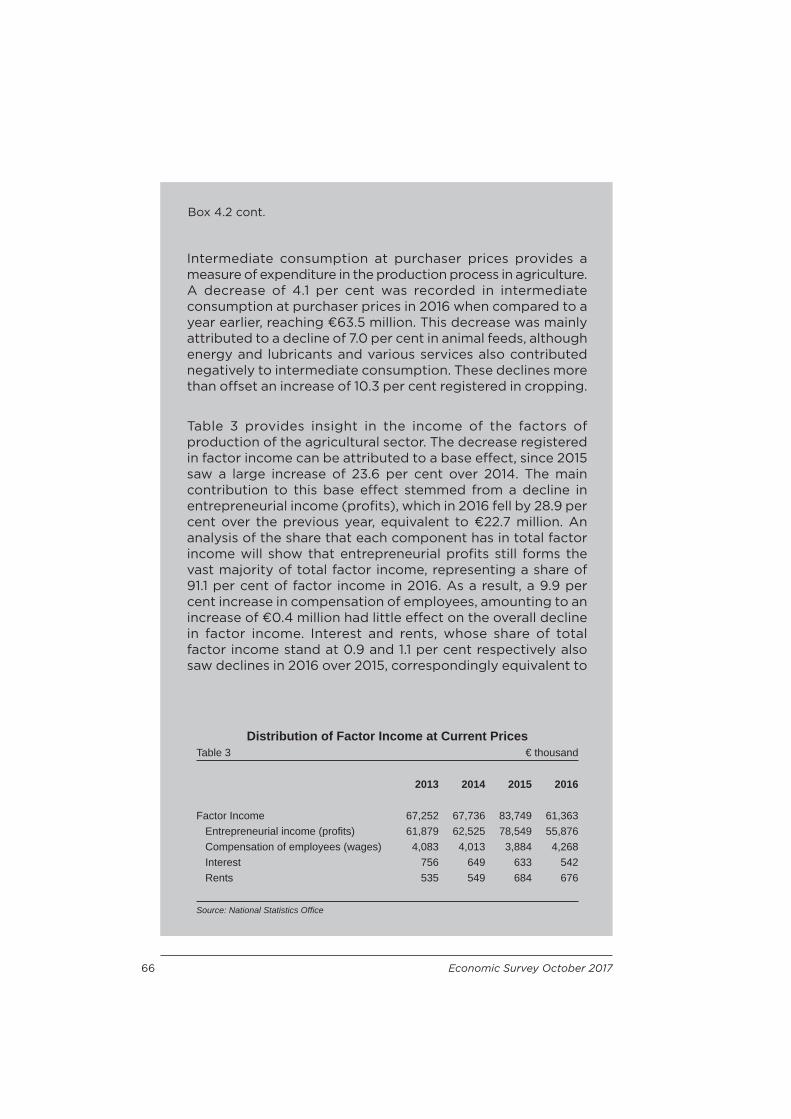
66 Economic Survey October 2017
Box 4.2 cont.
Intermediate consumption at purchaser prices provides a measure of expenditure in the production process in agriculture. A decrease of 4.1 per cent was recorded in intermediate consumption at purchaser prices in 2016 when compared to a year earlier, reaching €63.5 million. This decrease was mainly attributed to a decline of 7.0 per cent in animal feeds, although energy and lubricants and various services also contributed negatively to intermediate consumption. These declines more than off set an increase of 10.3 per cent registered in cropping.
Table 3 provides insight in the income of the factors of production of the agricultural sector. The decrease registered in factor income can be attributed to a base eff ect, since 2015 saw a large increase of 23.6 per cent over 2014. The main contribution to this base eff ect stemmed from a decline in entrepreneurial income (profi ts), which in 2016 fell by 28.9 per cent over the previous year, equivalent to €22.7 million. An analysis of the share that each component has in total factor income will show that entrepreneurial profi ts still forms the vast majority of total factor income, representing a share of 91.1 per cent of factor income in 2016. As a result, a 9.9 per cent increase in compensation of employees, amounting to an increase of €0.4 million had little eff ect on the overall decline in factor income. Interest and rents, whose share of total factor income stand at 0.9 and 1.1 per cent respectively also saw declines in 2016 over 2015, correspondingly equivalent to
Distribution of Factor Income at Current PricesTable 3 € thousand
2013 2014 2015 2016
Factor Income 67,252 67,736 83,749 61,363 Entrepreneurial income (profi ts) 61,879 62,525 78,549 55,876 Compensation of employees (wages) 4,083 4,013 3,884 4,268 Interest 756 649 633 542 Rents 535 549 684 676
Source: National Statistics Offi ce
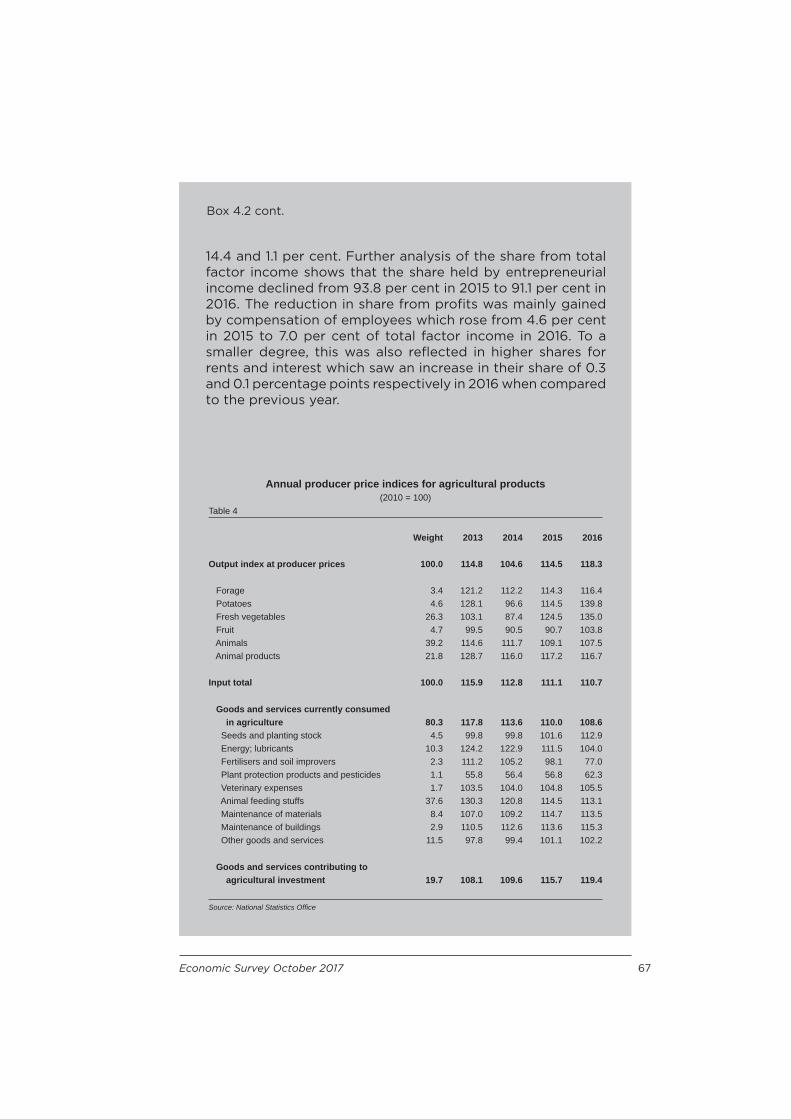
Economic Survey October 2017 67
Box 4.2 cont.
14.4 and 1.1 per cent. Further analysis of the share from total factor income shows that the share held by entrepreneurial income declined from 93.8 per cent in 2015 to 91.1 per cent in 2016. The reduction in share from profi ts was mainly gained by compensation of employees which rose from 4.6 per cent in 2015 to 7.0 per cent of total factor income in 2016. To a smaller degree, this was also refl ected in higher shares for rents and interest which saw an increase in their share of 0.3 and 0.1 percentage points respectively in 2016 when compared to the previous year.
Annual producer price indices for agricultural products (2010 = 100)
Table 4
Weight 2013 2014 2015 2016
Output index at producer prices 100.0 114.8 104.6 114.5 118.3
Forage 3.4 121.2 112.2 114.3 116.4 Potatoes 4.6 128.1 96.6 114.5 139.8 Fresh vegetables 26.3 103.1 87.4 124.5 135.0 Fruit 4.7 99.5 90.5 90.7 103.8 Animals 39.2 114.6 111.7 109.1 107.5 Animal products 21.8 128.7 116.0 117.2 116.7
Input total 100.0 115.9 112.8 111.1 110.7
Goods and services currently consumed in agriculture 80.3 117.8 113.6 110.0 108.6 Seeds and planting stock 4.5 99.8 99.8 101.6 112.9 Energy; lubricants 10.3 124.2 122.9 111.5 104.0 Fertilisers and soil improvers 2.3 111.2 105.2 98.1 77.0 Plant protection products and pesticides 1.1 55.8 56.4 56.8 62.3 Veterinary expenses 1.7 103.5 104.0 104.8 105.5 Animal feeding stuffs 37.6 130.3 120.8 114.5 113.1 Maintenance of materials 8.4 107.0 109.2 114.7 113.5 Maintenance of buildings 2.9 110.5 112.6 113.6 115.3 Other goods and services 11.5 97.8 99.4 101.1 102.2
Goods and services contributing to agricultural investment 19.7 108.1 109.6 115.7 119.4
Source: National Statistics Offi ce

68 Economic Survey October 2017
Box 4.2 cont.
Table 4 illustrates the annual producer price indices in relation to the agricultural sector from 2013 to 2016. Fluctuations in retail prices of fruit, vegetables, animals and animal products can be viewed in the output index while the input price index represents the price of raw materials and other services used as inputs by the agricultural sector. The disparity between input prices and output prices has a bearing on the profi t margin.
As displayed in Table 4, in 2016, output prices increased by 3.4 per cent over the previous year, an increase that can be mainly attributed to increases of 8.5 per cent and 22.1 per cent respectively for fresh vegetables and potatoes. On the other hand, input prices saw a marginal decline of 0.3 per cent. This decline was mainly the result of lower energy and lubricants, animal feeding stuff s, and fertilisers and soil improvers. This was partially off set by increases in almost all the remaining components, most notably seeds and planting stock.
Footnote:
1 NACE sector 12 – Manufacture of tobacco products
NACE sector 19 – Manufacture of coke and refi ned petroleum products
NACE sector 24 – Manufacture of basic metals

5. Services Activities


Economic Survey October 2017 71
5. Services ActivitiesThis Chapter presents an analysis of developments in the domestic services sector, focusing mainly on the fi rst seven months of 2017 of the local tourism industry. Apart from delving into the tourism sector, an overview of the regulatory, development and investment promotion activities within the services sector is also provided, focusing in particular on the Malta Financial Services Authority (MFSA), the Malta Gaming Authority (MGA), and the Malta Enterprise (ME).
5.1 TourismBetween January and July 2017, all tourism indicators continued to show a positive performance. The number of inbound tourists and nights spent in Malta continued to expand over the comparable period of 2016, along with tourist expenditure and employment. The same applies for the cruise passenger industry, which recorded a positive performance over the period under review. Table 5.1 and Appendix Table VI present a selection of tourism indicators.
In the fi rst seven months of the year, inbound tourism increased by a signifi cant 17.6 per cent when compared to the same period last year, reaching 1,241,248 persons. Nights spent by inbound tourists increased by around 11.0 per cent, and expenditure of inbound tourists increased by 13.9 per cent. Average full-time employment in the accommodation and food services activities increased by almost 800 jobs in the fi rst quarter of the year. In the fi rst two quarters of 2017, cruise passenger arrivals, excluding the embarkations and the Maltese cruise passenger arrivals, increased by 12.2 per cent over the corresponding period of 2016.
This sustained positive performance in the tourism industry refl ects the collaboration between the Government, the Malta Tourism Authority (MTA) and stakeholders that continued to refi ne and improve the tourism product through an increased emphasis on diversifi cation, as well as addressing accessibility to

72 Economic Survey October 2017
Malta through new routes while increasing frequency of existing ones especially during winter.
5.1.1 Monthly DistributionArrivals between January and July 2017, reached a signifi cant level of 1,241,248; a 17.6 per cent increase over the same period in 2016. As shown in Table 5.2 and Chart 5.1, all months considered in the analysis registered increases in inbound tourists when compared to the corresponding levels registered in 2016. The study of monthly data confi rms that July was again the peak month for inbound tourism accounting for 20.2 per cent of total inbound tourists. A signifi cant positive performance was also recorded in May and June, with shares of 17.4 per cent and 18.2 per cent respectively.
Main Tourism IndicatorsTable 5.1
2014 2015 2016 2016 2017
Jan-Jul Jan-Jul
Inbound Tourists 1,689,809 1,783,366 1,965,928 1,055,189 1,241,248
Nights spent (000’s) 13,522 14,152 14,961 7,775 8,626
Total Expenditure (€ million) 1,529 1,639 1,709 886 1,009
Cruise Passengers* 465,373 591,682 615,198 237,145(1) 266,183(1)
Average full-time employment in
accomodation and food services activities** 10,396 10,760 11,367 10,906(2) 11,703(2)
*Excluding embarkations and Maltese cruise passengers.**The data presented is based on the distribution of the administrative records of the JobsPlus of the gainfully occupied population according to the standard NACE classifi cation of economic activities.
(1)Data shows average for January-June.
(2)Data shows average for January-March.
Source: National Statistics Offi ce, JobsPlus

Economic Survey October 2017 73
Monthly Inbound TouristsTable 5.2
2014 2015 2016 2017
January 69,525 74,280 84,817 104,069
February 65,299 74,189 81,005 103,899
March 97,800 101,160 115,519 140,922
April 148,188 152,101 164,885 199,586
May 166,497 173,589 190,586 215,373
June 177,446 180,082 193,038 226,333
July 197,389 206,626 225,339 251,066
January-July 922,144 962,028 1,055,189 1,241,248
% change 8.6 4.3 9.7 17.6
August 235,094 246,485 253,330
September 185,438 192,550 206,920
October 177,961 196,692 215,119
November 102,940 113,042 140,404
December 66,232 72,568 94,966
Total 1,689,809 1,783,366 1,965,928
% change 6.8 5.5 10.2
Source: National Statistics Offi ce

74 Economic Survey October 2017
The number of inbound tourists increased by a signifi cant 24.0 per cent in the fi rst three months of 2017 when compared to the corresponding period in 2016, even though Easter was celebrated in April. As such, the buoyant performance registered in the sector can be only attributed to an increase in the number of fl ights to Malta in the winter months.
The aspect of seasonality is captured in Table 5.3, which shows the quarterly distribution of tourist departures between 2013 and 2016. The third quarter consistently registered the highest share of inbound tourists with around 35 per cent of the total, while the fi rst quarter as expected registered the lowest shares with the rate hovering around 14 per cent. However, the share of inbound tourists in the fi rst quarter followed an upward trend in the period under review. Consequently, both the second and the third quarters of 2016 recorded a marginal decline in the share of inbound tourists when compared to the corresponding period in 2015. This suggests that the drops in demand during the shoulder months are becoming less pronounced.
Chart 5.1
0
50
100
150
200
250
Inbound TouristsThousand
Total
UKJul-10 Jul-11 Jul-12 Jul-13 Jul-15Jul-14 Jul-16
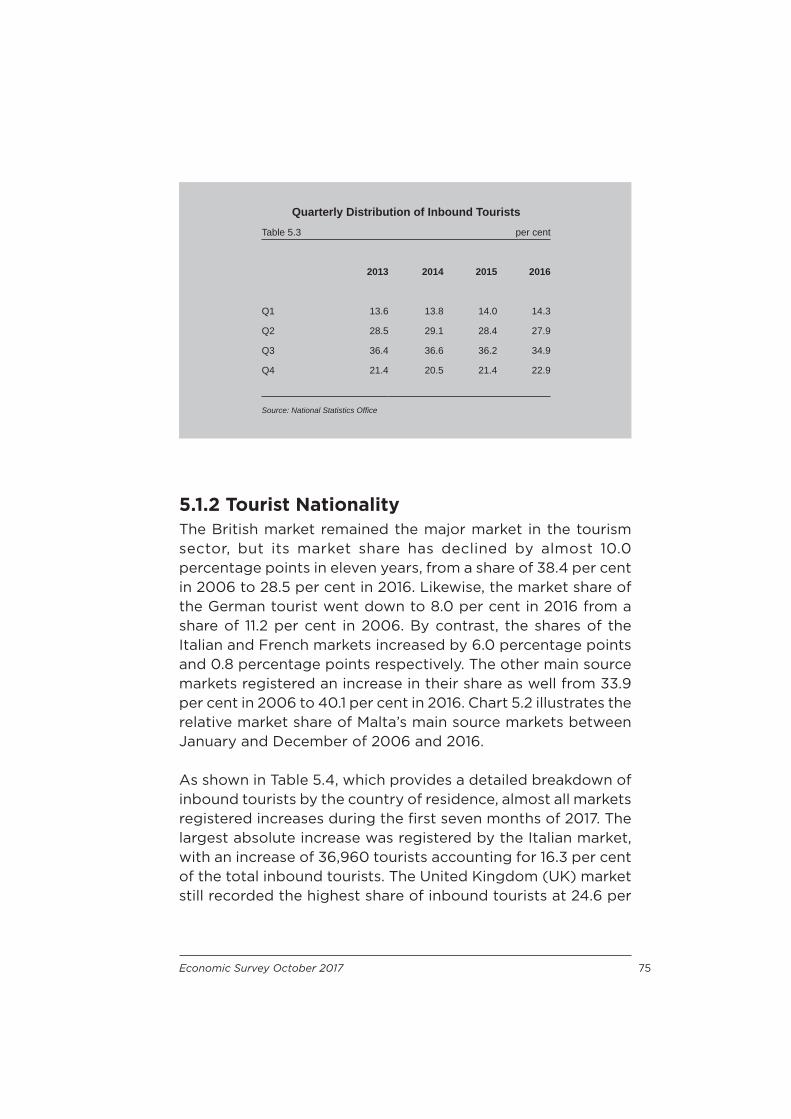
Economic Survey October 2017 75
5.1.2 Tourist NationalityThe British market remained the major market in the tourism sector, but its market share has declined by almost 10.0 percentage points in eleven years, from a share of 38.4 per cent in 2006 to 28.5 per cent in 2016. Likewise, the market share of the German tourist went down to 8.0 per cent in 2016 from a share of 11.2 per cent in 2006. By contrast, the shares of the Italian and French markets increased by 6.0 percentage points and 0.8 percentage points respectively. The other main source markets registered an increase in their share as well from 33.9 per cent in 2006 to 40.1 per cent in 2016. Chart 5.2 illustrates the relative market share of Malta’s main source markets between January and December of 2006 and 2016.
As shown in Table 5.4, which provides a detailed breakdown of inbound tourists by the country of residence, almost all markets registered increases during the fi rst seven months of 2017. The largest absolute increase was registered by the Italian market, with an increase of 36,960 tourists accounting for 16.3 per cent of the total inbound tourists. The United Kingdom (UK) market still recorded the highest share of inbound tourists at 24.6 per
Quarterly Distribution of Inbound TouristsTable 5.3 per cent
2013 2014 2015 2016
Q1 13.6 13.8 14.0 14.3
Q2 28.5 29.1 28.4 27.9
Q3 36.4 36.6 36.2 34.9
Q4 21.4 20.5 21.4 22.9
Source: National Statistics Offi ce
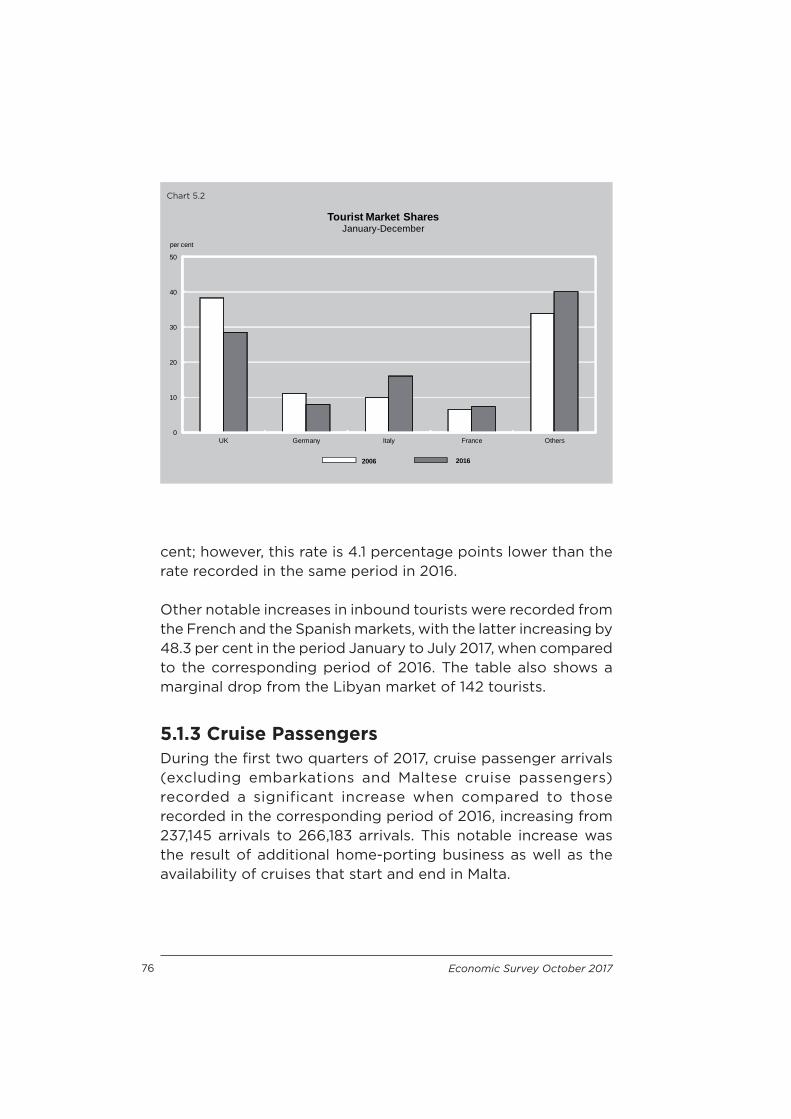
76 Economic Survey October 2017
cent; however, this rate is 4.1 percentage points lower than the rate recorded in the same period in 2016.
Other notable increases in inbound tourists were recorded from the French and the Spanish markets, with the latter increasing by 48.3 per cent in the period January to July 2017, when compared to the corresponding period of 2016. The table also shows a marginal drop from the Libyan market of 142 tourists.
5.1.3 Cruise PassengersDuring the fi rst two quarters of 2017, cruise passenger arrivals (excluding embarkations and Maltese cruise passengers) recorded a significant increase when compared to those recorded in the corresponding period of 2016, increasing from 237,145 arrivals to 266,183 arrivals. This notable increase was the result of additional home-porting business as well as the availability of cruises that start and end in Malta.
Chart 5.2
0
10
20
30
40
50
UK Germany Italy France Others
Tourist Market SharesJanuary-December
per cent
2006 2016
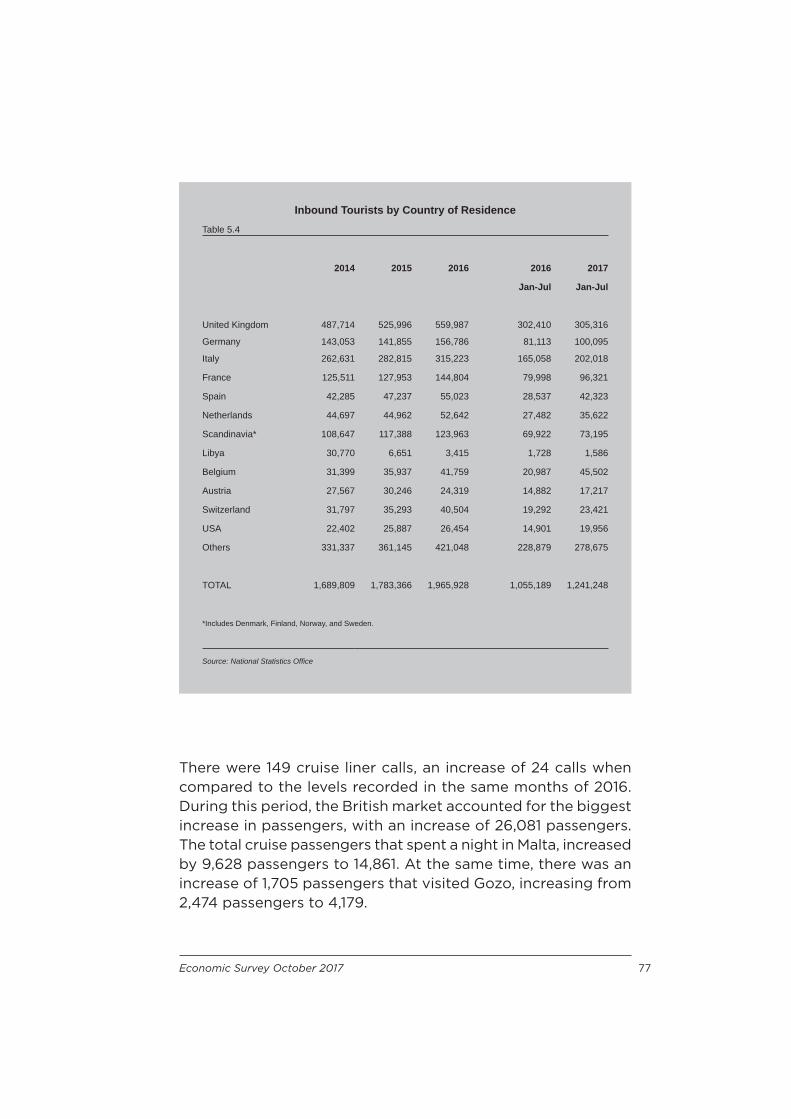
Economic Survey October 2017 77
There were 149 cruise liner calls, an increase of 24 calls when compared to the levels recorded in the same months of 2016. During this period, the British market accounted for the biggest increase in passengers, with an increase of 26,081 passengers. The total cruise passengers that spent a night in Malta, increased by 9,628 passengers to 14,861. At the same time, there was an increase of 1,705 passengers that visited Gozo, increasing from 2,474 passengers to 4,179.
Inbound Tourists by Country of ResidenceTable 5.4
2014 2015 2016 2016 2017
Jan-Jul Jan-Jul
United Kingdom 487,714 525,996 559,987 302,410 305,316
Germany 143,053 141,855 156,786 81,113 100,095
Italy 262,631 282,815 315,223 165,058 202,018
France 125,511 127,953 144,804 79,998 96,321
Spain 42,285 47,237 55,023 28,537 42,323
Netherlands 44,697 44,962 52,642 27,482 35,622
Scandinavia* 108,647 117,388 123,963 69,922 73,195
Libya 30,770 6,651 3,415 1,728 1,586
Belgium 31,399 35,937 41,759 20,987 45,502
Austria 27,567 30,246 24,319 14,882 17,217
Switzerland 31,797 35,293 40,504 19,292 23,421
USA 22,402 25,887 26,454 14,901 19,956
Others 331,337 361,145 421,048 228,879 278,675
TOTAL 1,689,809 1,783,366 1,965,928 1,055,189 1,241,248
*Includes Denmark, Finland, Norway, and Sweden.
Source: National Statistics Offi ce

78 Economic Survey October 2017
5.1.4 AccommodationBy the end of June 2017, the 4-Star and the 2-Star hotel categories declined by a unit each compared to June 2016. The number of hotel bed-places registered an increase of 1,064, with only the 2-Star hotel category recording a decline of 170 beds. During the same period, the other collective accommodation units increased by eight units with the number of bed-places increasing by 241. Table 5.5 provides data on the accommodation capacity by category in terms of units and beds.
The occupancy rates recorded for various types of accommodation and referring to the fi rst six months of 2017, show that all accommodation categories recorded the highest occupancy rate in June, as shown in Table 5.6. During June 2017, the 4-Star hotel category recorded the highest occupancy rate at 82 per cent, followed by the 5-Star category at 76 per cent.
Main Types of Tourist AccommodationTable 5.5
2016 (June) 2017 (June)
Establishments Bed-Places Establishments Bed-Places
Hotels5-Star 14 6,546 15 7,0854-Star 44 17,460 43 17,5563-Star 53 11,237 54 11,8362-Star 18 1,679 17 1,509
Hotel Total 129 36,922 129 37,986
Other N.E.C. Total 46 3,092 54 3,333
Source: National Statistics Offi ce

Economic Survey October 2017 79
In the period January to July 2017, the average length of stay declined to 6.9 nights, from 7.4 nights in 2016. It is to be noted, that increases were recorded in the number of guests staying in Malta for 3 days or less, the number of guests whose duration of stay was between 4 to 6 nights, and those staying for 7 nights or more. However, the number of guests staying in Malta for 3 days or less recorded a signifi cant increase of 36.6 per cent when compared to the same period in 2016. These results confi rm the now common trend of shorter and more frequent holidays.
Monthly Accommodation Occupancy Rates*Table 5.6 per cent
Hotels
Hostels &
5-Star 4-Star 3-Star 2-Star Guesthouses1
2016
Average (Jan-June) 62 66 51 47 42
2017
January 40 46 37 37 30
February 48 60 48 42 35
March 55 63 52 46 36
April 75 78 65 57 44
May 71 72 66 61 49
June 76 82 67 63 50
Average (Jan-June) 61 67 57 51 41
* Net Occupancy levels for Collective Accommodation Establishments based on the ACCOMSTAT Census
1 includes tourist villages
Source: National Statistics Offi ce

80 Economic Survey October 2017
Another emerging trend in the tourism sector is the increase in the number of tourists residing in private accommodation1. In the fi rst seven months of 2017, there were 26.8 per cent more tourists opting to stay in private accommodation.
5.1.5 EmploymentData for this indicator refers to the fi rst quarter of 2017. During this period, employment in the accommodation and food services activities increased to 11,703 persons on average, from an average of 10,906 persons in the corresponding period of 2016. As a share of the gainfully occupied population, employment in this sector increased marginally by 0.1 percentage points, to 6.3 per cent. However, as a share of the total private gainfully occupied population, the private sector employment in the accommodation and food services activities remained unchanged at 8.3 per cent.
5.1.6 Tourism Earnings During the period January to July 2017, tourism spending increased by 13.9 per cent, from €886.0 million to €1,009.5 million (see Table 5.7 and Chart 5.3). Total expenditure is split into package, non-package and “other” expenditure, with the non-package expenditure being further divided into the air/sea fares and accommodation expenditure. National Statistics Offi ce (NSO) data confi rms, that the year-on-year increase in the period January to July 2017 was mainly the result of a 27.7 per cent increase in non-package tourists, which in turn refl ected increases in both air/sea fares and accommodation. It is to be noted, that accommodation spending registered an increase of 28.9 per cent, 7.8 percentage points higher than the expenditure on air/sea fares, which stood at 21.1 per cent during the same period. Tourists’ expenditure on package holidays decreased by 1.4 per cent, while expenditure on the ‘other’ component (including shopping, food and drinks, and excursions during a tourism trip) of tourist expenditure increased by 17.2 per cent. Since tourism spending increased at a slightly slower pace than inbound tourists, expenditure in per capita terms decreased by 3.2 per cent to €813.3, while expenditure per nights spent
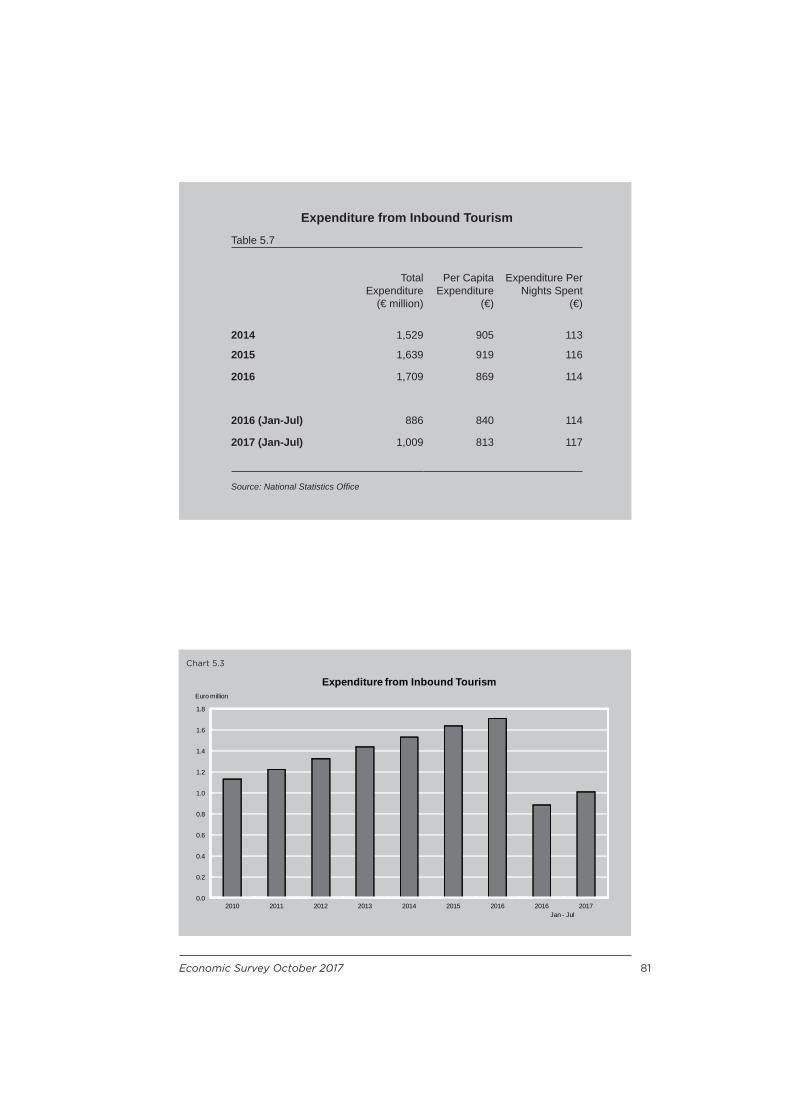
Economic Survey October 2017 81
Expenditure from Inbound TourismTable 5.7
Total Expenditure
(€ million)
Per Capita Expenditure
(€)
Expenditure Per Nights Spent
(€)
2014 1,529 905 113
2015 1,639 919 116
2016 1,709 869 114
2016 (Jan-Jul) 886 840 114
2017 (Jan-Jul) 1,009 813 117
Source: National Statistics Offi ce
Chart 5.3
0.0
0.2
0.4
0.6
0.8
1.0
1.2
1.4
1.6
1.8
2010 2011 2012 2013 2014 2015 2016 2016 2017
Expenditure from Inbound Tourism
Jan - Jul
Euro million

82 Economic Survey October 2017
increased from €114.0 in January to July 2016 to €117.0 in the corresponding period of 2017.
5.2 Regulatory ActivityThis section provides an insight into the regulatory developments in the services industry of Malta. Particularly, this section focuses on the MFSA, it being the sole regulator and supervisory authority for fi nancial services in Malta, and the MGA, which is the single, independent, regulatory body responsible for the governance of all gaming activities in Malta.
5.2.1 Malta Financial Services AuthorityThe MFSA is the single regulator for fi nancial services in Malta. The fi nancial services sector incorporates all fi nancial activity including that of credit institutions, fi nancial and electronic money institutions, securities and investment service companies, regulated markets, insurance companies, pension schemes and trustees. The MFSA is also the Listing Authority for the purpose of the Financial Markets Act and the Resolution Authority for the purpose of Directive 2014/59/EU and the Recovery and Resolution Regulations (L.N. 301 of 2015). The MFSA also manages the Registry of Companies. Data presented in this section deal with the period January to September 2017.
During the fi rst nine months of 2017, the MFSA continued to take an active part in the European System of Financial Supervisors (ESFS), which was initiated in January 2011. The MFSA participated actively in the meetings of the three European Supervisory Authorities (ESMA, EIOPA, EBA) and the European Systemic Risk Board (ESRB).
During the period under review, the MFSA has also been involved in on-going work in the establishment of the Banking Union, in particular the Single Supervisory Mechanism (SSM) conferring banking supervisory powers to the European Central Bank (ECB) as from November 2014, and the adopted Single Resolution Mechanism. The MFSA was also represented on the

Economic Survey October 2017 83
Supervisory Board, which has been established to plan and carry out the ECB’s supervisory tasks, undertake preparatory work, and propose complete draft decisions for adoption by the ECB’s Governing Council.
The MFSA played an important part in handling a substantial number of fi nancial services sector dossiers during Malta’s Presidency of the European Union (EU) between January and June 2017. The MFSA also supported the discussions to approve the amendments to the Anti-Money Laundering Directive. The Authority also hosted two EU Presidency events, the annual Strategy Day for Board Members of the European Insurance and Occupational Pensions Authority (EIOPA) and a meeting for the Board Members of the European Securities and Markets Authority (ESMA).
The MFSA continued to propose various amendments in order to enhance the legal and regulatory framework. In fact, the Authority conducted consultations on a variety of legislative initiatives, including proposed rules for Trustees and other Fiduciaries; issue of Legal Notices under the Financial Markets Act (FMA) and the Investment Services Act (ISA); amendments to Chapter 11 of the Listing Rules; proposed changes to Part A and Part B1 of the Investment Services Rules for Investment Services Providers; proposed amendments to the Insurance Intermediaries Act and the Insurance Business Act; and the proposed amendments to the Notified Investments Fund Regime (NAIFs). The macro-prudential framework continued to be strengthened during the period under review in line with Recommendations issued by the ESRB, as well as through the Joint Financial Stability Board (JFSB).
In February 2017, the MFSA successfully concluded and signed a Memorandum of Understanding (MoU) with the Abu Dhabi Global Market Financial Services Regulatory Authority. This enables a framework of bilateral cooperation between the two Authorities in the carrying out of their respective duties and obligations in the areas of banking, securities and insurance. It also provides for the exchange of information and the provision

84 Economic Survey October 2017
of technical and investigative assistance between the two Authorities.
Throughout the fi rst eight months of the year, the MFSA issued a signifi cant number of new licences. In total, 11 investment services licences were issued, leading to 161 licences by the end of August 2017. The MFSA also issued 83 new Collective Investment Scheme (CIS) licences, increasing the total number of CIS licences to 1,414. Financial institutions were issued 2 licences, increasing the total as at end of August to 44 units. Concerning insurance companies, 3 licences were issued, bringing the total to 63 insurance companies. Moreover, trustees increased by 8, to an aggregate of 165 trustees. With regards to retirement schemes, 4 schemes were licensed, with the total increasing to 49 schemes. In addition, during the period under review, 3,304 companies and partnerships were registered with the Registry of Companies.
5.2.2 Malta Gaming AuthorityThe MGA, established under the Lotteries and Other Games Act, Chapter 438 of the Constitution of Malta, is the single, independent, regulatory body responsible for the governance of all gaming activities in Malta, both online and land-based. The Maltese regulated land-based gaming market is composed of casinos, gaming parlours, commercial bingo halls and Maltco Lotteries Limited. The remote gaming regime applied by the MGA is both technology-neutral and game-neutral, therefore, encompassing any type of gaming off ered by means of distance communication (including, but not limited to, internet, digital TV, mobile phone technology and telephony). Any game off ered by means of distance communication, which can be securely managed and is compliant with the Regulations, is normally reviewed and considered for licensing by the MGA. The remote gaming sector is regulated under the provisions of the Remote Gaming Regulations (S.L. 438.04). Data on MGA’s performance is available up to the fi rst half of 2017.
Economic Survey October 2017 85
During the fi rst six months of 2017, the MGA continued to review its approach through a variety of initiatives. The most important initiative was the continuation of the overhaul of the entire regulatory framework governing the Maltese gaming industry. The overhaul, which began in 2015, is geared to address the various technological, political and legal developments facing the industry. The aim is that of consolidating all legislations under a single framework enabling consistent, technology-neutral, evidence-based and future-looking governance of all gaming sectors in Malta. This should lead to enhanced government structures and an extension of the regulatory scope and responsibilities of the Authority.
Since the end of 2013, the MGA has been working to consolidate Malta’s position in the global domain, particularly within the remote gaming sector. The aim of this strategy is to ensure that it has a regulatory framework that is robust, while fl exible enough to support the early adoption of new technology as well as the introduction of new gaming models. This with a view to maintaining and enhancing the eff ectiveness of its regulatory oversight while at the same time facilitating industry growth and evolution.
As at the end of June 2017, there were 282 remote gaming companies in Malta, which collectively held 558 licences. This implies that the number of registered remote gaming licences increased by almost 14 per cent over the corresponding period in 2016. Data on the land-based sector of the MGA shows that by the end of this period, the number of casinos in Malta stood at 4, while the number of bingo halls increased by a unit to 5 halls.
In April 2017, the MGA published the Skill Games Regulations (S.L. 438.11) which regulate the online skill games sector, which resulted in the issue of 15 controlled skill games companies. Furthermore, in June 2017, the 4th Anti-Money Laundering Directive (4th AMLD) came into force, whereby the transposition of this Directive enables that all gambling operators address persons in terms of anti-money laundering legislation, bringing into force onerous obligations and new compliance challenges.
86 Economic Survey October 2017
The MGA continued to participate actively in discussions relating to gaming in the EU and other fora. Gaming regulation in Europe and beyond is very granular and Governments have been seeking to ring-fence their territorial markets. In particular, the Authority forms part of the Expert Group on Gambling Services, hosted by the European Commission. In this Expert Group, MGA supports the view that some form of standardization is necessary in order to reduce regulatory burdens on operators licensed in more than one Member State. The initiative of the European Commission to achieve a digital single market has required the MGA to closely follow all initiatives to ensure that if gaming were in anyway aff ected, the interests of the industry would be properly safeguarded.
The MGA attended the quarterly meetings of the Expert Group on Gambling Services, hosted by the European Commission. The Expert Group discussed current issues relating to the European gambling sector, including challenges to regulation, new products and technological developments, the implementation of the 4th AMLD, initiatives relating to match-fi xing, as well as initiatives sponsored by the European Commission. In 2017, the European Commission concluded a project on comparing the technical requirements imposed by European gambling regulators, and has continued working on getting CEN-CENELEC, the European Standardisation Body, to create a European standard on technical reporting requirements in the gambling industry. The secretariat of the CEN technical committee has been awarded to AFNOR, the French standardisation authority, and the MGA has been cooperating with the Maltese standardisation authority, the MCCAA, in contributing to the development of such a standard. The newest project proposed by the European Commission, is a study on the eff ectiveness of payment and website blocking measures.
Another topic which is being discussed at Expert Group level, and which has been championed by the Dutch representatives, is cooperation in enforcement across borders. Although the MGA is in favour of cooperation, the stance remains that the
Economic Survey October 2017 87
Maltese authorities are not in a position to enforce the laws of other Member States.
Following the signature of the multilateral cooperation arrangement with EU/EEA gaming regulators in 2015, the MGA has been cooperating with its counterparts when receiving cooperation requests. These normally include information on best practices, the content of legislation in Malta, or information about particular Maltese operators. Malta has also made use of the cooperation arrangement to request information on the gambling policies implemented by other Member States. Whilst international cooperation on gambling matters is a priority for the MGA, especially in the prevention of crime and consumer protection, this is not to the detriment of the industry in Malta. The MGA also follows-up on other EU-related developments, specifically initiatives related to the Digital Single Market strategy. Although gambling was excluded from the scope, the MGA ensures that any of the proposals do not have adverse impacts on the gaming industry in Malta.
In 2017, the MGA announced the launch of a New Licensee Relationship Management System accessible through a secure and dedicated web portal, whereby such a project will entail a change in the way MGA interacts with its current and prospective licensees through the simplifi cation and digitisation of its online and land-based processes. This new system will empower the gaming operators to electronically track the status of their applications and meet regulatory requirements more effi ciently. This digitisation process will enhance a two-way communication between the Authority and its customers and will act as a one-stop shop for licensing.
5.2.3 Development and Investment PromotionME is Malta’s economic development agency, responsible for attracting new foreign direct investment as well as facilitating the growth of existing operations. Its roles are multifaceted, whereby it acts as a single point of contact for all enterprise
88 Economic Survey October 2017
support in Malta. ME develops support measures to create an environment conducive to the growth and development of industry, administers a number of fi scal and non-fi scal incentives, advises Government on economic policy and also acts as an intermediary between industry and Government, particularly on educational facilities.
During January to August 2017, ME approved 23 foreign-owned projects, where the new foreign projects were primarily in the life sciences sector, while the foreign expansion projects were in various established economic sectors including aviation, life sciences, precision engineering and plastics. The local industry also demonstrated a notable growth, evidenced by the approval of 10 Greenfi eld and 30 expansion projects by Maltese-owned enterprises. During this period, ME continued in its work of attracting new global investment to Malta. Furthermore, ME had a prominent role to ensure that leading players in the Aircraft Maintenance, Repair & Overhaul (MRO) industry not only maintained their base in Malta but also expanded their operations further.
During the fi rst eight months of the year, ME supported 16 start-up enterprises through the Start-up Finance and Business Start (B.Start) Schemes, with the total assistance awarded amounting to €500,000. ME also off ered support through a number of other schemes, whereby by the end of August 2017, the Corporation issued €6 million worth of tax credits under the Micro Invest Scheme, over €8.5 million in favour of benefi ciaries through Investment Aid Tax Credits, and €2.5 million in favour of 24 benefi ciaries under the Business Development and Continuity scheme.
Business First has further consolidated the support off ered to SMEs with an emphasis on start-ups. During the period under review, Business First and its functions were incorporated into a separate legal entity through a public-private partnership, with the aim of strengthening the focus on the promotion of government support services to local SMEs and microenterprise, as well as reinforce the one-stop-shop services for enterprises.

Economic Survey October 2017 89
Furthermore, to fulfi l its objectives in the support of SMEs formation and growth, ME continued to manage the Kordin Business Incubation Centre (KBIC), which is a mixed technology oriented style incubator. During January to September 2017, KBIC hosted 17 full-time clients, thus implying an 85 per cent occupancy rate.
Malta Industrial Parks Ltd. (MIPL) continued to work very closely with ME, administering and maintaining a substantial portfolio of industrial properties, exceeding 900 factories in various industrial estates, including the Safi Aviation Services Park (SASP). During January to August 2017, MIP allocated around 182,500 square metres of space to local and foreign owned businesses under titles of lease and emphyteusis.
Other signifi cant developments in 2017 included the continuous eff ort provided by the Enterprise European Network (EEN) to support micro-enterprises and SMEs. As of January 2015, the EEN is represented in Malta by a consortium made up of four business support organisations namely ME, the Malta Chamber of Commerce, Enterprise and Industry, the Malta Business Bureau and the Malta Council for Science and Technology. Through close collaboration with these entities, ME supported various workshops within the framework of the EU’s SME Policy, facilitated the participation of Maltese companies at international brokerage events and assisted the profi ling of SMEs interested in establishing contact with foreign entrepreneurs for cooperation purposes. Furthermore, ME, through EEN, continued to organise events mainly focusing on how nanotech and materials technologies can strengthen competitiveness across all European industries.
During the fi rst nine months of 2017, the Malta Life Sciences Centre hosted 28 companies/institutions most of which have already commenced operations and operate in a variety of areas, including genome sequencing, development and manufacture of pharmaceutical products, food technology, nutraceuticals, general laboratory testing, medical device design and accreditation. Furthermore, during the same period, the

90 Economic Survey October 2017
Digital Hub facility located within the Malta Life Sciences Park was at full capacity and hosted seven companies specialising in a number of areas in the IT sector, some of which related to the life sciences sector.
In addition, the connectivity study on Gozo, including the feasibility of the digital hub, was completed during the period under review. Works on the tender for the implementation of a new optic fi bre connection for Gozo progressed smoothly, with a development permit application for the project submitted to the Planning Authority.
Footnote:
1 Private accommodation comprises holiday furnished premises (farmhouses, fl ats and villas), rented accommodation (host families, marinas, paid-convents, rented yachts, student dormitories), own private residence (owned dwellings, owned caravans and yachts), staying with friends or relatives (even if charged - includes also friends’ private apartments) and other private accommodation (oilrig, free-convents, timeshare, dockyards (Palumbo), ship (used for work)).

6. Prices and Incomes


Economic Survey October 2017 93
6. Prices and IncomesThe Harmonised Index of Consumer Prices (HICP) rate published by Eurostat provides the offi cial measure of consumer price infl ation in the Euro Area for the purposes of monetary policy. This Chapter presents a review of the domestic price movements during the twelve months to August 2017, together with a comparison of Malta’s infl ation rate to that of other European Union (EU) Member States.
This Chapter also includes an analysis of average sectoral wages, on the basis of collective agreements of a representative sample of companies deposited within the Department of Industrial and Employment Relations.
Between October 2016 and January 2017, Malta’s monthly year-on-year harmonised infl ation rate, increased from 0.5 per cent to 1.4 per cent. However, it subsequently declined to 1.0 per cent by June 2017 before reaching the rate of 1.2 per cent in August 2017. The 12-month moving average infl ation rate stood at 1.1 per cent in August 2017 the same as was recorded in August 2016.
The Labour Force Survey (LFS) fi gures show that in the fi rst quarter of 2017, the average annual basic salary for employees was 5.7 per cent higher than the level recorded a year earlier. In the same period under review, the annual basic salary for employees engaged in Financial and insurance activities and Wholesale and retail trade, transportation and storage, accommodation and food service activities - the sectors with the highest and lowest levels respectively - experienced increases of 16.8 per cent and 3.8 per cent respectively.
Meanwhile, the study reviewing increases in collectively agreed wages indicates that, on average, the weekly wage increased by €7.38 or 2.1 per cent between August 2016 and August 2017. Wage growth in Direct production amounted to 1.7 per cent while wages in Services increased by 2.2 per cent. The highest percentage weekly wage increase of 5.2 per cent was

94 Economic Survey October 2017
registered in the Water supply; sewerage, waste management and remediation activities sub-sector.
6.1 Infl ation
6.1.1 International ComparisonTable 6.1 presents data on the infl ation rates for EU Members States as at August 2017. The infl ation rate is measured by the HICP methodology and enables direct comparability among Member States. Chart 6.1 shows domestic infl ationary trends in the 12-month moving average and annual HICP.
Infl ationary developments in the EU in August 2017, showed that Lithuania registered the highest annual rate of infl ation of 4.6 per cent, followed by Estonia (4.2 per cent), Latvia (3.2 per cent) and United Kingdom (2.9 per cent). The average infl ation rate for the EU28 Member States was 1.7 per cent, signifi cantly higher than the 0.3 per cent recorded in August 2016. Under the twelve main categories comprising the overall index, one notices that all sub-indices recorded a positive annual rate of change except for the Communication sub-index which declined at the rate of 1.2 per cent. Meanwhile, the highest change was observed in Restaurants and Hotels at 2.9 per cent and Transport at 2.7 per cent. These were followed by the Alcoholic beverages, tobacco and narcotics at 2.4 per cent and Housing, Water, Gas and Other fuel at 1.8 per cent.
The annual rate of infl ation in Malta in August 2017 stood at 1.2 per cent, marginally higher than the rate of 1.0 per cent recorded in August 2016. This is indicative of the fact that infl ation remained relatively low and stable during the past twelve months. Main price increases during this period were noted in Education (5.3 per cent), Alcoholic beverages, tobacco and narcotics (2.6 per cent), Health (2.1 per cent) and Furnishings, Household Equipment and Routine Household Maintenance (2.0 per cent). In the meantime, price declines were mainly driven by the Communications and Clothing and Footwear sub-indices with an annual decline of 2.3 per cent and 1.1 per cent,

Economic Survey October 2017 95
Harmonised Index of Consumer Prices (August 2017)Table 6.1 per cent
Member States Annual Rate12-Month Moving
Average
Austria 2.1 1.9Belgium 2.0 2.2Bulgaria 0.7 0.4Croatia 1.5 0.8Cyprus 0.5 0.5Czech Republic 2.4 2.0Denmark 1.5 0.7Estonia 4.2 2.8Finland 0.8 0.9France 1.0 1.0Germany 1.8 1.4Greece 0.6 0.9Hungary 2.7 2.0Ireland 0.4 0.0Italy 1.4 1.0Latvia 3.2 2.4Lithuania 4.6 2.7Luxembourg 2.3 1.8Netherlands 1.5 0.9Poland 1.4 1.1Portugal 1.3 1.2Romania 0.6 0.4Slovakia 1.6 0.7Slovenia 1.4 1.2Spain 2.0 1.7Sweden 2.2 1.7United Kingdom 2.9 2.1
EU 28 1.7 1.4Euro Area 1.5 1.3
Malta 1.2 1.1
Source: Eurostat, National Statistics Offi ce

96 Economic Survey October 2017
Chart 6.1
-2
-1
0
1
2
3
4
5
6
Harmonised Index of Consumer Prices
12-month moving average Annual
per cent
Aug-12 Aug-13 Aug-14 Aug-15 Aug-16 Aug-17
Harmonised Index of Consumer Prices Annual rate of change (y-o-y)
Table 6.2 per cent
2014 2015 2016 2017
January 0.9 0.8 0.8 1.4February 1.6 0.6 1.0 1.2March 1.4 0.5 1.0 1.2April 0.5 1.4 0.8 1.1May 0.4 1.3 1.0 1.1June 0.7 1.1 1.0 1.0July 0.6 1.2 0.9 1.2August 0.8 1.4 1.0 1.2September 0.6 1.6 0.9October 0.7 1.6 0.5November 0.6 1.3 0.8December 0.4 1.3 1.0
Source: National Statistics Offi ce

Economic Survey October 2017 97
respectively. Table 6.2 illustrates the monthly annual rate of HICP for the period January 2014 and August 2017.
In light of the above developments in the annual rate of infl ation, the 12-month moving average for Malta in August 2017 stood at 1.1 per cent, which was below the rate for EU28 at 1.4 per cent.
6.2 Retail Price Index and COLAThe Cost of Living Adjustment (COLA) agreement is based on the 12-month moving average measure of the Retail Price Index (RPI). This measure is calculated by comparing the average RPI in the 12-months leading to the month under consideration with the corresponding average in the previous 12-month period. Thus, the COLA as announced annually during the Budget, is directly dependent on the monthly changes occurring in the overall infl ation index. Moreover, the RPI index has a diff erent weighting structure when compared to the HICP index.
Malta’s RPI 12-month moving average infl ation rate in August 2017 stood at 1.2 per cent. The fl uctuations at sub-index level provides insight on the underlying contributors to domestic infl ation. Indeed, as Table 6.3 illustrates, the highest change in August 2017 was noted in the Food sector followed by the Beverages and Tobacco and Household Equipment and House Maintenance Costs sub-indices. Table 6.4 shows the 12-month moving average of the RPI overall infl ation rate.
In August 2017, the Food sub-index 12-month moving average increased to 3.88 per cent from 1.91 per cent in August 2016. Its contribution to overall price developments was the highest among all categories at 0.83 percentage points. This contribution was mainly driven by developments as observed in vegetables, fi sh, fruit, served meals and take-away meals.
The 12-month moving average rate for the Beverages and Tobacco sub-index, decreased from 4.25 per cent in August 2016 to 3.20 per cent during the same month in 2017, with a resulting contribution of 0.18 percentage points to the headline infl ation
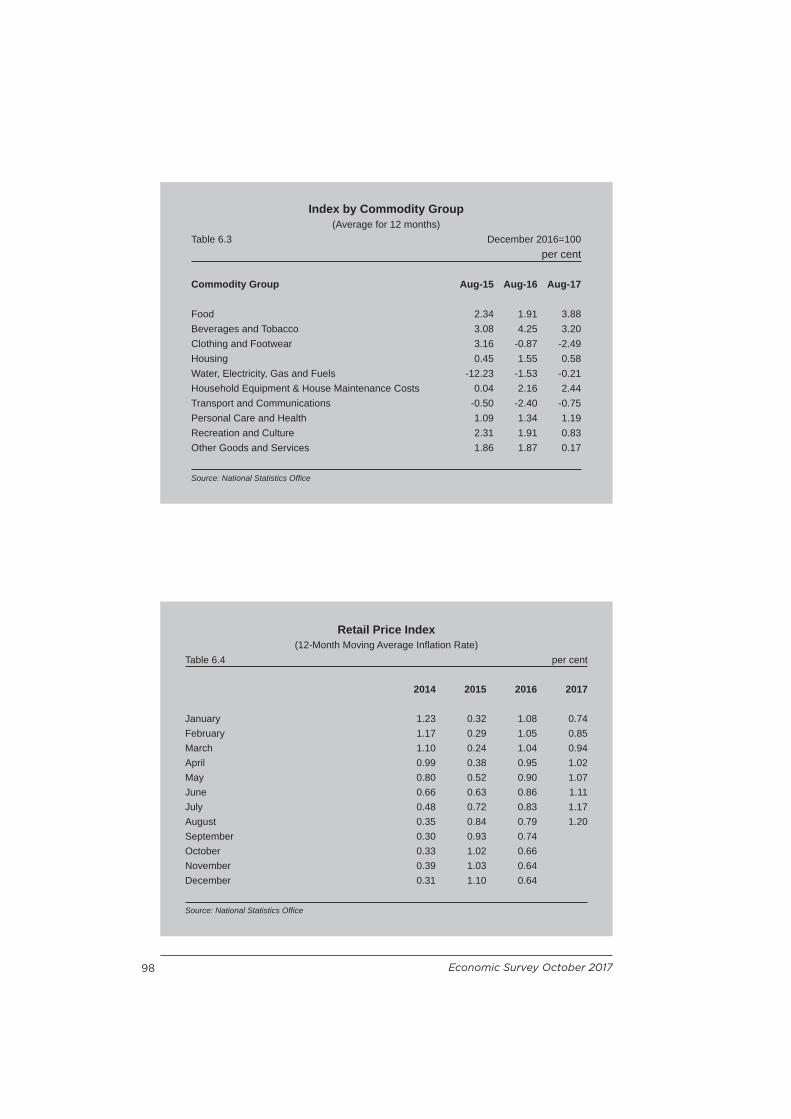
98 Economic Survey October 2017
Retail Price Index(12-Month Moving Average Infl ation Rate)
Table 6.4 per cent
2014 2015 2016 2017
January 1.23 0.32 1.08 0.74February 1.17 0.29 1.05 0.85March 1.10 0.24 1.04 0.94April 0.99 0.38 0.95 1.02May 0.80 0.52 0.90 1.07June 0.66 0.63 0.86 1.11July 0.48 0.72 0.83 1.17August 0.35 0.84 0.79 1.20September 0.30 0.93 0.74October 0.33 1.02 0.66November 0.39 1.03 0.64December 0.31 1.10 0.64
Source: National Statistics Offi ce
Index by Commodity Group(Average for 12 months)
Table 6.3 December 2016=100per cent
Commodity Group Aug-15 Aug-16 Aug-17
Food 2.34 1.91 3.88Beverages and Tobacco 3.08 4.25 3.20Clothing and Footwear 3.16 -0.87 -2.49Housing 0.45 1.55 0.58Water, Electricity, Gas and Fuels -12.23 -1.53 -0.21Household Equipment & House Maintenance Costs 0.04 2.16 2.44Transport and Communications -0.50 -2.40 -0.75Personal Care and Health 1.09 1.34 1.19Recreation and Culture 2.31 1.91 0.83Other Goods and Services 1.86 1.87 0.17
Source: National Statistics Offi ce

Economic Survey October 2017 99
rate. The principal contributors to infl ationary developments for this sub-index included cigarettes prices and off -sales non-alcoholic beverages.
The Clothing and Footwear sub-index sustained a declining pattern in its 12-month average, recording a decline of 2.49 per cent in August 2017. The contribution to headline infl ation stood at -0.16 percentage points. These developments mainly emanated from women’s outwear, although price developments in men’s outwear also contributed to the decline.
The Housing sub-index registered a 12-month average of 0.58 per cent in August 2017, with a contribution of 0.05 percentage points to the overall infl ation rate. Positive contributions to infl ation were observed in materials for plastering and cement rendering, and rents were in part offset by the negative contribution of various construction works.
In August 2017, the Water, Electricity, Gas and Fuels sub-index continued to show a negative average, however, the change has diminished. The 12-month average for August 2017 was -0.21 per cent showing almost a negligible change under this category. The relevant contribution for this sub-index was that of -0.01 percentage points and this mainly refl ected a slight change in gas and liquid fuels indices. The 12-month moving average rate for the Household Equipment and House Maintenance Cost sub-index, increased to 2.44 per cent in August 2017, up from 2.16 per cent in August 2016. The contribution of this sub-index to the overall rate stood at 0.17 percentage points, mainly underpinned by developments in furniture and furnishings sub-indices. However, a marginal negative contribution was noticed in household appliances and carpets.
In August 2017, the 12-month moving average infl ation rate for the Transport and Communications sub-index continued its negative trend with a registered rate of -0.75 per cent. The overall contribution to headline infl ation of this sub-index was also

100 Economic Survey October 2017
negative at -0.17 percentage points and this mainly emanated from developments pertaining to air transport services and fuels. On the other hand, motor vehicles showed a noticeable positive contribution.
In August 2017, the 12-month moving average rate for the Personal Care and Health sub-index stood at 1.19 per cent with a contribution of 0.11 percentage points to the RPI infl ation rate. This rate was slightly lower than the 1.34 per cent recorded in the previous comparable period of 2016. The main drivers included changes in medical services and hairdressing/personal grooming services.
The 12-month moving average growth rate in the Recreation and Culture sub-index was that of 0.83 per cent in August 2017. The contribution to the overall rate was that of 0.08 percentage points with the main contributor being education expenses and to a lesser extent hire and leasing of recreational sports events and entertainment and cultural visits. Meanwhile, books, newspapers and magazines, and audio visual equipment contributed negatively.
The 12-month average infl ation rate of the Other Goods and Services sub-index for August 2017 was that of 0.17 per cent with a contribution of 0.01 percentage points to the RPI infl ation rate. Positive developments in this index were observed in insurances. On the other hand, marginal negative contributions were registered in veterinary services and pet food, and jewelry, watches and clocks indices.
6.3 Sectoral Wages - Collective AgreementsThis section is concerned with the developments in average weekly wage rates based on collective agreements as deposited with the Department of Industrial and Employment Relations and covers the period between August 2016 and August 2017.
The sample under review is made up of 93 fi rms employing 19,582 employees, with 20 fi rms engaged in direct production and

Economic Survey October 2017 101
employing 6,064 employees with the other 73 fi rms operating in services with 13,518 employees. The data for weekly wages is divided into three distinguished levels as per ISCO-08 ten skill level groups excluding military occupations. ISCO stands for International Standard Classifi cation of Occupations and is a system of classifi cation and aggregation of occupational information under the International Labour Offi ce (ILO). Level 1 includes ISCO major group 9 where it refers to elementary occupations. Level 2 includes ISCO major groups 4 to 8 where these consist of clerks, service and sales workers, skilled agricultural and fi shery workers, craft and related trades workers, and plant and machine operators and assemblers, while Level 3 includes ISCO major groups 1 to 3 referring to managers, senior offi cials and legislators, professionals, technicians and associate professionals.
It is to be noted, that defi nite contracts of employment are not considered in this analysis. The data also excludes employment benefi ts over and above the basic wage, such as production bonuses, overtime payments, social security and allowances, and other non-wage income. This source of non-wage income can be quite signifi cant for some categories of employment hence it follows that the employees’ actual average weekly remuneration might be higher than that reported in this study.
Since the information in this Chapter is based on a sample of collective agreements and includes only the basic weekly wage, the results shown in the following Tables cannot be directly compared to data based on the gainfully occupied population included in other Chapters of this Economic Survey. Moreover, the Tables and data presented in this Chapter are not directly comparable to those published in previous Economic Surveys. Direct comparability is hampered by the methodology and sampling procedure adopted, mainly the inclusion of additional fi rms and exclusion of others. This means that the individual fi rms weighting in each category would change refl ecting the changes in employment levels. The reported average wage rates may also change due to a new collective agreement which can result in a reclassifi cation of grades.

102 Economic Survey October 2017
The methodology used in this study compiles collective agreements based on the entity’s European Classifi cation of Economic Activities (NACE) code. This classifi cation provides a structure for statistical data according to economic activity. The mean wage under the three levels for each individual collective agreement is then calculated. The fi gures obtained are then increased by the COLA in cases where the collective agreement is exclusive of COLA. The COLA for the year 2017 as announced in the 2017 Budget Speech amounted to €1.75.
Table 6.5 shows the average weekly wage rate for the various employment categories in the sampled fi rms as at August 2016. The overall weighted average wage of all sectors stood at €345.21 whereas the weighted average wage for those employed in direct production and services stood at €316.86 and €348.87, respectively. This implies a sectoral wage gap of €32.01. The highest average weekly wage rates were recorded by the Financial and insurance activities (€535.14) and the Education sub-sectors (€453.44). These were followed by Public administration and defence; compulsory social security (€394.86), Real estate activities (€391.31) and Manufacture of pharmaceuticals, medicinal chemical and botanical products (€384.05) sub-sectors. The lowest paid sub-sectors were the Residential care and social work activities (€248.00), the Accommodation and food service activities (€258.96), and the Water supply; sewerage, waste management and remediation activities sub-sector (€274.20). The lowest weekly average wage rate in August 2016 amounted to €194.57 and was earned under Level 2 in the Residential care and social work activities sub-sector while the highest weekly average wage rate was earned by the Financial and insurance activities Level 3 classifi cation (€676.97).
Table 6.6 shows the average weekly wage rates for the three employment levels in the sampled fi rms as at August 2017. The fact that both Table 6.5 and Table 6.6 use the same employment weighting structure and the same sample of fi rms makes them directly comparable. Thus, the diff erences in the corresponding
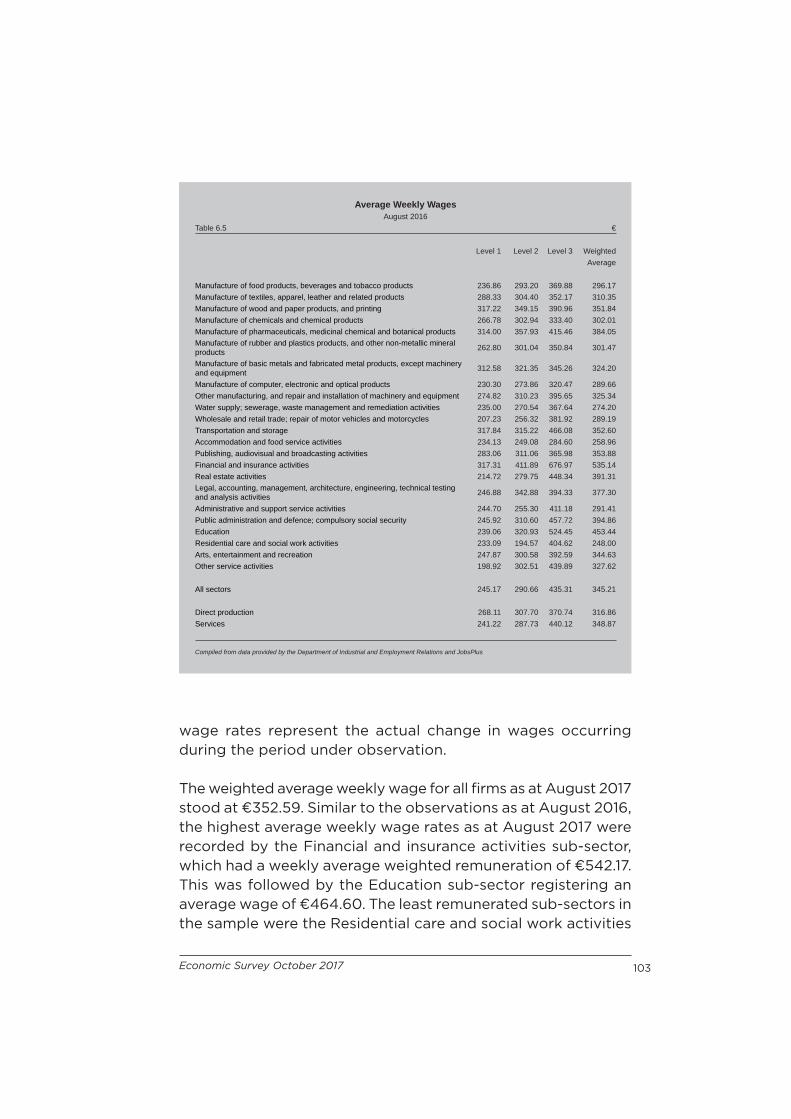
Economic Survey October 2017 103
Average Weekly WagesAugust 2016
Table 6.5 €
Level 1 Level 2 Level 3 WeightedAverage
Manufacture of food products, beverages and tobacco products 236.86 293.20 369.88 296.17Manufacture of textiles, apparel, leather and related products 288.33 304.40 352.17 310.35Manufacture of wood and paper products, and printing 317.22 349.15 390.96 351.84Manufacture of chemicals and chemical products 266.78 302.94 333.40 302.01Manufacture of pharmaceuticals, medicinal chemical and botanical products 314.00 357.93 415.46 384.05Manufacture of rubber and plastics products, and other non-metallic mineral products 262.80 301.04 350.84 301.47
Manufacture of basic metals and fabricated metal products, except machinery and equipment 312.58 321.35 345.26 324.20
Manufacture of computer, electronic and optical products 230.30 273.86 320.47 289.66Other manufacturing, and repair and installation of machinery and equipment 274.82 310.23 395.65 325.34Water supply; sewerage, waste management and remediation activities 235.00 270.54 367.64 274.20Wholesale and retail trade; repair of motor vehicles and motorcycles 207.23 256.32 381.92 289.19Transportation and storage 317.84 315.22 466.08 352.60Accommodation and food service activities 234.13 249.08 284.60 258.96Publishing, audiovisual and broadcasting activities 283.06 311.06 365.98 353.88Financial and insurance activities 317.31 411.89 676.97 535.14Real estate activities 214.72 279.75 448.34 391.31Legal, accounting, management, architecture, engineering, technical testing and analysis activities 246.88 342.88 394.33 377.30
Administrative and support service activities 244.70 255.30 411.18 291.41Public administration and defence; compulsory social security 245.92 310.60 457.72 394.86Education 239.06 320.93 524.45 453.44Residential care and social work activities 233.09 194.57 404.62 248.00Arts, entertainment and recreation 247.87 300.58 392.59 344.63Other service activities 198.92 302.51 439.89 327.62
All sectors 245.17 290.66 435.31 345.21
Direct production 268.11 307.70 370.74 316.86Services 241.22 287.73 440.12 348.87
Compiled from data provided by the Department of Industrial and Employment Relations and JobsPlus
wage rates represent the actual change in wages occurring during the period under observation.
The weighted average weekly wage for all fi rms as at August 2017 stood at €352.59. Similar to the observations as at August 2016, the highest average weekly wage rates as at August 2017 were recorded by the Financial and insurance activities sub-sector, which had a weekly average weighted remuneration of €542.17. This was followed by the Education sub-sector registering an average wage of €464.60. The least remunerated sub-sectors in the sample were the Residential care and social work activities

104 Economic Survey October 2017
Average Weekly WagesAugust 2017
Table 6.6 €
Level 1 Level 2 Level 3 WeightedAverage
Manufacture of food products, beverages and tobacco products 242.68 299.78 379.64 303.33Manufacture of textiles, apparel, leather and related products 297.08 313.15 365.92 319.85Manufacture of wood and paper products, and printing 318.97 350.90 392.71 353.59Manufacture of chemicals and chemical products 273.78 308.94 340.40 308.64Manufacture of pharmaceuticals, medicinal chemical and botanical products 320.75 364.58 421.96 390.64Manufacture of rubber and plastics products, and other non-metallic mineral products 265.67 303.57 353.61 304.10
Manufacture of basic metals and fabricated metal products, except machinery and equipment 318.33 327.10 351.01 329.95
Manufacture of computer, electronic and optical products 234.37 277.18 323.71 292.97Other manufacturing, and repair and installation of machinery and equipment 281.32 317.30 404.03 332.64Water supply; sewerage, waste management and remediation activities 247.50 284.96 384.40 288.32Wholesale and retail trade; repair of motor vehicles and motorcycles 213.65 262.23 388.62 295.42Transportation and storage 324.28 320.87 486.37 361.96Accommodation and food service activities 237.24 253.56 288.99 263.16Publishing, audiovisual and broadcasting activities 284.81 312.81 367.73 355.63Financial and insurance activities 320.87 415.70 687.59 542.17Real estate activities 221.95 286.99 459.92 401.56Legal, accounting, management, architecture, engineering, technical testing and analysis activities 253.31 350.56 403.29 385.88
Administrative and support service activities 250.21 257.42 418.77 296.04Public administration and defence; compulsory social security 253.99 319.06 469.51 405.32Education 245.02 328.85 537.35 464.60Residential care and social work activities 238.62 197.49 415.35 252.98Arts, entertainment and recreation 254.25 307.13 402.57 352.87Other service activities 201.39 307.37 449.32 333.45
All sectors 251.06 296.20 445.12 352.59
Direct production 273.25 312.85 377.14 322.33Services 247.24 293.33 450.17 356.49
Compiled from data provided by the Department of Industrial and Employment Relations and JobsPlus
(€252.98), the Accommodation and food service activities (€263.16) and the Water supply; sewerage, waste management and remediation activities (€288.32). The lowest reported wage resulted at Level 2 under the Residential care and social work activities sub-sector (€197.49), which is €27.73 or 16.33 per cent over the National Minimum Wage for 2017, which stood at €169.76. The highest average wage was at Level 3 in the Financial and insurance activities sub-sector at €687.59, while other relatively high wages were registered in the Education (€537.35) and the Public administration and defence; compulsory social security sub-sectors (€469.51) under the same level.

Economic Survey October 2017 105
Percentage Growth in Average Weekly WagesAugust 2017 - August 2016
Table 6.7 per cent
Level 1 Level 2 Level 3 WeightedAverage
Manufacture of food products, beverages and tobacco products 2.46 2.24 2.64 2.42Manufacture of textiles, apparel, leather and related products 3.03 2.87 3.90 3.06Manufacture of wood and paper products, and printing 0.55 0.50 0.45 0.50Manufacture of chemicals and chemical products 2.62 1.98 2.10 2.20Manufacture of pharmaceuticals, medicinal chemical and botanical products 2.15 1.86 1.56 1.71Manufacture of rubber and plastics products, and other non-metallic mineral products 1.09 0.84 0.79 0.87
Manufacture of basic metals and fabricated metal products, except machinery and equipment 1.84 1.79 1.67 1.77
Manufacture of computer, electronic and optical products 1.77 1.21 1.01 1.14Other manufacturing, and repair and installation of machinery and equipment 2.37 2.28 2.12 2.24Water supply; sewerage, waste management and remediation activities 5.32 5.33 4.56 5.15Wholesale and retail trade; repair of motor vehicles and motorcycles 3.10 2.31 1.75 2.15Transportation and storage 2.03 1.79 4.35 2.65Accommodation and food service activities 1.33 1.80 1.54 1.62Publishing, audiovisual and broadcasting activities 0.62 0.56 0.48 0.49Financial and insurance activities 1.12 0.93 1.57 1.31Real estate activities 3.37 2.59 2.58 2.62Legal, accounting, management, architecture, engineering, technical testing and analysis activities 2.60 2.24 2.27 2.27
Administrative and support service activities 2.25 0.83 1.84 1.59Public administration and defence; compulsory social security 3.28 2.72 2.57 2.65Education 2.49 2.47 2.46 2.46Residential care and social work activities 2.37 1.50 2.65 2.01Arts, entertainment and recreation 2.57 2.18 2.54 2.39Other service activities 1.24 1.61 2.14 1.78
All sectors 2.40 1.90 2.25 2.14
Direct production 1.92 1.67 1.73 1.73Services 2.50 1.95 2.28 2.18
Compiled from data provided by the Department of Industrial and Employment Relations and JobsPlus
Table 6.7 shows percentage changes in average weekly wage occurring between August 2016 and August 2017. The weighted average increase for all fi rms stood at 2.1 per cent. The average wage in the direct production sector increased by €5.47 or 1.7 per cent to reach €322.33 in August 2017, while the average weekly wage rate in the services sector increased by €7.62 or 2.2 per cent, thus reaching €356.49 in August 2017. The sub-sectors which recorded the highest percentage increase were the Water supply; sewerage, waste management and remediation activities which registered an increase of 5.2 per cent, followed
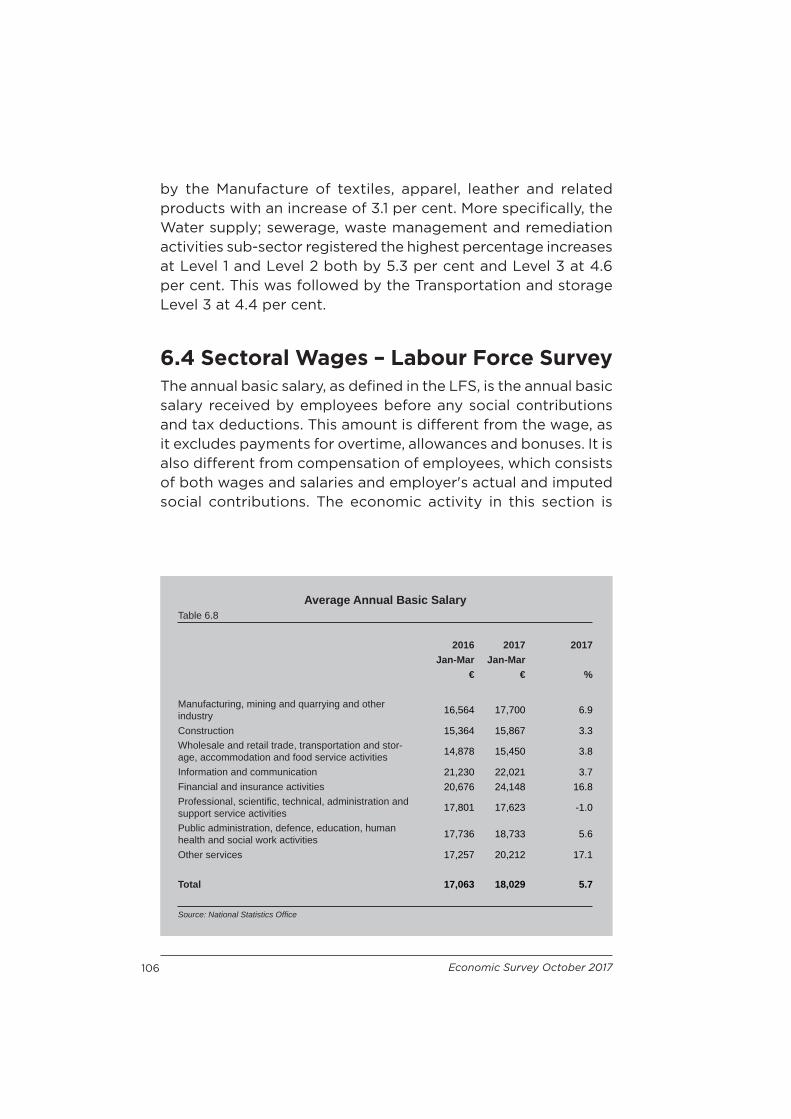
106 Economic Survey October 2017
by the Manufacture of textiles, apparel, leather and related products with an increase of 3.1 per cent. More specifi cally, the Water supply; sewerage, waste management and remediation activities sub-sector registered the highest percentage increases at Level 1 and Level 2 both by 5.3 per cent and Level 3 at 4.6 per cent. This was followed by the Transportation and storage Level 3 at 4.4 per cent.
6.4 Sectoral Wages – Labour Force SurveyThe annual basic salary, as defi ned in the LFS, is the annual basic salary received by employees before any social contributions and tax deductions. This amount is diff erent from the wage, as it excludes payments for overtime, allowances and bonuses. It is also diff erent from compensation of employees, which consists of both wages and salaries and employer's actual and imputed social contributions. The economic activity in this section is
Average Annual Basic SalaryTable 6.8
2016 2017 2017Jan-Mar Jan-Mar
€ € %
Manufacturing, mining and quarrying and other industry 16,564 17,700 6.9
Construction 15,364 15,867 3.3Wholesale and retail trade, transportation and stor-age, accommodation and food service activities 14,878 15,450 3.8
Information and communication 21,230 22,021 3.7Financial and insurance activities 20,676 24,148 16.8Professional, scientifi c, technical, administration and support service activities 17,801 17,623 -1.0
Public administration, defence, education, human health and social work activities 17,736 18,733 5.6
Other services 17,257 20,212 17.1
Total 17,063 18,029 5.7
Source: National Statistics Offi ce
Economic Survey October 2017 107
classifi ed according to NACE Rev. 2 (Nomenclature générale des Activités économiques dans les Communautés Europeennes).
LFS fi gures for the average annual basic salary in Table 6.8 show that in the fi rst quarter of 2017, the average annual basic salary, for both public and private employees was 5.7 per cent higher than the level recorded a year earlier. The economic sectors with the highest average annual basic salary in the fi rst three months of the year included Financial and insurance activities (€24,148), Information and communication activities (€22,021) and Other services (€20,212). The highest growth rate was registered in the latter sector, which includes the Arts, entertainment and recreation sector amongst others, with an average annual basic salary growth of 17.1 per cent, followed by Financial and insurance activities with a growth of 16.8 per cent. On the other hand, the construction sector registered the lowest growth rate at 3.3 per cent. The lowest average annual basic salary was registered in the Wholesale and retail trade, transportation and storage, accommodation and food service activities sector at €15,450, but the fi gure is still 3.8 per cent higher than the level recorded a year earlier.


7. International Trade


Economic Survey October 2017 111
7. International TradeThis Chapter seeks to provide an outline of Malta’s imports and exports with respect to the provision of goods and their fl ows by geographical distribution and type of commodity. The trade balance, defi ned as the diff erence between exports and imports will also be explored.
7.1 Exports of GoodsFor the period January to July 2017, Malta’s total exports declined by 32.1 per cent over the corresponding period in 2016, reaching a value of €1,555.9 million. Total exports net of fuel decreased by 32.6 per cent to a value of €1,167.7 million.
During the review period, chemicals exports fell by 75.8 per cent while the exports of fuel also fell by 30.6 per cent. The former can be attributed to a base eff ect following a substantial one-off consignment of pharmaceutical products which was exported to the United States (USA) in 2016, while the declining exports of oil relative to the increasing imports would suggest an increase in domestic consumption.
Exports of food, beverages and tobacco increased by €5.4 million (or 5.0 per cent), as a result of higher exports of fi sh. Exports of machinery and transport equipment experienced a recovery, increasing by €11.8 million (or 2.2 per cent) explained by the increases in the exports of electrical machinery and higher exports of mechanical machinery and appliances. Miscellaneous manufactured articles rose by €8.5 million (or 3.7 per cent) refl ecting higher exports of clothing, footwear, plastics and toys which more than off set lower exports of printed matter and iron made articles.
The breakdown of commodity exports is outlined in Table 7.1 and Chart 7.1.

112 Economic Survey October 2017
Chart 7.1
Commodity Breakdown of ExportsTable 7.1 € million
2013 2014 2015 2016 2016 2017Jan-Jul Jan-Jul
Food, Beverages and Tobacco 247.5 242.4 287.8 295.8 108.4 113.8Fuels 1,665.7 1,608.2 1,357.5 926.6 559.8 388.2Chemicals 358.2 377.3 363.6 921.9 778.1 188.1Machinery and Transport Equipment 1,112.4 1,000.7 968.0 960.3 536.8 548.6Miscellaneous Manufactured Articles* 404.5 375.9 411.5 406.6 226.6 235.1Other Manufactures 137.3 134.2 139.6 134.7 83.1 82.1
Total Exports 3,925.5 3,738.7 3,528.0 3,645.9 2,292.8 1555.9
Total Exports excl. Fuels 2,259.9 2,130.4 2,170.5 2,719.2 1,733.0 1,167.7
* This category includes; furniture and fi xtures, travel goods and accessories, clothing and accessories, footwear, scientifi c instruments and optical equipment.
Source: National Statistics Offi ce
Food, Beverages and Tobacco
7.3%
Fuels25.0%
Chemicals12.1%
Machinery and Transport Equipment
35.3%
Miscellaneous Manufactured
Articles*15.1%
Other Manufactures5.3%
Commodity Breakdown of ExportsJanuary - July 2017
Economic Survey October 2017 113
7.1.1 Geographical Distribution - ExportsDuring the period January to July 2017, exports were mainly directed towards Europe, which accounted for 45.6 per cent of total exports. As shown in Table 7.2, the bulk of these exports were to countries within the European Union (EU), amounting to €657.6 million or 42.3 per cent. When analysing the main developments within the EU, Malta registered a decrease of 33.0 per cent in exports to the United Kingdom (UK), a 32.5 per cent decrease in exports to Italy, and a decrease of 21.2 per cent to the Netherlands. Partly off setting these negative growth rates was an increase of 36.1 per cent in exports to Spain.
Exports to other European countries amounted to €52.4 million which was €12.3 million higher than the exports registered in January to July period of 2016.
Meanwhile, exports towards America declined substantially by 84.6 per cent from €698.8 million to €107.9 million, mainly attributed to a base eff ect from the substantial sale of pharmaceuticals to the USA in 2016. In fact, total exports to the USA only accounted for 5.0 per cent of total exports during the period January to July 2017, which is signifi cantly less than the 29.1 per cent of total exports recorded throughout the corresponding period of 2016. Malta’s exports to Africa declined by 17.0 per cent, reaching €291.8 million, accounting for 18.8 per cent of total exports for the period January to July 2017. This was due to a drop in the export of machinery, mechanical appliances and electrical machinery to Libya, in conjunction with lower exports of fuels to Egypt.
Exports to Asia increased by 6.5 per cent to reach €295 million, equivalent to 19.0 per cent of total exports over the period January to July 2017. Behind this growth was an increase of €21.8 million in exports to Hong Kong mainly related to electrical machinery, an increase of €8.1 million in exports to China mainly attributed to machinery, mechanical appliances and electrical machinery as well as a €6.3 million increase in exports to Japan, related to electrical appliances and fi sh. These were suffi cient

114 Economic Survey October 2017
to off set the €17.1 million decline in exports to Singapore mainly stemming from lower exports in electrical machinery. Exports to ships and aircrafts, which mainly represent bunkering activities, declined by 32.4 per cent.
Total Exports by Main Geographical AreasTable 7.2 € million
2013 2014 2015 2016 2016 2017Jan-Jul Jan-Jul
Europe 1,535.4 1,321.3 1,156.7 1,255.2 740.7 710.0 EU 1,246.1 1,105.8 1,079.1 1,183.5 700.6 657.6 Italy 154.1 161.2 137.7 208.8 144.4 97.5 Germany 348.6 309.2 334.1 389.0 225.3 232.2 France 253.0 204.1 239.6 229.7 123.8 124.8 UK 107.8 99.3 126.4 106.1 65.9 44.2 Netherlands 47.3 39.2 31.5 34.4 17.2 13.6 Spain 34.6 35.8 36.2 33.2 20.0 27.3 Others 300.6 257.0 173.7 182.3 103.9 118.0 Euro Area 953.6 835.6 826.0 947.6 561.5 526.1 Other European Countries 289.3 215.5 77.5 71.7 40.1 52.4Africa 617.3 971.3 934.9 563.5 351.6 291.8 Libya 238.0 208.6 120.0 124.8 77.6 52.6 Others 379.3 762.8 815.0 438.7 274.0 239.2America 224.7 231.3 222.7 802.8 698.8 107.9 USA 170.0 164.1 135.6 740.9 667.2 78.1 Others 54.7 67.2 87.0 61.8 31.6 29.8Oceania 9.8 14.4 17.3 14.1 7.7 4.6Asia 1,059.6 767.4 715.8 671.6 277.0 295.0 Japan 196.5 106.0 109.4 144.7 12.0 18.4 Singapore 272.2 185.4 169.9 153.5 89.9 72.7 China 45.6 23.4 43.5 43.7 13.9 22.0 Hong Kong 199.2 203.7 171.5 118.4 62.5 84.3 India 31.5 30.6 21.0 15.4 7.0 5.4 South Korea 11.3 37.1 16.1 27.6 5.9 10.2 Others 303.3 181.2 184.3 168.3 85.9 82.0Ships & Aircraft 478.7 433.0 480.6 338.6 217.0 146.6
Total Exports 3,925.5 3,738.7 3,528.0 3,645.9 2,292.8 1,555.9
Exports to the EU as % of Total 31.7 29.6 30.6 32.5 30.6 42.3
Source: National Statistics Offi ce

Economic Survey October 2017 115
7.2 Imports of GoodsDuring the period January to July 2017, imports of goods decreased by 12.0 per cent to reach a value of €3,636.5 million. Total imports net of fuel declined by 22.5 per cent throughout the fi rst seven months of 2017 from €3,223.9 million to €2,498.4 million. Data on imports of goods is presented in Table 7.3 and Chart 7.2.
Imports of consumer goods registered a growth of 4.3 per cent in refl ection of an increase of €10.1 million in food and beverages imports, an increase of €6.6 million in imports of durable consumer goods and a substantial increase of €13.6 million in imports of other consumer goods. The other consumer goods imports category includes a variety of non-durable goods, yet
Imports by Broad Economic CategoryTable 7.3 € million
2013 2014 2015 2016 2016 2017Jan-Jul Jan-Jul
Consumer Goods Food and Beverages 451.0 472.7 485.9 498.8 276.4 286.5 Durable Goods 335.5 374.0 453.8 433.5 253.9 260.5 Others 254.2 269.3 284.3 308.8 173.6 187.2Total 1,040.8 1,116.0 1,224.0 1,241.1 704.0 734.3
Industrial Supplies Primary 95.1 81.2 80.0 106.6 62.7 65.1 Semi-fi nished 1,274.4 1,169.8 1,178.2 1,014.4 601.0 579.2 Finished 160.0 151.0 210.8 193.2 105.1 109.2Total 1,529.5 1,402.0 1,469.0 1,314.2 768.8 753.6
Capital and Others Capital Goods 867.5 1,309.5 1,717.3 2,250.9 1,744.0 1,007.0 Fuel 2,179.7 2,561.1 1,689.4 1,672.3 908.5 1,138.1 Non-specifi ed and Gold 22.2 13.0 15.0 12.6 7.1 3.5Total 3,069.3 3,883.6 3,421.8 3,935.8 2,659.6 2,148.7
Total Imports 5,639.6 6,401.6 6,114.8 6,491.1 4,132.4 3,636.5
Total Imports excl. Fuel 3,460.0 3,840.5 4,425.3 4,818.8 3,223.9 2,498.4
Source: National Statistics Offi ce
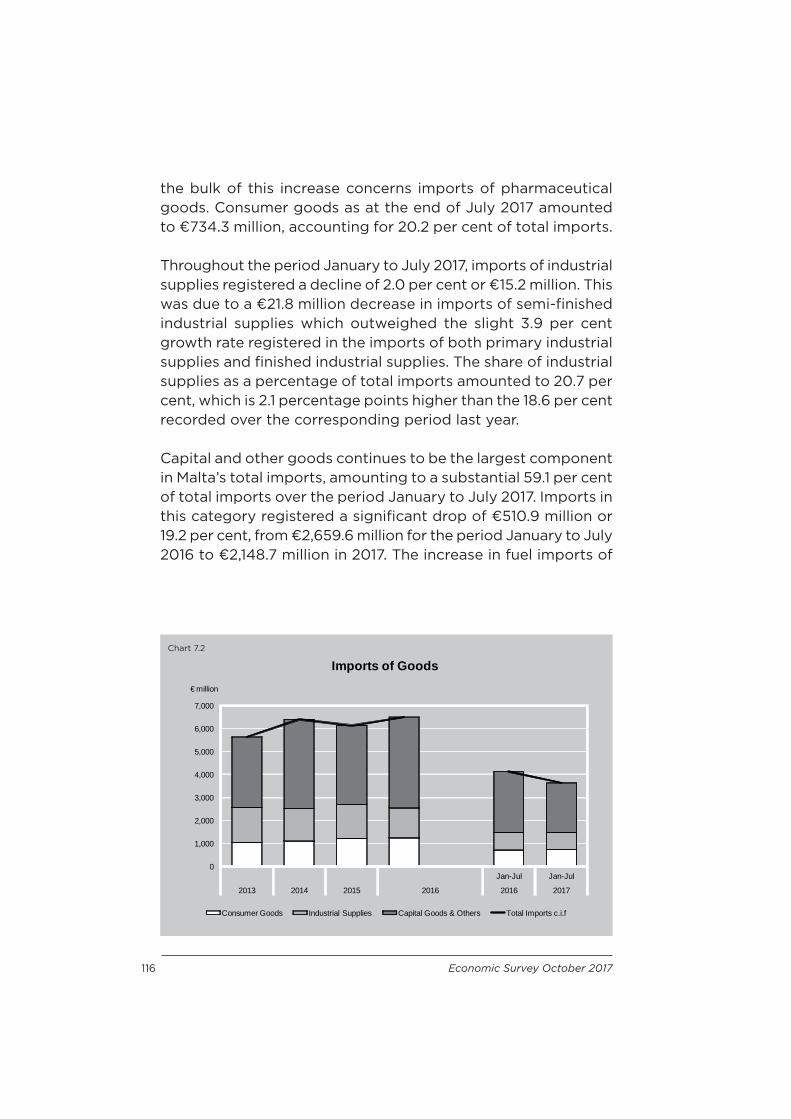
116 Economic Survey October 2017
the bulk of this increase concerns imports of pharmaceutical goods. Consumer goods as at the end of July 2017 amounted to €734.3 million, accounting for 20.2 per cent of total imports.
Throughout the period January to July 2017, imports of industrial supplies registered a decline of 2.0 per cent or €15.2 million. This was due to a €21.8 million decrease in imports of semi-fi nished industrial supplies which outweighed the slight 3.9 per cent growth rate registered in the imports of both primary industrial supplies and fi nished industrial supplies. The share of industrial supplies as a percentage of total imports amounted to 20.7 per cent, which is 2.1 percentage points higher than the 18.6 per cent recorded over the corresponding period last year.
Capital and other goods continues to be the largest component in Malta’s total imports, amounting to a substantial 59.1 per cent of total imports over the period January to July 2017. Imports in this category registered a signifi cant drop of €510.9 million or 19.2 per cent, from €2,659.6 million for the period January to July 2016 to €2,148.7 million in 2017. The increase in fuel imports of
Chart 7.2
0
1,000
2,000
3,000
4,000
5,000
6,000
7,000
Jan-Jul Jan-Jul
2013 2014 2015 2016 2016 2017
€ million
Imports of Goods
Consumer Goods Industrial Supplies Capital Goods & Others Total Imports c.i.f

Economic Survey October 2017 117
€229.6 million, or 25.3 per cent was off set by a sharp decline in imports of capital goods of 42.3 per cent, equivalent to €737.0 million. This refl ected the substantial drop in imports of aircraft and sea vessels following the extraordinary increase registered in 2016. This resulted in imports of capital goods as a percentage of total imports to decline by 14.5 percentage points from 40.2 per cent to 27.7 per cent.
7.2.1 Geographical Distribution – ImportsTable 7.4 shows developments in the geographical distribution of imports. Over the January to July 2017 period, total imports from Europe reached a level of €2,252.5 million, which represented 61.9 per cent of total imports. This was 11.2 percentage points higher than that recorded in 2016. Around 52.6 per cent of total imports relate to countries within the EU. Increasing imports from Spain (€57.3 million), the UK (€51.7 million) and Italy (€22.6 million) more than off set the decreases in imports of €46.1 million and €44.2 million from France and the Netherlands respectively. Imports with other European countries outside the EU, increased by €94.9 million reaching a value of €339.4 million, over the period January to July 2017.
Throughout the period January to July 2017, Malta’s imports from the Americas declined substantially by 56.5 per cent from €1,403.6 million to €611.0 million. This decline included a €410 million drop in imports of sea vessels and yachts from the Caribbean, an aggregated €389 million drop in imports of aircraft from both the USA and Canada, and a €58.4 million drop in imports of fuels from the USA. In terms of the share in total imports, a decline from 34.0 per cent to 16.8 per cent was registered from the American continent.
Imports from Africa increased by 18.1 per cent or €25.5 million to represent 4.6 per cent of total imports. An increase in imports by €28.4 million from Egypt and by €10.4 million from Cameroon were mainly related to fuel, while the €22.3 million imports from

118 Economic Survey October 2017
Equatorial Guinea were entirely liquefi ed natural gas. An increase in imports of yachts from South Africa contributed signifi cantly to the increase of €6.6 million in goods imported from this country. Meanwhile, a decline of €35.9 million was registered in imports of gas from Tunisia.
Malta’s imports from Asia increased substantially by 26.2 per cent, attributed to a growth by €85.1 million in imports from Singapore, €15.2 million in imports from Taiwan, €10.3 million
Total Imports by Main Geographical AreasTable 7.4 € million
2013 2014 2015 2016 2016 2017Jan-Jul Jan-Jul
Europe 4,066.4 4,285.6 4,284.7 3,684.0 2,098.2 2,252.5 EU 3,245.5 3,228.2 3,633.4 3,235.7 1,853.7 1,913.1 Italy 1,410.4 1,178.7 1,299.9 1,247.0 707.3 729.8 Germany 321.4 324.6 380.0 374.6 219.0 226.5 France 285.6 224.9 234.2 259.3 182.8 136.7 UK 309.5 390.6 418.8 347.6 213.2 264.9 Netherlands 202.4 231.6 438.8 230.7 143.2 99.0 Spain 168.4 237.4 230.0 203.8 84.5 141.9 Others 547.7 640.5 631.8 572.7 303.7 314.3 Euro Area 2,639.3 2,521.2 2,889.0 2,656.7 1,509.5 1,534.3 Other European Countries 820.9 1,057.4 651.3 448.3 244.5 339.4Africa 256.4 236.1 163.2 269.6 140.9 166.5 Libya 113.1 24.0 55.9 11.5 2.6 2.6 Others 143.4 212.0 107.3 258.0 138.3 163.8America 387.9 986.6 823.6 1,692.7 1,403.6 611.0 USA 187.9 610.2 294.3 292.3 203.3 180.5 Others 200.0 376.4 529.3 1,400.4 1,200.3 430.5Oceania 18.0 80.8 36.0 31.8 20.3 19.4Asia 827.6 733.6 783.0 803.9 462.9 584.0 Japan 49.0 49.2 70.1 53.1 32.7 30.3 Singapore 80.8 60.0 71.1 31.5 16.4 101.6 China 136.5 147.7 217.0 202.4 120.1 123.5 Hong Kong 17.4 17.9 26.5 40.0 27.0 13.5 India 86.9 100.7 108.0 112.6 68.4 78.7 South Korea 77.6 75.4 44.4 61.3 45.4 24.8 Others 379.4 282.8 245.9 302.9 153.0 211.7Ships & Aircraft 83.2 79.0 24.2 9.2 6.6 3.1
Total Imports 5,639.6 6,401.6 6,114.8 6,491.1 4,132.4 3,636.5
Imports to the EU as % of Total 57.5 50.4 59.4 49.8 44.9 52.6
Source: National Statistics Offi ce

Economic Survey October 2017 119
imports from India, and a €3.4 million increase in Chinese imports. The increases in imports from Singapore and Taiwan mainly related to machinery, mechanical appliances and electrical machinery, while the higher imports from India were in pharmaceuticals. Decreases in imports were registered from Hong Kong and South Korea, with the former declining by 50.0 per cent and the latter declining by 45.3 per cent. There was a decline in the imports of sea vessels and yachts coming from Hong Kong, while lower imports from South Korea were due to a lower demand for fuel oil. In the meantime, imports from Japan also declined by 7.4 per cent, related to machinery and mechanical appliances. As at the end of July 2017, imports from Asian countries accounted for 16.1 per cent in total exports. Imports from ships and aircrafts also declined by €3.4 million, reaching a level of imports of €3.1 million.
7.3 Trade BalanceHistorically, Malta has recorded a trade defi cit which has widened over time, averaging at 27.0 per cent of Gross Domestic Product (GDP) at current market prices over the past fi ve years. As at the end of July 2017, Malta’s visible negative trade gap, which shows the diff erence between exports and imports of goods, increased by €241 million, resulting in a negative trade balance of €2,080.6 million. Total exports decreased by €736.9 million, surpassing the decrease in imports of €495.9 million and thus widening the trade defi cit. Table 7.5 and Chart 7.3 illustrate these developments.
International trade in Malta has been highly infl uenced by the involvement of off shore oil bunkering activities and transhipment of oil. Such activities, however, may have a limited impact on the national accounts, balance of payments and employment data given their limited economic linkages to the Maltese economy. When excluding fuels from trade data, the visible trade gap increased by €160.2 million, amounting to €1,330.7 million over the January to July period of 2017. This refl ects a decrease in non-fuel imports of €725.5 million, which exceeded the decrease in non-fuel exports of €565.3 million.

120 Economic Survey October 2017
Chart 7.3
Foreign TradeTable 7.5 € million
2013 2014 2015 2016 2016 2017Jan-Jul Jan-Jul
Imports (c.i.f.) 5,639.6 6,401.6 6,114.8 6,491.1 4,132.4 3,636.5
Total Exports (f.o.b.) 3,925.5 3,738.7 3,528.0 3,645.9 2,292.8 1,555.9
Trade Gap -1,714.1 -2,662.9 -2,586.8 -2,845.2 -1,839.6 -2,080.6
Source: National Statistics Offi ce
-3,000
-2,500
-2,000
-1,500
-1,000
-500
0
0
1,000
2,000
3,000
4,000
5,000
6,000
7,000
Jan-Jul Jan-Jul
2013 2014 2015 2016 2016 2017
€ million€ millionForeign Trade
Imports (c.i.f.) Total Exports (f.o.b.) Trade Gap (Secondary Axis)

Economic Survey October 2017 121
7.3.1 Geographical Distribution – Trade BalanceTable 7.6 illustrates the trade balance held with a number of countries and regions. Malta has been registering a trade defi cit with most countries within the EU, in particular Italy, the UK, the Netherlands and Spain. Throughout the period January to July 2017, the trade defi cit continued to widen by 77.7 per cent with Spain, by 49.8 per cent with the UK and by 12.3 per cent with Italy, so that in total, Malta’s trade defi cit with the EU increased by €102.4 million, reaching €1,255.5 million.
With respect to countries outside the EU, the main development was Malta’s trade balance with the USA, which from a trade surplus of €463.9 million in 2016 returned to a historical defi cit of €102.4 million. A similar outcome occurred in the trade balance with Singapore, which shifted from a €73.5 million surplus to a €28.9 million defi cit. As for Hong Kong, the trade surplus improved from €35.5 million to €70.8 million, while the trade
Trade Balances with Various CountriesTable 7.6 € million
2013 2014 2015 2016 2016 2017Jan-Jul Jan-Jul
EU -1,999.4 -2,122.4 -2,554.3 -2,052.2 -1,153.1 -1,255.5Italy -1,256.3 -1,017.5 -1,162.2 -1,038.2 -562.9 -632.3Germany 27.2 -15.4 -45.9 14.4 6.3 5.7France -32.6 -20.8 5.4 -29.6 -59.0 -11.9UK -201.7 -291.3 -292.4 -241.5 -147.3 -220.7Netherlands -155.1 -192.4 -407.3 -196.3 -126.0 -85.4Spain -133.8 -201.6 -193.8 -170.6 -64.5 -114.6Other EU -247.1 -383.5 -458.1 -390.4 -199.8 -196.3
Other CountriesLibya 124.9 184.6 64.1 113.3 75.0 50.0USA -17.9 -446.1 -158.7 448.6 463.9 -102.4Japan 147.5 56.8 39.3 91.6 -20.7 -11.9Singapore 191.4 125.4 98.8 122.0 73.5 -28.9China -90.9 -124.3 -173.5 -158.7 -106.2 -101.5Hong Kong 181.8 185.8 145.0 78.4 35.5 70.8
Source: National Statistics Offi ce

122 Economic Survey October 2017
surplus with Libya experienced a €25 million decline. In the meantime, improvements were registered in the trade defi cit with Japan and China which decreased by €8.8 million and €4.7 million, respectively.
7.4 Balance of PaymentsThe present balance of payments statement is based on the sixth edition of the International Monetary Fund’s (IMF) balance of payments and international investment position manual (BPM6). During the fi rst six months of 2016, Malta experienced a narrowing of the surplus in the current account. The data available for this section spans from January to June of this year.
7.4.1 Current AccountMalta’s current account has been recording a surplus since 2012, contingent mainly on structural developments, improved competitiveness of the Maltese economy from a supply perspective, developments in international capital fl ows, and supported by a demand-induced eff ect following the gradual global economic recovery from the fi nancial crisis. In fact, Malta’s current account surplus averaged at 4.9 per cent of GDP over the past 5 years (2012 to 2016). Whilst similar developments are also evident in the rest of the European continent, the main distinguishing factor in Malta is that the surplus is supported by a strong economic performance, a structural fi scal surplus and a substantial growth in investment activity suggesting that the surplus is more prominently a feature of structural improvements in the economy which can be sustained over time.
The current account balance for Malta has continued to record consistent surpluses mainly driven by the growth in net exports primarily related to services activity. A number of indicators also show that the domestic component of production of goods but more prominently of services, has also been increasing, a development that is consistent with the growing goods and services balance. The positive developments in the current account balance are even more pronounced when one considers
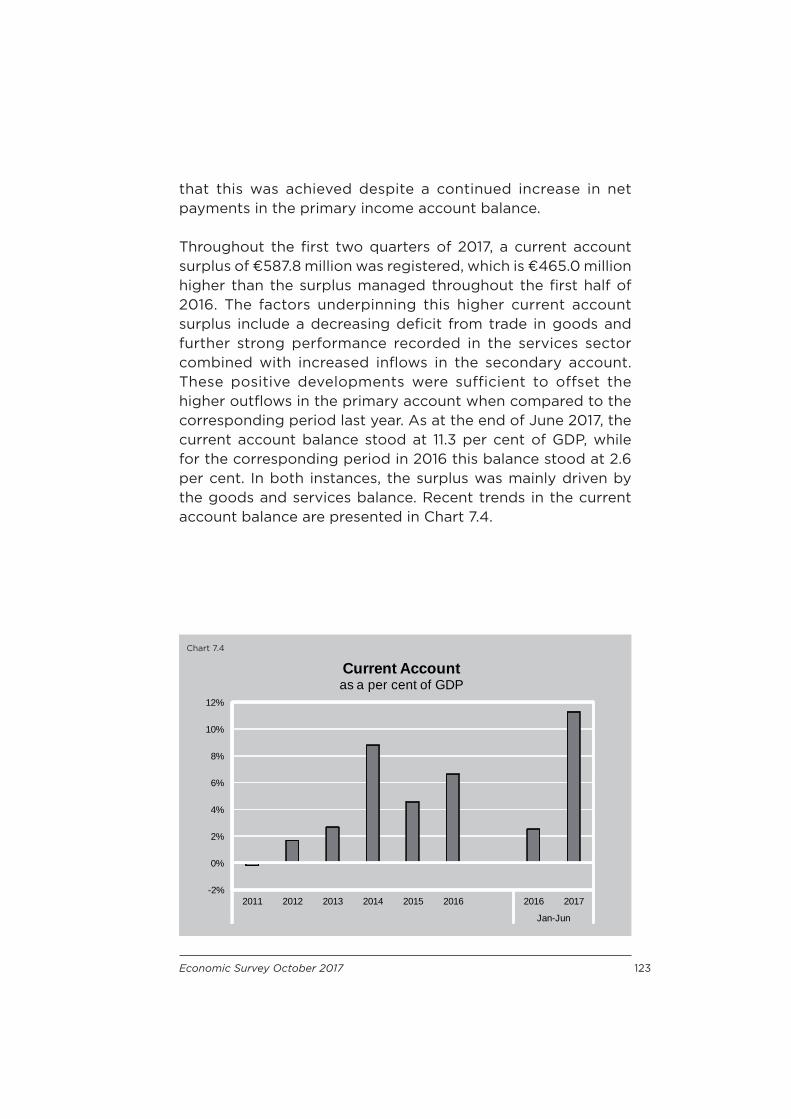
Economic Survey October 2017 123
that this was achieved despite a continued increase in net payments in the primary income account balance.
Throughout the fi rst two quarters of 2017, a current account surplus of €587.8 million was registered, which is €465.0 million higher than the surplus managed throughout the fi rst half of 2016. The factors underpinning this higher current account surplus include a decreasing defi cit from trade in goods and further strong performance recorded in the services sector combined with increased infl ows in the secondary account. These positive developments were sufficient to offset the higher outfl ows in the primary account when compared to the corresponding period last year. As at the end of June 2017, the current account balance stood at 11.3 per cent of GDP, while for the corresponding period in 2016 this balance stood at 2.6 per cent. In both instances, the surplus was mainly driven by the goods and services balance. Recent trends in the current account balance are presented in Chart 7.4.
Chart 7.4
-2%
0%
2%
4%
6%
8%
10%
12%
2011 2012 2013 2014 2015 2016 2016 2017
Jan-Jun
Current Accountas a per cent of GDP

124 Economic Survey October 2017
7.4.1.1 The Goods and Services AccountThe latest fi gures pertaining to the external balance indicate improved developments stemming from numerous fronts. The gradual global economic recovery following the fi nancial crisis has resulted in an increased demand for Malta’s exports. Also, the diversifi cation of the Maltese economy not only smoothened the risk associated with the small size of the economy, but also contributed to improved competitiveness. Moreover, the shift from a goods-oriented to a services-oriented economy also improved competitiveness.
Despite continuous increases in the goods defi cit resulting from higher imports over the years, the post-crisis surge in services exports by far outweighed the higher goods imports. In fact, the goods and services account has been the primary contributor towards the surplus in the current account.
As illustrated in Table 7.7, throughout the fi rst half of 2017, the goods and services balance remained positive as exports exceeded imports by €797.8 million. This was €461.6 million higher than the external balance registered throughout the corresponding period in 2016. As shown in Chart 7.5, the external balance as a percentage of GDP now stands at 15.3 per cent, when compared to the 8.4 per cent average over the period 2012 to 2016.
During the fi rst six months of 2017, net imports of goods declined by €254.8 million due to lower goods imports which were then partly off set by the decline in goods exports. Such developments are mainly explained by movements in transactions relating to general merchandise. The drop in goods imports of €266.5 million exceeded the decline in goods exports of €14.6 million, resulting in a merchandise trade defi cit which declined by €251.9 million over 2016, reaching €748.6 million. As a share of GDP, the general merchandise trade defi cit stood at 14.4 per cent.
While the goods account continues to register a persisting defi cit, the Maltese economy continues to export more services than it imports. Indeed, the surplus in services increased from
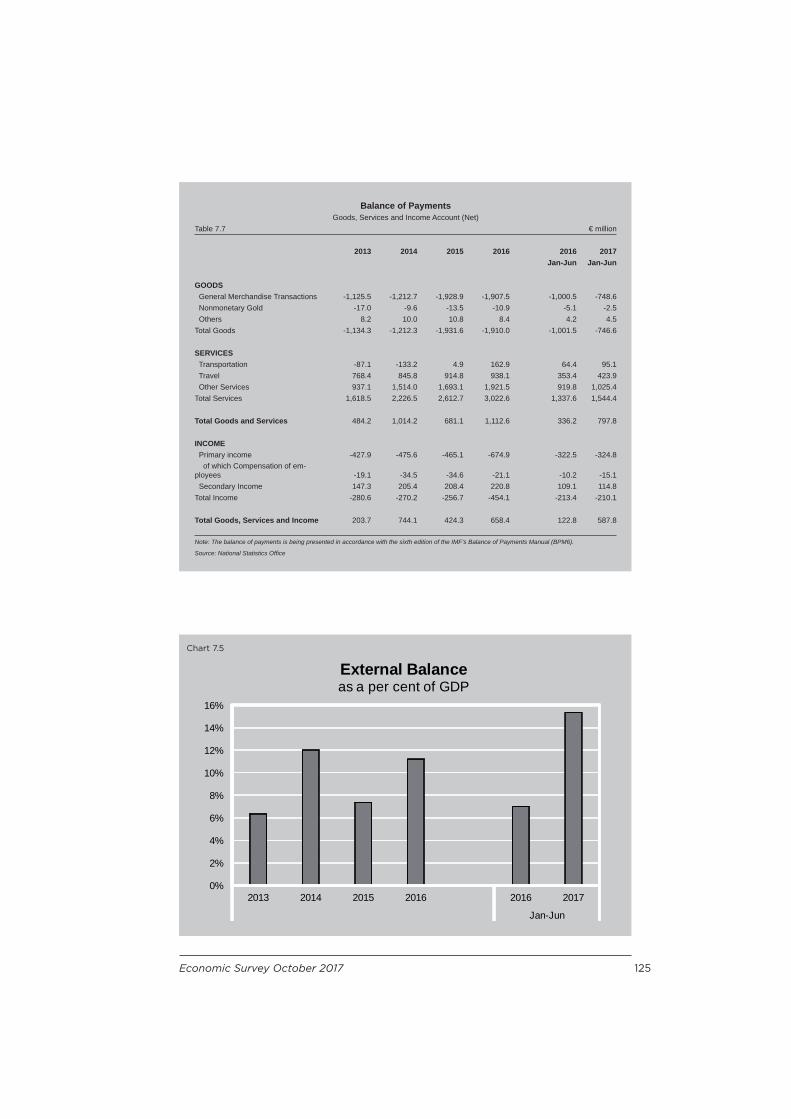
Economic Survey October 2017 125
Balance of PaymentsGoods, Services and Income Account (Net)
Table 7.7 € million
2013 2014 2015 2016 2016 2017Jan-Jun Jan-Jun
GOODS General Merchandise Transactions -1,125.5 -1,212.7 -1,928.9 -1,907.5 -1,000.5 -748.6 Nonmonetary Gold -17.0 -9.6 -13.5 -10.9 -5.1 -2.5 Others 8.2 10.0 10.8 8.4 4.2 4.5Total Goods -1,134.3 -1,212.3 -1,931.6 -1,910.0 -1,001.5 -746.6
SERVICES Transportation -87.1 -133.2 4.9 162.9 64.4 95.1 Travel 768.4 845.8 914.8 938.1 353.4 423.9 Other Services 937.1 1,514.0 1,693.1 1,921.5 919.8 1,025.4Total Services 1,618.5 2,226.5 2,612.7 3,022.6 1,337.6 1,544.4
Total Goods and Services 484.2 1,014.2 681.1 1,112.6 336.2 797.8
INCOME Primary income -427.9 -475.6 -465.1 -674.9 -322.5 -324.8 of which Compensation of em-ployees -19.1 -34.5 -34.6 -21.1 -10.2 -15.1 Secondary Income 147.3 205.4 208.4 220.8 109.1 114.8Total Income -280.6 -270.2 -256.7 -454.1 -213.4 -210.1
Total Goods, Services and Income 203.7 744.1 424.3 658.4 122.8 587.8
Note: The balance of payments is being presented in accordance with the sixth edition of the IMF’s Balance of Payments Manual (BPM6).
Source: National Statistics Offi ce
Chart 7.5
0%
2%
4%
6%
8%
10%
12%
14%
16%
2013 2014 2015 2016 2016 2017
Jan-Jun
External Balanceas a per cent of GDP

126 Economic Survey October 2017
20.2 per cent of GDP in 2012 to 30.4 per cent of GDP in 2016. This is around double the average of 15.6 per cent of GDP recorded pre-crisis.
Throughout the fi rst six months of 2017, the Maltese economy managed an invisible net export fi gure of €1,544.4 million, a rise of €206.8 million over January to June 2016. Although both services exports and imports experienced increases, the €323.6 million growth in exports more than off set the €116.8 million import growth.
The majority of net exports were composed mainly of developments in the personal cultural and recreation services sector, the travel sector and transport sector, where in each sector, imports were outweighed by exports. Notable developments in the other business services sector were also recorded, yet in this case imports continued to outweigh exports, resulting in a negative net exports balance.
The transport sector recorded an export fi gure of €402.9 million in the January to June period of 2017, an increase of €31.0 million over the corresponding period in 2016, while imports increased by a negligible €0.2 million to reach €307.7 million. Such an increase in the net exports balance was brought about by the continued expansion in the aviation industry in Malta. Indeed, this expansion in services was supported by the strong investment activity in transport equipment, particularly last year, which contributed to the rising defi cit in the goods balance in view of the import content of this investment.
Furthermore, Malta has managed to register consistent improvements in the tourism sector. During the fi rst six months of this year, the number of inbound tourists reached 1.0 million, an increase of 20.4 per cent when compared to the same period last year. This strong increase was mainly driven by a higher number of tourists that visited Malta for leisure purposes, although the number of business tourists also increased. The net exports registered by the travel sector were €423.9 million,
Economic Survey October 2017 127
since exports of €585.8 million outweighed the €162.0 million imports throughout the fi rst half of the year.
This marks further improvements over and above the already buoyant performance in the sector, brought about by increased tourism activity in Malta when compared to the activity by Maltese residents abroad.
The personal, cultural and recreational sector maintained its strong performance as a key contributor to the services surplus. From January to June 2017, exports over the corresponding period in 2016 continued to grow by €160.5 million, reaching €1,742.1 million. When netted against the relatively low €76.9 million imports fi gure, net exports in the personal cultural and recreational sector increased by €154.5 million over the corresponding half of 2016, reaching €1,665.2 million. These developments are primarily attributed to the expansion of the remote gaming sector in Malta.
The fi nancial services sector has also recorded an increase in net exports amounting to €16 million, mainly attributed to a €35.2 million decline in imports which exceeded the decrease in exports of €19.3 million.
When considering other business services, the negative net exports fi gure registered an increase of €19.6 million, since the increase in imports of other business services exceeded the growth in exports. A further disaggregation of this sector shows that the main increase in exports is attributed to an increase of €117.7 million in exports of professional and management consulting services. However, this was partly off set by a €44.2 million decline in exports of technical, trade-related and other business services. In terms of imports, both imports from professional and management consulting services as well as technical, trade-related and other business services increased by €51.3 million and €41.7 million, respectively. The overall result was an increase in the negative net exports of other business services from €706.2 million to €725.8 million.
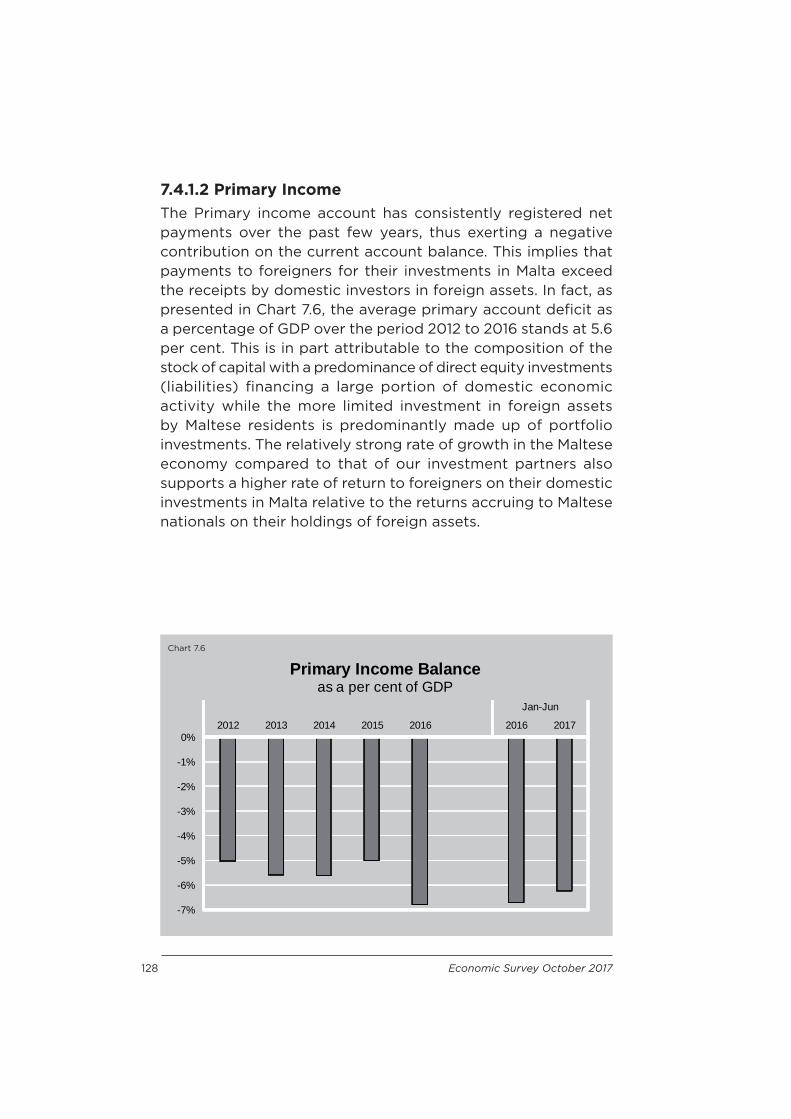
128 Economic Survey October 2017
7.4.1.2 Primary IncomeThe Primary income account has consistently registered net payments over the past few years, thus exerting a negative contribution on the current account balance. This implies that payments to foreigners for their investments in Malta exceed the receipts by domestic investors in foreign assets. In fact, as presented in Chart 7.6, the average primary account defi cit as a percentage of GDP over the period 2012 to 2016 stands at 5.6 per cent. This is in part attributable to the composition of the stock of capital with a predominance of direct equity investments (liabilities) fi nancing a large portion of domestic economic activity while the more limited investment in foreign assets by Maltese residents is predominantly made up of portfolio investments. The relatively strong rate of growth in the Maltese economy compared to that of our investment partners also supports a higher rate of return to foreigners on their domestic investments in Malta relative to the returns accruing to Maltese nationals on their holdings of foreign assets.
Chart 7.6
-7%
-6%
-5%
-4%
-3%
-2%
-1%
0%2012 2013 2014 2015 2016 2016 2017
Jan-Jun
Primary Income Balanceas a per cent of GDP

Economic Survey October 2017 129
Throughout the fi rst half of 2017, primary income net payments stood at €324.8 million, an increase of €2.3 million when compared to the corresponding period last year. The primary account defi cit as a percentage of GDP stands at 6.2 per cent, which is 0.5 percentage points higher than the defi cit recorded throughout the fi rst half of 2016.
This increase in net payments is a result of a €118.7 million decline in net receivables which mitigated the €116.3 million decline in net payables. Net receivables as at the end of June 2017 stood at €4,791.5 million while net payables were recorded at €5,116.3 million.
Compensation of employees, which represents a minor component of the primary income account, contributed €15.1 million in net payments to the total balance. The investment income account contributed €267.1 million in net payments whilst other primary income contributed to €42.6 million in net payments.
A disaggregation of the investment income component shows that a decrease of €94.8 million in direct investment net payments was registered when compared to the corresponding period in 2016. This is mainly due to lower Foreign Direct Investment outfl ows related to a €225.3 million decline in dividends and withdrawals from income of quasi-corporations that were then partially off set by an increase in reinvested earnings outfl ows of €127.4 million. Coupled with a minor decrease in receivables, direct investment net payments stood at €4,369.9 million.
Throughout the fi rst two quarters of 2017, portfolio investment net income receivables registered a decline of €103.6 million, attributed to a substantial decline in receivables. The dwindling portfolio investment net receivables fi gure is in fact the main contributor to the decline in primary income net payments when compared to the fi rst half of 2016.
When compared to January to June 2016, other investment net receivables increased by €20.8 million over the fi rst half of 2017,
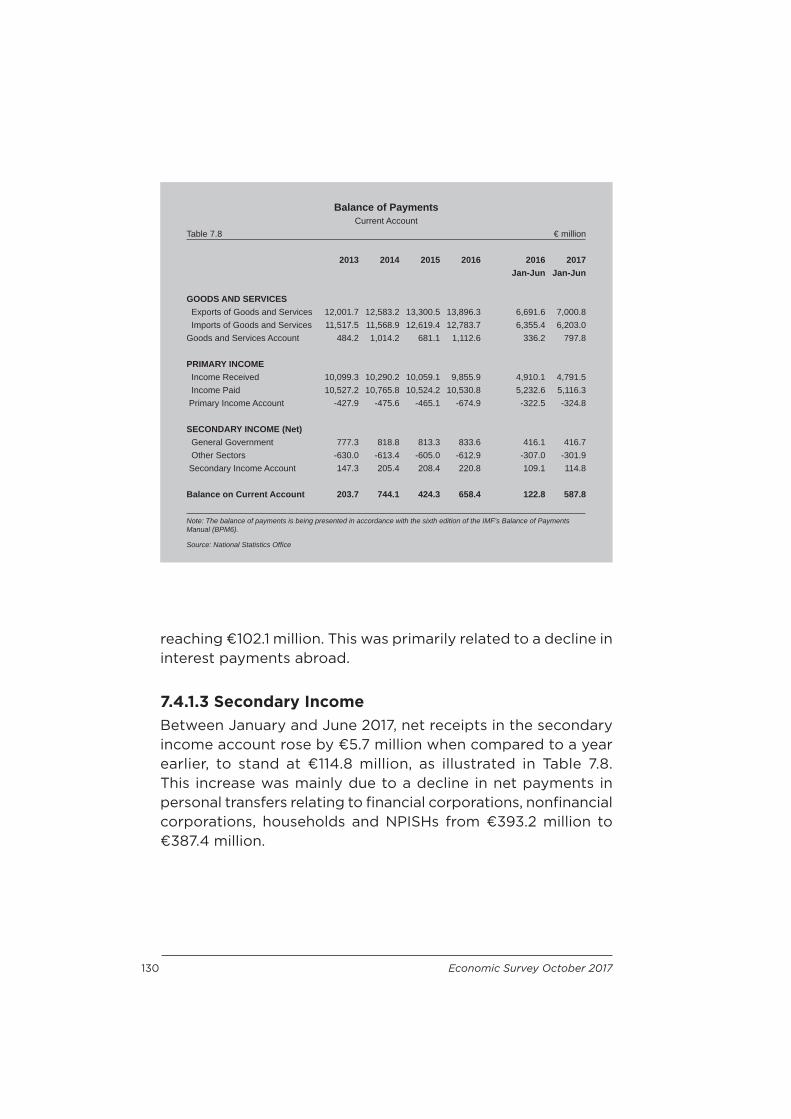
130 Economic Survey October 2017
reaching €102.1 million. This was primarily related to a decline in interest payments abroad.
7.4.1.3 Secondary IncomeBetween January and June 2017, net receipts in the secondary income account rose by €5.7 million when compared to a year earlier, to stand at €114.8 million, as illustrated in Table 7.8. This increase was mainly due to a decline in net payments in personal transfers relating to fi nancial corporations, nonfi nancial corporations, households and NPISHs from €393.2 million to €387.4 million.
Balance of PaymentsCurrent Account
Table 7.8 € million
2013 2014 2015 2016 2016 2017Jan-Jun Jan-Jun
GOODS AND SERVICES Exports of Goods and Services 12,001.7 12,583.2 13,300.5 13,896.3 6,691.6 7,000.8 Imports of Goods and Services 11,517.5 11,568.9 12,619.4 12,783.7 6,355.4 6,203.0Goods and Services Account 484.2 1,014.2 681.1 1,112.6 336.2 797.8
PRIMARY INCOME Income Received 10,099.3 10,290.2 10,059.1 9,855.9 4,910.1 4,791.5 Income Paid 10,527.2 10,765.8 10,524.2 10,530.8 5,232.6 5,116.3 Primary Income Account -427.9 -475.6 -465.1 -674.9 -322.5 -324.8
SECONDARY INCOME (Net) General Government 777.3 818.8 813.3 833.6 416.1 416.7 Other Sectors -630.0 -613.4 -605.0 -612.9 -307.0 -301.9 Secondary Income Account 147.3 205.4 208.4 220.8 109.1 114.8
Balance on Current Account 203.7 744.1 424.3 658.4 122.8 587.8
Note: The balance of payments is being presented in accordance with the sixth edition of the IMF’s Balance of Payments Manual (BPM6).
Source: National Statistics Offi ce
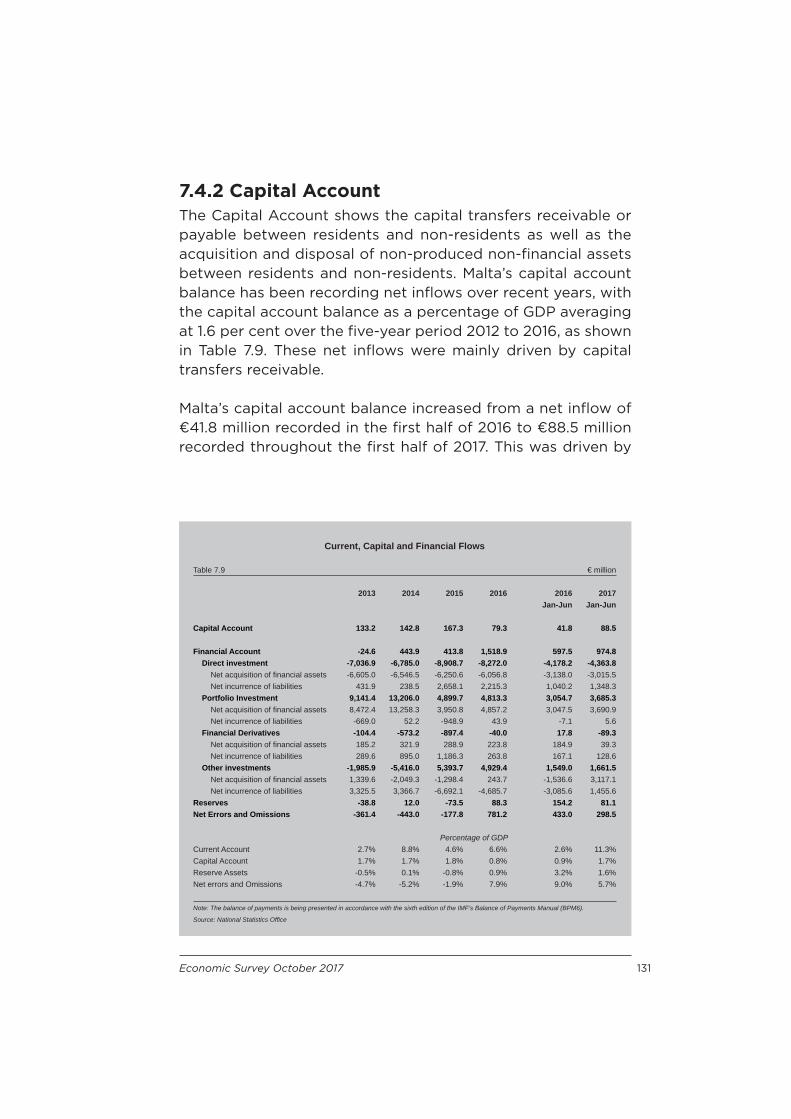
Economic Survey October 2017 131
7.4.2 Capital AccountThe Capital Account shows the capital transfers receivable or payable between residents and non-residents as well as the acquisition and disposal of non-produced non-fi nancial assets between residents and non-residents. Malta’s capital account balance has been recording net infl ows over recent years, with the capital account balance as a percentage of GDP averaging at 1.6 per cent over the fi ve-year period 2012 to 2016, as shown in Table 7.9. These net infl ows were mainly driven by capital transfers receivable.
Malta’s capital account balance increased from a net infl ow of €41.8 million recorded in the fi rst half of 2016 to €88.5 million recorded throughout the fi rst half of 2017. This was driven by
Current, Capital and Financial Flows
Table 7.9 € million
2013 2014 2015 2016 2016 2017Jan-Jun Jan-Jun
Capital Account 133.2 142.8 167.3 79.3 41.8 88.5
Financial Account -24.6 443.9 413.8 1,518.9 597.5 974.8 Direct investment -7,036.9 -6,785.0 -8,908.7 -8,272.0 -4,178.2 -4,363.8 Net acquisition of fi nancial assets -6,605.0 -6,546.5 -6,250.6 -6,056.8 -3,138.0 -3,015.5 Net incurrence of liabilities 431.9 238.5 2,658.1 2,215.3 1,040.2 1,348.3 Portfolio Investment 9,141.4 13,206.0 4,899.7 4,813.3 3,054.7 3,685.3 Net acquisition of fi nancial assets 8,472.4 13,258.3 3,950.8 4,857.2 3,047.5 3,690.9 Net incurrence of liabilities -669.0 52.2 -948.9 43.9 -7.1 5.6 Financial Derivatives -104.4 -573.2 -897.4 -40.0 17.8 -89.3 Net acquisition of fi nancial assets 185.2 321.9 288.9 223.8 184.9 39.3 Net incurrence of liabilities 289.6 895.0 1,186.3 263.8 167.1 128.6 Other investments -1,985.9 -5,416.0 5,393.7 4,929.4 1,549.0 1,661.5 Net acquisition of fi nancial assets 1,339.6 -2,049.3 -1,298.4 243.7 -1,536.6 3,117.1 Net incurrence of liabilities 3,325.5 3,366.7 -6,692.1 -4,685.7 -3,085.6 1,455.6Reserves -38.8 12.0 -73.5 88.3 154.2 81.1Net Errors and Omissions -361.4 -443.0 -177.8 781.2 433.0 298.5
Percentage of GDPCurrent Account 2.7% 8.8% 4.6% 6.6% 2.6% 11.3%Capital Account 1.7% 1.7% 1.8% 0.8% 0.9% 1.7%Reserve Assets -0.5% 0.1% -0.8% 0.9% 3.2% 1.6%Net errors and Omissions -4.7% -5.2% -1.9% 7.9% 9.0% 5.7%
Note: The balance of payments is being presented in accordance with the sixth edition of the IMF’s Balance of Payments Manual (BPM6).
Source: National Statistics Offi ce
132 Economic Survey October 2017
a substantial increase in capital infl ows coupled with a slight decline in capital outfl ows. The developments in the capital account occurred as a result of higher net infl ows from capital transfers relating to the general Government. The capital account as a percentage of GDP stood at 1.7 per cent, 0.8 percentage points higher than what was recorded in 2016.
7.4.3 The Financial Account and the Net International Investment PositionThe fi nancial account records transactions involving fi nancial assets and liabilities which take place between residents and non-residents.
As at the end of the fi rst half of 2017, domestic residents held about €73.6 billion in direct investment assets, mainly composed of debt instruments which stood at €42.0 billion. Direct investment liabilities amounted to €176.9 billion, mostly in the form of equity and investment fund shares.
Throughout January to June 2017, foreign direct investment net liabilities decreased by €4.4 billion, attributed primarily to an increase in liability holdings of €1.3 billion coupled with a decrease of €3.0 billion in asset holdings. The latter was the direct result of a €3.4 billion decline in asset holdings on debt instruments, which were then partially off set by a €360.7 million increase in equity and investment fund shares. Similarly, the increases in liability holdings mainly developed following higher debt instruments liability holdings of €1.2 billion along with an increase equity and investment fund shares liability holdings of €176.4 million. During the period under review, both reinvested earnings from the assets side and the liabilities side increased by €3.5 million and €161.2 million, respectively.
In terms of portfolio investment, as at the end of the fi rst half of 2017, assets held by domestic investors reached €110.5 billion, compared to the €3.6 billion portfolio investment liabilities. Portfolio investment asset holdings increased by €3.7 billion over the corresponding period of 2016. This was mainly

Economic Survey October 2017 133
composed of increases in long-term debt securities relating to deposit-taking corporations other than the central bank as well as debt securities in other sectors. Portfolio investment liabilities increased by €5.6 million due to increases in equity and investment fund shares which was enough to off set the decline in long-term debt securities relating to deposit-taking corporations other than the central bank. The above developments resulted in an overall increase in net portfolio investment of €3.7 billion.
Financial derivatives asset holdings amounted to €1.5 billion, while liabilities stood at €652.9 million. Net asset holdings decreased by €89.3 million throughout the fi rst half of 2017. This was primarily due to a substantial increase in liability holdings of €128.6 million which surpassed the €39.3 million higher asset holdings.
Other investment assets held by domestic investors amounted to €46.4 billion as at the end of June this year, while other investment liabilities held by domestic investors amounted to €44.8 billion. In the fi nancial account, the other investment category registered an increase in net asset holdings of €1.6 billion, refl ecting a €3.1 billion surge in asset holdings which was partially off set by a €1.5 billion increase in liability holdings. The increase in total asset holdings was attributed to increased asset holdings in currency and deposits (€2.6 billion), trade credit and advances (€282.7 million) and other accounts receivable/payable (€714.0 million) as well as decreased loan liability holdings (€76.2 million) and other accounts receivable/payable liability holdings (€97.1 million). Meanwhile, the increase in total liability holdings resulted from higher liability holdings in currency and deposits (€1.3 billion), higher trade credit and advances (€331.9 million) and declining asset holdings in loans (€528.9 million).
Net errors and omissions throughout the fi rst half of 2017 amounted to an infl ow of €298.5 million equivalent to 5.7 per cent of GDP. All in all, the fi nancial account registered a net infl ow of funds amounting to €974.8 million, of which reserve assets amounted to €81.1 million, equivalent to 1.6 per cent of GDP.


8. Financial Developments

Economic Survey October 2017 137
8. Financial DevelopmentsIn 2016, the general Government recorded a surplus of 1.0 per cent of Gross Domestic Product (GDP). During the eight months to August 2017, the diff erence between central Government recurrent revenue and total expenditure improved to €31.1 million - an improvement of €110.24 million when compared to the same period in the previous year. This improvement was mainly the result of higher recurrent revenue resulting from higher tax revenues refl ecting in particular the impact of stronger economic growth, as well as further effi ciency in revenue collection. Meanwhile, the public sector borrowing requirement decreased from €383.7 million to €60.3 million refl ecting developments in the sinking fund contribution and direct loan repayment.
Local Monetary Financial Institutions’ (MFIs) contribution to the stock of broad money (M3) of the Euro Area (EA) reached €19,576.0 million, in the period between January and July 2017, refl ecting an increase of 9.9 per cent compared to December of 2016. In recent years, the European Central Bank (ECB) was vital in helping restore economic and fi nancial stability by supporting the economic recovery in the aftermath of the global fi nancial and economic crisis. Signifi cant liquidity assistance was provided by the ECB to Euro Area (EA) banks. Recourse was made to conventional monetary policy tools in the initial stages of the crisis, while as the crisis intensifi ed, the ECB opted for several non-conventional monetary policy measures. As the EA economy continues its gradual recovery, the ECB continues to work within its remit to support the economy by aiming to maintain the main objective of price stability. The Enhanced Credit Support, the Outright Monetary Transactions Programme, as well as, the addition of the Corporate Sector Purchase Programme (CSPP) to the Asset Purchase Programme (APP) and the adjustment of the parameters of the Public-Sector Purchase Programme (PSPP), were among the non-conventional monetary policy decisions adopted by the ECB.
In the early months of 2015, the Euro experienced declines against all the three major currencies - US Dollar, Sterling and

138 Economic Survey October 2017
Japanese Yen - as a result of increased uncertainties surrounding the EA’s sovereign debt markets. In the subsequent months, the Euro-Dollar exchange rate started to show greater stability, whereas the Euro to Japanese Yen rate continued to follow a downward path up until 2016. On the other hand, the Euro-Sterling exchange rate experienced notable increases in the build-up of the Brexit referendum and this appreciation was further maintained post the Brexit result in June of 2016. In 2017, the Euro appreciated against all three major currencies in light of an improved economic outlook for the EA.
Government Revenue and Expenditure(January-August)
Table 8.1 € million
2014 2015 2016 2017
Recurrent Revenue 1,986.8 2,222.4 2,322.6 2,583.8 Tax Revenue 1,733.2 1,918.5 2,119.0 2,299.7 Direct Tax Revenue 1,052.5 1,137.4 1,263.3 1,364.0 Indirect Tax Revenue 680.7 781.1 855.7 935.7 Non-Tax Revenue 253.6 304.0 203.7 284.1
Total Expenditure 2,196.7 2,363.4 2,401.8 2,552.7 Recurrent Expenditure 1,790.8 1,939.3 2,063.7 2,221.6 Interest on Public Debt 151.8 152.7 149.8 144.4 Capital Expenditure 254.1 271.4 188.3 186.7
Balance of recurrent revenue and total expenditure -209.9 -141.0 -79.1 31.1
Financed by:Receipts from sale of shares 0.0 0.7 1.1 0.9Sinking Funds of Converted Loans 0.0 0.0 0.0 0.0Sinking Fund Contribution and Direct Loan Repayments -293.2 -79.7 -305.2 -90.2Equity Acquisition -13.8 -1.1 -12.5 -2.1Repayment of Loan made by government 0.0 0.0 12.0 0.0
Public Sector Borrowing Requirement -516.9 -221.1 -383.7 -60.3
Local Loans 573.8 258.3 438.7 257.8
Source: National Stastics Offi ce

Economic Survey October 2017 139
Chart 8.1
8.1 Public FinanceUnless otherwise stated, the analysis in this section is based on Government fi nance data as classifi ed in the statement of the Consolidated Fund, where such data is defi ned on a cash basis rather than on an accruals system. Consequently, this data is to be interpreted with caution since developments in Government’s net fi nancial position may not fully refl ect actual spending and revenue fl ows on an accruals basis. Table 8.1 presents Government’s fi scal position during the January to August 2014 to 2017 period, while Chart 8.1 illustrates trends in the consolidated fund balance.
8.1.1 RevenueDuring the fi rst eight months of 2017, recurrent revenue increased by €261.2 million, to reach €2,583.8 million. This increase was the result of higher revenues from taxes as well as from non-tax revenue components. Developments in the components of Government revenue for the periods January to August 2014 to 2017 are outlined in Appendix Table 8.1. Furthermore, Chart
-400
-350
-300
-250
-200
-150
-100
-50
0
50
2011 2012 2013 2014 2015 2016 2016 2017
Consolidated Fund BalanceEuro million
Jan - Aug
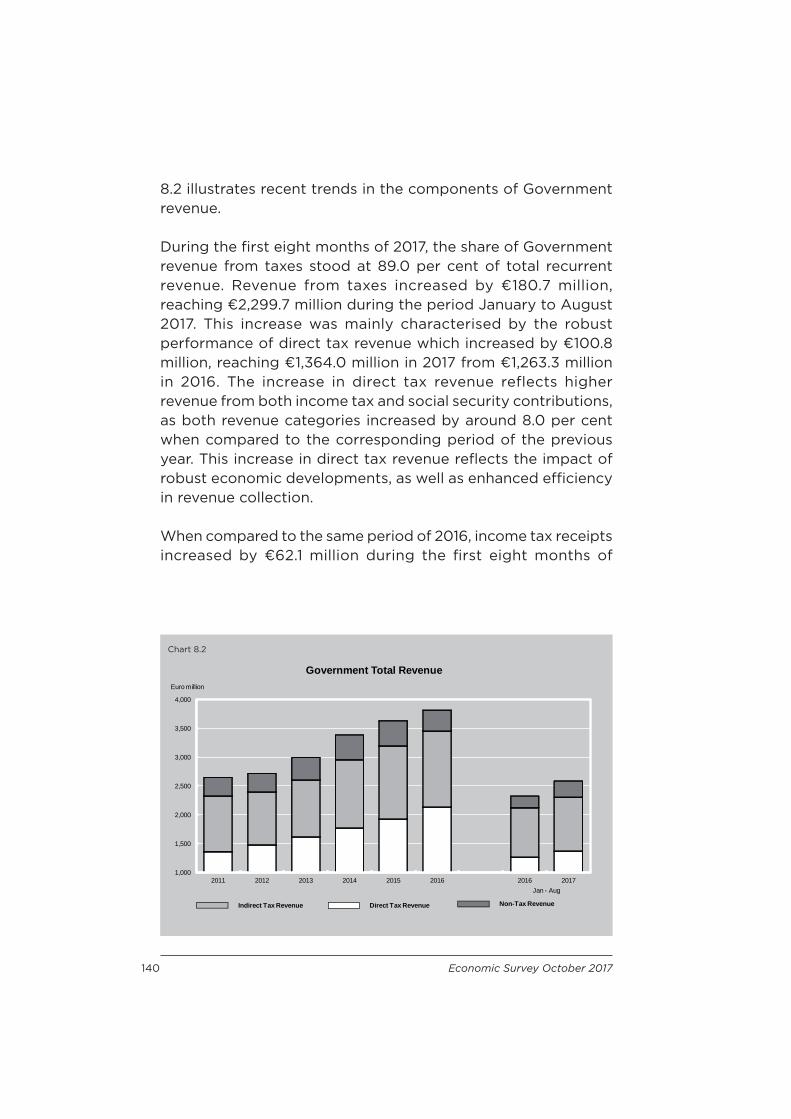
140 Economic Survey October 2017
8.2 illustrates recent trends in the components of Government revenue.
During the fi rst eight months of 2017, the share of Government revenue from taxes stood at 89.0 per cent of total recurrent revenue. Revenue from taxes increased by €180.7 million, reaching €2,299.7 million during the period January to August 2017. This increase was mainly characterised by the robust performance of direct tax revenue which increased by €100.8 million, reaching €1,364.0 million in 2017 from €1,263.3 million in 2016. The increase in direct tax revenue reflects higher revenue from both income tax and social security contributions, as both revenue categories increased by around 8.0 per cent when compared to the corresponding period of the previous year. This increase in direct tax revenue refl ects the impact of robust economic developments, as well as enhanced effi ciency in revenue collection.
When compared to the same period of 2016, income tax receipts increased by €62.1 million during the fi rst eight months of
Chart 8.2
1,000
1,500
2,000
2,500
3,000
3,500
4,000
2011 2012 2013 2014 2015 2016 2016 2017
Government Total RevenueEuro million
Indirect Tax Revenue Direct Tax Revenue
Jan - Aug
Non-Tax Revenue
Economic Survey October 2017 141
2017, reaching €833.3 million. This was mainly attributable to the positive developments in the international fi nancial and business sector, the domestic labour market and the property and fi nancial services sectors. Additionally, during the fi rst eight months of 2017, revenue from social security contributions increased by €38.7 million to reach €530.8 million. The positive developments in social security contributions are supported by the developments in the domestic labour market, confi rming the reform measures aimed at improving the labour market participation rate, particularly of women, as well as the pension reform initiatives resulting in higher social contribution rates and a lower number of retirees refl ecting the increase in the contribution period.
Meanwhile, revenue from indirect taxes also registered an addition of €80.0 million, increasing from €855.7 million in the fi rst eight months of 2016 to €935.7 million in 2017. The increase in indirect tax revenue can be explained by the higher revenue from Value Added Tax (VAT). Higher proceeds from Custom and Excise duties were also recorded. Meanwhile, higher revenue was also registered from Licences, Taxes and Fines.
Receipts from VAT increased by €43.2 million to €517.8 million during the period under review. This increase is mainly sourced from services/manufacturing/traders. Furthermore, alongside a more pronounced consumption pattern evident in the Maltese economy, these developments partially refl ect higher expenditure by foreign tourists in Malta. Receipts from custom and excise duties increased by €25.4 million to €196.0 million, mainly due to higher revenue from excise duty on petroleum. Additionally, revenue from licenses, taxes and fi nes increased by €11.5 million, reaching €222.0 million, refl ecting higher proceeds from duty on documents.
Non-tax revenue, which mainly comprises of grants, fees of offi ce and the transfer of profi ts generated by the Central Bank of Malta (CBM), increased by €80.4 million in the fi rst eight months of 2017 and reached €284.1 million, when compared to the corresponding period in 2016. This increase was mainly
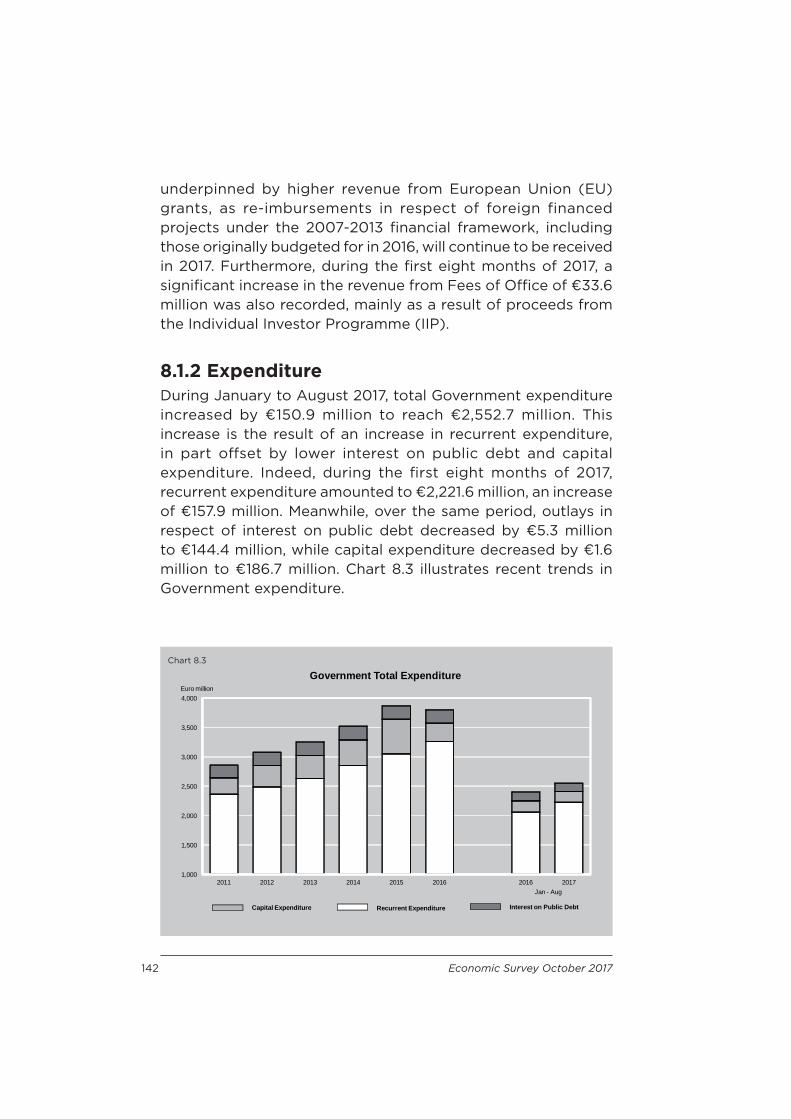
142 Economic Survey October 2017
underpinned by higher revenue from European Union (EU) grants, as re-imbursements in respect of foreign financed projects under the 2007-2013 fi nancial framework, including those originally budgeted for in 2016, will continue to be received in 2017. Furthermore, during the fi rst eight months of 2017, a signifi cant increase in the revenue from Fees of Offi ce of €33.6 million was also recorded, mainly as a result of proceeds from the Individual Investor Programme (IIP).
8.1.2 ExpenditureDuring January to August 2017, total Government expenditure increased by €150.9 million to reach €2,552.7 million. This increase is the result of an increase in recurrent expenditure, in part off set by lower interest on public debt and capital expenditure. Indeed, during the fi rst eight months of 2017, recurrent expenditure amounted to €2,221.6 million, an increase of €157.9 million. Meanwhile, over the same period, outlays in respect of interest on public debt decreased by €5.3 million to €144.4 million, while capital expenditure decreased by €1.6 million to €186.7 million. Chart 8.3 illustrates recent trends in Government expenditure.
Chart 8.3
1,000
1,500
2,000
2,500
3,000
3,500
4,000
2011 2012 2013 2014 2015 2016 2016 2017
Government Total ExpenditureEuro million
Capital Expenditure Recurrent Expenditure
Jan - Aug
Interest on Public Debt
Economic Survey October 2017 143
8.1.3 Recurrent ExpenditureRecurrent expenditure is classified under four categories, including Personal Emoluments, Operational and Maintenance Expenditure, Programmes and Initiatives and Contributions to Government Entities.
Programmes and Initiatives comprises of expenditure and social transfer payments made in respect of ad hoc programmes run by Government, as well as subsidies, payments and grants for the provision of services to citizens and to charitable and private institutions but excludes operational costs of Government departments. It also includes payments of own resources as contribution to the EU budget. During the period under review, this category of expenditure increased by €133.7 million to €1,367.9 million, mainly on account of higher outlays towards social security benefi ts, in particular retirement pensions and widow pensions. It is nevertheless worth noting that in part, additional outlays towards social security benefi ts also refl ect seasonal conditions in the timing of payments due. Higher outlays were also recorded in respect of Health Concession Agreements, as well as EU own resources and the Presidency of the Council of the EU. However, lower outlays were recorded for the provision of spare capacity and due to the non-recurrence of international conventions, in particular the CHOGM 2015.
Contributions towards Government Entities include the funding of Government entities, Parastatals, Corporations and Authorities. Outlays towards this category of expenditure amounted to €241.4 million during the period under review, thus representing a marginal increase of €2.0 million when compared to the same period a year earlier.
Personal Emoluments include all salaries and wages paid to elected offi cials and civil servants, as well as any bonuses and supplements paid to employees in excess of standard remunerations including any allowances and overtime payments. In the period under review, this category of expenditure increased by €25.6 million to €501.7 million when compared to the corresponding period of the previous year. Higher personal

144 Economic Survey October 2017
emoluments were mainly recorded in respect of the health and education sectors.
During the first eight months of 2017, Operational and Maintenance expenditure which includes payments for utilities, contractual services, materials and supplies, transport and rent, decreased by €3.5 million over the same period in 2016, to €110.6 million. Higher outlays in respect of the elderly and community care were more than off set by lower operational and maintenance expenditure by the Ministry for Health.
Appendix Table 8.2 presents the developments in Government’s recurrent expenditure on a cost centre basis for the fi rst eight months of 2017. The nomenclature of Ministries as well as the cost centres referred to in this Chapter refl ect the allocation of portfolios and assignment of responsibility for Government Departments and Government Entities. A direct comparison with data for past years is therefore not always possible.
At 28.2 per cent of Government’s total recurrent expenditure, Social Security Benefi ts make up the largest share of Government recurrent expenditure. Around 81.0 per cent of the social security benefi ts are contributory benefi ts, mainly retirement pensions, while the rest of the 19.0 per cent make up the non-contributory benefi ts, mainly social assistance and children’s allowance. During the fi rst eight months of 2017, welfare payments reached €625.9 million, as contributory benefi ts increased by €33.4 million mainly refl ecting increases in outlays towards retirement pensions. Meanwhile, non-contributory benefits increased marginally by €1.2 million.
8.1.4 Analysis of Recurrent Expenditure by Functional Classifi cationThe structure of recurrent expenditure can also be classifi ed by the main socio-economic functions of Government (according to the Classifi cation of the Functions of Government – COFOG). The diff erent economic functions are the general public service; defence; public order and safety; economic aff airs; environment

Economic Survey October 2017 145
protection; housing and community amenities; health; recreation, culture and religion; education and social protection. Chart 8.4 illustrates developments in Government expenditure according to the purpose for which the funds are used for the period January-August 2016 and 2017. Appendix Table 8.3 presents the developments in the main components of Government expenditure for the main COFOG categories.
During the period January to August 2017, social protection expenditure accounted for 44.1 per cent of recurrent expenditure followed by health and education which accounted for 15.8 and 13.4 per cent respectively. When compared to the same period of 2016, recurrent expenditure increased by €157.9 million, mainly on account of higher expenditure towards social protection (+€50.7 million) and general public services (+€45.2 million). Other noteworthy developments were registered in respect of expenditure towards health (+€33.6 million). All the other categories also recorded an expenditure increase but to a lesser extent.
Chart 8.4
0
100,000
200,000
300,000
400,000
500,000
600,000
700,000
800,000
900,000
1,000,000
2016 2017 2016 2017 2016 2017 2016 2017 2016 2017 2016 2017 2016 2017 2016 2017 2016 2017 2016 2017
General public services
Defence Public order and safety
Economic af fairs
Environment protection
Housing and community amenities
Health Recreation, culture and
religion
Education Social protection
Expenditure by Functional ClassificationJanuary - August
Capital Expenditure Recurrent expenditure and Interest on Public Debt
Euro thousand

146 Economic Survey October 2017
Chart 8.5 illustrates the components of recurrent expenditure for the main socio-economic functions of Government for the period January-August 2017. It is noted, that recurrent expenditure towards defence and public order and safety, and to a lesser extent that towards health and education, is mainly to fi nance personal emoluments. Meanwhile, above average expenditure on programmes and initiatives is registered by the social protection and the general public services categories. Expenditure towards housing and community amenities and recreation culture and religion mainly refl ects contributions to Government entities classifi ed under these categories of expenditure. It is also worth noting that operational and maintenance expenditure comprises the smallest share of Government outlays in each of the diff erent Government functions.
8.1.5 Capital ExpenditureDuring the period January-August 2017, capital expenditure declined marginally to €186.7 million or 7.3 per cent of total Government expenditure. Based on the latest available expenditure data by economic function, during the period
Chart 8.5
0% 10% 20% 30% 40% 50% 60% 70% 80% 90% 100%
General public services
Defence
Public order and safety
Economic affairs
Environment protection
Housing and community amenities
Health
Recreation, culture and religion
Education
Social protection
Total
Recurrent expenditure by COFOG categoryJanuary-August 2017
Personal Emoluments Operational and Maintenance Expenses Programmes and Initiatives Contributions to Government Entities

Economic Survey October 2017 147
January-August 2017, more than half of capital outlays were in respect of the ‘economic aff airs’ category which includes nine groups being the ‘general economic, commercial and labour aff airs’, ‘agriculture, forestry, fi shing and hunting’, ‘fuel and energy’, ‘mining, manufacturing and construction’, ‘transport’, ‘communication’, ‘other industries’, ‘R&D economic affairs’ and ‘economic aff airs n.e.c’. This category was followed by capital spending on education and public order and safety, which in aggregate amounted to three-quarters of total capital expenditure.
When compared to the corresponding period of 2016, higher capital expenditure was registered by the public order and safety, education and environmental protection categories, while a decrease in capital expenditure for all the other Government functions was recorded. During January-August 2017, capital expenditure on public order and safety increased by €7.2 million when compared to the corresponding period in 2016 while outlays on education and on environment protection increased by €6.7 million and €5.7 million, respectively. Meanwhile, a major decline in capital spending during the period under review over the January-August 2016 levels was noted for the housing and community amenities category, which decreased by €6.1 million.
8.1.6 International ComparisonThe following is an analysis of the fi scal position of the EU Member States for 2016. Table 8.2 presents the Government budgetary position as a percentage of GDP, while Table 8.3 presents the general Government debt position, also as a percentage of GDP, for EU Member States. Data presented in this section is based on the ESA 2010 system of national accounts and is therefore not directly comparable with data presented in previous sections of this Chapter. It is pertinent to note, that data for EU Member States, including data for Malta, and for the United States and for Japan is reproduced from the spring update of the AMECO Database. Data for 2016 and 2017 refl ect the defi cit and debt projections as per the European Commission’s Spring 2017 European Economic Forecast.

148 Economic Survey October 2017
General Government Net Lending (+) or Borrowing (-)as a percentage of GDP
Table 8.2 per cent
2014 2015 2016 2017F 2018F
Austria -2.7 -1.1 -1.6 -1.3 -1.0Belgium -3.1 -2.5 -2.6 -1.9 -2.0Bulgaria -5.5 -1.6 0.0 -0.5 -0.3Croatia -5.4 -3.4 -0.8 -1.1 -0.9Cyprus -8.8 -1.2 0.4 0.2 0.7Czech Republic -1.9 -0.6 0.6 0.3 0.1Denmark 1.4 -1.3 -0.9 -1.3 -0.9Estonia 0.7 0.1 0.3 -0.3 -0.5Finland -3.2 -2.7 -1.9 -2.2 -1.8France -3.9 -3.6 -3.4 -3.0 -3.2Germany 0.3 0.7 0.8 0.5 0.3Greece -3.7 -5.9 0.7 -1.2 0.6Hungary -2.1 -1.6 -1.8 -2.3 -2.4Ireland -3.7 -2.0 -0.6 -0.5 -0.3Italy -3.0 -2.7 -2.4 -2.2 -2.3Latvia -1.6 -1.3 0.0 -0.8 -1.8Lithuania -0.7 -0.2 0.3 -0.4 -0.1Luxembourg 1.4 1.4 1.6 0.2 0.3Netherlands -2.3 -2.1 0.4 0.5 0.8Poland -3.5 -2.6 -2.4 -2.9 -2.8Portugal -7.2 -4.4 -2.0 -1.8 -1.9Romania -1.4 -0.8 -3.0 -3.5 -3.7Slovakia -2.7 -2.7 -1.7 -1.3 -0.6Slovenia -5.4 -2.9 -1.8 -1.4 -1.2Spain -6.0 -5.1 -4.5 -3.2 -2.6Sweden -1.5 0.3 0.9 0.4 0.7United Kingdom* -5.7 -4.3 -3.0 -2.9 -2.3
EU 28 -3.0 -2.4 -1.7 -1.6 -1.5Euro Area -2.6 -2.1 -1.5 -1.4 -1.3United States -4.8 -4.2 -4.8 -4.7 -5.2Japan -5.4 -3.5 -3.7 -4.2 -3.6
Malta -2.0 -1.3 1.0 0.5 0.8
* Data pertains to UK fi nancial year (1 April to 31 March)
Source: AMECO Database
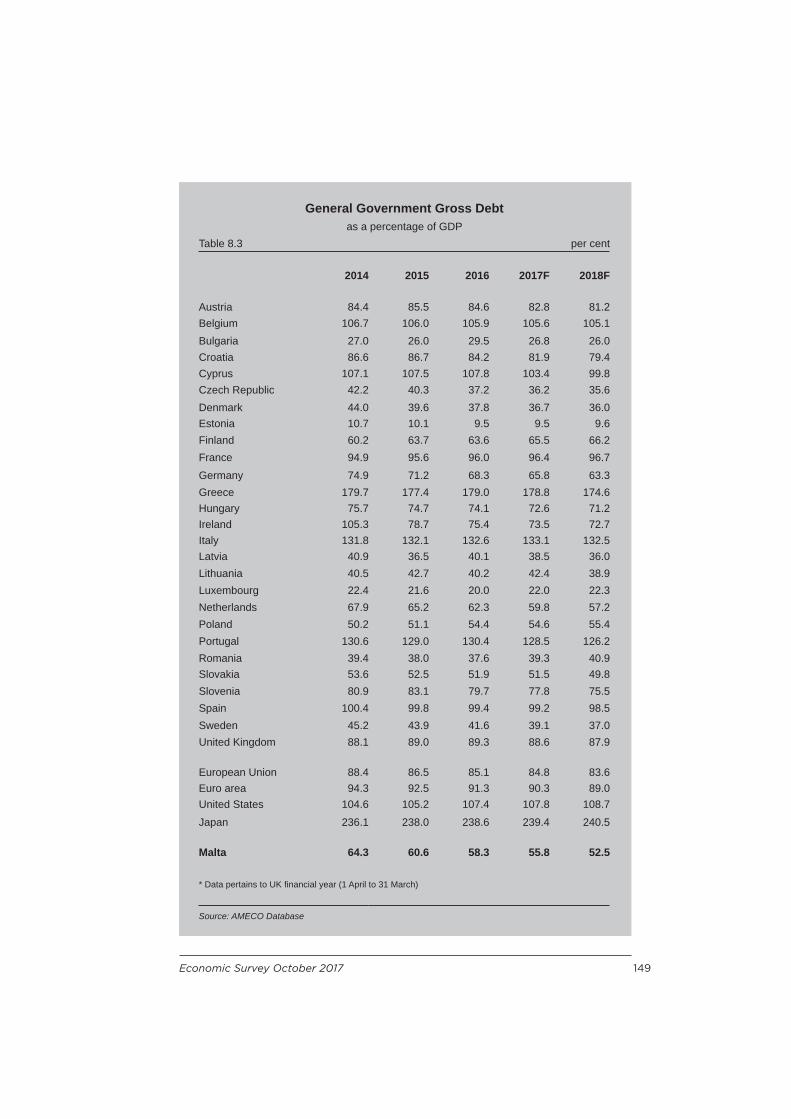
Economic Survey October 2017 149
General Government Gross Debtas a percentage of GDP
Table 8.3 per cent
2014 2015 2016 2017F 2018F
Austria 84.4 85.5 84.6 82.8 81.2Belgium 106.7 106.0 105.9 105.6 105.1Bulgaria 27.0 26.0 29.5 26.8 26.0Croatia 86.6 86.7 84.2 81.9 79.4Cyprus 107.1 107.5 107.8 103.4 99.8Czech Republic 42.2 40.3 37.2 36.2 35.6Denmark 44.0 39.6 37.8 36.7 36.0Estonia 10.7 10.1 9.5 9.5 9.6Finland 60.2 63.7 63.6 65.5 66.2France 94.9 95.6 96.0 96.4 96.7Germany 74.9 71.2 68.3 65.8 63.3Greece 179.7 177.4 179.0 178.8 174.6Hungary 75.7 74.7 74.1 72.6 71.2Ireland 105.3 78.7 75.4 73.5 72.7Italy 131.8 132.1 132.6 133.1 132.5Latvia 40.9 36.5 40.1 38.5 36.0Lithuania 40.5 42.7 40.2 42.4 38.9Luxembourg 22.4 21.6 20.0 22.0 22.3Netherlands 67.9 65.2 62.3 59.8 57.2Poland 50.2 51.1 54.4 54.6 55.4Portugal 130.6 129.0 130.4 128.5 126.2Romania 39.4 38.0 37.6 39.3 40.9Slovakia 53.6 52.5 51.9 51.5 49.8Slovenia 80.9 83.1 79.7 77.8 75.5Spain 100.4 99.8 99.4 99.2 98.5Sweden 45.2 43.9 41.6 39.1 37.0United Kingdom 88.1 89.0 89.3 88.6 87.9
European Union 88.4 86.5 85.1 84.8 83.6Euro area 94.3 92.5 91.3 90.3 89.0United States 104.6 105.2 107.4 107.8 108.7Japan 236.1 238.0 238.6 239.4 240.5
Malta 64.3 60.6 58.3 55.8 52.5
* Data pertains to UK fi nancial year (1 April to 31 March)
Source: AMECO Database

150 Economic Survey October 2017
In 2016, the Government defi cit of both the EA and the EU decreased in absolute terms compared with 2015. Indeed, in the EA, the Government defi cit-to-GDP ratio continued to decline from 2.1 per cent in 2015 to 1.5 per cent in 2016, and for the EU from 2.4 per cent to 1.7 per cent of GDP. Furthermore, the Government debt-to-GDP ratio improved in both the EA and the EU by 1.1 and by 1.4 percentage points, respectively. In 2016, the EA debt-to-GDP ratio declined by 1.1 percentage points to 91.3 per cent from 92.5 per cent in 2015, while that in the EU decreased by 1.3 percentage points to 85.1 per cent from 86.5 per cent in 2015. This improvement in the debt-to-GDP ratio was attributed to the changes in the nominal GDP level which outweighed the increase in the debt level. Historically-low interest rates also contributed to these improvements.
In 2016, Malta, together with Luxembourg, Sweden, Germany, Greece, the Czech Republic, the Netherlands, Cyprus, Estonia and Lithuania registered a Government surplus, while Bulgaria and Latvia reported a balanced budget. The lowest Government defi cits as a percentage of GDP were recorded in Ireland, Croatia and Denmark. In the meantime, France and Spain had defi cits higher than the 3.0 per cent of GDP benchmark, at 3.4 per cent and 4.5 per cent respectively, while the United Kingdom and Romania recorded a 3.0 per cent defi cit in 2016. The most pronounced improvement in the deficit-to-GDP ratio was recorded by Greece, which registered a 6.7 percentage points improvement in the Government balance, to reach a surplus of 0.7 per cent of GDP from a defi cit of 5.9 per cent in 2015. However, the budget balance deteriorated by 2.3 percentage points in Romania, from a defi cit of 0.8 per cent of GDP in 2015 to -3.0 per cent of GDP in 2016. Malta recorded a Government surplus of 1.0 per cent of GDP in 2016, from a defi cit of 1.3 per cent in 2015, placing Malta among the Member States with the best reported government balance in the EU and EA, second only to Luxembourg.
At the end of 2016, the lowest ratios of Government debt-to-GDP were recorded in Estonia, Luxembourg and Bulgaria. 16 Member States had Government debt ratios higher than 60.0 per cent of
Economic Survey October 2017 151
GDP, with the highest registered in Greece, Italy and Portugal. Consequently, the EU and EA average government debt-to-GDP ratios remains above the 60.0 per cent of GDP benchmark. Nevertheless, it is worth noting that 19 Member States registered a decline in their debt ratios, including Malta. Indeed, Malta recorded a Government debt ratio of 58.3 per cent of GDP, down by 2.4 percentage points from 2015. In the meantime, by registering a decrease of 3.5 percentage points between 2015 and 2016, Slovenia recorded the major improvement in its debt ratio to 79.7 per cent in 2016. By contrast, Latvia reported the highest increase in its ratio by 3.6 percentage points to 40.1 per cent during the same period, but remaining below the 60.0 per cent threshold.
On the 16 of June 2017, the Council closed the excessive defi cit procedures for Croatia and Portugal confi rming their defi cits had dropped below the EU’s 3.0 per cent of GDP reference value. The Commission also decided to recommend the Council to close the excessive defi cit procedure for Greece. If the Council follows the Commission’s recommendation, this would leave only 3 Member States under the corrective arm of the Pact, down from 24 countries in 2011.
Furthermore, the Commission adopted reports for Belgium and Finland under the Article 126 (3) of the Treaty on the Functioning of the EU (TFEU), in which it reviews their compliance with the debt criterion of the Treaty. In both cases, the conclusion is that the debt criterion should be considered as complied with. Earlier this year, the Commission also addressed a warning to Romania on the existence of a signifi cant deviation from the adjustment path toward the medium-term budgetary objective in 2016 and recommended the Council to adopt a recommendation for Romania to take appropriate measures in 2017 with a view to correcting the signifi cant deviation. It is the fi rst time that this procedure of the EU economic governance framework is being applied. It gives the authorities the opportunity to take corrective action in order to avoid a further worsening in public fi nances and the consequent opening of an excessive defi cit procedure.

152 Economic Survey October 2017
In 2016, the United States reported a Government fi scal defi cit ratio of 4.8 per cent of GDP, representing a further worsening of 0.6 of a percentage point from that reported in 2015. The gross debt-to-GDP ratio increased by 2.2 percentage points from 105.2 per cent in 2015 to 107.4 per cent in 2016. Meanwhile, in Japan, the Government defi cit-to-GDP ratio increased to 3.7 per cent of GDP in 2016 from 3.5 per cent in 2015. Furthermore, Japan’s debt-to-GDP ratio increased to 238.6 per cent in 2016 from 238.0 per cent in 2015. In this context, it is noted that both the EU and the EA compare favourably to the United States and Japan with respect to both the defi cit and debt ratios to GDP.
In the Spring 2017 European Economic Forecast, the European Commission observed that the European economy continued to grow at a steady rate in a context of global political uncertainties and other global challenges. The economy was at present benefi tting from accommodative monetary policy, a broadly neutral fi scal stance (assuming no policy change), stronger confi dence, the gradual recovery in global activity and robust job creation. Nevertheless, growth is not expected to strengthen much further as the economy remains burdened by legacies from the crisis such as high indebtedness and a fragile banking sector within some Member States.
Under a no-policy-change assumption, the defi cit-to-GDP ratio is expected to fall to 1.3 per cent of GDP in the EA and 1.5 per cent in the EU in 2018, while the gross debt to-GDP ratio is forecast at 89.0 per cent of GDP in the EA and 83.6 per cent in the EU in the same year.
After the budget balance for Malta swung into surplus in 2016, the Commission’s Spring Forecast expects the balance to remain positive but to moderate to 0.5 per cent of GDP. In 2018, under a no-policy-change assumption, the budget surplus is projected to improve further to 0.8 per cent of GDP. The government debt-to-GDP ratio, which fell below the 60.0 per cent threshold in 2016, is forecast to decline further to 55.8 per cent in 2017 and 52.5 per cent in 2018.
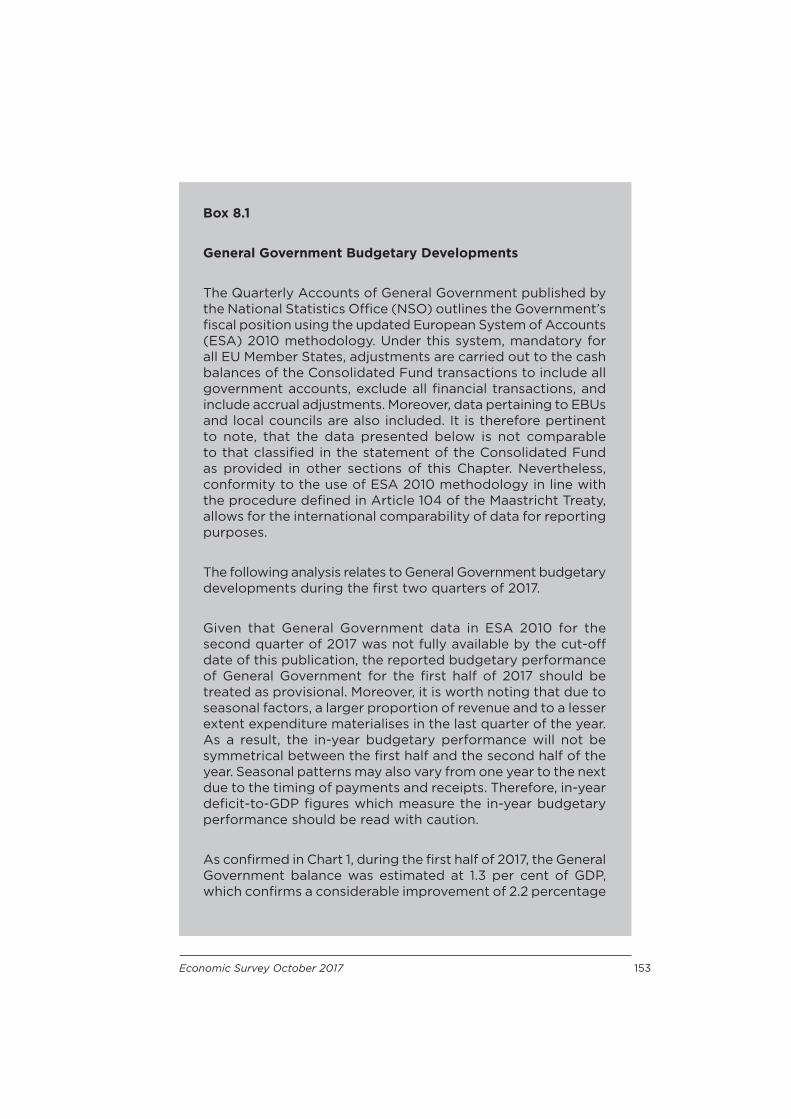
Economic Survey October 2017 153
Box 8.1
General Government Budgetary Developments
The Quarterly Accounts of General Government published by the National Statistics Offi ce (NSO) outlines the Government’s fi scal position using the updated European System of Accounts (ESA) 2010 methodology. Under this system, mandatory for all EU Member States, adjustments are carried out to the cash balances of the Consolidated Fund transactions to include all government accounts, exclude all fi nancial transactions, and include accrual adjustments. Moreover, data pertaining to EBUs and local councils are also included. It is therefore pertinent to note, that the data presented below is not comparable to that classifi ed in the statement of the Consolidated Fund as provided in other sections of this Chapter. Nevertheless, conformity to the use of ESA 2010 methodology in line with the procedure defi ned in Article 104 of the Maastricht Treaty, allows for the international comparability of data for reporting purposes.
The following analysis relates to General Government budgetary developments during the fi rst two quarters of 2017.
Given that General Government data in ESA 2010 for the second quarter of 2017 was not fully available by the cut-off date of this publication, the reported budgetary performance of General Government for the fi rst half of 2017 should be treated as provisional. Moreover, it is worth noting that due to seasonal factors, a larger proportion of revenue and to a lesser extent expenditure materialises in the last quarter of the year. As a result, the in-year budgetary performance will not be symmetrical between the fi rst half and the second half of the year. Seasonal patterns may also vary from one year to the next due to the timing of payments and receipts. Therefore, in-year defi cit-to-GDP fi gures which measure the in-year budgetary performance should be read with caution.
As confi rmed in Chart 1, during the fi rst half of 2017, the General Government balance was estimated at 1.3 per cent of GDP, which confi rms a considerable improvement of 2.2 percentage
154 Economic Survey October 2017
Box 8.1 continued
Chart 1
points when compared to the corresponding period of the previous year.
During the fi rst six months of 2017, the revenue-to-GDP ratio is estimated to have increased from 36.5 per cent to 38.2 per cent. This increase is mainly on account of higher non-tax revenue, as the ‘other’ category of revenue is estimated to have increased by 2.2 percentage points of GDP, refl ecting more buoyant proceeds from the IIP. All components of tax revenue, except for capital taxes, are estimated to have registered marginal declines while the tax burden is estimated to have declined by 0.5 of a percentage point of GDP.
When compared to the first two quarters of 2016, the expenditure-to-GDP ratio in the fi rst half of 2017 is estimated to have decreased by 0.5 percentage points to 36.9 per cent of GDP. These developments primarily refl ect lower ratios for most categories of expenditure, other than the ‘other’ category of expenditure, which primarily refl ects higher EU Own Resources and intermediate consumption. It is worth noting that in 2017, expenditure on intermediate consumption includes expenditure related to Malta’s Presidency of the EU
-8
-6
-4
-2
0
2
0
10
20
30
40
50
2013 2014 2015 2016 2016 2017
Public Finance Developments(in accordance with ESA 2010 methodology)
*Data for Q2-2017 is provisional, as published in the Half Yearly Report
GG Expenditure GG Revenue GG Deficit (secondary axis)
% of GDP % of GDP
Jan - Jun
Economic Survey October 2017 155
8.2 Monetary DevelopmentsDuring the fi rst seven months of 2017, the contribution of Maltese monetary fi nancial institutions (MFIs) to the stock of EA Broad Money (M3) increased, mainly underpinned by higher overnight deposits. On the other hand, the contributions towards M3 of both deposits redeemable at notice up to three months and of deposits with an agreed maturity of up to two years were negative, albeit the former more marginally so. In addition, there has also been a decline in net claims on non-residents of the EA, while both the other counterparts component and the credit counterpart contributed positively to Broad Money. In the meantime, the commercial banks opted to maintain unchanged the tight lending conditions for corporations, while slightly relaxing credit standards for consumer credit. In addition, in view of the relatively low interest rate environment, depositors were more inclined to hold highly short-term liquid deposits in their bank accounts.
8.2.1 Contribution of Resident MFIs to Euro Area Monetary AggregatesIn the fi rst seven months of 2017, the contribution of Maltese resident MFIs to total monetary aggregates (M3) of the EA registered an increase of 9.9 per cent, reaching €19,576.0 million when compared to €17,808.9 million registered in December 2016. The main factor which led to such an increase was a rise in overnight deposits. At the same time, slight negative contributions stemmed from both deposits redeemable at notice
Council. Moreover, during the fi rst two quarters of 2017, this category of expenditure involved added outlays due to Health Concession Agreements.
Box 8.1 continued

156 Economic Survey October 2017
up to three months and deposits with an agreed maturity of up to two years. Table 8.4 illustrates the main developments in monetary indicators. This data refl ects the continuous inclination towards maintaining short-term liquid money balances in the form of cash.
Between January and July 2017, narrow money (M1) reached €14,734.2 million, increasing by 8.7 per cent when compared to €13,550.9 million registered in December 2016. This was mainly due to a 9.1 per cent increase in overnight deposits during the same period as it reached €13,763.5 million in July 2017. Overnight deposits increased mostly during the second quarter of the year and slightly less in the fi rst three months of the year. Subsequently, overnight deposits continued to increase
Contribution of Resident MFIs to Euro Area Monetary Aggregates(1)
Table 8.4 € million
2016 2017 2017 2017* Jul-17 -(Dec) (Mar) (Jun) (Jul) Dec-16
% Change
Narrow Money (M1) 13,550.9 13,877.7 14,472.0 14,734.2 8.7 Currency issued(2) 939.5 931.0 955.3 970.7 3.3 Overnight deposits(3) 12,611.4 12,946.7 13,516.7 13,763.5 9.1
Intermediate Money (M2) 17,713.2 18,045.1 18,564.4 18,729.4 5.7 Narrow Money (M1) 13,550.9 13,877.7 14,472.0 14,734.2 8.7 Deposits redeemable at notice up to 3 months(3) 105.0 93.8 53.1 51.2 -51.3 Deposits with agreed maturity up to 2 years(3) 4,057.3 4,073.5 4,039.3 3,944.1 -2.8
Broad Money (M3)(4) 17,808.9 18,958.7 19,426.0 19,576.0 9.9 Intermediate Money (M2) 17,713.2 18,045.1 18,564.4 18,729.4 5.7 Debt securities issued up to 2 years initial maturity 95.7 913.6 861.6 846.6 784.7
* Provisional(1) Figures show the contribution of Maltese Monetary Financial Institutions (MFIs) to the Euro Area totals, and include deposit liabilities
to both residents of Malta and other Euro Area residents.(2) Comprises the Central Bank of Malta’s share of Euro banknotes issued by the Eurosystem, plus coins issued by the Bank on behalf
of the Treasury, less holdings of issued Euro banknotes and coins held by the MFI sector.(3) Deposits with MFIs exclude interbank deposits and deposits held by central Government.(4) M3-M2 comprises repurchase agreements and debt securities up to 2 years’ maturity issued by MFIs in Malta less holdings by MFIs in
Malta of such securities issued by MFIs anywhere in the Euro Area. Figures also include MMFs shares/units issued less holdings in such
units by MMFs and credit institutions resident in the Euro Area and holdings by non-residents of the Euro Area.
Source: Central Bank of Malta

Economic Survey October 2017 157
in the month of July. This dynamic refl ected developments in deposits from both Maltese residents as well as deposits from EA residents albeit due to their share, the former represented the main contributors to the developments in total overnight deposits.
Currency issued registered an increase of 3.3 per cent between January and July 2017 reaching €970.7 million, however its positive contribution to M1 was low due to its small share. The overall increase in currency issued was underpinned by increases registered in the second quarter and in July which both outweighed a decline registered in the fi rst quarter of the year.
During the period under review, deposits redeemable at notice up to three months declined substantially by 51.3 per cent when compared to December 2016, reaching €51.2 million. A signifi cant decline in such deposits from Maltese residents was the main contributor to this development. Although to a lesser extent, three month deposits from other EA residents also registered a noticeable decline, however, their overall eff ect was practically negligible due to their very small share.
During the same period, there has been a slight decrease of 2.8 per cent in deposits with an agreed maturity of up to two years which reached €3,944.1 million in July 2017. These ‘longer-term’ deposits registered a slight increase throughout the fi rst three months of the year, mainly due to slight increases in deposits from both Maltese and EA residents. This growth was reversed during the second quarter of 2017, mainly driven by lower deposits from residents of Malta which more than outweighed an increase registered in deposits from other EA residents. In the month of July, the decline in deposits with agreed maturity of up to two years intensifi ed, although, conversely to the second quarter, this was underpinned by lower deposits from other EA residents which more than outweighed a small increase in deposits from Maltese residents.
As shown in Table 8.5, total resident deposits increased by 6.3 per cent between January and July 2017 when compared to

158 Economic Survey October 2017
December 2016 reaching €16,404.0 million. Such an increase is mainly due to the signifi cant positive contribution from overnight deposits which increased by 9.3 per cent during the aforementioned period. At the same time, there has been a signifi cant decline of 51.7 per cent in deposits redeemable at notice up to three months, while two-year maturity deposits declined slightly by 3.2 per cent. Nevertheless, due to its share, the latter was the main negative contributor towards total resident deposits growth as the overall negative contribution from the decline in deposits redeemable at notice up to three months was only marginal.
8.2.2 Contribution of Resident MFIs to Counterparts to Euro Area Monetary AggregatesThe developments in the contribution of resident MFIs to counterparts to EA monetary aggregates since the end of 2016 are portrayed in Table 8.6. Between January and July 2017, Maltese MFIs’ contribution to the EA broad money stock (M3) increased, despite a decline in net claims on non-residents of the EA. The increase in resident MFIs’ contribution was mainly due to an increase registered in the credit counterpart, as well
Resident DepositsTable 8.5 € million
2014 2015 2016 2017* Jul-17 -(Dec) (Dec) (Dec) (Jul) Dec-16
% Change
Overnight Deposits(1) 8,390.8 10,839.6 12,165.1 13,292.7 9.3Deposits redeemable at notice up to 3 months 124.4 121.7 103.3 49.9 -51.7Deposits with agreed maturity up to 2 years 3,893.7 3,487.8 3,162.0 3,061.4 -3.2
Total resident deposits 12,408.9 14,449.2 15,430.4 16,404.0 6.3
* Provisional
(1)Overnight deposits are deposits withdrawable on demand and exclude interbank deposits and deposits held by central Government.
Source: Central Bank of Malta

Economic Survey October 2017 159
as thanks to a decline in the other counterparts element, as both had an overall positive contributory eff ect.
In the period January to July 2017, the credit counterpart of broad money reached €17,760.7 million, signifying an increase of 4.4 per cent when compared to December 2016. Such development was mainly driven by higher credit to other EA residents, albeit credit to Maltese residents also increased in the period under review. In the fi rst seven months of 2017, credit to other EA residents increased by 11.0 per cent, reaching €4,781.3 million when compared to December 2016. Lending to the private sector, which rose at a rate of 24.7 per cent, supported EA credit developments, outweighing the decline in credit to general Government which declined by 11.9 per cent during the same period. At the same time, lending to local residents increased by 2.2 per cent, reaching €12,979.4 million during the same comparative period. This was led by a 7.6 per cent increase
Contribution of Resident MFIs to Counterparts to Euro Area Monetary AggregatesTable 8.6
2016 2017 2017 2017* Jul-17 -(Dec) (Mar) (Jun) (Jul) Dec-16
% Change
Broad Money (M3)(1) 17,808.9 18,958.7 19,425.9 19,576.0 9.9
Credit Counterpart(2) 17,012.7 17,616.0 17,602.6 17,760.7 4.4 Credit to residents of Malta 12,706.1 12,969.3 12,959.9 12,979.4 2.2 Credit to general Government 2,961.5 3,182.1 3,188.9 3,186.9 7.6 Credit to other residents 9,744.6 9,787.3 9,771.0 9,792.5 0.5 Credit to other Euro Area residents 4,306.6 4,646.7 4,642.6 4,781.3 11.0
Net claims on non-residents of the Euro Area 9,421.5 9,032.1 7,577.2 7,884.8 -16.3
Other counterparts (net)(3) 8,625.3 7,689.4 5,753.9 6,069.5 -29.6
* Provisional(1) This does not represent holdings of M3 by residents of Malta but rather the contribution of MFIs in Malta to the Euro Area aggregate.(2) Credit includes, besides lending, claims in the form of debt securities and shares and other equity.(3) Includes net interbank claims/liabilities within the MFI sector. These counterparts make a negative contribution to M3.
Source: Central Bank of Malta

160 Economic Survey October 2017
in credit to general Government as credit to the private sector registered an increase of 0.5 per cent.
Table 8.7, illustrates the detailed developments in credit to Maltese residents, excluding general Government, underlying the 0.5 per cent increase in private sector loans during the fi rst seven months of 2017 when compared to December of last year. The overall increase was primarily the result of higher loans given out to ‘household and individuals’ which increased by 3.3 per cent between January and July 2017 when compared to December 2016. Positive contributions also stemmed from increases in credit to the ‘real estate, renting and business activities’ (+3.1 per cent), ‘wholesale, retail trade and repairs’ (+2.2 per cent), ‘construction’ (+2.9. per cent) and ‘manufacturing’ (+5.5 per cent). Loans to the ‘electricity, gas and water supply’ category
Credit to Other Residents(1)
Loans by Economic ActivityTable 8.7
2014 2015 2016 2017* Jul-17 -(Dec) (Dec) (Dec) (Jul) Dec-16
% Change
Total Credit 9,235.1 9,474.0 9,744.6 9,792.5 0.5
Total Loans(2) 9,101.9 9,205.4 9,428.6 9,533.8 1.1 Electricity, gas & water supply 393.0 264.7 274.8 279.5 1.7 Transport, storage & communication 379.3 369.2 304.0 275.2 -9.5 Manufacturing 271.1 274.8 259.1 273.3 5.5 Construction 712.9 515.0 485.9 500.1 2.9 Hotels & restaurants 368.0 404.9 344.8 301.4 -12.6 Wholesale & retail trade; repairs 811.7 814.1 780.1 797.4 2.2 Real estate, renting & business activities 677.6 713.1 764.1 787.5 3.1 Households & individuals 4,249.4 4,536.0 4,800.8 4,958.5 3.3 Other(3) 1,238.9 1,313.5 1,415.1 1,361.0 -3.8
* Provisional(1) Credit to other residents consists mainly of loans and holdings of securities, including equities, issued by the non-bank private sector and public non-fi nancial companies, and fi nancial derivatives. Interbank claims are excluded. Data only include credit to residents of Malta.(2)Data presented in this Table is compiled in accordance with NACE Rev2(3)Includes agriculture, mining & quarrying, public administration, education, health & social work, community recreation & personal activities, extra-territorial organisations & bodies and non-bank fi nancial institutions.
Source: Central Bank of Malta

Economic Survey October 2017 161
increased by 1.7 per cent, although due to their share this had a marginal impact on total loans. Declines in credit were registered in the ‘transport, storage and communication’, the ‘hotels and restaurants’ and ‘other’ category sectors which declined by 9.5 per cent, 12.6 per cent, and 3.8 per cent respectively.
Foreign capital from outside the EA also aff ects the growth dynamics in M3. Net claims representing the external counterpart of M3 declined signifi cantly by 16.3 per cent during the fi rst seven months of 2017 when compared to December 2016, which reached €7,884.8 million. Such development was mainly the result of a decline during the fi rst half of the year which more than outweighed the increase registered in July 2017. The decline in net claims on non-residents of the EA was complemented by a lower level of the other counterparts net balance which declined by 29.6 per cent during the period January to July 2017 over December 2016, reaching €6,069.5 million. These developments followed the same dynamics in net claims, registering a decline throughout the fi rst half of the year which more than off set an increase registered in the month of July 2017. The decline in the net claims component refl ects a slowdown in resident credit institutions’ liabilities to other EA banks with respect to their claims on them while the other counterparts’ component mainly refl ects interbank transactions across the EA and contributes negatively to M3.
8.2.3 The Money MarketOver the last decade, the ECB played a major role in restoring economic and fi nancial stability, gradually aiding the economic recovery following the fi nancial crisis. At fi rst, European fi nancial institutions were provided with important liquidity assistance as the ECB made recourse to traditional tools, including interest rate cuts. Nevertheless, as the fi nancial turmoil escalated in September 2008, the ECB further stepped in by supplementing traditional monetary policy and introduced a number of non-conventional monetary policy measures which were unparalleled in nature, scope and magnitude. These measures had the main objective to safeguard the primary aim of maintaining price
162 Economic Survey October 2017
stability, while ensuring an eff ective and effi cient monetary policy transmission mechanism. As the crisis unfolded, the ECB played a key role in supporting fi nancial intermediation within the EA while looking after the refi nancing tools of solvent banks and facilitating the restoration of confi dence in fi nancial markets. In recent years, during the economic recovery, the ECB continues working within its remit to support the European economy.
During the last month of 2015, the ECB announced further reductions to the interest rate on the deposit facility of 10 basis points to reach -0.30 per cent, while keeping unchanged the interest rates on the main refi nancing operations and the marginal lending facility at 0.05 per cent and 0.30 per cent respectively. At the turning of the fi rst quarter of 2016, the ECB Governing Council reduced by 5 basis points the interest rate on the main refi nancing operations of the Eurosystem to 0.00 per cent. Similarly, both interest rates on the marginal lending facility and on the deposit facility were further decreased by 5 and 10 basis points, to reach 0.25 per cent and -0.40 per cent respectively. Moreover, during the same month of March, the ECB added the Corporate Sector Purchase Programme (CSPP) to the Asset Purchase Programme (APP) and announced a number of changes to the APP. For instance, the ECB decided that the combined monthly purchases under the APP were to increase as of 1 April 2016 to €80 billion from €60 billion.
Furthermore, investment-grade euro-denominated bonds issued by non-bank corporations established in the EA would be included in the list of assets eligible for regular purchases under the CSPP. The CSPP was intended to further strengthen the pass-through of the Eurosystem’s asset purchases to the fi nancing conditions of the real economy with purchases due to start towards the end of the second quarter of 2016. As a result, and in conjunction with the other non-standard measures in place, the CSPP aimed to provide further monetary policy accommodation and contribute to a return of infl ation rates to levels below, but close to, 2.00 per cent in the medium-term. The eligibility under the Eurosystem’s collateral framework (the rules that lay out which assets are acceptable as collateral for

Economic Survey October 2017 163
monetary policy credit operations) constitutes a necessary condition for determining the eligibility of assets to be purchased under the CSPP, subject to further criteria.
In addition, a new series of four targeted longer-term refi nancing operations (TLTRO II), each with a maturity of four years, was launched (due to be starting in June 2016) whereby borrowing conditions for the aforementioned operations could be set as low as the interest rate on the deposit facility. The Governing Council also decided to adjust the parameters of the Public-Sector Purchase Programme (PSPP). The issuer and issue share limits for securities issued by eligible international organisations and multilateral development banks would be increased to 50.00 per cent.
Moreover, as of April 2016, the share of such securities purchased under the PSPP would be reduced from 12.00 per cent to 10.00 per cent on a monthly basis. To maintain the 20.00 per cent risk-sharing regime, the ECB’s share of monthly PSPP purchases would be increased from 8.00 per cent to 10.00 per cent. In the subsequent month, the main interest rate tools available to the ECB remained unchanged. The decision to maintain the rates on the main refi nancing operations, the marginal lending facility and the deposit facility remained unchanged up till July 2017.
By mid-2016, the Eurosystem started making purchases under its Corporate Sector Purchase Programme (CSPP). Moreover, the ECB started to conduct the fi rst operation in its new series of targeted longer-term refi nancing operations. In July 2016 and in subsequent months, the ECB confi rmed that the monthly asset purchases of €80 billion would run until the end of March 2017, or beyond, if necessary, until a sustained adjustment in the path of infl ation consistent with the ECB infl ation target was achieved. The Governing Council of the ECB also confi rmed that it expected the key ECB interest rates to remain at present or lower levels for an extended period of time, and well past the horizon of the net asset purchases.
164 Economic Survey October 2017
In the last month of 2016, the Governing Council decided that as of April 2017, the net asset purchases would continue at a monthly pace of €60 billion until the end of December 2017, or beyond, if necessary depending on the progress towards the target infl ation objective. To ensure the continued smooth implementation of the Eurosystem’s asset purchases, the Governing Council decided to change some of the parameters of the APP, eff ective as of January 2017. Amongst the changes, in addition to the extension of the programme, the ECB decided that the maturity range of the PSPP would be broadened by decreasing the minimum remaining maturity for eligible securities from two years to one year. Moreover, the purchases of securities under the APP with a yield to maturity below the interest rate on the ECB’s deposit facility would be permitted to the extent necessary.
Throughout the fi rst seven months of 2017, the Governing Council reconfi rmed that the net asset purchases, at the new monthly pace of €60 billion, were intended to run until the end of December 2017, or beyond, if necessary. The ECB maintained such a stance for the interest rate on the main refi nancing operations and on the marginal lending facility and the deposit facility as these remained unchanged at 0.00 per cent, 0.25 per cent and -0.40 per cent, respectively up until July 2017. The Governing Council expects the key ECB interest rates to remain at such levels for an extended period of time, and well beyond the horizon of the net asset purchases.
EA credit institutions can receive Central Bank credit not only through monetary policy operations but exceptionally also through Emergency Liquidity Assistance (ELA). ELA aims to provide Central Bank money to solvent fi nancial institutions that are facing temporary liquidity problems, outside of normal Eurosystem monetary policy operations. The rules and procedures surrounding the provision of ELA are laid down in the ELA agreement, which sets out the Governing Council’s role in the provision of ELA by National Central Banks (NCBs), in particular when assessing whether the provision of ELA by Eurosystem NCBs interferes with the objectives and tasks of the European System of Central Banks (ESCB). The ELA agreement
Economic Survey October 2017 165
was published in June 2017 and replaces the ELA procedure that was in place since October 2013.
The non-standard measures adopted by the ECB were aimed at augmenting the banking sector’s access to liquidity and consequently to support the functioning of the EA money market and to prolong the provision of credit to households as well as non-fi nancial corporations.
The rates of interest charged on short-term loans between banks (interbank rates) are generally indicative of the risk appetite in financial markets. As the level of risk aversion rises, fi nancial institutions would be less willing to exchange amongst themselves credit in the interbank market. During the fi rst three quarters of 2013, interbank rates remained relatively unchanged. Subsequently, interbank rates experienced some increasing volatility up until the fi rst half of 2014. However, from mid-2014 onwards, interbank rates were on a declining trend, leading to certain interest rate levels reaching negative values. This declining trend persisted till the second quarter of 2016 for the shorter-term rates which then stabilised in negative territory up until July 2017. Longer-term rates continued to decline throughout the second half of 2016 and during the fi rst seven months of 2017, albeit remaining at higher levels than their shorter-term counterparts. The overnight rate reached a negative value of 0.36 per cent in July 2017. The one year and six month rates reached a negative value of 0.15 per cent and 0.27 per cent respectively in July 2017.
The interest rates of EA interbank money markets have a bearing on Maltese Treasury Bills, as they represent an alternative portfolio investment opportunity to the local investors. During the fi rst eight months of 2017, the Maltese Government issued €376.2 million worth of Treasury Bills on the primary market. This level is €305.9 million lower than the level of Treasury Bills that were issued during the same period a year earlier. Yields in the primary and secondary markets for Malta Treasury Bills have been on a declining path since January 2013, while experiencing some volatility during 2014. In the fi rst seven months of 2017

166 Economic Survey October 2017
yields experienced a slight increase and as at July 2017, the yield on three-month bills in the primary market stood at a negative rate of 0.34 per cent whilst the yield on one-year bills stood at a negative rate of 0.19 per cent when compared to negative rates registered in July 2016 of 0.31 per cent and 0.28 per cent for three-month bills and one-year bills respectively.
No trades were executed in Treasury Bills for the period January-August 2017 and the comparable period of 2016.
8.2.4 Deposit and Lending RatesChart 8.6 below portrays developments in deposits and lending rates, together with the interest margin between their weighted averages and the ECB minimum bid rate. During 2014, the spread between weighted average deposit and lending rates experienced some fl uctuation, peaking at 3.40 per cent in November 2014 before edging down again in the fi nal month of the year. During 2014, the ECB minimum bid rate continued on a downward path reaching a low of 0.05 per cent in September. Over the course
Chart 8.6
0.0
1.0
2.0
3.0
4.0
5.0
Jan-
14
Mar
-14
May
-14
Jul-1
4
Sep
-14
Nov
-14
Jan-
15
Mar
-15
May
-15
Jul-1
5
Sep
-15
Nov
-15
Jan-
16
Mar
-16
May
-16
Jul-1
6
Sep
-16
Nov
-16
Jan-
17
Mar
-17
May
-17
Jul-1
7
Local Interest Rates and Margins
Spread - Interest margin Weighted average deposit rate Weighted average lending rateNon-financial companies lending rate Households and individuals lending rate ECB minimum bid rate
percentage points

Economic Survey October 2017 167
of 2015 and up to January 2016, the spread level increased gradually before declining again in the subsequent month and remaining relatively stable, while the ECB rate dropped to 0.00 per cent in March 2016 and remained at this level thereafter. The spread dipped again in May 2017 and edged mildly upwards until July 2017. The dynamics of such a stable spread level between lending and deposit rates, refl ects an overall marginal decrease in deposit rates and a corresponding minimal decline in lending rates from February 2016 onwards. As at the end of July 2017, the spread stood at 3.30 per cent, which represents the same level registered in January 2017.
8.2.5 The Capital MarketIn the fi rst eight months of 2017, the Government issued €258.9 million worth of stocks on the primary market. Moreover, €495.6 million worth of stocks were re-integrated into other issued stock during the period under review and total redeemed stocks amounted to €4.6 million.
Newly issued corporate bonds decreased by 3.0 per cent during the period January to August 2017, reaching €216.0 million as at August 2017 from €222.7 million registered in the fi rst eight months of 2016. Redemptions of corporate bonds increased by €88.1 million over the period under review, reaching €95.6 million by end of August 2017. No deductions were registered as at August 2017, mirroring the situation in same period in 2016, while rollovers registered an increase of 4.8 per cent, reaching €66.5 million as at August 2017.
Table 8.8 portrays the secondary market trading activities related to Government stock. Trading activity between January and August 2017 was lower than during the same period last year, as indeed, turnover levels declined by 9.4 per cent, to reach €299.4 million. The number of deals during the fi rst eight months of 2017 increased to 9,265 deals when compared to 7,514 in the period January to August 2016, refl ecting an increase of 23.3 per cent. In the period under review, trading was mainly concentrated in two issues, namely: 2.1 per cent MGS 2039 and 2.5 per cent MGS
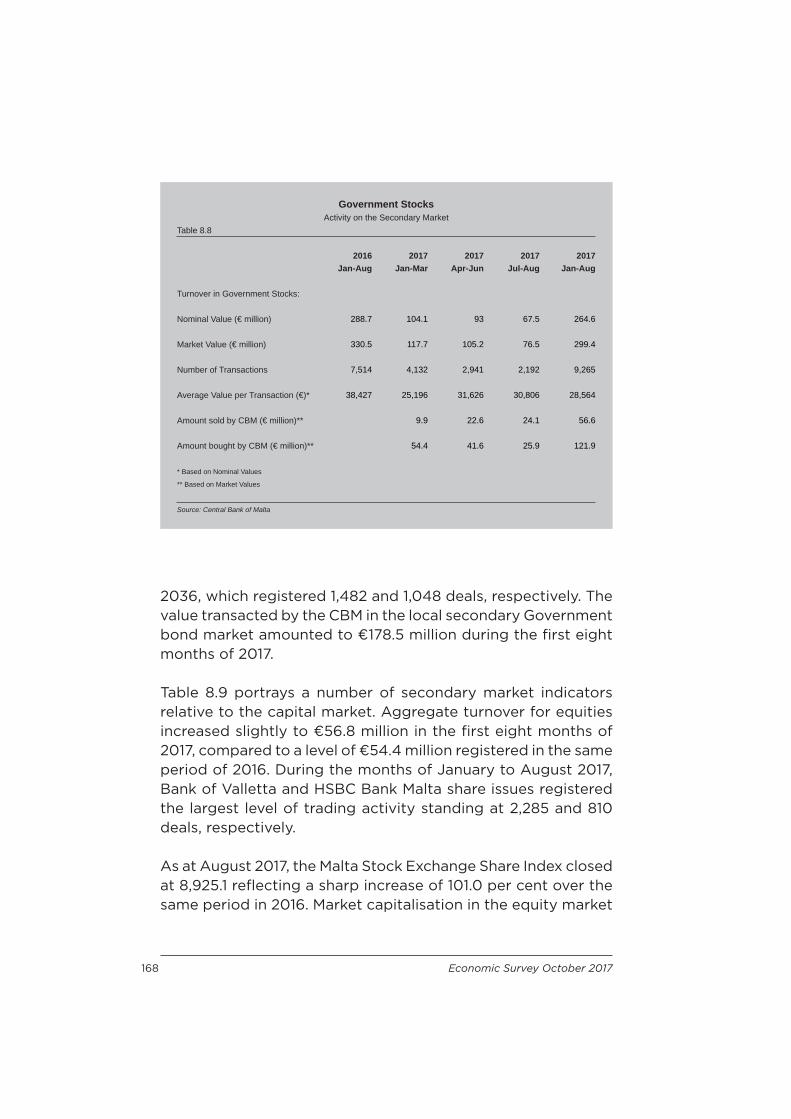
168 Economic Survey October 2017
2036, which registered 1,482 and 1,048 deals, respectively. The value transacted by the CBM in the local secondary Government bond market amounted to €178.5 million during the fi rst eight months of 2017.
Table 8.9 portrays a number of secondary market indicators relative to the capital market. Aggregate turnover for equities increased slightly to €56.8 million in the fi rst eight months of 2017, compared to a level of €54.4 million registered in the same period of 2016. During the months of January to August 2017, Bank of Valletta and HSBC Bank Malta share issues registered the largest level of trading activity standing at 2,285 and 810 deals, respectively.
As at August 2017, the Malta Stock Exchange Share Index closed at 8,925.1 refl ecting a sharp increase of 101.0 per cent over the same period in 2016. Market capitalisation in the equity market
Government StocksActivity on the Secondary Market
Table 8.8
2016 2017 2017 2017 2017Jan-Aug Jan-Mar Apr-Jun Jul-Aug Jan-Aug
Turnover in Government Stocks:
Nominal Value (€ million) 288.7 104.1 93 67.5 264.6
Market Value (€ million) 330.5 117.7 105.2 76.5 299.4
Number of Transactions 7,514 4,132 2,941 2,192 9,265
Average Value per Transaction (€)* 38,427 25,196 31,626 30,806 28,564
Amount sold by CBM (€ million)** 9.9 22.6 24.1 56.6
Amount bought by CBM (€ million)** 54.4 41.6 25.9 121.9
* Based on Nominal Values
** Based on Market Values
Source: Central Bank of Malta
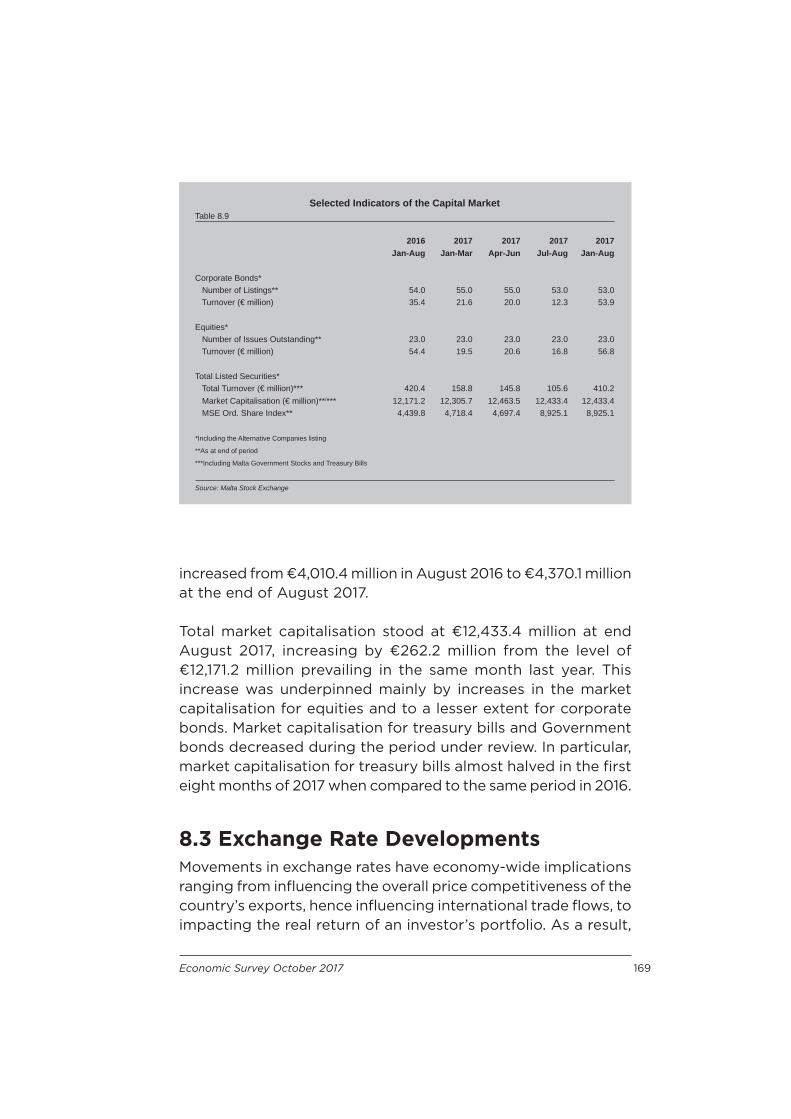
Economic Survey October 2017 169
increased from €4,010.4 million in August 2016 to €4,370.1 million at the end of August 2017.
Total market capitalisation stood at €12,433.4 million at end August 2017, increasing by €262.2 million from the level of €12,171.2 million prevailing in the same month last year. This increase was underpinned mainly by increases in the market capitalisation for equities and to a lesser extent for corporate bonds. Market capitalisation for treasury bills and Government bonds decreased during the period under review. In particular, market capitalisation for treasury bills almost halved in the fi rst eight months of 2017 when compared to the same period in 2016.
8.3 Exchange Rate DevelopmentsMovements in exchange rates have economy-wide implications ranging from infl uencing the overall price competitiveness of the country’s exports, hence infl uencing international trade fl ows, to impacting the real return of an investor’s portfolio. As a result,
Selected Indicators of the Capital MarketTable 8.9
2016 2017 2017 2017 2017Jan-Aug Jan-Mar Apr-Jun Jul-Aug Jan-Aug
Corporate Bonds* Number of Listings** 54.0 55.0 55.0 53.0 53.0 Turnover (€ million) 35.4 21.6 20.0 12.3 53.9
Equities* Number of Issues Outstanding** 23.0 23.0 23.0 23.0 23.0 Turnover (€ million) 54.4 19.5 20.6 16.8 56.8
Total Listed Securities* Total Turnover (€ million)*** 420.4 158.8 145.8 105.6 410.2 Market Capitalisation (€ million)**/*** 12,171.2 12,305.7 12,463.5 12,433.4 12,433.4 MSE Ord. Share Index** 4,439.8 4,718.4 4,697.4 8,925.1 8,925.1
*Including the Alternative Companies listing
**As at end of period
***Including Malta Government Stocks and Treasury Bills
Source: Malta Stock Exchange

170 Economic Survey October 2017
exchange rates developments aff ect economies, fi rms and also consumers, thus having a bearing on both the real, as well as the fi nancial sectors of an economy.
Chart 8.7 shows the developments in exchange rate markets since the end of 2014, portraying an indexed Euro exchange rate against the three major currencies, namely the US Dollar, UK Sterling and the Japanese Yen. The Euro experienced sharp declines against all three major currencies in the early months of 2015 as a result of increased uncertainties in the EA’s sovereign debt markets. Thereafter, the Euro to US Dollar exchange rate started to show greater stability, whereas the Euro to Japanese Yen rate continued to follow the downward path. With regards to the Euro-Sterling exchange rate, a notable appreciation was experienced following the Brexit referendum. In 2017, the Euro appreciated against all three major currencies in light of an improved economic outlook for the EA.
The Euro to US Dollar followed a downward path during the second half of 2014, and the depreciation intensifi ed during the
Chart 8.7
70.00
75.00
80.00
85.00
90.00
95.00
100.00
105.00
110.00
115.00
120.00
D M J S D M J S D M J
Euro Exchange Rate Movements(Index of End of Month Rates, End 2014=100)
US Dollar
UK Sterling
Japanese Yen
2015 2016 2017

Economic Survey October 2017 171
fi rst 3 months of 2015, reaching a 12-year low of US$1.05 by mid-March 2015, standing around 22.0 per cent lower than the level prevailing in the same comparable period a year earlier. This was the result of a number of factors, namely the possibility of a Greek exit from the Euro zone, along with a weak economic activity by a number of EA Member States, the expected tightening of monetary policy in the USA and the ECB’s quantitative easing program. In the subsequent quarters, the Euro recovered slightly relative to the Dollar and was trading at US$1.15 by mid October 2015, after which it declined back to a US$1.06 level by the end of November 2015 amid continued non-standard interventions by the ECB. The Euro-US Dollar exchange rate was relatively stable in the subsequent months hovering towards a value of US$1.12 up until October 2016, after which it declined again, reaching US$1.04 by December 2016. The Euro-Dollar exchange rate gained momentum in the subsequent months following better prospects in the Euro zone and was trading at US$1.18 by the end of August 2017. From a longer-term perspective, it was trading at around 8.7 per cent below its 10-year average level of US$1.30.
The Euro-Sterling exchange rate followed a downward trend during 2014 and the depreciation in the exchange rate continued during the fi rst quarter of 2015, with the rate reaching a 7-year low of £0.71 by mid-March 2015, representing an 8.8 per cent reduction in its value since the start of the year. This sharp decline refl ected the relatively stronger economic performance registered by the UK, increased uncertainties in the EA sovereign bonds market along with the possibility of a Greek exit from the Euro zone. The value of the Euro relative to the Sterling persisted in the following months reaching £0.70 in the beginning of August 2015. A strengthening of the Euro against the UK Sterling was observed in the subsequent weeks before depreciating again in November reaching £0.70 by the end of the month. The Euro regained strength relative to the UK Sterling throughout December; a positive trend that followed in the subsequent months with the rate trading at £0.79 by the end of the fi rst quarter of 2016 on the back of a relatively stronger outlook in the EA relative to the UK. The exchange rate developments in
172 Economic Survey October 2017
the subsequent months were governed by the Brexit referendum. Indeed, following the announcement of the referendum result on the 24th of June, the Euro gained 6.0 per cent over the UK Sterling in the span of one day, increasing from £0.76 to £0.81. The uncertainty surrounding the UK’s exit from the EU led the Euro to appreciate further relative to the Sterling and the relative exchange rate reached £0.90 by end of October 2016, albeit depreciating slightly in the following weeks. By the end of 2016, the sterling was trading at £0.85 against the Euro and it hovered around the same rate for the subsequent fi ve months. It then followed a gradual appreciation as a result of better EA prospects, and was trading at £0.92 by the end of August 2017 which, from a longer-term perspective, is 11.6 per cent above its 10-year average level of £0.84.
Following an overall sharp appreciation of the Euro in respect of the Japanese Yen during 2014, where it peaked at a 7-year high of around JPY 148, the value of the Euro against the Yen depreciated during the fi rst months of 2015 with the rate reaching JPY 126.96 by mid-April 2015 as a result of distress in the European markets. The exchange rate appreciated in the following weeks reaching a rate of JPY 140.04 by mid-June 2015, before gradually depreciating thereafter as a result of the uncertainty surrounding the EU, standing at JPY 130.97 by the end of 2015. The downward trend persisted in the subsequent months and the Euro was trading at JPY 123.97 by the end of May 2015. The uncertainty surrounding the Brexit intensifi ed the depreciation of the Euro against the Japanese Yen with the rate falling from JPY 120.7 to JPY 113.62 in just 1 day following the announcement of Brexit. The exchange rate seemed to stabilise thereafter, hovering around JPY 114 up to the end of November 2016, after which it appreciated again reaching the rate of JPY 123.08 by the end of 2016. This upward trend in the exchange rate was thereafter observed in 2017 as a result of an improved outlook for the EA, and the Euro against the Japanese Yen was trading at JPY 130.81 by the end of August 2017 – representing 13.7 per cent increase when compared to the level prevailing in the corresponding month of the previous year. From a longer-term perspective, the Euro against the Japanese Yen is currently

Economic Survey October 2017 173
trading at 2.7 per cent above the 10-year average mark of JPY 127.35.

174 Economic Survey October 2017
Government Revenue(January-August)
Appendix Table 8.1 € thousand
2014 2015 2016 2017
Tax Revenue 1,733,182 1,918,470 2,118,960 2,299,698Direct Tax Revenue 1,052,515 1,137,357 1,263,274 1,364,038 Income Tax 629,051 693,976 771,170 833,252 Social Security 423,464 443,381 492,105 530,786Indirect Tax Revenue 680,667 781,113 855,685 935,660 Customs and Excise Duties 96,905 160,222 170,594 195,957 Licences, Taxes and Fines 161,313 180,307 210,493 221,952 Value Added Tax 422,449 440,584 474,598 517,751
Non-Tax Revenue 253,619 303,960 203,670 284,091Fees of Offi ce 25,175 29,154 32,997 66,566Reimbursements 14,738 15,413 16,708 22,993Rents 20,145 21,515 22,253 22,088Dividends on Investments 4,306 9,273 12,441 19,125Repayment of Government Loans 1,031 132 73 34 and interestMiscellaneous Receipts 15,739 33,050 24,158 22,839Public Corporations 0 0 0 0Central Bank of Malta 37,000 36,000 36,000 36,000Grants 135,485 159,423 59,041 94,447
Recurrent Revenue 1,986,801 2,222,430 2,322,630 2,583,789
Extraordinary Receipts 0 700 1,131 889Loans 573,841 258,287 438,669 257,770Repayment of Loans made by Government 0 0 11,984 0
Total Revenue 2,560,642 2,481,418 2,774,413 2,842,448
Source: The Treasury, Ministry for Finance

Economic Survey October 2017 175
Government Recurrent Expenditure(January-August)
Appendix Table 8.2 € thousand
2014 2015 2016 2017
Offi ce of the President 1,715 2,291 2,683 3,412House of Representatives 1,909 2,306 2,826 2,855Offi ce of the Ombudsman 700 800 600 900National Audit Offi ce 1,980 2,025 2,160 2,363Offi ce of the Prime Minister 17,161 17,621 24,248 21,560Public Service Commission 280 339 363 371Information 711 742 676 616Government Printing Press 845 840 825 864Electoral Offi ce 6,310 6,841 1,224 6,636Government Property Division 4,777 4,808 4,516 0Ministry for European Affairs and Implementation of the Electoral Manifesto 5,283 7,697 16,232 34,650
Ministry for Foreign Affairs 12,847 14,129 15,013 16,438Ministry for Tourism [Culture and the Environment] 42,406 31,511 44,275 42,776Local Government 27,619 26,809 27,405 29,918Ministry for Education and Employment 138,543 164,874 170,956 168,687Education 120,072 129,329 137,783 146,070Ministry for Sustainable Development, the Environment and Climate Change 29,851 29,345 31,654 40,356
Ministry for Transport and Infrastructure 57,680 54,402 60,801 59,952Ministry for Gozo 16,678 16,786 18,186 19,616Ministry for Social Dialogue, Consumer Affairs and Civil Liberties 6,234 6,566 6,917 8,497
Industrial and Employment Relations 784 781 960 986Ministry for the Economy, Investment and Small Business 18,250 20,006 21,135 12,438Trade Services [Commerce] 1,033 1,036 1,115 981Ministry for the Family and Social Solidarity 32,161 42,452 40,798 51,249Social Policy [Security] 131,419 137,665 151,893 163,030Social Security Benefi ts 530,958 568,960 591,399 625,949Social Welfare Standards 611 675 678 691Elderly and Community Care 48,963 52,141 60,998 67,266Ministry for Home Affairs and National Security 18,757 14,145 8,876 8,919Armed Forces of Malta 24,694 26,672 27,145 29,514
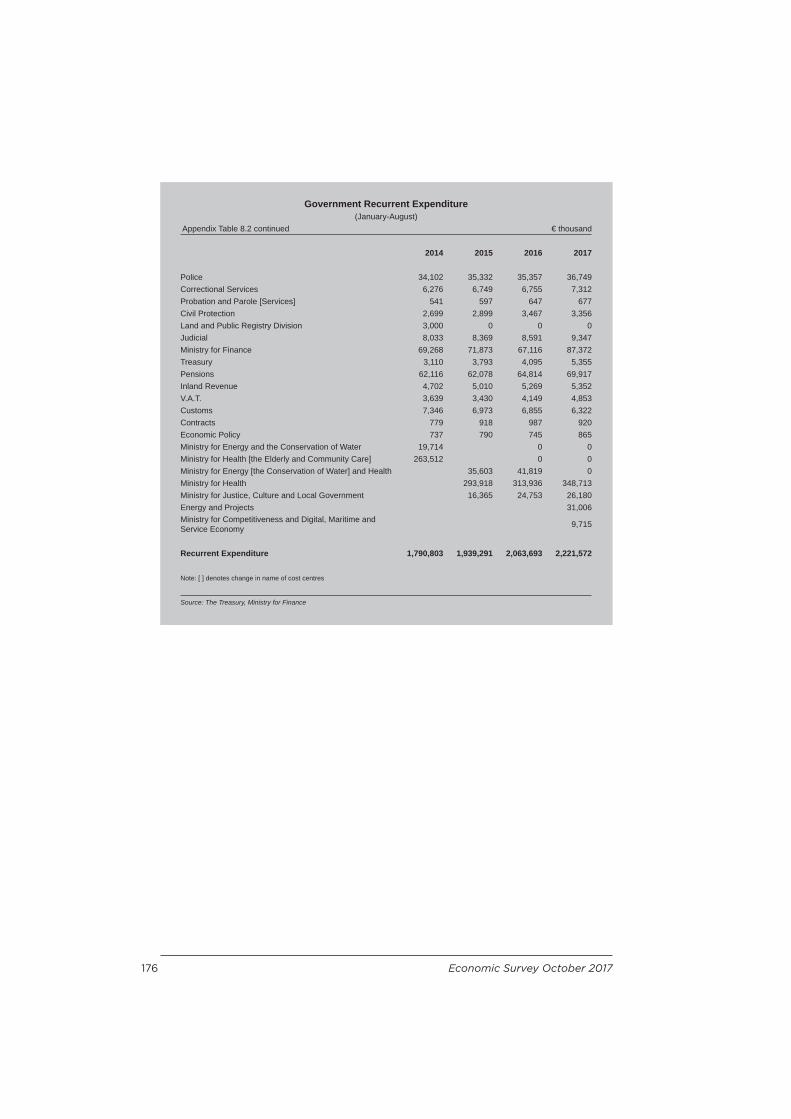
176 Economic Survey October 2017
Government Recurrent Expenditure(January-August)
Appendix Table 8.2 continued € thousand
2014 2015 2016 2017
Police 34,102 35,332 35,357 36,749Correctional Services 6,276 6,749 6,755 7,312Probation and Parole [Services] 541 597 647 677Civil Protection 2,699 2,899 3,467 3,356Land and Public Registry Division 3,000 0 0 0Judicial 8,033 8,369 8,591 9,347Ministry for Finance 69,268 71,873 67,116 87,372Treasury 3,110 3,793 4,095 5,355Pensions 62,116 62,078 64,814 69,917Inland Revenue 4,702 5,010 5,269 5,352V.A.T. 3,639 3,430 4,149 4,853Customs 7,346 6,973 6,855 6,322Contracts 779 918 987 920Economic Policy 737 790 745 865Ministry for Energy and the Conservation of Water 19,714 0 0Ministry for Health [the Elderly and Community Care] 263,512 0 0Ministry for Energy [the Conservation of Water] and Health 35,603 41,819 0Ministry for Health 293,918 313,936 348,713Ministry for Justice, Culture and Local Government 16,365 24,753 26,180Energy and Projects 31,006Ministry for Competitiveness and Digital, Maritime and Service Economy 9,715
Recurrent Expenditure 1,790,803 1,939,291 2,063,693 2,221,572
Note: [ ] denotes change in name of cost centres
Source: The Treasury, Ministry for Finance
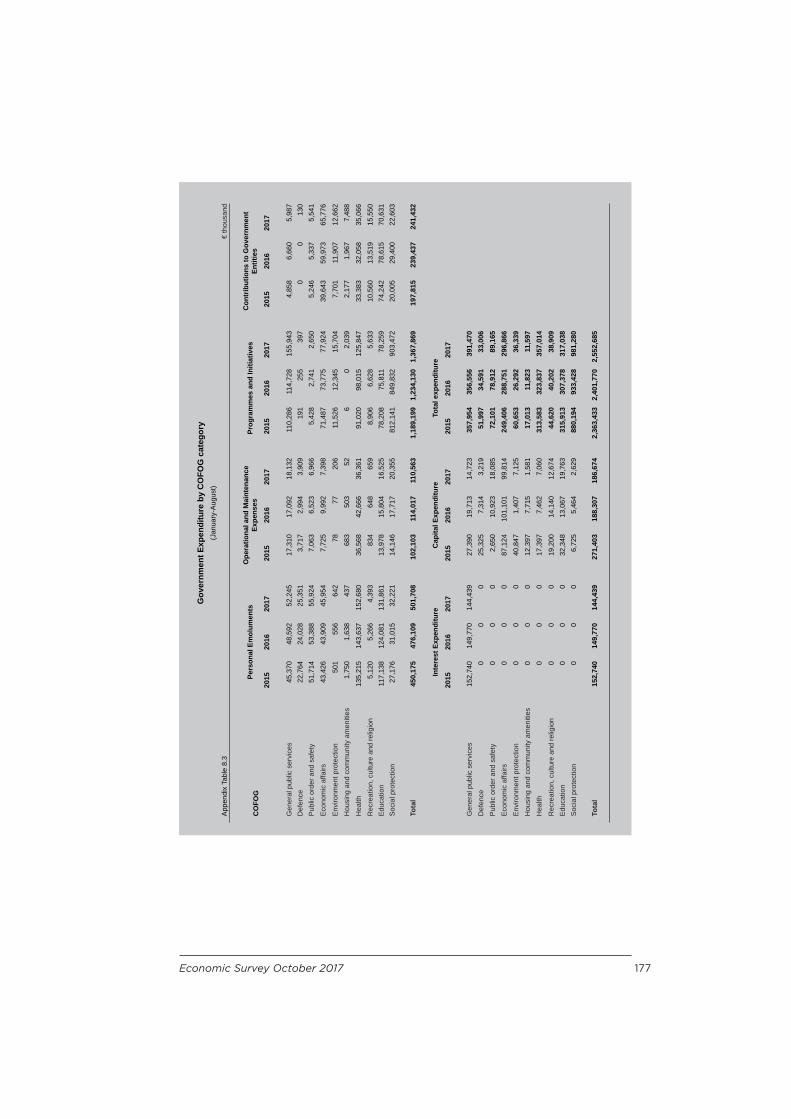
Economic Survey October 2017 177
Gov
ernm
ent E
xpen
ditu
re b
y C
OFO
G c
ateg
ory
(Jan
uary
-Aug
ust)
App
endi
x Ta
ble
8.3
€ th
ousa
nd
CO
FOG
Pers
onal
Em
olum
ents
Ope
ratio
nal a
nd M
aint
enan
ce
Expe
nses
Prog
ram
mes
and
Initi
ativ
esC
ontr
ibut
ions
to G
over
nmen
t En
titie
s
2015
2016
2017
2015
2016
2017
2015
2016
2017
2015
2016
2017
Gen
eral
pub
lic s
ervi
ces
45,3
70
48,5
92
52,2
45
17,3
10
17,0
92
18,1
32
110,
286
114,
728
155,
943
4,85
8 6,
660
5,98
7 D
efen
ce22
,764
24
,028
25
,351
3,
717
2,99
4 3,
909
191
255
397
0 0
130
Pub
lic o
rder
and
saf
ety
51,7
14
53,3
88
55,9
24
7,06
3 6,
523
6,96
6 5,
428
2,74
1 2,
650
5,24
6 5,
337
5,54
1 E
cono
mic
affa
irs43
,426
43
,909
45
,954
7,
725
9,99
2 7,
398
71,4
87
73,7
75
77,9
24
39,6
43
59,9
73
65,7
76
Env
ironm
ent p
rote
ctio
n50
1 55
6 64
2 78
77
20
6 11
,526
12
,345
15
,704
7,
701
11,9
07
12,6
62
Hou
sing
and
com
mun
ity a
men
ities
1,75
0 1,
638
437
683
503
52
6 0
2,03
9 2,
177
1,96
7 7,
488
Hea
lth13
5,21
5 14
3,63
7 15
2,68
0 36
,568
42
,666
36
,361
91
,020
98
,015
12
5,84
7 33
,383
32
,058
35
,066
R
ecre
atio
n, c
ultu
re a
nd re
ligio
n5,
120
5,26
6 4,
393
834
648
659
8,90
6 6,
628
5,63
3 10
,560
13
,519
15
,550
E
duca
tion
117,
138
124,
081
131,
861
13,9
78
15,8
04
16,5
25
78,2
08
75,8
11
78,2
59
74,2
42
78,6
15
70,6
31
Soc
ial p
rote
ctio
n27
,176
31
,015
32
,221
14
,146
17
,717
20
,355
81
2,14
1 84
9,83
2 90
3,47
2 20
,005
29
,400
22
,603
Tota
l 45
0,17
5 47
6,10
9 50
1,70
8 10
2,10
3 11
4,01
7 11
0,56
3 1,
189,
199
1,23
4,13
0 1,
367,
869
197,
815
239,
437
241,
432
Inte
rest
Exp
endi
ture
Cap
ital E
xpen
ditu
reTo
tal e
xpen
ditu
re
2015
2016
2017
2015
2016
2017
2015
2016
2017
Gen
eral
pub
lic s
ervi
ces
152,
740
149,
770
144,
439
27,3
90
19,7
13
14,7
23
357,
954
356,
556
391,
470
Def
ence
0 0
0 25
,325
7,
314
3,21
9 51
,997
34
,591
33
,006
P
ublic
ord
er a
nd s
afet
y0
0 0
2,65
0 10
,923
18
,085
72
,101
78
,912
89
,165
E
cono
mic
affa
irs0
0 0
87,1
24
101,
101
99,8
14
249,
406
288,
751
296,
866
Env
ironm
ent p
rote
ctio
n0
0 0
40,8
47
1,40
7 7,
125
60,6
53
26,2
92
36,3
39
Hou
sing
and
com
mun
ity a
men
ities
0 0
0 12
,397
7,
715
1,58
1 17
,013
11
,823
11
,597
H
ealth
0 0
0 17
,397
7,
462
7,06
0 31
3,58
3 32
3,83
7 35
7,01
4 R
ecre
atio
n, c
ultu
re a
nd re
ligio
n0
0 0
19,2
00
14,1
40
12,6
74
44,6
20
40,2
02
38,9
09
Edu
catio
n0
0 0
32,3
48
13,0
67
19,7
63
315,
913
307,
378
317,
038
Soc
ial p
rote
ctio
n0
0 0
6,72
5 5,
464
2,62
9 88
0,19
4 93
3,42
8 98
1,28
0
Tota
l 15
2,74
0 14
9,77
0 14
4,43
9 27
1,40
3 18
8,30
7 18
6,67
4 2,
363,
433
2,40
1,77
0 2,
552,
685

Statistical Annex


Economic Survey October 2017 181
Popu
latio
nTa
ble
I
2009
2010
2011
2012
2013
2014
2015
2016
Tota
l Pop
ulat
ion
(000
’s)
414,
027
414,
989
417,
546
421,
364
425,
384
429,
344
434,
403
440,
433
Mal
es (0
00’s
)20
6,20
320
6,40
520
7,69
520
9,88
021
2,42
421
4,73
521
7,56
922
0,91
4 F
emal
es (0
00’s
)20
7,82
420
8,58
420
9,85
121
1,48
421
2,96
021
4,60
921
6,83
421
9,51
9 %
Incr
ease
per
ann
um0.
8%0.
2%0.
6%0.
9%1.
0%0.
9%1.
2%1.
4%
Nat
ural
Incr
ease
per
ann
um80
888
889
871
279
692
188
31,
134
Cru
de B
irth
Rat
e (p
er 1
000
popu
latio
n)9.
89.
410
.09.
89.
59.
810
.010
.2
Cru
de M
orta
lity
Rat
e (p
er 1
000
popu
latio
n)7.
87.
37.
88.
17.
67.
78.
07.
6
Cru
de M
arria
ge R
ate
(per
100
0 po
pula
tion)
5.7
6.3
6.2
6.7
6.1
6.7
7.0
6.9
Inf
ant M
orta
lity
Rat
e (p
er 1
000
birth
s)5.
55.
66.
55.
36.
75.
05.
87.
4
Life
Exp
ecta
ncy
(at b
irth)
M
ales
77.9
79.3
78.7
78.6
79.6
79.8
79.7
80.4
F
emal
es82
.783
.683
.083
.084
.084
.384
.084
.3
Life
Exp
ecta
ncy
(at a
ge 6
5)
M
ales
16.8
18.5
17.7
17.6
18.4
18.5
18.7
19.6
F
emal
es20
.621
.121
.021
.021
.521
.721
.622
.1
Sou
rce:
Nat
iona
l Sta
tistic
s O
ffi ce
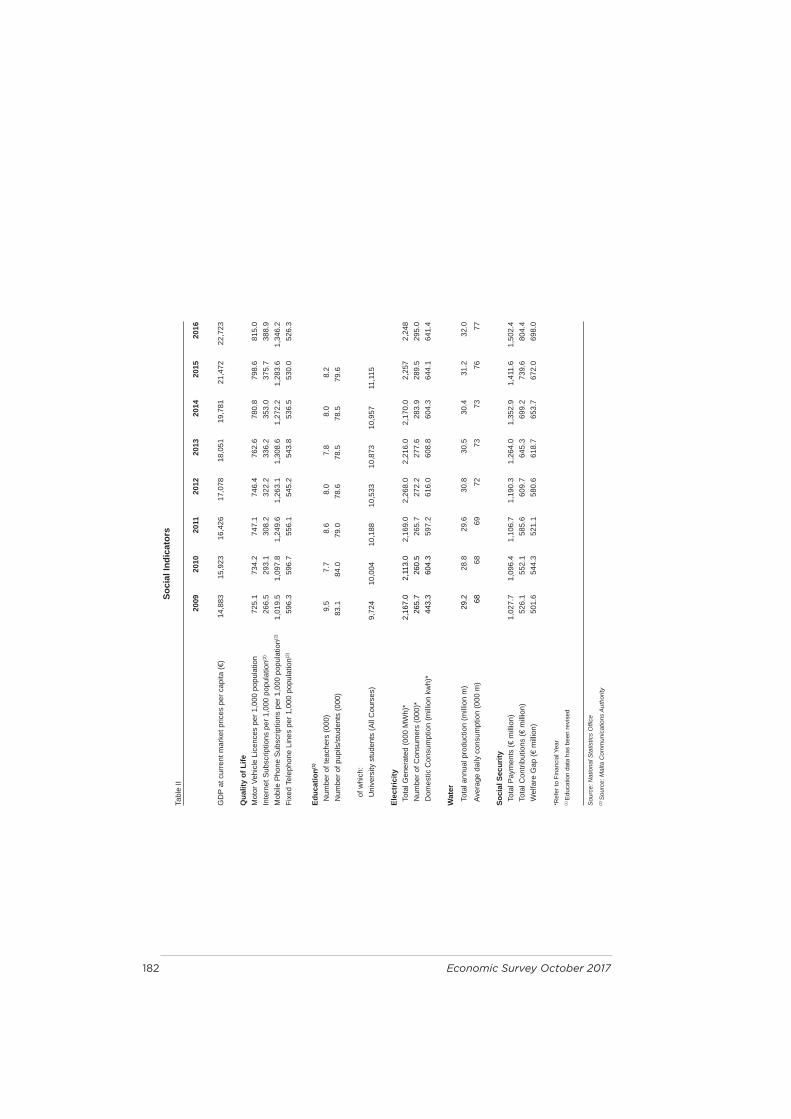
182 Economic Survey October 2017
Soci
al In
dica
tors
Tabl
e II
2009
2010
2011
2012
2013
2014
2015
2016
GD
P at
cur
rent
mar
ket p
rices
per
cap
ita (€
)14
,883
15,9
2316
,426
17,0
7818
,051
19,7
8121
,472
22,7
23
Qua
lity
of L
ifeM
otor
Veh
icle
Lic
ence
s pe
r 1,0
00 p
opul
atio
n72
5.1
734.
274
7.1
746.
476
2.6
780.
879
8.6
815.
0In
tern
et S
ubsc
riptio
ns p
er 1
,000
pop
ulat
ion(2
)26
6.5
293.
130
8.2
322.
233
6.2
353.
037
5.7
388.
9M
obile
Pho
ne S
ubsc
riptio
ns p
er 1
,000
pop
ulat
ion(2
)1,
019.
51,
097.
81,
249.
61,
263.
11,
308.
61,
272.
21,
283.
61,
346.
2Fi
xed
Tele
phon
e Li
nes
per 1
,000
pop
ulat
ion(2
)59
6.3
596.
755
6.1
545.
254
3.8
536.
553
0.0
526.
3
Educ
atio
n(1)
Num
ber o
f tea
cher
s (0
00)
9.5
7.7
8.6
8.0
7.8
8.0
8.2
Num
ber o
f pup
ils/s
tude
nts
(000
)83
.184
.079
.078
.678
.578
.579
.6
o
f whi
ch:
U
nive
rsity
stu
dent
s (A
ll C
ours
es)
9,72
410
,004
10,1
8810
,533
10,8
7310
,957
11,1
15
Elec
tric
ity
Tot
al G
ener
ated
(000
MW
h)*
2,16
7.0
2,11
3.0
2,16
9.0
2,26
8.0
2,21
6.0
2,17
0.0
2,25
72,
248
Num
ber o
f Con
sum
ers
(000
)*26
5.7
260.
526
5.7
272.
227
7.6
283.
928
9.5
295.
0 D
omes
tic C
onsu
mpt
ion
(mill
ion
kwh)
*44
3.3
604.
359
7.2
616.
060
8.8
604.
364
4.1
641.
4
Wat
er
Tot
al a
nnua
l pro
duct
ion
(mill
ion
m)
29.2
28.8
29.6
30.8
30.5
30.4
31.2
32.0
Ave
rage
dai
ly c
onsu
mpt
ion
(000
m)
6868
6972
7373
7677
Soci
al S
ecur
ity T
otal
Pay
men
ts (€
mill
ion)
1,02
7.7
1,09
6.4
1,10
6.7
1,19
0.3
1,26
4.0
1,35
2.9
1,41
1.6
1,50
2.4
Tot
al C
ontri
butio
ns (€
mill
ion)
526.
155
2.1
585.
660
9.7
645.
369
9.2
739.
680
4.4
Wel
fare
Gap
(€ m
illio
n)50
1.6
544.
352
1.1
580.
661
8.7
653.
767
2.0
698.
0
*Ref
er to
Fin
anci
al Y
ear
(1) E
duca
tion
data
has
bee
n re
vise
d
Sou
rce:
Nat
iona
l Sta
tistic
s O
ffi ce
(2) S
ourc
e: M
alta
Com
mun
icat
ions
Aut
horit
y
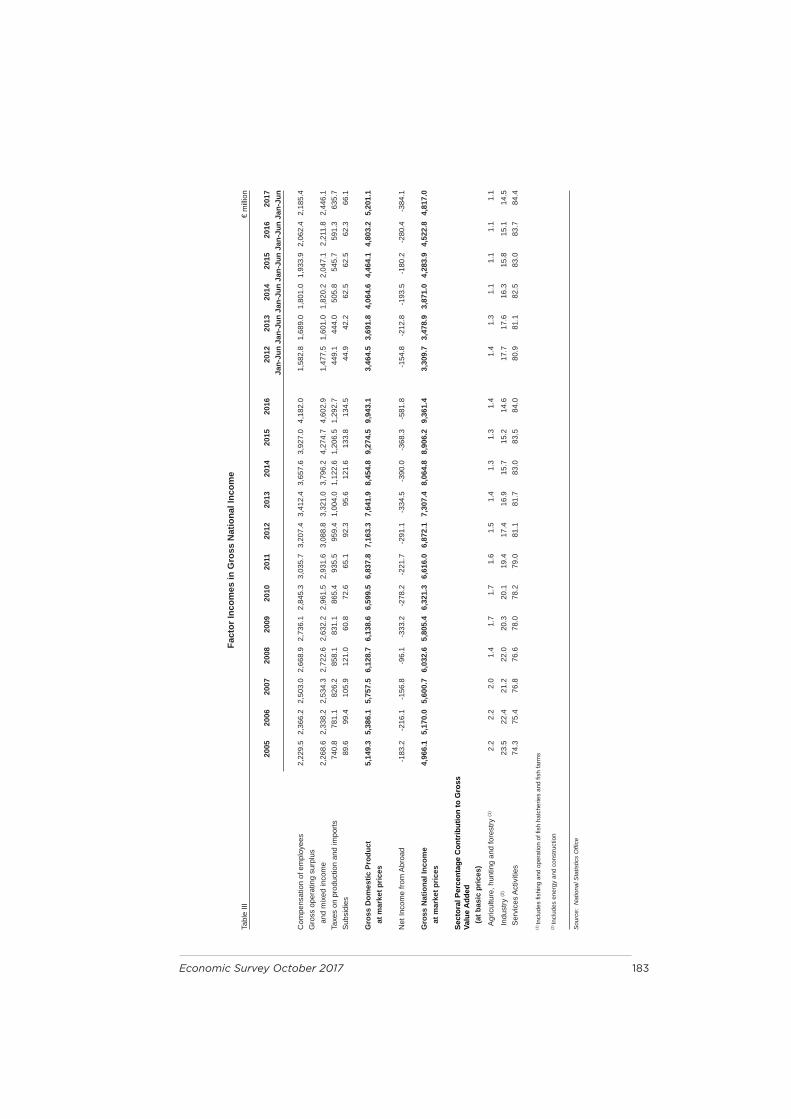
Economic Survey October 2017 183
Fact
or In
com
es in
Gro
ss N
atio
nal I
ncom
eTa
ble
III€
mill
ion
2005
2006
2007
2008
2009
2010
2011
2012
2013
2014
2015
2016
2012
2013
2014
2015
2016
2017
Jan-
Jun
Jan-
Jun
Jan-
Jun
Jan-
Jun
Jan-
Jun
Jan-
Jun
Com
pens
atio
n of
em
ploy
ees
2,22
9.5
2,36
6.2
2,50
3.0
2,66
8.9
2,73
6.1
2,84
5.3
3,03
5.7
3,20
7.4
3,41
2.4
3,65
7.6
3,92
7.0
4,18
2.0
1,58
2.8
1,68
9.0
1,80
1.0
1,93
3.9
2,06
2.4
2,18
5.4
Gro
ss o
pera
ting
surp
lus
and
mix
ed in
com
e2,
268.
62,
338.
22,
534.
32,
722.
62,
632.
22,
961.
52,
931.
63,
088.
83,
321.
03,
796.
24,
274.
74,
602.
91,
477.
51,
601.
01,
820.
22,
047.
12,
211.
82,
446.
1Ta
xes
on p
rodu
ctio
n an
d im
ports
740.
878
1.1
826.
285
8.1
831.
186
5.4
935.
595
9.4
1,00
4.0
1,12
2.6
1,20
6.5
1,29
2.7
449.
144
4.0
505.
854
5.7
591.
363
5.7
Sub
sidi
es89
.699
.410
5.9
121.
060
.872
.665
.192
.395
.612
1.6
133.
813
4.5
44.9
42.2
62.5
62.5
62.3
66.1
Gro
ss D
omes
tic P
rodu
ct5,
149.
35,
386.
15,
757.
56,
128.
76,
138.
66,
599.
56,
837.
87,
163.
37,
641.
98,
454.
89,
274.
59,
943.
13,
464.
53,
691.
84,
064.
64,
464.
14,
803.
25,
201.
1
at m
arke
t pric
es
Net
Inco
me
from
Abr
oad
-183
.2-2
16.1
-156
.8-9
6.1
-333
.2-2
78.2
-221
.7-2
91.1
-334
.5-3
90.0
-368
.3-5
81.8
-154
.8-2
12.8
-193
.5-1
80.2
-280
.4-3
84.1
Gro
ss N
atio
nal I
ncom
e4,
966.
15,
170.
05,
600.
76,
032.
65,
805.
46,
321.
36,
616.
06,
872.
17,
307.
48,
064.
88,
906.
29,
361.
43,
309.
73,
478.
93,
871.
04,
283.
94,
522.
84,
817.
0
at m
arke
t pric
es
Sect
oral
Per
cent
age
Con
trib
utio
n to
Gro
ss
Valu
e A
dded
(a
t bas
ic p
rices
) A
gric
ultu
re, h
untin
g an
d fo
rest
ry (1
) 2
.2
2.2
2
.0
1.4
1
.7
1.7
1
.6
1.5
1
.4
1.3
1
.3
1.4
1
.4
1.3
1
.1
1.1
1
.1
1.1
Ind
ustry
(2)
23.
5 2
2.4
21.
2 2
2.0
20.
3 2
0.1
19.
4 1
7.4
16.
9 1
5.7
15.
2 1
4.6
17.
7 1
7.6
16.
3 1
5.8
15.
1 1
4.5
Ser
vice
s A
ctiv
ities
74.
3 7
5.4
76.
8 7
6.6
78.
0 7
8.2
79.
0 8
1.1
81.
7 8
3.0
83.
5 8
4.0
80.
9 8
1.1
82.
5 8
3.0
83.
7 8
4.4
(1) In
clud
es fi
shin
g an
d op
erat
ion
of fi
sh h
atch
erie
s an
d fi s
h fa
rms
(2) In
clud
es e
nerg
y an
d co
nstru
ctio
n
Sou
rce:
Nat
iona
l Sta
tistic
s O
ffi ce

184 Economic Survey October 2017
Gro
ss N
atio
nal I
ncom
e an
d Ex
pend
iture
Tabl
e IV
€ m
illio
n
2005
2006
2007
2008
2009
2010
2011
2012
2013
2014
2015
2016
2012
2013
2014
2015
2016
2017
Jan-
Jun
Jan-
Jun
Jan-
Jun
Jan-
Jun
Jan-
Jun
Jan-
Jun
GN
I at c
urre
nt m
arke
t pric
es4,
966.
15,
170.
05,
600.
76,
032.
65,
805.
46,
321.
36,
616.
06,
872.
17,
307.
48,
064.
88,
906.
29,
361.
43,
309.
73,
478.
93,
871.
04,
283.
94,
522.
84,
817.
0 %
ann
ual i
ncre
ase
of G
NI
2.7%
4.1%
8.3%
7.7%
-3.8
%8.
9%4.
7%3.
9%6.
3%10
.4%
10.4
%5.
1%5.
1%11
.3%
10.7
%5.
6%6.
5%G
DP
at c
urre
nt m
arke
t pric
es5,
149.
35,
386.
15,
757.
56,
128.
76,
138.
66,
599.
56,
837.
87,
163.
37,
641.
98,
454.
89,
274.
59,
943.
13,
464.
53,
691.
84,
064.
64,
464.
14,
803.
25,
201.
1 %
ann
ual i
ncre
ase
of G
DP
6.1%
4.6%
6.9%
6.4%
0.2%
7.5%
3.6%
4.8%
6.7%
10.6
%9.
7%7.
2%6.
6%10
.1%
9.8%
7.6%
8.3%
GD
P at
con
stan
t pric
es5,
971.
46,
080.
66,
323.
06,
534.
66,
373.
76,
599.
56,
693.
06,
867.
57,
183.
07,
769.
78,
318.
48,
777.
33,
198.
63,
364.
93,
629.
53,
894.
74,
121.
24,
380.
2
Tota
l Fin
al C
onsu
mpt
ion
Expe
nditu
re c
urre
nt m
arke
t pric
es4,
176.
14,
421.
84,
517.
74,
814.
84,
956.
25,
101.
35,
355.
25,
541.
95,
708.
45,
949.
26,
321.
46,
492.
62,
717.
92,
796.
42,
906.
03,
056.
73,
246.
53,
303.
8 c
onst
ant p
rices
4,74
0.8
4,89
7.1
4,93
2.4
5,06
3.3
5,08
9.2
5,10
1.3
5,25
6.2
5,32
0.9
5,39
6.2
5,59
5.1
5,88
9.6
5,98
8.4
2,61
7.7
2,64
5.9
2,72
6.4
2,84
5.9
2,98
6.2
3,02
2.6
Rat
io (%
) of c
onsu
mpt
ion
to G
DP
at m
.p.
81.1
%82
.1%
78.5
%78
.6%
80.7
%77
.3%
78.3
%77
.4%
74.7
%70
.4%
68.2
%65
.3%
78.4
%75
.7%
71.5
%68
.5%
67.6
%63
.5%
Gen
eral
Gov
ernm
ent F
inal
Con
sum
ptio
n Ex
-pe
nditu
re c
urre
nt m
arke
t pric
es93
2.4
1,00
2.7
1,03
2.7
1,20
9.4
1,21
3.9
1,28
6.4
1,34
5.0
1,44
8.9
1,47
9.1
1,60
4.5
1,68
8.4
1,68
5.8
708.
073
0.3
792.
284
1.1
893.
984
2.6
con
stan
t pric
es1,
102.
21,
155.
71,
166.
41,
309.
91,
266.
21,
286.
41,
330.
01,
405.
61,
400.
11,
491.
71,
546.
51,
518.
268
8.8
692.
573
7.2
770.
280
6.0
750.
3 R
atio
(%) o
f Gov
ernm
ent c
onsu
mpt
ion
to G
DP
at
m.p
.18
.1%
18.6
%17
.9%
19.7
%19
.8%
19.5
%19
.7%
20.2
%19
.4%
19.0
%18
.2%
17.0
%20
.4%
19.8
%19
.5%
18.8
%18
.6%
16.2
%
Priv
ate
Fina
l Con
sum
ptio
n Ex
pend
iture
(1)
cur
rent
mar
ket p
rices
3,24
3.8
3,41
9.1
3,48
5.0
3,60
5.5
3,74
2.3
3,81
4.9
4,01
0.2
4,09
3.0
4,22
9.3
4,34
4.7
4,63
3.0
4,80
6.8
2,00
9.9
2,06
6.1
2,11
3.8
2,21
5.6
2,35
2.5
2,46
1.2
con
stan
t pric
es3,
634.
93,
738.
43,
763.
23,
755.
43,
822.
63,
814.
93,
926.
23,
915.
93,
996.
44,
103.
84,
344.
14,
472.
71,
929.
11,
953.
51,
989.
42,
075.
72,
180.
22,
274.
4 R
atio
(%) o
f priv
ate
cons
umpt
ion
to G
DP
at m
.p.
63.0
%63
.5%
60.5
%58
.8%
61.0
%57
.8%
58.6
%57
.1%
55.3
%51
.4%
50.0
%48
.3%
58.0
%56
.0%
52.0
%49
.6%
49.0
%47
.3%
Gro
ss F
ixed
Cap
ital F
orm
atio
n c
urre
nt m
arke
t pric
es1,
132.
91,
183.
21,
288.
21,
203.
11,
114.
81,
411.
61,
229.
11,
300.
61,
335.
61,
474.
52,
328.
52,
362.
365
0.7
654.
172
2.1
1,08
6.7
1,20
6.8
1,07
6.5
con
stan
t pric
es1,
286.
21,
319.
61,
393.
91,
266.
31,
116.
41,
411.
61,
184.
01,
201.
41,
215.
61,
305.
01,
936.
11,
928.
160
5.1
598.
164
5.7
912.
198
9.9
858.
3 R
atio
(%) fi
xed
inve
stm
ent t
o G
DP
at m
.p.
22.0
%22
.0%
22.4
%19
.6%
18.2
%21
.4%
18.0
%18
.2%
17.5
%17
.4%
25.1
%23
.8%
18.8
%17
.7%
17.8
%24
.3%
25.1
%20
.7%
(1
) Incl
udin
g N
PIS
H fi
nal c
onsu
mpt
ion
expe
nditu
re
Sou
rce:
Nat
iona
l Sta
tistic
s O
ffi ce

Economic Survey October 2017 185
Labo
urTa
ble
V
2012
2013
2014
2015
2016
2015
2016
2017
Mar
chM
arch
Mar
ch
Labo
ur S
uppl
y15
9,83
916
4,86
417
0,75
217
7,39
918
3,80
617
5,45
918
1,85
518
9,98
3
Gai
nful
ly O
ccup
ied
153,
000
157,
482
163,
760
172,
104
180,
240
169,
565
177,
822
187,
334
M
ales
100,
150
101,
704
104,
688
108,
962
112,
869
107,
708
111,
829
116,
517
Fe
mal
es52
,850
55,7
7859
,072
63,1
4267
,371
61,8
5765
,993
70,8
17
Priv
ate
Dire
ct P
rodu
ctio
n31
,617
31,5
5231
,910
32,5
7932
,928
32,5
2732
,994
33,4
51of
whi
ch:
Con
stru
ctio
n 8,
976
8,81
38,
995
9,42
69,
650
9,34
39,
705
10,0
26 M
anuf
actu
ring
20,1
1120
,231
20,3
8020
,556
20,6
1420
,598
20,6
4020
,727
Oth
ers
2,53
02,
508
2,53
52,
597
2,66
42,
586
2,64
92,
698
Priv
ate
Mar
ket S
ervi
ces
80,4
9884
,013
87,8
8595
,286
102,
687
92,9
7710
0,47
710
8,59
6of
whi
ch:
W
hole
sale
and
Ret
ail (
incl
udin
g R
epai
r of
Mot
or V
ehic
les,
M
otor
cyle
s 22
,851
23,1
5523
,819
24,6
21 2
5,16
6 2
4,42
9 2
5,29
3 25
,875
and
Per
sona
l and
Hou
seho
ld G
oods
) A
ccom
odat
ion
and
Food
Ser
vice
s10
,022
10,1
0310
,396
10,7
6011
,367
10,5
7611
,020
11,7
93 F
inan
cial
and
Insu
ranc
e A
ctiv
ities
6,70
17,
003
7,37
97,
787
8,19
37,
611
8,03
48,
482
Oth
ers
40,9
2443
,752
46,2
9152
,118
57,9
6150
,361
56,1
3062
,446
Publ
ic S
ecto
r40
,885
41,9
1743
,965
44,2
3944
,625
44,0
6144
,351
45,2
87of
whi
ch:
Gov
ernm
ent D
epar
tmen
ts 3
0,31
1 3
1,29
7 3
2,27
9 33
,029
33,0
9332
,989
32,9
73 3
3,41
3 I
ndep
ende
nt S
tatu
tory
Bod
ies
8,7
53
8,7
89
9,0
62
9,34
69,
701
9,24
09,
486
10,
103
Com
pani
es w
ith P
ublic
Sec
tor m
ajor
ity s
/hld
g 1
,821
1
,831
2
,624
1,
864
1,83
11,
832
1,89
2 1
,771
of w
hich
Tem
pora
ry E
mpl
oym
ent
601
558
505
429
428
418
417
417
Reg
iste
red
Une
mpl
oyed
*6,
839
7,38
26,
992
5,29
53,
566
5,89
44,
033
2,64
9 M
ales
5,30
35,
626
5,30
63,
978
2,6
21
4,4
51
2,9
93
1,91
3 F
emal
es
1,53
61,
756
1,68
61,
317
945
1
,443
1
,040
73
6
Sel
f Em
ploy
ed17
,865
18,1
0218
,615
19,5
2220
,043
19,2
6619
,983
20,7
43
Not
e: E
mpl
oym
ent d
ata
is s
ubje
ct to
revi
sion
* In
clud
es b
oth
Par
ts I
and
II of
the
regi
ster
ed u
nem
ploy
edD
ata
for 2
012
- 201
6 sh
ows
annu
al a
vera
ges
whi
le d
ata
for 2
015
Mar
ch, 2
016
Mar
ch, 2
017
Mar
ch s
how
s da
ta a
s at
end
Mar
ch
Sou
rce:
Job
sPlu
s

186 Economic Survey October 2017
Tou
rism
Tabl
e V
I
2009
2010
2011
2012
2013
2014
2015
2016
2015
2016
2017
Jan-
Jul
Jan-
Jul
Jan-
Jul
Inbo
und
Tour
ists
(000
’s)
1,18
2.5
1,33
8.8
1,41
5.0
1,44
3.4
1,58
2.2
1,68
9.8
1,78
3.4
1,96
5.9
962.
01,
055.
21,
241.
2of
whi
ch fr
om:
Uni
ted
Kin
gdom
398.
541
5.1
438.
844
1.3
454.
748
7.7
526.
056
0.0
283.
930
2.4
305.
3Ita
ly16
1.7
219.
720
1.8
202.
223
3.8
262.
628
2.8
315.
215
1.8
165.
120
2.0
Ger
man
y 12
7.4
126.
213
4.3
137.
514
7.1
143.
114
1.9
156.
874
.281
.110
0.1
Liby
a14
.315
.96.
317
.234
.630
.86.
73.
44.
51.
71.
6S
cand
inav
ian
Cou
ntrie
s 66
.892
.993
.897
.410
5.1
108.
611
7.4
124.
063
.069
.973
.2O
ther
413.
846
9.1
540.
154
7.9
606.
965
7.0
708.
780
6.6
384.
743
5.0
559.
0
Cru
ise
Pass
enge
rs (0
00’s
)(1)
415.
546
7.6
493.
255
5.7
424.
646
5.4
591.
761
5.2
223.
8(2)
237.
1(2)
266.
2(2)
Expe
nditu
re fr
om In
boun
d To
uris
m (€
mill
ion)
924.
91,
132.
01,
221.
31,
326.
51,
440.
41,
528.
61,
639.
11,
709.
084
1.0
886.
01,
009.
5
Tota
l Sec
tor E
mpl
oym
ent i
n H
otel
s an
d R
esta
uran
ts9,
789
9,77
59,
841
10,0
2210
,103
10,3
9610
,760
11,3
6710
,451
(3)
10,9
06(3
)11
,703
(3)
% o
f Gai
nful
ly O
ccup
ied
6.7
6.7
6.6
6.6
6.4
6.3
6.3
6.3
6.2
6.2
6.3
Out
boun
d To
uris
ts (0
00’s
)26
4.5
294.
330
8.5
331.
136
3.5
390.
742
7.6
496.
817
3.1(2
)20
7.8(2
)24
0.7(2
)
Day
s St
ayed
/ N
ight
s Sp
ent (
000’
s)9,
949.
411
,147
.911
,241
.511
,859
.512
,890
.313
,522
.114
,151
.614
,961
.47,
247.
87,
774.
88,
626.
4 %
of w
hich
spe
nt in
: 5
sta
r16
.414
.215
.313
.612
.611
.610
.29.
810
.910
.110
.1 4
sta
r31
.232
.933
.031
.831
.331
.530
.329
.732
.231
.829
.4 3
sta
r12
.013
.012
.913
.214
.417
.416
.614
.417
.314
.914
.7 2
sta
r1.
41.
01.
10.
90.
71.
31.
41.
41.
51.
41.
5 1
sta
r0.
00.
00.
00.
00.
00.
00.
00.
00.
00.
00.
0 U
ncla
ssifi
ed0.
00.
00.
00.
00.
00.
00.
00.
10.
00.
00.
1 G
uest
Hou
ses
0.6
0.8
0.6
0.9
1.0
1.0
1.0
1.1
1.1
1.0
1.1
Fla
ts/P
rivat
e R
esid
ence
s31
.431
.330
.332
.133
.134
.437
.840
.634
.238
.040
.3
Tour
ist V
illag
e/A
parth
otel
s/H
oste
ls/H
olid
ay C
ompl
ex/C
amp
Site
s/B
ed &
Bre
akfa
st7.
06.
96.
87.
66.
92.
72.
62.
92.
72.
82.
8
(1) E
xclu
ding
em
bark
atio
ns a
nd M
alte
se c
ruis
e pa
ssen
gers
.
(2) D
ata
for J
anua
ry-J
une.
(3) D
ata
show
s av
erag
e fo
r Jan
uary
-Mar
ch.
Sou
rce:
Nat
iona
l Sta
tistic
s O
ffi ce
, Job
sPlu
s

Economic Survey October 2017 187
Fore
ign
Trad
eTa
ble
VII
€ m
illio
n
2009
2010
2011
2012
2013
2014
2015
2016
2015
2016
2017
Jan-
Jul
Jan-
Jul
Jan-
Jul
Impo
rts
and
Expo
rts
Impo
rts (c
.i.f.)
3,47
5.3
4,33
5.4
5,34
1.6
6,18
9.5
5,63
9.6
6,40
1.6
6,11
4.8
6,49
1.1
3,92
4.9
4,13
2.4
3,63
6.5
C
onsu
mer
goo
ds*
1,05
7.8
1,20
0.7
1,46
6.0
1,72
2.1
1,58
5.7
1,75
6.3
1,64
6.4
1,65
9.1
953.
793
1.1
1,01
8.8
In
dust
rial s
uppl
ies*
1,70
7.3
2,29
2.1
2,99
9.5
3,65
6.3
3,18
4.9
3,33
3.8
2,75
0.2
2,58
0.1
1,68
0.0
1,45
6.8
1,61
0.4
C
apita
l goo
ds a
nd
othe
rs*
710.
384
2.7
876.
181
1.0
869.
01,
311.
51,
718.
22,
251.
81,
291.
21,
744.
51,
007.
3To
tal E
xpor
ts (f
.o.b
.)2,
087.
42,
809.
33,
819.
04,
438.
83,
925.
53,
738.
73,
528.
03,
645.
92,
128.
82,
292.
81,
555.
9
of w
hich
man
ufac
ture
s2,
065.
32,
729.
43,
745.
64,
334.
83,
810.
03,
627.
83,
396.
83,
475.
72,
105.
62,
273.
71,
528.
8Tr
ade
Gap
-1,3
87.9
-1,5
26.1
-1,5
22.6
-1,7
50.6
-1,7
14.1
-2,6
62.9
-2,5
86.8
-2,8
45.2
-1,7
96.1
-1,8
39.6
-2,0
80.6
a
s %
of G
DP
at
cur
rent
mar
ket p
rices
-2
2.6%
-23.
1%-2
2.3%
-24.
4%-2
2.4%
-31.
5%-2
7.9%
-28.
6%
Sele
cted
Gro
upin
gsE
U
Im
ports
2,42
5.9
2,72
1.8
3,35
9.6
3,95
2.1
3,24
5.5
3,22
8.2
3,63
3.4
3,23
5.7
2,25
4.0
1,85
3.7
1,91
3.1
E
xpor
ts82
0.7
1,14
9.1
1,30
1.9
1,29
6.0
1,24
6.1
1,10
5.8
1,07
9.1
1,18
3.5
632.
170
0.6
657.
6
U
nite
d K
ingd
om
Impo
rts38
0.3
360.
436
2.7
372.
830
9.5
390.
641
8.8
347.
627
5.0
213.
226
4.9
E
xpor
ts10
0.5
131.
415
0.4
124.
610
7.8
99.3
126.
410
6.1
73.7
65.9
44.2
Ita
ly
Impo
rts86
1.4
1,06
8.9
1,44
7.8
1,98
8.8
1,41
0.4
1,17
8.7
1,29
9.9
1,24
7.0
772.
470
7.3
729.
8
Exp
orts
105.
215
7.6
171.
217
4.2
154.
116
1.2
137.
720
8.8
77.5
144.
497
.5
G
erm
any
Im
ports
272.
429
6.7
317.
832
0.1
321.
432
4.6
380.
037
4.6
205.
521
9.0
226.
5
Exp
orts
222.
028
1.6
326.
235
8.5
348.
630
9.2
334.
138
9.0
201.
522
5.3
232.
2
F
ranc
e
Impo
rts33
9.0
338.
537
6.1
369.
128
5.6
224.
923
4.2
259.
313
2.6
182.
813
6.7
E
xpor
ts18
7.4
238.
624
4.9
296.
925
3.0
204.
123
9.6
229.
713
4.7
123.
812
4.8
Am
eric
a
Impo
rts22
9.5
276.
935
3.5
278.
938
7.9
986.
682
3.6
1,69
2.7
685.
01,
403.
661
1.0
E
xpor
ts18
5.1
228.
822
6.7
255.
322
4.7
231.
322
2.7
802.
812
0.6
698.
810
7.9
Afri
ca
Impo
rts72
.415
1.5
35.8
197.
225
6.4
236.
116
3.2
269.
676
.914
0.9
166.
5
Exp
orts
137.
218
2.7
234.
377
6.8
617.
397
1.3
934.
956
3.5
614.
835
1.6
291.
8A
sia
Im
ports
457.
761
1.7
641.
976
9.9
827.
673
3.6
783.
080
3.9
412.
546
2.9
584.
0
Exp
orts
528.
168
6.5
1,09
2.1
1,02
0.4
1,05
9.6
767.
471
5.8
671.
640
5.1
277.
029
5.0
* Tre
ated
diff
eren
tly fr
om o
ther
par
ts in
the
Sur
vey
Sou
rce:
Nat
iona
l Sta
tistic
s O
ffi ce
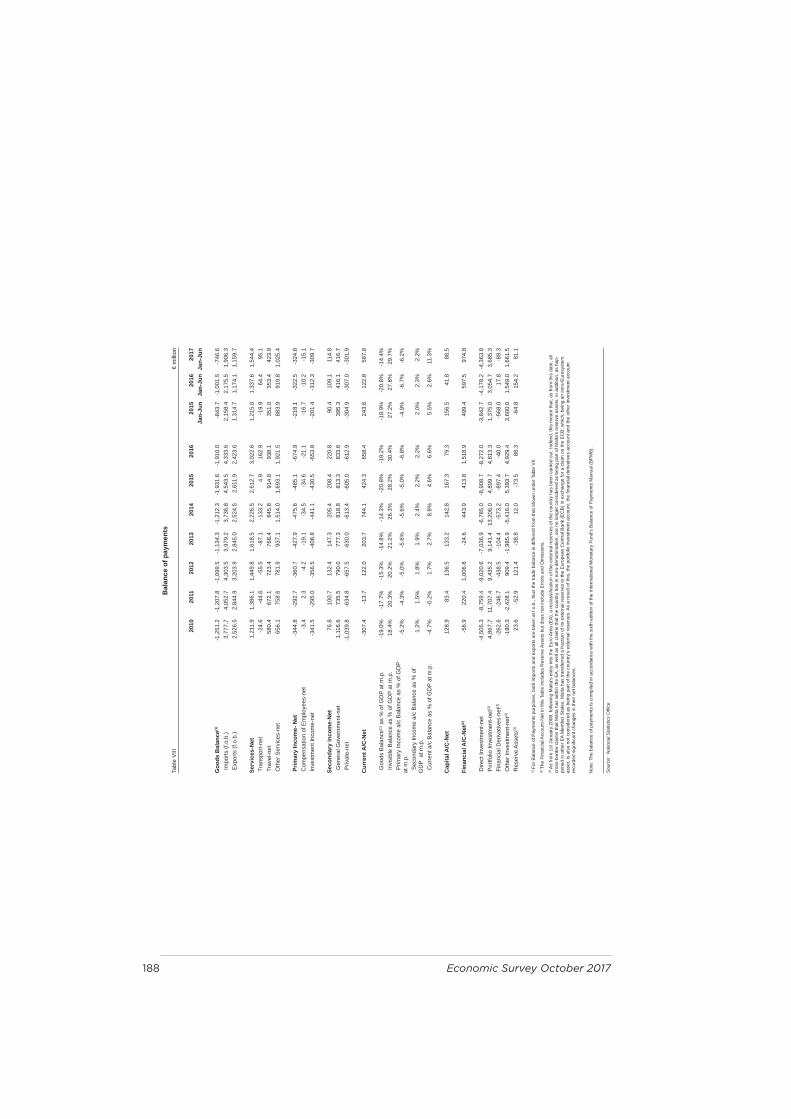
188 Economic Survey October 2017
Bal
ance
of p
aym
ents
Tabl
e V
III€
mill
ion
2010
2011
2012
2013
2014
2015
2016
2015
2016
2017
Jan-
Jun
Jan-
Jun
Jan-
Jun
Goo
ds B
alan
ce(1
)-1
,251
.2-1
,207
.8-1
,099
.5-1
,134
.3-1
,212
.3-1
,931
.6-1
,910
.0-8
43.7
-1,0
01.5
-746
.6 I
mpo
rts (f
.o.b
.)3,
777.
74,
052.
74,
303.
53,
979.
23,
736.
84,
543.
54,
333.
62,
158.
42,
175.
51,
906.
3 E
xpor
ts (f
.o.b
.)2,
526.
52,
844.
93,
203.
92,
845.
02,
524.
52,
611.
92,
423.
61,
314.
71,
174.
11,
159.
7
Serv
ices
-Net
1,21
1.9
1,38
6.1
1,44
9.8
1,61
8.5
2,22
6.5
2,61
2.7
3,02
2.6
1,21
5.0
1,33
7.6
1,54
4.4
Tra
nspo
rt-ne
t-2
4.6
-44.
6-5
5.5
-87.
1-1
33.2
4.9
162.
9-1
9.9
64.4
95.1
Tra
vel-n
et
580.
467
2.1
723.
476
8.4
845.
891
4.8
938.
135
1.0
353.
442
3.9
Oth
er S
ervi
ces-
net
656.
175
8.6
781.
993
7.1
1,51
4.0
1,69
3.1
1,92
1.5
883.
991
9.8
1,02
5.4
Prim
ary
Inco
me-
Net
-344
.8-2
92.7
-360
.7-4
27.9
-475
.6-4
65.1
-674
.9-2
18.1
-322
.5-3
24.8
Com
pens
atio
n of
Em
ploy
ees-
net
-3.4
2.3
-4.2
-19.
1-3
4.5
-34.
6-2
1.1
-16.
7-1
0.2
-15.
1 In
vest
men
t Inc
ome-
net
-341
.5-2
95.0
-356
.5-4
08.8
-441
.1-4
30.5
-653
.8-2
01.4
-312
.3-3
09.7
Seco
ndar
y In
com
e-N
et
76.8
100.
713
2.4
147.
320
5.4
208.
422
0.8
90.4
109.
111
4.8
Gen
eral
Gov
ernm
ent-n
et1,
116.
673
5.5
790.
077
7.3
818.
881
3.3
833.
639
5.3
416.
141
6.7
Priv
ate-
net
-1,0
39.8
-634
.8-6
57.5
-630
.0-6
13.4
-605
.0-6
12.9
-304
.9-3
07.0
-301
.9
Cur
rent
A/C
-Net
-3
07.4
-13.
712
2.0
203.
774
4.1
424.
365
8.4
243.
612
2.8
587.
8
Goo
ds B
alan
ce(1
) as
% o
f GD
P at
m.p
. -1
9.0%
-17.
7%-1
5.3%
-14.
8%-1
4.3%
-20.
8%-1
9.2%
-18.
9%-2
0.8%
-14.
4% I
nvis
ible
Bal
ance
as
% o
f GD
P at
m.p
. 18
.4%
20.3
%20
.2%
21.2
%26
.3%
28.2
%30
.4%
27.2
%27
.8%
29.7
% P
rimar
y In
com
e a/
c B
alan
ce a
s %
of G
DP
at
m.p
. -5
.2%
-4.3
%-5
.0%
-5.6
%-5
.6%
-5.0
%-6
.8%
-4.9
%-6
.7%
-6.2
%
Sec
onda
ry In
com
e a/
c B
alan
ce a
s %
of
GD
P a
t m.p
. 1.
2%1.
5%1.
8%1.
9%2.
4%2.
2%2.
2%2.
0%2.
3%2.
2%
Cur
rent
a/c
Bal
ance
as
% o
f GD
P at
m.p
. -4
.7%
-0.2
%1.
7%2.
7%8.
8%4.
6%6.
6%5.
5%2.
6%11
.3%
Cap
ital A
/C-N
et
128.
983
.413
6.5
133.
214
2.8
167.
379
.315
6.5
41.8
88.5
Fina
ncia
l A/C
-Net
(2)
-56.
922
0.4
1,00
6.8
-24.
644
3.9
413.
81,
518.
949
9.4
597.
597
4.8
Dire
ct In
vest
men
t-net
-4
,505
.3-8
,759
.4-9
,020
.6-7
,036
.9-6
,785
.0-8
,908
.7-8
,272
.0-3
,842
.7-4
,178
.2-4
,363
.8 P
ortfo
lio In
vest
men
t-net
(3)
4,86
7.7
11,7
07.4
9,43
5.2
9,14
1.4
13,2
06.0
4,89
9.7
4,81
3.3
1,37
5.0
3,05
4.7
3,68
5.3
Fin
anci
al D
eriv
ativ
es-n
et(3
) -2
62.6
-246
.7-4
38.5
-104
.4-5
73.2
-897
.4-4
0.0
-568
.017
.8-8
9.3
Oth
er In
vest
men
t-net
(3)
-180
.3-2
,428
.190
9.4
-1,9
85.9
-5,4
16.0
5,39
3.7
4,92
9.4
3,60
0.0
1,54
9.0
1,66
1.5
Res
erve
Ass
ets(3
)23
.6-5
2.9
121.
4-3
8.8
12.0
-73.
588
.3-6
4.8
154.
281
.1
(1) F
or B
alan
ce o
f Pay
men
ts p
urpo
ses,
bot
h im
ports
and
exp
orts
are
take
n at
f.o.
b., t
hus
the
trade
bal
ance
is d
iffer
ent f
rom
that
sho
wn
unde
r Tab
le V
II.(2
) The
Fin
anci
al A
ccou
nt-N
et in
this
Tab
le in
clud
es R
eser
ve A
sset
s bu
t doe
s no
t inc
lude
Err
ors
and
Om
issi
ons.
(3) A
s fro
m 1
st J
anua
ry 2
008,
follo
win
g M
alta
's e
ntry
into
the
Eur
o A
rea
(EA
), a
recl
assi
fi cat
ion
of th
e ex
tern
al re
serv
es o
f the
cou
ntry
has
bee
n ca
rrie
d ou
t. In
deed
, thi
s m
eant
that
, as
from
this
dat
e, a
ll cr
oss-
bord
er c
laim
s th
at M
alta
has
with
in th
e E
A, a
s w
ell a
s al
l cla
ims
that
the
coun
try h
as in
eur
o-de
nom
inat
ion,
are
no
long
er c
onsi
dere
d as
bei
ng p
art o
f Mal
ta's
rese
rve
asse
ts. I
n ad
ditio
n, a
s ha
p-pe
ned
in o
ther
EA
Mem
ber S
tate
s, M
alta
has
tran
sfer
red
a fra
ctio
n of
its
exte
rnal
rese
rves
to th
e E
urop
ean
Cen
tral B
ank
(EC
B) i
n ex
chan
ge fo
r a c
laim
on
the
EC
B; w
hich
, bei
ng a
n in
tra-E
uros
yste
m
asse
t, is
als
o no
t con
side
red
as b
eing
par
t of t
he c
ount
ry's
ext
erna
l res
erve
s. A
s a
resu
lt of
this
, the
por
tfolio
inve
stm
ent a
ccou
nt, t
he fi
nanc
ial d
eriv
ativ
es a
ccou
nt a
nd th
e ot
her i
nves
tmen
t acc
ount
re
cord
ed s
igni
fi can
t cha
nges
in th
eir n
et b
alan
ces.
Not
e: T
he b
alan
ce o
f pay
men
ts is
com
pile
d in
acc
orda
nce
with
the
sixt
h ed
ition
of t
he In
tern
atio
nal M
onet
ary
Fund
’s B
alan
ce o
f Pay
men
ts M
anua
l (B
PM
6).
Sou
rce:
Nat
iona
l Sta
tistic
s O
ffi ce

Economic Survey October 2017 189
Gov
ernm
ent R
even
ue a
nd E
xpen
ditu
reTa
ble
IX€
mill
ion
2008
2009
2010
2011
2012
2013
2014
2015
2016
2014
2015
2016
2017
Jan-
Aug
Jan-
Aug
Jan-
Aug
Jan-
Aug
Gov
ernm
ent R
ecur
rent
Rev
enue
2,30
2.1
2,37
0.8
2,52
5.4
2,64
3.8
2,71
62,
992.
13,
387.
23,
634.
83,
807.
01,
986.
82,
222.
42,
322.
62,
583.
8 I
ncre
ase/
(Dec
reas
e) %
per
ann
um3.
53.
06.
54.
72.
710
.213
.27.
34.
78.
111
.94.
511
.2 o
f whi
ch:
T
ax R
even
ue2,
098.
32,
130.
12,
242.
52,
323.
42,
393.
02,
602.
52,
953.
73,
195.
63,
446.
01,
733.
21,
918.
52,
119.
02,
299.
7
D
irect
Tax
Rev
enue
1,24
6.0
1,26
5.5
1,35
3.3
1,36
1.7
1,47
5.6
1,61
2.9
1,76
7.3
1,92
4.2
2,13
2.7
1,05
2.5
1,13
7.4
1,26
3.3
1,36
4.0
Indi
rect
Tax
Rev
enue
852.
386
4.6
889.
296
1.7
917.
398
9.6
1,18
6.4
1,27
1.4
1,31
3.3
680.
778
1.1
855.
793
5.7
N
on-T
ax R
even
ue20
3.8
240.
628
2.8
320.
532
2.8
389.
643
3.5
439.
236
1.0
253.
630
4.0
203.
728
4.1
Tota
l Gov
ernm
ent E
xpen
ditu
re2,
535.
32,
667.
82,
804.
62,
862.
43,
078.
03,
255.
33,
523.
53,
870.
63,
798.
12,
196.
72,
363.
42,
401.
82,
552.
7 I
ncre
ase/
(Dec
reas
e) %
per
ann
um8.
65.
25.
12.
17.
55.
88.
29.
9-1
.98.
07.
61.
66.
3 o
f whi
ch:
Rec
urre
nt E
xpen
ditu
re2,
124.
12,
204.
42,
296.
32,
361.
32,
488.
42,
632.
62,
857.
03,
056.
83,
264.
31,
790.
81,
939.
32,
063.
72,
221.
6 C
apita
l Exp
endi
ture
222.
127
1.3
311.
528
8.7
363.
839
4.7
435.
358
1.5
310.
325
4.1
271.
418
8.3
186.
7
% o
f Tot
al G
over
nmen
t Exp
endi
ture
8.8
10.2
11.1
10.1
11.8
12.1
12.4
15.0
8.2
11.6
11.5
7.8
7.3
Int
eres
t on
Pub
lic D
ebt
189.
019
2.0
196.
821
2.5
225.
822
7.9
231.
123
2.3
223.
515
1.8
152.
714
9.8
144.
4
Bal
ance
of r
ecur
rent
reve
nue
and
tota
l exp
endi
ture
-233
.1-2
97.0
-279
.2-2
18.6
-362
.3-2
63.2
-136
.3-2
35.8
8.9
-209
.9-1
41.0
-79.
131
.1
Fina
nced
by:
E
xtra
ordi
nary
Rec
eipt
s33
.32.
80.
09.
628
.428
.40.
00.
81.
10.
00.
71.
10.
9
Rec
eipt
s fro
m s
ale
of s
hare
s0.
00.
00.
00.
00.
00.
00.
00.
81.
10.
00.
71.
10.
9
Sin
king
Fun
ds o
f Con
verte
d Lo
ans
33.3
2.8
0.0
9.6
28.4
28.4
0.0
0.0
0.0
0.0
0.0
0.0
0.0
Sin
king
Fun
d C
ontri
butio
n &
Dire
ct L
oan
Rep
aym
ent
-111
.4-2
69.4
-207
.4-1
41.9
-361
.3-3
80.8
-427
.2-3
84.1
-545
.1-2
93.2
-79.
7-3
05.2
-90.
2 E
quity
Acq
uisi
tion
-6.5
-0.5
-0.2
-6.0
-33.
4-2
6.5
-13.
8-4
1.1
-13.
0-1
3.8
-1.1
-12.
5-2
.1 L
oan
Faci
lity
Agr
eem
ent w
ith th
e H
elle
nic
Rep
ublic
0.0
0.0
-19.
8-3
0.8
0.0
0.0
0.0
0.0
0.0
0.0
0.0
0.0
0.0
Loa
n Fa
cilit
y A
gree
men
t with
Air
Mal
ta p
lc0.
00.
00.
0-5
2.0
-52.
00.
00.
00.
00.
00.
00.
00.
00.
0R
epay
men
t of L
oans
mad
e by
Gov
ernm
ent
0.0
0.0
0.0
0.0
52.0
0.0
0.0
40.4
12.2
0.0
0.0
12.0
0.0
Pub
lic S
ecto
r Bor
row
ing
Req
uire
men
t-3
17.7
-564
.2-5
06.6
-439
.8-7
28.6
-642
.1-5
77.3
-619
.8-5
35.9
-516
.9-2
21.1
-383
.7-6
0.3
Loan
s28
5.7
455.
857
7.7
567.
864
5.7
627.
164
8.8
473.
259
7.9
573.
825
8.3
438.
725
7.8
Sou
rce:
Nat
iona
l Sta
tistic
s O
ffi ce
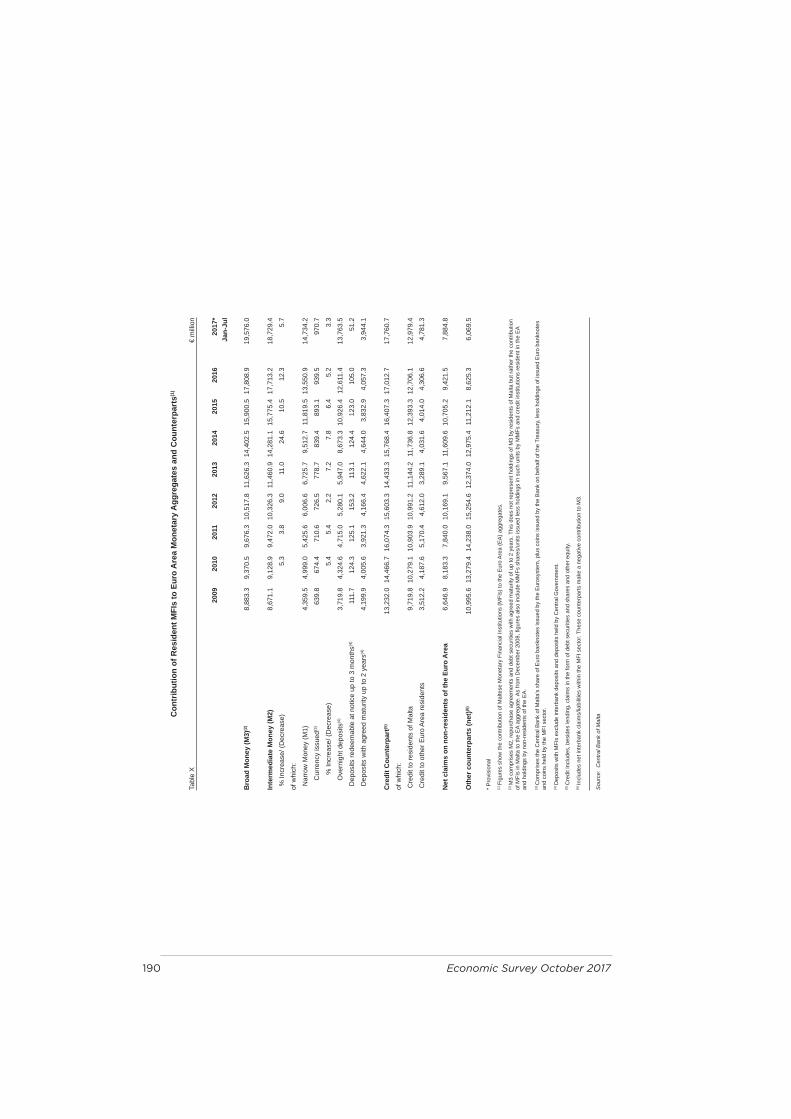
190 Economic Survey October 2017
Con
trib
utio
n of
Res
iden
t MFI
s to
Eur
o A
rea
Mon
etar
y A
ggre
gate
s an
d C
ount
erpa
rts(1
)
Tabl
e X
€ m
illio
n
2009
20
1020
1120
1220
1320
1420
1520
1620
17*
Jan-
Jul
Bro
ad M
oney
(M3)
(2)
8,88
3.3
9,37
0.5
9,67
6.3
10,5
17.8
11
,626
.3
14,4
02.5
15
,900
.5
17,8
08.9
19
,576
.0
Inte
rmed
iate
Mon
ey (M
2)8,
671.
19,
128.
9 9,
472.
0 10
,326
.3
11,4
60.9
14
,281
.1
15,7
75.4
17
,713
.2
18,7
29.4
% In
crea
se/ (
Dec
reas
e)
5.3
3.8
9.0
11.0
24
.6
10.5
12
.3
5.7
of w
hich
:
Nar
row
Mon
ey (M
1)4,
359.
54,
999.
0 5,
425.
6 6,
006.
6 6,
725.
7 9,
512.
7 11
,819
.5
13,5
50.9
14
,734
.2
C
urre
ncy
issu
ed(3
)63
9.8
674.
4 71
0.6
726.
5 77
8.7
839.
4 89
3.1
939.
5 97
0.7
% In
crea
se/ (
Dec
reas
e)
5.4
5.4
2.2
7.2
7.8
6.4
5.2
3.3
O
vern
ight
dep
osits
(4)
3,71
9.8
4,32
4.6
4,71
5.0
5,28
0.1
5,94
7.0
8,67
3.3
10,9
26.4
12
,611
.4
13,7
63.5
Dep
osits
rede
emab
le a
t not
ice
up to
3 m
onth
s(4)
111.
712
4.3
125.
1 15
3.2
113.
1 12
4.4
123.
0 10
5.0
51.2
Dep
osits
with
agr
eed
mat
urity
up
to 2
yea
rs(4
)4,
199.
94,
005.
6 3,
921.
3 4,
166.
4 4,
622.
1 4,
644.
0 3,
832.
9 4,
057.
3 3,
944.
1
Cre
dit C
ount
erpa
rt(5
)13
,232
.014
,466
.7
16,0
74.3
15
,603
.3
14,4
33.3
15
,768
.4
16,4
07.3
17
,012
.7
17,7
60.7
of w
hich
:
Cre
dit t
o re
side
nts
of M
alta
9,71
9.8
10,2
79.1
10
,903
.9
10,9
91.2
11
,144
.2
11,7
36.8
12
,393
.3
12,7
06.1
12
,979
.4
Cre
dit t
o ot
her E
uro
Are
a re
side
nts
3,51
2.2
4,18
7.6
5,17
0.4
4,61
2.0
3,28
9.1
4,03
1.6
4,01
4.0
4,30
6.6
4,78
1.3
Net
cla
ims
on n
on-r
esid
ents
of t
he E
uro
Are
a6,
646.
98,
183.
3 7,
840.
0 10
,169
.1
9,56
7.1
11,6
09.6
10
,705
.2
9,42
1.5
7,88
4.8
Oth
er c
ount
erpa
rts
(net
)(6)
10,9
95.6
13,2
79.4
14
,238
.0
15,2
54.6
12
,374
.0
12,9
75.4
11
,212
.1
8,62
5.3
6,06
9.5
* P
rovi
sion
al
(1) F
igur
es s
how
the
cont
ribut
ion
of M
alte
se M
onet
ary
Fina
ncia
l Ins
titut
ions
(MFI
s) to
the
Eur
o A
rea
(EA
) agg
rega
tes.
(2) M
3 co
mpr
ises
M2,
repu
rcha
se a
gree
men
ts a
nd d
ebt s
ecur
ities
with
agr
eed
mat
urity
of u
p to
2 y
ears
. Thi
s do
es n
ot re
pres
ent h
oldi
ngs
of M
3 by
resi
dent
s of
Mal
ta b
ut ra
ther
the
cont
ribut
ion
of M
FIs
in M
alta
to th
e E
A ag
greg
ate.
As
from
Dec
embe
r 200
8, fi
gure
s al
so in
clud
e M
MFs
sha
res/
units
issu
ed le
ss h
oldi
ngs
in s
uch
units
by
MM
Fs a
nd c
redi
t ins
titut
ions
resi
dent
in th
e E
A an
d ho
ldin
gs b
y no
n-re
side
nts
of th
e E
A.
(3) C
ompr
ises
the
Cen
tral B
ank
of M
alta
's s
hare
of E
uro
bank
note
s is
sued
by
the
Eur
osys
tem
, plu
s co
ins
issu
ed b
y th
e B
ank
on b
ehal
f of t
he T
reas
ury,
less
hol
ding
s of
issu
ed E
uro
bank
note
s an
d co
ins
held
by
the
MFI
sec
tor.
(4) D
epos
its w
ith M
FIs
excl
ude
inte
rban
k de
posi
ts a
nd d
epos
its h
eld
by C
entra
l Gov
ernm
ent.
(5) C
redi
t inc
lude
s, b
esid
es le
ndin
g, c
laim
s in
the
form
of d
ebt s
ecur
ities
and
sha
res
and
othe
r equ
ity.
(6) In
clud
es n
et in
terb
ank
clai
ms/
liabi
litie
s w
ithin
the
MFI
sec
tor.
Thes
e co
unte
rpar
ts m
ake
a ne
gativ
e co
ntrib
utio
n to
M3.
Sou
rce:
Cen
tral B
ank
of M
alta