Economic Research Service Situation and Outlook FDS...
21
A 1.9-bushel-per-acre increase in U.S. projected corn yield for 2017/18 raised production nearly 100 million bushels to 14.280 billion. Feed and residual use is raised 25 million bushels and food, seed, and industrial use is raised 10 million. Resulting ending stocks are projected up slightly at 2,340 million bushels. U.S. sorghum production was lowered as higher yields were offset by a reduction in acreage. World 2017/18 coarse grain production is projected higher this month. Foreign corn production is up but is almost offset by reduced output of oats, rye, millet, and mixed grain. Trade year basis foreign coarse grain trade is reduced, led by lower Argentine, Russian, and Ukrainian exports. Coarse grain use is boosted for China but reduced for Vietnam. Feed Outlook Tom Capehart [email protected] Olga Liefert [email protected] U.S. Corn Production Increased Economic Research Service Situation and Outlook FDS-17j October 16, 2017 The next release is November 14, 2017. -------------- Approved by the World Agricultural Outlook Board.
Transcript of Economic Research Service Situation and Outlook FDS...

A 1.9-bushel-per-acre increase in U.S. projected corn yield for 2017/18 raised production nearly 100 million bushels to 14.280 billion. Feed and residual use is raised 25 million bushels and food, seed, and industrial use is raised 10 million. Resulting ending stocks are projected up slightly at 2,340 million bushels. U.S. sorghum production was lowered as higher yields were offset by a reduction in acreage. World 2017/18 coarse grain production is projected higher this month. Foreign corn production is up but is almost offset by reduced output of oats, rye, millet, and mixed grain. Trade year basis foreign coarse grain trade is reduced, led by lower Argentine, Russian, and Ukrainian exports. Coarse grain use is boosted for China but reduced for Vietnam.
Feed Outlook Tom Capehart [email protected] Olga Liefert [email protected] U.S. Corn Production Increased
Economic Research Service Situation and Outlook FDS-17j October 16, 2017
The next release is November 14, 2017. -------------- Approved by the World Agricultural Outlook Board.

Corn Crop Raised From Last Month USDA’s National Agricultural Statistics Service (NASS) October Crop Production report raised projected yield 1.9 bushels per acre. The combined effect of a 0.4-million decline in estimated harvested acreage will result, if realized, in a U.S. crop of 14,280 million bushels, 95.6 million higher than last month and the second-highest ever. With a 55-million-bushel decrease in carryin and no change in imports, supply is projected at 16,625 million bushels, 40.5 million higher than last month.
2017/18 Corn Disappearance Raised 35 Million Bushels Feed and residual use for 2017/18 is projected 25 million bushels higher at 5,500 million as a result of larger supplies. Food, seed, and industrial (FSI) use is raised 10 million bushels this month on higher pace of corn used for glucose and dextrose, now projected at 380 million bushels. Strong demand during 2016/17 is expected to continue into 2017/18. Total FSI use is projected at 6,935 million bushels, 44.6 million higher than 2016/17. Carryout is projected at 2,340 million bushels, up 5.5 million from last month, resulting in a stocks-to-use ratio of 16.4, unchanged from last month.
020406080100120140160180200
0102030405060708090
100
88/89 91/92 94/95 97/98 2000/01 03/04 06/07 09/10 12/13 15/16
Bushels/acreMil. acres
Figure 1U.S. corn harvested area and yield
Sources: USDA, National Agricultural Statistics Service, QuickStats and USDA, World Agricultural Outlook Board, WASDE.
Harvested area (left axis)
Yield (right axis)
Domestic Outlook
2 Feed Outlook FDS-17j / October 16, 2017
USDA Economic Research Service

Projected Corn Price Steady The projected range for the average corn price received by producers is unchanged from last month with a range of $2.80 to $3.60 per bushel. The midpoint price is projected at $3.20 per bushel, the lowest since the 2006 crop.
Changes in the 2016/17 Balance Sheet Food, seed, and industrial use for 2016/17 is projected 20 million bushels higher this month at 6,890 million. Data from the NASS Grain Crushings and Co-Products Production report for August provide
0
2
4
6
8
10
12
14
16
18
87/88 1990/91 93/94 96/97 99/00 2002/03 05/06 08/09 11/12 14/15 17/18
Feed and residualExportsOther food, seed, and industrial usesEthanolEnding stocks
Figure 2
Note: Marketing year 2017/18 is projected.Source: USDA, World Agricultural Outlook Board, WASDE.
U.S. corn utilizationBillion bushels
0.0
1.0
2.0
3.0
4.0
5.0
6.0
7.0
06/07 08/09 2010/11 12/13 14/15 16/17
Billion bushels
Figure 3U.S. corn feed and residual use
Year Total 1st Qtr2nd Qtr 3rd Qtr4th Qtr
Sources: USDA, Economic Research Service, Feed Grains Database and USDA, World Agricultural Outlook Board, WASDE.

final marketing year corn for ethanol use of 5,438 million bushels, 3 million above last month’s projection. Estimated corn used during the spring of 2016/17 for seeding the 2017/18 crop is revised using objective yield and acreage data from NASS’s October Crop Production report.
Fourth quarter feed and residual was 688.1 million bushels, or about 12.6 percent of total feed and residual. This is larger than the recent 5-year average of 8.4 percent for fourth quarter feed and residual share. Fourth quarter feed and residual use may have been higher due to the delayed maturity of the 2017 crop and relatively large stocks on hand as of June 1. Feed and residual for 2016/17 is estimated at 5,464 million bushels, 38.8 million above last month’s estimate.
1.01.52.02.53.03.54.04.55.05.56.06.57.07.5
Sep. Oct. Nov. Dec. Jan. Feb. Mar. Apr. May Jun. July Aug.
2012/13
2013/14
2014/15
2015/16
2016/17
2017/18
Source: USDC, U.S. Census Bureau, September 2017 Grain Inspections.
Mil. metric tons
Figure 4
Monthly U.S. corn exports
123456789
Jan. 2000
Jan. 01
Jan. 02
Jan. 02
Jan. 03
Jan. 04
Jan. 05
Jan. 06
Jan. 07
Jan. 08
Jan. 09
Jan. 11
Jan. 12
Jan. 13
Jan. 14
Jan. 15
Jan. 16
Jan. 17
Dol. / bu
Sources: USDA, Economic Research Service, Feed Grains Database and USDA, Agricultural Marketing Service, http://marketnews.usda.gov/portal/lg.
Louisiana Gulf
Central Illinois
Figure 5
Monthly corn (yellow #2) prices for Central Illinois and Louisiana Gulf
4 Feed Outlook FDS-17j / October 16, 2017
USDA Economic Research Service

Projected U.S. corn exports for 2016/17 are lowered 2.1 million bushels to 2,293 million this month based on final marketing year data from the U.S. Census Bureau. Total domestic use is 12,354 million bushels, 59.3 million higher than last month’s forecast. Ending stocks for 2016/17, reported in the NASS Grain Stocks report released September 29, are 2,295 million bushels. Total use is estimated record high at 14,647 million bushels. Feed and Residual Use for Four Feed Grains and Wheat On a September-August basis, 2017/18 feed and residual use for the four feed grains plus wheat is projected at 150.0 million metric tons, 1 million higher than last month’s projection. Corn feeding is increased. For 2016/17, feed and residual use is lowered 0.1 million tons to 146.3 million on higher corn offset by lower wheat, sorghum, and oats feeding compared with last month. Other categories showed small declines. Feed and residual use per grain consuming animal unit (GCAU) is projected up 0.02 million units for 2017/18, at 1.54 million tons. For 2016/17, feed and residual use per GCAU was unchanged from last month at 1.53 million tons. Grain Consuming Animal Units Edge up for 2017/18 The projected index of grain consuming animal units for 2017/18 is raised 1.9 million units this month to 97.7 million. Larger inventories for beef cattle and hogs were behind the increase. For 2016/17, GCAUs are lowered slightly, ending the year at 95.8 million units. Sorghum Yield Raised for New Crop The 2017/18 sorghum yield is projected 2.4 bushels per acre higher at 72.2 bushels, compared with a 5-year average of 66.1 bushels. With a harvested area reduction of 0.3 million acres, production is forecast down 6.2 million bushels to 364.5 million. The combined effect of a carryin increase of 4.8 million bushels results in projected supplies of 398.0 million bushels, the lowest since 2012. With no change in projected disappearance, the lower supply is carried through the balance sheet, lowering ending stocks to 28.0 million bushels. For 2016/17, U.S. sorghum imports are projected down less than 1 million bushels to1.7 million, based on Census Bureau trade data through August. Supplies are estimated at 518.6 million bushels.
5 Feed Outlook FDS-17j / October 16, 2017
USDA Economic Research Service

Sorghum Use Unchanged for 2017/18 Projected sorghum use is unchanged for 2017/18 at 370.0 million bushels. The decline in supply is carried through to ending stocks, resulting in a projected 28-million-bushel carryout, 5.5 million below 2016/17. For 2016/17, disappearance is lowered 4.9 million bushels to 485.1 million on a 0.6-million-bushel increase in sorghum used for ethanol based on NASS Grain Crushings and Co-Products Production report data. Total FSI is projected at 115.4 million bushels. Exports are forecast 4.4 million bushels lower to 240.6 million on August Census Bureau data. The September 29 Grain Stocks estimated sorghum stocks in all positions on September 1 at 33.5 million bushels. Sorghum Price Lowered for Old Crop The projected average price received for sorghum by farmers in 2016/17 was lowered 6 cents per bushel to $2.79 based on year-end marketing data. The projected price for the new crop has a range of $2.50 to $3.30 for a midpoint of $2.90 per bushel, unchanged from last month’s projection. Barley Projected new crop barley production is raised 1.7 million bushels to 141.9 million based on area and yield changes reported in NASS’s September 29 Small Grains Summary. Planted area is projected up 105,000 acres to 2.5 million, and harvested area is raised 8,000 acres to 2.0 million. With imports of 15 million acres, the combined effect results in supplies of 263.3 million bushels. With no change in use, the increase is passed through to carryout of 70.3 million bushels. For 2016/17, the barley crop is raised 0.6 million bushels on higher estimated area reported in NASS’s Small Grains Summary report. Both planted and harvested acres were raised 7,000 acres this month, resulting in a crop of 199.9 million bushels. With imports of 9.6 million bushels, the combined effect results in supplies of 311.7 million.
0
10
20
30
40
50
60
70
80
90
0
2
4
6
8
10
12
14
1987/88 90/91 93/94 96/97 99/2000 02/03 05/06 08/09 11/12 14/15 17/18
Bu/acreMil. acres
Figure 6U.S. sorghum harvested area and yield
Sources: USDA, National Agricultural Statistics Service, QuickStats and USDA, World Agricultural Outlook Board, WASDE.
Harvested area (left axis)
Yield (right axis)
6 Feed Outlook FDS-17j / October 16, 2017
USDA Economic Research Service

With June 1 stocks known from the Grain Stocks report, feed and residual was increased 1.9 million bushels. The increase results in estimated total use of 205.3 million bushels. Estimated ending stocks are down 1.7 million bushels to 106.4 million bushels, based on the Grain Stocks report. The projected 2017/18 average price received by producers was lowered 10 cents on each end for a range of $4.10 to $5.10 per bushel and a midpoint of $4.60 per bushel. Continued weak prices for malting barley were behind the price shift. Oats The NASS 2017 Small Grains Summary reports a 79,000 decrease in oats harvested acres to 801,000 acres and a decrease of 5,200 acres in planted acres to 2.6 million acres. The combined effect of a 0.7-bushel increase in projected yield to 61.7 bushels results in production of 49.4 million bushels, 4.3 million below last month. Combined with a 2.2-million-bushel decline in carryin and 100 million in imports, supply is projected at 199.7 million bushels, about 12 million below last year. For 2017/18, total use is reduced 2 million bushels on lower FSI use. Oats food use is indicated lower. The reduction, partially offsetting reduced supply, reduces ending stocks to 29.7 million bushels. Feed and residual is raised 3.9 million bushels to 81.8 million. FSI is lowered 1.7 million to 76.3 million. With no change in exports, total use is projected at 161.5 million bushels. Ending stocks are lowered 2.2 million bushels to 50.3 million, based on June 1 stocks as reported in NASS’s Grain Stocks report. The projected average price received by producers for 2017/18 is unchanged with a range of $2.25 to $2.75 per bushel for a midpoint of $2.50 per bushel. For 2016/17, the price is estimated at $2.06 per bushel, unchanged from last month’s projection. Hay NASS’s October 12 Crop Production report forecasts all U.S. hay production in 2017 at 131.9 million tons, down 2 percent from 2016 as lower yields more than offset a slight increase in area. Based on October 1 conditions, the all-hay yield is expected to be 2.46 tons per acre, down from 2.52 tons per acre in 2016. Harvested acres are forecast at 53.5 million acres, slightly above last year. Production of alfalfa hay and mixtures is forecast at 56.0 million tons, down from the previous forecast and down 4 percent from 2016. Yields are forecast to average 3.27 tons per acre, lower relative to the 3.45 tons per acre producers harvested in 2016. Other hay area harvest is lower than last year at 36.4 million acres. The October 12 Crop Production report indicates that other hay production is down slightly from the August forecast to 75.9 million tons. Yields are down 0.01 tons per acre to 2.08 tons. Roughage-consuming animal units (RCAUs) in 2017/18 are estimated at 71.4 million, up 0.4 million from last year. Despite the higher RCAUs, the year-to-year decline in expected hay production results in lower hay use per RCAU, forecast at 1.85 tons.
7 Feed Outlook FDS-17j / October 16, 2017
USDA Economic Research Service

Global coarse grain production in 2017/18 is projected up 2.8 million tons this month to 1,319.4 million, while foreign coarse grain output is up slightly by 0.7 million tons to 943.3 million, though it is still down 21.0 million tons from the year before. The changes in global, foreign, and U.S coarse grain production by type of grain are presented in table A1.
Region or country Production Change from
previous monthYoY
change1 Comments
c
World 1,319.4 +2.8 -47.6
Foreign 943.3 +0.7 -21.0 Partly offsetting changes are made for a number of countries and commodities. See table A2.
United States 376.0 +2.2 -26.6 See section on U.S. domestic output.
World 1,038.8 +6.2 -36.5
Foreign 676.1 +3.7 -14.5 Changes in the SSA2 countries and Turkey are partly offset by reduced prospects in Russia and Ukraine. See table A2.
United States 362.7 +2.4 -22.0 See section on U.S. domestic output.
World 142.0 +0.1 -6.0
Foreign 138.9 +0.1 -4.8 Higher EU3 output is partly offset by a reduction in Algeria.
United States 3.0 Smaller than 0.05 -1.3 See section on U.S. domestic output.
World 60.7 +0.2 -2.4
Foreign 51.4 +0.4 +0.6 Revision for the SSA3 countries (mainly for Chad). See table A2.
United States 9.3 -0.2 -2.9 See section on U.S. domestic output.
World 22.9 -0.2 -0.8
Foreign 22.1 -0.1 -0.5 Lower oats output is projected for the EU.4 See table A2.
United States 0.7 -0.1 -0.2 See section on U.S. domestic output.
World 12.5 -0.3 -0.1
Foreign 12.2 -0.2 No change Lower rye output is projected for the EU. See table A2.
United States 0.2 -0.1 -0.1 See section on U.S. domestic output.
World/Foreign 26.6 -3.0 -2.3 Series revision for Nigeria. See text and table A2.
World/Foreign 16.0 -0.3 +0.5 Lower production projected for the EU. See table A2.1YoY: year over year changes. 2SSA: Sub-Saharan Africa. 3European Union. For changes and notes by country, see table A2.Source: USDA, Foreign Agricultural Service, Production, Supply and Distribution online database.
MILLET
MIXED GRAIN
RYE
Table A1 - World and U.S. coarse grain production at a glance (2017/18), October 2017
Million tonsCoarse grain production (total)
World production of coarse grains by type of grainCORN
BARLEY
SORGHUM
OATS
International Outlook
8 Feed Outlook FDS-17j / October 16, 2017
USDA Economic Research Service

For a glance at information and specific causes for the revisions of this month’s changes in coarse grain production by country and type of grain, see table A2. See map A for changes in corn production.
Type of crop Crop year Production
Change in forecast1
YoY2
changeComments
Corn Oct-Sep 67.8 +4.1 -1.5
Following a biannual review for the 58 Sub-Saharan Africa countries, area and production for Nigeria are significantly revised (see the text). Sizeable revisions are also made for Mozambique, Ethiopia, Tanzania, Uganda, and many other SSA countries.
Sorghum Oct-Sep 26.0 +0.3 -1.8A result of a biannual review and updates for past years for SSA countries. Sorghum output in Chad is projected higher. Production is also revised for many other SSA countries.
Millet Oct-Sep 12.2 -3.0 -1.4 Lower area and output are projected for Nigeria (see the text)
Corn Sep-Aug 6.0 +0.5 +0.5Despite significant heat during the reproductive period, better corn yields are projected with larger irrigated corn area. The heat did not last sufficiently long to damage irrigated crop.
Corn Oct-Sep 15.3 -0.7 No change Harvest report indicates lower-than-expected yields. Corn suffered from high temperatures and dryness.
Corn Oct-Sep 27.0 -0.5 -1.0 Rain deficit and high temperatures in September affected corn yields in Ukraine. Harvest relults to date support the reduction.
Corn Oct-Sep 59.4 No change -1.7 Harvest reports indicate higher French corn output that is fully offset by lower Italian production.
Barley Jul-Jun 58.8 +0.3 -1.1 Higher-than-projected yields in the United Kingdom (UK). Small adjustments are made for a number of EU countries.
Oats Jul-Jun 8.0 -0.1 -0.1 Adjustments based on harvest reports are made for Spain, Sweden, and several other countries.
Rye Jul-Jun 7.6 -0.2 +0.1Harvest reports indicate lower-than-projected yields mainly in Spain, while fractional changes are made for a number of countries in the EU.
Mixed grain Jul-Jun 15.7 -0.3 +0.6Harvest reports indicate lower-than-projected yields mainly in Spain, while fractional changes are made for a number of other EU countries.
1Change from previous month. Smaller changes for coarse grain output are made for several countries, see map A for changes in corn .2 YoY: year over year changes.
Source: USDA, Foreign Agricultural Service, Production, Supply and Distribution online database.
Table A2 - Coarse grain foreign production by country at a glance, October 2017
Million tons
Coarse grain production by country and by type of grain (2017/18)
RUSSIA
SUB-SAHARAN AFRICA
EUROPEAN UNION (EU)
UKRAINE
TURKEY
9 Feed Outlook FDS-17j / October 16, 2017
USDA Economic Research Service

Map A – Corn production changes for 2017/18, October 2017
Source: USDA, Foreign Agricultural Service, Production, Supply, and Distribution database.
This month’s changes in coarse grains, though partly offsetting, are dominated by the revisions for the Sub-Saharan African countries. A biannual review of grain production 2017/18 forecasts and updates for past years was made for each of the 58 Sub-Saharan Africa (SSA) countries maintained by the USDA, Foreign Agricultural Service
Figure 7: Nigerian coarse grain area – corn expands at the expense of millet
Million hectares
Source: USDA, Foreign Agricultural Service, Production, Supply, and Distribution online database.
The revision also indicates a bigger drop in yields in 2015/16, a year when coarse grain production in these countries fell by 13 million tons. The drought that year happened in South and Southeast Africa, where in some grain-producing regions precipitation that year was the lowest in 35 years and grain imports soared to partly offset the shortfall. In the following 2016/17 year, the situation was reversed and SSA countries enjoyed record grain output. However, a surge in grain production in 2016/17 did not curb
0
2
4
6
8
10
12
14
16
18
2003 2004 2005 2006 2007 2008 2009 2010 2011 2012 2013 2014 2015 2016 2017
Corn Millet Sorghum
10 Feed Outlook FDS-17j / October 16, 2017
USDA Economic Research Service

record-high imports. In 2016/17, SSA grain imports became even stronger, pushing food consumption (food, seed, and industrial (FSI) use) of all grains (wheat, rice, corn, sorghum, millet, barley, and oats) to the highest ever aggregate level, projected to stay almost as high in 2017/18. This month, food consumption of all grains in SSA is projected 2.5 million tons higher. (See figure 8.)
Figure 8: Sub-Saharan Africa (SSA) food consumption stays high
Million tons
Source: USDA, Foreign Agricultural Service, Production, Supply, and Distribution online database.
Chinese Coarse Grain Use Is Projected Higher
Global coarse grain use in 2017/18 is projected up 4.4 million tons to 1352.2 million. Foreign use projections for many countries are revised this month with many offsetting changes, and foreign use is up 3.6 million tons to 1,025.1 million. Feed use prospects are revised for several countries, reducing foreign feed and residual use 0.8 million tons. However, FSI use for foreign countries in the aggregate is increased (changes to the sum of the difference of local marketing year imports and exports have an effect on calculated global consumption).
The largest change is for China’s projected 2017/18 coarse grain use, up 3.5 million tons this month to 259.1 million. Increases are projected for both its FSI use and feed and residual use. After years of support for corn farmers has left China with a substantial stockpile, the government removed price supports for corn production, and corn prices plunged. The government also began to encourage growth of the industrial use of corn by supporting processing plants. As could be expected, the output of corn byproducts, such as starch, glucose, and fructose, has been expanding for the last 2 years, while Chinese exports of corn products have been soaring. Corn FSI use in China is projected higher this month by 2.0 million tons.
10
15
20
25
30
35
40
45
60
70
80
90
100
110
120
130
140
150
2001 2002 2003 2004 2005 2006 2007 2008 2009 2010 2011 2012 2013 2014 2015 2016 2017
SSA grain production SSA food consumption SSA imports (right axis)
11 Feed Outlook FDS-17j / October 16, 2017
USDA Economic Research Service

Figure 9: China's corn product exports soar as corn prices plunge
Million tons Price index
While corn imports in China are subject to a quota, the country has not restricted imports of barley and sorghum largely destined to the feed market, using them as a substitute for domestically procured inputs in feed rations and reduced imported DDGS (distiller's dried grains with solubles). Barley import prospects are boosted 1.0 million tons, supporting an increase in barley feed use of 1.0 million, while sorghum imports are increased 0.6 million tons and used for both feeding and alcohol production.
Another important change in coarse grain consumption is a projected decline in corn feeding for Vietnam, down 1.0 million tons to 12.0 million. Feed demand has been growing fast in Vietnam, more than doubling in the last 5 years (from 5.3 million tons in 2012 to 12.0 million projected for 2017). The growth has been fueled by expansion of its swine industry, as Vietnam is believed to have exported live swine to neighboring countries, mainly China. Recently China enforced closure of its border with Vietnam, citing quality concerns, which is expected to have partly reduced undocumented imports of live pigs from the country.
For additional information on this month’s changes in corn domestic consumption, see map B.
60
70
80
90
100
110
120
0.0
0.5
1.0
1.5
2.0
2.5
3.0
3.5
4.0
4.5
5.0
06/07 07/08 08/09 09/10 10/11 11/12 12/13 13/14 14/15 15/16 16/17*
Total Price Index 2006/07=100
Note: 2016/17 total prorated data to date. Products include starch, glucose/dextrose, fructose, starch residues, citric acid, esters of citric acid, and glutamic acid. * Prorated data. Source: China Customs, unconverted product weight, Oct-Sep basis.
12 Feed Outlook FDS-17j / October 16, 2017
USDA Economic Research Service

Map B – Corn FSI consumption changes for 2017/18, August 2017
FSI = food, seed, and industrial use.
Source: USDA, Foreign Agricultural Service, Production, Supply, and Distribution online database.
World Corn Trade Reduced for 2016/17
The international corn trade year (October-September) for 2016/17 ended September 30, but the publication of trade data often lags. However, the published data and the pace of shipments indicate that global corn trade is down 2.6 million tons. The largest reduction is for Argentine corn exports, down 2.5 million tons to 23.5 million, as Argentina slowed down its corn exports to Vietnam. Argentina is the major supplier of corn to Vietnam and bears the effects of reduced feed demand there (see above). Corn exports for Brazil are projected down 0.7 million tons, based on complete data for September 2017, as the country has not accumulated sufficient corn exports to fulfil the forecast, even with record-high exports in August-September. Brazilian 2016/17 local marketing year (March-February) exports are unchanged at 36.0 million. Corn exports are also increased 0.6 million tons for Mexico. There are smaller changes for several other countries.
Corn Trade Prospects for 2017/18 Reduced
World corn trade projected for 2017/18 is reduced 1.4 million tons this month to 150.9 million. The largest changes are lower corn imports in Vietnam and a corresponding reduction of exports for Argentina, both reduced by 1.0 million tons. See the above discussion on Vietnamese feed use (in the coarse grain use section) and on Argentine exports in the section on 2016/17 trade. Output-related reductions are made for Russian and Ukrainian corn exports (both down 0.5 million tons). Mexican exports are up 0.6 million tons, reflecting expectations of increasing trade of white corn to African countries (Kenya).
U.S. corn export prospects for 2017/18 are unchanged this month at 47.0 million tons. U.S. export projections for 2017/18 for all other coarse grains are also unchanged.
13 Feed Outlook FDS-17j / October 16, 2017
USDA Economic Research Service

For changes in corn imports, see map C.
Map C – Corn import changes for 2017/18, October 2017
Source: USDA, Foreign Agricultural Service, Production, Supply, and Distribution online database.
14 Feed Outlook FDS-17j / October 16, 2017
USDA Economic Research Service

Contacts and Links
Contact Information Tom Capehart (domestic), (202)-694-5313, [email protected] Olga Liefert,(international), (202)-694-5155, [email protected]
Subscription Information Subscribe to ERS e-mail notification service at http://www.ers.usda.gov/subscribe-to-ers-e-newsletters.aspx to receive timely notification of newsletter availability. Printed copies can be purchased from the USDA Order Desk by calling 1-800-363-2068 (specify the issue number)
To order printed copies of the five field crop newsletters—cotton and wool, feed, rice, oil crops, and wheat—as a series, specify series SUB-COR-4043
Data Feed Grains Database is a queryable database that contains monthly, quarterly, and annual data on prices, supply, and use of corn and other feed grains. This includes data published in the monthly Feed Outlook.
Related Websites Mann Library Feed Outlook page Mann Library WASDE page
Grain Circular https://www.fas.usda.gov/commodities/grain-and-feed
ERS Corn Topic page
E mail Notification Readers of ERS outlook reports have two ways they can receive an e-mail notice about release of reports and associated data. • Receive timely notification (soon after the report is posted on the web) via USDA’s Economics, Statistics and Market Information System (which is housed at Cornell University’s Mann Library). Go to http://usda.mannlib.cornell.edu/ MannUsda/aboutEmailService.do and follow the instructions to receive e-mail notices about ERS, Agricultural Marketing Service, National Agricultural Statistics Service, and World Agricultural Outlook Board products • Receive weekly notification (on Friday afternoon) via the ERS website. Go to here and follow the instructions to receive notices about ERS outlook reports, Amber Waves magazine, and other reports and data products on specific topics
The U.S. Department of Agriculture (USDA) prohibits discrimination in all its programs and activities on the basis of race, color, national origin, age, disability, and, where applicable, sex, marital status, familial status, parental status, religion, sexual orientation, genetic information, political beliefs, reprisal, or because all or a part of an individual’s income is derived from any public assistance program. (Not all prohibited bases apply to all programs.) Persons with disabilities who require alternative means for communication of program information (Braille, large print, audiotape, etc.) should contact USDA’s TARGET Center at (202) 720-2600 (voice and TDD). To file a complaint of discrimination write to USDA, Director, Office of Civil Rights, 1400 Independence Avenue, S.W., Washington, D.C. 20250-9410 or call (800) 795- 3272 (voice) or (202) 720-6382 (TDD). USDA is an equal opportunity provider and employer.
15 Feed Outlook FDS-17j / October 16, 2017
USDA Economic Research Service

Beginning stocks Production Imports
Total supply
Food, seed, and industrial
use
Feed and residual
use Exports
Total disappear-
anceEnding stocks
Farm price 2/(dollars
per bushel)
Sep-Nov 1,232 14,216 5 15,452 1,615 2,225 401 4,241 11,211 3.57Dec-Feb 11,211 6 11,217 1,622 1,445 400 3,468 7,750 3.80Mar-May 7,750 10 7,760 1,673 1,094 540 3,307 4,453 3.75Jun-Aug 4,453 11 4,464 1,687 520 526 2,733 1,731 3.69Mkt yr 1,232 14,216 32 15,479 6,597 5,284 1,867 13,748 1,731 3.70
Sep-Nov 1,731 13,602 13 15,346 1,631 2,178 301 4,111 11,235 3.65Dec-Feb 11,235 18 11,253 1,652 1,438 341 3,431 7,822 3.64Mar-May 7,822 21 7,843 1,655 914 563 3,132 4,711 3.60Jun-Aug 4,711 16 4,727 1,710 584 696 2,990 1,737 3.55Mkt yr 1,731 13,602 68 15,401 6,648 5,114 1,901 13,664 1,737 3.61
Sep-Nov 1,737 15,148 14 16,899 1,691 2,275 548 4,514 12,386 3.26Dec-Feb 12,386 12 12,398 1,710 1,529 537 3,777 8,621 3.39Mar-May 8,621 17 8,638 1,748 972 689 3,409 5,229 3.46Jun-Aug 5,229 14 5,243 1,742 688 518 2,948 2,295 3.40Mkt yr 1,737 15,148 57 16,942 6,890 5,464 2,293 14,647 2,295 3.36
Mkt yr 2,295 14,280 50 16,625 6,935 5,500 1,850 14,285 2,340 2.80-3.60
Sep-Nov 34.03 432.58 0.21 466.82 10.60 149.98 83.64 244.23 222.59 3.63Dec-Feb 222.59 0.12 222.71 1.80 2.37 98.69 102.86 119.86 4.17Mar-May 119.86 0.00 119.86 1.43 -14.99 99.13 85.57 34.29 4.41Jun-Aug 34.29 0.04 34.33 1.18 -55.54 70.28 15.92 18.41Mkt yr 34.03 432.58 0.38 466.98 15.01 81.82 351.75 448.57 18.41 4.03
Sep-Nov 18.41 596.75 3.60 618.76 22.14 159.65 114.44 296.23 322.54 3.54Dec-Feb 322.54 0.98 323.51 41.77 -6.14 86.30 121.93 201.58 3.17Mar-May 201.58 0.01 201.59 43.31 -5.53 73.46 111.24 90.35 3.10Jun-Aug 90.35 0.01 90.36 29.73 -41.39 65.38 53.73 36.63 3.33Mkt yr 18.41 596.75 4.59 619.75 136.95 106.58 339.58 583.12 36.63 3.31
Sep-Nov 36.63 480.26 0.00 516.90 21.65 142.68 44.43 208.75 308.15 2.62Dec-Feb 308.15 0.00 308.15 33.06 3.77 90.79 127.62 180.53 2.69Mar-May 180.53 0.00 180.53 35.25 3.10 57.48 95.83 84.71 2.79Jun-Aug 84.71 1.73 86.44 25.47 -20.44 47.87 52.90 33.54 3.53Mkt yr 36.63 480.26 1.74 518.63 115.41 129.11 240.57 485.10 33.54 2.79
Mkt yr 33.54 364.46 398.00 100.00 60.00 210.00 370.00 28.00 2.50-3.30
Sorghum 2014/15
2015/16
2016/17
2017/18
Table 1--Feed grains: U.S. quarterly supply and disappearance (million bushels), 10/16/2017
Commodity, market year,and quarter 1/Corn 2014/15
2015/16
2016/17
2017/18
16 Feed Outlook FDS-17j / October 16, 2017
USDA Economic Research Service

Beginning stocks Production Imports
Total supply
Food, seed, and industrial
use
Feed and residual
use Exports
Total disappear-
anceEnding stocks
Farm price 2/
(dollars per
bushel)Jun-Aug 82 182 7 271 39 48 4 91 180 5.69Sep-Nov 180 5 184 38 -14 4 28 156 5.25Dec-Feb 156 6 163 37 5 3 44 118 5.07Mar-May 118 6 124 37 4 4 45 79 4.86Mkt yr 82 182 24 287 152 43 14 209 79 5.30
Jun-Aug 79 218 4 301 40 38 3 82 219 5.39Sep-Nov 219 4 223 38 0 4 43 180 5.52Dec-Feb 180 7 187 37 10 3 50 138 5.66Mar-May 138 4 141 38 1 1 39 102 5.43Mkt yr 79 218 19 315 153 50 11 213 102 5.52
Jun-Aug 102 200 2 304 40 33 1 74 230 4.99Sep-Nov 230 2 232 39 0 1 40 193 4.78Dec-Feb 193 2 195 37 12 1 50 145 5.04Mar-May 145 3 148 37 2 2 41 106 4.96Mkt yr 102 200 10 312 153 48 4 205 106 4.96
Jun-Aug 106 142 2 251 40 30 2 71 180 4.52Mkt yr 106 142 15 263 153 35 5 193 70 4.10-5.10
Jun-Aug 25 70 27 122 18 30 1 48 74 3.34Sep-Nov 74 25 99 18 14 0 32 67 3.16Dec-Feb 67 32 99 17 22 0 40 59 3.08Mar-May 59 25 84 24 6 1 31 54 2.89Mkt yr 25 70 109 204 77 71 2 150 54 3.21
Jun-Aug 54 90 18 161 18 49 0 68 94 2.15Sep-Nov 94 26 120 18 19 1 37 83 2.08Dec-Feb 83 25 108 17 15 0 33 75 2.09Mar-May 75 16 91 23 10 1 34 57 2.11Mkt yr 54 90 86 229 77 94 2 172 57 2.12
Jun-Aug 57 65 21 142 19 44 1 64 79 1.87Sep-Nov 79 28 106 18 12 1 31 75 2.03Dec-Feb 75 24 100 17 18 1 37 63 2.35Mar-May 63 18 81 22 8 1 31 50 2.42Mkt yr 57 65 90 212 76 82 3 162 50 2.06
Jun-Aug 50 49 19 119 18 28 1 47 72 2.35Mkt yr 50 49 100 200 78 90 2 170 30 2.25-2.75
Latest market year is projected; previous market year is estimated. Totals may not add due to rounding.1/ Corn and sorghum, September 1-August 31 marketing year; Barley and oats, June 1-May 31 marketing year.
2/ Average price received by farmers based on monthly price weighted by monthly marketings. For the latest market year, quarterly prices are calculated by using the current monthly prices weighted by the monthly marketings for those months for the previous 5 years divided by the sum of marketings for those months.Source: USDA, World Agricultural Outlook Board, World Agricultural Supply and Demand Estimates and supporting materials.
Data run: 10/16/2017
Oats 2014/15
2015/16
2016/17
2017/18
Table 1--Feed grains: U.S. quarterly supply and disappearance, cont. (million bushels), 10/16/2017
Commodity, market year,and quarter 1/Barley 2014/15
2015/16
2016/17
2017/18
17 Feed Outlook FDS-17j / October 16, 2017
USDA Economic Research Service

Grain consuming animal units
(millions)
94.2
95.8
97.7
2015/16 2016/17Sep 3.55 3.78Oct 3.67 3.88Nov 3.62 3.83Dec 3.62 3.88Jan 3.55 4.07Feb 3.56 4.14Mar 3.54 4.04Apr 3.61 3.98May 3.74 4.03Jun 3.91 4.01Jul 3.28 4.00Aug 3.09 3.77Mkt year 3.56 3.95
2015/16 2016/17Jun 2.59Jul 2.70Aug 2.41Sep 2.39Oct 2.57Nov 2.60Dec 2.60Jan 2.58Feb 2.50Mar 2.46 4.70Apr 2.45May 2.44Mkt year 2.52 4.70
1/ Corn and sorghum, September 1-August 31 marketing year; Barley and oats, June 1-May 31 marketing year. Simple averageof monthly prices for the marketing year.Source: USDA, Agricultural Marketing Service, http://marketnews.usda.gov/portal/lg.
Data run: 10/13/2017
2.07 4.95 2.63 2.742.05 2.49 2.882.05 2.49 2.862.02 2.43 2.902.00 2.60 3.072.00 2.60 2.972.00 2.64 2.922.00 2.67 2.84
2.872.00 4.95 2.58 2.671.95 2.10 4.95 4.70 2.70 2.29
3.172.08 2.10 4.70 2.63 2.34 2.982.33 2.05 4.67 2.82 2.61
2017/182.36 2.05 4.70 2.89 2.58 2.95
Barley, No. 2 feed, Minneapolis, MN
(dollars per bushel)
Barley, No. 3 malting, Minneapolis, MN
(dollars per bushel)
Oats, No. 2 white heavy, Minneapolis, MN
(dollars per bushel)2016/17 2017/18 2015/16 2017/18 2015/16 2016/17
3.37 4.18 8.07 7.563.27 3.823.51 4.113.49 4.62 7.563.47 4.303.41 4.173.40 4.053.51 4.063.45 4.093.34 4.173.28 4.22 7.893.27 4.36 8.23
2017/18 2015/16 2017/18 2015/16 2016/173.09 3.15 4.22 3.74 8.08
1/ Corn and sorghum, September 1-August 31 marketing year; Barley and oats, June 1-May 31 marketing year.Source: USDA, World Agricultural Outlook Board, World Agricultural Supply and Demand Estimates and supporting materials.
Table 3--Cash feed grain prices, 10/16/2017
Mkt year and month 1/
Corn, No. 2 yellow, Central IL
(dollars per bushel)
Corn, No. 2 yellow, Gulf ports, LA
(dollars per bushel)
Sorghum, No. 2 yellow,
Gulf ports, LA (dollars per cwt)
2016/17
144.1 5.9 150.0 1.52017/18 MY Sep-Aug 139.7 1.5 1.1 1.8
1.523.1
MY Sep-Aug 138.8 3.3 1.0 1.2 144.2 2.0 146.3
-1.6 23.4Q4 Jun-Aug 17.5 -0.5 0.6 0.5 18.1 5.0
39.5 -0.6 38.9Q3 Mar-May 24.7 0.1 0.1 0.2 25.0
0.2 61.7 -0.8 60.9Q2 Dec-Feb 38.8 0.1 0.3 0.3
2016/17 Q1 Sep-Nov 57.8 3.6 0.0
MY Sep-Aug 129.9 2.7 1.0 1.5 135.1 3.2 138.3 1.5
22.1Q4 Jun-Aug 14.8 -1.1 0.7 0.7 15.2 7.2 22.4
0.1 36.9Q3 Mar-May 23.2 -0.1 0.0 0.2 23.3 -1.2
59.7 -2.9 56.8Q2 Dec-Feb 36.5 -0.2 0.2 0.3 36.9
2015/16 Q1 Sep-Nov 55.3 4.1 0.0 0.3
Table 2--Feed and residual use of wheat and coarse grains, 10/16/2017
Market year andquarter 1/
Corn (million
metric tons)
Sorghum (million
metric tons)
Barley (million
metric tons)
Oats (million
metric tons)
Feed grains (million
metric tons)
Wheat (million
metric tons)
Energy feeds (million
metric tons)
Energy feeds per grain
consuming animal unit
(tons)
18 Feed Outlook FDS-17j / October 16, 2017
USDA Economic Research Service

2014/15 2015/16 2016/17381.50 292.50 77.00441.40 291.88 83.50431.74 265.00 92.83380.03 248.75 97.50370.39 238.13 88.13357.83 216.50 87.13336.61 207.50 75.00320.23 242.50 71.00335.03 284.00 68.38375.48 280.00 71.35357.85 280.00 73.10333.63 285.00 75.00368.48 260.98 79.99
2014/15 2015/16 2016/17385.00 123.13 79.43383.79 132.63 85.53424.22 133.13 101.62382.49 132.50 98.25370.63 136.63 84.66376.00 134.50 80.76390.63 122.38 58.03368.75 141.10 48.41313.50 170.50 60.39333.75 149.38 67.10388.75 130.90 63.15344.00 127.75 67.48371.79 136.21 74.57
1/ September-August. Latest data may be preliminary or projected.Source: Calculated by USDA, Economic Research Service.
Date run: 10/13/2017
6,935.002017/18 MY Sep-Aug 460.00 380.00 235.00 5,475.00 149.00 206.50 29.50
29.50 6,890.4447.60 2.10 1,741.64
MY Sep-Aug 465.54 370.19 236.90 5,438.01 146.00 204.30Q4 Jun-Aug 126.35 97.09 61.18 1,370.17 37.15
1,710.44Q3 Mar-May 119.64 96.14 59.72 1,353.63 36.72 54.45 27.40 1,747.69
0.00 1,690.67Q2 Dec-Feb 106.39 88.16 56.08 1,371.14 36.35 52.33 0.00
2016/17 Q1 Sep-Nov 113.17 88.81 59.93 1,343.08 35.78 49.92
203.10 30.56 6,648.34MY Sep-Aug 472.11 337.44 238.52 5,223.61 143.00
1,654.93Q4 Jun-Aug 127.30 93.74 60.03 1,342.34 33.27 51.13 2.63 1,710.44
0.00 1,651.83Q3 Mar-May 125.18 89.99 57.84 1,264.80 38.27 50.92 27.93
50.62 0.00 1,631.15Q2 Dec-Feb 108.82 81.39 58.34 1,316.28 36.58 50.43
Cereals and other
products Seed
Total food, seed, and
industrial use2015/16 Q1 Sep-Nov 110.81 72.33 62.30 1,300.20 34.89
136.001/ October 1-September 30 except for hay. Simple average of monthly prices for the marketing year except for hay.2/ May 1-April 30 marketing year. U.S. season-average price based on monthly price received by farmers weighted by monthly marketings.
Source: USDA, Agricultural Marketing Service, http://marketnews.usda.gov/portal/lg, and USDA, National Agricultural Statistics Service, http://www.nass.usda.gov/Data_and_Statistics/Quick_Stats/index.asp.
Table 5--Corn: Food, seed, and industrial use (million bushels), 10/16/2017
Mkt year and qtr 1/
High-fructose corn syrup
(HFCS)Glucose and
dextrose StarchAlcohol for
fuel
Alcohol for beverages
and manufacturing
136.00Mkt yr 285.03 263.31 155.54 105.29 185.69 79.42 158.00
60.61 137.00 147.00Sep 285.63 301.88 139.30 111.63 112.67 64.43Aug 347.00 318.50 115.13 110.00 92.72
154.00Jul 381.67 276.25 153.50 110.63 77.96 61.48 138.00 152.00
146.00 157.00Jun 345.00 248.13 157.50 105.25 60.27 57.94 140.00
65.12 154.00 150.00May 310.10 245.50 178.50 100.50 64.25 60.72Apr 316.25 266.25 191.00 99.25 81.93
127.00Mar 261.00 284.38 189.50 98.25 1,118.55 68.64 139.00 134.00
141.00 126.00Feb 193.75 285.00 187.13 98.88 124.85 97.89 137.00
99.55 149.00 127.00Jan 200.13 255.60 186.50 96.30 140.93 104.16Dec 221.67 211.67 159.30 104.84 135.83
135.00Nov 266.25 229.00 113.13 111.70 106.87 106.53 147.00 130.00
2015/16 2016/17Oct 291.88 237.50 96.00 116.25 111.48 105.93 155.00
2015/16 2016/17 2014/15 2016/17 2014/15 2015/16
100.29 96.32 579.48 486.71 487.06
Meat and bone meal, Central US
Distillers dried grains, Central Illinois, IL
Wheat middlings, Kansas City, MO
Alfalfa hay, weighted-average
farm price 2/
95.50 85.38 525.00 469.38 469.25Mkt yr 324.56 312.22 304.43 208.61
88.75 90.30 550.63 507.20 475.50Sep 337.95 307.70 293.50 213.75
91.25 95.01 560.00 573.13 467.88Aug 340.80 301.05 295.63 198.50
74.40 107.13 571.60 568.13 475.75Jul 371.49 326.04 299.38 200.84
72.25 87.00 549.38 464.10 485.30Jun 408.58 258.75 281.00 179.38
83.13 73.25 575.63 434.00 501.13May 376.36 293.68 274.38 179.50
107.20 87.00 613.00 445.50 505.63Apr 303.81 305.67 288.13 195.00
117.25 102.38 631.25 457.50 516.50Mar 276.23 320.34 310.50 210.63
135.25 109.63 632.50 452.50 502.50Feb 273.61 334.32 302.50 221.88
143.30 113.13 613.50 482.25 501.67Jan 279.57 332.34 313.75 223.50
105.13 109.63 581.88 477.50 477.50Dec 289.78 321.03 334.38 217.50
90.13 96.00 549.38 509.38 466.13Nov 308.60 322.42 313.13 221.00
2014/15 2015/16 2014/15 2015/16 2016/17Oct 327.97 323.26 346.88 241.88
Table 4--Selected feed and feed byproduct prices (dollars per ton), 10/16/2017
Mkt year and month 1/
Soybean meal, high protein,
Central Illinois, IL
Cottonseed meal, 41% solvent, Memphis, TN
Corn gluten feed, 21% protein,
Midwest
Corn gluten meal, 60% protein,
Midwest2015/16 2016/17 2014/15 2016/17
19 Feed Outlook FDS-17j / October 16, 2017
USDA Economic Research Service
2017/18 2017/18Sep 16.01 14.41OctNovDecJanFebMarAprMayJunJulAugMkt year 2/
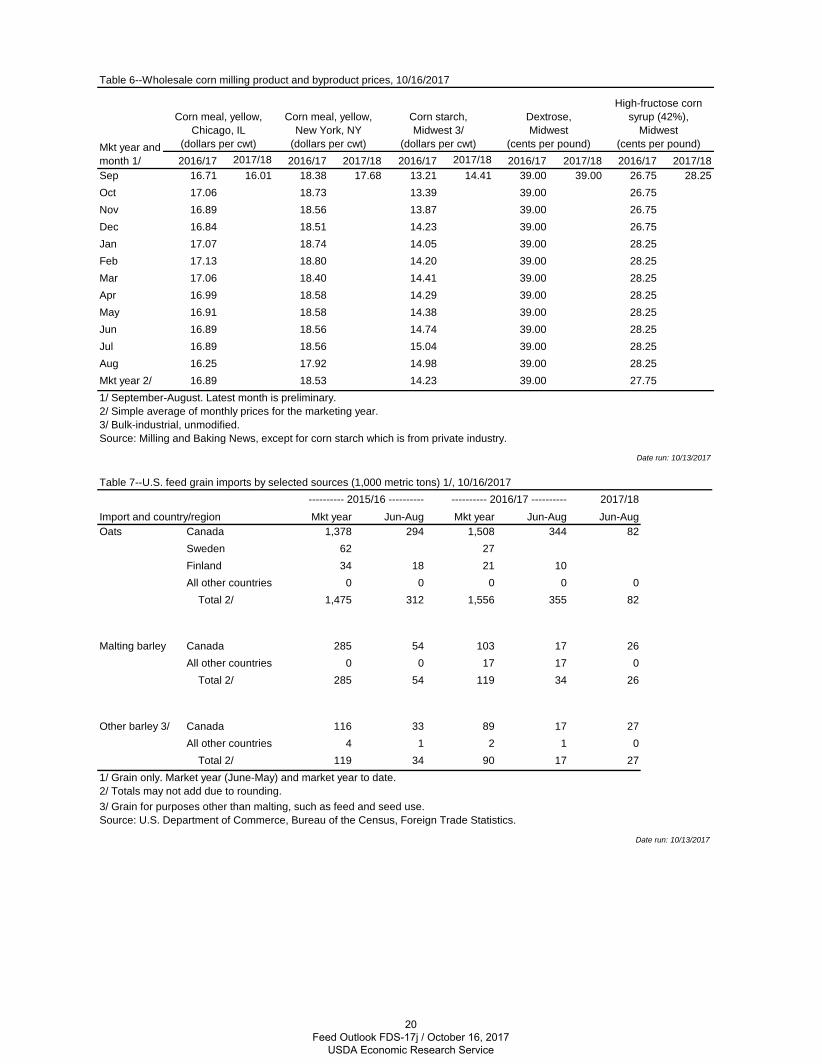
3/ Grain for purposes other than malting, such as feed and seed use.Source: U.S. Department of Commerce, Bureau of the Census, Foreign Trade Statistics.
Date run: 10/13/2017
4 1 2 1 0 Total 2/ 17
34 26
27
271/ Grain only. Market year (June-May) and market year to date.2/ Totals may not add due to rounding.
Other barley 3/ Canada 116 33 89 17All other countries
119 34 90
26All other countries 0 0 17 17 0
Malting barley Canada 285 54 103 17
Total 2/ 285 54 119
Total 2/ 1,475 312 1,556 355 82All other countries 0 0 0 0 0
62 27Finland 34 18 21 10
Jun-Aug Jun-AugOats Canada 1,378 294 1,508 344 82
Sweden
1/ September-August. Latest month is preliminary.2/ Simple average of monthly prices for the marketing year.3/ Bulk-industrial, unmodified.Source: Milling and Baking News, except for corn starch which is from private industry.
Date run: 10/13/2017
Table 7--U.S. feed grain imports by selected sources (1,000 metric tons) 1/, 10/16/2017
Import and country/region---------- 2015/16 ---------- ---------- 2016/17 ---------- 2017/18Mkt year Jun-Aug Mkt year
28.2516.89 18.53 14.23 39.00 27.7516.25 17.92 14.98 39.00
28.2516.89 18.56 15.04 39.00 28.2516.89 18.56 14.74 39.00
28.2516.91 18.58 14.38 39.00 28.2516.99 18.58 14.29 39.00
28.2517.06 18.40 14.41 39.00 28.2517.13 18.80 14.20 39.00
26.7517.07 18.74 14.05 39.00 28.2516.84 18.51 14.23 39.0016.89 18.56 13.87 39.00 26.75
39.00 26.75 28.2517.06 18.73 13.39 39.00 26.75
2016/17 2016/17 2017/18 2016/17 2017/1816.71 18.38 17.68 13.21 39.00
Table 6--Wholesale corn milling product and byproduct prices, 10/16/2017
Mkt year and month 1/
Corn meal, yellow, Chicago, IL
(dollars per cwt)
Corn meal, yellow, New York, NY
(dollars per cwt)
Corn starch, Midwest 3/
(dollars per cwt)
Dextrose, Midwest
(cents per pound)
High-fructose corn syrup (42%),
Midwest(cents per pound)
2016/17 2016/17 2017/18
20 Feed Outlook FDS-17j / October 16, 2017
USDA Economic Research Service

Mkt year Sep-Aug Mkt year Sep-AugMexico 13,337 13,337 13,916 13,916Japan 10,439 10,439 13,527 13,527Colombia 4,548 4,548 4,730 4,730South Korea 2,964 2,964 5,601 5,601Peru 2,383 2,383 2,986 2,986China (Taiwan) 2,038 2,038 2,966 2,966Saudi Arabia 1,389 1,389 2,138 2,138Venezuela 1,155 1,155 419 419Canada 1,014 1,014 704 704Guatemala 906 906 993 993Egypt 852 852 323 323Algeria 663 663 91 91El Salvador 631 631 593 593Costa Rica 552 552 819 819Honduras 550 550 505 505Morocco 450 450 871 871European Union-27 413 413 843 843Vietnam 413 413 200 200Panama 392 392 504 504Israel 388 388 83 83Chile 353 353 543 543China (Mainland) 321 321 807 807Jamaica 283 283 275 275Nicaragua 258 258 329 329Dominican Republic 253 253 807 807All other countries 1,342 1,342 2,670 2,670Total 2/ 48,288 48,288 58,242 58,242
China (Mainland) 7,034 7,034 4,801 4,801Mexico 625 625 585 585Sub-Saharan Africa 593 593 475 475Pakistan 205 205 0.466 0.466All other countries 170 170 250 250Total 2/ 8,626 8,626 6,111 6,111
2017/18Mkt year Jun-Aug Mkt year Jun-Aug Jun-Aug
Mexico 142 25 2 0.007Canada 52 28 63 11 25Morocco 14 14China (Taiwan) 7 2 4 1 0.837All other countries 21 6 26 4 10Total 2/ 235 76 95 16 36
Date run: 10/13/2017
Sorghum
---------- 2015/16 ---------- ---------- 2016/17 ----------
Barley
1/ Grain only. Market year (September-August for corn and sorghum, June-May for barley) and market year to date.2/ Totals may not add due to rounding. Source: U.S. Department of Commerce, Bureau of the Census, Foreign Trade Statistics.
Table 8--U.S. feed grain exports by selected destinations (1,000 metric tons) 1/, 10/16/2017
Export and country/region
---------- 2015/16 ---------- ---------- 2016/17 ----------
Corn
21 Feed Outlook FDS-17j / October 16, 2017
USDA Economic Research Service