Economic Policy Reforms Going for Growth
152
Economic Policy Reforms Going for Growth Interim Report 2016 Economic Policy Reforms Going for Growth INTERIM REPORT 2016 Skatteudvalget 2016-17 SAU Alm.del Bilag 3 Offentligt
Transcript of Economic Policy Reforms Going for Growth

Consult this publication on line at http://dx.doi.org/10.1787/growth-2016-en.
This work is published on the OECD iLibrary, which gathers all OECD books, periodicals and statistical databases. Visit www.oecd-ilibrary.org for more information.
Economic Policy Reforms
Going for GrowthInterim ReportGoing for Growth is the OECD’s regular report on structural reforms in policy areas that have been identifi ed as priorities to boost incomes in OECD and selected non-OECD countries (Brazil, China, Colombia, India, Indonesia, Latvia, Russian Federation and South Africa). Policy priorities are updated every two years and presented in a full report, which includes individual country notes with detailed policy recommendations to address the priorities. The next full report will be published in 2017.
This interim report takes stock of the actions taken by governments over the past year in the policy areas identifi ed as priorities for growth. This stocktaking is supported by internationally comparable indicators that enable countries to assess their economic performance and structural policies in a wide range of areas.
ContentsChapter 1. Overview of structural reforms in the policy areas identifi ed as priorities for growth
Chapter 2. Reform priorities in a diffi cult macro context
Chapter 3. From GDP to average household income: A look at the transmission channels
Chapter 4. Structural policy indicators
Eco
nom
ic Po
licy Refo
rms G
oing
for G
row
th Interim R
epo
rt2016
Economic Policy Reforms
Going for GrowthINTERIM REPORT
2016
ISSN 1813-27152016 SUBSCRIPTION
ISBN 978-92-64-25007-912 2016 01 1 P
Skatteudvalget 2016-17SAU Alm.del Bilag 3Offentligt


Economic Policy Reforms2016
GOING FOR GROWTHINTERIM REPORT

This work is published under the responsibility of the Secretary-General of the OECD. The
opinions expressed and arguments employed herein do not necessarily reflect the official
views of OECD member countries.
This document and any map included herein are without prejudice to the status of or
sovereignty over any territory, to the delimitation of international frontiers and boundaries
and to the name of any territory, city or area.
ISBN 978-92-64-25007-9 (print)ISBN 978-92-64-25008-6 (PDF)ISBN 978-92-64-25130-4 (epub)
Series: Economic Policy ReformsISSN 1813-2715 (print)ISSN 1813-2723 (online)
The statistical data for Israel are supplied 3by and under the responsibility of the relevant Israeli authorities. The useof such data by the OECD is without prejudice to the status of the Golan Heights, East Jerusalem and Israelisettlements in the West Bank under the terms of international law.
Photo credits: Cover © Alain Jacoby-Koaly pour Studio Pykha
Corrigenda to OECD publications may be found on line at: www.oecd.org/about/publishing/corrigenda.htm.
© OECD 2016
You can copy, download or print OECD content for your own use, and you can include excerpts from OECD publications, databases and
multimedia products in your own documents, presentations, blogs, websites and teaching materials, provided that suitable
acknowledgement of OECD as source and copyright owner is given. All requests for public or commercial use and translation rights should
be submitted to [email protected]. Requests for permission to photocopy portions of this material for public or commercial use shall be
addressed directly to the Copyright Clearance Center (CCC) at [email protected] or the Centre français d’exploitation du droit de copie (CFC)
Please cite this publication as:OECD (2016), Economic Policy Reforms 2016: Going for Growth Interim Report, OECD Publishing, Paris.http://dx.doi.org/10.1787/growth-2016-en

www.oecd.org/economics/goingforgrowth
Going for Growth was launched in 2005 as a new form of structural surveillancecomplementing the OECD’s long-standing country and sector-specific surveys. In line withthe OECD’s 1960 founding Convention, the aim is to help promote vigorous sustainableeconomic growth and improve the well-being of OECD citizens.
This surveillance is based on a systematic and in-depth analysis of structural policies andtheir outcomes across OECD members, relying on a set of internationally comparable andregularly updated policy indicators with a well-established link to performance. Using theseindicators, alongside the expertise of OECD committees and staff, policy priorities andrecommendations are derived for each member and, since the 2011 issue, six keynon-member economies with which the OECD works closely (Brazil, China, India, Indonesia,Russian Federation and South Africa). From one issue to the next, Going for Growth followsup on these recommendations and priorities evolve, not least as a result of governmentstaking action on the identified policy priorities.
Underpinning this type of benchmarking is the observation that drawing lessons frommutual success and failure is a powerful avenue for progress. While allowance should bemade for genuine differences in social preferences across OECD members, the uniqueness ofnational circumstances should not serve to justify inefficient policies.
In gauging performance, the focus is on GDP per capita, productivity and employment. Ashighlighted in the past and again in this issue, this leaves out some important dimensionsof well-being. For this reason, Going for Growth regularly features thematic chaptersdedicated to these other dimensions, and increasingly looks at the side effects ofgrowth-enhancing priorities on other government policy objectives.
Going for Growth is the fruit of a joint effort across a large number of OECD Departments.

EDITORIAL RESTORING HEALTHY GROWTH: POLICIES FOR HIGHER AND MORE INCLUSIVE PRODUCTIVITY
EditorialRestoring healthy growth: policies for higher
and more inclusive productivity
A pickup in global growth remains elusive, almost eight years after the financial crisis
erupted. The recovery in advanced economies is still muted, particularly in the euro area
and Japan, while growth has slowed in emerging-market economies (EMEs). Trade and
investment remain weak, while jobs and wage growth have been disappointing. Financial
markets are increasingly volatile as capital searches for both yield and safety. Getting back
to healthy and inclusive growth calls for urgent policy response, drawing on monetary,
fiscal, and structural policies working together: On the one hand, demand policies alone will
not restore sustainable growth; but on the other hand, policies to strengthen competition
and innovation, spur job creation, and repair financial systems to fund investment will
only yield results if there is enough demand.
This 2016 Going for Growth report underscores the importance of synergies among
policies in designing policy packages. Policy coherence across a broad range of reform
objectives such as product market competition, labour mobility and financial market
robustness is critical to create an environment conducive to innovation and resource
reallocation, which are crucial to reverse the widespread slowdown in productivity and the
rise in inequality.
Productivity – a central ingredient in the pursuit of wellbeing – has been decelerating
in a vast majority of countries, with the slowdown going back to around 2000, at least in
advanced economies. While this may partly reflect measurement issues, a common set of
unsettling trends lie behind the aggregate slowdown: the dispersion of productivity growth
across firms within industries, the decline in the growth rate of investment in knowledge-
based capital, and the reduction in the pace of business creation. These trends are
outcomes from problems in the basic policy environment – market competition and
innovation, labour market institutions, financial structure and robustness – which also
contribute to unfavourable trends in income distribution.
In addressing the productivity and inclusiveness challenges, governments need to
keep in mind the basic policies that underpin these developments, and hence the need for
coherent policy packages. Start with narrowing the productivity gap across firms, which
requires a better diffusion of innovations from leading to lagging firms. Since leading firms
are mostly multinationals, the intensity of cross-border connections via trade, FDI, global
value chains and the mobility of skilled labour is crucial for the diffusion of knowledge and
technologies from these globalised “frontier” firms to national firms.
Giving international trade a fresh boost requires that recent multilateral agreements in
this area be forcefully implemented but also that efforts be made to further reduce barriers
in the form foreign ownership restrictions or preferential treatments of domestic suppliers
ECONOMIC POLICY REFORMS 2016: GOING FOR GROWTH INTERIM REPORT © OECD 20164

EDITORIAL RESTORING HEALTHY GROWTH: POLICIES FOR HIGHER AND MORE INCLUSIVE PRODUCTIVITY
with respect to public procurement, taxes and subsidies. In several EMEs – notably Brazil,
India and Indonesia – barriers to infrastructure investment need to be addressed to
significantly improve the transport and logistic services that underpin cross-border trade.
Next, consider improving knowledge diffusion and making the most of new
technologies, which necessitates synergic investments by lagging firms in various forms of
knowledge-based capital such as R&D, skills and organisational know-how. Despite the
need to revive investment in knowledge-based capital, the incidence of innovation policy
reforms appears to have steadily fallen in recent years, as documented in this report.
Furthermore, for reforms in the area of innovation to pay off, firms need the right
incentives to strive for the development of new and better-quality products at lower costs.
Strong product market competition provides such incentive. In this regard, the decline in
business start-ups in advanced economies could be a sign that barriers to entry, including
through the financial system, have been creeping up and hence that the strength of
competition is eroding.
Re-examination is needed of competition policy, bankruptcy legislation and product
market regulations to facilitate entry and exit, and to provide a level playing field between
new firms and incumbents. As emphasised in this report, pro-competition reforms are
particularly needed in services where the scope for both job creation and productivity gains
remains large. This is especially true for Germany, Japan and Korea where the gap in
productivity between services and manufacturing is the largest among advanced
economies, but also for China as the economy goes through a challenging rebalancing from
manufacturing to services.
Deeper global integration and the growing reliance on intangible forms of capital
stresses the importance of collective policy approaches in the areas of competition law
enforcement, regulatory harmonisation, basic research and the taxation of mobile capital.
One major achievement in 2015 has been the global agreement on a list of measures to
limit tax avoidance by multinationals through the so-called Base Erosion and Profit
Shifting (BEPS) action plan elaborated under the auspices of the G20 and the OECD.
In addition to fostering competition, product market reforms also facilitate the
reallocation of resources from low- to high-productivity firms. The efficiency of resource
allocation would be further enhanced with measures to reduce barriers to labour mobility,
notably those linked to housing markets. In turn, to ensure that resource reallocation truly
serves wellbeing, workers need to be better equipped and offered real opportunities to
adapt skills. Adult learning programmes should thus focus more strongly on skills
complementarity with technological progress so as to help to reduce skills mismatch and
to facilitate adaptation to the rapid change in the nature of tasks associated with specific
jobs. Improving the matching of skills to jobs raises productivity and reduces inequality.
Sustained growth and job creation are the best ways to improve income distribution,
since the low- income and less-skilled bear the brunt of economic downturns. A challenge
for several advanced economies – in particular those facing persistently high unemployment
such as France, Italy and Spain – is to shift social protection from specific jobs to individuals
so as to better support the process of jobs and firms turnover that underpins dynamic,
growing economies. Reforms in this area will help to improve job opportunities for youth and
low-skilled workers, particularly hard hit by unemployment. For emerging economies,
stronger social protection is needed to reduce informality and inequality, while fostering
domestic consumption.
ECONOMIC POLICY REFORMS 2016: GOING FOR GROWTH INTERIM REPORT © OECD 2016 5

EDITORIAL RESTORING HEALTHY GROWTH: POLICIES FOR HIGHER AND MORE INCLUSIVE PRODUCTIVITY
Strong employment growth is critical to ensure that growth benefits all segments of
society, but it is not sufficient. In several countries, a large and rising share of the growth
benefits have accrued to high-income households, while income at the bottom has been
stagnant for many years. In the United Kingdom and in particular the United States, reforms
to provide better access to high-quality education for students from disadvantaged
backgrounds combined with measures to make the tax system more efficient and equitable
would help to make growth more inclusive. In some countries such as Italy and Korea,
household income has not kept up with GDP gains over the past two decades. Chapter 3 of
this report explores the channels through which the income generated through GDP is
transmitted to households.
Given the breadth and evolving nature of the growth and inclusiveness challenges
facing advanced and emerging economies, the slowdown in the pace of structural reform
documented in this report is deeply concerning. While the pace of reform should be
accelerating to restore sustainable and equitable growth, the pace of reforms appears to
have steadily declined since 2011-12. While some countries have made considerable
efforts, many have taken very little action and countries with ambitious reform
programmes, such as in India, Japan and Turkey face significant political challenges and
the risk of losing momentum. Progress has been made on the G20 action plan to raise
reform efforts, but much remains to be fully implemented.
Given the weak demand environment, structural reform packages that promote
productivity should focus as well in design on maximising short-run growth gains. Chapter
2 of this report reviews the issues and evidence on the impact of reforms introduced in a
difficult economic conjuncture for their outcomes in terms of both productivity and
income distribution. Reform strategies that put more weight on shifting the composition of
public spending towards investment, facilitating the entry of new firms in services, and
reducing barriers to labour mobility are most likely to boost activity in the short term, with
the support of demand policies and a repaired financial sector. More vigorous reform
efforts from euro area countries with a large current account surplus would also help to
ensure that the current growth pick-up in that region does not succumb to internal
divisions and external headwinds. All countries contributing collectively to reform efforts
and to supportive demand improves the prospects for a return to higher productivity and
more inclusive growth both at home and in the global economy.
Catherine L. Mann
OECD Chief Economist
ECONOMIC POLICY REFORMS 2016: GOING FOR GROWTH INTERIM REPORT © OECD 20166

TABLE OF CONTENTS
Table of contents
Executive summary . . . . . . . . . . . . . . . . . . . . . . . . . . . . . . . . . . . . . . . . . . . . . . . . . . . . . . . . . 11
Chapter 1. Overview of structural reforms in the policy areas identifiedas priorities for growth . . . . . . . . . . . . . . . . . . . . . . . . . . . . . . . . . . . . . . . . . . . . . . . . . . 15
Overview of structural reforms in the policy areas identified
as priorities for growth. . . . . . . . . . . . . . . . . . . . . . . . . . . . . . . . . . . . . . . . . . . . . . . . . . . 16
Introduction. . . . . . . . . . . . . . . . . . . . . . . . . . . . . . . . . . . . . . . . . . . . . . . . . . . . . . . . . . . . 17
A global overview of the progress on reform priorities . . . . . . . . . . . . . . . . . . . . . . . . 19
Assessment of reform progress by country groups . . . . . . . . . . . . . . . . . . . . . . . . . . . 22
The implications of growth-enhancing structural reforms for inclusive growth
and macroeconomic rebalancing . . . . . . . . . . . . . . . . . . . . . . . . . . . . . . . . . . . . . . . . . . 55
Notes. . . . . . . . . . . . . . . . . . . . . . . . . . . . . . . . . . . . . . . . . . . . . . . . . . . . . . . . . . . . . . . . . . 59
Bibliography. . . . . . . . . . . . . . . . . . . . . . . . . . . . . . . . . . . . . . . . . . . . . . . . . . . . . . . . . . . . 60
Chapter 2. Reform priorities in a difficult macro context. . . . . . . . . . . . . . . . . . . . . . . . . . 63
Reform priorities in a difficult macro context . . . . . . . . . . . . . . . . . . . . . . . . . . . . . . . 64
Introduction. . . . . . . . . . . . . . . . . . . . . . . . . . . . . . . . . . . . . . . . . . . . . . . . . . . . . . . . . . . . 65
Structural reforms in normal times . . . . . . . . . . . . . . . . . . . . . . . . . . . . . . . . . . . . . . . . 66
Structural reforms under weak demand conditions . . . . . . . . . . . . . . . . . . . . . . . . . . 69
Structural reforms under weak demand and constrained macroeconomic policies 73
Notes. . . . . . . . . . . . . . . . . . . . . . . . . . . . . . . . . . . . . . . . . . . . . . . . . . . . . . . . . . . . . . . . . . 77
Bibliography. . . . . . . . . . . . . . . . . . . . . . . . . . . . . . . . . . . . . . . . . . . . . . . . . . . . . . . . . . . . 78
Appendix 2.1. Detailed analysis on the impact of reforms in normal times . . . . . . . 82
Chapter 3. From GDP to average household income: A look at the transmissionchannels. . . . . . . . . . . . . . . . . . . . . . . . . . . . . . . . . . . . . . . . . . . . . . . . . . . . . . . . . . . . . . . 87
From GDP to average household income: A look at the transmission channels . . . 88
Introduction. . . . . . . . . . . . . . . . . . . . . . . . . . . . . . . . . . . . . . . . . . . . . . . . . . . . . . . . . . . . 89
Adjusted Household Disposable Income: definition and cross-country patterns . . . 90
Tracking income growth from the household perspective and explaining
the gap vis-à-vis GDP growth. . . . . . . . . . . . . . . . . . . . . . . . . . . . . . . . . . . . . . . . . . . . . . 93
Income distribution between the household and non-household sectors . . . . . . . 99
From functional income distribution to income inequality . . . . . . . . . . . . . . . . . . . . 107
Notes. . . . . . . . . . . . . . . . . . . . . . . . . . . . . . . . . . . . . . . . . . . . . . . . . . . . . . . . . . . . . . . . . . 111
Bibliography. . . . . . . . . . . . . . . . . . . . . . . . . . . . . . . . . . . . . . . . . . . . . . . . . . . . . . . . . . . . 113
Appendix 3.1. Policy drivers of the labour share: a brief literature overview. . . . . . . 116
Chapter 4. Structural policy indicators . . . . . . . . . . . . . . . . . . . . . . . . . . . . . . . . . . . . . . . . . 121
ECONOMIC POLICY REFORMS 2016: GOING FOR GROWTH INTERIM REPORT © OECD 2016 7

Look for the StatLinks2at the bottom of the tables or graphs in this book.
To download the matching Excel® spreadsheet, just type the link into your
Internet browser, starting with the http://dx.doi.org prefix, or click on the link from
the e-book edition.
Follow OECD Publications on:
This book has... StatLinks2A service that delivers Excel files from the printed page! ®
http://twitter.com/OECD_Pubs
http://www.facebook.com/OECDPublications
http://www.linkedin.com/groups/OECD-Publications-4645871
http://www.youtube.com/oecdilibrary
http://www.oecd.org/oecddirect/ OECD
Alerts

ISO CODES
ISO Codes
The codes for country names and currencies used in this volume are those attributed
to them by the International Organization for Standardization (ISO).
Country code Country name Currency code Country code Country name Currency code
AUS Australia AUD ISL Iceland ISK
AUT Austria EUR ISR Israel ILS
BEL Belgium EUR ITA Italy EUR
BRA Brazil BRL JPN Japan JPY
CAN Canada CAD KOR Republic of Korea KRW
CHE Switzerland CHF LUX Luxembourg EUR
CHL Chile CLP LVA Latvia LVL
CHN China CNY MEX Mexico MXN
CZE Czech Republic CZK NLD Netherlands EUR
DEU Germany EUR NOR Norway NOK
DNK Denmark DKK NZL New Zealand NZD
ESP Spain EUR POL Poland PLN
EST Estonia EUR PRT Portugal EUR
FIN Finland EUR RUS Russian Federation RUB
FRA France EUR SVK Slovak Republic SKK
GBR United Kingdom GBP SVN Slovenia EUR
GRC Greece EUR SWE Sweden SEK
HUN Hungary HUF TUR Turkey TRL
IDN Indonesia IDR USA United States USD
IND India INR ZAF South Africa ZAR
IRL Ireland EUR
Note: EU refers to the average of 21 European Union members of the OECD.
ECONOMIC POLICY REFORMS 2016: GOING FOR GROWTH INTERIM REPORT © OECD 2016 9

Economic Policy Reforms 2016
Going for Growth Interim Report
© OECD 2016
Executive summary
Global growth prospects remain clouded in the near term, with emerging-market
economies losing steam, world trade slowing down and the recovery in advanced
economies being dragged down by persistently weak investment. These near-term
concerns arise against the background of a widespread deceleration of productivity gains,
with the downward trend going back to early 2000s – at least in advanced economies – and
with little signs of revival. The growth slowdown observed among emerging-market
economies over the past couple of years also raises questions about their capacity to
further closing the income gap vis-à-vis most advanced countries. The case for structural
reforms, combined with supporting demand policies, remains strong to sustainably lift
productivity and the job creation that will promote improvements in equity.
Going for Growth offers a comprehensive assessment to help governments reflect on how
policy reforms might affect their citizens’ wellbeing and to design policy packages that best
meet their objectives. The Going for Growth framework is instrumental in helping G20
countries to monitor their efforts to fulfil the pledge made in 2014 of boosting their combined
gross domestic product (GDP) by 2%, and to adapt their growth strategies accordingly.
This interim report reviews the main growth challenges faced by OECD and selected
non-OECD countries and takes stock of progress over the past year or so in adopting
structural policy reforms to address them (Chapter 1). This is examined in light of the
thrust of the country-specific priorities identified in the 2015 issue of Going for Growth. The
potential implications of growth-enhancing reforms for inclusiveness and macroeconomic
rebalancing are also discussed, with a focus on public finance consolidation, the narrowing
of current account imbalances, and the reduction of income inequality.
The report also reviews the issues and evidence on the impact of reforms implemented
in a context of persistently weak demand as well as under different cases regarding the
availability or effectiveness of macroeconomic policies in supporting the reforms
(Chapter 2). Finally, the report provides an assessment of the link between income generated
from GDP and income distributed to households (Chapter 3). In particular, it examines how
the main channels through which GDP growth is transmitted to the household sector have
evolved over the past two decades across OECD countries.
Policy reform challenges● In devising reform strategies to sustainably improve the wellbeing of a majority of
citizens, governments around the world need to address deep structural weaknesses
that the crisis laid bare, but which in many cases originated well before.
● The global slowdown in productivity growth has been characterised by the widening of
the dispersion of productivity growth across firms within industries, in particular
11

EXECUTIVE SUMMARY
between frontier firms – essentially multinational enterprises which have maintained
steady productivity growth – and all other firms that operate well within the productivity
frontier. Removing barriers that stifle entrepreneurship and limit the capacity of firms to
make the most of knowledge and technological diffusion is a reform priority.
● Reducing unemployment continues to be a major challenge for many countries, particularly
so in Southern and Central European countries where long-term unemployment remains
particularly high. Other countries have been facing relatively high rates of labour market
withdrawals (e.g. United States), low labour force participation of women (Korea and Japan)
or a high incidence of informal employment (most emerging-market economies).
Addressing these labour market challenges is a priority to make growth more inclusive.
Progress achieved in 2015● Even though progress is made in tackling some of the main challenges, the slowdown in
the pace of reforms observed in 2013-14 has continued in 2015, even after taking into
account measures that are in the pipeline but that have yet to be fully implemented.
● The pace of reforms has varied both across countries and policy areas.
❖ It continues to be generally higher in Southern European countries (in particular Italy
and Spain) than among Northern European countries. Outside Europe, countries where
a relatively high number of measures related to Going for Growth recommendations have
been taken include Japan among advanced economies, and China, India and Mexico in
the case of emerging economies.
❖ Relatively more actions have been taken to lift the labour force participation of women
and to improve educational outcomes, while fewer actions are observed in the areas of
innovation policy, public sector efficiency or product and labour market regulation.
● In countries where income inequality is a particular concern, the majority of actions
taken on policy priorities are likely to help narrowing the income distribution. However,
recent actions taken to boost growth are unlikely to help countries with largest current
account deficits to narrow their external imbalances.
Reforming in a context of weak demand● Against the background of subdued global economic prospects, there is a good case for
prioritising reforms that in addition to stimulate employment and productivity, can best
support activity in the short term.
❖ Aside from raising investment in public infrastructure, these include reductions of
barriers to entry in services sectors with pent-up demand, reforms of benefit
entitlements in the areas of health and pension, as well as reforms of housing policies
and job-search assistance programmes to facilitate geographic and job mobility.
❖ Increasing the short-term payoff from structural reforms also requires that remaining
financial sector dysfunctions be addressed so as to improve the flow of credit to
households and firms with limited access to financial markets.
❖ In the euro area, a greater synchronisation of reforms would also help reduce the
transition costs by giving greater scope to monetary policy to mitigate the potential
rise in real interest rates resulting from persistently low inflation.
ECONOMIC POLICY REFORMS 2016: GOING FOR GROWTH INTERIM REPORT © OECD 201612

EXECUTIVE SUMMARY
❖ Countries with very limited budgetary room may have to prioritise on high short-term
returns or on low-cost measures and ensure that others are financed through means
that are as friendly as possible to employment and growth.
GDP growth and aggregate household income● Real GDP has tended to grow by more than real household income in the majority of
OECD countries between the mid-1990s and 2013.
● This growth gap is partly due to factors having little policy traction, in particular the fact
that consumption prices (which include VAT) have tended to rise relative to production
prices over the period under consideration, the only exceptions being commodity
exporters such as Norway, Australia and Canada.
● The household income share of GDP, simply defined as the ratio of nominal household
disposable income over nominal GDP, has been stable over the period under
consideration and on average across OECD countries. This average stability masks
heterogeneity in both the level and evolution across countries, with a large decline
observed in Austria and Korea and a large increase in the Slovak Republic and Finland.
● Developments in the household income share of GDP can be assessed by looking at the
profile of households’ labour, capital and secondary ( i.e. net government transfers)
income share of GDP. A large number of countries have experienced a concomitant
decline in the labour share of GDP and in the share of capital income going to
households, suggesting that a rising share of profits has been retained by the corporate
sector instead of being redistributed to the household sector.
● Yet, there are no clear links between the changes in income distribution between the
household, corporate and government sectors of the economy on the one hand, and the
rise in income inequality within the household sector experienced by many OECD
countries, on the other.
ECONOMIC POLICY REFORMS 2016: GOING FOR GROWTH INTERIM REPORT © OECD 2016 13


Economic Policy Reforms 2016
Going for Growth Interim Report
© OECD 2016
Chapter 1
Overview of structural reformsin the policy areas identified
as priorities for growth
This chapter reviews the main growth challenges faced by OECD and selected non-OECD countries and takes stock of the progress made since 2015 in the adoptionand implementation of structural policy reforms to address these challenges.Progress is assessed on the basis of actions taken in response to Going for Growthpolicy recommendations. The chapter also discusses the potential effect of thereforms on policy objectives other than GDP growth, in particular public financeconsolidation, narrowing current account imbalances and reducing incomeinequality.
The statistical data for Israel are supplied by and under the responsibility of the relevant Israeliauthorities. The use of such data by the OECD is without prejudice to the status of the Golan Heights,East Jerusalem and Israeli settlements in the West Bank under the terms of international law.
15

1. OVERVIEW OF STRUCTURAL REFORMS IN THE POLICY AREAS IDENTIFIED AS PRIORITIES FOR GROWTH
Overview of structural reforms in the policy areas identified as prioritiesfor growth
Main findings
● The slowdown in the pace of reforms observed in 2013-14 has continued in 2015, even
after taking into account measures that are in the pipeline but that have yet to be fully
implemented.
❖ On average across advanced economies, about 14% of the reform recommendations
found in Going for Growth have been fully implemented in 2015, while another 36% are
in the process of implementation.
❖ For emerging economies, fewer recommendations have been fully implemented
in 2015 but initial steps have been made on around 44% of recommendations.
❖ The share of implemented recommendations has generally been higher in Southern
European countries (in particular Italy and Spain) than in Northern European
countries.
❖ Outside Europe, countries where a relatively high number of measures related to Going
for Growth recommendations have been taken include Japan among advanced
economies and China, India and Mexico in the case of emerging economies.
● The intensity of reforms has also varied across policy areas. Relatively more actions have
been taken to lift the labour force participation of women, reduce the labour tax wedge
and to improve educational outcomes, while fewer actions were observed in the areas of
innovation policy, public sector efficiency or labour market regulation.
● Against the background of weakening global economic prospects, there is a good case for
prioritising reforms that in addition to stimulate employment and productivity, can best
support activity in the short term.
❖ Aside from higher investment in public infrastructure, these include reductions of
barriers to entry in services sectors with pent-up demand as well as reforms in the
area of housing policies and job-search assistance to facilitate geographic and job
mobility.
❖ Countries with very limited budgetary room may have to prioritise on high short-term
returns or on low-cost measures and ensure that others are financed through means
that are as friendly as possible to employment and growth.
● In countries where income inequality is a particular concern, the majority actions taken
on policy priorities are likely to help narrowing the income distribution.
● Recent actions taken to boost growth are unlikely to help the countries with largest
current account deficits to narrow their large external imbalances.
ECONOMIC POLICY REFORMS 2016: GOING FOR GROWTH INTERIM REPORT © OECD 201616
1. OVERVIEW OF STRUCTURAL REFORMS IN THE POLICY AREAS IDENTIFIED AS PRIORITIES FOR GROWTH
s
323716
-50
-40
-30
-20
-10
0
10
20
30
40
50
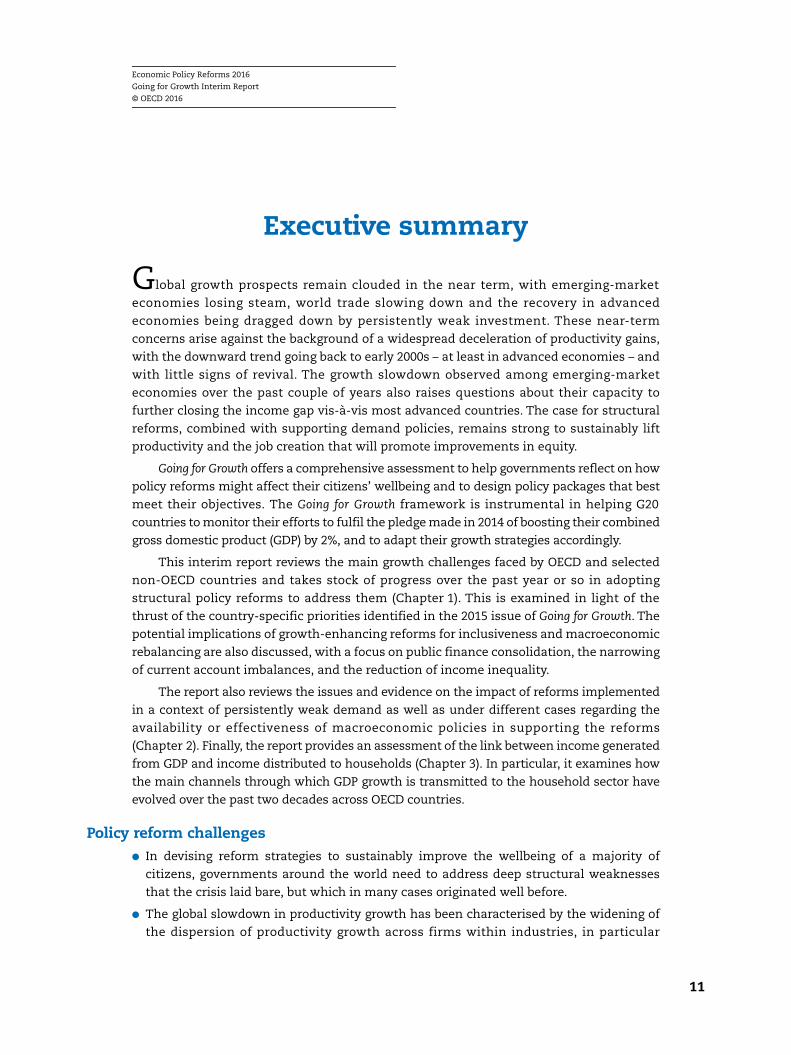
IntroductionGlobal growth is set to disappoint in the near term, with emerging-market economies
losing steam and the recovery in output and employment in advanced economies
remaining uneven. While labour market weaknesses are still a major challenge for many
countries, a key contributing factor across a majority of them has been the slowdown of
productivity growth, reflecting both weak investment in physical capital (machines and
equipment, physical infrastructure) and poor growth in multi-factor productivity. In most
advanced countries, the recovery in non-residential investment is lagging behind that of
GDP, substantially so among European countries (Figure 1.1). Lingering doubts about the
strength and sustainability of domestic demand, a difficult access to finance and subdued
growth prospects for the world economy are weighing down on investment (OECD, 2015a).
While the weakness of investment coincided with the crisis, the slowdown in multi-
factor productivity among advanced countries goes all the way back to the early 2000s
(Figure 1.2), an indication that deep structural weaknesses may cast a shadow on future
growth prospects. The contributing factors deserving most attention include a slowdown
in the diffusion of innovation from firms at the technological frontier – mostly
multinationals which have enjoyed steady productivity growth – to lagging firms, weaker
investment in knowledge-based capital and a decline in the pace of business start-ups
(OECD, 2015b). Yet, in many OECD countries facing stagnant or falling working-age
population and declining returns to higher education, the role of innovation as a source of
productivity gains and medium-term rises in material living standards will become even
more prevalent. In addition, many countries are still facing high long-term unemployment
or relatively high rates of labour market withdrawals, in both cases contributing to skills
erosion, social exclusion and income inequality.
Against this background, the case for ambitious structural reforms, combined with
supportive demand policies, remains strong to lift potential growth. The 2015 issue of Going
for Growth identified priorities and formulated explicit recommendations to address the
Figure 1.1. Investment is lagging behind the recovery of GDP in most European countrieThe difference between the 2014 and 2008 levels, as a percentage of the 2008 level
1. The last available year is 2013 for Switzerland and Chile; 2012 for Mexico.Source: OECD, Economic Outlook Database.
1 2 http://dx.doi.org/10.1787/888933
-50
-40
-30
-20
-10
0
10
20
30
40
50
GR
C
SVN
ISL
PRT
ITA
ESP
FIN
CZE
SVK
EST
DN
K
NO
R
NLD
FRA
AUT
JPN
DEU
GBR LU
X
CH
E
IRL
HU
N
USA
SWE
BEL
MEX
CAN PO
L
KOR
NZL ISR
AUS
CH
L
Gross domestic product Private non-residential and government fixed capital formation¹
ECONOMIC POLICY REFORMS 2016: GOING FOR GROWTH INTERIM REPORT © OECD 2016 17
1. OVERVIEW OF STRUCTURAL REFORMS IN THE POLICY AREAS IDENTIFIED AS PRIORITIES FOR GROWTH
ies
323721
-1
0
1
2
3
4
5
6
7
8
9
10
11
key challenges. In essence, recommendations have been made i) to develop skills and
knowledge-based capital, underpinned by the quality and inclusiveness of the education
system, ii) to improve policy settings in competition and innovation to facilitate the entry
of new firms and the smooth reallocation of capital and labour towards the most
productive firms and sectors, iii) to make growth more inclusive by removing obstacles to
higher employment and labour force participation of underrepresented groups such as
women, youth, low-skilled and older workers and by encouraging faster reallocation to
new jobs and ensuring that workers can up-grade skills.
This chapter reviews the main growth challenges faced by OECD countries and
selected non-OECD economies and takes stock of actions taken that relate to policy
recommendations on reform priorities laid out in the 2015 issue of Going for Growth. The
priorities are selected with a view to improving material living standards through
employment and productivity gains. The policy areas covered include product and labour
market regulations, tax and benefit systems, rules affecting foreign trade and investment,
education and training, as well as innovation. The chapter specifically evaluates the extent
to which the countries have addressed such reform priorities, mainly focusing on the
actions taken in 2015. The implementation of reforms is defined as the introduction of
relevant laws and decrees or appropriate measures (such as budgetary provisions) put in
place for the reform to come into effect. It does not, however, evaluate how effectively
those legislations or measures are enforced in practice.
The next section provides a global overview of the reform momentum in 2015
compared to previous periods. The subsequent section discusses the main challenges
faced by countries and reviews actions taken on policy recommendations to address these
challenges, with a special focus on developments that have taken place in 2015. The final
section discusses the possible impact of recommendations on other important policy
objectives, namely the reduction of income inequality as well as of budgetary deficits and
current account imbalances.
Figure 1.2. Labour productivity growth slowed even before the crisis in advanced economAverage annual growth rate of GDP per hour worked,1 percentage
1. GDP per employee for non OECD countries. For Brazil, Indonesia and Mexico data refer to 1991-2000 instead of 1990-2000.Source: OECD, National Accounts and Productivity Databases and International Labour Organisation (ILO) Database.
1 2 http://dx.doi.org/10.1787/888933
-1
0
1
2
3
4
5
6
7
8
9
10
11
ITA GBR SWE FRA DEU JPN CAN USA AUS ESP KOR MEX TUR BRA IDN IND CHN
1990-2000 2000-07 2007-14
ECONOMIC POLICY REFORMS 2016: GOING FOR GROWTH INTERIM REPORT © OECD 201618

1. OVERVIEW OF STRUCTURAL REFORMS IN THE POLICY AREAS IDENTIFIED AS PRIORITIES FOR GROWTH
d
323735
action
A global overview of the progress on reform prioritiesOn average across advanced economies, about 14% of the reform recommendations
found in the 2015 issue of Going for Growth have been fully implemented (that is, they were
met with relevant legislation or significant budgetary provision) in 2015, while 36% were in
the process of implementation (Figure 1.3 panel A). For emerging economies, although the
share of the Going for Growth recommendations that have been fully implemented
remained lower than in advanced economies, a higher proportion (44%) was in the process
of implementation (Panel B). Taken at face value, these numbers indicate a marked
slowdown in the pace of reforms in 2015 relative to the pace observed during the
period 2013-14 (Figure 1.4, “fully implemented actions”). However, considering that
legislative intensity can vary significantly from one year to the next, caution is needed in
comparing the pace reported in one year (2015) relative to the pace averaged over a two-
year period.1 Still, even if one takes into account not only the policy measures fully
implemented but also the ones in the process of implementation – which may or may not
end up as fully implemented – the pace of reforms would remain below that of the past two
years (Figure 1.4, “full-implementation of in-process measures”).
The actual pace of reform is more likely to lie somewhere between these two cases,
confirming the slowdown of the reform momentum observed since the peak of 2011-12.
The deceleration is most apparent in euro area economies, where it is now similar to the
pace observed elsewhere. Furthermore, the pace of reform in the euro area (current
account) surplus economies continues to be substantially below that of euro area deficits
economies.
Figure 1.3. About 50 % of the Going for Growth recommendations have been implementeor are in the process of implementation
1 2 http://dx.doi.org/10.1787/888933
14.2%
36.4%
49.4%
A. Advanced economies
7.8%
46.9%
45.3%
B. Emerging economies
Fully implemented (the adoption of relevant law etc.) In process of implementation Limited steps taken or no
ECONOMIC POLICY REFORMS 2016: GOING FOR GROWTH INTERIM REPORT © OECD 2016 19

1. OVERVIEW OF STRUCTURAL REFORMS IN THE POLICY AREAS IDENTIFIED AS PRIORITIES FOR GROWTH
imatede Goingud andus wass). Thertugal,
323740
0.000.050.100.150.200.250.300.35
0.400.450.500.550.600.650.70
323752
0.0
0.1
0.2
0.3
0.4
0.5
0.6
0.7
0.8
0.9
26
While in the aftermath of the crisis, the responsiveness to Going for Growth
recommendations tended to be higher in countries that faced more difficult
macroeconomic conditions – in particular a very high unemployment rate (Figure 1.5) –
such relationship has been less apparent more recently: a high responsiveness has been
observed across countries facing diverse macroeconomic conditions.
Figure 1.4. The pace of reform has decelerated in 2015The share of implemented Going for Growth recommendations1
1. The chart illustrates the pace of reform in previous periods captured by the indicator of reform responsiveness (RRI) and the estlevel of responsiveness in 2015 based on two different scenarios to ensure comparability with previous two-year periods. See thfor Growth 2010 issue for an explanation on RRI, and the main text on how the hypothetical RRI is computed. Following OllivaSchwellnus (2013), the euro area surplus economies are defined as the euro area members for which the current account surplon average larger than 1% of GDP over the period 2000-05 (Austria, Belgium, Germany, Finland, Luxembourg and the Netherlandeuro area deficit economies include the remaining members of the OECD euro area (France, Estonia, Greece, Ireland, Italy, Pothe Slovak Republic, Slovenia and Spain).
1 2 http://dx.doi.org/10.1787/888933
0.000.050.100.150.200.250.300.35
0.400.450.500.550.600.650.70
Advancedeconomies
Emerging marketeconomies
Euro area deficiteconomies
Euro area surpluseconomies
Non-Euro EUeconomies
Non-EU advancedeconomies
2011-12 2013-14 2015 (fully implemented) 2015 (full implementation of in-process measures)
Figure 1.5. The pace of reforms has been faster in countries facing hardestmacroeconomic conditions
Source: OECD, Going for Growth 2013, 2015 and Labour Force Statistics Databases.1 2 http://dx.doi.org/10.1787/888933
AUSAUT
BEL
BRACAN
CHECHL
CHN CZE
DEUDNK
ESP
EST
FIN
FRA
GBR
GRC
HUN
IRL
ISL
ISRITA
JPNKOR
LUX
MEX
NLDNOR
NZLPOL
PRT
RUS
SVK
SVNSWE
TURUSA
ZAF
0
0.1
0.2
0.3
0.4
0.5
0.6
0.7
0.8
0.9
0 1 2 3 4 5 6 7 8 9 10 11 12 13 14 15 16 17 18 19 20 21 22 23 24 25Unemployment rate in 2010
Reform Responsiveness Indicator averaged over 2011-14
ECONOMIC POLICY REFORMS 2016: GOING FOR GROWTH INTERIM REPORT © OECD 201620

1. OVERVIEW OF STRUCTURAL REFORMS IN THE POLICY AREAS IDENTIFIED AS PRIORITIES FOR GROWTH
n. Full
323765
100
There is also notable heterogeneity in the responsiveness to Going for Growth
recommendations across the main policy areas. Among the reforms that boost employment,
the largest share of recommendations with actions implemented or in the process of
implementation is observed in the area of barriers to the labour force participation of
women, where action has focused on improving access to childcare services. On the other
hand, labour taxation, especially on low-wage earners, is the area where the share of fully
implemented recommendations is the highest. In the case of reforms that enhance labour
productivity, the area where most action has taken place is education, with an emphasis on
upgrading the contents of vocational training, improving teaching quality via revised
curriculum and new evaluation system, or increasing provision of early childhood education.
In contrast, relatively few actions have been taken in the areas of labour market regulation –
where more substantial actions had been seen during the past few years – as well as in the
area of innovation support and product market regulation (Figure 1.6).
Yet, the weak global economic prospect calls for a stronger and more broadly-based
reform efforts across countries, not least to improve confidence and prop up investment.The
case is particularly compelling for reforms that in addition to stimulate employment and
productivity can best support demand in the short term. Aside from a shift in the
composition of public spending towards infrastructure investment, this includes reductions
of barriers to firm entry in services sectors with pent-up demand as well as reforms in the
areas of housing market policies and job-search assistance that can facilitate geographic and
job mobility, thereby easing frictions in the reallocation of resources.
A welcome initiative promoting concerted actions to step up the intensity of reforms
across major economies has been launched in November 2014 by G20 governments, which
have committed to raise their collective GDP by 2018 by an additional 2% through an
Figure 1.6. Reform intensity has been highest in the areas of educationand of full-time labour force participation of women1
Share of implemented recommendations, percentage
1. The chart summarises the share of recommendations made in Going for Growth 2015 by the status of their implementatioimplementation refers to the adoption of relevant laws or equivalent measures.
1 2 http://dx.doi.org/10.1787/888933
0 10 20 30 40 50 60 70 80 90
R&D and innovation policy
Efficiency of public spending
Tax system-structure and efficiency
PMR, Trade and FDI
Human capital
Job protection legislation
Retirement/Disability system
ALMP/Unemployment Benefits
Tax system-Labour tax wedge
Policy barriers to female labour participation
Ref
orm
s en
hanc
ing
labo
urpr
oduc
tivity
Ref
orm
s en
hanc
ing
labo
urut
ilisat
ion
Fully implemented (adoption of relevant law etc.) In process of implementation Limited steps taken or no action
ECONOMIC POLICY REFORMS 2016: GOING FOR GROWTH INTERIM REPORT © OECD 2016 21
1. OVERVIEW OF STRUCTURAL REFORMS IN THE POLICY AREAS IDENTIFIED AS PRIORITIES FOR GROWTH
ambitious package of structural measures and macroeconomic policies (see Box 1.1). The
structural policies were assessed by the IMF and OECD as contributing more than 2% to G20
GDP by 2018 relative to the baseline if fully implemented. According to the joint
assessment by the International Monetary Fund, OECD and World Bank, G20 countries are
making progress towards implementing their commitments but more effort is needed for
the full and timely implementation that would be needed to meet the GDP objective.
Assessment of reform progress by country groupsThis section reviews the main challenges and actions taken by countries on priorities
identified in Going for Growth. For this purpose, the review of actions taken is organised
around groups of countries sharing similar challenges and priorities (Box 1.2).
Group 1: Countries with extremely high long-term and youth unemployment (Greece,Ireland, Italy, Portugal, Slovak Republic and Spain)
Those countries, particularly hard hit by the crisis, have seen a recovery in output
(with Greece being a notable exception) as a substantial reduction in unit labour costs
improved their competitiveness. However, their unemployment rate remains painfully
high, in particular the incidence of long-term and youth unemployment, which is the
Box 1.1. G20 Growth strategy and its implementation
In November 2014, the leaders of G20 countries agreed to “ambitious but realistic”policies with the aim to lift the G20’s collective GDP by at least 2% above the trajectoryimplied by the existing policies over the coming five years. All G20 countries submittedGrowth Strategies (GS) that consist of macroeconomic policies to stimulate demand in thenear term and structural reforms to lift employment and productivity through strongercompetition, trade, as well as public and private investment. A wide range of reforms inproduct and labour markets, investments in public infrastructure, tax reforms andinnovation policies were included in the GS.
This process brought a new level of ambition to global economic cooperation in this area.It was based on a clear quantitative target and backed up by specific and detailed reformcommitments. While the process is member-led and based on peer review, it has beensupported by analysis from international organisations including the OECD. This includedan initial assessment of the policy priorities, based in part on Going for Growth.
Many measures committed by G20 countries in their GS overlap with reform prioritiesrecommended in Going for Growth. Examples of such measures include regulatory reformsto reduce administrative burdens to business activities, increase spending on active labourmarket policies, vocational training and childcare service, and opening up service sectorsto foreign competition.
This process was also supported by a joint quantification exercise by the IMF and theOECD that estimated the impact of the specific policy commitments. This estimated thatthe full implementation of GS would raise the G20’s collective GDP by 2.1 per cent by 2018.
The OECD, together with the IMF and World Bank, is also supporting G20 countries totrack progress on the commitments and has provided a quantitative assessment of impactof measures implemented before the 2015 G20 Summit in Antalya, Turkey.
ECONOMIC POLICY REFORMS 2016: GOING FOR GROWTH INTERIM REPORT © OECD 201622

1. OVERVIEW OF STRUCTURAL REFORMS IN THE POLICY AREAS IDENTIFIED AS PRIORITIES FOR GROWTH
Box 1.2. Country grouping by common challenges
For the purpose of this review, countries are grouped according to the common nature ofthe most pressing challenges as identified in the 2015 issue of Going for Growth andsummarised here in the following set of tables. Challenges are examined at a level thatallows for groupings that are as meaningful as possible, though some degree ofarbitrariness remains inevitable. Many countries may be confronted with a similarchallenge such as, for instance, high and persistent unemployment. But beyond this broadchallenge, countries are also distinguished according to the more specific structuralfactors and policy weaknesses perceived to be contributing the most to that particularchallenge. The country groups are shown in the table below.
With many countries sharing a great deal of challenges, there are some “borderline”cases, i.e. countries that could legitimately belong to another group than the one assignedin this exercise. For instance, Finland has been grouped with Austria, Belgium, France,Luxembourg and Slovenia on the basis of challenges such as low labour force participationof older workers and persistently high unemployment. However, it could also be seen asbelonging to a group comprising mainly of Nordic countries.
Similarly, a few countries only share part of the characteristics on their group. Forexample, persistently high unemployment is not as big a concern in Austria as it is forother countries in the group. In fact, one country – Iceland – could not be fitted in anygroup and is not covered in the report. The European countries form four groups, whilethe rest of the OECD and BRIICS account for another four groups. The EU as such isnot considered as a country and not covered in this report, although it is givenrecommendations in the Going for Growth.
For further details on the identification and selection of reform areas as well as underlyingempirical literature, see past issues of Going for Growth.
Country Group Countries Main challenges Strengths
Group 1 Greece, Ireland, Italy, Portugal,Slovak Republic, Spain
Extremely high youth and long-termunemployment
Past labour market reforms improvedcost competitiveness
Group 2 Czech Republic, Estonia, Hungary,Israel, Poland, Latvia
Large productivity gap vis-à-visadvanced OECD countries
High cost competitiveness and strongmanufacturing base
Group 3 Denmark, the Netherlands, Norway,Sweden
Low average working hours and risksin housing markets
Highest productivity level amongthe OECD countries
Group 4 Austria, Belgium, Finland, France,Luxembourg, Slovenia
High unemployment and early exitfrom labour market
High productivity levels
Group 5 Australia, Canada, New Zealand,Switzerland, United Kingdoms,United States
Sluggish productivity growthand low return to KBC investment
Relatively flexible product and labourmarkets
Group 6 Germany, Japan, Korea Low productivity in services sectorsand limited full-time labourparticipation by women
Good manufacturing exportperformance and relatively lowunemployment
Group 7 Chile, China, Mexico,Russian Federation
Large productivity gap vis-à-visthe advanced OECD countries
Large room for catch-up and strongmanufacturing base or abundantnatural resources
Group 8 Turkey, Brazil, Colombia, Indonesia,India, South Africa
High labour informality, infrastructureshortages and low educationalattainments
Large room for catch-up and highpopulation growth
ECONOMIC POLICY REFORMS 2016: GOING FOR GROWTH INTERIM REPORT © OECD 2016 23

1. OVERVIEW OF STRUCTURAL REFORMS IN THE POLICY AREAS IDENTIFIED AS PRIORITIES FOR GROWTH
high
323779
0
10
20
30
40
50
60
70
80
JPN
highest among OECD countries (Figure 1.7). Such high long-term unemployment
undermines long-run growth through skills erosion and reduces the prospect of career
building and social mobility for affected youth, with the risk of a further widening of
income inequality (OECD, 2015c).
Addressing youth and long-term unemployment requires the mobilisation of a broad range of policies…
The most pressing agenda for these countries is to mobilise a broad range of policies
to improve job opportunities for the unemployed and to facilitate their return to work.
Furthermore, reforms that raise productivity must be pursued to ensure mid- to long-term
recovery in output and employment. All countries in this group should extend and improve
the effectiveness of active labour market policies (ALMPs), in particular those related to
job-search assistance, training programmes and hiring subsidies. Resources allocated to
ALMPs in comparison to the caseloads are well below OECD average in those countries.
Recent policy actions in this area include:
● As the part of the Jobs Act, Italy has established the Active Labour Market Policies Agency
(Agenzia Nazionale per le Politiche Attive del Lavoro or ANPAL) that coordinates ALMPs
implemented by local authorities and those by the authority of the Ministry of Labour.
Measures to ensure more effective monitoring and evaluation of ALMPs are also in
the pipeline.
● Portugal launched in April 2015 the 43 million Euro programme “Reactivar” that seeks to
improve job prospects for the long-term unemployed over 30 years of age by financing
internships in the private sector during six months.
● The Slovak Republic implemented subsidies to support the first jobs for youth under 29.
Furthermore, it is engaging in several reforms to enhance the effectiveness of ALMPs such
as establishing a first point contact in Public Employment Services that allows more
individualised job-search support or reallocation of labour officers in order to reduce the
caseload per officer by half.
Figure 1.7. Youth unemployment rate and the share of long-term unemployed remain veryPercentage, 20141
1. Data for long-term unemployment for Korea refer to 2013.Source: OECD, Labour Force Statistics Database.
1 2 http://dx.doi.org/10.1787/888933
0
10
20
30
40
50
60
70
80
ESP
GR
C
ITA
PRT
SVK
IRL
EU POL
FRA
BEL
SWE
LUX
HU
N
SVN
OEC
D
FIN
TUR
CH
L
GBR CZE NZL
EST
CAN USA
AUS
NLD
DN
K
ISR
AUT
KOR
ISL
MEX
CH
E
DEU
NO
R
Youth unemployment rate (15-24) Long-term unemployment rate (% of total unemployed)
ECONOMIC POLICY REFORMS 2016: GOING FOR GROWTH INTERIM REPORT © OECD 201624

1. OVERVIEW OF STRUCTURAL REFORMS IN THE POLICY AREAS IDENTIFIED AS PRIORITIES FOR GROWTH
● Spain launched a new activation programme targeted at the long-term unemployed. It
also introduced a reform of vocational training programmes that focuses on the specific
needs of firms, while opening to competition the provision of training programs. The
quality control of activation measures were also strengthened.
Other important labour market reforms recommended to those countries would
enhance the effectiveness of ALMPs. They include expanding the coverage of
unemployment benefits to workers not covered (Greece, Italy and Portugal), narrowing the
gap in job protection between regular and non-regular workers (Italy and Spain) and
increasing the flexibility of wage formation by reducing further the administrative
extension of sectorial bargaining (Portugal and Spain). These countries have been quite
active in those areas in recent years: notably Spain and Portugal have been engaging in
reforms of employment protection and wage bargaining systems (OECD, 2014a and 2014b).
Most recently, Italy introduced a new employment contract with a less costly dismissal
procedure, along with the new social insurance for employment extending its coverage
while making benefits conditional on participation in active labour market programmes.
… together with reforms that increase educational attainment and employabilityof youth.
Raising graduation rates from higher education – while ensuring that the skills
acquired better match labour market needs – will also improve youth employment
prospects and long-run productivity growth. Common priorities include raising the quality
of compulsory education and tertiary education by improving autonomy and
accountability of schools and universities. A particularly important related reform is to
increase the provision of vocational education and training (VET) with a better curriculum
and participation of employers and, beyond schooling, to improve access to job-related
training.
Recent policy actions in this area include:
● In Spain, the reform of vocational training programmes mentioned above provides
life-long training opportunities for employed workers.
● The Slovak Republic introduced a new funding system for secondary vocational schools
which allocates funds according to the performance of students in the labour market.
Reducing administrative burdens and entry barriers to specific sector would contribute to job creation and competitiveness
Reducing the regulatory barriers to entry as well as the compliance costs associated
with complex regulations can stimulate business expansion and job creation. The
employment gains can be particularly rapid in industries with large pent-up demand and
low entry costs (such as some professional services) (See Chapter 2). Stronger competition
also fosters the reallocation of jobs from lower- to higher-productivity firms within sectors,
thereby improving the allocation of skills (OECD, 2015b; Adalet McGowan and
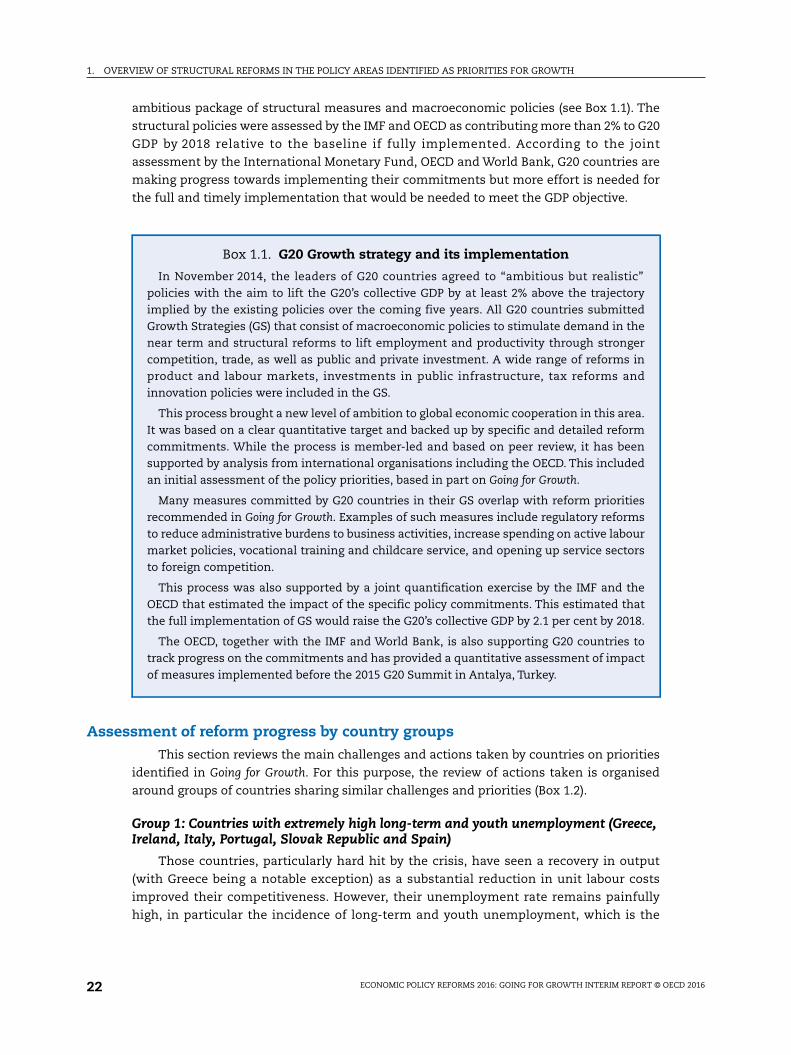
Andrews, 2015). The productivity gain expected from improving the matching between
workers’ skills and the skills level required for their job is particularly large in some of
these countries (Figure 1.8). Stronger product market competition would also facilitate
labour market reforms (Blanchard and Giavazzi, 2003). This allows for lower unit labour
costs which translate into lower prices, improving competitiveness as well as real wages in
these countries.
ECONOMIC POLICY REFORMS 2016: GOING FOR GROWTH INTERIM REPORT © OECD 2016 25

1. OVERVIEW OF STRUCTURAL REFORMS IN THE POLICY AREAS IDENTIFIED AS PRIORITIES FOR GROWTH
Table 1.1. Reform priorities for countries with high long-termand youth unemployment
GRE IRL ITA PRT SVK ESP
R1 A1 R A R A R A R A R A
Unemployment benefits/social protection and ALMPs
Make UB conditional on work availability and job-searchcriteria/reinforce activation
✓ •
Taper UB along duration/reduce age-bias in UB/reduceprogressively the combined generosity of UB and othersocial benefits (i.e. reduce spikes in marginal effectivetax rates)
✓ ✓
Expand the coverage or level of UB/social protectionand social services
✓ ✓ • ✓
Strengthen resources for job-search assistanceand training whilst improving targeting of ALMPs
✓ ✓ ✓ • ✓ • ✓ • ✓ •
Focus on well-targeted training programs/requalification ✓ ✓ ✓ ✓ • ✓ •Strengthen monitoring and evaluation of PES ✓ ✓ • ✓ ✓
Job protection
Ease EPL on regular workers to narrow the gap with respectto non-regular workers and tackle labour market duality
✓ • ✓
Minimum wages and wage bargaining systemsReduce or eliminate administrative extensionof collective wage agreements
✓ ✓
Human capital
Early childhood educationExpand access to quality childcare and early education/improve targeting
✓ • ✓ •
Primary and secondary educationImprove curricula and evaluation ✓ ✓ •Other recommendations (reduce dropout, reduceinequality in educational outcomes and opportunities)
✓ ✓
Tertiary educationIncrease university autonomy and accountabilityor specialisation by institutions
✓ ✓ ✓
Introduce/raise tuition fees flanked by income-contingentloans/mean-tested grants, Improve targetingof means-tested financial assistance
✓ ✓ ✓
Expand access to and effectiveness of apprenticeshipsand VET and their relevance to labour market needs
✓ ✓ ✓ • ✓ •
Expand access to and effectiveness of lifelong/job-relatededucation and training
✓ ✓ ✓ •
Reduce economy-wide regulatory burdens
Reduce administrative burden on start-ups/complexityof regulatory procedure
✓ ✓ ✓ • ✓ •
Reduce the scope of public ownership/state intervention ✓ • ✓ ✓
Ease business exit/bankruptcy procedures ✓ •
Reduce sector-specific regulatory burdensNetwork sectors (energy, transport, telecoms) ✓ ✓ ✓ ✓ •Retail trade and professional services ✓ ✓ • ✓ ✓ ✓
R&D and innovation
Increase public support/Improve targeting of publicsupport/evaluate grant programs
✓ ✓ •
Increase and/or reform indirect R&D support –tax incentives, seek balance between directand indirect support
✓ ✓ •
Strengthen collaboration between research centres/universities and industry
✓ ✓ ✓ •
1. R stands for recommendation in that area, A stands for any actions that are implemented or in the processof implementation.
ECONOMIC POLICY REFORMS 2016: GOING FOR GROWTH INTERIM REPORT © OECD 201626
1. OVERVIEW OF STRUCTURAL REFORMS IN THE POLICY AREAS IDENTIFIED AS PRIORITIES FOR GROWTH
y froms using
, OECD
323785
0
2
4
6
8
10
12
14
16
Recent policy actions taken in this area include:
● Ireland introduced the Legal Service Regulation Bill which would establish an
independent regulator for the legal profession.
● Italy introduced relevant decrees aimed at improving the efficiency in the civil courts
and at streamlining bankruptcy procedures.
● Spain is implementing the Market Unity Law that addresses internal market fragmentation
for product and service markets and simplifies business licencing and other administrative
burdens. It also took steps to liberalise passenger transport in railways.
Group 2: Countries with a large labour productivity gap vis-à-vis OECD average(Czech Republic, Estonia, Hungary, Israel, Poland and Latvia)
Those countries have most recently enjoyed relatively strong growth led by household
consumption and exports. They also benefit from strong trade linkages with more
advanced European economies, in particular in the case of the Czech Republic, Slovak
Republic and Hungary, which are deeply integrated into their global value chains. Israel
boasts a competitive and innovation-intensive manufacturing sector. However, the gap in
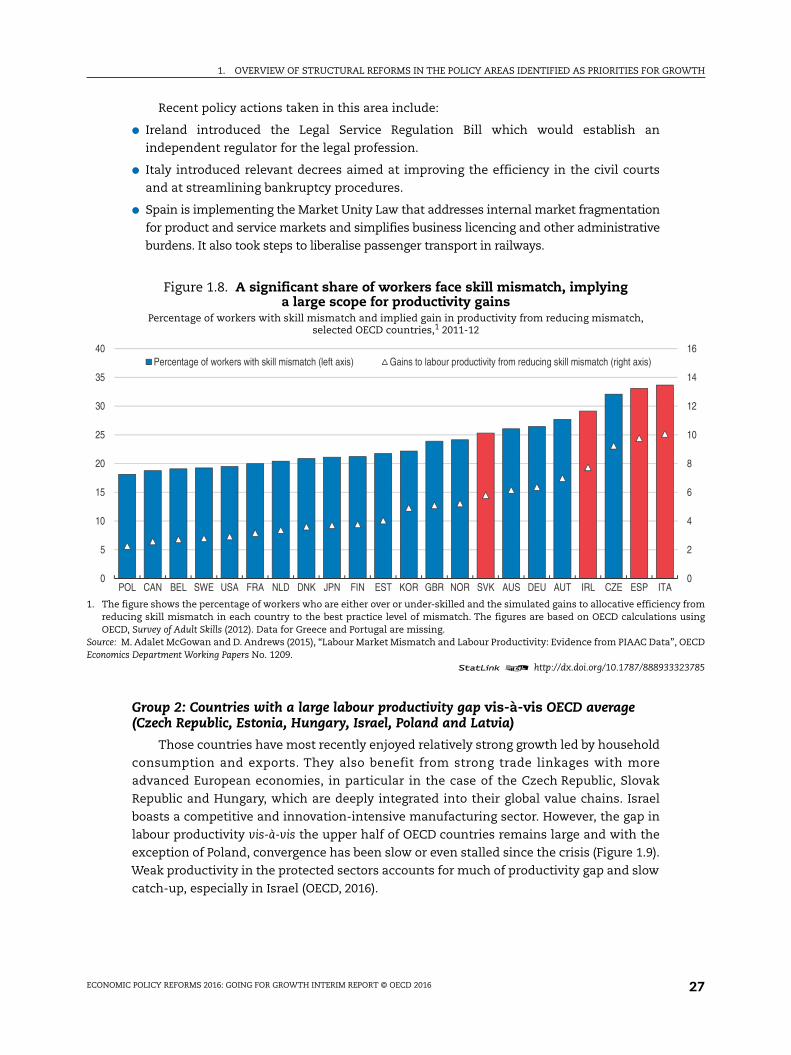
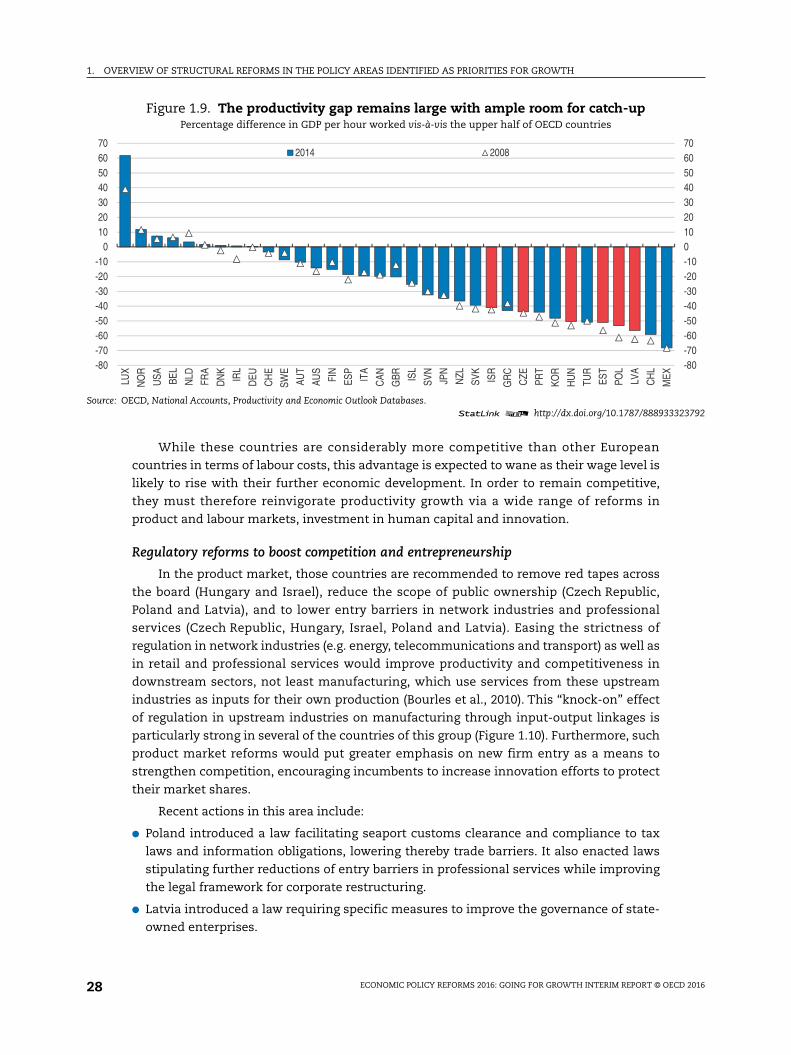
labour productivity vis-à-vis the upper half of OECD countries remains large and with the
exception of Poland, convergence has been slow or even stalled since the crisis (Figure 1.9).
Weak productivity in the protected sectors accounts for much of productivity gap and slow
catch-up, especially in Israel (OECD, 2016).
Figure 1.8. A significant share of workers face skill mismatch, implyinga large scope for productivity gains
Percentage of workers with skill mismatch and implied gain in productivity from reducing mismatch,selected OECD countries,1 2011-12
1. The figure shows the percentage of workers who are either over or under-skilled and the simulated gains to allocative efficiencreducing skill mismatch in each country to the best practice level of mismatch. The figures are based on OECD calculationOECD, Survey of Adult Skills (2012). Data for Greece and Portugal are missing.
Source: M. Adalet McGowan and D. Andrews (2015), “Labour Market Mismatch and Labour Productivity: Evidence from PIAAC Data”Economics Department Working Papers No. 1209.
1 2 http://dx.doi.org/10.1787/888933
0
5
10
15
20
25
30
35
40
POL CAN BEL SWE USA FRA NLD DNK JPN FIN EST KOR GBR NOR SVK AUS DEU AUT IRL CZE ESP ITA
Percentage of workers with skill mismatch (left axis) Gains to labour productivity from reducing skill mismatch (right axis)
ECONOMIC POLICY REFORMS 2016: GOING FOR GROWTH INTERIM REPORT © OECD 2016 27
1. OVERVIEW OF STRUCTURAL REFORMS IN THE POLICY AREAS IDENTIFIED AS PRIORITIES FOR GROWTH
323792
-80-70-60-50-40-30-20-10010203040506070
While these countries are considerably more competitive than other European
countries in terms of labour costs, this advantage is expected to wane as their wage level is
likely to rise with their further economic development. In order to remain competitive,
they must therefore reinvigorate productivity growth via a wide range of reforms in
product and labour markets, investment in human capital and innovation.
Regulatory reforms to boost competition and entrepreneurship
In the product market, those countries are recommended to remove red tapes across
the board (Hungary and Israel), reduce the scope of public ownership (Czech Republic,
Poland and Latvia), and to lower entry barriers in network industries and professional
services (Czech Republic, Hungary, Israel, Poland and Latvia). Easing the strictness of
regulation in network industries (e.g. energy, telecommunications and transport) as well as
in retail and professional services would improve productivity and competitiveness in
downstream sectors, not least manufacturing, which use services from these upstream
industries as inputs for their own production (Bourles et al., 2010). This “knock-on” effect
of regulation in upstream industries on manufacturing through input-output linkages is
particularly strong in several of the countries of this group (Figure 1.10). Furthermore, such
product market reforms would put greater emphasis on new firm entry as a means to
strengthen competition, encouraging incumbents to increase innovation efforts to protect
their market shares.
Recent actions in this area include:
● Poland introduced a law facilitating seaport customs clearance and compliance to tax
laws and information obligations, lowering thereby trade barriers. It also enacted laws
stipulating further reductions of entry barriers in professional services while improving
the legal framework for corporate restructuring.
● Latvia introduced a law requiring specific measures to improve the governance of state-
owned enterprises.
Figure 1.9. The productivity gap remains large with ample room for catch-upPercentage difference in GDP per hour worked vis-à-vis the upper half of OECD countries
Source: OECD, National Accounts, Productivity and Economic Outlook Databases.1 2 http://dx.doi.org/10.1787/888933
-80-70-60-50-40-30-20-10
010203040506070
LUX
NO
R
USA BE
L
NLD
FRA
DN
K
IRL
DEU
CH
E
SWE
AUT
AUS
FIN
ESP
ITA
CAN
GBR IS
L
SVN
JPN
NZL
SVK
ISR
GR
C
CZE
PRT
KOR
HU
N
TUR
EST
POL
LVA
CH
L
MEX
2014 2008
ECONOMIC POLICY REFORMS 2016: GOING FOR GROWTH INTERIM REPORT © OECD 201628

1. OVERVIEW OF STRUCTURAL REFORMS IN THE POLICY AREAS IDENTIFIED AS PRIORITIES FOR GROWTH
ces, onoutputtakes a
Papers,
323807
0.00
0.01
0.02
0.03
0.04
0.05
0.06
0.07
0.08
0.09
0.10
0.11
0.12
0.13
0.14
Higher investment in human capital and innovation capability
Ensuring a sufficient supply of skilled workers is essential for these countries to retain
and upgrade their comparative advantage in manufacturing. Raising the quality of tertiary
education and vocational education and training (VET) is of particular importance in
smooth school-to-work transition and skills development.
Recent policy actions in this area include:
● The Czech Republic made an amendment to the Higher Education Act, aimed at
increasing the quality of higher education by reforming the accreditation of institution
and study programmes.
● Estonia approved a law introducing quality standards and increasing the visibility of
adult training. A system for labour market monitoring and forecasting will be
operational in 2016. It also introduced a new grant system for university students which
offers flexible conditions and strengthened support to students of poor socio-economic
background.
● In Hungary, the transition from secondary to upper-secondary vocational school has
been facilitated and the share of practice-oriented training in VET programmes has been
increased.
● Poland implemented measures to engage employers to provide more workplace training
for secondary vocational education, such as an obligation for vocational university
programmes to contain at least a three-month apprenticeship or for companies
operating in special economic zones to collaborate with schools to develop their
educational programmes.
Figure 1.10. Regulations in non-manufacturing sector have significant impacton the manufacturing sector
The indicator of regulatory impact on manufacturing sector,1 index scale from 0 to 1, 2013
1. The figure compares the impact of regulation in upstream network industries (ETCR) as well as in retail and professional servimanufacturing sector. The impact indicator is computed using the 2013 definition of PMR indicator and domestic input-coefficients (except that of Korea which uses US input-output coefficient) and normalised across countries as an index thatvalue between 0 (minimum value across observations) and 1 (maximum value). Data for Latvia are missing.
Source: Égert and Wanner (2015), “The Regulatory Impact Indicator: the 2013 Vintage”, OECD Economic Department Workingforthcoming.
1 2 http://dx.doi.org/10.1787/888933
0.00
0.01
0.02
0.03
0.04
0.05
0.06
0.07
0.08
0.09
0.10
0.11
0.12
0.13
0.14
GBR AU
S
DN
K
NLD
SWE
KOR
CAN
CH
E
JPN
CH
L
MEX
NO
R
IRL
NZL
SVN
ISR
DEU FI
N
AUT
PRT
CZE
ESP
SVK
GR
C
HU
N
EST
FRA
ITA
TUR
POL
LUX
BEL
ECONOMIC POLICY REFORMS 2016: GOING FOR GROWTH INTERIM REPORT © OECD 2016 29

1. OVERVIEW OF STRUCTURAL REFORMS IN THE POLICY AREAS IDENTIFIED AS PRIORITIES FOR GROWTH
tries
rmany,; 2011
efined
323813
0.0
0.5
1.0
1.5
2.0
2.5
3.0
3.5
With the notable exception of Israel, the intensity of business-based R&D in those
countries remains below the level in advanced OECD countries (Figure 1.11). An increase in
investment in innovation, especially in the ICT sector that often experiences high
productivity growth and acts as an input driving productivity growth in other sector, would
strengthen their competitiveness in the medium- to long-run. While a better targeting of
R&D support and a stronger university-industry linkage would enhance the effectiveness
of innovation system in those countries, significant actions have not yet been observed in
area of innovation policy.
Growth-friendly tax reform that reduces the labour tax wedge would enhance employment
Those countries also share persistently high long-term unemployment that is partly
due to the high labour tax wedge discouraging the return to work. They are thus
recommended to reduce the burden of labour income taxation by relying more on less
distortive taxes such as VAT, environmental and immovable property taxation. Recent
policy actions in this area are:
● Estonia raised the level of tax-free allowance and will allow low-income full-time
workers to apply for a tax rebate from 2017. At the same time, taxes on alcohol, fuel and
gas are to be raised.
● Hungary approved a legislation that reduces its flat income tax rate from 16% to 15%
from 2016.
● Poland reformed the fragmented tax and social security regimes across different labour
contracts by a law that makes all civil law contracts subject to the same social security
contributions up to the minimum wage.
Figure 1.11. The intensity of business-based R&D is low compared to advanced OECD counBusiness based R&D as a percentage of GDP,1 2013
1. BERD refer to Business expenditure on R&D. Data refer to 2012 for Czech Republic, Denmark, Estonia, Finland, France, GeHungary, Israel, Italy, the Netherlands, Norway, Poland, Portugal, Romania, Slovenia, Spain Switzerland and the United Kingdomfor Australia, Austria, Belgium, Greece, Iceland, Ireland, Mexico, New Zealand and the United States. The ICT sector is daccording to the OECD ICT sector definition based on ISIC Rev.4. Data for Latvia are missing.
Source: OECD (2015), OECD Digital Economy Outlook 2015, OECD Publishing, Paris.1 2 http://dx.doi.org/10.1787/888933
0.0
0.5
1.0
1.5
2.0
2.5
3.0
3.5
ISR
KOR
JPN
FIN
SWE
CH
E
DN
K
DEU SV
N
USA AU
T
CH
N
BEL
FRA
ISL
EST
AUS
NLD IR
L
GBR CZE
NO
R
HU
N
CAN IT
A
PRT
ESP
NZL
TUR
SVK
POL
GR
C
MEX
ICT BERD Rest of BERD
ECONOMIC POLICY REFORMS 2016: GOING FOR GROWTH INTERIM REPORT © OECD 201630
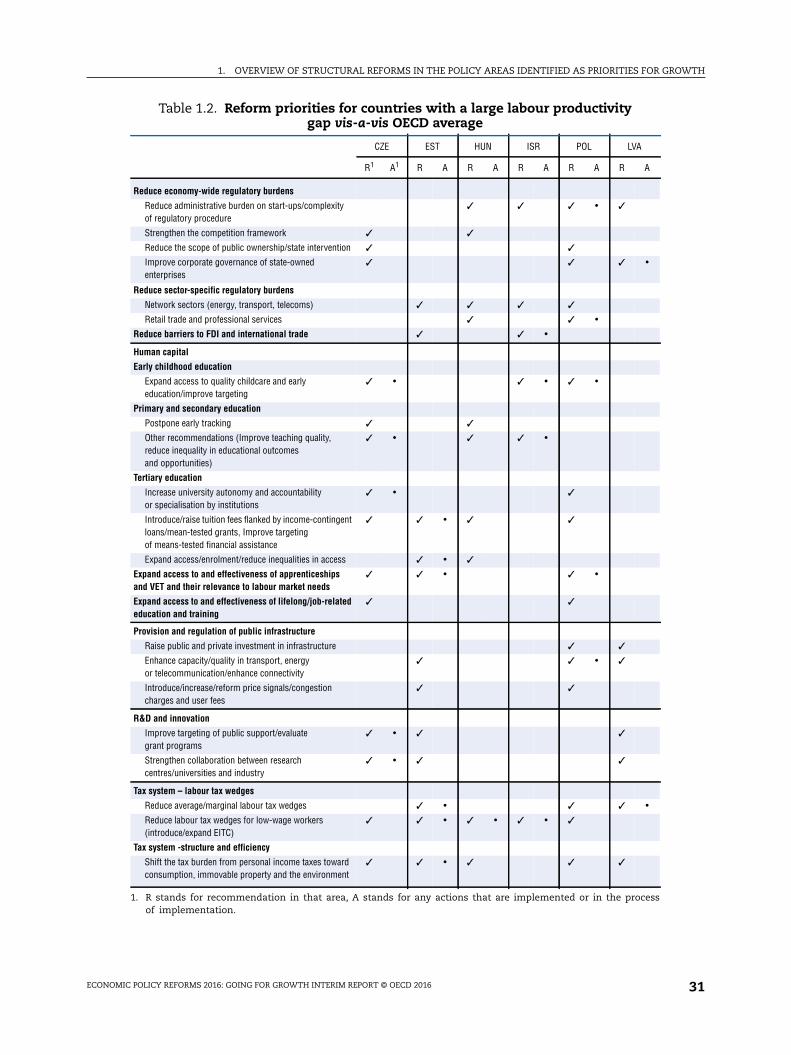
1. OVERVIEW OF STRUCTURAL REFORMS IN THE POLICY AREAS IDENTIFIED AS PRIORITIES FOR GROWTH
Table 1.2. Reform priorities for countries with a large labour productivitygap vis-a-vis OECD average
CZE EST HUN ISR POL LVA
R1 A1 R A R A R A R A R A
Reduce economy-wide regulatory burdens
Reduce administrative burden on start-ups/complexityof regulatory procedure
✓ ✓ ✓ • ✓
Strengthen the competition framework ✓ ✓
Reduce the scope of public ownership/state intervention ✓ ✓
Improve corporate governance of state-ownedenterprises
✓ ✓ ✓ •
Reduce sector-specific regulatory burdens
Network sectors (energy, transport, telecoms) ✓ ✓ ✓ ✓
Retail trade and professional services ✓ ✓ •
Reduce barriers to FDI and international trade ✓ ✓ •
Human capital
Early childhood education
Expand access to quality childcare and earlyeducation/improve targeting
✓ • ✓ • ✓ •
Primary and secondary education
Postpone early tracking ✓ ✓
Other recommendations (Improve teaching quality,reduce inequality in educational outcomesand opportunities)
✓ • ✓ ✓ •
Tertiary education
Increase university autonomy and accountabilityor specialisation by institutions
✓ • ✓
Introduce/raise tuition fees flanked by income-contingentloans/mean-tested grants, Improve targetingof means-tested financial assistance
✓ ✓ • ✓ ✓
Expand access/enrolment/reduce inequalities in access ✓ • ✓
Expand access to and effectiveness of apprenticeshipsand VET and their relevance to labour market needs
✓ ✓ • ✓ •
Expand access to and effectiveness of lifelong/job-relatededucation and training
✓ ✓
Provision and regulation of public infrastructure
Raise public and private investment in infrastructure ✓ ✓
Enhance capacity/quality in transport, energyor telecommunication/enhance connectivity
✓ ✓ • ✓
Introduce/increase/reform price signals/congestioncharges and user fees
✓ ✓
R&D and innovation
Improve targeting of public support/evaluategrant programs
✓ • ✓ ✓
Strengthen collaboration between researchcentres/universities and industry
✓ • ✓ ✓
Tax system – labour tax wedges
Reduce average/marginal labour tax wedges ✓ • ✓ ✓ •
Reduce labour tax wedges for low-wage workers(introduce/expand EITC)
✓ ✓ • ✓ • ✓ • ✓
Tax system -structure and efficiency
Shift the tax burden from personal income taxes towardconsumption, immovable property and the environment
✓ ✓ • ✓ ✓ ✓
1. R stands for recommendation in that area, A stands for any actions that are implemented or in the processof implementation.
ECONOMIC POLICY REFORMS 2016: GOING FOR GROWTH INTERIM REPORT © OECD 2016 31

1. OVERVIEW OF STRUCTURAL REFORMS IN THE POLICY AREAS IDENTIFIED AS PRIORITIES FOR GROWTH
ries
mmes013 for007 forrlands;
indings
323821
0
1
2
3
4
5
6
7
8
9
10
11
12
13
MEX
Group 3: Countries with low working hours and housing market distortions(Denmark, the Netherlands, Norway and Sweden)
These countries enjoy the highest labour productivity among OECD countries and
also a relatively high employment rate thanks to strong labour force participation of
women. However, their average working hours remain substantially below the OECD
average and a relatively high share of working-age population are receiving disability
benefits compared to other OECD countries (Figure 1.12). These indicate further room to
improve labour resource utilisation. Therefore, the reform priority for these countries is to
reduce the policy disincentives to work longer hours and to remain in the labour force,
namely the high tax burden on labour and the generous sickness and disability benefit
system.
Making work pay more while preventing early withdrawal from labour market
Countries in this group are recommended to reduce the relatively high corporate and
labour income tax rates by shifting the tax burden to property and indirect taxation, such
as value-added tax (VAT), and also to remove tax expenditure on owner-occupied housing.
The high marginal tax wedge on labour income is hindering the work incentives of low-
income households and second-income earners in the Netherlands, while it is
discouraging above-average income earners to work longer hours in Sweden
(OECD, 2015d). As an example of recent actions in this area, Norway has increased the tax
value of secondary homes to 80% of market value and has streamlined tax expenditures
while reducing the income tax rates in a step-wise manner.
Figure 1.12. The share of disability benefit recipients is among the highest in OECD countPercentage of population aged 20-64 years old receiving disability benefits1
1. Disability benefits include benefits received from schemes to which beneficiaries have paid contributions (contributory), prografinanced by general taxation (non-contributory) and work injury schemes. The last available year is 2014 for Estonia; 2Australia, Czech Republic, Finland and the United States; 2010 for Spain; 2009 for Mexico; 2008 for Austria, Japan and Korea; 2Canada and France; 2005 for Luxembourg. For 2000, data refer to 2004 for Poland; 2003 for Japan and Mexico; 2002 for the Nethe2001 for Ireland.
Source: Secretariat updates of figures published in OECD (2010), Sickness, Disability and Work: Breaking the Barriers: A Synthesis of Facross OECD Countries, OECD Publishing, Paris.
1 2 http://dx.doi.org/10.1787/888933
0
1
2
3
4
5
6
7
8
9
10
11
12
13
EST
NO
R
SVN
HU
N
NLD FI
N
ISL
DN
K
SWE
USA
GBR BE
L
CZE
SVK
IRL
ITA
POL
AUS
ISR
LUX
FRA
DEU
CH
E
AUT
CAN PR
T
ESP
NZL JPN
KOR
2012 2000
ECONOMIC POLICY REFORMS 2016: GOING FOR GROWTH INTERIM REPORT © OECD 201632
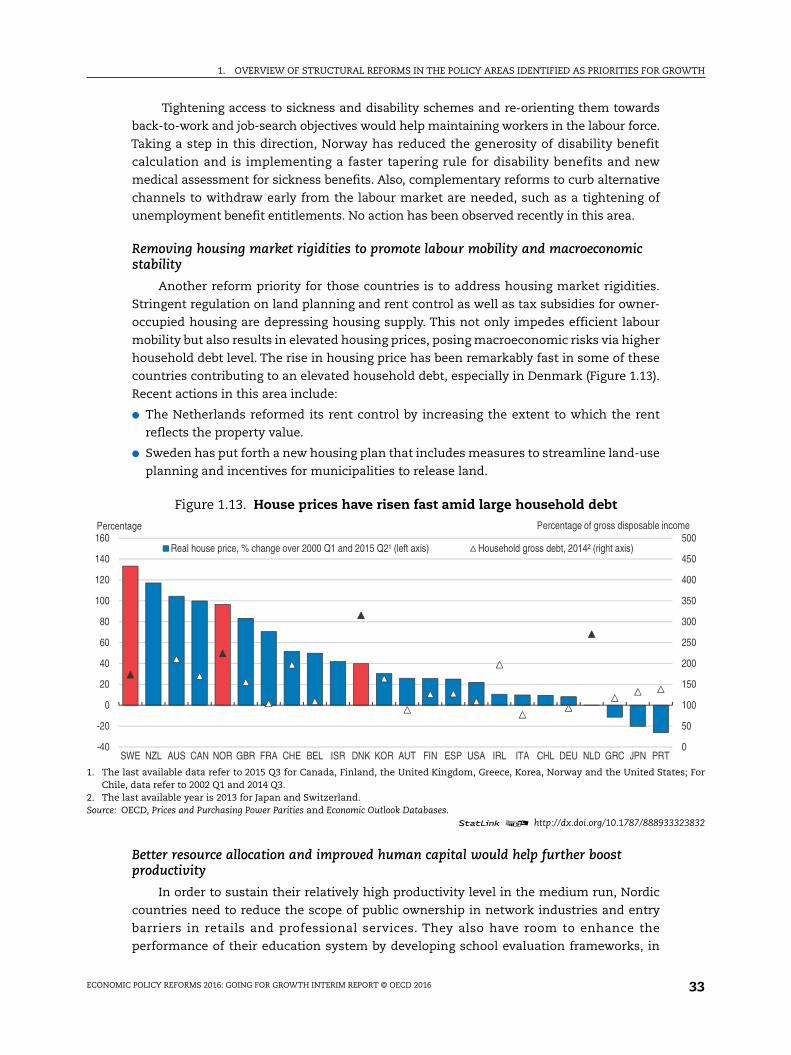
1. OVERVIEW OF STRUCTURAL REFORMS IN THE POLICY AREAS IDENTIFIED AS PRIORITIES FOR GROWTH
es; For
323832
0
50
100
150
200
250
300
350
400
450
500ome
Tightening access to sickness and disability schemes and re-orienting them towards
back-to-work and job-search objectives would help maintaining workers in the labour force.
Taking a step in this direction, Norway has reduced the generosity of disability benefit
calculation and is implementing a faster tapering rule for disability benefits and new
medical assessment for sickness benefits. Also, complementary reforms to curb alternative
channels to withdraw early from the labour market are needed, such as a tightening of
unemployment benefit entitlements. No action has been observed recently in this area.
Removing housing market rigidities to promote labour mobility and macroeconomic stability
Another reform priority for those countries is to address housing market rigidities.
Stringent regulation on land planning and rent control as well as tax subsidies for owner-
occupied housing are depressing housing supply. This not only impedes efficient labour
mobility but also results in elevated housing prices, posing macroeconomic risks via higher
household debt level. The rise in housing price has been remarkably fast in some of these
countries contributing to an elevated household debt, especially in Denmark (Figure 1.13).
Recent actions in this area include:
● The Netherlands reformed its rent control by increasing the extent to which the rent
reflects the property value.
● Sweden has put forth a new housing plan that includes measures to streamline land-use
planning and incentives for municipalities to release land.
Better resource allocation and improved human capital would help further boost productivity
In order to sustain their relatively high productivity level in the medium run, Nordic
countries need to reduce the scope of public ownership in network industries and entry
barriers in retails and professional services. They also have room to enhance the
performance of their education system by developing school evaluation frameworks, in
Figure 1.13. House prices have risen fast amid large household debt
1. The last available data refer to 2015 Q3 for Canada, Finland, the United Kingdom, Greece, Korea, Norway and the United StatChile, data refer to 2002 Q1 and 2014 Q3.
2. The last available year is 2013 for Japan and Switzerland.Source: OECD, Prices and Purchasing Power Parities and Economic Outlook Databases.
1 2 http://dx.doi.org/10.1787/888933
-40
-20
0
20
40
60
80
100
120
140
160
SWE NZL AUS CAN NOR GBR FRA CHE BEL ISR DNK KOR AUT FIN ESP USA IRL ITA CHL DEU NLD GRC JPN PRT
Percentage
Real house price, % change over 2000 Q1 and 2015 Q2¹ (left axis) Household gross debt, 2014² (right axis)
Percentage of gross disposable inc
ECONOMIC POLICY REFORMS 2016: GOING FOR GROWTH INTERIM REPORT © OECD 2016 33

1. OVERVIEW OF STRUCTURAL REFORMS IN THE POLICY AREAS IDENTIFIED AS PRIORITIES FOR GROWTH
particular by improving teacher quality and strengthening vocational education and
training. Norway and Sweden have increased budget resources to raise teacher
qualification and salaries. The Netherlands and Sweden are recommended to reduce the
strictness of employment protection of regular workers, which would improve productivity
by enhancing the allocation of labour resource.
Table 1.3. Reform priorities for countries with low working hoursand housing market distortions
DNK NLD NOR SWE
R1 A1 R A R A R A
Unemployment benefits/social protection and ALMPs
Make UB conditional on work availability and job-search criteria/reinforce activation
✓
Retirement and disability policies
Phase out early retirement pathways(via disability or unemployment)
✓
Review criteria to disability benefits, improve monitoringand integration with ALMPs
✓ ✓ ✓ • ✓
Job protection
Ease EPL on regular workers (shorten judicial procedure, reduceseverance pay), narrow the gap with respect to non-regularworkers and tackle labour market duality
✓ ✓
Ease conditions for justified individual or collective dismissals ✓ • ✓
Tax system – labour tax wedges
Reduce labour tax wedges ✓ ✓ • ✓
Tax system -structure and efficiency
Shift the tax burden from personal income taxes towardconsumption, immovable property and the environment
✓ ✓
Broaden the tax base – reduce tax expenditures/subsidies ✓ ✓ ✓ • ✓
Housing/Planning/Zoning policies and regulations
Remove obstacles to the expansion of a private residentialmarket/reduce rent regulation
✓ ✓ • ✓
Improve targeting or reduce the use of housing subsidies/improvetargeting in the provision of social housing
✓ ✓ •
Reduce/eliminate preferential tax treatment for housinginvestment/reform property taxation
✓ ✓ • ✓
Loosen/reform land, zoning and planning restrictions ✓ • ✓ ✓
Reduce economy-wide regulatory burdens
Reduce the scope of public ownership/state intervention ✓ • ✓
Reduce sector-specific regulatory burdens
Network sectors (energy, transport, telecoms) ✓ • ✓
Retail trade and professional services ✓ •
Human capital
Primary and secondary education
Improve teaching quality/improve incentives for talented teachers(especially to work in difficult schools)
✓ • ✓ •
Improve incentives to secondary education completion/focuson reduce dropout
✓ ✓ •
Expand access to and effectiveness of apprenticeshipsand VET and their relevance to labour market needs
✓ ✓
Expand access to and effectiveness of lifelong/job-relatededucation and training
✓
1. R stands for recommendation in that area, “A” stands for any actions that are implemented or in the processof implementation.
ECONOMIC POLICY REFORMS 2016: GOING FOR GROWTH INTERIM REPORT © OECD 201634

1. OVERVIEW OF STRUCTURAL REFORMS IN THE POLICY AREAS IDENTIFIED AS PRIORITIES FOR GROWTH
s totallation.
323847
-40
-30
-20
-10
0
10
20
30
40
50
60
Group 4: Countries with high structural unemployment and/or low participationof older workers (Austria, Belgium, Finland, France, Luxembourg and Slovenia)
The countries in this group are also enjoying levels of productivity that are among the
highest within OECD countries (Slovenia being an exception), but their unemployment
rates remain considerably above pre-crisis levels (except Austria), which along with low
labour force participation rates and low average working hours, contribute to low overall
labour resource utilisation (Figure 1.14). To a large extent, the low labour force participation
rate reflects the early exit of older workers from labour markets.
An important reform agenda for those countries is to boost employment by reducing
the institutional disincentives to labour embedded in the unemployment benefits and
pension systems. To ensure that reforms enhancing labour supply result in increased
employment, measures to remove impediments to job creation are also advocated, such as
lowering tax wedges for low-income earners and reducing entry barriers to industries with
strong potential growth.
Institutional disincentives to job search and labour supply should be removed
In order to encourage more intensive job search, these countries are recommended to
reduce the generosity of unemployment benefits as the duration of the spell lengthens and
to activate job-search assistance and conditions at an earlier stage of the spell.
Furthermore, they also need to reduce labour tax wedges, which are among the highest in
OECD countries, and are particularly reducing job opportunities and incentives to take-up
work for low-income earners.
Figure 1.14. Shorter average hours worked and lower employment rates reduceoverall labour utilisation
Percentage difference in labour utilisation1 vis-à-vis the upper half of OECD countries, 2014
1. Employment rate is measured as total number of employed divided by working-age population. Hours worked are measured anumber of hours worked per employed. Working-age population is measured as working-age population divided by total popuThe total of the three components is not equal to labour resource utilisation since the decomposition is multiplicative.
Source: OECD, National Accounts, Productivity, Employment Outlook and Economic Outlook Databases.1 2 http://dx.doi.org/10.1787/888933
-40
-30
-20
-10
0
10
20
30
40
50
60
KOR
CH
E
ISL
MEX NZL ISR
JPN
CH
L
CAN PO
L
EST
CZE LU
X
AUS
AUT
PRT
USA
OEC
D
HU
N
SWE
GBR
GR
C
IRL
SVK
FIN
NO
R
NLD
DEU
DN
K
SVN EU ITA
ESP
TUR
BEL
FRA
Hours worked Employment rate Working age population Total
ECONOMIC POLICY REFORMS 2016: GOING FOR GROWTH INTERIM REPORT © OECD 2016 35

1. OVERVIEW OF STRUCTURAL REFORMS IN THE POLICY AREAS IDENTIFIED AS PRIORITIES FOR GROWTH
Recent policy actions include:
● Austria in its latest tax reform has reduced the bottom statuary income tax rate.
Furthermore, earners with income below the first income bracket will be eligible for a
reimbursement of half of their social security contributions, up to EUR 400 per year.
● Belgium has reduced the level of part-time unemployment benefits and tightened the
access to unemployment benefits for young people who have insufficient work
experience. It also introduced a revenue-neutral shift in the tax burden from labour
income to consumption and capital.
● Finland has put in place a joint service involving central and local government bodies
that targets the long-term unemployed to improve the labour market skills and
employability.
● In France, the earned-income tax credit providing incentives for workers to join the
labour force has been raised through the integration and a better targeting of two
existing measures.
Closing the pathway to early exit from labour markets
Encouraging older workers to remain in the labour market requires that a number of
measures be taken to raise financial incentives to pursuing activity, but also that the
working life evolves along with increases in life expectancy. The most essential reform is to
increase the statutory retirement age and to re-design contribution and disbursement of
pension so that it does not penalise continued work. Furthermore, these countries need to
tighten access to programmes such as unemployment insurance or disability benefits that
are often used as pathways to early retirement. On the other hand, provision of activation
measures such as job placement services and life-long training are also important to
support the attachment of older workers to labour market. Significant pension reforms
were put in place during the 2010-12 period, notably to help restore public finance
sustainability, but further action is needed to encourage the pursuit of activity at older age.
More recent policy actions in this area include:
● In Belgium, pension age is gradually increased to 67 years by 2030 and incentives for
early retirement are being curbed.
● Finland reoriented the wage subsidy system to those who are in the most difficult labour
market situations, namely to the long-term unemployed over 60 years old.
● In France, an agreement reached by social partners will raise incentives for workers
covered by complementary pensions to remain in the labour force at older age.
Removing impediments to job creation will help to absorb more workers into employment
Reforms to increase labour supply may not increase employment in the short run,
especially during difficult macroeconomic conditions (See Chapter 2). To this end,
complementary reforms that boost hiring and job creation are needed, such as reducing
regulatory barriers to entry in industries with large scope for job creation.
● In France, a recent reform (Loi Macron) eases somewhat entry regulation in legal services
and facilitates the creation of firms that can offer a wide range of legal and accounting
services in the same entity. It also expands the possibility for stores to open on Sundays,
especially in specific areas defined as touristic zones (albeit subject to agreements
between store management and unions) and introduces a partial liberalisation of long-
distance passenger coach services.
ECONOMIC POLICY REFORMS 2016: GOING FOR GROWTH INTERIM REPORT © OECD 201636

1. OVERVIEW OF STRUCTURAL REFORMS IN THE POLICY AREAS IDENTIFIED AS PRIORITIES FOR GROWTH
Table 1.4. Reform priorities for countries with high structural unemploymentand low participation of old workers
AUT BEL FIN FRA LUX SVN
R1 A1 R A R A R A R A R A
Unemployment benefits/social protection and ALMPs
Make UB conditional on work availability and job-searchcriteria/reinforce activation
✓ ✓ ✓ •
Taper UB along duration/reduce age-bias in UB/reduceprogressively the combined generosity of UBand other social benefits (i.e. reduce spikes in marginaleffective tax rates)
✓ • ✓ ✓ ✓
Tax system – labour tax wedges
Reduce average/marginal labour tax wedges ✓ • ✓ • ✓ ✓ •
Remove tax and benefit disincentives to low earnersfull-time participation/introduce or expand EITC
✓ ✓ ✓
Tax system -structure and efficiency
Shift the tax burden from personal income taxes towardconsumption, immovable property and the environment
✓ • ✓ • ✓ ✓ •
Broaden the tax base – reduce tax expenditures ✓ ✓ ✓ •
Retirement and disability policies
Phase out early retirement pathways (via disabilityor unemployment)
✓ • ✓ • ✓ • ✓ ✓
Increase statutory or minimum retirement age ✓ • ✓
Lengthen contribution requirements to claim fullpension/make benefits actuarially neutral
✓ • ✓ • ✓
Adjust benefits/retirement age in line with life expectancy ✓ ✓ • ✓
Job protection
Ease EPL on regular workers to narrow the gapwith respect to non-regular workers and tacklelabour market duality
✓ ✓
Ease conditions for justified individual or collectivedismissals
✓ • ✓ •
Minimum wages and wage bargaining systems ✓ ✓
Reduce sector-specific regulatory burdens
Network sectors (energy, transport, telecoms) ✓ ✓ ✓ ✓ • ✓ •
Retail trade and professional services ✓ ✓ ✓ ✓ • ✓
Human capital
Primary and secondary education
Improve teaching quality/improve incentives for talentedteachers (especially to work in difficult schools)
✓ •
Other recommendations (reduce inequality in educationaloutcomes and opportunities, etc.)
✓ •
Tertiary education
Increase university autonomy and accountabilityor specialisation by institutions
✓
Introduce/raise tuition fees flanked by income-contingentloans/mean-tested grants, improve targeting of means-tested financial assistance
✓ ✓ ✓
Other recommendations (reduce inequalities in access etc.) ✓ ✓
Expand access to and effectiveness of lifelong/job-relatededucation and training
✓ ✓ •
1. R stands for recommendation in that area, A stands for any actions that are implemented or in the processof implementation.
ECONOMIC POLICY REFORMS 2016: GOING FOR GROWTH INTERIM REPORT © OECD 2016 37

1. OVERVIEW OF STRUCTURAL REFORMS IN THE POLICY AREAS IDENTIFIED AS PRIORITIES FOR GROWTH
323852
350
400
450
500
550
600
650
Stronger equity in educational attainment and access to skills formation would increase employability and productivity
While the education systems in those countries yield relatively high performance on
average, the individual scores are also strongly influenced by the pupil’s socio-economic
background (Figure 1.15). Education reforms that promote successful outcomes for all
students, in particular those allocating more resource to schools with larger
concentrations of students from disadvantaged background, would promote equality of
opportunities, social mobility and long-term growth. Similarly, better access to higher
education and skills formation opportunities such as VET and life-long training would
facilitate school-to-work transitions and enhance the employability of the low-skilled
workers. As an example of recent policy actions, France introduced a new individualised
guidance system designed for secondary-school students to prevent early drop out. It also
put in place priority education networks that allocate funding and teacher trainings across
schools based on the social characteristics of their students.
Group 5: Countries with sluggish productivity growth despite relatively highinvestment in knowledge-based capital (Australia, Canada, New Zealand,Switzerland, United Kingdoms and United States)
Countries from this group have recently seen a slowdown in growth (except
New Zealand and the United Kingdom), as investment remained subdued, contrasting
with a comparatively good employment performance. Relatively low rates of youth and
long-term unemployment indicate that these countries have generally been successful at
keeping lower-skilled workers in the labour force. The flip side is persistently weak
productivity growth, in particular gains in multifactor productivity, despite comparatively
high investment in knowledge-based capital and a business environment generally
favourable to entrepreneurship, in addition to flexible labour markets.
At the same time, boosting productivity requires that a number of common structural
weaknesses be addressed, in particular in the areas of educational outcomes – to ensure
that educational qualification translates into skills – public spending efficiency, tax
revenue structure and public infrastructure.
Figure 1.15. Inequality in educational outcomes is relatively high2012
Source: OECD (2013), PISA 2012 Results: Excellence through Equity (Volume II): Giving Every Student the Chance to Succeed.1 2 http://dx.doi.org/10.1787/888933
CHN
KOR
JPNCHENLD
ESTFIN
CAN
POLBELDEUAUT
AUS IRL SVNDNK
NZL
CZE FRAGBRISLLVA
LUXNOR PRTITA ESPRUSSVKUSASWE HUNISR
GRCTUR
CHLMEXBRA
COLIDN
350
400
450
500
550
600
650
0 2 4 6 8 10 12 14 16 18 20 22 24 26
OECD average
Percentage of variation in performance explained by the PISA index of economic, social and cultural status
PISA mean mathematic score
OECD average
ECONOMIC POLICY REFORMS 2016: GOING FOR GROWTH INTERIM REPORT © OECD 201638

1. OVERVIEW OF STRUCTURAL REFORMS IN THE POLICY AREAS IDENTIFIED AS PRIORITIES FOR GROWTH
t
level 0issing.public
323869
0.0
0.4
0.8
1.2
1.6
2.0
2.4
Ensuring further equity in access to high quality education would enhancehuman capital
The performance of high-school students from these countries in PISA tests in science
and reading proficiency is only around the international average and with a tendency in some
cases (Australia, New Zealand and the United Kingdom) to show a high variation across
students. These countries need to reduce inequality in access to education at all levels.
Increasing the supply and quality of early childhood education and care (ECEC) is of particular
importance, as it influences the participation and performance of students at higher education
levels. In these countries, expenditure on early childhood education is relatively low, which in
some cases is reflected in enrolment rates (Figure 1.16). Reforms should be targeted to
minorities and less advantageous social groups, in order to raise equality of opportunities and
social mobility. Efforts are made by these countries to expand the supply of, and to raise
enrolment in ECEC. For example, the United Kingdom has committed to double the
entitlement to free childcare for working families with 3 and 4 year-old children from 2017.
Most countries in this group have faced substantial increases in income inequality
during the past few decades. In some cases, there is evidence (the United States in particular)
that strong investment in ICT and complementary organisational changes have resulted in
faster replacement of workers by machines and software to perform specific tasks, while
increasing the demand for workers with complementary skills, favouring those with higher
skill levels (Brynjolfsson and McAfee, 2011). A wider access to higher education and effective
VET programmes can help mitigate the impact of skill-biased technological progress on
income inequality. As an example of recent actions in this area, the United States enacted
the Workforce Innovation and Opportunity Act which consolidates job training programmes
and aims to streamline services to assist job seekers. This reform involves concentrating
resources on programmes that have proved to be effective and become more responsive to
business needs.
Figure 1.16. Expenditure on early childhood education is relatively low while enrolmenrates can be raised for some countries1
1. Early childhood education target children aged below the age of entry into ISCED level 1. There are two categories of ISCEDprogrammes: early childhood educational development (ISCED 01) and pre-primary education (ISCED 02). Data for Canada are m
2. Public and private expenditure. The last available year is 2013 for Indonesia. Public expenditure only for Switzerland andinstitutions only for Italy, Poland, Portugal and Switzerland. Data for Canada are missing.
Source: OECD (2015), Education at a Glance 2015: OECD Indicators.1 2 http://dx.doi.org/10.1787/888933
0
20
40
60
80
100
120
ISR
FRA
BEL
GBR
DN
KN
ZL ISL
ESP
NO
RIT
ASW
ED
EU EST
SVN
NLD JP
NPR
TO
ECD
AUT
LUX
FIN
SVK
AUS
CZE
POL
CH
LIR
LM
EXU
SATU
RC
HE
LVA
RU
SBR
AC
OL
IDN
Enrolment rates (%) at age 3 in early childhood and pre-primary education, 2013 (left axis)Expenditure on early childhood educational institutions as a % of GDP, 2012 (right axis)²
ECONOMIC POLICY REFORMS 2016: GOING FOR GROWTH INTERIM REPORT © OECD 2016 39

1. OVERVIEW OF STRUCTURAL REFORMS IN THE POLICY AREAS IDENTIFIED AS PRIORITIES FOR GROWTH
oll and
323873
0
10
20
30
40
50
60
70
80
90
100
Growth-friendly and efficient tax system supports productivity growth
Tax reforms that shifts the burden from direct taxation such as income tax to indirect
taxation such as VAT, Goods and Service tax (GST) or property taxation contributes to
productivity growth by reducing distortion on labour supply and corporate investments
(Arnold et al., 2012). The tax revenue in these countries relies considerably more on income
taxation and social security contributions compared to other OECD countries (Figure 1.17).
They have room to expand the role of indirect taxation, for instance, by harmonising the
sales tax rate across regions (e.g. in Canada) or introducing environmental taxes. The
efficiency of taxation can be also enhanced by broadening tax base and scrapping ill-
targeted tax expenditures, such as the deduction of mortgage interest for owner-occupied
housing from income taxation (e.g. in the United States).
Recent actions in this area include:
● Australia introduced in its 2015-16 Budget several measures to reduce corporate taxation,
notably a lower rate of corporate-income for small businesses and a more generous capital
write-off rule.
● Canada introduced some measures to reduce direct taxation, such as increasing the
annual contribution limit for Tax-Free Savings Accounts (TFSAs) and a gradual lowering
of the small business tax rate from 11% currently to 9% by 1 January 2019.
Enhancing the effectiveness of public services and infrastructure
Providing effective public services in the face of mounting budgetary pressures while
containing tax increases is a challenge shared by many OECD countries, including those
from this group. An important reform priority is to enhance the cost efficiency of
healthcare while ensuring equity to access. Furthermore, in some countries such as
Australia and the United Kingdom, congested and depleted infrastructure calls for an
increased provision of infrastructure as well as regulatory reforms that enhance its
efficient use such as introduction of congestion fee.
Figure 1.17. The share of direct taxes in total tax revenues is relatively higher1
Structure of general government tax revenue, percentage, 2014
1. Direct taxes refer to an aggregate of taxes on income, profits and capital gains, social security contributions and taxes on payrworkforce. The last available year is 2013 for Australia, Japan, Mexico, the Netherlands and Poland.
Source: OECD, Revenue Statistics Database.1 2 http://dx.doi.org/10.1787/888933
0
10
20
30
40
50
60
70
80
90
100
JPN
USA
CH
E
AUT
DEU
NO
R
SWE
BEL
DN
K
CAN NLD
CZE
FRA
FIN
SVK
ESP
LUX
ITA
AUS
POL
IRL
SVN
PRT
ISL
EST
KOR
NZL
GBR
GR
C
HU
N
ISR
TUR
MEX CH
L
Direct taxes Goods and services Property Other taxes
ECONOMIC POLICY REFORMS 2016: GOING FOR GROWTH INTERIM REPORT © OECD 201640

1. OVERVIEW OF STRUCTURAL REFORMS IN THE POLICY AREAS IDENTIFIED AS PRIORITIES FOR GROWTH
Some policy actions in these areas include:
● The United States expanded the pilot project “Bundled Payments for Care Improvement
Initiative” conducted by Centers for Medicare and Medicaid Services to over 2000
additional hospitals and medical establishments.
Table 1.5. Reform priorities for countries with sluggish productivity growthin spite of favourable institutional settings
AUS CAN NZL CHE GBR USA
R1 A1 R A R A R A R A R A
Human capital
Early childhood education
Expand access to quality childcare and early education/improve targeting
✓ • ✓ • ✓ ✓ • ✓ •
Primary and secondary education
Improve teaching quality/improve incentives for talentedteachers (especially to work in difficult schools)
✓ ✓
Improve curricula and evaluation ✓ ✓ •
Reduce inequality in educational outcomesand opportunities
✓ ✓ ✓
Tertiary education
Introduce/raise tuition fees flanked by income-contingentloans/mean-tested grants, improve targetingof means-tested financial assistance
✓ ✓
Expand access/enrolment/reduce inequalities in access ✓ • ✓
Expand access to and effectiveness of apprenticeshipsand VET and their relevance to labour market needs
✓ • ✓ ✓ •
Unemployment benefits/social protection and ALMPs
Strengthen resources for job-search assistanceand training while improving targeting of ALMPs
✓ • ✓ •
Tax system -structure and efficiency
Shift the tax burden from personal income taxes towardconsumption, immovable property and the environment
✓ • ✓
Shift the tax burden from corporate income taxes towardconsumption, immovable property and the environment
✓ • ✓ • ✓ •
Broaden the tax base – reduce tax expenditures ✓ ✓ ✓ ✓
Efficiency of public spending and services
Increase cost-efficiency in the healthcare sector ✓ • ✓ ✓ ✓ •
Reduce inequalities in access to public healthcare ✓ • ✓ ✓
Reduce sector-specific regulatory burdens
Network sectors (energy, transport, telecoms) ✓ ✓
Reduce barriers to FDI and international trade ✓ ✓ ✓
R&D and innovation
Increase and/or direct R&D support ✓ ✓
Improve targeting of public support/evaluategrant programs
✓ ✓
Strengthen collaboration between researchcentres/universities and industry
✓
Provision and regulation of public infrastructure
Raise public and private investment in infrastructure,promote private sector participation/concessions/PPPs
✓ • ✓ •
Introduce/increase/reform price signals/congestioncharges and user fees
✓ ✓ ✓ •
1. R stands for recommendation in that area, A stands for any actions that are implemented or in the processof implementation.
ECONOMIC POLICY REFORMS 2016: GOING FOR GROWTH INTERIM REPORT © OECD 2016 41

1. OVERVIEW OF STRUCTURAL REFORMS IN THE POLICY AREAS IDENTIFIED AS PRIORITIES FOR GROWTH
● Australia is implementing its Infrastructure Growth Package which includes an initiative
encouraging State and Territory governments to privatise assets to finance new
investments.
● The United Kingdom, in its Productivity Plan put forth in July 2015, prioritises the
upgrading of road network, to be achieved partly by spending GBP 15 billion on new roads
over the rest of this decade. It also sets as a target that superfast broadband be made
available to 95% of UK households and businesses by 2017.
Some reforms can increase the return to investment in knowledge-based capital
These countries are among those with relatively high rates of investment in
knowledge-based capital (KBC), a wide range of intangible assets that includes, beside R&D,
data, brand, design, firms-specific skills and quality managerial practices. While KBC is
observed to have contributed substantially to GDP growth in advanced OECD countries
(Corrado et al., 2012), KBC also generate knowledge spill-overs due to their non-exclusive
nature, thereby acting as an important source of productivity growth (OECD, 2013a).
Despite their high intensity in KBC investment, the subdued productivity growth suggests
that these countries are enjoying only limited return on their investment.
In order to strengthen the economy-wide impact of KBC investment, these countries
should encourage a stronger interaction between industries and research institutes, with a
view to improving the commercialisation of new technologies. Also, reducing entry barriers
and enhancing competition in industries (such as network and service industries) allows
innovative firms that leverage KBC to play a larger role as the driver of productivity growth
and the source of knowledge spill-overs. Similarly, reducing barriers to trade and FDI would
encourage foreign firms closer to the technological frontier to enter the domestic market,
facilitating the diffusion of new knowledge. However, limited policy actions have been
observed in those policy areas recently.
Group 6: Countries with relatively low productivity in non-manufacturing sectors,fast population ageing and high barriers to female labour force participation(Germany, Japan and Korea)
Countries in this group generally have a productivity level in services that is low
relative to the level in manufacturing, with the productivity gap being particularly large
compared to other countries (Figure 1.18). Lagging productivity in services is contributing
to economy-wide labour productivity being significantly below the average of the upper-
half of OECD countries (Germany being an exception) (Figure 1.19). Therefore, reducing
regulatory barriers to competition and innovation in network industries as well as
professional services and retail distribution remains a key common priority.
Another challenge shared by these countries is the rapid ageing of population. The
share of working-age population plus the older population under the age of 75 in those
countries will fall significantly faster than in other OECD countries (Figure 1.19). Given the
need to mitigate the impact of labour force shortages, boosting the full-time labour
participation of women has been high on the policy agenda of these countries. However,
this requires comprehensive reforms that not only remove institutional disincentives for
full-time labour participation but also that promote a working environment that can best
help to reconcile work and family responsibilities.
ECONOMIC POLICY REFORMS 2016: GOING FOR GROWTH INTERIM REPORT © OECD 201642
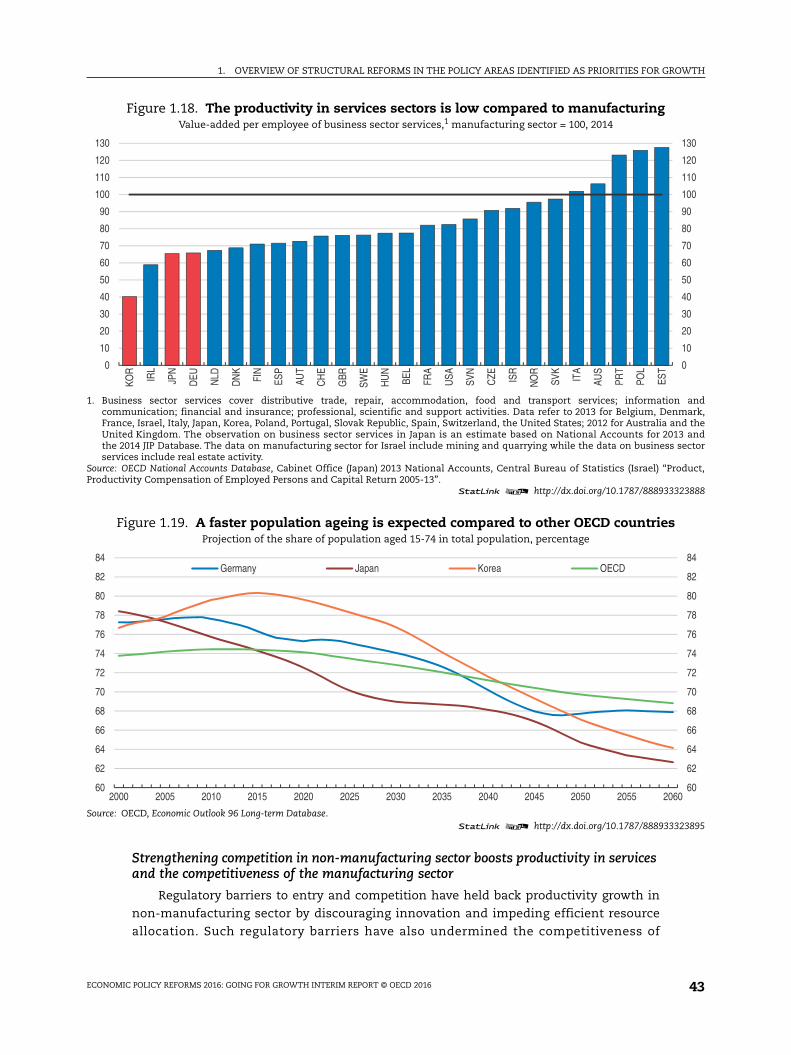
1. OVERVIEW OF STRUCTURAL REFORMS IN THE POLICY AREAS IDENTIFIED AS PRIORITIES FOR GROWTH
n andnmark,nd the13 andsector
roduct,
323888
323895
0
10
20
30
40
50
60
70
80
90
100
110
120
130
60
62
64
66
68
70
72
74
76
78
80
82
84
60
Strengthening competition in non-manufacturing sector boosts productivity in services and the competitiveness of the manufacturing sector
Regulatory barriers to entry and competition have held back productivity growth in
non-manufacturing sector by discouraging innovation and impeding efficient resource
allocation. Such regulatory barriers have also undermined the competitiveness of
Figure 1.18. The productivity in services sectors is low compared to manufacturingValue-added per employee of business sector services,1 manufacturing sector = 100, 2014
1. Business sector services cover distributive trade, repair, accommodation, food and transport services; informatiocommunication; financial and insurance; professional, scientific and support activities. Data refer to 2013 for Belgium, DeFrance, Israel, Italy, Japan, Korea, Poland, Portugal, Slovak Republic, Spain, Switzerland, the United States; 2012 for Australia aUnited Kingdom. The observation on business sector services in Japan is an estimate based on National Accounts for 20the 2014 JIP Database. The data on manufacturing sector for Israel include mining and quarrying while the data on businessservices include real estate activity.
Source: OECD National Accounts Database, Cabinet Office (Japan) 2013 National Accounts, Central Bureau of Statistics (Israel) “PProductivity Compensation of Employed Persons and Capital Return 2005-13”.
1 2 http://dx.doi.org/10.1787/888933
Figure 1.19. A faster population ageing is expected compared to other OECD countriesProjection of the share of population aged 15-74 in total population, percentage
Source: OECD, Economic Outlook 96 Long-term Database.1 2 http://dx.doi.org/10.1787/888933
0
10
20
30
40
50
60
70
80
90
100
110
120
130KO
R
IRL
JPN
DEU NLD
DN
K
FIN
ESP
AUT
CH
E
GBR
SWE
HU
N
BEL
FRA
USA
SVN
CZE IS
R
NO
R
SVK
ITA
AUS
PRT
POL
EST
60
62
64
66
68
70
72
74
76
78
80
82
84
2000 2005 2010 2015 2020 2025 2030 2035 2040 2045 2050 2055 20
Germany Japan Korea OECD
ECONOMIC POLICY REFORMS 2016: GOING FOR GROWTH INTERIM REPORT © OECD 2016 43

1. OVERVIEW OF STRUCTURAL REFORMS IN THE POLICY AREAS IDENTIFIED AS PRIORITIES FOR GROWTH
downstream industries, especially manufacturing, given that 30% or more of the total
value added in exports of manufactured goods is created with services as intermediate
inputs. This indicates that substantial efficiency gains could be achieved in services
industries by easing regulatory barriers to entry, which could in turn help boosting
competitiveness of the manufacturing sector. To this end, those countries are
recommended to facilitating entry and competition in network industries and other
services, namely in retail. In Germany, abolishing price regulations and reducing exclusive
rights in professional services is also a priority. Recent policy actions in this area include:
● Japan passed a law ensuring the neutrality of the electricity transmission and
distribution sectors with regard to generation and retail through legal unbundling. It also
passed a law that facilitates the establishment of foreign enterprises and promotes
entrepreneurship in the National Strategic Special Zones.
● Korea reviewed nearly 800 regulations and amended the laws underpinning 2 377
regulations under the Regulatory Reform Shinmungo, a system allowing citizens to
request reform directly to the government. It also launched the “Regulatory Reform for
Foreign Investment.”
Duality in social protection and training opportunity constrains productivity growth
Stringent employment protection on regular workers lowers labour productivity by
impeding a smooth reallocation of labour resource (Bassanini et al., 2009). Furthermore,
the significant gap in employment protection and training opportunities between regular
and non-regular workers has a negative impact on income equality and human capital in
those countries, due to the limited mobility from non-regular to regular contracts. These
countries thus need to reduce labour market duality by increasing the transparency in
dismissal procedure of regular workers while strengthening the job protection and training
opportunities of non-regular workers.
While there are few reforms in the area of dismissal procedure of regular workers,
some steps have been taken to strengthen the social protection of non-regular workers: For
instance, Japan is to expand Employees’ Pension Insurance and has extended the coverage
of health insurance to 250 thousand non-regular workers beginning from 2016. Germany is
considering a reform that limits the duration of employment on jobs filled by temporary
work agency workers to 18 months. Those workers are to receive the same remuneration
as comparable regular workers after 9 months.
Multi-dimensional efforts are needed to increase full-time labour participation of women
Full-time labour participation of women in these countries remains limited for various
reasons: fiscal disincentives such as the joint taxation system or benefits and allowances
conditional on spouse’s non-employment; high costs, insufficient supply or ill-targeted
childcare services; lack of flexibility in working-time arrangement and long working hours
that prevent the take up of maternity leave. Duality between regular and non-regular
workers also discourages labour participation, given that women are overrepresented in
part-time workers (which are mostly non-regular contracts) in these countries
(OECD, 2015e). Therefore, reforms to boost women’s full-time participation should extend
to multiple dimensions covering tax/benefits system, public services and labour
regulations, whereas increasing the supply of childcare facilities or maternity leave alone
may not be sufficient.
ECONOMIC POLICY REFORMS 2016: GOING FOR GROWTH INTERIM REPORT © OECD 201644

1. OVERVIEW OF STRUCTURAL REFORMS IN THE POLICY AREAS IDENTIFIED AS PRIORITIES FOR GROWTH
Recent policy actions include:
● Germany boosted federal expenditure to expand the childcare services supply for
children aged 0-3 years and to raise the quality of childcare, in particular with regards to
facilities and equipment. It also abolished the cash-for-care subsidy.
● Japan is increasing the number of childcare places in order to accommodate about
0.5 million children by March 2018. Also, after-school childcare centres are being created
to provide care for 0.3 million children by March 2020.
Table 1.6. Reform priorities for countries with low productivityin non-manufacturing sectors and high barriers to female labour participation
DEU JPN KOR
R1 A1 R A R A
Reduce economy-wide regulatory burdens
Reduce administrative burden on start-ups/complexity of regulatory procedure ✓ • ✓ •
Other recommendations (strengthen the competition framework, reducethe scope of public ownership)
✓
Reduce sector-specific regulatory burdens
Network sectors (energy, transport, telecoms) ✓ ✓ •
Retail trade and professional services ✓ ✓ ✓
Reduce barriers to FDI and international trade ✓ • ✓ •
Reduce/reform public subsidies to agriculture ✓ • ✓
Job protection
Ease EPL on regular workers to narrow the gap with respect to non-regularworkers and tackle labour market duality
✓ ✓ • ✓
Ensure the enforcement of labour laws
Unemployment benefits/social protection and ALMPs
Expand the coverage of social protection and ALMPs to e.g. non-regularworkers
✓ • ✓
Expand/target job- placement schemes
Tax system – labour tax wedges
Remove tax and benefit disincentives to full-time female/second earners/loneparents participation
✓ • ✓
Other recommendations (reduce labour tax wedge/disincentives to low incomeearners’ full-time participation)
✓
Tax system -structure and efficiency
Shift the tax burden from personal income taxes toward consumption,immovable property and the environment
✓ ✓
Shift the tax burden from corporate income taxes toward consumption,immovable property and the environment
✓ •
Broaden the tax base – reduce tax expenditures ✓ ✓ •
Policy barriers to full-time female participation – other than taxes and benefits
Expand access to quality childcare and early education/improve targeting ✓ • ✓ • ✓ •
Reform parental leave policies/work place arrangement ✓
Human capital
Primary and secondary education (Ensure adequate school resourcesand infrastructure, etc.)
✓
Expand access to and effectiveness of apprenticeships and VETand their relevance to labour market needs
✓ •
Expand access to and effectiveness of lifelong/job-related educationand training
✓ ✓
1. R stands for recommendation in that area, A stands for any actions that are implemented or in the processof implementation.
ECONOMIC POLICY REFORMS 2016: GOING FOR GROWTH INTERIM REPORT © OECD 2016 45

1. OVERVIEW OF STRUCTURAL REFORMS IN THE POLICY AREAS IDENTIFIED AS PRIORITIES FOR GROWTH
untry’sxports.Mexicod basepan).
323901
0
5
10
15
20
25
30
35
40
45
50
55
60
BRA
● Korea introduced the provision of free childcare for up to 12 hours per day for all children
under five, regardless of the employment status of the mother and family income. Free
childcare will be prioritised toward families whose both parents work.
Group 7: Emerging-market economies with ample room for productivity catch-upthrough investment in knowledge-based capital and better resource allocation(Chile, Mexico, China and Russia)
Following several years (or decades in the case of China) of strong growth, these
emerging-market economies need to shift to new sources of growth to continue to catch up
with advanced economies. Productivity gains driven by resource reallocation away from
agriculture to manufacturing, capital deepening, integration into the global trade system
and the associated technology transfer have largely run their course. As the productivity
gap between those countries and advanced OECD countries remains large, those countries
need to step up investment in knowledge-based capital, improve resource allocation and
encourage a more widespread development of skills and human capital.
These economies benefited greatly from their high integration in global value chains
(GVCs) as suppliers of base materials (Chile and Russian Federation) or assemblers of final
products (China and Mexico) (Figure 1.20). However, except Russian Federation, their
manufacturing exports embody a relatively small share of domestic value-added arising
from services, where the value-added created by GVCs is often concentrated (OECD, 2013b).
To draw more value-added from their global engagement, these countries need to further
improve their capabilities in knowledge and skill-intensive activities within GVCs (such as
new product development, manufacturing of core components, or brand development).
Figure 1.20. Strong participation into GVCs but considerable roomto move up the value chain
Index of GVC participation and the share of domestic service value-addedin manufacturing exports,1 percentage, 2011
1. The index of GVC participation consists of Backward participation, which is the share of foreign value-added embodied in a coexports, and Forward participation, which is a country’s value-added embodied in other countries’ exports, as the share of its eBackward participation tends to be higher for small countries or those engaging heavily in assembly of final goods (ex: China,and some central European countries). Forward participation tends to be higher for countries exporting natural resource anmaterial (ex: Norway or Australia) and those participating in GVC as providers of core components (ex: the United States or Ja
Source: OECD-WTO Trade in Value Added Database (TiVA), October 2015.1 2 http://dx.doi.org/10.1787/888933
0
5
10
15
20
25
30
35
40
45
50
55
60
SVK
CZE
KOR
HU
NSV
NFI
NPO
LM
EX AUT
JPN
SWE
DEU BE
LC
HL
ISL
ITA
PRT
FRA
NO
RES
TC
HE
ESP
TUR
ISR
CAN
GBR IR
LU
SAAU
SN
LDD
NK
GR
CN
ZLLU
X
CH
NR
US
ZAF
IDN
LVA
IND
CO
L
Backward participation in GVCs: Foreign VA embodied in exports, as % of total gross exportsForward participation in GVCs: Domestic VA embodied in exports of foreign country, as % of total gross exportsDomestic services value added share of gross exports
ECONOMIC POLICY REFORMS 2016: GOING FOR GROWTH INTERIM REPORT © OECD 201646

1. OVERVIEW OF STRUCTURAL REFORMS IN THE POLICY AREAS IDENTIFIED AS PRIORITIES FOR GROWTH
Effective innovation policies stimulate business investment in knowledge-based capital
In order for innovation to play a larger role in economic growth, business-based
investment in KBC must be stimulated through effective support measures and a strong
innovation system including better networking between research institutions and firms to
facilitate the commercialisation of new technologies. These countries are recommended to
revamp or reallocate their R&D support and enhance university-industry or public-private
Table 1.7. Reform priorities for countries with a large roomfor productivity catch-up through investment in knowledge-based capital
and better resource allocation
CHL MEX CHN RUS
R1 A1 R A R A R A
R&D and innovation
Increase public support ✓ • ✓ • ✓
Increase and/or reform indirect R&D support – tax incentives,improve balance between direct and indirect support
✓
Improve targeting of public support/evaluate grant programs ✓
Strengthen collaboration between research centres/universitiesand industry
✓ ✓
Reduce economy-wide regulatory burdens
Reduce administrative burden on start-ups/complexityof regulatory procedure
✓ ✓ • ✓ • ✓
Strengthen the competition framework ✓ • ✓ ✓ •
Reduce the scope of public ownership/state intervention ✓ • ✓
Reduce sector-specific regulatory burdens
Network sectors (energy, transport, telecoms) ✓ ✓ •
Reduce barriers to FDI and international trade ✓ • ✓ •
Legal infrastructure and the rule of law
Reinforce judiciary independence and accountability ✓ • ✓ •
Reduce the scope for public officials’ interference in decision-making processes/corruption, increase business transparency
✓ • ✓ •
Financial markets regulation and supervision
Strike a better balance between liberalisation and regulationin financial markets
✓ •
Human capital
Early childhood education
Expand access to quality childcare and early education/improvetargeting
✓ •
Primary and secondary education
Improve curricula and evaluation ✓ ✓ •
Reduce inequality in educational outcomes and opportunities ✓ • ✓
Other recommendations (ensure adequate school resourcesand infrastructure, etc.)
✓ •
Tertiary education
Improve curricula and evaluation ✓ ✓
Expand access/enrolment/reduce inequalities in access ✓ ✓
Expand access to and effectiveness of apprenticeshipsand VET and their relevance to labour market needs
✓ ✓ •
Unemployment benefits/social protection and ALMPs
Expand the coverage or level of UB/social protectionand social services
✓ • ✓ ✓
1. R stands for recommendation in that area, A stands for any actions that are implemented or in the processof implementation.
ECONOMIC POLICY REFORMS 2016: GOING FOR GROWTH INTERIM REPORT © OECD 2016 47
1. OVERVIEW OF STRUCTURAL REFORMS IN THE POLICY AREAS IDENTIFIED AS PRIORITIES FOR GROWTH
sector linkages. Increasing their stock of KBC conditions their ability to innovate and move
up the value chain, but also enhances their ability to absorb and assimilate the diffusion of
advanced technology from the global frontier.
As an example of recent actions in this area, Chile launched an agenda for productivity,
innovation and growth that includes the creation of a productivity commission, designed to
lay the ground work for more balanced and diversified development across sectors, and to
increase investment in R&D activities. Mexico launched the National Entrepreneur Fund to
foster productivity and innovation in small and medium sized enterprises.
Reforms that enhance resource allocation boost productivity and maximise the economy-wide impact of KBC
Economy-wide productivity growth is shaped importantly by the extent to which more
productive firms can grow in size (Bartelsman et al., 2013). Also, reforms that strengthen an
economy’s ability to allocate resources to innovative firms magnify the impact of KBC
investment, for these firms can act as a larger source of knowledge spill-overs (OECD, 2015b).
By reducing further the scope of command and control regulations as well as the weight of
state ownership and entry barriers, these countries can better use market mechanisms that
reward competitive firms with larger market shares. Such reforms, together with those in
financial and labour markets to improve the allocation of skills and capital toward more
productive firms, would unleash productivity growth.
Recent policy actions in this area include:
● Chile introduced a new competition bill that strengthens the sanctions for cartels,
introduces a more effective and transparent merger control regime and grants the
competition authority formal powers to perform market studies.
● China lifted price controls on 24 commodities and services, including for some
categories of freight and passenger transport. It reduced the administrative burden by
abolishing or delegating to the sub-national level over 350 administrative approval
processes. Furthermore, with the removal of the ceiling on short-term deposits, interest
rates have been liberalised except for some policy rates.
● Mexico is implementing the License and Production Sharing Contracts in energy sector
and has concluded three tenders. It is also opening up the insurance and telecom
industry to FDI. Furthermore, it launched a one-stop online shop for government
services and information that would reduce the administrative costs of start-ups.
A robust legal infrastructure is a foundation of economic growth, especially for
innovation-driven growth. A transparent and fair legal environment that ensures
protection of intellectual property and contract enforcement is crucial for investment in
KBC considering that new ideas can often be easily replicated, denying those who invested
in the development of such ideas the possibility to recoup their initial investment. Reforms
that combat corruption and enforce the rule of law would also stimulate entrepreneurship
by reducing the de facto entry barriers.
Recent policy actions in this area include:
● China increased the transparency in business conduct by replacing the annual review of
enterprises by a requirement of annual disclosure of corporate reports to all enterprises.
● Mexico passed its new anti-corruption framework and has accelerated the implementation
of a new justice system at state level.
ECONOMIC POLICY REFORMS 2016: GOING FOR GROWTH INTERIM REPORT © OECD 201648

1. OVERVIEW OF STRUCTURAL REFORMS IN THE POLICY AREAS IDENTIFIED AS PRIORITIES FOR GROWTH
● The Russian Federation enacted the amendments to the anti-corruption law that
broadened the categories of public officials forbidden to have foreign bank accounts.
Also, Judges’ salaries are to be increased by 30% in 2016.
Reforms enhancing educational outcome and labour mobility complement KBCin realising higher productivity growth
An intensive use of new technologies or other types of KBC increases the demand for
workers with skills that complements KBC in achieving higher productivity. A shortage of
such skills can be a bottleneck for countries in this group in translating investment in
innovation into significant productivity gains. On the other hand, new technologies will
inevitably displace workers with skills that are substituted by new technologies. This
underscores the importance of education reforms that enable more students and workers
with ample opportunities to acquire relevant skills. To this end, those countries ought to
further raise the quality of primary and secondary education and ensure equity in access.
They are also need to re-orient tertiary education to the skills demanded in labour markets
and to upgrade VET by improving teaching quality and curriculum.
Recent policy actions include:
● Chile is processing bills to reform early childhood education, pre-primary education and
improve teacher pay conditions. The government has also introduced new legislation
that eliminates profits, tuition fees, and selective admission practices in primary and
secondary schools receiving state subsidies.
● Mexico implemented the new national standard for primary and secondary teacher
performance, in spite of delay in some states. It also launched the Educational Infrastructure
Certificates, a new bond to finance the improvement of school infrastructure.
Reforms that remove barriers to labour mobility, such as granting equal access to
public services by migrant workers irrespective of their registration status, also boost
productivity growth by making it easierfor skilled workers to relocate to higher
productivity jobs in urban areas (OECD, 2015e). To this end, China should allow equal
access to education for the children of all migrants. Steps are taken as few cities have
issued residential permits to migrants.
Group 8: Emerging-market economies with high labour informalityand infrastructure bottlenecks (Turkey, Brazil, Colombia, India, Indonesiaand South Africa)
The last group consists of emerging-market economies in need of addressing a wide
range of structural bottlenecks in order to sustain strong medium-term growth. The most
binding bottlenecks include high labour informality and youth unemployment, severe
shortages in public infrastructure and low educational attainment.
Various institutional barriers to formal employment must be removed
Labour informality is often associated with poor employment conditions such as a
lack of protection against wage non-payment or hazardous work, lay-offs without notice or
compensation, and the absence of benefits such as pensions, sick pay and health
insurance. Informal employment, especially prevailing in India, Indonesia and Colombia
(Figure 1.21), and high youth unemployment (especially serious in South Africa) are rooted
on various rigidities affecting the formal labour markets: onerous labour regulation and
stringent employment protection (e.g. in India and Indonesia); high minimum wage and
ECONOMIC POLICY REFORMS 2016: GOING FOR GROWTH INTERIM REPORT © OECD 2016 49

1. OVERVIEW OF STRUCTURAL REFORMS IN THE POLICY AREAS IDENTIFIED AS PRIORITIES FOR GROWTH
n area.
323918
0
10
20
30
40
50
60
70
80
90
non-wage hiring costs (e.g. in Colombia, Indonesia, Turkey and South Africa); and stringent
regulatory entry barriers and administrative burden that impede entrepreneurship and job
creation (e.g. in South Africa). In Turkey, the low statutory retirement age is discouraging
formal work at older ages.
The scope of reforms to reduce labour informality and unemployment in those
countries is wide, given the need to address both the high costs of formal employment and
weak job creation. Essential reforms include shifting worker protection from jobs to
workers by reducing the rigidities in severance procedures while introducing or expanding
the coverage of unemployment benefits; cutting social security contributions and other
non-tax compulsory employer payments; capping increases in minimum wages and
weakening administrative extension of collective bargaining; cutting red tape and the
administrative burden on business operations and strengthening active labour market
policies such as job placement services.
Recent policy actions in those areas include:
● India amended its Apprentices Act, relaxing some rigid norms related to the hiring of
apprentices. Also, the firm size threshold below which companies can lay off employees
without prior government approval has been raised in some states. Furthermore, a
unified online portal for 16 central government labour laws was launched while making
labour inspection processes more transparent.
● Turkey has granted permanent social security contribution cuts and wage subsidies for
the employment of young workers. The wages of workers receiving on-the-job
vocational training will be paid by the government for six months, and the employer
social security contributions for these workers will be fully subsidised for 3½ years, if the
training ends up in hiring.
● In order to reduce the barriers to entrepreneurship, South Africa lowered turnover taxes
for micro businesses and increased tax credits for the venture capital scheme.
Figure 1.21. Informal employment represents a high share of total employmentPercentage of total employment, 20131
1. Data refer to 2009 for Indonesia; 2010 for South Africa and China; 2012 for India. For China, the figure is an official estimate for urbaSource: International Labour Organisation (ILO).
1 2 http://dx.doi.org/10.1787/888933
0
10
20
30
40
50
60
70
80
90
IND IDN COL MEX BRA ZAF CHN TUR
ECONOMIC POLICY REFORMS 2016: GOING FOR GROWTH INTERIM REPORT © OECD 201650

1. OVERVIEW OF STRUCTURAL REFORMS IN THE POLICY AREAS IDENTIFIED AS PRIORITIES FOR GROWTH
Addressing infrastructure bottlenecks through efficient regulatory settingsand better targeting
The large infrastructure gap that constrains productivity growth in these countries
should be addressed by crowding in private investments for instance, in the form of
private-public partnerships. Essential reforms in this area include resolving the
inefficiencies in regulation concerning tender, concession, land acquisition or project
approval as recommended to India and Indonesia. Also, a better prioritisation of
investment through an ex-ante cost-benefit evaluation (as recommended to Colombia)
would enhance the contribution of infrastructure investment to productivity growth.
Recent policy actions in this area include:
● Brazil launched the second stage of the Logistics Investment Programme PLI, with
planned investments of BRL 70 billion through concessions by 2018.
● Colombia expanded the incentives to coordinate better regional infrastructure projects,
namely prioritising larger regional projects in need. The plan also included general
guidelines for evaluating and prioritising PPPs with a methodology to be issued by the
National Planning Department.
● As part of the “Make in India” initiative, India took measures that could encourage
private investment, such as relaxing FDI regulations in some sectors including railways,
construction, air transport services. It also introduced regulatory reforms in the energy
sector such as an enhanced transparency in coal allocation, a partial privatisation of
Coal India and the auctioning of oil and gas fields.
Raising educational attainment by allocating more resource and improvingteaching quality
As regards the performance of teenage students, the results from the PISA tests reveal
the poor international ranking of these countries, in particular in maths (Figure 1.15). This
undermines productivity growth but in some cases also contributes to high youth
unemployment (e.g. South Africa). There is considerable scope for increasing the resources
devoted to education (on a per student basis) and to improve the quality of teachers
through more comprehensive training and evaluation programmes. Furthermore,
vocational training must be revamped both in supply and quality in order to address the
low youth employability and skill shortage.
Recent policy actions include:
● Columbia increased new fellowships for tertiary education and introduced a new system
of targeting student loans. It also foresees extending early childhood care to 1.1 million
infants as opposed to 400 thousand today.
● Turkey adopted its Vocational and Technical Education Strategy and Action Plan 2014-18
which includes 24 specific goals to be monitored by performance indicators, including
revisions of curricula according to national professional standards.
● Indonesia introduced a new syllabus while increasing the funding for education.
● India launched the Skill India Initiative that includes expansion in quantity and scope of
skill training programmes and financial incentives for youth attending and completing
those programmes.
ECONOMIC POLICY REFORMS 2016: GOING FOR GROWTH INTERIM REPORT © OECD 2016 51

1. OVERVIEW OF STRUCTURAL REFORMS IN THE POLICY AREAS IDENTIFIED AS PRIORITIES FOR GROWTH
Table 1.8. Reform priorities for countries with high labour informalityand infrastructure
TUR BRA COL IND IDN ZAF
R1 A1 R A R A R A R A R A
Job protection
Ease EPL on regular workers (reduce severance payment)to narrow the gap with respect to non-regular workersand tackle labour market duality
✓ ✓ • ✓
Ease conditions for justified individual or collective dismissals ✓ • ✓
Minimum wages and wage bargaining systems
Reduce the minimum cost of labour/allow for ageor sector differentiation
✓ ✓ ✓ ✓
Unemployment benefits/social protection and ALMPs
Expand the coverage or level of UB/social protectionand social services
✓ ✓
Tax system – labour tax wedges
Reduce average/marginal labour tax wedges ✓
Reduce labour tax wedges by reducing social securitycontributions
✓ • ✓
Human capital
Primary and secondary education
Ensure adequate school resources and infrastructure ✓ ✓ ✓ ✓ • ✓
Improve teaching quality/improve incentives for talentedteachers (especially to work in difficult schools)
✓ ✓ ✓ ✓
Improve school accountability and autonomy ✓ ✓ ✓
Reduce inequality in educational outcomes and opportunities ✓ ✓
Other recommendations (improve curricula and evaluation,reduce dropout)
✓ ✓
Tertiary education
Increase university autonomy and accountabilityor specialisation by institutions
✓ ✓
Improve targeting of means-tested financial assistance ✓ •
Expand access to and effectiveness of apprenticeshipsand VET and their relevance to labour market needs
✓ • ✓ ✓ • ✓
Expand access to and effectiveness of lifelong/job-relatededucation and training
✓ • ✓
Reduce economy-wide regulatory burdens
Reduce administrative burden on start-ups/complexityof regulatory procedure
✓ • ✓ ✓ •
Ease business exit/bankruptcy procedures ✓ ✓ •
Other recommendations (Strengthen the competitionframework etc.)
✓
Reduce sector-specific regulatory burdens
Network sectors (energy, transport, telecoms) ✓ • ✓ ✓
Reduce barriers to FDI and international trade ✓ ✓ •
Provision and regulation of public infrastructure
Raise/improve targeting of public and private investmentin infrastructure
✓ • ✓ • ✓ • ✓ •
Promote private sector participation/concessions/PPPs ✓ • ✓ • ✓
Financial markets regulation and supervision
Encourage private participation in financial markets/gradually reduce state intervention while ensuring strongprudential regulation
✓ • ✓ •
Reduce/reform public subsidies to agriculture and energy ✓ ✓ •
1. R stands for recommendation in that area, A stands for any actions that are implemented or in the processof implementation.
ECONOMIC POLICY REFORMS 2016: GOING FOR GROWTH INTERIM REPORT © OECD 201652

1. OVERVIEW OF STRUCTURAL REFORMS IN THE POLICY AREAS IDENTIFIED AS PRIORITIES FOR GROWTH
Cross-country policy issues with implications for international trade and FDIGlobal trade growth has slowed and, compared to past trends, is particularly weak
relative to GDP growth, which may reflect a structural shift in the relationship between the
two aggregates (OECD, 2015f, Constantinescu et al., 2015). Yet, trade plays a fundamental
role in the diffusion of technology and access to high-quality imported intermediate goods
boosts productivity and competitiveness within GVCs (OECD, 2013b). Therefore, collective
efforts to remove structural impediments to international trade, such as non-tariff
barriers, are required to boost growth both in the short and in the longer term.
Some progress is observed at the global level, and to a lesser extent, at the regional and
country levels. At the global level, the negotiation on the Trade Facilitation Agreement
(TFA), which contains various provisions for improving the speed and efficiency of border
procedures, was concluded in December 2013, followed by the adoption of a Protocol of
Amendment in November 2014.The full implementation of the TFA is expected to reduce
worldwide trade costs by 12.5 to 17.5% (OECD, 2015g). Furthermore, some important
aspects of trade facilitation such as the availability of advanced rulings or streamlining of
border and custom procedures strengthen significantly countries’ integration into GVCs
via increased use of foreign inputs in exported goods or higher exports of intermediate
goods used as inputs in foreign exports (Moïsé and Sorescu, 2015).2
Another breakthrough came in October 2015, when 12 Asia-Pacific countries reached
the Trans-Pacific Partnership (TPP) agreement which covers nearly 40% of the world
economy. Aside from the reduction of tariff barriers, the TPP agreement includes
provisions that improve intellectual property protection, remove barriers to investment in
services, and increase consistency and transparency of regulatory regimes across partner
countries. While the immediate impact of the agreement on trade and FDI flows remains
uncertain given that many tariffs are abolished only gradually, the prospect of better access
to foreign markets may stimulate investment in the relatively short run. In the medium
term, stronger competition and increased inward and outward investment are likely to
stimulate innovation and productivity growth in previously shielded sectors, namely
services and parts of agriculture (Jorgensen et al., 2015).
At the regional level, the European Commission has taken a step toward the Digital
Single Market by adopting a strategy that lays out legislative process toward further
harmonisation in regulations and reduction of administrative burdens concerning cross-
border e-commerce and telecom markets. Another strategy related to the Energy Union
was also adopted, aiming for a fully integrated European energy market that involves
interconnections and a common regulatory framework. While tremendous efforts are
required to push through regulatory harmonisation in Europe, the return to such reforms
is large, involving substantial boost in trade and FDI across EU countries (Fournier
et al., 2015). The harmonisation in service sector is of particular importance, given that it
accounts for up to half of the value-added embodied in gross exports. The stringency of
regulatory barriers to service trade reduces not only imports but also exports of services,
for such restrictions are mainly behind the border and therefore weakens the
competitiveness of local firms as well (Nordås and Rouzet, 2015).
At the country level, some reforms in the highly protected agriculture sector and
energy subsidies have taken place. For instance, Japan has reformed its Agricultural Co-
operative system and relaxed some of the limits on corporate farm ownership, steps that
may promote competition and boost productivity. Norway raised production-level caps in
ECONOMIC POLICY REFORMS 2016: GOING FOR GROWTH INTERIM REPORT © OECD 2016 53

1. OVERVIEW OF STRUCTURAL REFORMS IN THE POLICY AREAS IDENTIFIED AS PRIORITIES FOR GROWTH
he end
323929
0
10
20
30
40
50
60
70
80
90
100
some agriculture support mechanisms so as to encourage a shift to larger-scale units.
Indonesia scrapped subsidies on gasoline and capped those on diesel – a welcome move
that contributes both to the efficiency of budget allocation and the environment. However,
the administrative price setting regime that replaced subsidies is cumbersome and still
inhibits the adjustment of domestic fuel prices to world prices. Furthermore, Indonesia
sharply increased import tariffs on food, clothes, cars and other consumer goods, which
pushes-up inflation and has a negative impact on household income.
Summing-up: a great variation in the implementation of reforms acrossand within country groups
During 2015, the highest share of full implementation of structural reforms
corresponding to the recommendations made in Going for Growth 2015 has been observed in
country group 1 consisting mostly of Southern European countries (Figure 1.22). Among the
countries in this group, Italy and Spain have been most active, while the intensive pace of
reforms observed in Greece in previous years basically came to a halt in 2015 in part due to
the political transition in the first half of the year. Despite a slower share of completed
reforms, other country groups could also end-up with a pace of reforms that is comparable
to the average observed across OECD countries over the past two years, if preliminary steps
in a number of areas are fully implemented. Within each country group, some countries have
been more active, for instance Norway (group 3), France (group 4) and Japan (group 6). In the
case of the two country groups comprising emerging-market economies (groups 7 and 8),
relatively few reforms have been fully implemented but initial action has been taken on a
substantial number of recommendations, in particular in China, India and Mexico.
Figure 1.22. A large variance in the share of the Going for Growth recommendationsimplemented or in process of implementation1
Percentage
1. The chart summarises the share of recommendations made in Going for Growth 2015 by the status of their implementation at tof 2015. Full implementation refers to legislation of relevant laws or equivalent measures.
1 2 http://dx.doi.org/10.1787/888933
0
10
20
30
40
50
60
70
80
90
100
Group 1 Group 2 Group 3 Group 4 Group 5 Group 6 Group 7 Group 8
Limited steps taken or no action In process of implementation Fully implemented (adoption of relevant law etc.)
ECONOMIC POLICY REFORMS 2016: GOING FOR GROWTH INTERIM REPORT © OECD 201654

1. OVERVIEW OF STRUCTURAL REFORMS IN THE POLICY AREAS IDENTIFIED AS PRIORITIES FOR GROWTH
The implications of growth-enhancing structural reforms for inclusive growthand macroeconomic rebalancing
This section briefly discusses the potential impact of Going for Growth recommendations
and actions taken on policy objectives other than growth in GDP per capita agenda, more
specifically the narrowing of income distribution as well as of fiscal and current account
imbalances.3
Many structural reforms yield double dividends in term of boosting growthand reducing income inequality
The fact that in many countries growth in GDP per capita over the past three decades
has benefitted little low-income households points to the importance of structural reforms
that promote inclusive growth. The contribution of structural policies to trends in income
inequality has been well documented (see inter alia OECD, 2008, 2011, 2014c, 2015h), providing
many insights on how reforms could be tailored so as to yield the double dividend of higher
growth and reduced income inequality (see Chapter 2 of Going for Growth 2015).
Many of the recommendations made in the 2015 issue of Going for Growth are expected
to reduce income inequality, especially those aimed at increasing employment (Table 1.9,
column 1). However, some reforms encouraging the labour participation of low income
earners and low-skilled workers can lead to higher wage dispersion at the lower end of the
distribution. Other reforms enhancing competition and innovation are often found to be
associated with wider earning gaps (OECD, 2011), partly through their role in stimulating
skilled-biased technology changes. This underscores the importance that such reforms be
complemented with measures to facilitate worker’s up-skilling and reduce skill mismatch,
such as better provisions of vocational trainings and lifelong learning programmes.
Across the ten OECD countries facing the highest degree of income inequality, the
number of reforms implemented or in the process of being implemented that are likely to
reduce inequality is twice as high as those that are more likely to increase them
(Figure 1.25).4
The short-run budgetary pressures can be mitigated by a good design and packagingof reforms
In many OECD countries, not least those with a very high level of government debt
relative to GDP, the need to pursue public finance consolidation remains high, especially
those where population ageing is likely to put additional budgetary pressures. Under a
stylised scenario of interest rates normalisation and a rising expenditure on healthcare,
long-term care and pension, government debt ratios are expected to rise in about two-third
of OECD countries even in the case where interest rates remain at par with GDP growth
rates from 2020 onward (OECD, 2015a). And the debt dynamic gets worse in the case where
interest rates exceed GDP growth (Figure 1.23).
Although Going for Growth recommendations generally contribute to fiscal
consolidation in the long run – in particular those that boost private-sector employment
(OECD, 2013c) – some of them are associated with non-negligible up-front increases in
public expenditure (or declines in revenues) and their implementation can thus pose
challenge to fiscal consolidation in the short run (Table 1.9, column 2). Countries with very
limited budgetary room may have to focus on low-cost measures or ensure that others are
financed through means that are as friendly as possible to employment and growth. The
ECONOMIC POLICY REFORMS 2016: GOING FOR GROWTH INTERIM REPORT © OECD 2016 55

1. OVERVIEW OF STRUCTURAL REFORMS IN THE POLICY AREAS IDENTIFIED AS PRIORITIES FOR GROWTH
Table 1.9. The implication of the Going for Growth recommendationsand actions taken on other objectives
Incomedistribution
Budgetbalance
Currentaccountposition
Countries with priorities in this area(countries taking related action in bold)
Labour market policies
Reducing the duality between regular and non-regularworkers (in job protection, training opportunity, etc.)/reducing informal labour participation
+ ~CHL, DEU, ESP, FRA, ITA, IND, IDN, ISR, JPN,KOR, LUX, NLD, SWE,TUR
Reforming minimum wage and wage bargaining ~ + BEL,COL, ESP, IDN, PRT,SVN, TUR, ZAF
Extending the coverage of unemployment insuranceand social protection
+ -AUS, CHL, CHN, GRC, IDN, ITA, JPN, KOR, PRT,RUS,TUR
Reducing the replacement rate and durationof unemployment benefits/strengtheningconditionality on job-search
~ + BEL, FIN, FRA, IRL, LUX, NLD, PRT, SVN
Improving effectiveness of ALMPs (job-searchassistance/individual follow-up/trainingand re-skilling)
+ -/~ESP, EST, FRA, GRC, GBR, IRL, ISR, ITA, LVA,NLD, PRT,RUS, SVK, USA, ZAF
Reforming the tax-benefits system to encouragelabour force participation of the low-skilled
+/~ -/~AUT, BEL, COL, CZE, DEU, EST, FIN, FRA, GBR,HUN, IRL, ISR, ITA, LUX, LVA, NLD, POL, SVN,SWE, TUR
Reducing barriers to female labour force participation(increasing provision of childcare, reducing fiscaldisincentives)
+ -/~ -AUS, CHE, CHL, COL, CZE, DEU, GBR, IRL, JPN,KOR, NLD, NZL, POL,SVK, TUR, USA
Reducing disincentive for continued work at old ageand tightening the eligibility to disability benefits
~ + -AUT, BEL, DNK, EST, FIN, HUN, LUX, NLD,NOR,POL, SVN, SWE, TUR, USA
R&D and Innovation
Boosting innovation activities(R&D and other investments in KBC)
- - -AUS, CAN, CHL, COL, CZE, EST, IRL, LVA, MEX,NZL, PRT, RUS, SVK, SVN
Education/Human capital
Increasing the provision and quality of early,primar and secondary education
+ -
AUS, BRA, CHE, CHL, CHN, COL, CZE, DEU, DNK,FRA, GBR, GRC, HUN, IRL, ISL, IND, IDN, ISR,ITA, JPN, KOR, MEX, NZL, NOR, POL,PRT, SVK,SWE, TUR, USA, ZAF
Increasing the outcome of tertiary education/broadeningaccess to VET and life-long training
+ -/~
AUT, BRA, CAN,CHE, CHL, CHN, COL, CZE, DEU,DNK, ESP,EST, FIN, FRA, GBR, GRC, HUN, IND,ITA, JPN, KOR,NZL, POL, PRT, SVK, SVN, SWE,TUR, USA, ZAF
Product Market Reform
Reforming product market regulation (PMR)to enhance competition, trade and FDI
- -/~
AUT, BEL, BRA, CAN, CHL, CHN, CZE, DEU, DNK,ESP, EST, FIN, FRA, GRC, HUN, IND, IDN, IRL,ISR, ITA, JPN, KOR, LUX, LVA, MEX, NZL, NOR,POL, PRT, RUS, SVK, SVN, TUR, ZAF
Reducing agricultural and energy subsidy + + ~ CHE, IDN, ISR, JPN, KOR, NOR, TUR, USA
Tax reform
Shifting the burden from direct to indirect taxation(including fiscal devaluations, etc.)
-/~ ~ +AUS, AUT, BEL, CAN, CHE, COL, CZE, DNK, DEU,EST, FIN, FRA, ITA, JPN, KOR, LVA, POL, SWE
Enhancing the efficiency of tax system(cutting back tax expenditure, broadening tax base,fighting tax evasion)
+/~ + +AUS, AUT, BRA, CAN, CHE, COL, DEU, DNK, EST,FIN, FRA, GRC, ITA, JPN, LVA, NLD, NOR, SWE,TUR, USA
Infrastructure
Increasing investment in public infrastructure - -AUS, BRA, COL, EST, GBR, IDN, IND, LVA, MEX,POL
Note: The table summarises the expected short- to medium-run impact of each type of reform in attaining the policyobjectives. “+” corresponds to the case where the reform is likely to contribute to the objective whereas “-”corresponds to the case where it is unlikely to help or generate a short-run trade-off. “~” corresponds to the casewhere the impact is ambiguous due to opposing effects. Blank corresponds to the case of no direct effects. Thecountry code in bold corresponds to the case where policy action is taken.
ECONOMIC POLICY REFORMS 2016: GOING FOR GROWTH INTERIM REPORT © OECD 201656

1. OVERVIEW OF STRUCTURAL REFORMS IN THE POLICY AREAS IDENTIFIED AS PRIORITIES FOR GROWTH
on the
323931
0
50
100
150
200
250
300
350
short-run impacts on fiscal expenditure can be also mitigated by implementing in tandem
reforms that enable fiscal savings. An example of such “packaging” is a strengthening of
conditionality of unemployment benefits on activation measures while expanding ALMPs,
as is being done in Italy. Furthermore, some reforms can be implemented in a cost-efficient
manner through adequate regulatory reforms. For instance, enabling competition and
adequate pricing in network sector can stimulate private investment in public
infrastructure.
Among the ten OECD countries with the largest primary deficits and the highest
government debt levels, the majority of reforms implemented or in the process of
implementation are likely to put short-term pressures on the budgetary balance
(Figure 1.25).5
Reforms can help rebalancing the structural component of current account deficitsor surplus
While current account imbalances declined substantially after the crisis, about one
half of the decline is explained by cyclical factors, namely large contractions in domestic
demand on the back of bursting housing bubbles in a number of deficit countries (Ollivaud
and Schwellnus, 2013). The narrowing of cyclically-adjusted global current account
imbalances reflects a substantial narrowing for all major trading areas except the euro
area, where the cyclically-adjusted balance of surplus countries continued to widen while
that of deficit countries narrowed by about one percentage point (Figure 1.24).This
underscores the importance of removing the institutional distortions that alter
households’ saving behaviour or return to private investment. For deficit countries,
reforms in labour and product markets that reduce labour or business costs may also help
to reduce imbalances by improving competitiveness.
Figure 1.23. Government debt levels will likely rise in a majority of OECD countrieswith normalisation of interest rates and population ageingDebt level in 2014 and simulated debt levels in 2030,1 as a percentage of GDP
1. The chart compares the government debt level in 2014 and the simulated level in 2030 under two alternative scenariosevolution of the interest rate and the GDP growth rate. See the source for the details of assumptions made in the simulation.
Source: OECD (2015), OECD Economic Outlook, OECD Publishing, Paris.1 2 http://dx.doi.org/10.1787/888933
0
50
100
150
200
250
300
350
EST
LUX
KOR
NZL
AUS
CH
E
SWE
CZE
SVK
DN
K
POL
ISR
FIN
NLD
DEU IS
L
CAN AU
T
SVN
HU
N
USA
GBR
EA15
ESP
IRL
FRA
BEL
PRT
ITA
JPN
Debt level in 2014
Debt level in 2030 when the interest rate equals the GDP growth rate
Debt level in 2030 when the interest rate exceeds the GDP growth rate
ECONOMIC POLICY REFORMS 2016: GOING FOR GROWTH INTERIM REPORT © OECD 2016 57

1. OVERVIEW OF STRUCTURAL REFORMS IN THE POLICY AREAS IDENTIFIED AS PRIORITIES FOR GROWTH
nd thero arealgium,D euro
lances:
323943
2014
2014
Figure 1.24. The non-cyclical component of external imbalances remain substantialBusiness and housing-cycle adjusted components of current account balances, as a percentage of GDP1
1. The chart decomposes the headline current account imbalances to the component explained by business and housing cycle anon-cyclical component. Following Ollivaud and Schwellnus (2013), the euro area surplus countries are defined to include eumembers for which the current account surplus was on average larger than 1% of GDP over the period 2000-05 (Austria, BeGermany, Finland, Luxembourg and the Netherlands). The euro area deficit zone includes the remaining members of the OECarea (France, Estonia, Greece, Ireland, Italy, Portugal, the Slovak Republic, Slovenia and Spain).
Source: Updated calculations based on P. Ollivaud and C. Schwellnus (2013), "The Post-crisis Narrowing of International ImbaCyclical or Durable?” OECD Economics Department Working Papers, No. 1062, OECD Publishing, Paris.
1 2 http://dx.doi.org/10.1787/888933
-7
-6
-5
-4
-3
-2
-1
0
1
2
3
2000
2001
2002
2003
2004
2005
2006
2007
2008
2009
2010
2011
2012
2013
2014
A. United States
Non-cyclical component Business and housing cycle component Headline current account
-5
-4
-3
-2
-1
0
1
2
3
2000
2001
2002
2003
2004
2005
2006
2007
2008
2009
2010
2011
2012
2013
B. Euro deficit countries
-1
0
1
2
3
4
5
2000
2001
2002
2003
2004
2005
2006
2007
2008
2009
2010
2011
2012
2013
2014
C. Japan
-2
-1
0
1
2
3
4
5
6
7
8
9
2000
2001
2002
2003
2004
2005
2006
2007
2008
2009
2010
2011
2012
2013
D. Euro surplus countries
-2-10123456789
1011
2000
2001
2002
2003
2004
2005
2006
2007
2008
2009
2010
2011
2012
2013
2014
E. China
-4
-2
0
2
4
6
8
10
12
14
16
18
2000
2001
2002
2003
2004
2005
2006
2007
2008
2009
2010
2011
2012
2013
2014
F. Oil zone
ECONOMIC POLICY REFORMS 2016: GOING FOR GROWTH INTERIM REPORT © OECD 201658

1. OVERVIEW OF STRUCTURAL REFORMS IN THE POLICY AREAS IDENTIFIED AS PRIORITIES FOR GROWTH
untriesthose
323951
0
2
4
6
8
10
12
14
16
18
20
The expected contribution of structural reforms to a stronger current account
summarised in the third column of Table 1.9 suggests that reducing the minimum costs of
labour by reforming worker’s bargaining power help deficit countries to rebalance the non-
cyclical component of imbalances. Similarly, cutting back subsidies or tax incentives that
lead to excessive consumption or investment in specific products may also help. For
countries with a large current account surplus, regulatory reforms and fiscal supports that
boost investment in physical and knowledge-based capital as well as higher investment in
public infrastructure can contribute to reducing the structural component of the current
account. Furthermore, promoting the full-time labour force participation of women and
older workers may also work towards rebalancing by increasing income of those groups
and thereby reducing the need for precautionary or retirement saving.
Across countries facing largest external imbalances, there are similar numbers of
reforms that have been implemented or are in process of implementation that are likely or
unlikely to help reducing those imbalances in the short run (Figure 1.25).6 However, while
the reforms undertaken by countries with largest external surpluses are overall likely to
help the rebalancing, none of those undertaken by countries with largest deficits are
expected to contribute to the narrowing of imbalances.
Notes
1. This may be particularly the case when the indicator is compiled and averaged over a relativelysmall group of countries such as the group of emerging-market economies.
2. The TFA will enter into force once two-thirds of members have completed their domesticratification process of the Protocol. Some of the largest trading countries such as the United States,European Union and its member states, China and Japan have completed the ratification process.
3. The implication on the environment are not covered in this chapter, given that there are only veryfew reforms that directly affects environment and that such impacts are importantly shaped by
Figure 1.25. The actions taken are likely to help reduce inequalitybut not macroeconomic imbalances
Number of Going for Growth recommendations implemented or in process of implementation1
1. The chart summarises the number of recommendations implemented or in the process of implementation by the group of cofacing highest income inequality, fiscal and external imbalances. See footnotes in the text for the methodology for selectingcountries.
1 2 http://dx.doi.org/10.1787/888933
0
2
4
6
8
10
12
14
16
18
20
Reducing income inequality Fiscal consolidation Current account rebalancing
Reforms that contribute to objectives Reforms that do not contribute
ECONOMIC POLICY REFORMS 2016: GOING FOR GROWTH INTERIM REPORT © OECD 2016 59

1. OVERVIEW OF STRUCTURAL REFORMS IN THE POLICY AREAS IDENTIFIED AS PRIORITIES FOR GROWTH
the environmental regulations in place (see Chapter 3 of the 2015 issue of Going for Growth for anin-depth discussion).
4. The 10 OECD countries with highest income inequality are chosen on a basis of an index thatcombines the standardised values of Gini coefficients and relative poverty rate. They are: Mexico,Chile, Turkey, the United States, Israel, Japan, Greece, Spain, Australia and Portugal.
5. The 10 OECD countries with the largest fiscal imbalance are chosen on basis of an index thatcombines the standardised value of cyclically-adjusted primary balance deficits (percentage ofpotential GDP) and of government debt (percentage of GDP). They are: Japan, the United Kingdom,the United States, France, Canada, Ireland, Belgium, Slovenia, Spain and the Netherlands.
6. The group of countries with the largest external imbalances are the 10 countries selected on thebasis of an index that combines the standardised value of current account deficits (averaged over2010-14) and external debt (both as percentage of GDP) and the 10 countries with the largestcurrent account surplus. The largest deficit countries are: Greece, Turkey, Portugal, Poland,New Zealand, Australia, Spain, Latvia, Colombia and the Slovak Republic, while the largest surpluscountries are: Norway, Switzerland, the Netherlands, Sweden, Germany, Denmark, Luxembourg,Korea, Russian Federation and Slovenia.
Bibliography
Adalet McGowan, M. and D. Andrews (2015), “Labour Market Mismatch and Labour Productivity:Evidence from PIAAC Data” OECD Economics Department Working Paper No. 1209.
Arnold, J. et al. (2011), “Tax Policy for Economic Recovery and Growth”, The Economic Journal, Vol. 121,59-80.
Bartelsman, E. et al. (2013), “Cross-Country Differences in Productivity: The Role of Allocation andSelection”, American Economic Review 2013, 103(1): 305-334.
Bassanini, A. et al. (2009), “Job Protection Legislation and Productivity Growth in OECD Countries”,Economic Policy, April 2009 pp. 349-402.
Blanchard, O. and F. Giavazzi (2003), “Macroeconomic Effects of Regulation and Deregulation in Goodsand Labour Markets”, The Quarterly Journal of Economics, Vol. 118(3), pp. 879-907.
Brynjolfsson, E., and A. McAfee. (2011), Race Against the Machine. Lexington: Digital Frontier Press.
Constantinescu, C., A. Mattoo, and M. Ruta (2015), “The Global Trade Slowdown: Cyclical orStructural?” IMF Working Paper WP15/6.
Corrado, C., J. Haskel, C. Jona-Lasinio and M. Iommi (2012), “Intangible Capital and Growth in AdvancedEconomies: Measurement Methods and Comparative Results”, INTAN-Invest Mimeo.
Fournier, J. et al. (2015), “Implicit Regulatory Barriers in the EU Single Market: New Empirical Evidencefrom Gravity Models”, OECD Economics Department Working Papers, No. 1181, OECD Publishing. http://dx.doi.org/10.1787/5js7xj0xckf6-en.
Jorgenson, D.W., K. Nomura and J.D. Samuels (2015), “Trade Agreements and Trans-PacificCompetition” EU-VOX Column, 8 July 2015.
Moïsé, E. and S. Sorescu (2015), “Contribution of Trade Facilitation Measures to the Operation of SupplyChains”, OECD Trade Policy Papers, No. 181, OECD Publishing, Paris. http://dx.doi.org/10.1787/5js0bslh9m25-en.
Nordås, H. K. and D. Rouzet (2015), “The Impact of Services Trade Restrictiveness on Trade Flows: FirstEstimates”, OECD Trade Policy Papers, No. 178, OECD Publishing Paris, http://dx.doi.org/10.1787/5js6ds9b6kjb-en.
OECD (2008), Growing Unequal? Income Distribution and Poverty in OECD Countries, OECD Publishing,Paris. http://dx.doi.org/10.1787/9789264044197-en.
OECD (2011), Divided We Stand: Why Inequality Keeps Rising, OECD Publishing, Paris, http://dx.doi.org/10.1787/9789264119536-en.
OECD (2013a), Supporting Investment in Knowledge Capital, Growth and Innovation, OECD Publishing,Paris, http://dx.doi.org/10.1787/9789264193307-en.
OECD (2013b), Interconnected Economies: Benefiting from Global Value Chains, OECD Publishing,Paris, http://dx.doi.org/10.1787/9789264189560-en.
ECONOMIC POLICY REFORMS 2016: GOING FOR GROWTH INTERIM REPORT © OECD 201660

1. OVERVIEW OF STRUCTURAL REFORMS IN THE POLICY AREAS IDENTIFIED AS PRIORITIES FOR GROWTH
OECD (2013c), Economic Policy Reforms 2013: Going for Growth, OECD Publishing, Paris, http://dx.doi.org/10.1787/growth-2013-en.
OECD (2014a), The 2012 Labour Market Reform in Spain: A Preliminary Assessment, OECD Publishing,Paris, http://dx.doi.org/10.1787/9789264213586-en.
OECD (2014b), OECD Economic Surveys: Portugal 2014, OECD Publishing, Paris, http://dx.doi.org/10.1787/eco_surveys-prt-2014-en.
OECD (2014c), All on Board – Making Inclusive Growth Happen, OECD Publishing, Paris, www.oecd.org/inclusive-growth/All-on-Board-Making-Inclusive-GrowthHappen.pdf.
OECD (2015a), OECD Economic Outlook June 2015, OECD Publishing, Paris, http://dx.doi.org/10.1787/eco_outlook-v2015-1-en.
OECD (2015b), The Future of Productivity, OECD Publishing, Paris. Accessible from: www.oecd.org/economy/the-future-of-productivity.htm.
OECD (2015c), 2015 Employment Outlook, OECD Publishing, Paris, http://dx.doi.org/10.1787/empl_outlook-2015-en.
OECD (2015d), 2015 Going for Growth, OECD Publishing, Paris, http://dx.doi.org/10.1787/growth-2015-en.
OECD (2015e), OECD Economic Surveys: China 2015, OECD Publishing, Paris, http://dx.doi.org/10.1787/growth-2015-en.
OECD (2015f), OECD Economic Outlook November 2015, OECD Publishing, Paris, http://dx.doi.org/10.1787/eco_outlook-v2015-2-en.
OECD (2015g), “Implementation of the WTO Trade Facilitation Agreement: The Potential Impact onTrade Costs” available from www.oecd.org/trade/tradedev/WTO-TF-Implementation-Policy-Brief_EN_2015_06.pdf.
OECD (2015h), In It Together: Why Less Inequality Benefits All, OECD Publishing, Paris, http://dx.doi.org/10.1787/9789264235120-en.
OECD (2016), OECD Economic Surveys: Israel 2016, OECD Publishing, Paris, http://dx.doi.org/10.1787/eco_surveys-isr-2016-en.
Ollivaud, P. and C. Schwellnus (2013), “The Post-crisis Narrowing of International Imbalances: Cyclicalor Durable?”, OECD Economics Department Working Papers, No. 1062, OECD Publishing, Paris, http://dx.doi.org/10.1787/5k44t7j9sdtc-en.
Sakellaris, P. and D.J. Wilson (2004), “Quantifying Embodied Technological Change” Review ofEconomic Dynamics 7 (2004) 1-26.
ECONOMIC POLICY REFORMS 2016: GOING FOR GROWTH INTERIM REPORT © OECD 2016 61


Economic Policy Reforms 2016
Going for Growth Interim Report
© OECD 2016
Chapter 2
Reform prioritiesin a difficult macro context
This chapter reviews the main issues related to the short-term impact of structuralreforms in different macroeconomic contexts and takes stock of existing theoreticaland empirical studies. Taking reforms introduced in “normal” times as abenchmark, it reviews the available evidence on the impact of reforms that areimplemented in “bad” times – i.e. in the presence of a sizeable negative output gapand persistently weak demand – as well as under different assumptions regardingthe availability or effectiveness of macroeconomic policies in supporting the reforms.In doing so the chapter focuses on the key channels through which different reformsinfluence short-term activity via the main components of demand and discusseshow these channels operate under different macro conditions.
The statistical data for Israel are supplied by and under the responsibility of the relevant Israeli authorities.The use of such data by the OECD is without prejudice to the status of the Golan Heights, East Jerusalemand Israeli settlements in the West Bank under the terms of international law.
63

2. REFORM PRIORITIES IN A DIFFICULT MACRO CONTEXT
Reform priorities in a difficult macro context
Main Findings
● In a context of weak demand, structural reform strategies should put more weight on
measures that in addition to stimulating medium-term employment and productivity
can best support demand in the short term. The reforms most likely to achieve this
include:
❖ Shift in the composition of public spending towards investment: More specifically, public
infrastructure investment that effectively increases the growth potential in the
medium term (e.g. high-speed broadband network) can stimulate private investment
in the short term.
❖ Product market reforms in specific service sectors: Reforming rules restricting the entry of
new suppliers (exclusive rights) and the capacity of existing suppliers to compete (fees
control) in services characterised by relatively low entry costs (e.g. professional services,
taxis, etc.) can yield positive short-term gains in employment and domestic demand.
❖ Reforms of benefit entitlements in the areas of pension or health: Reforming pension or
health systems to contain future ageing-related costs can create the space for short-
term stimulus measures and raise their effectiveness, notably through increased
confidence in the sustainability of public finances. The gains from such reforms can
exceed the cost in the short term to the extent that only future benefits are reduced.
❖ Reforms easing frictions in the reallocation of resources: Reducing barriers to geographic or
jobs mobility can increase the speed of employment gains in difficult times. Housing
market policies that promote residential mobility include the lowering of transaction
taxes or costs on buying properties as well as the reduction of the stringency of rental
regulation.
● In contrast, the risks that reforms fail to lift activity in the short run – or that they even
further depress demand – are highest in the case of reforms that initially put downward
pressures on wages or mark-ups, such as reforms of employment protection legislation,
minimum wages or product market regulation in network industries. A number of
measures could help mitigate those risks:
❖ Reform packaging: Simultaneous reforms of labour and product markets may reduce
the risk or extent of contractionary effects. First, the price reduction resulting from
product market reforms will ease the downward pressure on the real wage from labour
market reforms. Second, labour market reforms will facilitate the necessary
reallocation of workers arising from product market reforms as rents are redistributed
across firms and sectors.
❖ Reform synchronisation: In the case of the euro area, a greater synchronisation of
reforms will also help reduce the transition costs by giving greater scope to monetary
policy to mitigate the potential rise in real interest rates.
ECONOMIC POLICY REFORMS 2016: GOING FOR GROWTH INTERIM REPORT © OECD 201664

2. REFORM PRIORITIES IN A DIFFICULT MACRO CONTEXT
● Increasing the short-term payoff from structural reforms also calls for measures that
shift the relative strength of the transmission channels from supply-side reforms to
demand components.
❖ Addressing financial sector dysfunctions to improve the credit flow: Significant progress has
been achieved in cleaning the banking sector balance sheet following the crisis.
However, the share of non-performing loans in the banking system remains relatively
high in a number of euro area countries. In fact, the relative speed at which banks’
balance sheets were consolidated in the United States may have helped support the
faster recovery.
❖ Reducing policy uncertainty: Reform strategies that are well communicated and
sufficiently comprehensive to create synergies may also provide clearer guidance and
confidence about the direction and sustainability of policy decisions.
IntroductionQuantifying the long-term gains from structural reforms with some degree of
precision is not straightforward but there is at least broad consensus on the direction of
impact and the main channels of transmission. Assessing the short-term effects is more
challenging: not only are the various channels of influence more difficult to disentangle
but the macro context in which the reforms are introduced raises ambiguity as to the
direction of the impact.
Progress has been made in better understanding how reforms of product and labour
markets affect the main components of supply and demand in the short term and hence
how they impact on output gaps, external accounts and relative prices.1 While a further
understanding of the short-run dynamic effects of reforms is still needed, it is particularly
so in the case where reforms are introduced in a context of persistently weak demand,
deflationary pressures, sizeable negative output gaps, and with only a partial support from
demand-management policies. One concern is that some reforms may have a short-term
contractionary effect on activity, prices or employment.
For instance, such concern has been raised and debated in the context of reforms
introduced at a time when monetary policy is constrained due to nominal interest
rates hitting the zero lower bound (Eggertson, Ferrero and Raffo, 2014; Fernández-
Villaverde, 2014; Vogel, 2014). More generally, the experience of southern euro area
countries, which have implemented significant reforms in a context of aenemic domestic
and external demand as well as without the support of macro policies, has led to renewed
interest in better understanding the links between reforms and demand and raised
questions about the timing, sequencing and packaging of reforms.
Against this background, this chapter reviews the main issues related to the short-
term impact of structural reforms in different macroeconomic contexts and takes stock of
existing theoretical and empirical studies. An effort is made to assess the extent of
knowledge about the short-term demand effect of specific structural reforms. This impact
can have a huge bearing on political feasibility, as transitional losses are likely to erode
popular support for reforms.
To set the scene, the next section lays out the case of reforms introduced in “normal”
times, i.e. with the economy operating close to potential and with available support of
macroeconomic policies. It identifies the main channels through which structural reforms
influence short-term activity through consumption, investment and net exports. The
ECONOMIC POLICY REFORMS 2016: GOING FOR GROWTH INTERIM REPORT © OECD 2016 65

2. REFORM PRIORITIES IN A DIFFICULT MACRO CONTEXT
subsequent section then focuses on the case where reforms are introduced in “bad” times,
i.e. with a sizeable negative output gap and persistently weak demand, and examines how
the more adverse environment influences the relative strengths of the main channels. The
final section goes one step further and considers cases where reforms are implemented in
a weak conjuncture and under constrained macro policies.
Structural reforms in normal timesThe speed at which gains from structural reforms can be achieved depends on several
factors, even in normal times, that is when cyclical factors are not at play. First, the
credibility of announced reform packages plays a key role. Households and firms are more
likely to act early in response to reforms if they believe in the implementation and the
sustainability of the policy measures as a permanent change. Second, structural
characteristics of the economy, including the structural policy settings in place will shape
the speed at which a reform yields benefits. For instance, stronger price or wage stickiness
is likely to delay the long-term benefit of reform, ceteris paribus, by constraining the scope
and speed of real variables to adjust to the policy change. Third, well-functioning financial
markets play a key role in bringing forward the gains from reforms by funding the
necessary investment and allowing for income smoothing both in anticipation of future
gains and to offset temporarily income loses (OECD, 2012).
Mainstream models predict a number of channels of transmission through which
structural reforms affect the main components of demand. The key channels include
i) wealth or permanent income effects which bring forward future reform-driven income
gains in current consumption and investment, notably through rising asset prices and
positive confidence channels, ii) disposable income and cash-flow effects for households and
firms that are liquidity or cash-flow constrained, i.e. that do not have access to borrowing
from banks or other financial institutions iii) uncertainty or negative confidence effects arising
from households’ and firms’ perception of heightened (or diminished) income and profit
insecurity, which come through the precautionary motive for saving and iv) a real interest
rate channel which captures inter-temporal substitution effects: by making the holding of
financial assets more attractive, a rise in the real interest rate induces a decline in current
consumption in favour of higher savings. In addition, some reforms have budgetary
implications when not introduced in a budget-neutral way and will affect demand
through a fiscal multiplier effect. In what follows, the discussion considers mainly
budget-neutral reforms.
What does the evidence tell us about the short-run impact of reformsin normal times?
A more detailed analysis of the impact of different types of reforms on short-term
demand and activity through these channels is reported in Appendix 2.1. This analysis
essentially comes from studies that simulate the impact of reforms, in particular based on
dynamic stochastic general equilibrium (DSGE) models. There are also a few empirical
studies looking at changes in policy indicators to define structural reform episodes and to
estimate their short-term effects (Bouis et al., 2012). In any case, the empirical literature
looking at the short-term effect of reforms mostly refer to normal times, that is when
macro policies can react to short-term demand developments. Therefore, when macro
ECONOMIC POLICY REFORMS 2016: GOING FOR GROWTH INTERIM REPORT © OECD 201666
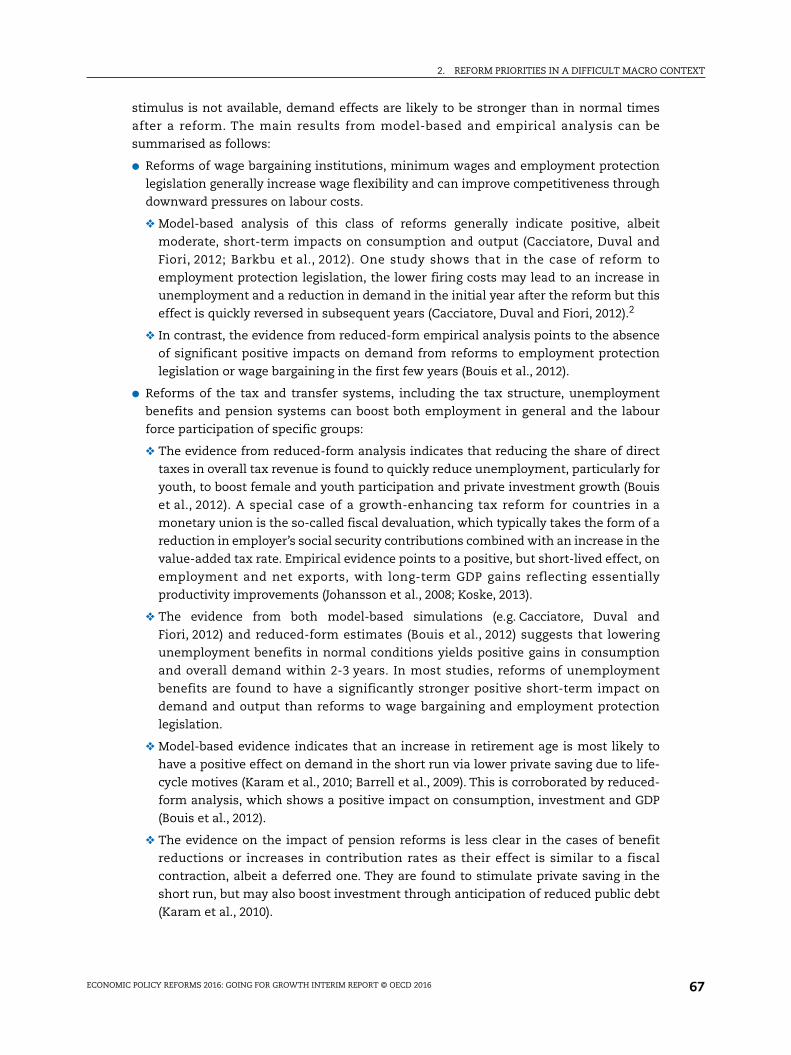
2. REFORM PRIORITIES IN A DIFFICULT MACRO CONTEXT
stimulus is not available, demand effects are likely to be stronger than in normal times
after a reform. The main results from model-based and empirical analysis can be
summarised as follows:
● Reforms of wage bargaining institutions, minimum wages and employment protection
legislation generally increase wage flexibility and can improve competitiveness through
downward pressures on labour costs.
❖ Model-based analysis of this class of reforms generally indicate positive, albeit
moderate, short-term impacts on consumption and output (Cacciatore, Duval and
Fiori, 2012; Barkbu et al., 2012). One study shows that in the case of reform to
employment protection legislation, the lower firing costs may lead to an increase in
unemployment and a reduction in demand in the initial year after the reform but this
effect is quickly reversed in subsequent years (Cacciatore, Duval and Fiori, 2012).2
❖ In contrast, the evidence from reduced-form empirical analysis points to the absence
of significant positive impacts on demand from reforms to employment protection
legislation or wage bargaining in the first few years (Bouis et al., 2012).
● Reforms of the tax and transfer systems, including the tax structure, unemployment
benefits and pension systems can boost both employment in general and the labour
force participation of specific groups:
❖ The evidence from reduced-form analysis indicates that reducing the share of direct
taxes in overall tax revenue is found to quickly reduce unemployment, particularly for
youth, to boost female and youth participation and private investment growth (Bouis
et al., 2012). A special case of a growth-enhancing tax reform for countries in a
monetary union is the so-called fiscal devaluation, which typically takes the form of a
reduction in employer’s social security contributions combined with an increase in the
value-added tax rate. Empirical evidence points to a positive, but short-lived effect, on
employment and net exports, with long-term GDP gains reflecting essentially
productivity improvements (Johansson et al., 2008; Koske, 2013).
❖ The evidence from both model-based simulations (e.g. Cacciatore, Duval and
Fiori, 2012) and reduced-form estimates (Bouis et al., 2012) suggests that lowering
unemployment benefits in normal conditions yields positive gains in consumption
and overall demand within 2-3 years. In most studies, reforms of unemployment
benefits are found to have a significantly stronger positive short-term impact on
demand and output than reforms to wage bargaining and employment protection
legislation.
❖ Model-based evidence indicates that an increase in retirement age is most likely to
have a positive effect on demand in the short run via lower private saving due to life-
cycle motives (Karam et al., 2010; Barrell et al., 2009). This is corroborated by reduced-
form analysis, which shows a positive impact on consumption, investment and GDP
(Bouis et al., 2012).
❖ The evidence on the impact of pension reforms is less clear in the cases of benefit
reductions or increases in contribution rates as their effect is similar to a fiscal
contraction, albeit a deferred one. They are found to stimulate private saving in the
short run, but may also boost investment through anticipation of reduced public debt
(Karam et al., 2010).
ECONOMIC POLICY REFORMS 2016: GOING FOR GROWTH INTERIM REPORT © OECD 2016 67
2. REFORM PRIORITIES IN A DIFFICULT MACRO CONTEXT
● Measures to improve job-search assistance and training for the unemployed or childcare
services can raise labour force participation and address labour market frictions.
However, these typically have implications for public spending and should be carefully
assessed on a budget-neutral basis to capture the effects coming from the structural
changes:3
❖ In the case of a budgetary-neutral reform of active labour market policies (ALMPs), the
effect is found to be similar to that of a tightening of unemployment benefits
(Cacciatore, Duval and Fiori, 2012), except that by lowering firms’ search costs or the
costs of initial training, they may stimulate labour demand somewhat more rapidly.
● Product market reforms comprise essentially reductions in regulatory barriers to
competition which can lead to lower mark-ups and export prices, lower input prices (and
production costs) for downstream industries, and higher productivity through efficiency
gains and improved product quality and variety through higher investment in
innovation.
❖ By and large, model-based evidence points to modest short-term GDP gains from
product market reforms, with more visible impacts appearing after 2-3 years
(Anderson et al., 2014); (Barkbu et al., 2012).
❖ Evidence from reduced-form empirical analysis based on aggregate data shows no
significant short-term impact on GDP, except for a decline in the initial year, due to a
temporary drop in investment (Bouis et. al., 2012). Evidence based on sector-level data
indicates that productivity gains can be achieved after 2-3 years (Bourlès et al., 2013;
Dabla-Norris et al., 2015).
❖ The overall results at the aggregate level may mask very different outcomes depending
on whether barriers to competition are lowered in manufacturing or service sectors,
and within services whether the reforms affect primarily network industries
(e.g. energy, telecoms and transport) or professional services, where regulatory
barriers to entry and strict conduct regulation may create strong latent demand.
Overall, the bulk of evidence suggests that the gains from pro-growth structural
reforms introduced in normal times generally exceed the potential losses even in the short
run. This is generally the case including with reforms aimed at restoring competitiveness
through lower relative production costs and prices. However, the positive effect is in many
cases modest, especially in the three-year horizon. The aggregate benefits from reforms to
unemployment benefits or pension systems (retirement age) tend to accrue more rapidly
than those from other types of reforms, in particular the ones primarily focused on raising
wage flexibility and facilitating resource reallocation. Furthermore, the modest net effect
of reforms often masks more substantial shifts in the composition of demand, not only
between domestic and foreign, but also within domestic demand, reflecting the opposite
impact that reforms have on investment and consumption in the case of some reforms.
Initial conditions and reform implementation play a role
The short-term effects of structural reform in one area may depend in part on initial
policy and institutional settings in other areas. However, the evidence is inconclusive to the
extent that it is difficult to empirically identify how interactions between policy settings
and reforms affect outcomes (e.g. Bassanini and Duval, 2009; Bouis et al., 2012). For
instance, model-based simulations by Cacciatore et al. (2012) find that gains in the
aftermath of product market reforms would be quicker if initially job protection is less
ECONOMIC POLICY REFORMS 2016: GOING FOR GROWTH INTERIM REPORT © OECD 201668
2. REFORM PRIORITIES IN A DIFFICULT MACRO CONTEXT
stringent and unemployment benefits are low. That is because when entry barriers fall,
new jobs are filled more quickly, minimising the risks of lengthy unemployment spells for
laid-off workers. On the other hand, findings from reduced-form empirical analysis show
that under initially weak job protection a relaxation of product market regulation leads to
higher unemployment and lower employment (Bouis et al., 2012).
How reform is implemented also matters as there can be material interaction effects
between policies:
● Reform packages: a package of labour and product market reforms that is sufficiently
broad can induce a faster adjustment and alleviate the transitional costs of certain
reforms (Anderson Hunt and Snudden, 2014; Cacciatore et al., 2012; Everaert and
Schule, 2008, Gomes et al., 2013). For instance, (Cacciatore et al., 2012) find that a
combination of product market, job protection and unemployment benefit reforms
boosts GDP, employment and wages immediately, in contrast with the effects of some of
these reforms taken in isolation.
● Reform credibility: Early announcement and credible commitment to future reforms can
help bring forward the gains from reforms by fostering investment and consumption
today. Adjémian et al., (2007) find that announcing product market reforms in advance
can trigger an immediate response by firms, accelerating the upside adjustment in
investment and output even before the reform is actually implemented.
● Pace of reforms: theoretical studies suggest that outcomes might be better if reforms were
sequenced, with product market reforms preceding labour market reforms (Blanchard
and Giavazzi, 2003). Reforming product markets first can also lower the resistance to
labour market reforms by reducing rents and facilitate their subsequent
implementation. Another political argument for gradualism is that as governments have
a fixed amount of political capital, it is best if they allocate their scarce resources to one
set of reforms at a time (Coeuré, 2014). However, too long a time lag between reforms
might not be desirable. For instance, in the case of New Zealand’s reforms in the 1980s a
significant time lag (about five years) between the liberalisation of product markets and
labour market reforms mitigated the potential overall gains from reforms (Caldera
Sánchez, de Serres and Yashiro, 2016).
● Boldness of reforms: Recent empirical analysis has found that incremental labour market
reforms tend to raise household income instability while bolder reforms do not,
increasing the risk of resistance and reversal in the former case (Cournède et al., 2015).
Structural reforms under weak demand conditionsThe previous section has shown that the short-term impact of reforms on the main
components of demand often depends on the net outcomes of conflicting channels. The
short-term impact from many types of reforms depends notably on the net effect on
disposable income and cash-flow as well as the relative strength of the wealth effect versus
the precautionary motive for savings. While the bulk of evidence indicates that positive
channels dominate the negative ones in normal times, it may no longer be true when
reforms are introduced at an unfavourable stage in the business cycle.
Several factors shift the relative strengths of these channels in downturns. First, the
proportion of households and firms facing liquidity constraints can be expected to rise
along with unemployment and the tightening of credit conditions, which are often features
of downturns (Bernanke and Gertler, 1989; Fissel and Jappelli, 1990). Second, even for
ECONOMIC POLICY REFORMS 2016: GOING FOR GROWTH INTERIM REPORT © OECD 2016 69

2. REFORM PRIORITIES IN A DIFFICULT MACRO CONTEXT
households or firms that are not liquidity-constrained, the positive wealth effect of
reforms is likely to be weaker, especially if the downturn is associated with dysfunctions in
financial markets or the need for private-sector deleveraging. Conversely, the
precautionary motive for saving in the face of reforms is likely to be higher in a bad
conjuncture. Heightened macro-economic and policy uncertainty can lead households and
firms to postpone spending and investment “to wait and see”. Finally, the efficiency of job
matching may deteriorate in periods of persistent unemployment, given a rising share of
long-term unemployed and declines in housing prices. Some of these factors may also
condition the effectiveness of fiscal and monetary policies in supporting demand.
Reforms reducing the cost of labour and mark-ups are more likely to depress demandduring downturns
Reforms entailing a bigger risk of further depressing demand in downturns include
those whose most immediate impact is to put downward pressures on wages or mark-ups.
● Product market reforms that enhance competition in formerly protected sectors usually
lead to incumbents to engage in restructuring as they seek efficiency gains to preserve
mark-ups in the face of downward pressures on prices. In turn, this leads to the
displacement of workers and capital in the short run (Blanchard, 2006). Stronger
competition also leads to the exit of least productive firms. In normal economic
conditions, displaced resources are absorbed eventually by new entrants, more
competitive firms that are expanding production or by other sectors. As a result of more
efficient resource allocation, aggregate productivity increases and as lower prices
stimulate demand employment is also expected to increase. However, when the
economy is in a slump, demand may respond less to the lower prices resulting from
competition. In such context, displaced resources are expected to remain unemployed
for longer as a bleaker profit outlook and credit constraints slows the entry of new firms
or the expansion of incumbent firms (Lee and Mukoyama, 2015; Barlevy, 2003; EC, 2013).
● Reforms of wage bargaining institutions or the minimum wage have an uncertain effect
on demand in the short term during a downturn. The downward pressures on wages
may not be as rapidly compensated by employment gains and the prospects of future
productivity-related income gains as they would in normal times. This will weaken
consumer demand in the short term by lowering disposable income and strengthening
precautionary savings. An easing of employment protection legislation may lead to a
similar outcome, as the outflow from unemployment may take more time to exceed the
rise in the inflow rate than in normal times.
● Reforms that drive wages down and increase product market competition can boost
competitiveness and net exports but their ultimate impact on aggregate demand may be
muted in an environment of weak external demand, such as a global downturn.
Conversely, Canada, Germany and Sweden have in the past introduced major reforms in
a context of weak domestic demand but benefited from robust global trade growth
helping to revive their economies relatively quickly (Caldera Sánchez, de Serres and
Yashiro, 2016).
Reforms raising incentives to take-up work may be contractionary during downturns
Reforms reducing the generosity of unemployment benefits (replacement rate and
duration) are effective in reducing unemployment in the short run by encouraging the
unemployed to intensify job search and accept existing offers, thereby increasing outflows
ECONOMIC POLICY REFORMS 2016: GOING FOR GROWTH INTERIM REPORT © OECD 201670

2. REFORM PRIORITIES IN A DIFFICULT MACRO CONTEXT
during(i.e. thends to
323963
-2.0
-1.5
-1.0
-0.5
0.0
0.5
1.0
1.5
2.0
2.5
3.0
6
from unemployment. However, when labour demand is weak reducing unemployment
insurance could lower disposable income if no jobs are available in the short run,
negatively impacting demand. Indeed, evidence shows that when unemployment benefit
reforms are undertaken during a typical economic upturn employment increases after two
or three years (Figure 2.1). In contrast, if it is undertaken during a typical downturn, the
gain in employment is muted and even turns negative from the third year after the reform.
Other reforms aimed at increasing labour supply are also likely to be less effective in
boosting employment and may even be contractionary when labour demand is weak. For
instance, tax reforms to remove the fiscal disincentives to second earner’s labour
participation (such as reduction of spousal tax credits) or reforms that tighten access to
disability benefits may not increase employment much if implemented in a context of
weak demand, given that the targeted groups may face even more difficulties in finding
work than the other unemployed. Instead, they may lower private consumption by
reducing household disposable income, if the measure is introduced also to generate
budgetary savings.
Indeed, one factor contributing to the higher risk of a negative impact of reforms is the
potential increase in skills and geographical mismatches, combined with the heightened
pressures on resources devoted to job-search assistance and training programmes. Even
though evidence on mismatches is not always easy to interpret, increasing mismatches are
a recurrent concern during cyclical downturns insofar as the impact differs across
industries and regions (OECD, 2011). In such a case, a depressed housing market may slow
geographical mobility, in particular where mobility is already hampered by housing and
rental market policies that create high transaction costs (Andrews et al., 2011). Also, active
labour market policies that focus on the least employable workers may be less effective in
Figure 2.1. The gains in employment of an unemployment benefit reformcan turn negative during a downturn
1. The lower (upper) line corresponds to the impact of the reduction in the initial unemployment benefit replacement rateeconomic downturn (upturn), where the economic cycle is measured through the level of the pre-reform unemployment gapdifference between the structural unemployment rate and the unemployment rate). The economic downturn (upturn) correspothe case where the unemployment gap is set to the minimum (maximum) value within the sample.
Source: Bouis et al. (2012).1 2 http://dx.doi.org/10.1787/888933
-2.0
-1.5
-1.0
-0.5
0.0
0.5
1.0
1.5
2.0
2.5
3.0
1 2 3 4 5
Percentage points
Years after the shock
Economic upturn¹
Economic downturn¹
ECONOMIC POLICY REFORMS 2016: GOING FOR GROWTH INTERIM REPORT © OECD 2016 71
2. REFORM PRIORITIES IN A DIFFICULT MACRO CONTEXT
downturns. Reinforcing job-search assistance may not help in this case as the probability
of reemployment does not depend so much on search efforts when there is a lack of jobs
(Boeri et al., 2015). Hence, there may be a case for shifting the focus on workers early in the
unemployment spells as the chances to find a job are higher. 4
Demand-side policies mitigate a negative impact from reforms in the short run whendemand is weak
The short-term effect of reforms in downturns and the extent to which adverse effects
can be quickly over-turned also depends on the timeliness and effectiveness of macro
policies. As regards, monetary policy, its effectiveness in stimulating aggregate demand in
the short run will in part depend on how well the financial market is functioning and on
the share of liquidity constrained households and firms. A dysfunctional financial sector
makes it harder for funds to flow to new investment opportunities, which is critical for
reforms to pay off. On the other hand, a higher share of liquidity constrained agents may
make monetary policy more effective by reducing the cost of debt services, leaving the net
effect unclear.
The effectiveness of fiscal policy may be enhanced during recessions due to higher
multiplier effects (Auerbach and Gorodnichenko, 2013; Blanchard and Leigh, 2013). During
a recession government spending is less likely to cause an increase in the interest rate and
crowd out private consumption and investment, provided long-term fiscal sustainability is
not at risk. Similarly, the increase in the proportion of liquidity-constrained firms and
households who have a higher propensity to consume out of their income makes fiscal
policy more effective during a downturn (Galí et al., 2007), especially during a financial
crisis or when the financial sector is weak (Corsetti et al., 2012).
The largest short-run impact on aggregate demand is likely to come from government
spending measures rather than from tax cuts (e.g. Mineshima et al., 2014). This is largely
because spending measures have a direct impact on aggregate demand while tax
reductions will have a muted effect if they are saved because of, for instance, high
uncertainty. In practice, fiscal stimulus measures can be designed on both the spending
and tax side to have a rapid and substantial multiplier effect.
Among spending measures, public investment is usually found to be the most powerful
instrument (Röhn, 2010). Boosting investment in public infrastructure is a typical way to
boost demand during a downturn, as it pulls demand today, as opposed to other investments
(e.g. R&D or education) that need longer to pay off. An increase in public infrastructure
investment boosts aggregate demand via two channels, first, through the short-term fiscal
multiplier, and second, by crowding in private investment. Indeed, evidence suggests that
the positive short-term effect on demand is even stronger when there is economic slack –
less crowding out of private investment –, and monetary policy is accommodative
IMF (2014). Furthermore, the productivity gains from infrastructure shocks are significantly
higher during downturns (Dabla-Norris et al., 2015). In the European Union, removing
financial barriers and harmonising regulations, in particular in the area of network
industries, would help achieve a higher return on investment.5
Some tax reductions can also be put in place to increase household disposable income
and boost spending in the short term. While in theory consumption should not respond much
to temporary changes in taxes, as consumers are likely to spread out their consumption
over their lifetimes, evidence suggests that in some cases temporary tax reductions can be
ECONOMIC POLICY REFORMS 2016: GOING FOR GROWTH INTERIM REPORT © OECD 201672

2. REFORM PRIORITIES IN A DIFFICULT MACRO CONTEXT
effective in boosting consumption spending in the short term. For instance, the income tax
rebates the US federal government enacted in 2001 and 2008 as part of its economic
stimulus packages significantly boosted spending in the short term, especially for
households with low liquid wealth or low income (Johnson et al., 2006; Parker
et al., 2013).6Reductions in labour taxes or social security contributions targeted to lower-
income workers, can also increase aggregate demand in the short term, as spending by this
group is closely tied to their disposable income (De Mooij and Keen, 2013).
The scope for expansionary fiscal policy may, however, be limited when long-run fiscal
constraints are significant. An increase in government spending (or tax cuts) in countries
with high debt levels may act as a signal that fiscal tightening will be required in the near
future. The anticipation of such adjustment could have a contractionary effect – through
for instance adverse effects on financial markets, interest rates and consumer spending –
that would offset the short-term expansionary effects. Ricardian behaviour, implying that
fiscal stimulus is at least partly offset through an increase in private sector savings, is
stronger the higher the level of government debt (Röhn, 2010). Moreover, in a financial
crisis, debt financed spending expansions might reinforce a negative feedback loop
between bank and government balance sheets when government debt is high.
Structural reforms under weak demand and constrained macroeconomic policiesMonetary and fiscal policies may be limited in various ways in practice, making it
difficult to smooth the transitional dynamics associated with structural reforms. This
section discusses the short-run impacts of structural reforms when weak demand
is compounded by three types of constraints: monetary policy has hit the zero lower
bound and has to rely on unconventional monetary tools; participation in a monetary
union; and fiscal policy is constrained by consolidation requirements or legislated bounds
on the fiscal deficit.
Reforms at the Zero Lower Bound (ZLB)
The zero lower bound (ZLB) brings an additional channel through which structural
reforms may lower demand and output in the short run, namely an increase in the real
interest rate. In principle, structural reforms that boost aggregate supply can, in a weak
demand environment, have a negative impact in the short run by putting downward
pressures on prices and inflation expectations if the monetary policy stimulus cannot
be increased. The inability of the monetary authority to adjust nominal interest
rates in response to falling expectations would push up the real interest rate, further
depressing rather than stimulating aggregate demand (Eggertsson et al., 2014; Fernández-
Villaverde, 2014).
In practice, this may be an issue only for a relatively limited set of reforms, mostly
those that enhance competitiveness through downward pressures on domestic production
costs and mark-ups. In the case of reforms that boost productivity through innovation and
the reallocation of resources, it is less clear how much of an increase in production
capacity can be achieved in the presence of anaemic demand, given the more limited
incentives to make the necessary investments. Even if firms do invest, given the time
required for these investments to translate into higher supply and downward pressures on
inflation expectations, economies may have moved away from the ZLB, hence allowing
ECONOMIC POLICY REFORMS 2016: GOING FOR GROWTH INTERIM REPORT © OECD 2016 73

2. REFORM PRIORITIES IN A DIFFICULT MACRO CONTEXT
monetary policy to react by lowering nominal interest rates. In any case, structural reforms
that raise future potential growth will also increase the natural real interest rate, thereby
reducing the stringency of the ZLB.
Furthermore, other factors will contribute to mitigate the potential adverse real
interest rate effect, even in the case of reforms that do result in rising real interest rates.
First, liquidity-constrained households will not be very sensitive to the real interest rate
increases but will benefit from falling price levels (Vogel, 2014). Second, insofar as the
reforms yield competitiveness gains, increases in net exports will help mitigate the
downward pressures on domestic demand, although this may not be sufficient to offset the
impact of higher real interest rates (Eggertsson et al., 2014). Third, reforms leading to a
price level adjustment need not create disinflationary expectations if the change is bold
and implemented in a short time period rather than incremental and introduced gradually
(Coeuré, 2014).7
Finally, in a country with its own currency, the presumption that monetary policy is
incapable of responding to a deflationary shock at the ZLB is debatable given the now
widespread use of unconventional monetary policies and their effectiveness in boosting
demand up to a point. However, there is concern that unconventional tools could be
insufficient in a context of falling real neutral interest rates and persistent negative output
gaps, raising the risk of a downward spiral in output and inflation. In such a context, it is a
priori unclear whether structural reforms would reduce the risks by raising the long-term
real neutral rate or increase the risks by temporary increasing deflationary pressures. Such
concerns are of particular importance in countries that do not have their own monetary
policy, where cost-cutting structural reforms should be considered with particular
attention and be part of wider policy packages.
Reforms in a monetary union
The real interest rate channel that plays a role at the zero lower bound also operates
in a monetary union, even in normal times. With nominal rates set at the union-wide level,
reforms undertaken by one member alone to reduce relative wages and prices could lead
to a higher real interest rate. In such a case, internal devaluations can be contractionary in
the short term, especially during a period of weak demand, as the positive gains on
competitiveness and growth through a reduction in labour costs and domestic prices can
be outweighed by the negative effects from higher real interest rates.8Furthermore, for
countries in a monetary union, changes in the real exchange rate must come through
adjustments in relative labour costs and prices. In the case of reforms that lead to a real
exchange rate depreciation, such adjustment can be costly. This is especially the case
when inflation in the union as a whole is near zero, as real depreciation would require
reductions in nominal wages and prices.
On the other hand, fiscal devaluations – a reduction of employer’s social security
contributions combined with an increase in value-added (VAT) tax rate – is a type of measure
that may have more traction for countries in a monetary union, in particular as a means to
boost competitiveness and exports in the short run. As mentioned above, a fiscal devaluation
is a special case of a reform that shifts taxation from more distortive (direct) sources to less
distortive (indirect) ones. Such shifts have been found to yield permanent gains in output
and productivity levels in the longer run. An additional competitiveness channel operates in
the short term in the case of a monetary union, as long as not too many members introduce
a similar reform at the same time, in which case the impact on net exports of each is
ECONOMIC POLICY REFORMS 2016: GOING FOR GROWTH INTERIM REPORT © OECD 201674
2. REFORM PRIORITIES IN A DIFFICULT MACRO CONTEXT
diminished. With nominal wages fixed in the short run, a reduction in social security
contributions rates lowers labour costs. If the fall in labour costs is passed on into prices,
both export and domestic good prices fall leading to a boost in competitiveness. By contrast,
the higher VAT only bears on domestic and import goods, but not on exports and, therefore
will not dampen the positive effect on competitiveness and net exports.
The magnitude of the short-run benefits of a fiscal devaluation is, however, uncertain.
Model-based simulations suggest that fiscal devaluations have beneficial, but moderate,
short-term effects on net exports, output and employment (Koske, 2013). For instance, for
Portugal, a fiscal devaluation of 1% of GDP would lift net exports by 0.1% of GDP in the first
year of the reform (EC, 2011). By contrast, econometric estimates for the euro area show
much larger effects in the short run, of an immediate impact on net exports of up to 4% of
GDP for a 1% GDP shift in revenues (De Mooij and Keen, 2013). Given the uncertainty
surrounding the short-term benefits, a fiscal devaluation cannot thus be a substitute for
more fundamental reforms of labour and product markets to sustainably boost
competitiveness, but can help sustain demand in the short term.
Reforms under budgetary constraints and public finance consolidation
An expansionary fiscal policy can compensate the lack of support from monetary
policy in addressing the demand shortfall, especially for euro area countries which cannot
expect an expansionary monetary policy by the ECB to accommodate their individual
reforms. However, the fiscal space in many OECD countries has been limited either
because they have to engage in fiscal consolidation, face high debt financing costs or their
fiscal balances are bound by rules. Indeed, for several countries needing to put public
finances on a sustainable path, fiscal policy has been contractionary until recently.
Negative impacts of fiscal consolidation are likely to be more pronounced during weak
demand times as fiscal multipliers are significantly larger during economic recessions
than expansions (Auerbach and Gorodnichenko, 2013).
Tight fiscal conditions and a limited ability of the government to cushion the
transitory costs for losers may increase some of the contractionary effects of structural
reforms in the short run (Duval, 2008). For instance, reforms that increase flexibility in
employment protection and wage formation can negatively impact private consumption if
governments cannot mitigate the increase in income risks with an expansion of
unemployment benefits or active labour market policies (ALMPs). Fiscal constraints are
particularly a concern if they undermine the ability of countries to carry out structural
reforms that entail higher spending (e.g. in ALPMs, R&D or childcare), less revenue
(e.g. labour taxes), or up-front public spending, for instance through transfer schemes, to
compensate reform losers. Furthermore, they can also reduce the feasibility of growth-
enhancing structural policies that could enhance short-term as well as long-term growth,
such as high-quality infrastructure investment.
The urgency in the fiscal situation may bias structural reforms toward those that
realise fiscal savings rapidly, but may be contractionary in the short run. An example of
such reforms is a reduction in welfare expenditure that for example took place in
New Zealand in the early 1990s amid the strong need for fiscal consolidation (Caldera
Sánchez, de Serres and Yashiro, 2016). While a strong pressure to reduce public spending
may facilitate the implementation of reforms to public-sector administration and services,
the success of the reforms in terms of raising cost-effectiveness and quality may be
undermined if priority needs to be given to immediate budgetary savings.
ECONOMIC POLICY REFORMS 2016: GOING FOR GROWTH INTERIM REPORT © OECD 2016 75
2. REFORM PRIORITIES IN A DIFFICULT MACRO CONTEXT
Reforms likely to boost short-run demand when demand is weak and macroeconomicpolicies are constrained.
Some reforms can be expansionary even under relatively weak demand and
constrained macroeconomic policies if they encourage investment or generate rapid
job gains:
● Product market reforms that ease supply constraints. Reducing entry barriers in service
sectors with large pent-up demand and low entry costs can unleash the entry of new
firms, boosting investment and job creation relatively fast. Simulations for Italy show
that half of the gains of reforms that facilitate the entry of new firms in the service sector
would be realised within three years (Forni et al., 2010). Case studies have also found
that liberalisation in sectors such as retail trade and telecommunications often resulted
in fast decreases in prices and increases in output and employment (Bertrand and
Kramarz, 2002; Faini et al., 2006; Skuterud, 2005). Another example is professional
services that remain heavily regulated in many countries (i.e. legal, accounting,
engineering and architecture professions), especially as regards entry regulations
(Figure 2.2). As such reforms reduce the relative price of non-tradables, their impact on
net exports will be similar to that of an internal devaluation, with additional positive
effects due to the fact that non-tradables are a major input into tradables.
● Reforms that improve confidence or reduce uncertainty regarding future economic conditions: By
improving the sustainability of public finances, credible reforms in pensions and
healthcare systems can boost consumption today through wealth effects and reduced
need for precautionary saving. Empirical studies have, indeed, shown that the risk of
unexpected healthcare expenditure is an important motive of precautionary saving, and
policies that improve access to medical insurance increase consumption (Gruber and
Yelowitz, 1999; Jappelli et al., 2007; Bai and Wu, 2014). However, such reforms may be less
effective in reducing precautionary saving if the volatility of income and the risk of
unemployment is very high (Mody et al., 2012). Product market reforms that reduce the
economy-wide administrative burdens on firms and reduce the initial cost of starting-up
a business can also improve expectations on future business conditions. For instance,
simulations suggest that reforms to reduce the initial costs of starting-up a business
implemented during the crisis in Italy, Portugal and Spain have significantly raised the
birth rate of firms in those countries (Ciriaci, 2014).
Overall, the review of the evidence on the effects that specific reforms can have on
demand when introduced in a difficult macro context allows for a tentative hierarchy of
reforms to be drawn based on their likely effectiveness (Table 2.1). The measures most
likely to bring short-term benefits even in a bad conjuncture are those aimed at raising
investment in knowledge-based capital, including through infrastructure spending and tax
structure reforms, as well as those focusing on helping unemployed workers to find jobs,
including through higher mobility. In fact, the effectiveness of these measures even tends
to be stronger in a difficult context than in normal times. In the specific case of the euro
area, one reform that is likely to pay-off in a bad conjuncture is the shift in the tax
composition from direct to indirect sources.
Other reforms may have effects that do not necessarily differ much when introduced
in a context of weak demand as compared to a normal conjuncture, which means in most
cases modest short-term benefits. These include measures to raise competition in
professional services sectors or to increase the retirement age. On the other hand, an
ECONOMIC POLICY REFORMS 2016: GOING FOR GROWTH INTERIM REPORT © OECD 201676

2. REFORM PRIORITIES IN A DIFFICULT MACRO CONTEXT
323978
lativerained(3)
U
0.0
0.5
1.0
1.5
2.0
2.5
3.0
3.5
4.0
4.5
5.0
Con
duct
easing of employment protection on regular contracts or reforms of collective wage
bargaining arrangements are more likely to entail short-term costs if introduced in a
difficult context. The same is true for reforms of pension systems, if they involve
reductions in benefits or increases in contributions.
Notes
1. A large number of studies looking at the short-term effect of structural reforms using either amodel-based or reduced-form empirical analysis are reported in Appendix 2.1. More completeinformation, including the review of case studies, can be found in Caldera Sánchez, de Serres andYashiro (2016).
2. The latter owes to the fact that while the destruction of jobs is immediate, job creation tends to begradual as time is needed to match firms and available workers.
Figure 2.2. Regulation in professional servicesIndex scale of 0-6 from least to most restrictive
1. 2008 data instead of 2013.Source: OECD, Product Market Regulation Database.
1 2 http://dx.doi.org/10.1787/888933
Table 2.1. Expected short-term effects of specific reforms on demand
Effect on demandin normal times (1)
Change in effect relativeto (1) due to downturns
but with supportfrom macro policies (2)
Change in effect reto (2) due to const
macro policies
Reduction in regulatory barriers to competition in network industries Increase Weaker Weaker
Reduction in regulatory barriers to entry in professional servicesand retail trade
Increase Equal Equal
Shift in tax composition from direct to indirect sources Small increase Weaker Stronger in EM
Reform of collective wage bargaining arrangement and minimum wages Small increase Weaker Weaker
Easing of employment protection legislation on regular contracts No effect or small decrease Weaker Weaker
Reform of unemployment benefits Increase Weaker Weaker
Strengthening of job search assistance, training and wage subsidy programmes Increase Stronger Stronger
Reforms of pension systems: Increasing retirement ages Increase Equal Equal
Reforms of pension systems: Reducing benefits or raising contributions No effect or small decrease Weaker Equal
Raising incentives for investment in knowledge-based capital, includingthrough infrastructure spending
Increase Stronger Stronger
0.0
0.5
1.0
1.5
2.0
2.5
3.0
3.5
4.0
4.5
5.0
Entry
Con
duct
Entry
Con
duct
Entry
Con
duct
Entry
Con
duct
Entry
Con
duct
Entry
Con
duct
Entry
Con
duct
Entry
Con
duct
Entry
Con
duct
Entry
Con
duct
Entry
Con
duct
Entry
BEL CAN FRA DEU ITA JPN NLD ESP SWE CHE GBR USA¹
2013 2003
ECONOMIC POLICY REFORMS 2016: GOING FOR GROWTH INTERIM REPORT © OECD 2016 77

2. REFORM PRIORITIES IN A DIFFICULT MACRO CONTEXT
3. Model-based simulations indicate that unfunded increases in spending on active labour marketpolicies or childcare services have stronger positive effects on demand within the first two yearsthan after five years (Barkbu et al.; 2012).
4. Insofar as competition for jobs is fiercer in weaker labour markets, active labour marketprogrammes that focus on some workers may improve the search ability of those workers byreducing the relative job-search success of others (Crépon et al. 2013; Michaillat, 2012). A meta-analysis of impact estimates of studies of active labour market programmes by Card, Kluve andWeber (2015) suggests that they are more likely to show positive impacts in a recession.
5. Evidence by Fournier (2015) finds that lower heterogeneity in product market regulations betweentwo countries leads to greater bilateral FDI.
6. The Economic Growth and Tax Relief Reconciliation Act of 2001 gave tax rebates to most UShouseholds over a ten-week period from late July to the end of September 2001. The EconomicStimulus Act of 2008 consisted primarily of a USD 100 billion programme of tax rebates toapproximately 130 million US tax filers.
7. Indeed, using model-based simulations, a number of studies have found that the short-runnegative impact of product and labour market reforms can be fairly small (or non-existent) andshort-lived (only one year after reforms) (Gomes, 2014; Vogel, 2014).
8. In the case where private sector debt deleveraging is a major factor contributing to the weaknessof demand, it has been shown that under the presence of collateral constraints and long-term debtcontracts product market reforms may have a positive impact on output and employment even inthe short run despite their deflationary effect (Andrés, Arce and Thomas, 2014). However, theeffect of labour market reforms in the same circumstances are less favourable.
Bibliography
Adjémian, S. et al. (2007), “Variantes en Univers Incertain”, Économie et Prévision, Special Issue.
Anderson, D., B. Hunt, and S. Snudden, (2014), “Fiscal Consolidation in the Euro Area: How Much PainCan Structural Reforms Ease?” Journal of Policy Modelling 36 (2014) 785-799.
Anderson, D., B. Barkbu, L. Lusinyan and D. Muir (2014), “Assessing the Gains from Structural Reformsfor Jobs and Growth”, Chapter 7 of Jobs and Growth: Supporting the European Recovery, IMF.
Andrés, J., O. Arce and C. Thomas (2014), “Structural Reforms in a Debt Overhang”, Documentos deTrabajo, No. 1421, Banco de Espana.
Andrews, D., A. Caldera Sánchez and Å. Johansson (2011), “Housing Markets and Structural Policies inOECD countries”, OECD Economics Department Working Papers, No. 836, OECD Publishing, Paris, http://dx.doi.org/10.1787/5kgk8t2k9vf3-en.
Anton, J. and R. Muñoz de Bustillo (2011), “The Impact of the Minimum Wage on Spanish Youth:Evidence From A Natural Experiment”, Technical report, Munich Personal RePEc Archive Paper 33488.
Arpaia, A., W. Roeger, J. Varga and J. in’t Veld (2007), “Quantitative Assessment of Structural Reforms:Modelling the Lisbon Strategy” European Economy Economic Papers 282, European Commission.
Auerbach, A.J., Y. Gorodnichenko (2013), “Fiscal Multipliers in Recession and Expansion”, in AlbertoAlesina and Francesco Giavazzi edited Fiscal Policy after the Financial Crisis, University of ChicagoPress.
Bai, C. and B. Wu (2014), “Health Insurance and Consumption: Evidence from China’s New CooperativeMedical Scheme”, Journal of Comparative Economics, 42 450-469.
Barlevy , G. (2003), “Credit Market Frictions and the Allocation of Resources Over the Business Cycle”Journal of Monetary Economics, 50, 1795-1818
Barkbu, B., J. Rahman and R. Valdés (2012), “Fostering Growth in Europe Now” IMF Staff Discussion NoteSDN/12/07. IMF. Washington.
Barrell, R., I. Hurst and S. Kirby (2009), “How to Pay for the Crisis or Macroeconomic Implications ofPension reforms” Discussion paper No. 333, National Institute of Economic and Social Research.
Bassanini, A. and R. Duval (2009), “Unemployment, Institutions, and Reform Complementarities:Re-Assessing the Aggregate Evidence for OECD Countries”, Oxford Review of Economic Policy, Vol. 25,No. 1, pp. 40-59.
ECONOMIC POLICY REFORMS 2016: GOING FOR GROWTH INTERIM REPORT © OECD 201678

2. REFORM PRIORITIES IN A DIFFICULT MACRO CONTEXT
Bernanke, B. and M. Gertler (1989), “Agency Costs, Net Worth and Business Fluctuations” AmericanEconomic Review, 79, March 1989, 14-31.
Bertrand, M. and F. Kramarz (2002), “Does Entry Regulation Hinder Job Creation? Evidence from theFrench Retail Industry”, Quarterly Journal of Economics, 117(4), pp. 1369-1413.
Blanchard, O. (2006), “Comments” in T. Boeri, M.Castanheira, R. Faini, and V. Galasso edited StructuralReforms Without Prejudices, Oxford University Press.
Blanchard, O. and D. Leigh (2013), “Growth Forecast Errors and Fiscal Multipliers” NBER Working Paper18779.
Boeri, T., P. Cahuc and A. Zylberberg (2015), “The Costs of Flexibility-Enhancing Reforms forIndividuals: a Literature Review,” OECD Economics Department Working Papers No. 1227, OECDpublishing, http://dx.doi.org/10.1787/5jrs558c5r5f-en.
Bouis, R., O. Causa, L. Demmou, and A. Zdzienicka (2012), “The Short-Term Effects of StructuralReforms: An Empirical Analysis”, OECD Economics Department Working Papers, No. 949, OECDPublishing, http://dx.doi.org/10.1787/5k9csvk4d56d-en.
Bouis, R., O. Causa, L. Demmou, and R. Duval (2012),”How quickly Does Structural Reform Pay Off? AnEmpirical Analysis of the Short-Term Effects of Unemployment Benefits Reform”, IZA Journal ofLabor Policy 2012, 1:12.
Bourlès, R., G. Cette, J. Lopez, J. Mairesse, and G. Nicoletti (2013), “Do Product Market Regulations InUpstream Sectors Curb Productivity Growth? Panel Data Evidence for OECD Countries”, The Reviewof Economics and Statistics, 95(5), pp.1750-1768.
Cacciatore, M., R. Duval and G. Fiori (2012), “Short-Term Gain or Pain? A DSGE Model-Based Analysis ofthe Short-Term Effects of Structural Reforms in Labour and Product Markets”, OECD EconomicsDepartment Working Papers, No. 948, OECD Publishing, Paris, http://dx.doi.org/10.1787/5k9csvkkr3xn-en.
Caldera Sánchez, A, A. de Serres and N. Yashiro (2016), “Reforming in a difficult macro context: whatshould be the priority”, OECD Economics Department Working Papers, No. 948, OECD Publishing, Paris,forthcoming.
Card, D. J. Kluve, and A. Weber (2015), “What Works? A Meta Analysis of Recent Active Labour MarketProgram Evaluations”, IZA Discussion Papers No. 9236.
Ciriaci, D. (2014), “Business Dynamics and Red Tape Barriers”, Economic Paper No 532, EuropeanCommission.
Coeuré, B. (2014), “Structural Reforms: Learning the Right Lesson from the Crisis”, Speech given at theEconomic conference, Latvijas Banka, Riga, 17 October 2014.
Corsetti, G., A. Meier and G. Müller (2012), “What Determines Government Spending Multipliers?”,CEPR Discussion Papers No. 9010.
Cournède, B., P. Garda, P. Hoeller and V. Ziemann (2015), “Effects of Pro-Growth Policies on theEconomic Stability of Firms, Workers and Households”, OECD Economic Policy Papers, No. 12, OECDPublishing, Paris.
Crépon, B., M. Dejemeppe and M. Gurgand (2005), “Counseling the Unemployed: Does It LowerUnemployment Duration and Recurrence?” IZA DP No. 1796.
Crépon, B., E. Duflo, M. Gurgand, R. Rathelot and P. Zamora (2013), “Do Labour Market Policies haveDisplacement Effects? Evidence from a Clustered Randomized Experiment”, The Quarterly Journal ofEconomics 128 (2): 531-580.
Cribb, J., Emmerson, C. and G. Tetlow, (2014), “Incentives, Shocks or Signals: Labour Supply Effects ofIncreasing the Female State Pension Age in the UK”, IFS Working Paper W13/03.
Dabla-Norris, E., S. Guo, V. Haksar, M. Kim, K. Kochhar, K.Wiseman, and A. Zdzienicka (2015), “The NewNormal: A Sector-Level Perspective on Growth and Productivity Trends in Advanced Economies”,IMF Staff Discussion Note SDN/15/03. IMF. Washington.
de Mooij, R. and M. Keen (2013), “Fiscal Devaluation and Fiscal Consolidation: The VAT in TroubledTimes” in A. Alesina and F. Giavazzi edited Fiscal Policy after the Financial Crisis, University of ChicagoPress.
Duval, R. (2008), “Is There a Role For Macroeconomic Policy in Fostering Structural Reforms? PanelEvidence from OECD Countries Over the Past Two Fecades”, European Journal of Political Economy 24(2008) 491-502.
ECONOMIC POLICY REFORMS 2016: GOING FOR GROWTH INTERIM REPORT © OECD 2016 79
2. REFORM PRIORITIES IN A DIFFICULT MACRO CONTEXT
Eggertsson, G., A. Ferrero, and A. Raffo, (2014),”Can Structural Reforms Help Europe?” Journal ofMonetary Economics 61(2014)2-22.
European Commission (2013), “The Growth Impact of Structural Reforms”, Quarterly Report on the EuroArea, Vol. 12, No. 4.
ECB (2015), “Progress with structural reforms across the Euro Area and their possible impacts”,Economic Bulletin, Issue 2 / 2015, European Central Bank, Frankfurt. European Commission (2011),“The Economic Adjustment Programme for Portugal, First Review – summer 2011”, EuropeanEconomy Occasional Papers, No. 83.
Everaert, L. and W. Schule (2008), “Why It Pays to Synchronize Structural Reforms in the Euro AreaAcross Markets and Countries”. IMF Staff Papers 55(2).
Faini, R., J. Haskel, G. Navaretti, B., C. Scarpa and C.Wey(2006), “Contrasting Europe’s Decline: DoProduct Market Reforms Help?”, in Boeri, T., M. Castanheira, R. Faini, and V. Galasso editedStructural Reforms Without Prejudices, Oxford University Press.
Fernández-Villaverde, J. (2014), “Discussion of “Can Structural Reforms Help Europe?” by GautiEggertsson, Andrea Ferrero and Andrea Raffo”, Journal of Monetary Economics 61(2014), 23-31.
Fiori, G., G. Nicoletti, S. Scarpetta and F. Schiantarelli (2012), “Employment Effects of Product andLabour Market Reforms: Are There Synergies?”, The Economic Journal, Vol. 122 (558), February. Fissel,G.S. and T. Jappelli (1990), “Do Liquidity Constraints Vary over Time? Evidence from Survey andPanel Data: Note” Journal of Money, Credit and Banking, Vol. 22, No. 2 (May, 1990), pp. 253-262.
Forni, L., A. Gerali and M. Pisani. (2010), “Macroeconomic Effects of Greater Competition in the ServiceSector: the case of Italy”, Macroeconomic Dynamics, 2010, 1-32.
Fournier, J.M. (2015), “The Negative Effect of Regulatory Divergence on Foreign Direct Investment”,OECD Economics Department Working Papers, http://dx.doi.org/10.1787/5jrqgvg0dw27-en.
Galí, J., J. D. López-Salido and J. Vallés (2007), “Understanding the Effects of Government Spending onConsumption”, Journal of the European Economic Association, Vol. 5(1), pages 227-270.
Gruber, J. and A. Yelowitz (1999), “Public Health Insurance and Private Savings”, Journal of PoliticalEconomy, Vol. 107, No. 6 (December 1999), pp. 1249-1274.
Goolsbee, A. and C. Syverson (2008), “How do Incumbents Respond to the Threat of Entry? Evidencefrom the Major Airlines”, Quarterly Journal of Economics, 123(4), pp. 1611-1633.
Gomes S., P. Jacquinot, M. Mohr and M. Pisani (2013), “Structural Reforms and MacroeconomicPerformance in the Euro Area Countries: A Model-Based Assessment”, International Finance 16(1),23-44.
Gomes, S. (2014), “Euro Area Structural Reforms in Times of a Global Crisis”, Banco de Portugal WorkingPaper 2014.
IMF (2014), The World Economic Outlook, October 2014, IMF, Washington.
Jappelli, T., L. Pistaferri and G.Weber (2007), “Health Care Quality, Economic Inequality andPrecautionary Saving”, Health Economics. 16: 327-346.
Johansson, Å., et al. (2008), “Taxation and Economic Growth”, OECD Economics Department WorkingPapers, No. 620, OECD Publishing, Paris, http://dx.doi.org/10.1787/241216205486.
Johnson, D.S., J.A. Parker and N.S. Souleles (2006), “Household Expenditure and the Income Tax Rebatesof 2001”, American Economic Review 96 (5): 1589-610.
Karam, P.D., D. Muir, J. Pereira and A. Tuladhar (2010), “Macroeconomic Effects of Public PensionReforms” IMF Working Paper No. 10/297, IMF.
Koske, I. (2013), “Fiscal Devaluation – Can it Help to Boost Competitiveness?”, OECD EconomicsDepartment Working Papers, No. 1089, OECD Publishing, Paris, http://dx.doi.org/10.1787/5k3z2dckn2bw-en.
Kluve J. (2010), “The effectiveness of European active labour market programs”, Labour Economics, 17,pp. 904-918.
Kramarz, F. and T. Philippon (2001), “The Impact of Differential Payroll Tax Subsidies on MinimumWage Employment”, Journal of Public Economics, 82, pp. 115-146.
Kugler, A. and G. Pica (2008), “Effects of Employment Protection on Worker and Job Flows: Evidencefrom the 1990 Italian Reform”, Labour Economics, 15, pp. 78-95.
ECONOMIC POLICY REFORMS 2016: GOING FOR GROWTH INTERIM REPORT © OECD 201680

2. REFORM PRIORITIES IN A DIFFICULT MACRO CONTEXT
Lee, Y. and T. Mukoyama (2015), “Entry and Exit of Manufacturing Plants over the Business Cycle”European Economic Review, Vol. 77, issue C, pp. 20-27.
Martins, P. (2014), “30.000 Minimum Wages: The Economic Effects of Collective Bargaining Extensions”,IZA Discussion Paper No. 8540.
Michaillat, P. (2012), “Do Matching Frictions Explain Unemployment? Not in Bad Times”, AmericanEconomic Review 102(4): 1721-1750.
Mineshima, A., M. Poplawski-Ribeiro and A. Weber (2014), “Size of Fiscal Multipliers”, in Cottarelli, C.,P. Gerson and A. Senhadji (eds.), Post-crisis Fiscal Policy, The MIT Press.
Mody, A., F. Ohnsorge and D. Sandri (2012), “Precautionary Savings in the Great Recession” IMF WorkingPaper 12/42.
Mourougane, A. and L. Vogel (2008), “Speed of Adjustment to Selected Labour Market and TaxReforms”, OECD Economics Department Working Papers, No. 647, OECD Publishing, Paris, http://dx.doi.org/10.1787/234217500715.
Neumark, D., I. Salas, and W. Wascher (2013), “Revisiting the minimum wage-employment debate:Throwing out the baby with the bathwater?” NBER Working Paper No. 18681.
OECD (2011), Economic Outlook May 2011, OECD Publishing, Paris
OECD (2012), Economic Surveys: Euro Area 2012, OECD Publishing. Paris
Orsini, K. and S. Vila Nunez (2014), “The Impact of The Spanish Labour Market Reform on the On-The-Job Search Rate”, ECFIN Country Focus Vol. 11 (7).
Parker, J.A., N.S. Souleles, D.S. Johnson and R. McClelland (2013), “Consumer Spending and theEconomic Stimulus Payments of 2008”, American Economic Review 2013, 103(6): 2530-2553.
Röhn, O. (2010), “New Evidence on the Private Saving Offset and Ricardian Equivalence”, OECDEconomics Department Working Papers, No. 762, OECD Publishing, Paris, http://dx.doi.org/10.1787/5kmft7qb5kq3-en.
Rosholm, M. and M. Svarer, (2008), “The Threat Effect of Active Labour Market Programmes”,Scandinavian Journal of Economics, 110(2), pp. 385-401.
Skuterud, M. (2005), “The Impact of Sunday Shopping on Employment and Hours of Work in the RetailIndustry: Evidence from Canada”, European Economic Review, 49(8), pp. 1953-78.
Uusitalo, R. and J. Verho (2010), “The Effect of Unemployment Benefits on Re-Employment Rates:Evidence from the Finnish Unemployment Insurance Reform” Labour Economics 17: 643-654.
Van Ours, J.C. and M. Vodopivec (2006),”How Shortening the Potential Duration of UnemploymentBenefits Entitlement Affects the Duration of Unemployment: Evidence from a NaturalExperiment”, Journal of Labor Economics 24: 351-378.
Varga, J., W. Roeger, and J. in’t Veld (2013), “Growth Effects of Structural Reforms in Southern Europe:the Case of Greece, Italy, Spain and Portugal”, European Economy Economic Papers 511. EuropeanCommission.
Varga, J. and J. in ’t Veld (2014), “The Potential Growth Impact of Structural Reforms in the EU: ABenchmarking Exercise”, European Economy Economic Papers 541, European Commission.
Vogel, L. (2014), “Structural Reforms at the Zero Bound” European Economy Economic Papers 537,European Commission.
Von Below, D. and P. Thoursie (2010), “Last in, First Out? Estimating the Effect of Seniority Rules inSweden”, Labour Economics, 17, pp. 987-997.
ECONOMIC POLICY REFORMS 2016: GOING FOR GROWTH INTERIM REPORT © OECD 2016 81

2. REFORM PRIORITIES IN A DIFFICULT MACRO CONTEXT
APPENDIX 2.1
Detailed analysis on the impact of reformsin normal times
This appendix provides a summary of the expected effects of specific reforms on
short-term activity and a review of the findings from selected studies. The information is
reported in the table below, which describes some of the channels through which reforms
affect the main components of demand and reports the results obtained from DSGE-type
model-based analyses and empirical analyses. The specific reforms considered in the
overview are the following:
Labour market reforms to enhance wage flexibility and facilitate labour resource reallocation:
They include reforms of wage-bargaining institutions to raise the responsiveness of wage
adjustments to local labour market conditions; reductions in minimum wages to improve
the jobs prospect of low-skilled workers; reforms of employment protection legislationagain to facilitate relative wage adjustments as well as the reallocation of resources across
firms and industries; By and large, they can also be thought of as measures to boost
competitiveness through downward pressures on domestic production costs, in particular
labour costs.
Reforms to stimulate labour force participation and improve matching: This covers
essentially reforms of the transfer systems, including unemployment benefits and other
forms of income support for non-working individuals, but also measures to reduce the
financial disincentive to labour force participation of specific groups such as women
(including childcare support) and older workers (pension systems). Also covered are
measures to increase the scope and effectiveness of active labour market policies, in
particular job-search assistance and training programmes.
Reforms to boost product market competition: This comprises essentially reductions inregulatory barriers to competition which operates through state control of business
operations, various legal and administrative barriers to start-ups, protection of incumbents
as well as via obstacles to foreign trade and investment.
Reforms aimed directly at enhancing the productive capacity and productivity of the business
sector: These cover tax structure reforms that encourage corporate activity, financial
incentives for business innovation and investment in public infrastructure.
Model-based assessmentsThe model-based simulations covered in the table are taken from studies that make
use of Dynamic Stochastic General Equilibrium (DSGE) models for the analysis of specific
ECONOMIC POLICY REFORMS 2016: GOING FOR GROWTH INTERIM REPORT © OECD 201682

2. REFORM PRIORITIES IN A DIFFICULT MACRO CONTEXT
reforms. In particular, many studies have been conducted by international organisations
on the basis of their core DSGE models.
● European Central Bank: Studies based on the Euro Area and Global Economy model
(EAGLE) include ECB (2015) [1] and Gomes et al. (2013) [2].
● European Commission: Studies based on different versions of the QUEST model include
EC (2013) [3]; Vogel (2014) [4], Varga and in’t Veld (2014) [5], Varga, Roeger and in’t
Veld (2013) [6] and Arpaia et al.,(2007) [7].
● IMF: Studies based on the Global Integrated Monetary and Fiscal model (GIMF) include
Anderson et al.,(2014), [8] Barkbu et al., (2012) [9], Everaert and Schule (2008) [10], Karam
et al., (2010) [11].
● OECD: Studies using a DSGE-type model include Cacciatore, Duval and Fiori (2012) [12]and Mourougane and Vogel (2008) [13].
The DSGE approach has the advantage of describing the response of the macro-
economy to reforms within a consistent general equilibrium framework and to illustrate
the transmission channels. DSGE model-based simulations also allow for assessing issues
that are relevant today, but have little historical precedent, such as the zero lower bound on
nominal interest rates in many advanced economies.
A direct comparison of model-based results across studies requires caution given that
the same structural reform can be captured in different ways depending on the
characteristics of the model. For instance, a reform of employment protection can be
captured by a simultaneous reduction in firing costs and in the bargaining power of
individual workers in one model, while it is captured as an increase in total factor
productivity in another model. Important channels may also be missing in the modelling
framework. In particular, the precautionary motive for saving and hence the adverse
confidence effects arising from higher job and income volatility cannot be easily featured
in such frameworks. Finally, to ensure models are tractable, analyses are typically limited
to a small set of structural reforms, (most often product and labour market reforms that
reduce price and wage mark-ups), which remains highly stylised.
Empirical analysis based on aggregate or sectoral data● There have been very few empirical studies that have used reduced-form equations to
estimate the impact of reforms with a focus on the short-run effect using cross-country
aggregate data or sectoral data:
● Studies using aggregate data include Bouis et al., (2012) [14], Fiori et al., (2012) [15], de
Mooji and Keen (2012) [16]. For example, Bouis et al., (2012) estimate average impulse
responses in terms of employment and output after one to five years following different
types of structural reforms (e.g. product market reforms), based on a panel data of
OECD countries over the period 1983 to 2007.
● Studies using sectoral data include Bourlès et al., (2013) [17] and Dabla-Norris et al., (2015)
[18]. The latter estimates the impulse response mostly in terms of productivity after
three years and five years following several types of structural reforms, based on a panel
data of 23 industries in 11 advanced economies over the period 1970-2007.
While the estimation of reduced-form equations allows for a flexible empirical
specification and the assessment of the impact of a wide array of reforms, it does not
identify the channels through which reforms affect output or employment. Furthermore,
ECONOMIC POLICY REFORMS 2016: GOING FOR GROWTH INTERIM REPORT © OECD 2016 83

2. REFORM PRIORITIES IN A DIFFICULT MACRO CONTEXT
the often incremental nature of reforms makes it difficult to clearly identify the short-run
impacts. Estimations are also prone to specification error. For instance, a failure to control
for the possible complementarity across reforms can bias the estimated impacts of a given
reform (Bassanini and Duval, 2009 [19]).
Empirical analysis based on micro studiesAnother branch of studies infers the impacts of structural reforms by investigating
and looking at event studies and assessing the change in the variables of interest before
and after a specific episode of reforms. Such event studies often employ a difference-in-
difference or regression discontinuity estimation approach that exploits a micro panel
dataset covering the periods before and after the reforms. Some studies also infer general
tendencies on the effectiveness of specific reforms from a meta-analysis of the existing
empirical evidences.
● Studies on wage bargaining/minimum wage reforms include Neumark et al., (2013) [20],Anton and Muñoz de Bustillo (2011) [21] and Martins (2014) [22].
● Studies on EPL reforms include Kugler and Pica (2008) [23], Von Below and Thoursie (2010)
[24] and Orsini and Vila Nunez (2014) [25]. Kugler and Pica (2008) assess the consequences
of Italy’s legislation that strengthened the protection of regular employment for firms with
less than 19 employees.
● Studies on unemployment benefits reforms include van Ours and Vodopivec (2006) [26] and
Uusitalo and Verho (2010) [27] studying the effect of duration and replacement rate on
unemployment duration from the reforms in Slovenia and Finland, respectively.
● Studies on ALMPs include Crépon et al., (2005) [28], Rosholm and Shaver (2008) [29] which
report significant impact on unemployment duration. Less favourable finding is reported
for instance by Crépon et al., (2013) [30]. Kleuve (2010) [31] provide a meta-analysis of
previous assessments.
● Studies on pension reforms include Cribb et al., (2014) [32] that observed the consequences
of a UK reform raising women’s pension eligibility age on their labour supply and
unemployment rate.
● Studies on product market reforms include Golsbee and Syverson (2008) [33], Bertrand and
Kramarz (2002) [34] and Skuterud (2005) [35]. Also, Faini et al., (2006) [36] provide case
studies of liberalisation and privatisation in different sectors in three European countries.
While event studies allow for richer and more rigorous inference on reform impacts
than the two previous methods, their focus on a specific policy in a given time and a
country makes it difficult to generalise their findings. Also the aggregate macroeconomic
implications are not always clear when the analysis focuses on very specific reforms and
markets.
ECONOMIC POLICY REFORMS 2016: GOING FOR GROWTH INTERIM REPORT © OECD 201684

2. REFORM PRIORITIES IN A DIFFICULT MACRO CONTEXT
all
insxcessmpact
cts0],d
ffect2])
stmentear
eases
mption.toymentmall
age4]).ionloser
re
lingent
n
Table A2.1. The impact of structural reforms in normal times: a synthesis
Reform area Channels of transmission Evidence on short-term impacts
Collective wagebargaining arrangementand minimum wages
● Raises responsiveness of wages to local labour and productmarkets.
● Puts downward pressures on real wages, in particularfor low-skilled workers but raises labour demand withan ambiguous effect on aggregate disposable incomeand consumption.
● If reduced costs lead to higher mark-ups for firms,this may raise investment among firms dependenton internal financing.
● If the lower costs are largely and quickly passed throughlower prices, then net exports may contribute to short-termdemand gains.
Model-based evidence:● Employment gains exceed short-term real wage losses. Sm
and temporary negative impact on inflation ([1], [2]).● Moderate increase in consumption, investment and GDP.
Small net effect on the current account. ([1], [2]).Evidence from empirical analysis:● Aggregate data: Empirical analysis confirms short-term ga
in employment, consumption and GDP of reduction in the ecoverage of collective wage agreements. Less evidence of ion investment.([14])
● Micro studies: Most studies find negative employment effeof minimum wages, especially for youth and low-skilled ([2[21]). Effect of extending collective wage bargaining is founto be similar to minimum wage.([22])
Employmentprotection legislationon open-ended contracts
● Reduces wage bargaining power of employees on regular contracts.Increases both hiring and lay-off rates by reducing expected costsof terminating a match. Boosts long-run productivityby encouraging job-to-job mobility and facilitating reallocationof workers across firms and sectors.
● Net impact on consumption ambiguous: Impact on disposableincome depends on employment and wages. Higher wealththrough future productivity and income gains but potentiallyhigher precautionary saving if increased instabilityin employment.
● Impact on investment and on net export similar to that of reformof wage bargaining. Potential wage moderation effect of reformreflected in improved competitiveness and/or higher mark-ups.
Model-based evidence:● Small positive effect on consumption despite initial
and short-lived rise in unemployment. More rapid positive eon investment and GDP. No visible effect on net exports.([1
Evidence from empirical analysis:● Aggregate data: No evidence of significant impacts on
consumption or GDP but mild positive effect on private inve([14]). No evidence of significant positive effect in the five-yhorizon. Some evidence of negative effects on productivityand output at the 2-3 years horizon ([18]).
● Micro studies: Increase in lay-off rates is generally foundto exceed the rise in hiring rates in the short term leadingto higher unemployment ([23],[24]). Some evidence of incrin on-the-job search by employees on open-ended contractfollowing recent reform in Spain ([25]).
Unemployment benefits:Extension of the benefitcoverage, strongerconditionalityand tapering of benefitsalong the spell
● Lowers benefits and the reservation wage of the unemployedand puts downward pressures on wages.
● Raises incentives to take-up jobs and labour demand. Stimulatesjob creation without affecting job destruction.
● Net effect on disposable income and consumption depends onspeed of employment gains and strength of wealth effect arisingfrom higher future income.
● Speed of rise in employment depends on extent of vacancies leftunfilled due to high reservation wage. Employment gains furtheraccelerated if reform is accompanied by lower social securitycontributions.
● Households not directly involved by the reform may raiseprecautionary savings to compensate for reduced generosityof benefits.
Model-based evidence:● Positive gains GDP, investment and to a lesser extent consu
Decline in consumption for LC-households more than offseby increases for others through wealth effects ([5]). Unemplfalls as employment rises more rapidly than labour force. Spositive contribution from net exports ([12]).
Evidence from empirical analysis:● Aggregate data: Positive impact on employment across all
and gender groups, as well as on consumption and GDP ([1● Micro studies: Reduction in replacement rates and/or durat
lead to a short-term increase in employment among those cto benefit exhaustion ([26], [27]).
Active labour marketpolicies:Job search assistance,training programmesand hiring or wagesubsidies
● Improves matching efficiency and facilitates reallocation of labour;raises employment in the short run and productivityin the long run.
● If unfunded, raises disposable income and can be perceivedby firms as a reduction in non-wage costs. Effect on consumptionand investment works like fiscal expansion and depends on sizeof multiplier.
Model-based evidence:● Impact of budgetary neutral reforms of ALMPs is similar
to that of reduction in unemployment benefit, except for morapid increase in labour demand ([5], [12]).
● Unfunded increases in ALMP spending have strongerpositive effects on demand in the first two years than afterfive years ([8], [9]).
Evidence from empirical analysis:● Aggregate data: Increases in ALMP spending, after control
or cyclical influences, are found to raise aggregate employmbut not consumption or GDP ([14]).
● Micro studies: Most studies (though not all) find evidencethat active job search assistance and mandatory participatioto programmes help reduce the duration of unemploymentin the short term ([28], [29], [31]).
ECONOMIC POLICY REFORMS 2016: GOING FOR GROWTH INTERIM REPORT © OECD 2016 85
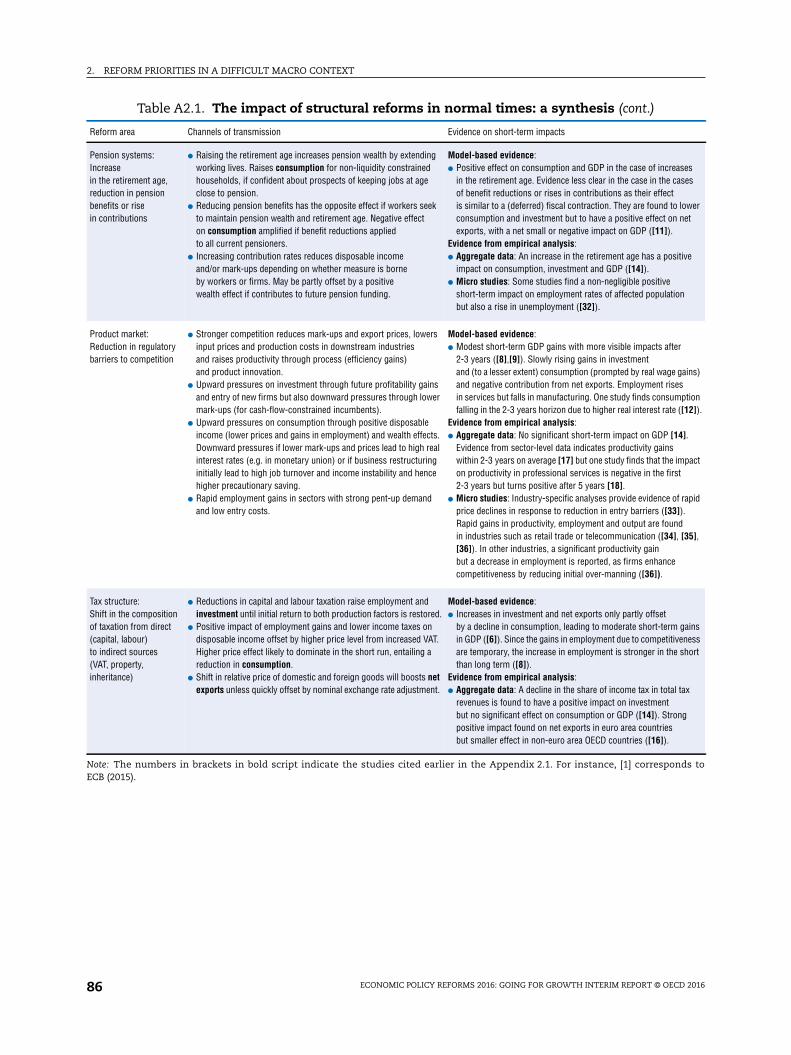
2. REFORM PRIORITIES IN A DIFFICULT MACRO CONTEXT
easescases
o lowern net
sitive
ion
er
gains)esmption
e ([12]).
14].
impactst
of rapid3]).nd], [35],
gainsivenesse short
l tax
ong
nds to
Pension systems:Increasein the retirement age,reduction in pensionbenefits or risein contributions
● Raising the retirement age increases pension wealth by extendingworking lives. Raises consumption for non-liquidity constrainedhouseholds, if confident about prospects of keeping jobs at ageclose to pension.
● Reducing pension benefits has the opposite effect if workers seekto maintain pension wealth and retirement age. Negative effecton consumption amplified if benefit reductions appliedto all current pensioners.
● Increasing contribution rates reduces disposable incomeand/or mark-ups depending on whether measure is borneby workers or firms. May be partly offset by a positivewealth effect if contributes to future pension funding.
Model-based evidence:● Positive effect on consumption and GDP in the case of incr
in the retirement age. Evidence less clear in the case in theof benefit reductions or rises in contributions as their effectis similar to a (deferred) fiscal contraction. They are found tconsumption and investment but to have a positive effect oexports, with a net small or negative impact on GDP ([11]).
Evidence from empirical analysis:● Aggregate data: An increase in the retirement age has a po
impact on consumption, investment and GDP ([14]).● Micro studies: Some studies find a non-negligible positive
short-term impact on employment rates of affected populatbut also a rise in unemployment ([32]).
Product market:Reduction in regulatorybarriers to competition
● Stronger competition reduces mark-ups and export prices, lowersinput prices and production costs in downstream industriesand raises productivity through process (efficiency gains)and product innovation.
● Upward pressures on investment through future profitability gainsand entry of new firms but also downward pressures through lowermark-ups (for cash-flow-constrained incumbents).
● Upward pressures on consumption through positive disposableincome (lower prices and gains in employment) and wealth effects.Downward pressures if lower mark-ups and prices lead to high realinterest rates (e.g. in monetary union) or if business restructuringinitially lead to high job turnover and income instability and hencehigher precautionary saving.
● Rapid employment gains in sectors with strong pent-up demandand low entry costs.
Model-based evidence:● Modest short-term GDP gains with more visible impacts aft
2-3 years ([8],[9]). Slowly rising gains in investmentand (to a lesser extent) consumption (prompted by real wageand negative contribution from net exports. Employment risin services but falls in manufacturing. One study finds consufalling in the 2-3 years horizon due to higher real interest rat
Evidence from empirical analysis:● Aggregate data: No significant short-term impact on GDP [
Evidence from sector-level data indicates productivity gainswithin 2-3 years on average [17] but one study finds that theon productivity in professional services is negative in the fir2-3 years but turns positive after 5 years [18].
● Micro studies: Industry-specific analyses provide evidenceprice declines in response to reduction in entry barriers ([3Rapid gains in productivity, employment and output are fouin industries such as retail trade or telecommunication ([34[36]). In other industries, a significant productivity gainbut a decrease in employment is reported, as firms enhancecompetitiveness by reducing initial over-manning ([36]).
Tax structure:Shift in the compositionof taxation from direct(capital, labour)to indirect sources(VAT, property,inheritance)
● Reductions in capital and labour taxation raise employment andinvestment until initial return to both production factors is restored.
● Positive impact of employment gains and lower income taxes ondisposable income offset by higher price level from increased VAT.Higher price effect likely to dominate in the short run, entailing areduction in consumption.
● Shift in relative price of domestic and foreign goods will boosts netexports unless quickly offset by nominal exchange rate adjustment.
Model-based evidence:● Increases in investment and net exports only partly offset
by a decline in consumption, leading to moderate short-termin GDP ([6]). Since the gains in employment due to competitare temporary, the increase in employment is stronger in ththan long term ([8]).
Evidence from empirical analysis:● Aggregate data: A decline in the share of income tax in tota
revenues is found to have a positive impact on investmentbut no significant effect on consumption or GDP ([14]). Strpositive impact found on net exports in euro area countriesbut smaller effect in non-euro area OECD countries ([16]).
Note: The numbers in brackets in bold script indicate the studies cited earlier in the Appendix 2.1. For instance, [1] correspoECB (2015).
Table A2.1. The impact of structural reforms in normal times: a synthesis (cont.)
Reform area Channels of transmission Evidence on short-term impacts
ECONOMIC POLICY REFORMS 2016: GOING FOR GROWTH INTERIM REPORT © OECD 201686

Economic Policy Reforms 2016
Going for Growth Interim Report
© OECD 2016
Chapter 3
From GDP to average householdincome: A look at the transmission
channels
This chapter reviews the association between GDP and living standards from theperspective of the average household, focusing on the income dimension. Itdiscusses the mechanisms through which GDP growth “trickles down” to householdsector income with a view to assessing whether and to what extent suchmechanisms are amenable to policy intervention. To do so, the chapter provides aproper assessment of the link between income generated from GDP and incomedistributed to households, which implies examining income distribution betweenhousehold and the non-household sectors of the economy.
The statistical data for Israel are supplied by and under the responsibility of the relevant Israeliauthorities. The use of such data by the OECD is without prejudice to the status of the Golan Heights,East Jerusalem and Israeli settlements in the West Bank under the terms of international law.
87

3. FROM GDP TO AVERAGE HOUSEHOLD INCOME: A LOOK AT THE TRANSMISSION CHANNELS
From GDP to average household income: A look at the transmission channels
Main findings
● Real GDP has tended to grow by more than real household income in the majority of
OECD countries between the mid-1990s and 2013.
● This growth gap is partly due to factors having little policy traction, such as differential
developments between the price of domestic output and the price of consumption
faced by domestic households, driven notably by terms-of-trade effects: consumption
prices have tended to rise relative to output prices in most OECD countries over the
period, the only exceptions being commodity exporters such as Norway, Australia
and Canada.
● The household income share of GDP, simply defined as the ratio of nominal household
disposable income over nominal GDP, has been stable over the period, on average across
OECD countries, but with cross-country heterogeneity, with for instance a large decline
in Austria and Korea and a large increase in the Slovak Republic and Finland.
● Developments in the household income share of GDP reflect developments in the
distribution of production income between the household and non-household sectors of
the economy. This can in turn be assessed by looking at household labour, capital and
secondary income shares of GDP:
❖ About half of OECD countries have experienced a decline in the labour share of GDP, in
particular Portugal, Slovenia and Japan, while the other half have experienced an
increase, though of a lower magnitude.
❖ The vast majority of OECD countries have experienced a decline in the household
capital income share of GDP, in particular Belgium and Italy, while only a few
countries, including Portugal and the United States, have seen an increase.
❖ Concomitant declines in the labour and household capital income shares of GDP could
suggest that a rising share of profits has been retained by the corporate sector instead
of being redistributed to the household sector.
❖ The decline in the household capital income share of GDP could be overstated to the
extent that the corporate sector has been reducing the use of dividends in favour of
alternative profit redistribution mechanisms to shareholders, such as share buybacks
– and that associated capital gains are not recorded in macroeconomic data.
❖ The vast majority of OECD countries experienced an increase in the household
secondary income share of GDP over the past two decades, i.e. in the share of
production income that is being redistributed by the government to the household
sector. However, this largely reflects the increases in public income transfers
over the early phases of the crisis, which cushioned household incomes from the
fall in GDP.
ECONOMIC POLICY REFORMS 2016: GOING FOR GROWTH INTERIM REPORT © OECD 201688

3. FROM GDP TO AVERAGE HOUSEHOLD INCOME: A LOOK AT THE TRANSMISSION CHANNELS
❖ In addition, the increase in the secondary household income share could be overstated
to the extent that it does not allow for measuring the negative effect of a shift in the tax
composition from direct to indirect sources, in particular consumption taxes; yet
associated reforms have been quite frequent across the OECD over the last two decades.
● The analysis did not reveal clear links between the changes in income distribution at the
macro-level and the rise in income inequality within the household sector experienced
by many OECD countries over the last decades.
IntroductionGDP per capita is a widely used measure of living standards and a key headline indicator
of economic performance. The emphasis given to GDP growth relies on the assumption that
higher GDP per capita is associated with rising living standards for most households. This
view has been increasingly challenged. On its own, GDP per capita falls short of accurately
measuring people’s wellbeing, even from a narrow material living standard perspective.1 In
that respect, one issue that has received little attention is the extent to which GDP growth
“trickles down” to households. Yet this is of primary relevance from a wellbeing perspective,
as recognised for instance by the Stiglitz Commission (Stiglitz et al. 2009).2
Assessing the links between GDP growth and household income growth is also of
particular interest for the understanding of developments in income inequality.3 How GDP
growth generates income for the household sector, and the composition of this income, are
important factors for inequality. For instance, the distribution of income between labour
and capital does matter for understanding income inequality. However, assessing this may
have become more complex than in the past as households have more diverse sources of
income and there is considerable dispersion within the categories of income. It is thus
important to go beyond the classic concept of labour share to understand inequality,
notably by enlarging the concept to the different types of household income sources.
Given these challenges, the chapter analyses the association between GDP and living
standards from the perspective of the average household, focusing on the income
dimension. The idea is to better understand the mechanisms through which GDP growth
“trickles down” to household sector income. This justifies a proper assessment of the link
between income generated from GDP and income distributed to households, which implies
examining income distribution between household and non-household sectors of the
economy.4
The chapter is structured as follows: the first section describes the measurement
framework used throughout the chapter, based on the System of National Accounts (SNA).
The second section delivers a snapshot overview of developments in real household
income compared to GDP over the last two decades. It also sheds light on the drivers that
are, in principle, least amenable to policy intervention, e.g. differential developments
between the prices faced by households and those of domestic output and primary income
flows with the rest of the world. The third section analyses how income generated from
domestic production is distributed between the household and non-household sectors of
the economy, in particular the general government and the corporate sector, with a focus
on the functional income distribution, in other words on income distribution between
labour and capital. The fourth section delivers an assessment of the link between income
distribution across household and non-household sectors and income distribution within
the household sector.
ECONOMIC POLICY REFORMS 2016: GOING FOR GROWTH INTERIM REPORT © OECD 2016 89

3. FROM GDP TO AVERAGE HOUSEHOLD INCOME: A LOOK AT THE TRANSMISSION CHANNELS
Adjusted Household Disposable Income: definition and cross-country patternsFor the purpose of this chapter, the level of resources accruing to the household sector
is gauged through adjusted household disposable income (AHDI) from the National
Accounts, combining information on a large number of market and non-market income
sources (including income derived from hidden or underground activities).5 This is
considered as the best available measure of material conditions from a cross-country
perspective, although it may not be fully reflective of households’ command over economic
resources (Box 3.1).6 For ease of exposition, Figure 3.1 provides a simplified overview of
income flows between the household and non-household sectors of the economy as
measured in the SNA.
Box 3.1. Adjusted household disposable incomefrom the national accounts: limitations
Adjusted household disposable income from the national accounts includes some non-cash items that households may not recognise as part of their income:
● Employer contributions to social security, and employer payments for private pensions,healthcare, and other benefits do not enter the pay-packets of workers but are part ofhousehold income in the national accounts. This is because compensation of employeesis defined in the national accounts with a view to explicitly measuring the full cost oflabour as a factor of production. For example, whereas in the real world socialcontributions are paid directly by the employers to the social funds and are never seenby the employees, the national accounts treat them as part of wages paid to households.As a result, the “compensation of employees” item includes all contributions, includingimputed contributions. In this chapter, this item is included in the definition of labourincome.
● Homeowners-occupiers do not receive an income from the housing services that theyprovide to themselves. Yet an income is imputed in the national accounts, called“imputed rent”. This income flow is estimated based on actual rents of comparableaccommodations, but national statistical offices apply different methodologies in thisrespect. In this chapter, this item is included in the definition of household capitalincome.
● Households benefit from the services supplied by general government, such ashealthcare, education, housing, recreational and cultural services, but associatedtransfers are not spendable. The national accounts attribute to household income animputed value for such services, i.e. “social transfers in-kind”, to distinguish them fromcash transfers. Their measurement is problematic given the non-market nature of theseservices (and could be very different from the household point of view). Indeed, thenational accounts valuation of social transfer in-kind is based on the price of inputsused in the production process, hence on expenditure by general government. In thischapter, this item is included in the definition of household secondary income.
The non-recording of capital gains and losses is another limitation of the householdincome account. Agents face a potential holding gain or loss whenever the pricefluctuates. A distinction is made between “unrealised” and “realised” gains and losses. Atypical unrealised gain or loss occurs when the price of a share held by an agent changesbut when the agent has not yet sold his holdings. By contrast, realised gains (or losses)result from the sale of the shares. The proceeds received from the holding gain are in mostcases subject to taxation.
ECONOMIC POLICY REFORMS 2016: GOING FOR GROWTH INTERIM REPORT © OECD 201690

3. FROM GDP TO AVERAGE HOUSEHOLD INCOME: A LOOK AT THE TRANSMISSION CHANNELS
AHDI is obtained by adding two broad components: 1) the flows that make up
individuals’ primary (or market) income: labour income (compensation of employees and
labour income of the self-employed – the latter being part of “mixed income”) and capital
income (income derived from financial assets, essentially dividends and interest, included
under “property income” and from non-financial assets, essentially actual and imputed
rents, included under “operating surplus”, as well as self-employment capital income – the
latter being part of “mixed income”); and 2) secondary or redistribution income: the cash
and in-kind social transfers that households receive from governments (such as public
education and healthcare services) net of the current taxes on income and wealth and the
social security contributions paid by households. In this respect, consumption taxes are
not considered among taxes paid by the household sector in the SNA. They appear in the
difference between GDP at market prices and GDP at factor costs (i.e. GDP at market prices
minus taxes on production and imports). AHDI can be expressed both in gross and net
terms, with the difference being households’ consumption of fixed capital.7 The bulk of
this chapter relies on the gross measure to make the link with GDP, which is a gross
concept, and because of better cross-country comparability.8
Box 3.1. Adjusted household disposable incomefrom the national accounts: limitations (cont.)
Households in OECD countries have on several occasions in the recent past benefitedfrom rises, or suffered from falls, in the prices of these two types of assets; for instanceduring the stock market bubble toward the end of the 1990s, and the steep drop in stockprices starting in 2000 and more recently, during the housing market bubble. Asset pricechanges induce positive or negative wealth effects, allowing household to consume moreor less than their disposable income. These so-called “wealth effects “may play a majorrole in households’ perception of own economic resources, but they cannot be inferredfrom national accounts.
Against this background, household capital income as defined in this chapter based onthe SNA excludes capital gains and losses, whether realised or not. Income from housingassets is included insofar as it reflects actual and imputed rents (the latter accruing tohomeowner occupiers). Financial income covers interest received on households’ financialinvestments and dividends paid by companies to households but, due to the exclusion ofcapital gains, other forms of financial income are excluded from the SNA. Such is the caseof share buy-backs, which have been playing a growing role in corporate profitredistribution strategy. This income transfer from firms to households is not recorded inthe household income account.
Finally and related to the previous point, the impact of the external sector on householdincome in the SNA covers essentially primary income, that is, income from work,dividends and interest. Financial transactions with the rest of the world do not affecthousehold income nor do they affect GDP. By contrast, such transactions affect the balancesheet of resident institutional sectors as defined in the SNA: households, the generalgovernment and corporations. As a result, external macroeconomic imbalances stemmingfrom e.g. net borrowing vis à vis the rest of the world do not influence the distribution ofincome between the general government and households but may eventually influencethe distribution of wealth and savings between the general government and households,an issue that goes beyond the scope of the current chapter.
ECONOMIC POLICY REFORMS 2016: GOING FOR GROWTH INTERIM REPORT © OECD 2016 91

3. FROM GDP TO AVERAGE HOUSEHOLD INCOME: A LOOK AT THE TRANSMISSION CHANNELS
The limitations associated with the definition of household income in the SNA should be
kept in mind and differences across countries and over time should therefore be interpreted in
light of different institutional arrangements. Nevertheless, the SNA system relies on a number
of harmonising procedures implemented with a view to maximising cross-country
comparability. Importantly for the purpose of this chapter, such procedures ensure a very good
level of comparability for the household income account. Comparability may be more
problematic for the household financial and balance sheet accounts and this may limit cross-
country analysis of household wealth and savings. One of the most relevant issues in this
respect is the recording of pension contributions and pension benefits of employees between
capitalisation and pay-as-you go systems (Box 3.2). This chapter performs a comparative
analysis of household income but not of household wealth. As a result, the analysis should not
be affected by differences in institutional arrangements governing countries’ pension systems,
reflecting harmonising adjustments applied within the household income account.
For the average household, the main income component is compensation of employees,
followed by self-employment income9 and transfers in-kind provided by the government
(Figure 3.2, Panel A). When the AHDI decomposition is simplified into labour and capital
income (which make up primary income) and secondary income, labour income appears as
the most important income source in most countries (Figure 3.2, Panel B).
Figure 3.1. Income flows between the household and non-household sectors:a simplified overview of the System of National Accounts (SNA)
1. In the case of self-employed, only overall (mixed) income is reported. In order to split their income into the labourand capital components, the labour income of self-employed is imputed by assuming that their annual wage isthe same as for the average employees of the whole economy. The capital income is then approximated by takingthe difference between mixed income of self-employed and their imputed labour income.
2. Household primary income corresponds to income derived from market activities and is sometimes referred to as“market income”.
+
Household Secondary IncomeLabour income1 Household Capital Income
GDP at market prices
GDP at factor cost (= GDP at market prices – taxes on
production and imports)
Governmentsector
Corporatesector
Household sector(including self-employed firms)
GNI at market prices(=GDP at market prices + primary incomes received
from the rest of the world-primary incomes paid
to the rest of the world)
Household primary income2 (market income) Household secondary income
= Adjusted Household Disposable Income (AHDI)
Social benefits and transfers + social transfers in kind – current
taxes on income and wealth
Actual and imputed rents(“operating surplus”)
Capital income from financial assets (“property income”)
Self-employment capital income(under “mixed income”)
Compensation of employees (= wages and salaries +
employers’ social security contributions)
Self-employment labour income (under “mixed
income”)
Compensation of employees
Property income
Self-employment la
bour income
Current taxes on income and wealth
Social benefits and transfers + socialtransfers in kind
Ope
ratin
g su
rplu
s
Self-
empl
oym
ent
capi
tal i
ncom
e
ECONOMIC POLICY REFORMS 2016: GOING FOR GROWTH INTERIM REPORT © OECD 201692

3. FROM GDP TO AVERAGE HOUSEHOLD INCOME: A LOOK AT THE TRANSMISSION CHANNELS
Tracking income growth from the household perspective and explainingthe gap vis-à-vis GDP growth
From a welfare perspective, household income growth is best measured in real
consumption terms (i.e. changes in nominal household income should be deflated with
consumption prices and not with output prices which are used to deflate GDP). This is
what ultimately matters to assess household consumption possibilities as a function of
production income. Tracking growth from the household income perspective thus starts
with the simple comparison between growth in GDP and growth in real adjusted household
income with a view to assessing the extent to which income generated from GDP trickles
down to the average household. This comparison suggests that since the mid-1990s and in
particular over the pre-crisis period, GDP has tended to grow more than households’
economic resources in many OECD countries (Figure 3.3, Panels A and B). The gap was
particularly large in Korea and Ireland. In fact, only a few countries with large commodity-
producing sectors experienced stronger gains in real household incomes relative to GDP
(e.g. Norway and Australia).
The growth gap between GDP and household incomes temporarily narrowed during
the initial phase of the crisis, as automatic stabilisers (i.e. rises in net income transfers
from government to households during recessions) and discretionary income-support
Box 3.2. How pension and social security funds are recordedin the household income accounts
One can distinguish two main types of pension systems: those functioning as “savingsplans” (also called “full capitalisation systems”) and those functioning as “transfer plans”(also called “pay-as-you-go systems”). If the pension plan is a savings plan (often called a“pension fund”), each employee contributes to a fund from which his or her future pensionbenefit will be paid. The national accounts record all contributions to the plan (both thoseof employers and of employees) as a form of savings by employees (i.e. an increase in thepension asset of employees) and pension benefits as “dis-saving” (i.e. a decrease of thepension asset of retirees).
By contrast, a pension system is a transfer plan (rather than a savings plan) when thepension contributions of current employees are used to pay the pension benefits of currentretirees. In this case (which is typical of social security pension systems), the nationalaccounts deduct pension contributions from income (and thus they are also deductedfrom savings), and pension benefits are considered part of income (and thus included insavings). Pension contributions are included in current transfers paid by households andpension benefits in current transfers by households.
To harmonise the measure of household income, the SNA framework records pensioncontributions and benefits of savings plans (i.e. pension funds) as if they were transferplans (i.e. social security).* As a result, cross-country comparisons of household incomeaccounts are in principle unaffected by cross-country differences in the institutionalsettings governing the funding of pension systems. In this chapter, pension benefits andcontributions are included in the definition of household secondary (net) income, beingconsidered as transfer income.
* This (transfer) income flow from the corporate sector to the household sector is not shown in the simplifiedoverview of income flows between SNA sectors (Figure 3.1). In principle, it would appear as a secondaryincome flow from the corporate sector (pension funds) to the household sector.
ECONOMIC POLICY REFORMS 2016: GOING FOR GROWTH INTERIM REPORT © OECD 2016 93

3. FROM GDP TO AVERAGE HOUSEHOLD INCOME: A LOOK AT THE TRANSMISSION CHANNELS
e sume self-t taxesrectly).seholdaly, the
rplus”
323992
-50
-25
0
25
50
75
100
125
150
175
200
-10
0
10
20
30
40
50
60
70
80
90
100
110
120
measures introduced to moderate the fall in aggregate demand at the early stages of the
recession had the effect – to a varying extent across countries – of protecting households’
disposable incomes from recession-induced losses in market incomes (i.e. income from
work and capital) (Figure 3.3, Panel C).10 However, with the effect of automatic stabilisers
and anti-crisis measures tapering off, the diverging trends resumed as GDP growth largely
outpaced household income growth in 2009-13 (Figure 3.3, Panel D). Indeed, more than one
third of OECD countries experienced contracting household real disposable incomes in
post-crisis years, reflecting in part the impact of fiscal consolidation.
Figure 3.2. Components of adjusted household disposable income1 (AHDI)As a percentage of gross adjusted household disposable income, 2013
1. The data refer to the components of gross adjusted household disposable income based on the System of National Accounts. Thof compensation of employees, property income, operating surplus and mixed income (i.e. labour and capital income of themployed) represents primary or market income. Social contributions and transfers and social transfers in kind minus currenon income and wealth represent secondary income (income that the government redistributes to households directly or indiSee Figure 3.1 for a definition of the respective components shown in panels A and B. Components do not exactly sum to hougross adjusted disposable income due to statistical discrepancies. Data refer to 2014 for Czech Republic, Denmark, Finland, ItNetherlands, Portugal and Sweden; 2012 for New Zealand and Switzerland. For Chile and Korea, the component “Operating suincludes mixed income.
Source: OECD, National Accounts Database.1 2 http://dx.doi.org/10.1787/888933
-50
-25
0
25
50
75
100
125
150
175
200
MEX
GR
C
ITA
POL
CH
L
PRT
SVK
NZL
ESP
CZE
USA FI
N
GBR AU
T
DEU FR
A
JPN
IRL
HU
N
SWE
KOR
SVN
BEL
EST
NLD
DN
K
CH
E
A. Detailed overview
Compensation of employees Operating surplus Mixed incomeProperty income Social transfers in kind Social contributions and transfers
Current taxes on income, wealth etc.
-10
0
10
20
30
40
50
60
70
80
90
100
110
120
MEX GRC PRT ITA POL SVK ESP USA FIN CZE FRA DEU GBR AUT HUN SWE JPN IRL SVN EST BEL NLD DNK CHE
B. Simplified overview
Labour income Capital income Secondary income
ECONOMIC POLICY REFORMS 2016: GOING FOR GROWTH INTERIM REPORT © OECD 201694
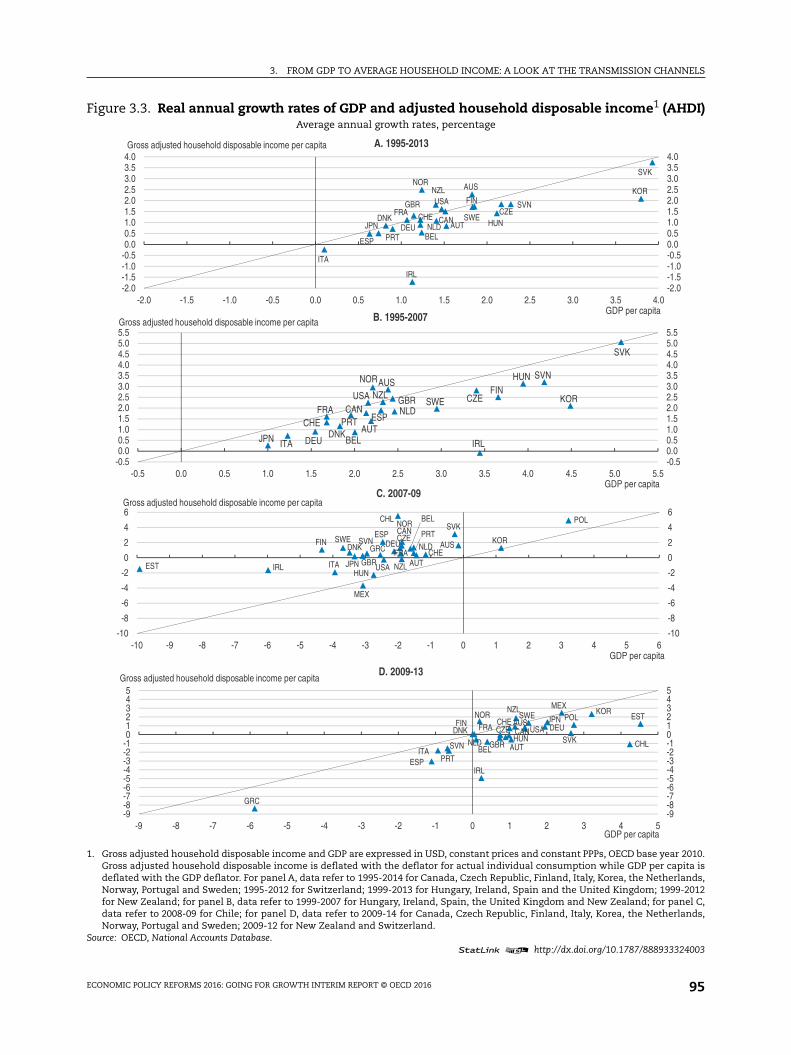
3. FROM GDP TO AVERAGE HOUSEHOLD INCOME: A LOOK AT THE TRANSMISSION CHANNELS
HDI)
r 2010.pita is
rlands,9-2012anel C,rlands,
324003
0
.5050505050505
.0
.5
.0
.5050505050
Figure 3.3. Real annual growth rates of GDP and adjusted household disposable income1 (AAverage annual growth rates, percentage
1. Gross adjusted household disposable income and GDP are expressed in USD, constant prices and constant PPPs, OECD base yeaGross adjusted household disposable income is deflated with the deflator for actual individual consumption while GDP per cadeflated with the GDP deflator. For panel A, data refer to 1995-2014 for Canada, Czech Republic, Finland, Italy, Korea, the NetheNorway, Portugal and Sweden; 1995-2012 for Switzerland; 1999-2013 for Hungary, Ireland, Spain and the United Kingdom; 199for New Zealand; for panel B, data refer to 1999-2007 for Hungary, Ireland, Spain, the United Kingdom and New Zealand; for pdata refer to 2008-09 for Chile; for panel D, data refer to 2009-14 for Canada, Czech Republic, Finland, Italy, Korea, the NetheNorway, Portugal and Sweden; 2009-12 for New Zealand and Switzerland.
Source: OECD, National Accounts Database.1 2 http://dx.doi.org/10.1787/888933
AUS
AUT
BEL
CAN
CHE
CHL
CZEDEUDNK
ESP
EST
FINFRA
GBR
GRC
HUNIRL ITA JPN
KOR
MEX
NLD
NOR
NZL
POL
PRTSVK
SVNSWE
USA
-1
-8
-6
-4
-2
0
2
4
6
-10
-8
-6
-4
-2
0
2
4
6
-10 -9 -8 -7 -6 -5 -4 -3 -2 -1 0 1 2 3 4 5 6GDP per capita
C. 2007-09Gross adjusted household disposable income per capita
AUS
AUTBEL
CANCHE
CHL
CZE DEUDNK
ESP
ESTFIN FRA
GBR
GRC
HUN
IRL
ITA
JPNKOR
MEX
NLD
NORNZL
POL
PRT
SVKSVN
SWE
USA
-9-8-7-6-5-4-3-2-1012345
-9-8-7-6-5-4-3-2-1012345
-9 -8 -7 -6 -5 -4 -3 -2 -1 0 1 2 3 4 5GDP per capita
D. 2009-13Gross adjusted household disposable income per capita
AUS
AUTBEL
CANCHE
CZE
DEUDNK
ESP
FIN
FRAGBR
HUN
IRLITAJPN
KORNLD
NOR
NZL
PRT
SVK
SVN
SWEUSA
-00.0.1.1.2.2.3.3.4.4.5.5.
-0.50.00.51.01.52.02.53.03.54.04.55.05.5
-0.5 0.0 0.5 1.0 1.5 2.0 2.5 3.0 3.5 4.0 4.5 5.0 5.5GDP per capita
B. 1995-2007Gross adjusted household disposable income per capita
AUS
AUTBEL
CANCHECZE
DEUDNK
ESP
FINFRA
GBR
HUN
IRL
ITA
JPN
KOR
NLD
NORNZL
PRT
SVK
SVN
SWE
USA
-2-1-1-00.0.1.1.2.2.3.3.4.
-2.0-1.5-1.0-0.50.00.51.01.52.02.53.03.54.0
-2.0 -1.5 -1.0 -0.5 0.0 0.5 1.0 1.5 2.0 2.5 3.0 3.5 4.0GDP per capita
A. 1995-2013Gross adjusted household disposable income per capita
ECONOMIC POLICY REFORMS 2016: GOING FOR GROWTH INTERIM REPORT © OECD 2016 95

3. FROM GDP TO AVERAGE HOUSEHOLD INCOME: A LOOK AT THE TRANSMISSION CHANNELS
The contribution of relative price movements to the growth gap
Differential developments between GDP and household income in real terms may
reflect differential developments between consumption and output prices (Figure 3.4, Panels
A and B). Indeed, different price indices are used to convert nominal values in real values,
respectively the GDP deflator for domestic output and the consumption deflator for
household income.
The comparison between real and nominal terms shows that a very large part of the
growth gap between GDP and real household income is due to relative price effects over the
period under consideration (i.e. 1995-2013). Most OECD countries experienced declines in
output relative to consumer prices while the only ones experiencing increases in output
prices relative to consumer prices are commodity-exporters such as Australia, Canada and
Norway (Figure 3.4, Panel C) – pointing to terms-of-trade effects. In nominal terms, growth
in household income was remarkably close to GDP growth.
Such relative price effects could reflect a number of factors, including:
● Secular declines in the relative price of investment reducing output prices more than
consumer prices, and, related, secular declines in the price of tradable relative to non-
tradable products, especially in services.
● Temporary increases in commodity prices generating favourable terms-of-trade effects
in commodity-exporting countries over the period under consideration.
● Increases in consumer prices resulting from tax reforms shifting the burden from direct
to indirect taxes and in particular to VAT over the period under consideration.11
The contribution of cross-border income flows to the growth gap
Part of the gap between growth in GDP and household income may also reflect that
between the income produced within the territory and the income received by residents.
Household incomes are measured for resident units, regardless of whether these incomes
are obtained within the national territory or not. In addition to the income received from
the production within the territory, which is included in GDP, residents may receive income
derived from production outside the territory, which is excluded from GDP.12 Adding the
net primary income flows with the rest of the world to GDP allows for coming closer to the
resources that can trickle down to resident households. These primary incomes consist of
wages and salaries, property income (interest and dividends) and taxes and subsidies on
production. The final result is Gross National Income (GNI), which can be considered as a
“bridge” measure: GNI is, unlike GDP, an income-based concept and not a production based
concept, since it includes income derived from production abroad and excludes the value
of output repaid to foreign factors of production. As a result, assessing developments in
household income relative to GNI instead of GDP underscores the potential role of primary
income flows with the rest of the world.13
A look at the evolution of GNI suggests that developments in primary income flows
with the rest of the world also account for part of the growth gap between real GDP and real
household income (Figure 3.5, Panels A and B), but to a much lesser extent than relative
prices. Weaker GNI relative to GDP growth seems to have contributed to weaker growth of
household income relative to GDP in e.g. Belgium and Korea (Figure 3.5, Panel C). At the
opposite end of the spectrum, stronger GNI relative to GDP growth seems to have
contributed to stronger growth of household income relative to GDP in e.g. Australia and
Norway, which suggests that associated foreign income inflows were also driven by rising
ECONOMIC POLICY REFORMS 2016: GOING FOR GROWTH INTERIM REPORT © OECD 201696
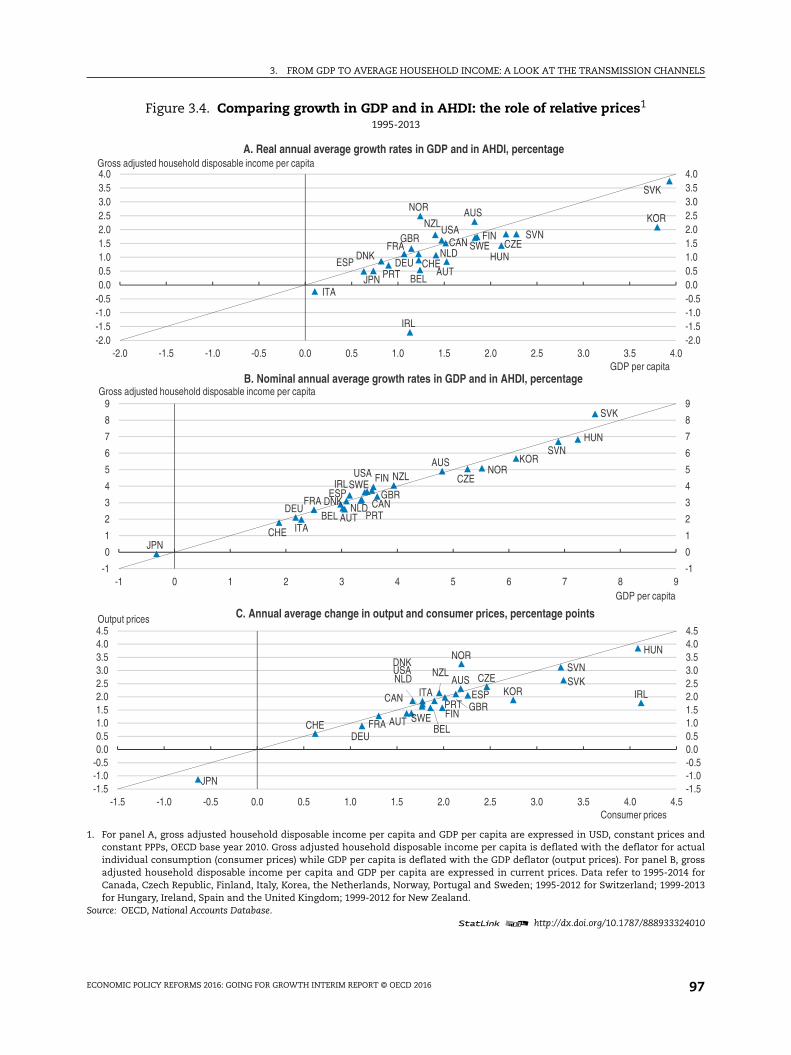
3. FROM GDP TO AVERAGE HOUSEHOLD INCOME: A LOOK AT THE TRANSMISSION CHANNELS
es andactual, gross
014 for9-2013
324010
-1
0
1
2
3
4
5
6
7
8
9
9
-1.5-1.0-0.50.00.51.01.52.02.53.03.54.04.5
.5
-2.0-1.5-1.0-0.50.00.51.01.52.02.53.03.54.0
.0
Figure 3.4. Comparing growth in GDP and in AHDI: the role of relative prices1
1995-2013
1. For panel A, gross adjusted household disposable income per capita and GDP per capita are expressed in USD, constant pricconstant PPPs, OECD base year 2010. Gross adjusted household disposable income per capita is deflated with the deflator forindividual consumption (consumer prices) while GDP per capita is deflated with the GDP deflator (output prices). For panel Badjusted household disposable income per capita and GDP per capita are expressed in current prices. Data refer to 1995-2Canada, Czech Republic, Finland, Italy, Korea, the Netherlands, Norway, Portugal and Sweden; 1995-2012 for Switzerland; 199for Hungary, Ireland, Spain and the United Kingdom; 1999-2012 for New Zealand.
Source: OECD, National Accounts Database.1 2 http://dx.doi.org/10.1787/888933
AUS
AUTBELCAN
CHE
CZE
DEUDNK
ESPFIN
FRA GBR
HUN
IRL
ITA
JPN
KOR
NLD
NORNZL
PRT
SVK
SVN
SWEUSA
-1
0
1
2
3
4
5
6
7
8
9
-1 0 1 2 3 4 5 6 7 8GDP per capita
B. Nominal annual average growth rates in GDP and in AHDI, percentageGross adjusted household disposable income per capita
AUS
AUTBEL
CAN
CHE
CZE
DEU
DNK
ESP
FINFRA
GBR
HUN
IRLITA
JPN
KORNLD
NOR
NZL
PRT
SVKSVN
SWE
USA
-1.5-1.0-0.50.00.51.01.52.02.53.03.54.04.5
-1.5 -1.0 -0.5 0.0 0.5 1.0 1.5 2.0 2.5 3.0 3.5 4.0 4
Output prices
Consumer prices
C. Annual average change in output and consumer prices, percentage points
AUS
AUTBEL
CAN
CHE
CZE
DEUDNK
ESP
FINFRA
GBR
HUN
IRL
ITAJPN
KOR
NLD
NOR
NZL
PRT
SVK
SVNSWE
USA
-2.0-1.5-1.0-0.50.00.51.01.52.02.53.03.54.0
-2.0 -1.5 -1.0 -0.5 0.0 0.5 1.0 1.5 2.0 2.5 3.0 3.5 4GDP per capita
A. Real annual average growth rates in GDP and in AHDI, percentageGross adjusted household disposable income per capita
ECONOMIC POLICY REFORMS 2016: GOING FOR GROWTH INTERIM REPORT © OECD 2016 97
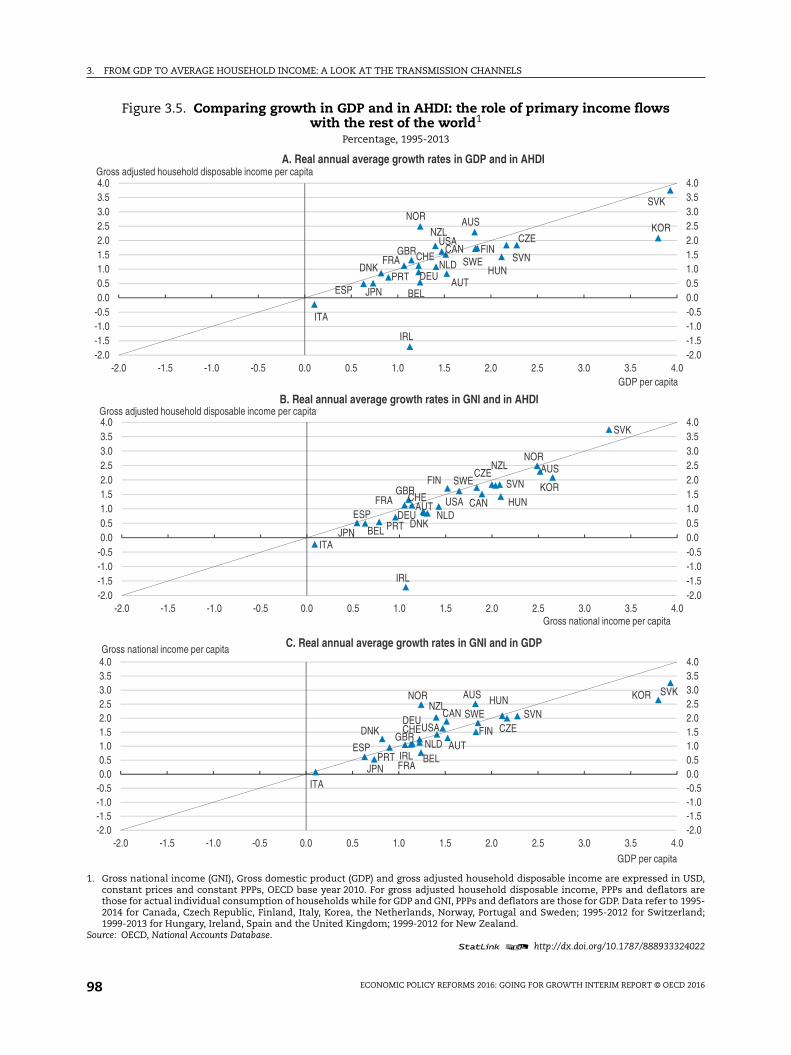
3. FROM GDP TO AVERAGE HOUSEHOLD INCOME: A LOOK AT THE TRANSMISSION CHANNELS
n USD,ors areo 1995-erland;
324022
-2.0-1.5-1.0-0.50.00.51.01.52.02.53.03.54.0
.0
-2.0-1.5-1.0-0.50.00.51.01.52.02.53.03.54.0
.0a
K
-2.0-1.5-1.0-0.50.00.51.01.52.02.53.03.54.0
.0
a
Figure 3.5. Comparing growth in GDP and in AHDI: the role of primary income flowswith the rest of the world1
Percentage, 1995-2013
1. Gross national income (GNI), Gross domestic product (GDP) and gross adjusted household disposable income are expressed iconstant prices and constant PPPs, OECD base year 2010. For gross adjusted household disposable income, PPPs and deflatthose for actual individual consumption of households while for GDP and GNI, PPPs and deflators are those for GDP. Data refer t2014 for Canada, Czech Republic, Finland, Italy, Korea, the Netherlands, Norway, Portugal and Sweden; 1995-2012 for Switz1999-2013 for Hungary, Ireland, Spain and the United Kingdom; 1999-2012 for New Zealand.
Source: OECD, National Accounts Database.1 2 http://dx.doi.org/10.1787/888933
AUS
AUT
BEL
CANCHE
CZE
DEUDNK
ESP
FIN
FRAGBR
HUN
IRL
ITAJPN
KOR
NLD
NORNZL
PRT
SVK
SVNSWE
USA
-2.0-1.5-1.0-0.50.00.51.01.52.02.53.03.54.0
-2.0 -1.5 -1.0 -0.5 0.0 0.5 1.0 1.5 2.0 2.5 3.0 3.5 4Gross national income per capita
B. Real annual average growth rates in GNI and in AHDIGross adjusted household disposable income per capita
AUS
AUTBEL
CANCHE
CZE
DEUDNK
ESP
FINFRA
GBR
HUN
IRL
ITA
JPN
KOR
NLD
NOR
NZL
PRT
SVK
SVNSWE
USA
-2.0-1.5-1.0-0.50.00.51.01.52.02.53.03.54.0
-2.0 -1.5 -1.0 -0.5 0.0 0.5 1.0 1.5 2.0 2.5 3.0 3.5 4GDP per capit
A. Real annual average growth rates in GDP and in AHDIGross adjusted household disposable income per capita
AUS
AUTBEL
CAN
CHE CZEDEU
DNK
ESP
FIN
FRA
GBR
HUN
IRL
ITAJPN
KOR
NLD
NORNZL
PRT
SV
SVNSWEUSA
-2.0-1.5-1.0-0.50.00.51.01.52.02.53.03.54.0
-2.0 -1.5 -1.0 -0.5 0.0 0.5 1.0 1.5 2.0 2.5 3.0 3.5 4
Gross national income per capita C. Real annual average growth rates in GNI and in GDP
GDP per capit
ECONOMIC POLICY REFORMS 2016: GOING FOR GROWTH INTERIM REPORT © OECD 201698

3. FROM GDP TO AVERAGE HOUSEHOLD INCOME: A LOOK AT THE TRANSMISSION CHANNELS
commodity prices over the period under consideration (Figure 3.5, Panel C). Nevertheless,
in most cases, developments in primary income flows with the rest of the world do not
seem to explain much of the wedge between real GDP and real household income
dynamics: indeed, a number of countries (for example Ireland and Italy) experienced
equivalent growth gaps in terms of either GDP or GNI.
A wrap-up on the growth gap of household income vis-à vis GDP
This section has looked at the respective contributions of relative prices and cross-
border income flows to the growth gap between real household disposable income and real
GDP. It finds that the former explains a substantial portion of the gap while the
contribution of the latter is negligible except for a few countries. Taking these factors into
account, the rest of the chapter focuses on the factors potentially driving a wedge between
AHDI and GDP, both expressed in nominal terms.
In order to do so, the chapter introduces the household income share of GDP, a
synthetic measure of the growth dividends from the household perspective, which is
simply defined as the ratio of nominal AHDI to nominal GDP. A significant decline in the
ratio would indicate that a substantial portion of the growth gap in real terms remains to
be explained, even after taking into account relative price effects. As it turns out, such ratio
has been stable over the last two decades, on average across OECD countries (Figure 3.6,
Panels A and B).14 Nevertheless, this stability masks differential trends across countries,
with marked declines – of around 6 percentage points – in Austria, Korea, Belgium and
Norway and marked increases – of around 10 and 5 percentage points – in the
Slovak Republic and Finland, respectively (Figure 3.6, Panel B).
The finding of a broad stability on average is formally confirmed by econometric
analysis: the elasticity of adjusted household disposable income to GDP is not statistically
different from unity, once controlling for country-fixed effects and other factors.15 This
incidentally implies that the wide cross-country differences in the level of household
income shares of GDP (Figure 3.6, Panel A) tend to persist over time. They are likely due to
factors such as the degree of countries’ openness, their trade structure and industrial
composition.16
Income distribution between the household and non-household sectorsThis section provides an exploratory analysis of the household income share along its
components with a view to understanding the channels through which production income
(GDP) translates into household income. This requires assessing the link between GDP and
the three household income components defined in the first section: labour and capital
(i.e. primary income); and secondary income, i.e. income redistributed from the
government. This allows for shedding some light on income distribution between the
household and non-household sectors of the national economy, in particular the
government and corporate sectors.
The labour share of GDP
Labour represents the main source of overall income for the average household
(Figure 3.2). Capital income also plays a role, but it represents a comparatively minor
income source and, depending on the mode of capital remuneration, may be redistributed
from the corporate to the household sector with a lag.17As a result, the functional income
distribution, i.e. the division of income generated by domestic production between the
ECONOMIC POLICY REFORMS 2016: GOING FOR GROWTH INTERIM REPORT © OECD 2016 99
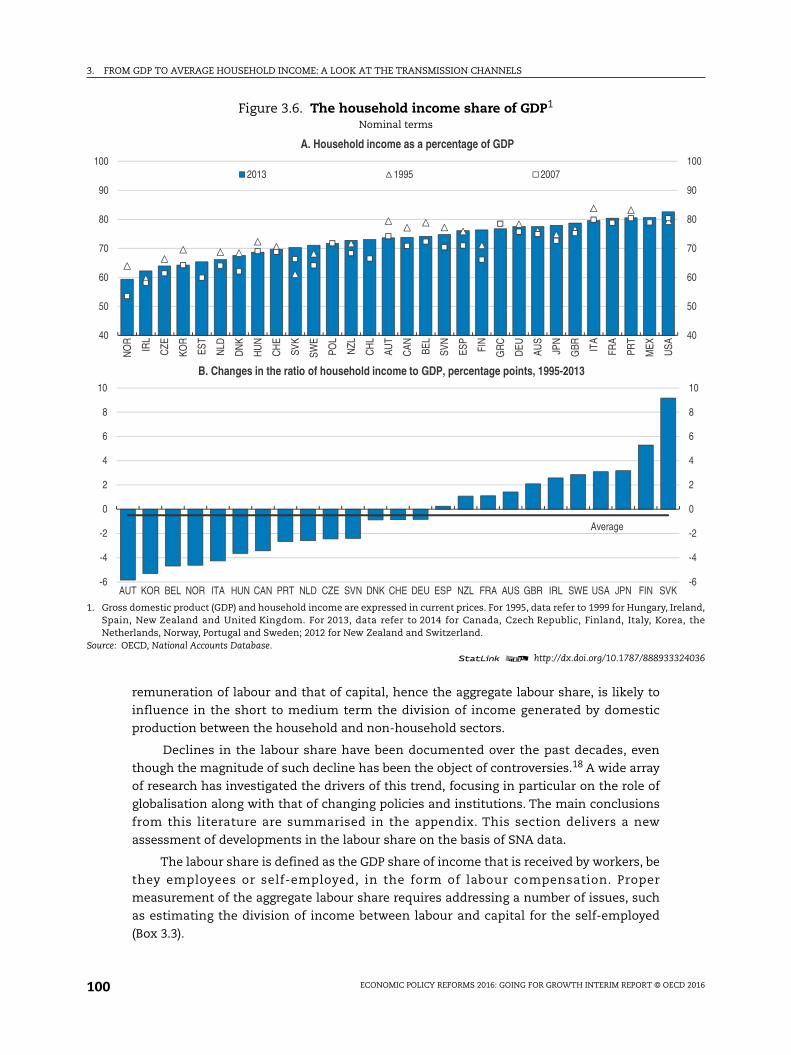
3. FROM GDP TO AVERAGE HOUSEHOLD INCOME: A LOOK AT THE TRANSMISSION CHANNELS
reland,ea, the
324036
40
50
60
70
80
90
100
USA
-6
-4
-2
0
2
4
6
8
10
remuneration of labour and that of capital, hence the aggregate labour share, is likely to
influence in the short to medium term the division of income generated by domestic
production between the household and non-household sectors.
Declines in the labour share have been documented over the past decades, even
though the magnitude of such decline has been the object of controversies.18 A wide array
of research has investigated the drivers of this trend, focusing in particular on the role of
globalisation along with that of changing policies and institutions. The main conclusions
from this literature are summarised in the appendix. This section delivers a new
assessment of developments in the labour share on the basis of SNA data.
The labour share is defined as the GDP share of income that is received by workers, be
they employees or self-employed, in the form of labour compensation. Proper
measurement of the aggregate labour share requires addressing a number of issues, such
as estimating the division of income between labour and capital for the self-employed
(Box 3.3).
Figure 3.6. The household income share of GDP1
Nominal terms
1. Gross domestic product (GDP) and household income are expressed in current prices. For 1995, data refer to 1999 for Hungary, ISpain, New Zealand and United Kingdom. For 2013, data refer to 2014 for Canada, Czech Republic, Finland, Italy, KorNetherlands, Norway, Portugal and Sweden; 2012 for New Zealand and Switzerland.
Source: OECD, National Accounts Database.1 2 http://dx.doi.org/10.1787/888933
40
50
60
70
80
90
100
NO
R
IRL
CZE
KOR
EST
NLD
DN
K
HU
N
CH
E
SVK
SWE
POL
NZL
CH
L
AUT
CAN BE
L
SVN
ESP
FIN
GR
C
DEU AU
S
JPN
GBR IT
A
FRA
PRT
MEX
A. Household income as a percentage of GDP
2013 1995 2007
-6
-4
-2
0
2
4
6
8
10
AUT KOR BEL NOR ITA HUN CAN PRT NLD CZE SVN DNK CHE DEU ESP NZL FRA AUS GBR IRL SWE USA JPN FIN SVK
B. Changes in the ratio of household income to GDP, percentage points, 1995-2013
Average
ECONOMIC POLICY REFORMS 2016: GOING FOR GROWTH INTERIM REPORT © OECD 2016100

3. FROM GDP TO AVERAGE HOUSEHOLD INCOME: A LOOK AT THE TRANSMISSION CHANNELS
Box 3.3. Measuring the aggregate labour share
The aggregate labour share is typically computed by dividing gross labour compensation byGDP at factor costs. There are several measurement issues associated with this calculation:
● Measurement issues in specific industries. In some industries, measurement of the labourshare is problematic, which could impact on that of the aggregate labour share. Forexample, the value added of the public administration, as measured in the nationalaccounts, is often equal to the sum of labour costs. As a consequence the labour sharemay be dramatically inflated in the public sector. Outside the public sector, in industriessuch as mining and fuel production, value added fluctuates quite a lot while wages donot, thereby inducing large fluctuations in the labour share.
● Labour compensation of the self-employed: the revenue of the self-employed is a mix oflabour and capital incomes, which are typically not identified separately in the nationalaccounts and appear under the item “mixed income”. This requires imputing labourincome for the self-employed. There is wide consensus that the remuneration ofproprietor’s labour should be assumed equal to the average compensation of wageearners (Arpaia et al., 2009).*
To analyse the mechanism whereby income generated by aggregate production tricklesdown to households, the labour share must be defined at the aggregate level by assuming thatwage of the self-employed is the same as for the average employee of the whole economy.
In order to gauge the robustness of the analysis, the aggregate labour share can beconfronted to alternative comparable datasets, relying on recent work published byKarabarbounis and Neiman (2014). The correlations between the aggregate labour shareestimates of this chapter and those of Karabarbounis and Neiman are very close to one:they range between 0.90 and 0.95 for the levels and between 0.78 and 0.85 for the annualchanges between 1995 and 2010.
Finally, this chapter uses as a denominator of the labour share of GDP at market prices andnot at factor costs. This is necessary to analyse the link between GDP and household materialliving standards with a view to getting closer on the purchasing power of household incomes.This also takes into account the fact that government absorbs part of the value added (seeEuropean Commission, 2007, for a discussion). In any case, this measurement choice has noimpact on results since the correlation between the labour share measured in terms of GDP atmarket prices and factor costs is higher than 0.97 both in levels and differences.
An additional analytical issue is the treatment of those at the top of the pay distribution;those are often more akin to entrepreneurs, employed by shareholders and rewarded withstock options which are an entitlement based on future profits and reduce the futurereturns to other shareholders. OECD (2012) delivered adjusted labour shares, by excludingthe top 1% earners’ income from the computation of the wage bill for seven countries overthe period 1990 to mid-2000s: this shows that the drop in the “adjusted” labour share – orthe labour share for the bottom 99% of income earners – is even greater than the drop inthe “unadjusted” labour share, especially for the United States and Canada, due to anincrease in the wage share of top income earners. One recent study estimates that thelabour share excluding the contribution of top incomes has declined so much in the USthat it is lower today than at any other time since the 1930s (Giovannoni, 2014). This mayreflect the surge in CEO and other top executives’ compensation, one of the main drivingforces beyond the broader well-documented finding of an increase in the share of nationalincome accruing to top incomes (Atkinson et al. 2011, Fernandes et al. 2009, Frydman andJenker, 2010). This issue is beyond the scope of the current chapter but is left for futureresearch, building on recent OECD work on top incomes (Ruiz and Woloszko, 2015).
* An alternative method, when focusing on the business sector and working at the industry level, is to imputethe hourly compensation of a proprietor’s labour share by using the industry average compensation ofemployees.
ECONOMIC POLICY REFORMS 2016: GOING FOR GROWTH INTERIM REPORT © OECD 2016 101
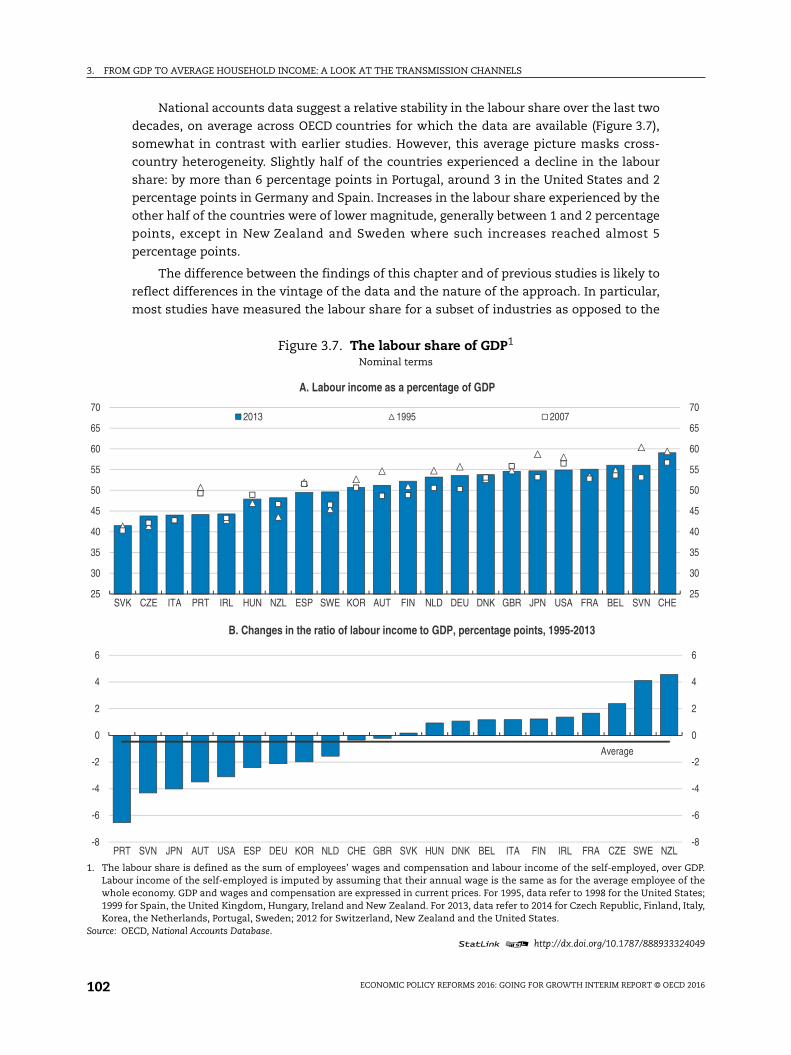
3. FROM GDP TO AVERAGE HOUSEHOLD INCOME: A LOOK AT THE TRANSMISSION CHANNELS
er GDP.of the
States;d, Italy,
324049
25
30
35
40
45
50
55
60
65
70
-8
-6
-4
-2
0
2
4
6
L
National accounts data suggest a relative stability in the labour share over the last two
decades, on average across OECD countries for which the data are available (Figure 3.7),
somewhat in contrast with earlier studies. However, this average picture masks cross-
country heterogeneity. Slightly half of the countries experienced a decline in the labour
share: by more than 6 percentage points in Portugal, around 3 in the United States and 2
percentage points in Germany and Spain. Increases in the labour share experienced by the
other half of the countries were of lower magnitude, generally between 1 and 2 percentage
points, except in New Zealand and Sweden where such increases reached almost 5
percentage points.
The difference between the findings of this chapter and of previous studies is likely to
reflect differences in the vintage of the data and the nature of the approach. In particular,
most studies have measured the labour share for a subset of industries as opposed to the
Figure 3.7. The labour share of GDP1
Nominal terms
1. The labour share is defined as the sum of employees’ wages and compensation and labour income of the self-employed, ovLabour income of the self-employed is imputed by assuming that their annual wage is the same as for the average employeewhole economy. GDP and wages and compensation are expressed in current prices. For 1995, data refer to 1998 for the United1999 for Spain, the United Kingdom, Hungary, Ireland and New Zealand. For 2013, data refer to 2014 for Czech Republic, FinlanKorea, the Netherlands, Portugal, Sweden; 2012 for Switzerland, New Zealand and the United States.
Source: OECD, National Accounts Database.1 2 http://dx.doi.org/10.1787/888933
25
30
35
40
45
50
55
60
65
70
SVK CZE ITA PRT IRL HUN NZL ESP SWE KOR AUT FIN NLD DEU DNK GBR JPN USA FRA BEL SVN CHE
A. Labour income as a percentage of GDP
2013 1995 2007
-8
-6
-4
-2
0
2
4
6
PRT SVN JPN AUT USA ESP DEU KOR NLD CHE GBR SVK HUN DNK BEL ITA FIN IRL FRA CZE SWE NZ
B. Changes in the ratio of labour income to GDP, percentage points, 1995-2013
Average
ECONOMIC POLICY REFORMS 2016: GOING FOR GROWTH INTERIM REPORT © OECD 2016102

3. FROM GDP TO AVERAGE HOUSEHOLD INCOME: A LOOK AT THE TRANSMISSION CHANNELS
aggregate economy, for instance by focusing on the non-primary business sector (as done
in OECD, 2012) while others have also excluded the self-employed (as done in
Karabarbounis and Neiman, 2014). The current findings may mask compositional effects
arising from cross-industry differences as well as workers’ reallocation between industries.
As a result, the aggregate approach needs to be complemented with a finer industry-level
approach in future work.
The household capital income share of GDP
Capital represents a smaller source of overall income than labour for the average
household, but this this income source is far from negligible and highly variable across
countries (Figure 3.2).19 Since capital is ultimately held by households, developments in
economy-wide capital income over the last decades should have ultimately trickled down
to the household sector.20 This section provides a preliminary exploration of developments
in capital income for the average household with a view to shedding light on this issue.
Before doing so, it is useful to remind the SNA definition of household capital income. Such
income covers the three following items:
● Household operating surplus: this item corresponds to income from housing services, that
is, actual and “imputed” rents. In countries where homeownership is dominant such as
France and Italy, most output in the housing sector is recorded as imputed rent paid by
homeowners to themselves and this item amounts to around 10% of household adjusted
disposable income per capita.
● Capital income of the self-employed: this item corresponds to the remuneration of capital for
unincorporated enterprises, which are included in the household sector alongside “real”
households. The national accounts do not generally allow for distinguishing between
income from capital and labour for the self-employed, and the sum of the two is
therefore called “mixed income”. The split between the remuneration of labour and that
of capital needs to be imputed, as explained in Box 3.3. The resulting capital income
share is highly heterogeneous across countries, between 2.5% and 20% of adjusted
household disposable income per capita, not least reflecting the heterogeneous
incidence of self-employment.
● Property income: this item corresponds to the returns on households’ financial
investments (interest, dividends, and imputed interests from life insurance policies). It
represents a smaller part of household income per capita compared to other capital
income components and may not deliver a comprehensive assessment of returns to
financial capital, reflecting the following limitations: i) it excludes capital gains and
losses, whether realised or unrealised, and ii) as a result, it excludes capital gains from
share buy-backs, yet such corporate profits redistribution mechanism to shareholders
has been on the rise relative to dividend pay-out and iii) in some countries such as
Germany and Italy it includes self-employment income accruing to a very substantial
group of small individual firms.21The latter limitation has been shown to affect foremost
cross-country level comparisons, leaving trend comparisons largely unaffected.22
Proper measurement of the capital income share ideally requires taking into account
capital depreciation. The increasing share of fast-depreciating capital, notably intangible
and knowledge-based capital (KBC) in all OECD countries implies an increase in the
average depreciation rate of the overall capital stock (Andrews and Criuscolo, 2013). Experts
generally assume a depreciation rate around 15% for intangible capital, which is much
ECONOMIC POLICY REFORMS 2016: GOING FOR GROWTH INTERIM REPORT © OECD 2016 103

3. FROM GDP TO AVERAGE HOUSEHOLD INCOME: A LOOK AT THE TRANSMISSION CHANNELS
ts1
ed andd theirseholdf fixedngary,
weden;
324054
-14
-12
-10
-8
-6
-4
-2
0
2
4
6
8
10
higher than the depreciation rate applied to tangible capital, although this is a new area of
research which implies that any such estimate is surrounded by uncertainty. Even without
formally taking into account KBC, recent empirical findings based on a sample of G7
countries suggest that trend rise in the capital income share is less pronounced when
measured in net terms, reflecting increasing depreciation rates (Rognlie, 2015).
In practice however, methods for calculating consumption of fixed capital are complex
and tend to differ between countries, thus creating doubts about the comparability of
results. In addition, depreciation data are only available for a subset of countries in the
SNA. As a result of these issues, this chapter presents both gross and net capital income
shares. While the net concept is more appropriate in theory, results should be interpreted
with care, reflecting comparability and measurement issues.
According to SNA data, the household capital income share of GDP (i.e. the ratio of
capital income accruing to the household sector over GDP) has declined in the vast
majority of OECD countries since the mid-90s (Figure 3.8).23 The average decline of 2.5
percentage points masks cross-country differences in magnitude: from more than 12
percentage points in Italy to around 1 percentage point in France. The decline in property
income may partly reflect declining interest payments on government debt held by
households, as suggested by the sharper decline observed in Italy and Belgium, since in
these countries bonds and other debt securities represent a higher proportion of household
financial assets compared to the rest of the OECD.24 Portugal and the United States are
among the few countries experiencing a rise in the household capital income share and
they are also among the countries experiencing a marked decline in the labour share. This
Figure 3.8. The evolution of the household capital income share of GDP and its componenNominal terms, percentage points, 1995-2013
1. The household capital income share is defined as the sum of household operating surplus, capital income of the self-employproperty income, over GDP. Capital income of the self-employed is imputed by the difference between their mixed income anlabour income, assuming that their annual wage is the same as for the average employee of the whole economy. GDP and houcapital income are expressed in current prices. Net capital income is obtained by subtracting households’ consumption ocapital from gross capital income. For 1995, data refer to 1998 for the United States; 1999 for Spain, the United Kingdom, HuIreland and New Zealand. For 2013, data refer to 2014 for Czech Republic, Finland, Italy, Korea, the Netherlands, Portugal, S2012 for Switzerland, New Zealand and the United States.
Source: OECD, National Accounts Database.1 2 http://dx.doi.org/10.1787/888933
-14
-12
-10
-8
-6
-4
-2
0
2
4
6
8
10
ITA BEL HUN CZE IRL NLD GBR DNK CHE SVN AUT ESP FRA JPN DEU FIN SWE USA PRT SVK
Household operating surplus Property income Capital income of the self-employed
Gross household capital income, total Net household capital income
Average (gross household capital income)
ECONOMIC POLICY REFORMS 2016: GOING FOR GROWTH INTERIM REPORT © OECD 2016104

3. FROM GDP TO AVERAGE HOUSEHOLD INCOME: A LOOK AT THE TRANSMISSION CHANNELS
could suggest a shift in the functional income distribution. Nevertheless, a number of
countries experienced a decline in the household capital income share amid stability
(e.g. United Kingdom) or decline (e.g. Austria) in the labour share.
Income from housing services has been the only component of household capital
income not falling relative to GDP. This corresponds to rental income, most of which is
imputed in the national accounts on the grounds of owner-occupied housing. This finding
echoes recent work by Rognlie (2015) as well as Bonnet et al. (2014) who show that the trend
rise in the capital share of GDP has been driven by the housing sector.25 This could mitigate
the adverse distributional consequences of rising capital incomes, because housing is
more equitably distribut ed than other capital assets (i.e. financial assets), as recently
shown in OECD (2015b).26 The role of housing cannot be properly addressed through SNA
data, due to cross-country differences in the methodology applied for imputing owner-
occupied rents (Box 3.1).
Parallel declines in labour and household capital income shares of GDP could suggest
that a rising share of primary income has been retained by the corporate sector. This would
be consistent with Karabarbounis and Neiman (2014) who show that the decline of the
labour share has been the counterpart of a concomitant increase in corporate savings.27
Nevertheless, the findings reported in this chapter provide a more complex picture:
widespread declines in the household capital income share have coincided with mixed
developments in the labour share (i.e. increases in some countries, declines in others). The
decline in household capital income could nevertheless be overestimated in the current
analysis if the nature of capital income has been changing towards forms of remuneration
that are not covered by the SNA. This notably applies to realised capital gains, as discussed
before, including share buy-backs, which have been increasingly used by corporations as a
way to redistribute profits to shareholders. Assessing developments in household capital
income in association with developments in corporate profit distribution and savings
behaviour is also an important area for future research.
The household secondary income share of GDP
Developments in the household income share of GDP may also reflect income flows
between the household and the government sector. Indeed, so far the analysis has focused
on household primary income, that is, income from labour and capital. This needs to be
complemented with an analysis of household secondary income, that is, income that the
government redistributes in cash or in-kind to households, net of the current taxes on
income and wealth paid by households (see Figures 3.1 and 3.2).
Secondary household income shares of GDP have been rising in many countries
(Figure 3.9, Panel A). This finding should be qualified: it largely reflects higher social
transfers and lower taxes during the crisis period (Figure 3.9, Panels B and C), which have
cushioned household disposable incomes from the falls in GDP and market income. Apart
from the crisis period, cross-country trends have been heterogeneous, with around one
third of countries experiencing declines of more than 2 percentage points, another third
facing rises of more than 2 percentage points, and the rest seeing relative stability in the
share of household secondary income in GDP (Figure 3.9). All in all, income redistributed by
the government does not appear as a major long-term driver of disposable income for the
average household, but rather as a key income stabiliser over the economic cycle, which is
broadly consistent with priors on the cushioning role of the welfare state.
ECONOMIC POLICY REFORMS 2016: GOING FOR GROWTH INTERIM REPORT © OECD 2016 105

3. FROM GDP TO AVERAGE HOUSEHOLD INCOME: A LOOK AT THE TRANSMISSION CHANNELS
n-kindined asr 1995,
ta refernd the
324062
-4
-2
0
2
4
6
8
10
N
-6
-4
-2
0
2
4
6
-1
0
1
2
3
4
5
6
7
P
Figure 3.9. The evolution of the household secondary income share of GDP1
Nominal terms, percentage points, 1995-2013
1. The household secondary income share is defined as the sum of the net social benefits, transfers, and social transfers ireceived by households, minus current taxes on income, wealth, etc. over GDP. The household secondary income share is defthe ratio of household secondary income over GDP. GDP and household secondary income are expressed in current prices. Fodata refer to 1998 for the United States; 1999 for Spain, the United Kingdom, Hungary, Ireland and New Zealand. For 2013, dato 2014 for Czech Republic, Finland, Italy, Korea, the Netherlands, Portugal, Sweden; 2012 for Switzerland, New Zealand aUnited States.
Source: OECD, National Accounts Database.1 2 http://dx.doi.org/10.1787/888933
-4
-2
0
2
4
6
8
10
SWE AUT DEU FRA KOR DNK PRT CZE CHE HUN NLD BEL FIN SVN ESP ITA IRL GBR SVK USA JP
A. 1995-2013
Average
-6
-4
-2
0
2
4
6
SWE FIN DNK ESP AUT CZE KOR GBR FRA HUN SVN BEL DEU PRT IRL CHE USA NLD ITA SVK JPN
B. 1995-2007
Average
-1
0
1
2
3
4
5
6
7
DEU PRT NLD CHE FRA KOR AUT BEL SVK HUN ITA CZE SWE JPN SVN IRL DNK USA GBR FIN ES
C. 2007-13
Average
ECONOMIC POLICY REFORMS 2016: GOING FOR GROWTH INTERIM REPORT © OECD 2016106

3. FROM GDP TO AVERAGE HOUSEHOLD INCOME: A LOOK AT THE TRANSMISSION CHANNELS
The finding of an increase in income redistributed from governments to households could
also be overestimated to the extent that consumption taxes are excluded from taxes paid by
households in the SNA framework, as emphasised above. Yet across high-income countries
the recent period has been characterised by a trend shift in the tax structure towards
consumption taxes,28 which is likely to have reduced the purchasing power of household
incomes. Indeed, this is in line with the findings reported in the first section of this chapter,
that is, a decline in real household incomes, when nominal household income is deflated with
consumer prices, as those have increased in many countries relative to output prices.
A Wrap-up on the household income share of GDPTo wrap-up, the changes in the household income share of GDP presented at the
beginning of this chapter can be decomposed as changes in the labour share of GDP, in the
household capital income share of GDP, and in the household secondary income share of
GDP (Figure 3.10). This summary decomposition delivers the following broad conclusions:
● Over the period 1995-2013, declines in the household income share of GDP were in most
cases largely driven by declines in the household capital income share of GDP while
increases were driven by increases in the household secondary income share of GDP. The
contribution of labour income was heterogeneous across countries, but generally of
lower magnitude (Figure 3.10, Panel A).
● The relative contribution of labour, household capital and household secondary income
shares partly reflects the cushioning role of secondary income redistributed by
governments at the onset of the crisis (Figure 3.10, Panels B and C). Indeed, most
OECD countries experienced declines in the household income share of GDP over the
pre-crisis period; this was driven by declines in primary incomes, in particular by
declines in the household capital income share but also, though to a lesser extent, by
declines in the labour share. Such declines were not generally compensated by increases
in household secondary income shares of GDP, in contrast with the crisis period.
From functional income distribution to income inequalityFunctional income distribution, which can be defined as the division of income
between labour and capital, is often expected to explain income inequality. However, the
link is not a simple one whereby income is divided into workers receiving only wages and
capitalists or landlords receiving only profits and rents. First, most people have multiple
sources of income, notably from labour and from capital; second, there is considerable
inequality within each category of income, notably within labour and capital income. Even
if there were only two types of income, wage and capital, the effect on income inequality
of changes in the functional income distribution would depend on the degree of correlation
between wage and capital income and on the relative dispersion between the two income
sources.29
Market incomeEmpirically, declines in the labour share have been associated with widening market-
income inequalities,30 even though the correlation is not very high and a number of
countries have experienced increases in both labour shares and inequality of market
incomes (Figure 3.11). The association is even weaker for household capital income.
Developments in the household capital income share reveal nothing on market-income
inequality, as most OECD countries have experienced declines in household capital income
ECONOMIC POLICY REFORMS 2016: GOING FOR GROWTH INTERIM REPORT © OECD 2016 107

3. FROM GDP TO AVERAGE HOUSEHOLD INCOME: A LOOK AT THE TRANSMISSION CHANNELS
nd the014 forile andin, the
324070
-12-10-8-6-4-2024681012
-8
-6
-4
-2
0
2
4
6
8
10
12
-8
-6
-4
-2
0
2
4
6
8
10
12
Figure 3.10. Decomposing the changes in the household income share of GDP1
Nominal terms, percentage points
1. See Figures 3.7 to 3.9 for the definition of respectively the labour share, the household capital income share (gross terms), ahousehold secondary income share. GDP and the various components are expressed in current prices. For 2013, data refer to 2Czech Republic, Denmark, Finland, Italy, the Netherlands, Portugal and Sweden; 2012 for New Zealand and Switzerland. For ChKorea, the component “Operating surplus” includes mixed income. For panel C, 1999 instead of 1995 for Hungary, Ireland, SpaUnited Kingdom and New Zealand and 1998 for the United States.
Source: OECD, National Accounts Database.1 2 http://dx.doi.org/10.1787/888933
-12-10-8-6-4-202468
1012
AUT BEL ITA HUN PRT NLD CZE SVN DNK CHE DEU ESP FRA GBR IRL SWE JPN FIN USA SVK
A. 1995-2013
Labour share of GDP Capital income share of GDP Secondary income share of GDP Household income share of GDP
-8
-6
-4
-2
0
2
4
6
8
10
12
SVN BEL DNK AUT CZE FIN ESP NLD SWE ITA HUN PRT DEU JPN CHE IRL GBR FRA USA SVK
B. 1995-2007
-8
-6
-4
-2
0
2
4
6
8
10
12
AUT HUN ITA PRT CHE FRA DEU BEL NLD CZE GBR SVK IRL USA SVN ESP JPN DNK SWE FIN
C. 2007-13
ECONOMIC POLICY REFORMS 2016: GOING FOR GROWTH INTERIM REPORT © OECD 2016108

3. FROM GDP TO AVERAGE HOUSEHOLD INCOME: A LOOK AT THE TRANSMISSION CHANNELS
ncomeulationcome).2, data
333811
-8
-6
-4
-2
0
2
4
6
8
10
12
5e
998 foranada,
333824
-8
-6
-4
-2
0
2
4
6
8
10
12
3e
shares and increases in inequality of market incomes (Figure 3.12). This is likely to reflect
measurement limitations associated with household capital income, such as the non-
recording of capital gains in national accounts. Measurement limitations also apply to Gini
coefficients. Generally computed on household surveys, they tend to under-estimate top
incomes and thus the dispersion of capital incomes.
Figure 3.11. Developments in the labour share and in market income inequality¹Nominal terms, percentage points, 1995-2012
1. See Figure 3.7 for a definition of the labour share. Inequality is measured by the Gini index coefficient for pre-tax and transfer i(market income). The values of the Gini coefficient range between 0, in the case of “perfect equality” (i.e. each share of the popgets the same share of income), and 1, in the case of “perfect inequality” (i.e. all income goes to the individual with the highest inFor 1995, data refer to 1998 for the United States, 1999 for Hungary, Ireland, Spain, New Zealand and the United Kingdom. For 201refer to 2011 for Canada, Denmark, France, Germany, Japan, the United Kingdom, New Zealand, Switzerland and Sweden.
Source: OECD, National Accounts and Income Distribution Databases.1 2 http://dx.doi.org/10.1787/888933
AUT
BELCHE
CZE
DEU
DNK
ESP
FIN
FRA
GBR
IRL
ITA
JPN
KOR
NLD
NZL
PRT
SVK
SVN
SWE
USA
-8
-6
-4
-2
0
2
4
6
8
10
12
-5 -4 -3 -2 -1 0 1 2 3 4
Change in the Gini coefficient for household market income
Change in the labour shar
Correlation coefficient = -0.36
Figure 3.12. Developments in the household capital income shareand in market income inequality1
Nominal terms, percentage points, 1995-2012
1. See Figure 3.8 for a definition of the household capital income share and Figure 3.11 for the Gini index. For 1995, data refer to 1the United States, 1999 for Hungary, Ireland, Spain, New Zealand and the United Kingdom. For 2012, data refer to 2011 for CDenmark, France, Germany, Japan, the United Kingdom, New Zealand, Switzerland and Sweden.
Source: OECD, National Accounts and Income Distribution Databases.1 2 http://dx.doi.org/10.1787/888933
AUT
BEL CHE
CZE
DEU
DNK
ESP
FIN
FRA
GBR
IRL
ITA
JPN
NLD
PRT
SVK
SVN
SWE
USA
-8
-6
-4
-2
0
2
4
6
8
10
12
-11 -10 -9 -8 -7 -6 -5 -4 -3 -2 -1 0 1 2
Change in the Gini coefficient for household market income
Change in the household capital income shar
Correlation coefficient = 0.02
ECONOMIC POLICY REFORMS 2016: GOING FOR GROWTH INTERIM REPORT © OECD 2016 109

3. FROM GDP TO AVERAGE HOUSEHOLD INCOME: A LOOK AT THE TRANSMISSION CHANNELS
lity1
tion isfficientStates,France,
333836
-6
-4
-2
0
2
4
6
8
9re
-14-12-10-8-6-4-20246810121416
9re
Secondary or redistribution income allows for moving from market income to
disposable income, i.e. market income net of current income taxes paid and transfers
received by households from the government. The association between developments in
the household secondary income share of GDP and in inequality of household disposable
income is negative and relatively strong (Figure 3.13, Panel A). Redistribution income is
indeed meant to reduce the impact of market income inequality on disposable income
inequality. Nevertheless, the redistributive effect of taxes and transfers is heterogeneous
across OECD countries: for a given rise in secondary income accruing to the average
household, countries are more (e.g. Portugal) or less (the Netherlands) successful at
moderating the transmission from market income inequality to disposable income
inequality (Figure 3.13, panel B).
Figure 3.13. Developments in the household secondary income share and in income inequaNominal terms, percentage points, 1995-2012
1. See Figure 3.9 for a definition of household secondary income share and Figure 3.11 for the Gini index. The extent of redistribudefined as the difference between the Gini coefficients for disposable and market income, relative to the value of the Gini coefor market income. It is measured in terms of the change over the period 1995- 2012. For 1995, data refer to 1998 for the United1999 for Hungary, Ireland, Spain, New Zealand and the United Kingdom. For 2012, data refer to 2011 for Canada, Denmark,Germany, Japan, the United Kingdom, New Zealand, Switzerland and Sweden.
Source: OECD, National Accounts and Income Distribution Databases.1 2 http://dx.doi.org/10.1787/888933
AUT
BELCHE
CZE
DEU
DNK
ESP
FINFRA
GBR
HUNIRL
ITA
JPN
NLD
PRT
SVK
SVN
SWE
USA
-6
-4
-2
0
2
4
6
8
-3 -2 -1 0 1 2 3 4 5 6 7 8
A. Developments in the household secondary income share andin disposable income inequality
Change in the Gini coefficient for household disposable income
Change in the household secondary income sha
Correlation coefficient = -0.41
AUT
BEL
CHE
CZE
DEU
DNK
ESP
FIN
FRA
GBR
IRLITA
JPN
NLD
PRT
SVK
SVN
SWE
USA
-14-12-10
-8-6-4-202468
10121416
-3 -2 -1 0 1 2 3 4 5 6 7 8
B. Developments in the household secondary income share andin the extent of redistribution
Change in the extent of redistribution
Change in the household secondary income sha
Correlation coefficient = -0.63
ECONOMIC POLICY REFORMS 2016: GOING FOR GROWTH INTERIM REPORT © OECD 2016110
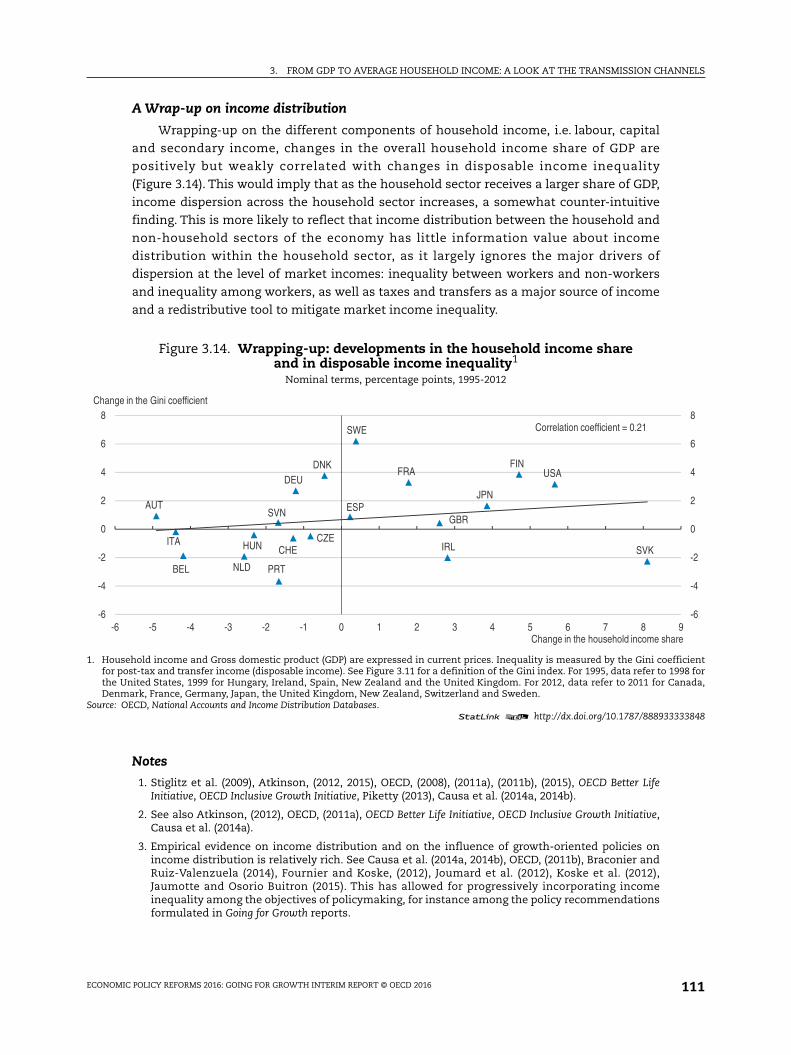
3. FROM GDP TO AVERAGE HOUSEHOLD INCOME: A LOOK AT THE TRANSMISSION CHANNELS
fficient998 foranada,
333848
-6
-4
-2
0
2
4
6
8
9re
A Wrap-up on income distribution
Wrapping-up on the different components of household income, i.e. labour, capital
and secondary income, changes in the overall household income share of GDP are
positively but weakly correlated with changes in disposable income inequality
(Figure 3.14). This would imply that as the household sector receives a larger share of GDP,
income dispersion across the household sector increases, a somewhat counter-intuitive
finding. This is more likely to reflect that income distribution between the household and
non-household sectors of the economy has little information value about income
distribution within the household sector, as it largely ignores the major drivers of
dispersion at the level of market incomes: inequality between workers and non-workers
and inequality among workers, as well as taxes and transfers as a major source of income
and a redistributive tool to mitigate market income inequality.
Notes
1. Stiglitz et al. (2009), Atkinson, (2012, 2015), OECD, (2008), (2011a), (2011b), (2015), OECD Better LifeInitiative, OECD Inclusive Growth Initiative, Piketty (2013), Causa et al. (2014a, 2014b).
2. See also Atkinson, (2012), OECD, (2011a), OECD Better Life Initiative, OECD Inclusive Growth Initiative,Causa et al. (2014a).
3. Empirical evidence on income distribution and on the influence of growth-oriented policies onincome distribution is relatively rich. See Causa et al. (2014a, 2014b), OECD, (2011b), Braconier andRuiz-Valenzuela (2014), Fournier and Koske, (2012), Joumard et al. (2012), Koske et al. (2012),Jaumotte and Osorio Buitron (2015). This has allowed for progressively incorporating incomeinequality among the objectives of policymaking, for instance among the policy recommendationsformulated in Going for Growth reports.
Figure 3.14. Wrapping-up: developments in the household income shareand in disposable income inequality1
Nominal terms, percentage points, 1995-2012
1. Household income and Gross domestic product (GDP) are expressed in current prices. Inequality is measured by the Gini coefor post-tax and transfer income (disposable income). See Figure 3.11 for a definition of the Gini index. For 1995, data refer to 1the United States, 1999 for Hungary, Ireland, Spain, New Zealand and the United Kingdom. For 2012, data refer to 2011 for CDenmark, France, Germany, Japan, the United Kingdom, New Zealand, Switzerland and Sweden.
Source: OECD, National Accounts and Income Distribution Databases.1 2 http://dx.doi.org/10.1787/888933
AUT
BEL
CHECZE
DEUDNK
ESP
FINFRA
GBR
HUN IRLITA
JPN
NLD PRT
SVK
SVN
SWE
USA
-6
-4
-2
0
2
4
6
8
-6 -5 -4 -3 -2 -1 0 1 2 3 4 5 6 7 8
Change in the Gini coefficient
Change in the household income sha
Correlation coefficient = 0.21
ECONOMIC POLICY REFORMS 2016: GOING FOR GROWTH INTERIM REPORT © OECD 2016 111

3. FROM GDP TO AVERAGE HOUSEHOLD INCOME: A LOOK AT THE TRANSMISSION CHANNELS
4. This paper relies on a comprehensive use of the SNA and its guide (Lequiller and Blades, 2014). TheSNA defines six institutional sectors: households (S14); non-financial corporations (S11); financialcorporations (S12); general government (S13); non-profit institutions serving households (S15); andthe rest of the world (S2).
5. An estimate of income derived from the underground (or hidden) economy is included in the SNAand represents a large share of GDP in many countries (for example around 11% in Spain). SeeLequiller and Blades (2014). Household income in the SNA consistently includes income derivedfrom hidden activities. The majority of hidden activities are related to small enterprises. As aconsequence, the main part of the adjustment ends up in output and value added of households(for example in self-employment income).
6. See Atkinson (2009) and (2012) for a discussion and the definition of “spendable income”.
7. Consumption of fixed capital is defined as the reduction in the value of the fixed assets used inproduction. At the household level, the most important fixed asset is usually housing. Under theSNA framework, consumption of fixed capital is estimated by applying a depreciation rate to thecurrent value of each capital asset, i.e. its current market price. The depreciation rate varies acrosscountries and depends on the assumption about assets’ service lives (i.e., how long the asset isassumed to be used; for example in the United States it is assumed that the service life of adwelling is 80 years). Depreciation functions may be geometric (US assumption for dwellings) orlinear. On average across OECD countries for which data are available, consumption of fixed capitalrepresents 5% of net adjusted household disposable income.
8. There are well-known measurement issues in the estimation of households’ consumption of fixedcapital, suggesting that gross adjusted disposable income may be more appropriate for cross-country comparison purposes. The correlation between them is close to one (0.99).
9. Self – employment income corresponds to the SNA item “mixed income”: so-called because thiscategory includes both the remuneration of labour and that of capital.
10. This pattern is in line with recent OECD work on inequality trends during the crisis, where it isshown that taxes and social transfers alleviated the effects on disposable incomes of fallingmarket incomes during the crisis (OECD, 2013c).
11. Many OECD countries have been raising their standard VAT rate, in particular between 2009and 2014. The OECD average standard VAT rate reached 19.1% in January 2014, from 17.6% in January2009. Ten OECD countries now have a standard rate above 22% versus four in 2009. See OECD (2014).
12. For example, household income includes -- while GDP excludes -- the wages and salaries ofworkers who are resident in a country but working in neighbouring countries; conversely,household income excludes, while GDP includes, the wages and salaries of workers who arenon-resident of a country where they have come to work.
13. GNI is not affected by the activity of multinationals and therefore the allocation of value added andprofits across countries. In the SNA, all profits end up in the country of residence of themultinational, via the item “reinvested earnings on foreign direct investment” in the businessaccounts: see Chapter 7 in Lequiller and Blades, (2014).
14. The same diagnosis applies to the household income share of GNI (not shown).
15. This finding confirms earlier results by Causa et al. (2014b).
16. See Causa et al. (2014b) for a discussion.
17. For instance companies may defer cash dividends distribution because the cyclical or institutionalcontext makes it more attractive to accumulate cash or retain earnings for investment purposes.The part of household capital income that accrues in the form of capital gains is de facto excludedfrom the SNA.
18. See OECD, (2012) for a recent in-depth assessment and policy analysis., see also inter alia Arpaiaet al. (2009); Azmat et al. (2012), Bentolila and Saint-Paul (2003), Checchi and Garcia-Penalosa,(2008, 2010), De Serres at al. (2002), Elsby et al. (2013), European Commission, (2007), Frydman andSaks, (2010), Harrison, (2002), Jaumotte and Tytell, (2007); more recent papers have analysed theconcomitant rise in the capital share: see Karabarbounis and Neiman (2014), Piketty (2013), Pikettyand Zucman (2014), Rognlie (2015).
19. Trend rises in the aggregate capital share of GDP among high-income countries since the post wararea have been documented and received growing attention among researchers and policymakers,not least reflecting associated inequality implications (Piketty, 2013). See Karabarbounis andNeiman (2014), Piketty (2013), Piketty and Zucman (2014), Rognlie (2015). The most recent period is
ECONOMIC POLICY REFORMS 2016: GOING FOR GROWTH INTERIM REPORT © OECD 2016112

3. FROM GDP TO AVERAGE HOUSEHOLD INCOME: A LOOK AT THE TRANSMISSION CHANNELS
however characterized by a marked decline in the investment rate hence in capital per worker asdiscussed for instance in Chapter 3 of OECD (2015a). The impact on the functional incomedistribution is likely to depend on number of factors such as substitutability between capital andlabour. The impact on the household capital income share is likely to materialize with a lag andwill depend on companies’ profits and their redistribution strategies.
20. Capital income of general government is null by construction, because the output of the generalgovernment sector consists of non-market output and is valued “at cost”, meaning that valueadded is equal to labour costs (i.e. compensation of civil servants, which is included in theaggregate labour share).
21. In Italy, unincorporated enterprises with more than five employees are considered as “quasi-corporations” and are therefore classified in the corporate sector. This implies an overestimationof the profit share hence an underestimation of the labour share. See Guidetti and Pionnier, (2015)for a detailed assessment.
22. This conclusion is based on findings reported in Guidetti and Pionnier (2015).
23. These results pre-date the crisis: similar conclusions are reached for the period 1995-2013.
24. OECD (2015b), Chapter 6.
25. The finding of positive effects from housing assets is also emphasized in recent OECD work onhousehold wealth: OECD (2015b) shows that rising house prices have been a key factor leading tohigher household wealth in some OECD countries such as Australia, Belgium, Canada, Spain andthe UK. In the SNA, the household income account does not allow for directly capturing capitalgains associated with rising house prices – unless indirectly reflected in rising actual and imputedrents.
26. This argument remains tentative since the National Accounts data do not cover the incomedistribution. See OECD (2015b), Chapter 6 for a recent focus on household wealth and itsdistribution.
27. The authors develop a model-based explanation for these trends: that is, a global decline in thecost of capital, which has induced firms to shift away from labour and towards capital, financed inpart by an increase in corporate savings.
28. OECD (2014).
29. The higher the dispersion of capital relative to labour income and the higher the correlationbetween the two income sources, the most likely will the decline in labour share result in higherinequality.
30. See OECD (2012), Checchi and Garcia Penalosa (2008, 2010).
Bibliography
Andrews, D. and C. Criscuolo (2013), “Knowledge-Based Capital, Innovation and ResourceAllocation”, OECD Economics Department Working Papers 1046, OECD Publishing Paris, http://dx.doi.org/10.1787/5k46bh92lr35-en.
Arpaia, A., E. Prez and K. Pichelmann (2009), “Understanding Labour Income Share Dynamics inEurope”, European Economy Economic Papers No. 379, European Commission, Brussels, May.
Atkinson, A.B, T. Piketty, and E. Saez, (2011), “Top incomes in the long run of history”, Journal of EconomicLiterature, American Economic Association, Vol. 49(1), pages 3-71, March.
Atkinson, A.B. (2009), “Factor shares: the principle problem of political economy?” Oxford Review ofeconomic policy, Vol. 25, No. 1, pp. 3-16.
Atkinson, A.B. (2012), “Putting people first and macro-economic policy”, paper prepared for the OECDNew Approaches to Economic Challenges Group Meeting, October 2012.
Atkinson, A.B. (2015), Inequality: what can be done? Harvard University Press.
Azmat, G., A. Manning and J. van Reenen (2012), “Privatization and the decline of labour’s share:international evidence from network industries”, Economica, Vol. 79 Issue 315, pp. 470-492.
Bassanini, A. and T. Manfredi (2012), “Capital’s Grabbing Hand? A Cross-country/Cross-industryAnalysis of the Decline of the Labour Share”, OECD Social, Employment and Migration Working Paper,OECD Publishing, Paris.
ECONOMIC POLICY REFORMS 2016: GOING FOR GROWTH INTERIM REPORT © OECD 2016 113

3. FROM GDP TO AVERAGE HOUSEHOLD INCOME: A LOOK AT THE TRANSMISSION CHANNELS
Bentolila, S. and G. Saint-Paul (2003), “Explaining Movements in the Labor Share”, Contributions toMacroeconomics, Vol. 3, No. 1.
Blanchard, O. and F. Giavazzi (2003), “Macroeconomic effects of regulation and deregulation in goodsand labor markets”, Quarterly Journal of Economics, Vol. 115, pp. 879-907.
Bonnet, O., P.H. Bono, G. Chapelle and E. Wasmer (2014), “Does housing capital contribute toinequality”? A comment on Thomas Piketty’s Capital in the 21st Century”, Sciences Po EconomicsDiscussion papers 2014-07.
Causa, O. , A. Cavaciuti, N. Ruiz and Z. Smidova, (2014a) “GDP and Income Distribution DevelopmentsAcross OECD Countries”, OECD Economics Department Working Paper, No. 111, OECD Publishing Paris,http://dx.doi.org/10.1787/5jz5m89dh0nt-en.
Causa, O., A. De Serres and N. Ruiz (2014b) “Can Pro-growth policies lift all boats? An analysis based onhousehold disposable income”, OECD Economics Department Working Papers No. 1180, OECDPublishing Paris, http://dx.doi.org/10.1787/5jxrh8dh5wg7-en.
Checchi, D. and C. Garcia-Peñalosa (2008), “Labour Market Institutions and Income Inequality”,Economic Policy, Vol. 23, No. 56, pp. 601-649.
Checchi, D. and C. Garcia-Peñalosa (2010), “Labour Market Institutions and the Personal Distribution ofIncome in the OECD”, Economica, Vol. 77, No. 307, pp. 413-450.
Corrado, C. , J. Haskel, Jona-Lasinio, C. and M. Iommi (2012), “Intangible Capital and Growth inAdvanced Economies: Measurement Methods and Comparative Results”, Intan Invest.
Dew-Becker, I. and R. J. Gordon (2005), “Where did the productivity go? Inflation dynamics and thedistribution of income”, NBER Working Paper 11842.
Elsby, M. W, Honijin, B. and A. Sahin (2013), “The decline of the US labour share”, Brookings papers onEconomic Activity, Fall 2013, p. 51-63.
European Commission (2007),” The Labour income Share the European Union,” Chapter 5 ofEmployment in Europe 2007, Directorate-General for Employment, Social Affairs and EqualOpportunities, Brussels.
Fernandes, N., M.A. Ferreira, P. Matos and K.J. Jenter (2009), “The pay divide: (why) are us top executivespaid more?”, ECGI Working Paper No. 255/2009.
Fournier, J.-M. and I. Koske (2013), “The Determinants Of Earnings Inequality: Evidence from QuantileRegressions”, OECD Journal: Economic Studies, Vol. 2012/1, http://dx.doi.org/10.1787/eco_studies-2012-5k8zs3twbrd8
Frydman, C. and D. Jenter (2010), “CEO Compensation”, Annual Review of Financial Economics, Vol. 2,No. 1, pp. 75-102.
Giovannoni, O. (2014) “What do we know about the labor share and the profit share? Part III: measuresand structural factors”, Economics Working Paper Archive wp_805, Levy Economics Institute.
Guidetti and Pionnier (2015), “Comparing profit shares in value-added in four OECD countries: towardsmore harmonised National Accounts”, OECD Statistics Directorate Working Paper No.61, OECDPublishing, Paris.
Harrison, A. (2002), “Has globalization eroded labor’s share? Some cross-country evidence”, Paperpresented at the Joint Conference of the IDB and the World Bank: The FDI Race: Who Gets thePrize? Is it Worth the Effort? October.
ILO (2012), Global Wage Report 2012/2013: Wages and equitable growth, Geneva.
Jaumotte, F and C. Osorio Buitron (2015), “Inequality and labour market institutions”, IMF StaffDiscussion note SDN/15/14.
Jaumotte, F. and I. Tytell (2007), “How has the globalization of labor affected the labor income share inadvanced countries?”, IMF Working Paper, No. 07/298.
Joumard, I. , M. Pisu and D. Bloch (2012), “Tackling income inequality: the role of taxes and transfers”,OECD Journal: Economic Studies, Vol. 2012.
Karabarbounis, L. and B. Neiman (2014), “The global decline of the labour share”, The Quarterly Journalof Economics 129 (1), p. 61, 103.
Koh, D., R. Santaeulalia-Llopis, and Y. Zheng (2015), “Labour share decline and the capitalization ofintellectual property products”, Washington University in Saint-Louis Working Paper
ECONOMIC POLICY REFORMS 2016: GOING FOR GROWTH INTERIM REPORT © OECD 2016114

3. FROM GDP TO AVERAGE HOUSEHOLD INCOME: A LOOK AT THE TRANSMISSION CHANNELS
Koske, I., J. Fournier and I. Wanner (2012), “Less Income Inequality and More Growth – Are TheyCompatible? Part 2. The Distribution of Labour Income”, OECD Economics Department WorkingPapers, No. 925, OECD Publishing, Paris, http://dx.doi.org/10.1787/5k9h2975rhhf-en
Lequiller, F. and D. Blades (2014), Understanding national accounts: Second Edition, OECD Publishing, Paris.
OECD (2008), Growing Unequal? Income distribution and poverty in OECD countries, OECD Publishing, Paris,http://dx.doi.org/10.1787/9789264044197-en.
OECD (2011a), How’s Life? Measuring well-being, OECD Publishing, Paris, http://dx.doi.org/10.1787/9789264121164-en.
OECD (2011b), Divided we stand: why inequality keeps rising, OECD Publishing, Paris, http://dx.doi.org/10.1787/9789264119536-en
OECD (2012), “Labour losing to capital: what explains the declining labour share?”, Chapter 2 ofEmployment Outlook 2012, OECD Publishing, Paris, http://dx.doi.org/10.1787/empl_outlook-2012-4-en.
OECD (2014), Consumption Tax Trends 2014: VAT/GST and excise rates, trends and policy issues, OECDPublishing, Paris, http://dx.doi.org/10.1787/ctt-2014-en.
OECD (2015a), OECD Economic Outlook Volume 2015/1, OECD Publishing, Paris, http://dx.doi.org/10.1787/eco_outlook-v2015-1-en.
OECD (2015b), In it together: why less inequality benefits all, OECD Publishing, Paris, http://dx.doi.org/10.1787/9789264235120-en.
Piketty, T. (2013), Le capital au XXIème siècle, ed. Seuil, Paris.
Piketty, T. and G. Zucman (2014), “Wealth and inheritance in the long-run”, CEPR discussion paperNo.DP10072.
Rognlie, M. (2015) “Deciphering the fall and rise in the net capital share”, Brooking Chapters on EconomicActivity, BPEA Conference Draft, March 19-20, 2015.
Ruiz, N. and N. Woloszo (2016), “What Do Household Surveys Suggest about the Top 1% incomes andInequality in OECD Countries?”, OECD Economics Department Working Papers, No. 1265, http://dx.doi.org/10.1787/5jrs556f36zt-en.
De Serres, A., Scarpetta, S. and C. de la Maisonneuve (2002), “Sectoral shifts in Europe and theUnited States: how they affect aggregate labour shares and the properties of wage equations”,OECD Economics Department Working Papers No 326, OECD Publishing, Paris, http://dx.doi.org/10.1787/763626062738
Stiglitz, J.E., A. Sen and J.-P. Fitoussi (2009), Report by the Commission on the Measurement of EconomicPerformance and Social Progress, www.stiglitzsenfitoussi.fr/documents/rapport_anglais.pdf.
ECONOMIC POLICY REFORMS 2016: GOING FOR GROWTH INTERIM REPORT © OECD 2016 115

3. FROM GDP TO AVERAGE HOUSEHOLD INCOME: A LOOK AT THE TRANSMISSION CHANNELS
APPENDIX 3.1
Policy drivers of the labour share: a brief literatureoverview
Declines in the labour share have been documented over the past decades, even
though the magnitude of such a decline has been the object of controversies.1 A wide array
of research has investigated the drivers of this trend, focusing in particular on the role of
globalisation along with that of changing policies and institutions. The main conclusions
from this literature can be summarised as follows:
● Empirical evidence has pointed to negative effects of technical change and skill-biased
technical change embodied in ICT capital on the labour share, reflecting extensive
automation of production and substitution between capital and labour.2
❖ Technical change is becoming disembodied to the extent that it reflects the
accumulation of knowledge-based capital (KBC, including output from R&D, better
management, etc.). This also favours high-skilled workers, for instance because the
accumulation of KBC reflects productive improvements associated with highly-
qualified personnel.
❖ However, disembodied technical change and the rising share of KBC have uncertain
effects on the aggregate labour share. First, in net as opposed to gross terms, the
process is not necessarily capital-augmenting once the higher depreciation rates for
KBC are accounted for; second, the process is likely to exacerbate wage inequality
between low- and high-skilled workers, reducing the labour share of the low-skilled
relative to that of the high-skilled, with ambiguous aggregate effects.3
● Evidence on the effect of globalisation on the labour share is not clear cut. Foreign
competition may reduce the bargaining power of workers in exposed industries, which
would not nevertheless necessarily imply a decline in the aggregate labour share. This is
likely to reflect the aggregate interplay between multiple confounding channels and
factors, such as differences in trade-induced reallocation between high and low-labour
share industries and differential effects between high and low-skilled workers.4 Robust
findings for advanced countries can be summarised as follows (OECD, 2012, Bassanini
and Manfredi, 2012):
❖ Rising offshoring of intermediate stages of production tends to reduce the labour share.
❖ Competition from foreign firms in domestic market induces structural changes that
have different effects on the aggregate labour share, that is: i) greater import
penetration prompts reallocation of resources away from affected industries and
towards either domestic industries or countries with lower labour costs; and ii) growth
ECONOMIC POLICY REFORMS 2016: GOING FOR GROWTH INTERIM REPORT © OECD 2016116

3. FROM GDP TO AVERAGE HOUSEHOLD INCOME: A LOOK AT THE TRANSMISSION CHANNELS
of import penetration appears more important in industries that are typically
characterised by a high labour share. The resulting larger trade-induced reallocation
away from these industries contributes to reduce the aggregate labour share, although
available evidence points to a small effect.5, 6
● Evidence on product market liberalisation pertains to the network industries, as most
reforms have been taking place in these industries during the 1990s.
❖ Privatisation of SOEs tends to reduce the labour share within liberalised industries and
as a result the aggregate labour share.
❖ Reductions in barriers to entry have no significant effect on the labour share. This is
likely to reflect the interplay between counter-balancing effects of pro-competitive
reforms: i) on the one hand, these reforms may erode firms’ rents and squeeze profits
hence increase the labour share;7 ii) on the other hand, these reforms may erode the
bargaining power of the average worker hence reduce the labour share.
● Available studies have been largely silent on reform-driven price effects and associated
effects on the labour share. Workers generally benefit from increased competition in the
form of gains in real wages. For example, trade liberalisation reforms that reduce
barriers to import competition should reduce consumption prices relative to GDP prices.
The descriptive analysis reported in this chapter suggests that relative price effects have
a large impact on real household developments. Proper identification of reform-driven
relative price developments is a challenging task for future research.
● Empirical evidence on the effects of labour market policies on labour shares is mixed.
This probably reflects the differential effects across categories of workers, such as across
low and high-skilled workers (European Commission, 2007).8 The main conclusions can
be summarised as follows:
❖ Trends in the labour share cannot be strictly related to the nature of collective
bargaining or to its evolution (OECD, 2012).9 This likely reflects the important and
confounding role of globalisation, increased competition and financial liberalisation,
which have: i) reduced the collective bargaining power of workers across the board,
that is, irrespective of wage bargaining regimes, and ii) at the same time, catalysed
wage bargaining reforms towards either more decentralisation or more centralisation
and co-ordination,10 ultimately delivering wage moderation.11
❖ Increases in the statutory minimum wage relative to the median tend to reduce the
labour share, but the quantitative effect is estimated to be very small (OECD, 2012).
This could reflect that firms are induced to invest in labour-saving innovation
prompted by the need to contain the rise in labour costs. This finding would suggest
that large increases in minimum wage could reduce the labour share, even though
such increases might reduce wage inequality in the lower-half of the wage distribution
and in-work poverty. Indeed, empirical evidence based on European countries
suggests that higher minimum wages increase low-skilled labour shares and reduce
medium-skilled labour shares, resulting in a small negative effect at the aggregate
level (European Commission, 2007).
❖ Stepping-up job search support and active labour market policies (ALMPs) while
reducing the generosity of unemployment benefits has been found to increase the
labour share of low-skilled workers across European countries (European
Commission, 2007). Well-designed and targeted activation and training policies
primarily induce an increase in employment of low-skilled workers, who are
ECONOMIC POLICY REFORMS 2016: GOING FOR GROWTH INTERIM REPORT © OECD 2016 117
3. FROM GDP TO AVERAGE HOUSEHOLD INCOME: A LOOK AT THE TRANSMISSION CHANNELS
overrepresented among the pool of unemployed. The evidence suggests that this
compensates any potential moderating effect on wages. The overall effect of higher
spending on ALMP on the aggregate labour share has been found insignificant,
reflecting a negative effect on the labour share of medium-skilled workers by contrast
to the effect on low-skilled workers; while that of higher UB replacement rates has
been found negative, reflecting a concomitant negative effect on the labour share of
low and medium-skilled workers.
❖ Relaxing job protection has not been found to trigger any significant change in the
aggregate labour share, even though it has been found to boost aggregate productivity
growth. This neutrality may reflect the interplay of differential effects of job protection
between industries and workers. Empirical evidence based on European countries
suggests that stricter job protection increases high-skilled labour shares and reduces
medium-skilled labour shares, resulting in a small negative effect at the aggregate
level (European Commission, 2007). Non-standard employment has become the
predominant source of job creation in many OECD countries since the mid-nineties
(OECD, 2015, Chapter 4). More recent forms of non-standard employment such as on-
call work, subcontracted work and zero-hours contracts in e.g. the United Kingdom
and the United States certainly favour hiring flexibility for firms and in principle also
for workers who need it. However, in practice, for workers, they have been associated
with more wage variability and reduced firms’ obligations to ensure standard benefits
and protection; as well as with low career and training opportunities. Policy changes
of this type may reduce workers’ bargaining power and as a result, their wages,
especially for those with low skills.
● The high growth of the financial sector has also been highlighted as a potential cause of
declining labour shares, even though direct empirical evidence is scarce.12 The
deregulation of financial markets may have lowered workers’ bargaining power by
pressuring firms to reduce costs; hence to focus on core activities while sub-contracting
labour-intensive activities in order to reduce debt while at the same time generate high
short-term profits.
Notes
1. See OECD, (2012) for a recent in-depth assessment and policy analysis., see also inter alia Arpaiaet al. (2009); Azmat et al. (2012), Bentolila and Saint-Paul (2003), Checchi and Garcia-Penalosa,(2008, 2010), De Serres at al. (2002), Elsby et al. (2013), European Commission, (2007), Frydman andSaks, (2010), Harrison, (2002), Jaumotte and Tytell, (2007); more recent papers have analysed theconcomitant rise in the capital share: see Karabarbounis and Neiman (2014), Piketty (2013), Pikettyand Zucman (2014), Rognlie (2015).
2. Karabarbounis and Neiman (2014), Koh et al. (2015), OECD (2012), Arpaia et al. (2009), EuropeanCommission (2007), Jaumotte and Tytell (2007).
3. This reflects differences in substitutability between capital and low skilled as opposed to highskilled labour, because different degree of substitutability between capital and labour havedifferent implications on the effect on the labour share of a change in the relative price of labour.When the elasticity of substitution between capital and labour is smaller than 1, the labour sharewill increase if the capital-labour ratio increases. In this context, the price effect will dominate thequantity effect. This implies that a reduction in workers’ bargaining power leading to a decline inthe real wage will reduce the labour share if the elasticity of substitution between labour andcapital is smaller than 1. Given that it is generally assumed that high skilled labour iscomplementary to capital while low skilled labour is substitutable to capital, capital deepening canincrease the labour share of high skilled workers and reduce the labour share of low skilledworkers.
ECONOMIC POLICY REFORMS 2016: GOING FOR GROWTH INTERIM REPORT © OECD 2016118

3. FROM GDP TO AVERAGE HOUSEHOLD INCOME: A LOOK AT THE TRANSMISSION CHANNELS
4. See OECD (2012) for a discussion.
5. The finding of a small reallocation effect is in line with that of the documented negligible role ofreallocation in explaining changes in the aggregate labour share. See Bassanini and Manfredi(2012).
6. European Commission (2007) finds a negative effect of openness on the labour share of medium-skilled workers, and this drives a negative effect at the aggregate level.
7. This is the well-known prediction of a standard theoretical model with homogenous firms andworkers (Blanchard and Giavazzi, 2003).
8. Again, this is due to differences in the elasticity of substitution between capital and different typesof labour (e.g. low and high skilled). Reform effects are also likely to depend on the elasticity ofsubstitution in industries most affected by the reforms.
9. European Commission (2007) finds a negative effect of union density on the labour share of low-skilled workers and a positive effect on the labour share of high-skilled workers. The authorsinterpret this along the lines of complementarity between high-skilled work and capital andsubstitutability between low-skilled work and capital. Union density is however a very crude andpartial measure which in isolation falls short of capturing the nature of wage bargaining.
10. Such pro-decentralisation reforms have largely aimed at increasing the flexibility to negotiate atfirm level. See OECD (2012) for an in-depth qualitative discussion of wage bargaining reforms.
11. See Box 3.5 in OECD (2012) for a summary of empirical studies on globalisation and increasedcompetition on workers’ bargaining power.
12. OECD (2012), ILO (2012).
ECONOMIC POLICY REFORMS 2016: GOING FOR GROWTH INTERIM REPORT © OECD 2016 119


Economic Policy Reforms 2016
Going for Growth Interim Report
© OECD 2016
Chapter 4
Structural policy indicators
This chapter contains a comprehensive set of quantitative indicators that allow fora comparison of policy settings across countries. The indicators cover areas oftaxation and income support systems and how they affect work incentives, as wellas product and labour market regulations, education and training, trade andinvestment rules and innovation policies. The indicators are presented in the form offigures showing for all countries the most recent available observation and thechange relative to the previous observation.
The statistical data for Israel are supplied by and under the responsibility of the relevant Israeliauthorities. The use of such data by the OECD is without prejudice to the status of the Golan Heights,East Jerusalem and Israeli settlements in the West Bank under the terms of international law.
121

4. STRUCTURAL POLICY INDICATORS
a; 2013
um to
reau ofn (ILO)atisticsge andWages
324086
0
10
20
30
40
50
60
70
80
90
100
CO
L
0
10
20
30
40
50
60
70
80
90
100
Figure 4.1. Cost of labour
1. Missing countries do not have a national statutory minimum wage except for Mexico. Data refer to 2004-05 and 2009-10 for Indifor Colombia.
2. Exactly half of all workers have wages either below or above the median wage for the OECD countries. Percentage of minimaverage wage for China, Indonesia, the Russian Federation and India.
3. The cost of labour is the sum of the wage level and the corresponding social security contribution paid by employers.Source: Panel A: OECD, OECD Employment Outlook Database; China Ministry of Human Resources and Social Security, National BuStatistics; Instituto Brasileiro de Geografia e Estatística (Pesquisa Nacional por Amostra de Domicílios); International Labour OrganisatioDatabase on Conditions of Work and Employment Laws; Ministry of Man Power and Transmigration of the Republic of Indonesia and StIndonesia (BPS); Russia Federal State Statistics Service and Rani, U., P. Belser, M. Oelz and S. Ranjbar (2013), “Minimum wage coveracompliance in developing countries” International Labour Review, Vol 152, No.3-4; Panel B: OECD, OECD Employment Outlook and TaxingDatabases.
1 2 http://dx.doi.org/10.1787/888933
0
10
20
30
40
50
60
70
80
90
100
USA CZE
MEX JP
N
ESP
EST
IRL
CAN
KOR
GR
C
SVK
NLD
GBR EU
OEC
D
POL
BEL
AUS
HU
N
ISR
LUX
PRT
NZL
SVN
FRA
CH
L
TUR
RU
S
CH
N
IND
LVA
BRA
IDN
A. Minimum wages1
As a percentage of median wage2
2014 2009
0
10
20
30
40
50
60
70
80
90
100
CZE
USA JP
N
ESP
EST
IRL
CAN
KOR
GR
C
GBR NLD BE
L
SVK
EU
OEC
D
POL
FRA
AUS
HU
N
ISR
LUX
PRT
NZL
SVN
CH
L
TUR
B. Minimum cost of labour3
As a percentage of labour cost of median worker2
2014 2009
ECONOMIC POLICY REFORMS 2016: GOING FOR GROWTH INTERIM REPORT © OECD 2016122
4. STRUCTURAL POLICY INDICATORS
at 67%ludinglevant
or 2008worker
its aretion is
eceipt.
324097
0
10
20
30
40
50
60
70
80
90
100
LVA
0
10
20
30
40
50
60
70
80
90
100
LVA
Figure 4.2. Net income replacement rates for unemploymentNet income when unemployed as a percentage of net income when working1
1. Simple average of the net replacement rates for the following households situations: single with no child and with two childrenand 100% AW, one-earner married couple with no child and with two children at 67% AW and 100% AW. After tax and incunemployment and family benefits. Social assistance and other means-tested benefits are assumed to be available subject to reincome conditions. Housing costs are assumed equal to 20% of AW. The OECD average excludes Chile for 2008 and Mexico fand 2013. For Turkey, the average worker earnings (AW) value is not available. Calculations are based on average productionearnings (APW).
2. Initial phase of unemployment but following any waiting period. Any income taxes payable on unemployment benefdetermined in relation to annualised benefit values (i.e. monthly values multiplied by 12) even if the maximum benefit durashorter than 12 months.
3. After tax and including unemployment benefits, social assistance, family and housing benefits in the 60th month of benefit rValues for Italy and Turkey are equal to zero in 2008 and 2013.
Source: OECD, Tax-Benefit Models.1 2 http://dx.doi.org/10.1787/888933
0
10
20
30
40
50
60
70
80
90
100
GR
CKO
RTU
RAU
SU
SA NZL
EST
CH
LG
BRH
UN
SVK
SWE
FRA
POL
OEC
DES
PAU
TIT
AEU
DEU CZE
CAN
NO
RIR
LIS
LFI
NPR
TBE
LJP
NN
LDC
HE
SVN
DN
KIS
RLU
X
A. Initial²
2013 2008
0
10
20
30
40
50
60
70
80
90
100
ITA
TUR
CH
LG
RC
USA
HU
NPR
TES
PSV
KKO
RES
TIS
RC
ANO
ECD EU POL
AUS
FRA
NZL
CZE BE
LSV
ND
EUSW
EG
BRN
OR
CH
EN
LDD
NK
ISL
LUX
AUT
FIN
IRL
JPN
B. 60th month³
2013 2008
ECONOMIC POLICY REFORMS 2016: GOING FOR GROWTH INTERIM REPORT © OECD 2016 123
4. STRUCTURAL POLICY INDICATORS
es, as ae datahealthloyees.
lower
age of
ed in :South
324108
0
10
20
30
40
50
60
LVA
0
10
20
30
40
50
60
CH
N
Figure 4.3. Average tax wedge on labour1
As a percentage of total labour compensation
1. Measured as the difference between total labour compensation paid by the employer and the net take-home pay of employeratio of total labour compensation. It therefore includes both employer and employee social security contributions. For India, thcover manufacturing companies with 20 or more employees (which represent 5% of all companies in the sector); liability toinsurance and Employee Provident Fund contributions in India are restricted to employees in firms that have 20 or more empIn China, a significant portion of workers are not covered by the social security system; hence their tax wedge is significantlythan the figure reported here, which reflects the situation of workers covered.
2. Couple with two children, at 100% of average worker earnings for the first earner. Average of three situations regarding the wthe second earner (0%, 33% and 67% of average worker earnings).
Source: OECD, Taxing Wages Database; For BIICS countries, data represent the latest figures based on the methodology describGandullia, L., N. Iacobone and A. Thomas (2012), “Modelling the tax burden on labour income in Brazil, China, India, Indonesia andAfrica” OECD Taxation Working Papers, No. 14; for Latvia, data are based on the methodology described in Taxing Wages.
1 2 http://dx.doi.org/10.1787/888933
0
10
20
30
40
50
60
CH
LN
ZL ISR
MEX
KOR
CH
EIR
LAU
SG
BRC
AN ISL
USA LU
XJP
NN
LDO
ECD
NO
RPO
LPR
TG
RC
TUR
DN
KES
PEU FI
NSV
NSV
KES
TC
ZESW
EIT
AAU
TD
EU FRA
HU
NBE
L
IDN
ZAF
IND
BRA
CH
N
A. At 67% of average worker earnings, single person without children
2014 2009
0
10
20
30
40
50
60
CH
LN
ZLC
HE
IRL
ISR
MEX
KOR
LUX
AUS
CAN USA
GBR IS
LJP
NO
ECD
SVN
NLD
DN
KPO
LC
ZESV
KN
OR
PRT
EU EST
ESP
TUR
SWE
HU
NFI
ND
EU AUT
ITA
FRA
GR
CBE
L
IDN
IND
ZAF
BRA
LVA
B. At 100% of average worker earnings, couple with two children²
2014 2009
ECONOMIC POLICY REFORMS 2016: GOING FOR GROWTH INTERIM REPORT © OECD 2016124

4. STRUCTURAL POLICY INDICATORS
-homeof theresent
cted toecurityered.ed in :South
324113
0
10
20
30
40
50
60
70
80
LVA
0
10
20
30
40
50
60
70
80
LVA
0
10
20
30
40
50
60
70
80
LVA
Figure 4.4. Marginal tax wedge on labour1
As a percentage of total labour compensation for single persons without children
1. Measured as the difference between the change in total labour compensation paid by employers and the change in the net takepay of employees, as a result of an extra unit of national currency of labour income. The difference is expressed as a percentagechange in total labour compensation. For India, the data cover manufacturing companies with 20 or more employees (which rep5% of all companies in the sector); liability to health insurance and Employee Provident Fund contributions in India are restriemployees in firms that have 20 or more employees. In China, a significant portion of workers are not covered by the social ssystem; hence their tax wedge is significantly lower than the figure reported here, which reflects the situation of workers cov
Source: OECD, Taxing Wages Database; For BIICS countries, data represent the latest figures based on the methodology describGandullia, L., N. Iacobone and A. Thomas (2012), “Modelling the tax burden on labour income in Brazil, China, India, Indonesia andAfrica” OECD Taxation Working Papers, No. 14; for Latvia, data are based on the methodology described in Taxing Wages.
1 2 http://dx.doi.org/10.1787/888933
0
10
20
30
40
50
60
70
80
CH
LM
EX NZL
KOR
CH
EIS
RJP
NC
AN USA PO
LIR
LAU
SD
NK
GBR
OEC
DES
TIS
LN
OR
TUR
SVN
SWE
ESP
LUX
SVK
NLD
GR
CC
ZE EUH
UN
PRT
FIN
ITA
DEU AU
TFR
ABE
L
IDN
ZAF
CH
NIN
DBR
A
A. At 67% of average worker earnings
2014 2009
0
10
20
30
40
50
60
70
80
CH
LM
EXKO
RN
ZLC
HE
JPN
POL
ISR
AUS
GBR
CAN ES
TD
NK
ISL
TUR
USA
OEC
DSV
KSW
EC
ZEG
RC
HU
NES
PN
OR
SVN
NLD EU PR
TLU
XIT
AFI
NIR
LFR
AD
EU AUT
BEL
IND
IDN
ZAF
BRA
CH
N
B. At 100% of average worker earnings
2014 2009
0
10
20
30
40
50
60
70
80
CH
LM
EXKO
RN
ZLJP
NC
HE
POL
CAN ES
PAU
SES
TAU
TU
SAD
EU SVK
ISR
OEC
DTU
RIS
LC
ZEH
UN
GBR EU
NO
RN
LD LUX
GR
CD
NK
IRL
FIN
FRA
SVN
PRT
ITA
SWE
BEL
IND
IDN
ZAF
CH
NBR
A
C. At 167% of average worker earnings
2014 2009
ECONOMIC POLICY REFORMS 2016: GOING FOR GROWTH INTERIM REPORT © OECD 2016 125

4. STRUCTURAL POLICY INDICATORS
res theis theld-age
ecurityividual.
324127
-20
-15
-10
-5
0
5
10
15
IND
-20
-15
-10
-5
0
5
10
15
IND
Figure 4.5. Changes in net pension wealth1
As a percentage of gross annual individual earnings
1. The change in pension wealth is a measure of the incentive to remain in the workforce for an additional period. It measuincrease in the level of pension entitlement one gains by remaining in employment for an additional year. The calculationannual average increase in males’ pension wealth when working from age 55 to 59 (early retirement) and from age 60 to 64 (opension). Net pension wealth is the present value of the flow of pension benefits, taking account of the taxes and social scontributions that retirees have to pay on their pensions. It is measured and expressed as a multiple of gross annual indearnings in the respective country. See OECD (2013), Pensions at a Glance 2013: OECD and G20 Indicators for additional details
Source: OECD, Pension Models.1 2 http://dx.doi.org/10.1787/888933
-20
-15
-10
-5
0
5
10
15
MEX NZL
ESP
USA
DEU
GBR PR
TN
OR
DN
KC
AN FRA
ISL
BEL
EST
POL
CH
LN
LDAU
SSW
EIR
LJP
NO
ECD
FIN
SVK
KOR
AUT
EU ISR
CZE IT
AH
UN
LUX
TUR
CH
EG
RC
SVN
CH
NID
NZA
FBR
ALV
AR
US
A. Early retirement: age 55 to 59
2012 2008
-20
-15
-10
-5
0
5
10
15
LUX
PRT
MEX
SVN
GR
CFR
ABE
LES
TD
EU USA
SWE
CAN EU NZL
ESP
AUS
GBR
OEC
DD
NK
NO
RH
UN
AUT
POL
NLD IR
LC
HL
ISL
CH
EFI
NJP
NIS
RKO
RSV
KC
ZE ITA
TUR
BRA
RU
SLV
AC
HN
IDN
ZAF
B. Old-age pension: age 60 to 64
2012 2008
ECONOMIC POLICY REFORMS 2016: GOING FOR GROWTH INTERIM REPORT © OECD 2016126

4. STRUCTURAL POLICY INDICATORS
es1
level offers to“Equalentage
earner
324131
lled includesSCED 0tries.
324149
-10
0
10
20
30
40
50
60
70
80
90
100
110
120
0.00
0.25
0.50
0.75
1.00
1.25
1.50
1.75
2.00
2.25
Figure 4.6. Difference in net transfers to government: single and equal dual-earner couplPercentage points
1. The figure highlights the differential tax / benefit “regime” between single and dual-earner couple families, for a given overallearnings – e.g. looking at couple families with incomes of 133% of average earnings. It shows the difference in net transgovernment between two household cases: (1) “Single-earner couples” – with one earner with 133% of average earnings and (2)dual-earner couples”- both spouses earn the same either average earnings or 67% of average earnings. The difference is in percpoints and computed as [(1)-(2)]/(1).
2. The value for 2008 is not reported as it is highly distorted due to the fact that the net transfers to government from single-couples is close to zero.
Source: OECD, Tax-Benefit Models.1 2 http://dx.doi.org/10.1787/888933
Figure 4.7. Public expenditure on childcare services1
As a percentage of GDP, 2011
1. Childcare expenditure covers children under three enrolled in childcare and children between the ages of three and five enropre-school. Childcare refers to formal day-care services, such as day-care centres and family day-care. Pre-school inkindergartens and day-care centres which usually provide an educational content as well as traditional care for children (Iunder UNESCO’s classification system). Local government spending may not be properly captured in the data for federal coun
2. EU and OECD averages exclude Canada, Greece, Switzerland and Turkey.Source: OECD, Family and Social Expenditure Databases.
1 2 http://dx.doi.org/10.1787/888933
-10
0
10
20
30
40
50
60
70
80
90
100
110
120
DEU FR
ASV
KC
ZEU
SAH
UN
EST
POL
ISL
CH
ED
NK
CH
LBE
LJP
NSV
NO
ECD
TUR EU
NO
RLU
XES
PPR
TAU
SIT
AC
AN AUT
GBR
SWE
NZL
KOR
FIN
NLD IRL²
GR
CM
EX LVA
2013 2008
0.00
0.25
0.50
0.75
1.00
1.25
1.50
1.75
2.00
2.25
EST
SVK
USA PR
T
CH
L
CZE JP
N
AUT
DEU IR
L
SVN
POL
LUX
ESP
AUS
MEX IT
A
HU
N
BEL
EU²
OEC
D²
KOR
NLD IS
R
NZL FIN
GBR
NO
R
FRA
SWE
ISL
DN
K
LVA
Pre-school Childcare Total, 2006
ECONOMIC POLICY REFORMS 2016: GOING FOR GROWTH INTERIM REPORT © OECD 2016 127

4. STRUCTURAL POLICY INDICATORS
ges of
324153
-60
-40
-20
0
20
40
60
80
100
120
140
LVA
-40
-20
0
20
40
60
80
100
120
LVA
Figure 4.8. Implicit tax on returning to work1
As a percentage of gross earnings in new job, 2012
1. Net transfers and childcare fees for households with two children aged 2 and 3. Taking into account childcare fees and chantaxes and benefits in case of a transition to a job paying two-thirds of average worker earnings.
2. Second earner taking up employment at 67% of average wage and the first earner earns 100% of average wage.3. The OECD average excludes Chile, Italy, Mexico and Turkey.4. Lone parent taking up employment at 67% of average wage.Source: OECD, Tax-Benefit Models; www.oecd.org/els/social/workincentives.
1 2 http://dx.doi.org/10.1787/888933
-60
-40
-20
0
20
40
60
80
100
120
140
KOR
GR
C
ESP
SWE
ISR
EST
PRT
POL
FRA
NO
R
JPN
AUT
EU³
ISL
OEC
D³
NLD
CZE
HU
N
DEU FI
N
LUX
DN
K
BEL
SVK
CH
E
AUS
CAN SV
N
USA
GBR IR
L
NZL
A. Second earner taking up employment²
Childcare fee Decrease in benefits Increase in social contributions and income tax Total increase
-40
-20
0
20
40
60
80
100
120
GR
C
PRT
HU
N
SVK
EST
ESP
KOR
SWE
NO
R
POL
FRA
AUS
EU³
OEC
D³
DEU NLD FI
N
LUX
GBR CZE IS
R
NZL
BEL
ISL
SVN
CH
E
DN
K
AUT
USA
CAN IR
L
JPN
B. Lone parent taking up employment4
ECONOMIC POLICY REFORMS 2016: GOING FOR GROWTH INTERIM REPORT © OECD 2016128

4. STRUCTURAL POLICY INDICATORS
arninggdom,
324163
-60
-40
-20
0
20
40
60
80
LVA
-80
-60
-40
-20
0
20
40
60
80
LVA
Figure 4.9. Net costs of childcareChildcare-related costs and benefits as a percentage of average wage, 2012
1. Couples where the first earner earns 100% of the average wage and the second earns 67% of the average wage. Lone parent e67% of the average wage. For Canada, the European Union, Finland, Norway, OECD, Slovak Republic, Slovenia and the United Kinchildcare benefits refer to childcare and other benefits.
2. EU and OECD averages exclude Chile, Italy, Mexico and Turkey.Source: OECD, Tax-Benefit Models; www.oecd.org/els/social/workincentives.
1 2 http://dx.doi.org/10.1787/888933
-60
-40
-20
0
20
40
60
80
KOR
AUT
HU
N
GR
C
PRT
SWE
ISL
POL
EST
ESP
DEU
DN
K
BEL
SVN
FRA
NO
R
EU²
ISR
OEC
D²
CZE
AUS
JPN
FIN
NLD LU
X
SVK
CH
E
CAN USA NZL IR
L
GBR
A. Couples¹
Childcare fee Childcare benefits Tax reductions Net Cost
-80
-60
-40
-20
0
20
40
60
80
KOR
DN
K
LUX
PRT
SWE
BEL
DEU FR
A
AUT
GR
C
ISL
HU
N
GBR
CH
E
POL
EST
ESP
NO
R
NLD EU
²
OEC
D²
AUS
SVN
FIN
JPN
NZL ISR
CZE
CAN SV
K
USA IR
L
B. Lone parent¹
ECONOMIC POLICY REFORMS 2016: GOING FOR GROWTH INTERIM REPORT © OECD 2016 129

4. STRUCTURAL POLICY INDICATORS
he first
U) and
324177
-40
-30
-20
-10
0
10
20
30
40
50
CH
N
0
10
20
30
40
50
60
70
LVA
Figure 4.10. Average tax wedge: single parent versus second earnerPercentage
1. Single parent with two children earning 67% of the average wage.2. Results apply only for the minority case where the employee works in a firm with more than 20 employees.3. Average tax wedge faced by the second earner when earning 67 % of the average wage in a family with two children, where t
earner receives a full average wage.Source: Taxing Wages 2015 (calculations based on data retrieved from OECD.Stat: http://dotstat.oecd.org/Index.aspx?DataSetCode=AWCOTaxing Wages Models for non-OECD member countries.
1 2 http://dx.doi.org/10.1787/888933
-40
-30
-20
-10
0
10
20
30
40
50
IRL
NZL
CAN AU
SIS
RC
HE
GBR LU
XC
HL
DN
KN
LDU
SASV
NM
EXKO
RIS
LO
ECD
NO
R EU JPN
CZE
PRT
HU
NSV
KIT
AES
TFI
NAU
TPO
LES
PD
EUSW
ETU
RBE
LFR
AG
RC
IDN
ZAF
LVA
IND
²BR
A
A. Single parent¹
2014 2009
0
10
20
30
40
50
60
70
CH
LIS
RM
EXKO
RC
HE
GBR NLD JP
NN
ZLN
OR
IRL
USA PO
LTU
RAU
SO
ECD
FIN
GR
CC
AN LUX
SWE
ESP
EST
DN
KEU SV
KAU
TPR
TIT
AIS
LFR
AC
ZEH
UN
SVN
DEU BE
L
IDN
ZAF
IND
²BR
AC
HN
B. Second earner³
2014 2009
ECONOMIC POLICY REFORMS 2016: GOING FOR GROWTH INTERIM REPORT © OECD 2016130

4. STRUCTURAL POLICY INDICATORS
blished
324184
erages
324193
0.0
0.5
1.0
1.5
2.0
2.5
3.0
3.5
4.0
4.5
5.0
5.5
0
5
10
15
20
25
30
35
40
45
50
55
60
65
70
Figure 4.11. Number of weeks lost due to sick leave
1. The OECD average excludes Australia, Chile, Israel, Japan, Korea, Mexico and New Zealand.Source: OECD estimates based on the European Labour Force Survey (unpublished data), the Canadian Labour Force Survey and puU.S Current Population Survey estimates on lost working time rate due to injury or illness of full-time wage and salary workers.
1 2 http://dx.doi.org/10.1787/888933
Figure 4.12. Public expenditure on active labour market policies per unemployed1
As a percentage of GDP per capita
1. Data refer to 2012 for France, Korea, New Zealand, Poland and Spain; 2011 for Israel and the United Kingdom. OECD and EU avexclude Greece, Iceland and Turkey.
Source: OECD, Public expenditure and participant stocks on Labour Market Programmes and Economic Outlook Databases.1 2 http://dx.doi.org/10.1787/888933
0.0
0.5
1.0
1.5
2.0
2.5
3.0
3.5
4.0
4.5
5.0
5.5G
RC
TUR
HU
N
USA ES
T
SVK
ITA
IRL
POL
CAN LU
X
CH
E
GBR
DN
K
NLD IS
L
OEC
D¹
EU CZE
AUT
ESP
SVN
BEL
PRT
DEU
SWE
FRA
FIN
NO
R
LVA
2014 2009
0
5
10
15
20
25
30
35
40
45
50
55
60
65
70
MEX SV
K
USA CH
L
ESP
EST
ISR
GBR PR
T
CAN SV
N
NZL
JPN
AUS
ITA
CZE
POL
IRL
OEC
D EU
HU
N
KOR
BEL
LUX
FRA
NLD
CH
E
DEU FI
N
AUT
NO
R
SWE
DN
K
LVA
2013¹ 2008
ECONOMIC POLICY REFORMS 2016: GOING FOR GROWTH INTERIM REPORT © OECD 2016 131

4. STRUCTURAL POLICY INDICATORS
324200
0.00.51.01.52.02.53.03.54.04.55.05.56.0
0.00.51.01.52.02.53.03.54.04.55.05.56.0
0.00.51.01.52.02.53.03.54.04.55.05.56.0
Figure 4.13. Employment protection legislationIndex scale of 0-6 from least to most restrictive
1. Data refer to 2014 for Colombia, Slovenia and the United Kingdom; 2012 for BRIICS countries and Latvia.2. Values for 2013 are equal to zero for Chile, Indonesia and New Zealand.Source: OECD, Employment Protection Database.
1 2 http://dx.doi.org/10.1787/888933
0.00.51.01.52.02.53.03.54.04.55.05.56.0
CAN USA
GBR NZL
AUS
NLD
SWE
IRL
JPN
ISL
CH
EIS
RD
EUD
NK
FIN
HU
NO
ECD
CZE
SVN
AUT
EUM
EX POL
PRT
BEL
CH
LSV
KKO
RIT
AG
RC
EST
ESP
NO
RFR
ALU
XTU
R
ZAF
RU
SLV
AC
HN
CO
LIN
DID
NBR
A
B. Protection for temporary employment
2013¹ 2008
0.00.51.01.52.02.53.03.54.04.55.05.56.0
CH
LN
ZL FIN
ISR
KOR
PRT
CZE
NO
RSW
ETU
RG
BR AUS
DN
KES
TPO
LU
SAO
ECD
CAN EU NLD
AUT
GR
CJP
NFR
ASV
KSV
NES
PIS
LIR
LD
EUH
UN
CH
EIT
ALU
XM
EX BEL
IDN
IND
BRA
RU
SZA
FC
HN
LVA
CO
L
C. Additional protection on collective dismissals²
2013¹ 2008
0.00.51.01.52.02.53.03.54.04.55.05.56.0
USA
CAN
GBR NZL
HU
NC
HE
IRL
AUS
JPN
EST
SVK
MEX ES
PSV
NO
ECD
ISL
GR
CD
NK
AUT
BEL
EU POL
TUR
NO
RLU
XKO
RIS
RFI
NSW
EC
HL
DEU IT
AFR
AN
LDC
ZEPR
T
CO
LBR
AZA
FLV
AR
US
CH
NIN
DID
N
A. Protection for regular employment
2013¹ 2008
ECONOMIC POLICY REFORMS 2016: GOING FOR GROWTH INTERIM REPORT © OECD 2016132

4. STRUCTURAL POLICY INDICATORS
ates
less ofbourg,
r Chile,aland,
he lastd, thea; 2011
s AIAS,
324219
0102030405060708090100110120
0
10
20
30
40
50
60
70
80
90
100
Figure 4.14. Coverage rates of collective bargaining agreements and trade union density rPercentage
1. The coverage rate is measured as the percentage of workers who are covered by collective bargaining agreements, regardwhether or not they belong to a trade union. For 2013, data refer to 2012 for Australia, Estonia, France, Israel, Korea, LuxemMexico, Poland, Indonesia and South Africa; 2011 for New Zealand; 2010 for Italy; 2009 for Ireland. For 2008, data refer to 2009 foDenmark, Estonia, Hungary, Ireland, Mexico, Norway, Switzerland, Brazil, the Russian Federation and Latvia; 2007 for New ZePoland and Sweden; 2005 for Italy; 2000 for Israel.
2. The union density rate is the percentage of workers belonging to a trade union. The rates refer to wage and salary workers. Tavailable year is 2014 for Australia, Canada, Chile, Iceland, Ireland, Japan, Mexico, New Zealand, Sweden, SwitzerlanUnited Kingdom and the United States; 2012 for Indonesia, Israel, Korea, Latvia, Luxembourg, Poland, Portugal and South Africfor Brazil.
Source: OECD estimates and J. Visser, ICTWSS Database, Version 5.0. Amsterdam: Amsterdam Institute for Advanced Labour StudieOctober 2015.
1 2 http://dx.doi.org/10.1787/888933
0102030405060708090
100110120
TUR
KOR
USA
MEX PO
LN
ZLJP
NC
HL
HU
NES
TSV
KIS
RC
ANG
BR IRL
GR
CC
ZEC
HE
OEC
DD
EU LUX
AUS
EU SVN
NO
RPR
TES
PIT
AD
NK
NLD IS
LSW
EFI
NBE
LAU
TFR
A
IDN
LVA
RU
SZA
FBR
A
A. Coverage rates of collective bargaining agreements¹
2013 2008
0
10
20
30
40
50
60
70
80
90
100
EST
TUR
FRA
KOR
HU
NU
SA CZE
POL
SVK
MEX
AUS
CH
LC
HE
ESP
JPN
NLD
DEU NZL
PRT
SVN
GR
CIS
RG
BRC
ANO
ECD
IRL
AUT
EU LUX
ITA
NO
RBE
LD
NK
SWE
FIN
ISL
IDN
LVA
BRA
RU
SZA
F
B. Trade union density rates²
2013 2008
ECONOMIC POLICY REFORMS 2016: GOING FOR GROWTH INTERIM REPORT © OECD 2016 133
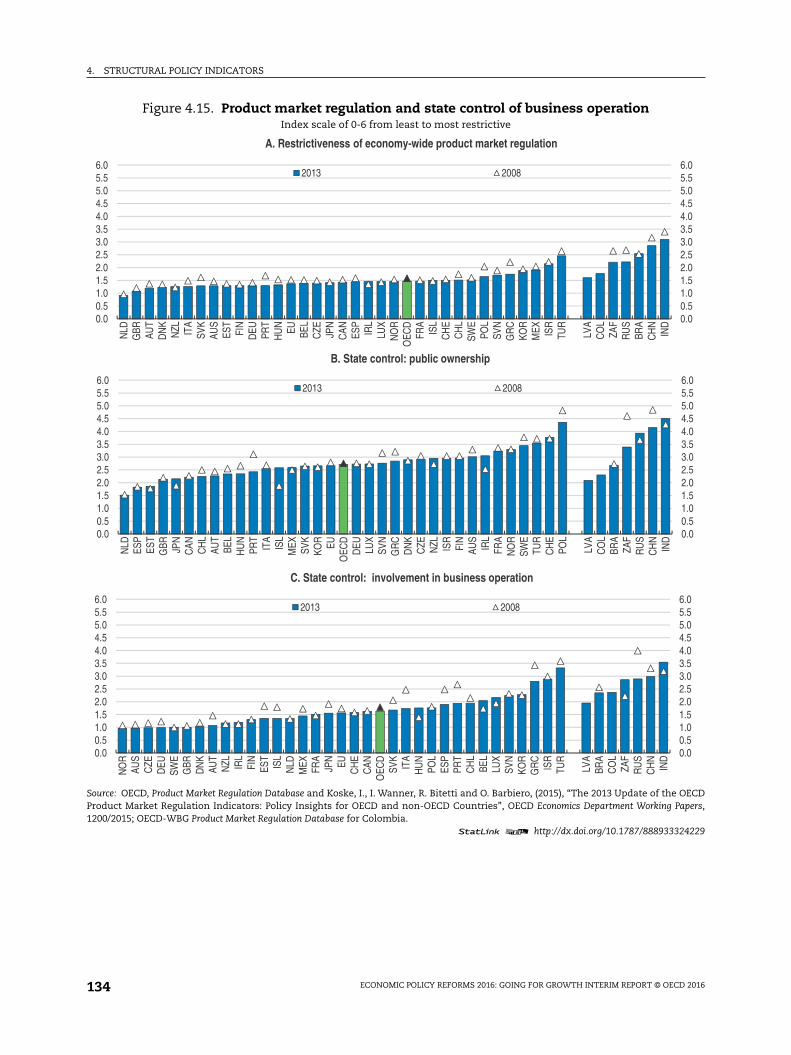
4. STRUCTURAL POLICY INDICATORS
OECDPapers,
324229
0.00.51.01.52.02.53.03.54.04.55.05.56.0
0.00.51.01.52.02.53.03.54.04.55.05.56.0
0.00.51.01.52.02.53.03.54.04.55.05.56.0
Figure 4.15. Product market regulation and state control of business operationIndex scale of 0-6 from least to most restrictive
Source: OECD, Product Market Regulation Database and Koske, I., I. Wanner, R. Bitetti and O. Barbiero, (2015), “The 2013 Update of theProduct Market Regulation Indicators: Policy Insights for OECD and non-OECD Countries”, OECD Economics Department Working1200/2015; OECD-WBG Product Market Regulation Database for Colombia.
1 2 http://dx.doi.org/10.1787/888933
0.00.51.01.52.02.53.03.54.04.55.05.56.0
NLD
GBR AU
TD
NK
NZL ITA
SVK
AUS
EST
FIN
DEU PR
TH
UN EU BEL
CZE JP
NC
AN ESP
IRL
LUX
NO
RO
ECD
FRA
ISL
CH
EC
HL
SWE
POL
SVN
GR
CKO
RM
EX ISR
TUR
LVA
CO
LZA
FR
US
BRA
CH
NIN
D
A. Restrictiveness of economy-wide product market regulation
2013 2008
0.00.51.01.52.02.53.03.54.04.55.05.56.0
NLD
ESP
EST
GBR JP
NC
AN CH
LAU
TBE
LH
UN
PRT
ITA
ISL
MEX SV
KKO
R EUO
ECD
DEU LU
XSV
NG
RC
DN
KC
ZE NZL ISR
FIN
AUS
IRL
FRA
NO
RSW
ETU
RC
HE
POL
LVA
CO
LBR
AZA
FR
US
CH
NIN
D
B. State control: public ownership
2013 2008
0.00.51.01.52.02.53.03.54.04.55.05.56.0
NO
RAU
SC
ZED
EUSW
EG
BRD
NK
AUT
NZL IR
LFI
NES
TIS
LN
LDM
EX FRA
JPN EU
CH
EC
ANO
ECD
SVK
ITA
HU
NPO
LES
PPR
TC
HL
BEL
LUX
SVN
KOR
GR
CIS
RTU
R
LVA
BRA
CO
LZA
FR
US
CH
NIN
D
C. State control: involvement in business operation
2013 2008
ECONOMIC POLICY REFORMS 2016: GOING FOR GROWTH INTERIM REPORT © OECD 2016134

4. STRUCTURAL POLICY INDICATORS
OECDPapers,
324232
0.00.51.01.52.02.53.03.54.04.55.05.56.0
IND
0.00.51.01.52.02.53.03.54.04.55.05.56.0
CH
N
0.00.51.01.52.02.53.03.54.04.55.05.56.0
ZAF
Figure 4.16. Barriers to entrepreneurshipIndex scale of 0-6 from least to most restrictive
Source: OECD, Product Market Regulation Database and Koske, I., I. Wanner, R. Bitetti and O. Barbiero, (2015), “The 2013 Update of theProduct Market Regulation Indicators: Policy Insights for OECD and non-OECD Countries”, OECD Economics Department Working1200/2015; OECD-WBG Product Market Regulation Database for Colombia.
1 2 http://dx.doi.org/10.1787/888933
0.00.51.01.52.02.53.03.54.04.55.05.56.0
PRT
SVK
ITA
HU
NAU
TN
LDD
NK
CAN NZL
POL
LUX
MEX BE
LFR
AFI
N EU JPN
CH
EO
ECD
DEU
KOR
EST
NO
RG
RC
AUS
SVN
GBR CZE IS
LSW
EES
PIR
LIS
RTU
RC
HL
RU
SC
OL
LVA
ZAF
CH
NBR
A
A. Complexity of regulatory procedures
2013 2008
0.00.51.01.52.02.53.03.54.04.55.05.56.0
AUS
NZL
CH
LC
HE
NLD
DN
KC
ANN
OR
GBR
SWE
IRL
JPN
DEU FI
NES
TKO
RO
ECD
SVN EU ISL
AUT
SVK
CZE IT
AFR
AIS
RES
PG
RC
LUX
MEX PR
TBE
LPO
LH
UN
TUR
RU
SZA
FC
OL
LVA
BRA
IND
B. Administrative burdens on startups
2013 2008
0.00.51.01.52.02.53.03.54.04.55.05.56.0
GBR ES
TC
ZEAU
TSV
KSW
EPO
LIT
AIR
LEU SV
NES
PPR
TC
HL
DN
KN
LD FIN
GR
CFR
AO
ECD
LUX
NZL
BEL
DEU
CAN
HU
NC
HE
ISL
JPN
NO
RKO
RTU
RAU
SIS
RM
EX LVA
CO
LC
HN
BRA
RU
SIN
D
C. Regulatory protection of incumbents
2013 2008
ECONOMIC POLICY REFORMS 2016: GOING FOR GROWTH INTERIM REPORT © OECD 2016 135

4. STRUCTURAL POLICY INDICATORS
OECDPapers,
324249
0.0
0.5
1.0
1.5
2.0
2.5
3.0
3.5
4.0
CH
N
0.0
0.5
1.0
1.5
2.0
2.5
3.0
3.5
4.0
BRA
0.0
0.5
1.0
1.5
2.0
2.5
3.0
3.5
4.0
BRA
Figure 4.17. Barriers to trade and investmentIndex scale of 0-6 from least to most restrictive
Source: OECD, Product Market Regulation Database and Koske, I., I. Wanner, R. Bitetti and O. Barbiero, (2015), “The 2013 Update of theProduct Market Regulation Indicators: Policy Insights for OECD and non-OECD Countries”, OECD Economics Department Working1200/2015; OECD-WBG Product Market Regulation Database for Colombia.
1 2 http://dx.doi.org/10.1787/888933
0.0
0.5
1.0
1.5
2.0
2.5
3.0
3.5
4.0
LUX
PRT
SVN
CZE
NLD ES
TFI
NES
PD
EUH
UN
GR
CD
NK
EU BEL
IRL
SVK
ITA
JPN
CH
LSW
ETU
RG
BR POL
OEC
DC
HE
NO
RFR
AAU
TAU
SKO
RIS
LIS
RC
ANM
EX NZL
CO
LLV
AZA
FBR
AR
US
IND
A. Barriers to FDI
2013 2008
0.0
0.5
1.0
1.5
2.0
2.5
3.0
3.5
4.0
AUS
AUT
BEL
CAN CH
LC
ZED
NK
EST
FIN
FRA
DEU
GR
CH
UN
ISL
IRL
ISR
ITA
JPN
LUX
NLD NZL
NO
RPO
LPR
TSV
KSV
NES
PSW
EC
HE
TUR
GBR EU
OEC
DM
EXKO
R
LVA
CO
LR
US
ZAF
CH
NIN
D
B. Tariff barriers
2013 2008
0.0
0.5
1.0
1.5
2.0
2.5
3.0
3.5
4.0
AUS
NLD NZL
GBR BE
LPO
LC
HE
FIN
HU
NIR
LIS
LLU
XFR
AD
EU EU ESP
CH
LPR
TIT
AO
ECD
CZE
DN
KAU
TN
OR
GR
CKO
RSV
KSW
EJP
NES
TC
AN ISR
SVN
MEX
TUR
IND
LVA
CH
NC
OL
ZAF
RU
S
C. Other barriers to trade and investment
2013 2008
ECONOMIC POLICY REFORMS 2016: GOING FOR GROWTH INTERIM REPORT © OECD 2016136

4. STRUCTURAL POLICY INDICATORS
OECDPapers,
324253
0.00.51.01.52.02.53.03.54.04.55.05.56.0
ZAF
0.00.51.01.52.02.53.03.54.04.55.05.56.0
ZAF
0.00.51.01.52.02.53.03.54.04.55.05.56.0
CO
L
Figure 4.18. Sectoral regulation in the transport sectorIndex scale of 0-6 from least to most restrictive
Source: OECD, Product Market Regulation Database and Koske, I., I. Wanner, R. Bitetti and O. Barbiero, (2015), “The 2013 Update of theProduct Market Regulation Indicators: Policy Insights for OECD and non-OECD Countries”, OECD Economics Department Working1200/2015; OECD-WBG Product Market Regulation Database for Colombia.
1 2 http://dx.doi.org/10.1787/888933
0.00.51.01.52.02.53.03.54.04.55.05.56.0
AUS
AUT
CH
LD
EUG
RC
HU
NIS
LIT
ASV
KES
PC
HE
GBR BE
LN
LDD
NK
NO
RFR
ASW
EIR
LO
ECD EU
CAN JP
NKO
RIS
RLU
XFI
NM
EX NZL
TUR
POL
CZE ES
TPR
TSV
N
BRA
CO
LIN
DC
HN
LVA
RU
S
A. Airlines sector
2013 2008
0.00.51.01.52.02.53.03.54.04.55.05.56.0
GBR
CAN CZE
DN
KD
EU AUS
AUT
EST
ITA
POL
NO
RJP
NSW
EH
UN
NLD
SVK
EUO
ECD
BEL
FRA
SVN
PRT
CH
EM
EX ESP
CH
LFI
NG
RC
KOR
IRL
LUX
ISR
NZL
TUR
LVA
RU
SC
OL
BRA
IND
CH
N
B. Rail sector
2013 2008
0.00.51.01.52.02.53.03.54.04.55.05.56.0
AUS
CAN IS
RC
HE
AUT
DN
KFI
ND
EU IRL
JPN
LUX
MEX NZL
NO
RSV
KSW
EG
BRO
ECD
HU
N EU BEL
CZE ES
TIS
LKO
RN
LDPO
LPR
TSV
NES
PC
HL
GR
CFR
ATU
RIT
A
BRA
RU
SZA
FIN
DLV
AC
HN
C. Road sector
2013 2008
ECONOMIC POLICY REFORMS 2016: GOING FOR GROWTH INTERIM REPORT © OECD 2016 137

4. STRUCTURAL POLICY INDICATORS
OECDPapers,
324263
0.00.51.01.52.02.53.03.54.04.55.05.56.0
ZAF
0.00.51.01.52.02.53.03.54.04.55.05.56.0
BRA
Figure 4.19. Sectoral regulation in the energy sectorIndex scale of 0-6 from least to most restrictive
Source: OECD, Product Market Regulation Database and Koske, I., I. Wanner, R. Bitetti and O. Barbiero, (2015), “The 2013 Update of theProduct Market Regulation Indicators: Policy Insights for OECD and non-OECD Countries”, OECD Economics Department Working1200/2015; OECD-WBG Product Market Regulation Database for Colombia.
1 2 http://dx.doi.org/10.1787/888933
0.00.51.01.52.02.53.03.54.04.55.05.56.0
ESP
PRT
DEU
GBR CH
LIT
AH
UN
FIN
AUT
BEL
NLD EU NZL
POL
JPN
SVK
IRL
AUS
NO
RSW
EC
ZEO
ECD
DN
KC
HE
SVN
GR
CLU
XTU
RFR
AES
TC
ANKO
RIS
LIS
RM
EX
BRA
CO
LR
US
IND
LVA
CH
N
A. Electricity sector
2013 2008
0.00.51.01.52.02.53.03.54.04.55.05.56.0
GBR ES
PD
EU PRT
CAN BE
LSW
EH
UN
AUS
ITA
CZE NZL
EST
AUT
CH
LEU NLD IS
RO
ECD
FRA
JPN
LUX
DN
KSV
KSV
NIR
LTU
RG
RC
CH
EN
OR
POL
FIN
MEX
KOR
CO
LC
HN
IND
RU
SLV
AZA
F
B. Gas sector
2013 2008
ECONOMIC POLICY REFORMS 2016: GOING FOR GROWTH INTERIM REPORT © OECD 2016138
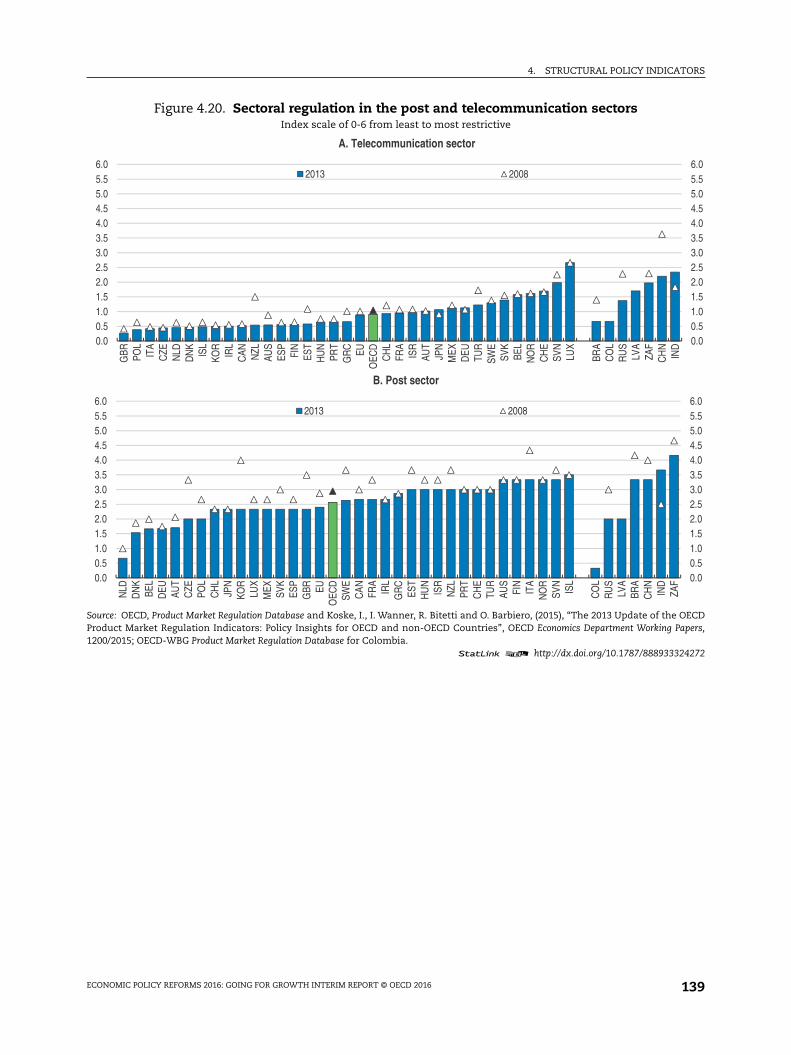
4. STRUCTURAL POLICY INDICATORS
OECDPapers,
324272
0.00.51.01.52.02.53.03.54.04.55.05.56.0
IND
0.00.51.01.52.02.53.03.54.04.55.05.56.0
ZAF
Figure 4.20. Sectoral regulation in the post and telecommunication sectorsIndex scale of 0-6 from least to most restrictive
Source: OECD, Product Market Regulation Database and Koske, I., I. Wanner, R. Bitetti and O. Barbiero, (2015), “The 2013 Update of theProduct Market Regulation Indicators: Policy Insights for OECD and non-OECD Countries”, OECD Economics Department Working1200/2015; OECD-WBG Product Market Regulation Database for Colombia.
1 2 http://dx.doi.org/10.1787/888933
0.00.51.01.52.02.53.03.54.04.55.05.56.0
GBR PO
LIT
AC
ZEN
LDD
NK
ISL
KOR
IRL
CAN NZL
AUS
ESP
FIN
EST
HU
NPR
TG
RC EU
OEC
DC
HL
FRA
ISR
AUT
JPN
MEX
DEU TU
RSW
ESV
KBE
LN
OR
CH
ESV
NLU
X
BRA
CO
LR
US
LVA
ZAF
CH
N
A. Telecommunication sector
2013 2008
0.00.51.01.52.02.53.03.54.04.55.05.56.0
NLD
DN
KBE
LD
EU AUT
CZE
POL
CH
LJP
NKO
RLU
XM
EX SVK
ESP
GBR EU
OEC
DSW
EC
AN FRA
IRL
GR
CES
TH
UN
ISR
NZL
PRT
CH
ETU
RAU
SFI
NIT
AN
OR
SVN
ISL
CO
LR
US
LVA
BRA
CH
NIN
D
B. Post sector
2013 2008
ECONOMIC POLICY REFORMS 2016: GOING FOR GROWTH INTERIM REPORT © OECD 2016 139

4. STRUCTURAL POLICY INDICATORS
OECDPapers,
324281
0.00.51.01.52.02.53.03.54.04.55.05.56.0
RU
S
0.00.51.01.52.02.53.03.54.04.55.05.56.0
CH
N
Figure 4.21. Sectoral regulation in retail and professional servicesIndex scale of 0-6 from least to most restrictive
Source: OECD, Product Market Regulation Database and Koske, I., I. Wanner, R. Bitetti and O. Barbiero, (2015), “The 2013 Update of theProduct Market Regulation Indicators: Policy Insights for OECD and non-OECD Countries”, OECD Economics Department Working1200/2015; OECD-WBG Product Market Regulation Database for Colombia.
1 2 http://dx.doi.org/10.1787/888933
0.00.51.01.52.02.53.03.54.04.55.05.56.0
SWE
SVN
KOR
NZL
AUS
NLD
CH
LC
HE
ISL
EST
IRL
CZE
DN
KSV
KG
BR PRT
NO
RO
ECD
HU
NM
EX EU TUR
JPN
AUT
CAN
GR
CPO
LFR
AD
EU FIN
ESP
ITA
ISR
BEL
LUX
LVA
ZAF
CO
LBR
AIN
DC
HN
A. Retail
2013 2008
0.00.51.01.52.02.53.03.54.04.55.05.56.0
SWE
FIN
GBR
DN
KC
HE
AUS
NO
RN
ZLN
LD IRL
MEX CH
LIS
LES
TO
ECD
ITA
JPN
KOR EU FRA
CZE
ESP
BEL
SVN
ISR
DEU AU
TSV
KPR
TG
RC
HU
NC
AN POL
LUX
TUR
CO
LZA
FBR
A
B. Professional services
2013 2008
ECONOMIC POLICY REFORMS 2016: GOING FOR GROWTH INTERIM REPORT © OECD 2016140

4. STRUCTURAL POLICY INDICATORS
324290
0
10
20
30
40
50
60
70
80
90
100
CHN
0
10
20
30
40
50
60
70
80
90
100
ZAF
Figure 4.22. Educational attainmentAs a percentage of population aged 25-34 and 45-54, 20141
1. Data refer to 2013 for Brazil, Chile and France; 2012 for South Africa; 2011 for Indonesia; 2010 for China.2. Data are missing for Japan.Source: OECD, Education at a Glance 2015: OECD Indicators.
1 2 http://dx.doi.org/10.1787/888933
0
10
20
30
40
50
60
70
80
90
100
KOR
CZE
POL
SVN
CAN
SVK
CHE
ISR
FIN
IRL
AUT
USA
EST
DEU
HUN
LUX
AUS
GBR FR
ANL
D EUO
ECD
²BE
LDN
KSW
EG
RCNO
RNZ
LCH
LIT
AIS
LES
PPR
TTU
RM
EX LVA
ZAF
COL
BRA
IDN
A. Upper secondary education
45-54 25-34
0
10
20
30
40
50
60
70
80
90
100
KOR
CAN
LUX
IRL
GBR
NOR
AUS
ISR
CHE
SWE
USA
NLD
BEL
FRA
POL
DNK
ESP
OEC
DIS
LNZ
LFI
NES
TEU
GRC AU
TSV
NJP
NHU
NPR
TCZ
ESV
KDE
UCH
LTU
RM
EX ITA
LVA
COL
CHN
BRA
IDN
B. Tertiary education
ECONOMIC POLICY REFORMS 2016: GOING FOR GROWTH INTERIM REPORT © OECD 2016 141

4. STRUCTURAL POLICY INDICATORS
e pointsize of
France,Turkey.Mexico
age of
005 foreneralupper
r India,
324301
0102030405060708090100110120
0
10
20
30
40
50
60
70
80
90
Figure 4.23. Graduation rates in upper secondary and tertiary education1
Percentage
1. Graduation rates represent the estimated percentage of people from a given age cohort that is expected to graduate at somduring their lifetime. This estimate is based on the number of graduates in a given year, regardless of their age, divided by thethe average cohort of the typical age of graduation. In panel A, OECD and EU averages exclude Australia, Belgium, Estonia,Germany, the Netherlands, the United Kingdom and exclude for 2005 only Austria, Hungary, Israel, Sweden, Switzerland andIn panel B, OECD and EU averages exclude Belgium, Canada, Estonia, France, Greece, Hungary, Iceland, Ireland, Israel, Korea,and Poland.
2. Estimated graduation rates can be very high, even above 100%, when a significant number of people above the typicalgraduation returns to school. One such example is the New Opportunities programme in Portugal.
3. First-time graduation rates for ISCED 3. The last available year is 2014 for China and India; data refer to 2007-08 instead of 2India. For Brazil and the Russian Federation, data refer to graduation rate at upper secondary level for typical age from the gprogrammes except for India for which upper secondary education is defined as persons aged 19 year olds who completedsecondary education.
4. First-time graduation rates for ISCED 5 to 7. Data refer to 2014 for China and India and to 2007-08 instead of 2005 for India. Fotertiary education refers to the 24 year olds and over who have graduated.
Source: OECD, Education at a Glance 2015: OECD Indicators; CEIC for China data; India National Sample Survey.1 2 http://dx.doi.org/10.1787/888933
0102030405060708090
100110120
MEX
TUR
ESP
LUX
CZE IT
ASW
EU
SAN
OR
HU
NO
ECD
SVK
EU SVN
CAN CH
LPO
LAU
TIS
RKO
RD
NK
CH
EFI
NJP
NIR
LN
ZLPR
T²G
RC
ISL
IND
RU
SC
HN
BRA
IDN
CO
LLV
A
A. Upper secondary education3
2013 2005
0
10
20
30
40
50
60
70
80
90
LUX
ITA
DEU
SWE
PRT²
NO
R EU NLD
SVK
CZE
TUR
GBR
CH
E
FIN
OEC
D
CH
L
ESP
AUT
USA
SVN
DN
K
JPN
NZL
AUS
IND
CH
N
LVA
RU
S
B. Tertiary education4
2013 2005
ECONOMIC POLICY REFORMS 2016: GOING FOR GROWTH INTERIM REPORT © OECD 2016142

4. STRUCTURAL POLICY INDICATORS
du and
ance in
324311
ce onlyipatingas thealysis.ance inance to
324326
300
325
350
375
400
425
450
475
500
525
550
50
60
70
80
90
100
110
120
130
140
RUS
Figure 4.24. Educational achievementAverage of PISA scores in reading, mathematics and science1
1. PISA is the Programme for International Student Assessment. Data for India is the average for 2010 of the states of Tamil NaHimachal Pradesh and therefore may not be representative of nation-wide outcomes.
Source: OECD (2014), PISA 2012 Results: What Students Know and Can Do (Volume I, Revised edition, February 2014): Student PerformMathematics, Reading and Science, PISA.
1 2 http://dx.doi.org/10.1787/888933
Figure 4.25. Variance of educational achievementTotal variance in PISA scores in reading, mathematics and science1
1. PISA is the Programme for International Student Assessment. OECD = 100. Average of PISA scores in mathematics and scienin 2009 for France. The variance components in mathematics, sciences and reading were estimated for all students in particcountries with data on socio-economic background and study programmes. The variance in student performance is calculatedsquare of the standard deviation of PISA scores in reading, mathematics and science for the sample of students used in the an
Source: OECD (2014), PISA 2012 Results: What Students Know and Can Do (Volume I, Revised edition, February 2014): Student PerformMathematics, Reading and Science, PISA; OECD (2013), PISA 2012 Results: Excellence through Equity (Volume II): Giving Every Student the ChSucceed, PISA.
1 2 http://dx.doi.org/10.1787/888933
300
325
350
375
400
425
450
475
500
525
550M
EX CH
LTU
RG
RC
SVK
ISR
SWE
ISL
HU
NPR
TIT
AES
PLU
XU
SAN
OR
OEC
DD
NK
SVN
FRA
EU CZE
AUT
GBR NZL
BEL
AUS
DEU IR
LC
HE
NLD
POL
CAN ES
TFI
NJP
NKO
R
IDN
CO
LBR
AR
US
LVA
IND
2012 2009
50
60
70
80
90
100
110
120
130
140
MEX CH
LES
TTU
RDN
KIR
LPO
LES
PKO
RCA
NFI
NCZ
ESV
NG
RC CHE
HUN
USA
PRT
AUT
NLD
OEC
D EU ITA
DEU
JPN
ISL
NOR
GBR AU
SSW
ELU
XBE
LSV
KFR
ANZ
LIS
R
IDN
COL
BRA
LVA
2012 2009
ECONOMIC POLICY REFORMS 2016: GOING FOR GROWTH INTERIM REPORT © OECD 2016 143

4. STRUCTURAL POLICY INDICATORS
dex of
: Giving
324331
orce.
324343
0
5
10
15
20
25
30
35
40
45
50
55
60
0
10
20
30
40
50
60
70
80
Figure 4.26. Influence of socio-economic and cultural backgroundon student reading performance1
Strength of the link between the reading score and the socio-economic index
1. Defined as the estimated coefficient from the country-specific regression of PISA reading performance on corresponding ineconomic, social and cultural status (ESCS).
Source: OECD (2011), Education at a Glance 2011: OECD Indicators; OECD (2013), PISA 2012 Results: Excellence through Equity (Volume II)Every Student the Chance to Succeed, PISA.
1 2 http://dx.doi.org/10.1787/888933
Figure 4.27. Share of direct taxes1
As a percentage of total tax revenue
1. Direct taxes aggregate taxes on income, profits and capital gains, social security contributions and taxes on payroll and workf2. The last available year is 2013 for Australia, Brazil, Colombia, Japan, Mexico, the Netherlands and Poland.Source: OECD, Revenue Statistics Database.
1 2 http://dx.doi.org/10.1787/888933
0
5
10
15
20
25
30
35
40
45
50
55
60
MEX ES
TTU
RIS
LC
AN ITA
CH
LES
PPR
TKO
RN
OR
FIN
USA
GR
CPO
LLU
XD
EUO
ECD
CH
EJP
NSW
EN
LDD
NK
IRL
EU SVN
GBR AU
SAU
TH
UN
ISR
CZE BE
LN
ZLSV
KFR
A
IDN
BRA
CO
LLV
AR
US
2012 2009
0
10
20
30
40
50
60
70
80
CH
LM
EXTU
RIS
RH
UN
GR
CG
BR NZL
KOR
EST
ISL
PRT
SVN
IRL
POL
OEC
D EU AUS
ITA
LUX
ESP
SVK
FIN
FRA
CZE
NLD
CAN
DN
KBE
LSW
EN
OR
DEU AU
TC
HE
USA JP
N
CO
LBR
A
2014² 2009
ECONOMIC POLICY REFORMS 2016: GOING FOR GROWTH INTERIM REPORT © OECD 2016144

4. STRUCTURAL POLICY INDICATORS
ia and
324352
324368
0
2
4
6
8
10
12
14
16
18
0
5
10
15
20
25
30
35
40
45
50
55
60
65
70
Figure 4.28. Health expenditureAs a percentage of GDP
1. Data refer to 2014 for Canada, China, Finland, Germany, Iceland, Italy, Japan, Korea, the Netherlands, Norway, Portugal, SlovenSwitzerland; 2012 for Australia, Ireland, Luxembourg.
Source: OECD, Health Database and China National Bureau of Statistics.1 2 http://dx.doi.org/10.1787/888933
Figure 4.29. Producer support estimate to agricultureAs a percentage of farm receipts
1. EU refers to all 28 members of the European Union.Source: OECD, Producer and Consumer Support Estimates Database.
1 2 http://dx.doi.org/10.1787/888933
0
2
4
6
8
10
12
14
16
18
TUR
EST
MEX PO
LLU
XKO
RC
ZEC
HL
HU
NIS
RSV
KIR
LG
BR SVN
FIN
ESP
ISL
AUS
EU ITA
OEC
DPR
TG
RC
NO
RN
ZLC
AN AUT
JPN
BEL
DN
KFR
ASW
EN
LDD
EUC
HE
USA ID
NIN
DLV
AC
HN
RU
SC
OL
ZAF
BRA
2013¹ 2008
0
5
10
15
20
25
30
35
40
45
50
55
60
65
70
NZL AUS CHL CAN ISR USA MEX OECD EU¹ TUR ISL JPN KOR CHE NOR ZAF BRA RUS COL CHN IDN
2014 2009
ECONOMIC POLICY REFORMS 2016: GOING FOR GROWTH INTERIM REPORT © OECD 2016 145

4. STRUCTURAL POLICY INDICATORS
324378
0.0
0.5
1.0
1.5
2.0
2.5
3.0
3.5
4.0
4.5
5.0
5.5
6.0
Figure 4.30. Public investmentAs a percentage of GDP
1. Average 2009-13 for Chile, Korea, Mexico, New Zealand, the Russian Federation and Colombia.2. Average 2006-09 for Turkey.Source: OECD, Economic Outlook Database.
1 2 http://dx.doi.org/10.1787/888933
0.0
0.5
1.0
1.5
2.0
2.5
3.0
3.5
4.0
4.5
5.0
5.5
6.0IS
RC
HL
DEU BE
LIR
LM
EX ITA
TUR
GBR
CH
EAU
TIS
LPR
TJP
NES
PSV
KG
RC
DN
KO
ECD
AUS
EU NZL
NLD FI
NU
SA FRA
HU
NLU
XC
ANN
OR
CZE
SWE
SVN
POL
KOR
EST
RU
SZA
FC
OL
LVA
2009-14¹ 2004-09²
ECONOMIC POLICY REFORMS 2016: GOING FOR GROWTH INTERIM REPORT © OECD 2016146
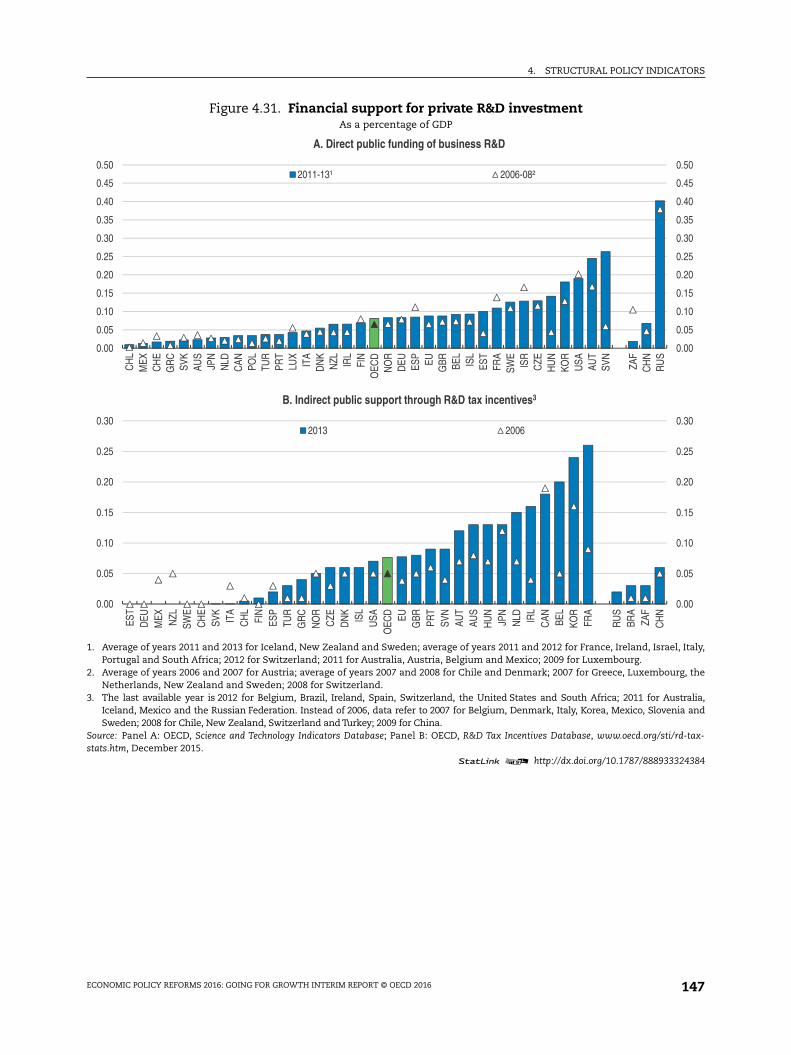
4. STRUCTURAL POLICY INDICATORS
l, Italy,
rg, the
stralia,ia and
rd-tax-
324384
0.00
0.05
0.10
0.15
0.20
0.25
0.30
0.35
0.40
0.45
0.50
0.00
0.05
0.10
0.15
0.20
0.25
0.30
Figure 4.31. Financial support for private R&D investmentAs a percentage of GDP
1. Average of years 2011 and 2013 for Iceland, New Zealand and Sweden; average of years 2011 and 2012 for France, Ireland, IsraePortugal and South Africa; 2012 for Switzerland; 2011 for Australia, Austria, Belgium and Mexico; 2009 for Luxembourg.
2. Average of years 2006 and 2007 for Austria; average of years 2007 and 2008 for Chile and Denmark; 2007 for Greece, LuxembouNetherlands, New Zealand and Sweden; 2008 for Switzerland.
3. The last available year is 2012 for Belgium, Brazil, Ireland, Spain, Switzerland, the United States and South Africa; 2011 for AuIceland, Mexico and the Russian Federation. Instead of 2006, data refer to 2007 for Belgium, Denmark, Italy, Korea, Mexico, SlovenSweden; 2008 for Chile, New Zealand, Switzerland and Turkey; 2009 for China.
Source: Panel A: OECD, Science and Technology Indicators Database; Panel B: OECD, R&D Tax Incentives Database, www.oecd.org/sti/stats.htm, December 2015.
1 2 http://dx.doi.org/10.1787/888933
0.00
0.05
0.10
0.15
0.20
0.25
0.30
0.35
0.40
0.45
0.50
CH
LM
EXC
HE
GR
CSV
KAU
SJP
NN
LDC
AN POL
TUR
PRT
LUX
ITA
DN
KN
ZL IRL
FIN
OEC
DN
OR
DEU ES
PEU
GBR BE
LIS
LES
TFR
ASW
EIS
RC
ZEH
UN
KOR
USA AU
TSV
N
ZAF
CH
NR
US
A. Direct public funding of business R&D
2011-13¹ 2006-08²
0.00
0.05
0.10
0.15
0.20
0.25
0.30
EST
DEU
MEX NZL
SWE
CH
ESV
KIT
AC
HL
FIN
ESP
TUR
GR
CN
OR
CZE
DN
KIS
LU
SAO
ECD EU
GBR PR
TSV
NAU
TAU
SH
UN
JPN
NLD IR
LC
AN BEL
KOR
FRA
RU
SBR
AZA
FC
HN
B. Indirect public support through R&D tax incentives3
2013 2006
ECONOMIC POLICY REFORMS 2016: GOING FOR GROWTH INTERIM REPORT © OECD 2016 147


ORGANISATION FOR ECONOMIC CO-OPERATIONAND DEVELOPMENT
The OECD is a unique forum where governments work together to address the economic, social and
environmental challenges of globalisation. The OECD is also at the forefront of efforts to understand and
to help governments respond to new developments and concerns, such as corporate governance, the
information economy and the challenges of an ageing population. The Organisation provides a setting
where governments can compare policy experiences, seek answers to common problems, identify good
practice and work to co-ordinate domestic and international policies.
The OECD member countries are: Australia, Austria, Belgium, Canada, Chile, the Czech Republic,
Denmark, Estonia, Finland, France, Germany, Greece, Hungary, Iceland, Ireland, Israel, Italy, Japan, Korea,
Luxembourg, Mexico, the Netherlands, New Zealand, Norway, Poland, Portugal, the Slovak Republic,
Slovenia, Spain, Sweden, Switzerland, Turkey, the United Kingdom and the United States. The European
Union takes part in the work of the OECD.
OECD Publishing disseminates widely the results of the Organisation’s statistics gathering and
research on economic, social and environmental issues, as well as the conventions, guidelines and
standards agreed by its members.
OECD PUBLISHING, 2, rue André-Pascal, 75775 PARIS CEDEX 16
(12 2016 01 1 P) ISBN 978-92-64-25007-9 – 2016

Consult this publication on line at http://dx.doi.org/10.1787/growth-2016-en.
This work is published on the OECD iLibrary, which gathers all OECD books, periodicals and statistical databases. Visit www.oecd-ilibrary.org for more information.
Economic Policy Reforms
Going for GrowthInterim ReportGoing for Growth is the OECD’s regular report on structural reforms in policy areas that have been identifi ed as priorities to boost incomes in OECD and selected non-OECD countries (Brazil, China, Colombia, India, Indonesia, Latvia, Russian Federation and South Africa). Policy priorities are updated every two years and presented in a full report, which includes individual country notes with detailed policy recommendations to address the priorities. The next full report will be published in 2017.
This interim report takes stock of the actions taken by governments over the past year in the policy areas identifi ed as priorities for growth. This stocktaking is supported by internationally comparable indicators that enable countries to assess their economic performance and structural policies in a wide range of areas.
ContentsChapter 1. Overview of structural reforms in the policy areas identifi ed as priorities for growth
Chapter 2. Reform priorities in a diffi cult macro context
Chapter 3. From GDP to average household income: A look at the transmission channels
Chapter 4. Structural policy indicators
Eco
nom
ic Po
licy Refo
rms G
oing
for G
row
th Interim R
epo
rt2016
Economic Policy Reforms
Going for GrowthINTERIM REPORT
2016
ISSN 1813-27152016 SUBSCRIPTION
ISBN 978-92-64-25007-912 2016 01 1 P