Economic Modelling and Regional Impact Analysis
26
71 Chapter 3: Economic Modelling and Regional Impact Analysis 3 Economic Modelling and Regional Impact Analysis Key findings: • Regional economic modelling based on general equilibrium analysis is often used in impact simulation analyses. • The techniques are useful as general equilibrium analysis captures the interdependencies in a market economy and shows that the different agents in the economy do not operate in isolation. • There are different types of models, including: − Input-output models – used for short term analysis of small policy changes. − SAM-Leontief models which are a statistical representation of the economic and social structure of a country or region. − Computable general equilibrium (CGE) models which are powerful with regard to issues such as fiscal policy and trade policy interventions. • The Western Cape Department of Agriculture and ARC developed the first Western Cape Social Accounting Matrix (SAM) for 1993 as part of the SM3 project. • The Western Cape SAM showed that horticultural enterprises dominate agriculture’s contribution to provincial value added and employment.
Transcript of Economic Modelling and Regional Impact Analysis
71
Chapter 3: Economic Modelling and Regional Impact Analysis
3
Economic Modelling and Regional Impact Analysis
Key findings:
• Regional economic modelling based on general equilibrium analysis is often used in impact simulation analyses.
• The techniques are useful as general equilibrium analysis captures the interdependencies in a market economy and shows that the different agents in the economy do not operate in isolation.
• There are different types of models, including:
− Input-output models – used for short term analysis of small policy changes. − SAM-Leontief models which are a statistical representation of the economic
and social structure of a country or region. − Computable general equilibrium (CGE) models which are powerful with
regard to issues such as fiscal policy and trade policy interventions.
• The Western Cape Department of Agriculture and ARC developed the first Western Cape Social Accounting Matrix (SAM) for 1993 as part of the SM3 project.
• The Western Cape SAM showed that horticultural enterprises dominate agriculture’s contribution to provincial value added and employment.
72
Western Cape Provincial Economic Review & Outlook 2007
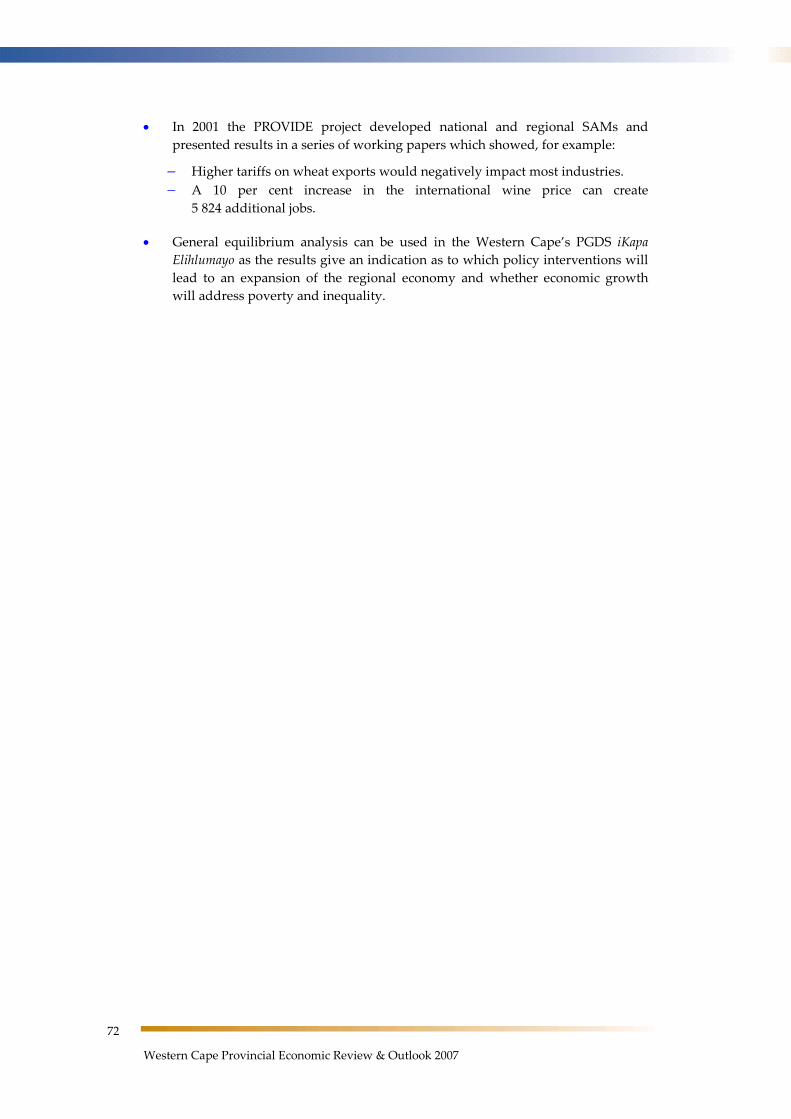
• In 2001 the PROVIDE project developed national and regional SAMs and presented results in a series of working papers which showed, for example:
− Higher tariffs on wheat exports would negatively impact most industries. − A 10 per cent increase in the international wine price can create
5 824 additional jobs.
• General equilibrium analysis can be used in the Western Cape’s PGDS iKapa Elihlumayo as the results give an indication as to which policy interventions will lead to an expansion of the regional economy and whether economic growth will address poverty and inequality.

73
Chapter 3: Economic Modelling and Regional Impact Analysis
1. Introduction Economic modelling is a critical tool in government policy, planning and budgeting processes at the national and regional level, and regional models have been developed specifically to increase understanding of the impact of changes, such as shifts in government policy or chance events, on a specific region. Regional models are also used for forecasting economic activity at the regional level, using large-scale econometric models based on time series data.
Chapter 2: Economic Outlook: 2007/08 — 2009/10 makes use of such forecasting techniques in presenting a regional economic outlook for the Western Cape for the period 2007/08 to 2009/10.
Regional economic modelling has evolved from simple input-output models with fixed relative prices to the more complex computable general equilibrium models that allow for flexible relative prices. More recent developments of input-output models also include the construction of integrated models that combine econometric and input-output approaches models.
Since 1996, the Western Cape Department of Agriculture has had an active interest and participation in regional economic modelling; particularly impact simulation based on general equilibrium analysis.
While macroeconomic analysis makes use of economic aggregates in a top-down approach, general equilibrium analysis has its roots in microeconomics, giving an understanding of the whole economy using a bottom-up approach that starts at the basic level of individual markets and agents.
General equilibrium analysis therefore captures the interdependencies in a market economy where the prices and production of all goods are interrelated and shows that the different agents in the economy do not operate in isolation. For example an increase in the price of crude oil affects all industries, some to a greater extent than others, depending on the reliance on petroleum product as an input in the production and transport processes.
Both direct and indirect effects are relevant in the context of general equilibrium analysis and it is the capturing of indirect, or secondary, effects that makes general equilibrium analysis a powerful planning tool, distinguishing it from other analytical techniques.
General equilibrium analysis also allows for insight into the socio-economic impacts, including income, welfare, and employment, of policy decisions and economic shocks. These are particularly important when assessing the impact of policy decisions on different communities in the economy.
This chapter introduces key concepts related to general equilibrium analysis before discussing some of the key outputs that have emerged from the Western Cape Department of Agriculture’s economic modelling projects, showing how these have informed the regional policy debate. The chapter then concludes in suggesting further possibilities for general equilibrium analysis in the Western Cape.

74
Western Cape Provincial Economic Review & Outlook 2007
2. Explaining general equilibrium and related concepts
The term ‘general equilibrium’ conveys two concepts. First, ‘general’ indicates that the entire economy is taken into account, not only one economic sector, based on the knowledge that no economic sector or economic agent operates in isolation.
Second, ‘equilibrium’ suggests that the starting point of the analysis assumes that the economy is in equilibrium. General equilibrium analysis assumes that the equilibrium in the economy is disturbed as a result of an economic shock, such as drought, or change in policy, which can include fiscal policy related to available tax instruments, investment decisions, social transfers, to name a few.
This will trigger an adjustment period in the economy because policy that influences one market causes changes in behaviour of households and firms, leading to changes in other markets, commonly referred to as the ripple effects throughout the economy. The assumption is that the economy will attempt to revert back to a new equilibrium.
General equilibrium analysis aims to estimate the magnitude of changes between the original and the new equilibrium. The time frame for the model is therefore the time it takes to move from one state of equilibrium to another. In dynamic models, as opposed to static models, a time dimension is introduced and this is particularly useful when the timing or sequencing of implementation of policies is of importance.
2.1 Models and data
Models and associated databases are functionally separate. The datasets for general equilibrium models, such as input-output tables and social accounting matrices (SAMs), capture the circular flow of funds (which move in the opposite direction to goods and services) through the economy.
The models consist of several equations that capture the economic relationships based on economic theory. In applied research the data from a specific type of dataset is used together with the model to quantify estimates. Hence one database can support several variants of a model, with each variant producing potentially different results.
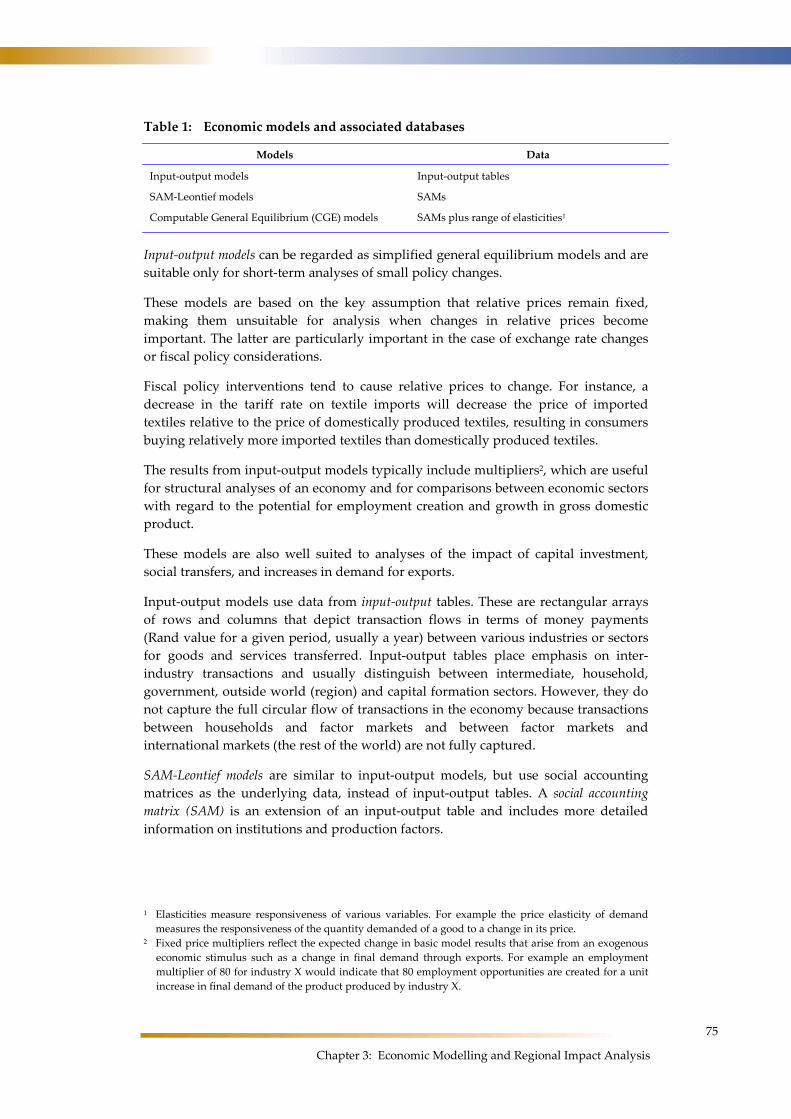
Table 1 presents the broad model types and associated data commonly used in general equilibrium analysis. The list is not exhaustive because many variants of these models have been developed over time, but the list is simplified for explanatory purposes.
75
Chapter 3: Economic Modelling and Regional Impact Analysis
Table 1: Economic models and associated databases
Models Data
Input-output models Input-output tables
SAM-Leontief models SAMs
Computable General Equilibrium (CGE) models SAMs plus range of elasticities1
Input-output models can be regarded as simplified general equilibrium models and are suitable only for short-term analyses of small policy changes.
These models are based on the key assumption that relative prices remain fixed, making them unsuitable for analysis when changes in relative prices become important. The latter are particularly important in the case of exchange rate changes or fiscal policy considerations.
Fiscal policy interventions tend to cause relative prices to change. For instance, a decrease in the tariff rate on textile imports will decrease the price of imported textiles relative to the price of domestically produced textiles, resulting in consumers buying relatively more imported textiles than domestically produced textiles.
The results from input-output models typically include multipliers2, which are useful for structural analyses of an economy and for comparisons between economic sectors with regard to the potential for employment creation and growth in gross domestic product.
These models are also well suited to analyses of the impact of capital investment, social transfers, and increases in demand for exports.
Input-output models use data from input-output tables. These are rectangular arrays of rows and columns that depict transaction flows in terms of money payments (Rand value for a given period, usually a year) between various industries or sectors for goods and services transferred. Input-output tables place emphasis on inter-industry transactions and usually distinguish between intermediate, household, government, outside world (region) and capital formation sectors. However, they do not capture the full circular flow of transactions in the economy because transactions between households and factor markets and between factor markets and international markets (the rest of the world) are not fully captured.
SAM-Leontief models are similar to input-output models, but use social accounting matrices as the underlying data, instead of input-output tables. A social accounting matrix (SAM) is an extension of an input-output table and includes more detailed information on institutions and production factors.
1 Elasticities measure responsiveness of various variables. For example the price elasticity of demand measures the responsiveness of the quantity demanded of a good to a change in its price.
2 Fixed price multipliers reflect the expected change in basic model results that arise from an exogenous economic stimulus such as a change in final demand through exports. For example an employment multiplier of 80 for industry X would indicate that 80 employment opportunities are created for a unit increase in final demand of the product produced by industry X.
76
Western Cape Provincial Economic Review & Outlook 2007
SAM-Leontief models represent flows of all economic transactions that take place within an economy (regional or national) and is therefore a statistical representation of the economic and social structure of a country or region. SAMs conventionally refer to a single year, providing a static picture of the economy.
A SAM is a data set presented in the form of a square matrix (columns equal rows) in the sense that all institutional agents are represented as buyers and sellers. The SAM captures not only the value of transactions, but also between which two agents in the economy these transactions take place.
Columns represent expenditures and rows represent receipts, and there is a row and column for each agent. Following accounting principles, the total of the row and column account for each agent must equate, otherwise all incomes and expenditures are not taken into account.
Because a SAM reflects the whole economy, it also forms a useful basis to check the consistency of statistics from the various sources, thus identifying inconsistencies in the data quality.
There are six main groups of agents – products; producers; factors of production including capital, labour and land; institutions including households, incorporated enterprises and government; capital including savings and investment; and trade.
For example, a SAM captures the total value of intermediate consumption in the economy as the payments from the producers to the commodity market, while household income tax is captured as a payment from households to government.
The level of detail within the broad aggregates can vary greatly. For instance, the aggregate commodity account can be disaggregated in any desired number of commodity groups, depending on the focus of the study and availability of data.
The multipliers calculated with SAM-Leontief models tend to be larger than those calculated with input-output models because a SAM captures the full circular flow, as opposed to input-output tables, which do not allow for the feedback of factor incomes to households for consumption expenditures.
The range of issues suitable for analysis with SAM-Leontief models is similar to those suitable for input-output models and model assumptions are also comparable to those of input-output models. Examples of applications are presented in section 3: Strategic micro and macro modelling.
Computable general equilibrium (CGE) models differ from input-output models in that they allow for changes in relative prices. CGE models therefore have wider application possibilities and are particularly powerful with regard to issues involving relative price changes, such as fiscal policy and trade policy interventions.
Induced changes in relative prices provide the economic incentives for changes in production and consumption patterns. Changes in relative prices imply substitution possibilities, the magnitude of which is determined by an elasticity of substitution. For instance, if the export price of goods increases relative to the price that producers can obtain in the domestic market, then producers will divert a greater proportion of their produce towards the export market relative to the domestic market.
77
Chapter 3: Economic Modelling and Regional Impact Analysis
Similarly, an income elasticity of demand indicates the change in quantity of goods or services demanded as a result of a unit change in income. The number of elasticities required for a CGE model depends on the functions included in the model.
Despite the fact that indirect effects in the economy are also captured with CGE models, there are typically no multipliers explicitly calculated with CGE models and therefore these models are not as frequently used for sectoral comparisons as the input-output models and SAM-Leontief models.
CGE models are used for impact analysis, such as estimating the effect of a particular shock or policy change. The results derived can be reported as either changes in quantities or relative prices because the model has an explicit price system and a quantity system.
For instance, results could indicate the impact on consumer prices, producer prices and import prices, as well as quantities of goods and services produced and traded. Estimates on factor incomes, employment and household welfare can also be obtained.
Examples of applications are presented in section 4: General equilibrium for SA, which also presents a description of the SAMs developed as part of the PROVIDE project.
2.2 General equilibrium or impact analysis modelling exercises
General equilibrium or impact-modelling exercises usually only simulate one or two policy changes simultaneously. When too many changes are incorporated into one simulation, then the effects become intertwined and the model loses its power to extract from reality to improve the understanding of the economy.
Results are therefore seldom viewed in reality. Rather they are used to interpret the direction in which the economy may tend to move, given an economic shock.
Furthermore, general equilibrium analysis has a macro-economic focus; making its applicability more suited to economy-wide analysis rather then detailed impact analysis where there are limited linkages. For instance the socio-economic impact of an outbreak of swine fever on one farm in the Western Cape is not suitable for analysis with a CGE model, even though this might have important implications for the owner involved.
A more suitable analysis for CGE techniques would be to determine the implications of animal disease in general, through the potential ramifications on imposed trade bans, food prices and household welfare.
However, it is worth mentioning that general equilibrium modelling has been carried out at various levels of the economy, from national, to regional or provincial level, as well as town level.
78
Western Cape Provincial Economic Review & Outlook 2007
3. Strategic micro and macro modelling During 1996 the Western Cape Department of Agriculture and the Agricultural Research Council (ARC) collaborated on a Strategic Micro and Macro Modelling (SM3) project to develop the necessary enabling framework for systematic quantitative decision-making.
The macro-modelling component of the SM3 project focused on the role of agriculture in the Western Cape, identifying and quantifying the forward and backward linkages with the rest of the provincial economy. The model facilitated analysis of the impact of agricultural policy changes on the agriculture sector, the rest of the production sectors in the economy, and households.
A key project output3 was the development of a Western Cape SAM for 1993 that emphasised the agricultural sector. The SAM included 25 agricultural sectors and 23 non-agricultural sectors, distinguishing between farm-owner households and farm worker households. The SAM categorised non-farm households according to population group and per capita income.
The 1993 Western Cape SAM findings showed the dominance of horticultural enterprises in agriculture’s contributions to provincial value added, employment and employee remuneration. Viticulture, deciduous fruit, vegetables and table grapes were key contributors.
The livestock industry, in particular broiler production, was also a key contributor to provincial value-added and employment, although salary and wage payments to farm workers were particularly low in livestock enterprises relative to other industries.
The 1993 SAM for the Western Cape also indicated that while white households overall spent the largest total amount of money, the coloured population significantly dominated provincial spending on raw farm commodities as well as processed food.
In 1993 coloureds accounted for 73,0 per cent of household spending and africans accounted for 68,1 per cent of household spending on unprocessed and processed agricultural commodities. This suggests that growth of domestic demand for agricultural output is heavily dependent on income dynamics among those populations.
Initial research4 using the Western Cape SAM suggests that R1,00 of additional demand for agricultural output will increase Provincial value added by R1,29, requiring R0,21 of additional international imports and will contribute R0,26 to government revenue.
3 Eckert et al., 1997 (a) 4 Eckert et al., 1997 (b), and Eckert and Liebenberg, 1997
79
Chapter 3: Economic Modelling and Regional Impact Analysis
Primary agriculture’s potential to contribute to employment and value added was found to significantly exceed those of the non-agricultural sectors in the Western Cape. Agribusiness showed substantially higher employment multipliers than other non-agricultural sectors.
Within agriculture itself, the horticultural sub-sector ranked first, followed by livestock. Furthermore, agricultural production tends to make greater contributions to household income and in a more redistributive manner than other sectors.
The model results confirmed that spending by the poor tends to provide a much greater stimulus to SA’s agricultural and manufacturing industries than does spending by the rich. The poor devote a higher portion of their incomes to consumption spending, directly consume fewer imports and their spending tends to hire more people who are also poor, especially the agricultural labour force and persons involved in the informal sector.
Subsequent research5 evaluated the implications of the World Trade Organisation (WTO) negotiations on the Western Cape economy.
The first scenario estimated the effect of a partial reduction in trade tariffs, assuming that world prices of various (primary) agricultural commodities would on average increase by 2 to 3 per cent as a result.
As the Western Cape economy is comparatively small in size, it is regarded as a price taker in world markets. This means that the increase in world prices would lead to an increase in domestic prices.
The results confirmed expectations that food manufacturing sectors, including canning, dairy, beverage and tobacco, distilleries and wineries, grain products and animal feeds industries would be most affected by price increases in the agricultural sector.
Furthermore, an increase in the price of primary agricultural products would contribute to higher cost of living, particularly for coloured and african households in rural areas. The cost of living increased for the low (0,58%), medium (0,47%) and high (0,42%) income groups. In contrast, households that experience the lowest increase in the cost of living, ranging between 0,15 and 0,11 per cent include white and asian, rural and urban, middle and high income groups.
These results confirm that low-income households, who spend a high percentage of their income on food, are notably impacted by an increase in food prices (especially primary agricultural products). The analysis also shows that high income households are responsible for the greater part of repeated cycles of income expenditure (feedback) in the economy, and are therefore the greatest contributors to stimulation of economic activity.
5 Berning et al., 1999
80
Western Cape Provincial Economic Review & Outlook 2007
The second scenario estimated the impact of an increase in international exports on the Western Cape economy, assuming that there will be a greater market for products from SA in general and from the Western Cape in particular due to a reduction in trade tariff rates and the shift of production from protected to unprotected economies.
The analysis identified several key provincial agricultural and food processing industries as potential growth sectors that were likely to increase production, taking advantage of greater international market access.
Simulations in export demand showed that a 2,5 to 5 per cent expansion in identified industries could create about 9 500 additional employment opportunities.
The SAM employment multipliers are a function of inter-industry dependencies, the manner in which factor payments are distributed from production sectors to institutions and the pattern of institutional demand.
While a standard modelling assumption presumes that all production sectors have capacity to increase output, such is not always the case in agriculture. The research therefore progressed into quantifying the implications of supply side constraints in agriculture in the Western Cape6.
Although the Western Cape has benefited from the increased export opportunities that followed political reform in the early 1990s it is important to recognise that the ability of agriculture to respond to the liberalisation of trade is dependent upon the rigidity of supply-side constraints, especially the availability of land resources.
The study demonstrated that the economic benefits accruing from expanded export opportunities are not only influenced by these capacity constraints but also by the patterns of interdependence within an economy, particularly for the food processing industries.
Results indicated that, despite supply constraints, increases in exports of wine, table grapes and other deciduous fruits have contributed positively to increases in employment and rural incomes, especially among farm worker households and reductions in income inequalities.
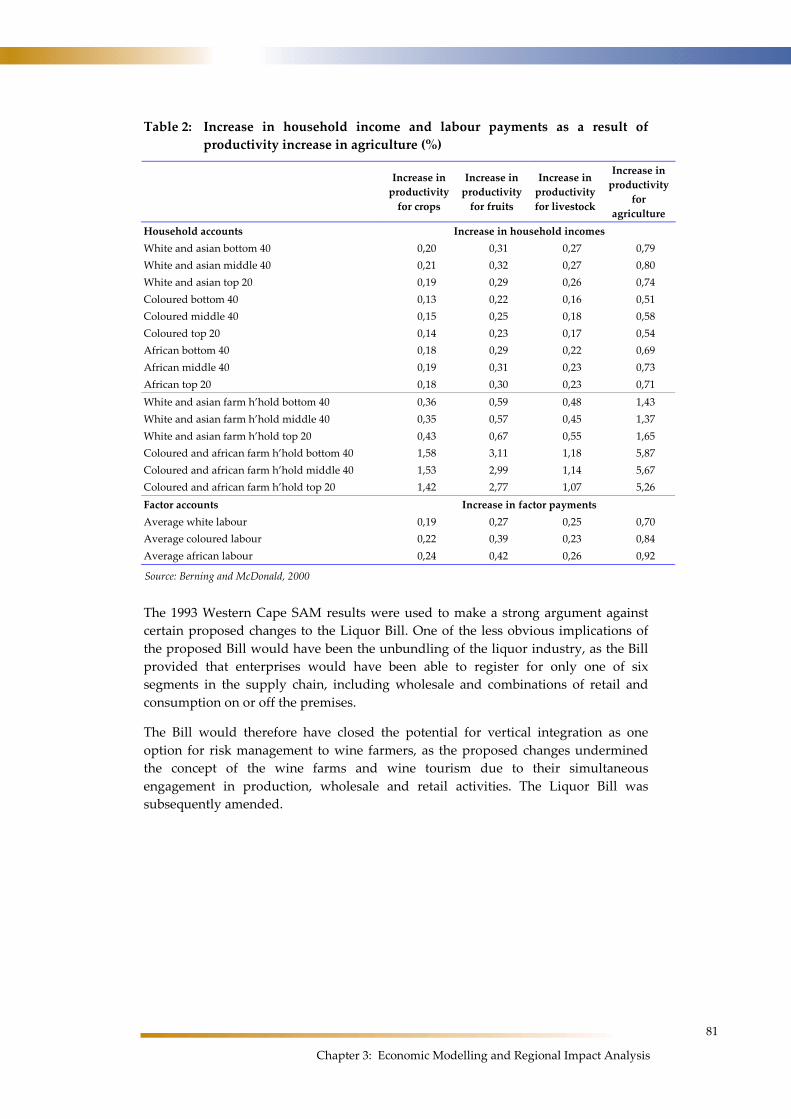
Furthermore, future benefits are likely to rise from relaxing the constraints via increases in agricultural production through increased productivity, as this will influence the extent to which capacity constraints can be released and consequently will determine the magnitude of the benefits, as shown in Table 2 below. Results suggest that trade opportunities accompanied by productivity growth are likely to be complementary in the search for shared growth and reduced inequality.
6 Berning and McDonald, 2000
81
Chapter 3: Economic Modelling and Regional Impact Analysis
Table 2: Increase in household income and labour payments as a result of productivity increase in agriculture (%)
Increase in
productivity for crops
Increase in productivity
for fruits
Increase in productivity for livestock
Increase in productivity
for agriculture
Household accounts Increase in household incomes White and asian bottom 40 0,20 0,31 0,27 0,79 White and asian middle 40 0,21 0,32 0,27 0,80 White and asian top 20 0,19 0,29 0,26 0,74 Coloured bottom 40 0,13 0,22 0,16 0,51 Coloured middle 40 0,15 0,25 0,18 0,58 Coloured top 20 0,14 0,23 0,17 0,54 African bottom 40 0,18 0,29 0,22 0,69 African middle 40 0,19 0,31 0,23 0,73 African top 20 0,18 0,30 0,23 0,71 White and asian farm h’hold bottom 40 0,36 0,59 0,48 1,43 White and asian farm h’hold middle 40 0,35 0,57 0,45 1,37 White and asian farm h’hold top 20 0,43 0,67 0,55 1,65 Coloured and african farm h’hold bottom 40 1,58 3,11 1,18 5,87 Coloured and african farm h’hold middle 40 1,53 2,99 1,14 5,67 Coloured and african farm h’hold top 20 1,42 2,77 1,07 5,26 Factor accounts Increase in factor payments Average white labour 0,19 0,27 0,25 0,70 Average coloured labour 0,22 0,39 0,23 0,84 Average african labour 0,24 0,42 0,26 0,92
Source: Berning and McDonald, 2000
The 1993 Western Cape SAM results were used to make a strong argument against certain proposed changes to the Liquor Bill. One of the less obvious implications of the proposed Bill would have been the unbundling of the liquor industry, as the Bill provided that enterprises would have been able to register for only one of six segments in the supply chain, including wholesale and combinations of retail and consumption on or off the premises.
The Bill would therefore have closed the potential for vertical integration as one option for risk management to wine farmers, as the proposed changes undermined the concept of the wine farms and wine tourism due to their simultaneous engagement in production, wholesale and retail activities. The Liquor Bill was subsequently amended.
82
Western Cape Provincial Economic Review & Outlook 2007
4. General equilibrium analysis for the Western Cape
While the SM3 project SAM for the Western Cape provided valuable information for decision-makers, it followed the structure used by earlier SAMs for SA, and consequently had certain structural characteristics that precluded its use as a database for CGE models.
In 2001 the Western Cape Department of Agriculture initiated the development of a CGE model for the Western Cape, which also required the revision of the 1993 SAM with detail on the agricultural sector7.
The project was able to draw on a broader range of data than five years. Available data included the 1993 supply and use tables that provided data on domestic production and imports, and intermediate and final demand respectively, the 1993 Census of Agriculture, the 1995 October Household Survey, the 1995 Income and Expenditure Survey and the 1996 Census of Manufacturing.
The revised SAM was developed following a modular approach, which facilitated any subsequent updates. The general structure of this SAM eventually formed the base for the Provincial Decision-making Enabling (PROVIDE) project SAMs.
Two case studies were conducted. The first8 analysed the potential of the basic income grant to alleviate poverty in rural areas. The results indicated that when funded exogenously a basic income grant could achieve substantial reductions in poverty and inequality.
However, a universal basic income grant would be only marginally superior to a targeted basic income grant and would achieve a lower degree of poverty alleviation than an enhanced but targeted basic income grant.
If the basic income transfers were funded by increases in tax rates, the degrees of poverty alleviation achieved were greatly reduced, particularly if the transfers were funded by an increase in the value added tax rate.
When a basic income grant was assumed to be funded from tax revenues the degrees of poverty alleviation from targeting increased enormously such that under certain scenarios targeting could nearly double the estimated extent of poverty alleviation.
The second study9 explored the socio-economic implications of a property tax on agricultural land. The study results were incorporated into the Land Tax Committee final report on a guideline framework for the implementation of property tax on agricultural land in the Western Cape. The property rate was subsequently introduced, with the Western Cape being one of the first provinces to implement.
7 The research project was initiated in conjunction with the University of Sheffield, UK, a collaborative link that is still ongoing.
8 McDonald and Punt, 2003 9 McDonald and Punt, 2004
83
Chapter 3: Economic Modelling and Regional Impact Analysis
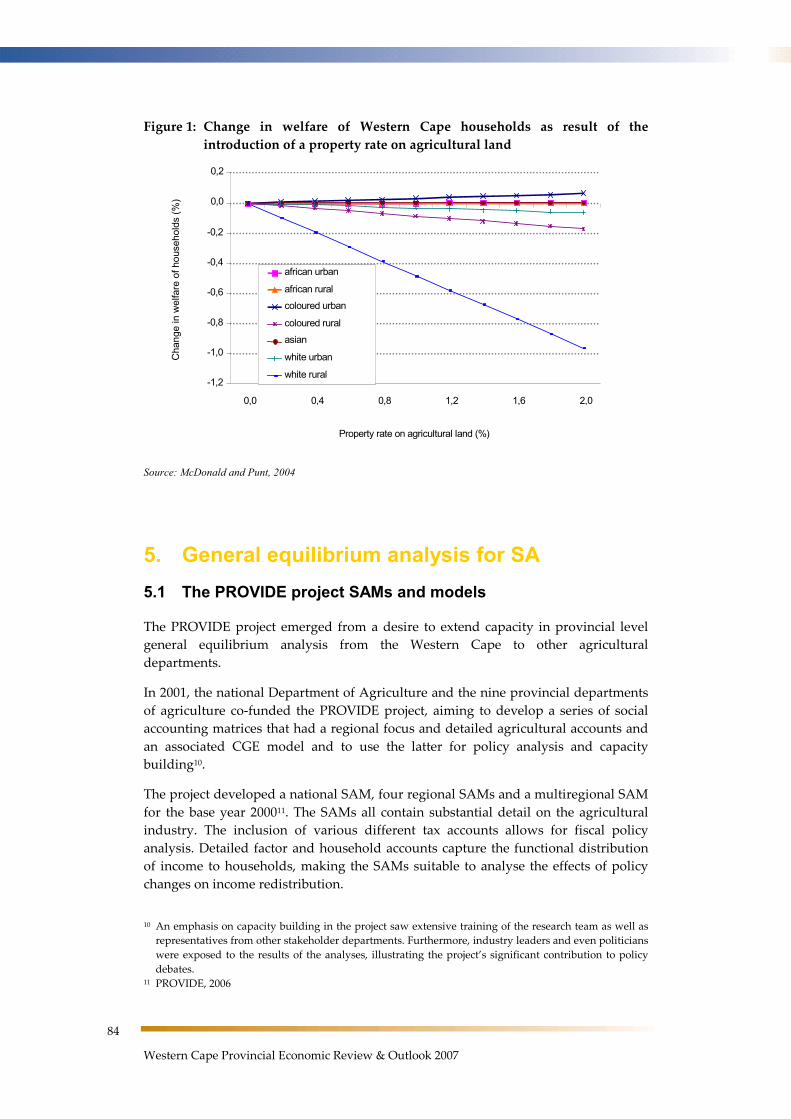
The study showed that the tax would have only a marginal impact on provincial GDPR. If the revenue received from the tax were spent in the Province, there would be a slight increase in GDPR.
Price changes, including those on food products, are insubstantial. Production in different agricultural regions is affected differently. The relatively rich white rural households lose out – inevitably since they are the primary recipients of income from land.
The only other representative household for which notable income losses were indicated is the coloured rural household, which is heavily dependent upon employment in agriculture and is regarded as one of the poorest household groups in the Province.
Figure 1 below shows that the benefits to other households from the introduction of a property rate on rural land would be negligible if Government were to spend the additional revenue according to existing government expenditure patterns.
The results suggested that there is little benefit from the introduction of a property rate on agricultural land in the Western Cape.
Furthermore, the CGE model does not capture implications related to the extent to which farm debt is secured against the asset value of agricultural land. Any property rate on agricultural land will reduce the returns to agricultural land as an investment; consequently the value of agricultural land will inevitably decline as a result of the introduction of a property rate on agricultural land.
One likely result is that a number of farmers will be placed in a position of holding negative equity, while all land owning farmers will experience a reduction in income. Such events are likely to produce a series of adjustment problems for a number of years. The model does not explore such adjustment concerns as it only refers to the long-run equilibrium outcomes of the introduction of property rates on agricultural land.
84
Western Cape Provincial Economic Review & Outlook 2007
Figure 1: Change in welfare of Western Cape households as result of the introduction of a property rate on agricultural land
-1,2
-1,0
-0,8
-0,6
-0,4
-0,2
0,0
0,2
0,0 0,4 0,8 1,2 1,6 2,0
Property rate on agricultural land (%)
Cha
nge
in w
elfa
re o
f hou
seho
lds
(%)
african urban
african rural
coloured urban
coloured rural
asian
white urban
white rural
Source: McDonald and Punt, 2004
5. General equilibrium analysis for SA 5.1 The PROVIDE project SAMs and models
The PROVIDE project emerged from a desire to extend capacity in provincial level general equilibrium analysis from the Western Cape to other agricultural departments.
In 2001, the national Department of Agriculture and the nine provincial departments of agriculture co-funded the PROVIDE project, aiming to develop a series of social accounting matrices that had a regional focus and detailed agricultural accounts and an associated CGE model and to use the latter for policy analysis and capacity building10.
The project developed a national SAM, four regional SAMs and a multiregional SAM for the base year 200011. The SAMs all contain substantial detail on the agricultural industry. The inclusion of various different tax accounts allows for fiscal policy analysis. Detailed factor and household accounts capture the functional distribution of income to households, making the SAMs suitable to analyse the effects of policy changes on income redistribution.
10 An emphasis on capacity building in the project saw extensive training of the research team as well as representatives from other stakeholder departments. Furthermore, industry leaders and even politicians were exposed to the results of the analyses, illustrating the project’s significant contribution to policy debates.
11 PROVIDE, 2006
85
Chapter 3: Economic Modelling and Regional Impact Analysis
The PROVIDE SAM for SA has 558 accounts, which can be grouped into seven broad aggregates — commodities (116, of which 20 are for agriculture), activities/industries (166, of which 70 are for agriculture), margins (2), factors (98), institutions (173), capital (2) and international trade (1). The institutions consist of sub-aggregates —households (162), incorporated enterprises (1) and government (10).
The commodity and activity accounts are largely based upon the account classification scheme used in Statistics SA’s supply and use tables. A distinguishing feature of the national SAM is that it contains provincial level information on households and labour, providing critical insight into policy impact at a provincial level.
The factor and household categories are identified firstly by province of residence, then by population group and then by other selected criteria such as gender and education level of head of household, and skill level of factor group.
Government tax accounts include commodity taxes (value added tax, excise duties and import duties) and subsidies, production taxes and subsidies and direct taxes on households and enterprises.
The agricultural commodity accounts reflect the pattern of commodity production in SA, while the agricultural activity accounts classify farms by regions within provinces.
The PROVIDE regional SAMs are based on the four regions identified for purposes of the PROVIDE Project – the Northern Cape and Western Cape; the Eastern Cape and KwaZulu-Natal; the North West, Free State and Gauteng; and Mpumalanga and Limpopo.
Each regional SAM contains detailed accounts for the particular region and accounts for the other three regions are aggregated and appear as an account called “Rest of SA”.
The commodity accounts (48 accounts) and non-agricultural activity accounts (approximately 33 accounts) in the regional SAMs are derived from aggregations of the commodity and activity accounts in the national SAM and are consistent for each of the regional SAMs, except for selected industries that are not found in a particular region.
The number of accounts in each of the regional SAMs varies between 143 and 173 depending mainly on the number of agricultural activity, household and factor accounts in each. The household and factor accounts in the regional SAMs correspond to those for the particular region in the national SAM.
Compared to the national SAM, a distinction is made between provincial government and the consolidated government in the regional SAM. With regard to trade a distinction is made between interregional trade within SA and international trade.

86
Western Cape Provincial Economic Review & Outlook 2007
In the multiregional SAM detailed accounts for each of the four regions appear and, compared to the regional SAM, there is therefore no need for a “Rest of SA” account. The interregional trade flows depict between which two regions the trade is taking place. The multiregional SAM has 624 accounts. Information from the regional SAMs is retained for the commodity, activity, factor, household and provincial government accounts. The accounts for enterprises, consolidated government, capital and stock changes present national level information.
The PROVIDE CGE model12 allows for a generalised treatment of trade relationships by incorporating provisions for non-traded exports and imports, and competitive and non-competitive imports. It also permits the relaxation of the small country assumption for exported commodities. The model encompasses multiple product activities by differentiating between commodities by the activities that produce them, using a range of production technologies that can be selected by the user. The model runs in General Algebraic Modelling System (GAMS) software.
5.2 PROVIDE Project case studies
Besides numerous background papers and technical documents, a series of working papers present the results of various studies conducted as part of the PROVIDE project.
PROVIDE Project Working Papers
The PROVIDE project working papers are posted on the PROVIDE website (www.elsenburg.com/PROVIDE). Feedback indicates that the research analyses have been widely utilised. The working paper series includes the following:
WP2004:1 Trade liberalisation, efficiency and SA’s sugar industry
WP2004:2 The welfare impacts of national and international agricultural efficiency gains — a SA case study
WP2005:1 A Computable General Equilibrium (CGE) analysis of the impact of an oil price increase in SA
WP2005:2 Costs and benefits of higher tariffs on wheat imports to SA — a general equilibrium analysis
WP2005:3 Quantifying the economic divide in SA Agriculture: An income-side analysis
WP2005:4 The impact of a higher fuel levy on the Western Cape
WP2005:5 General equilibrium effects in the SA maize market: International trade simulations
WP2005:6 The welfare impacts of targeted transfers to poor households
WP2006:1 The impact of increasing excise duties on the economy
WP2006:2(1)to(9) The impact of property rates on agricultural land, focusing on each individual province
WP2006:3 The impact of an increase in wine industry exports on the SA economy, focusing on the Western Cape
12 PROVIDE, 2005 (a)

87
Chapter 3: Economic Modelling and Regional Impact Analysis
Working Paper 2005:2 on the ‘Costs and benefits of higher tariffs on wheat imports’ to SA13 formed part of a report to Grain SA, after Grain SA commissioned a study on the implications of increasing the import tariff on wheat.
The report formed the basis for negotiations between the Bureau for Food and Agricultural Policy (BFAP) and Grain SA, and the International Trade Administration Commission (ITAC). ITAC is the international institution that administers import tariffs.
This study described and quantified the effects of increased tariffs on the local wheat industry. The results showed that the benefits to the wheat industry are highly concentrated and smaller than the loss of income caused in other sectors.
The impact of a 25 percentage point increase in the tariff rate on wheat on the economy translates into a net decline of 0,03 per cent in GDP, after accounting for the benefits to winter cereals farmers and farm workers. This represented a cost of R257,4 million (2000 values) to the economy.
The tariff increase would negatively affect most industries, except the winter cereal producers. The main winter cereal producing agricultural regions would likely expand, causing a net increase in value added in agriculture as a whole.
There is a reallocation of scarce factors from other sectors towards winter cereal production. This is an important consideration in terms of allocative efficiency in the economy because the returns from winter cereal production are raised “artificially” when tariff rates are increased.
The reallocation of resources towards winter cereal production is also reflected in the results for factors and households, where only those closely involved in winter cereal production benefit. This is especially the case in the Free State and Northern Cape.
However in the Western Cape, despite the fact that there are two main winter cereal producing areas, it was found that the anticipated benefits as a result of the increased tariff on wheat imports are not sufficient to outweigh the negative impacts on employment and factor incomes as a result of the general contraction in the economy.
The effects are also mildly regressive, that is they tend to harm low-income households more than higher-income households. This is largely explained by the increase in some food prices.
Figure 2 below shows that when the import tariff on wheat increases by more than 20 per cent, government revenue from import tariffs on wheat starts to decline due to the decline in wheat imports.
13 Working Paper 2005:2 was undertaken in collaboration with the BFAP and Free State University.

88
Western Cape Provincial Economic Review & Outlook 2007
Figure 2: Changes in government revenue and expenditure following an increase in import tariffs on wheat
-0,03
-0,03
-0,02
-0,02
-0,01
-0,01
0,00
0,01
0,01
0,02
35 40 45 50 55 60
Increase in import tariff on wheat
Per
cent
age
chan
ge
Import tariff revenue
Government income
Direct income tax revenue
Government expenditure
Source: PROVIDE working paper, 2005:2
Working paper 2006:1 on the ‘Impact of increasing excise duties on the economy’ was completed on request from the SA Wine Industry Council. The results were used during negotiations between the SA Wine Council and Provincial Ministers of Finance and Tourism from the Northern and Western Cape and the National Minister of Finance to determine the desired level of increases in the excise duties on wine.
This study investigated the economic impact of a 10 per cent increase in excise duties on wine, focusing on the change in GDP, trade and prices, as well as changes in the factor market and the welfare of households of the Northern and Western Cape (the two major wine producing provinces in the country).
The results indicated that the majority of households in SA would be worse off in terms of real consumption expenditure, and that all households in the Northern and Western Cape would experience welfare losses. Lower-income households would be most affected, as they tend to spend a larger share of their income on beverages and tobacco.
89
Chapter 3: Economic Modelling and Regional Impact Analysis
However, these results do not capture the benefits from any reduction in negative externalities following the decline in demand due to a price increase in alcoholic beverages, and hence are likely to represent an upper bound of any welfare losses. Likely negative externalities include continuation of high levels of foetal alcohol syndrome among children, high levels of traffic accidents, and high levels of violence, including domestic violence. Additional analyses indicated that the gain in productivity required to offset the negative impact of increasing excise duties is rather small.
Further analysis was undertaken for the SA Wine Industry Council in respect of the economic impact of changing labels on wine bottles, following proposed legislation on mandatory health warning labels on wine products. The results contributed to more in-depth discussion and investigation into the viability of this legislation, the financial implications for the wine industry and the potential socio-economic implications for the Western Cape, thus avoiding hasty decisions that might have unintended consequences.
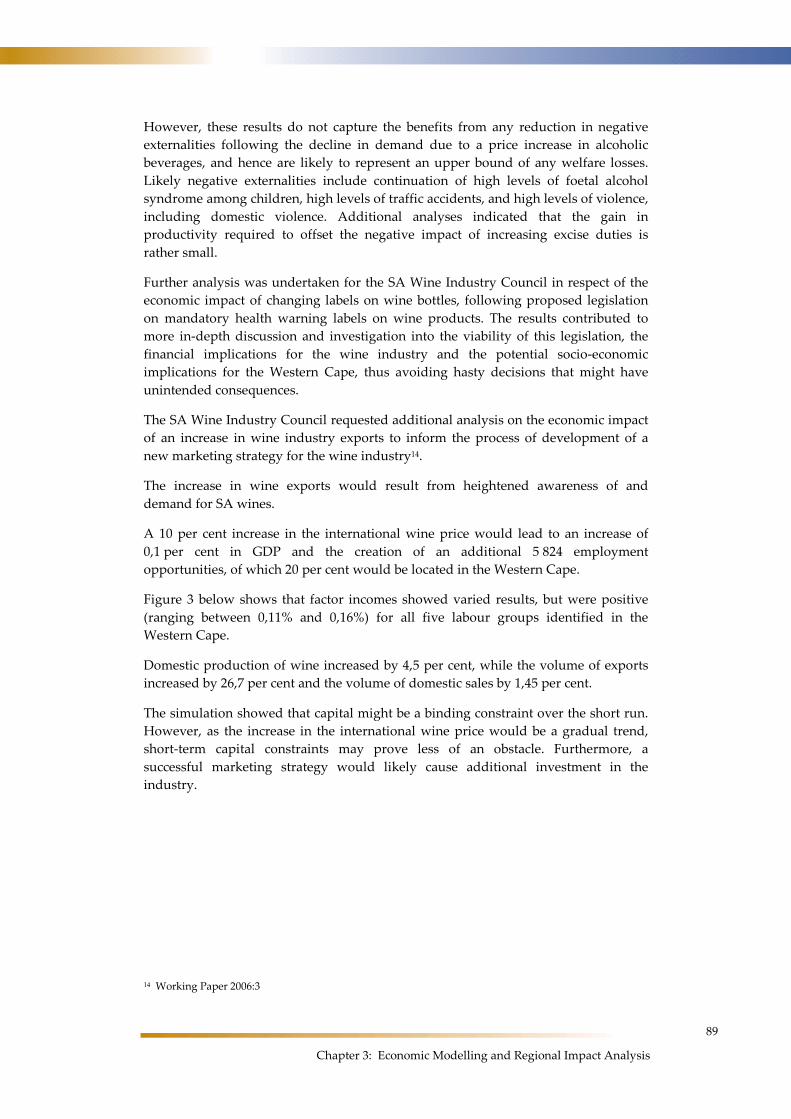
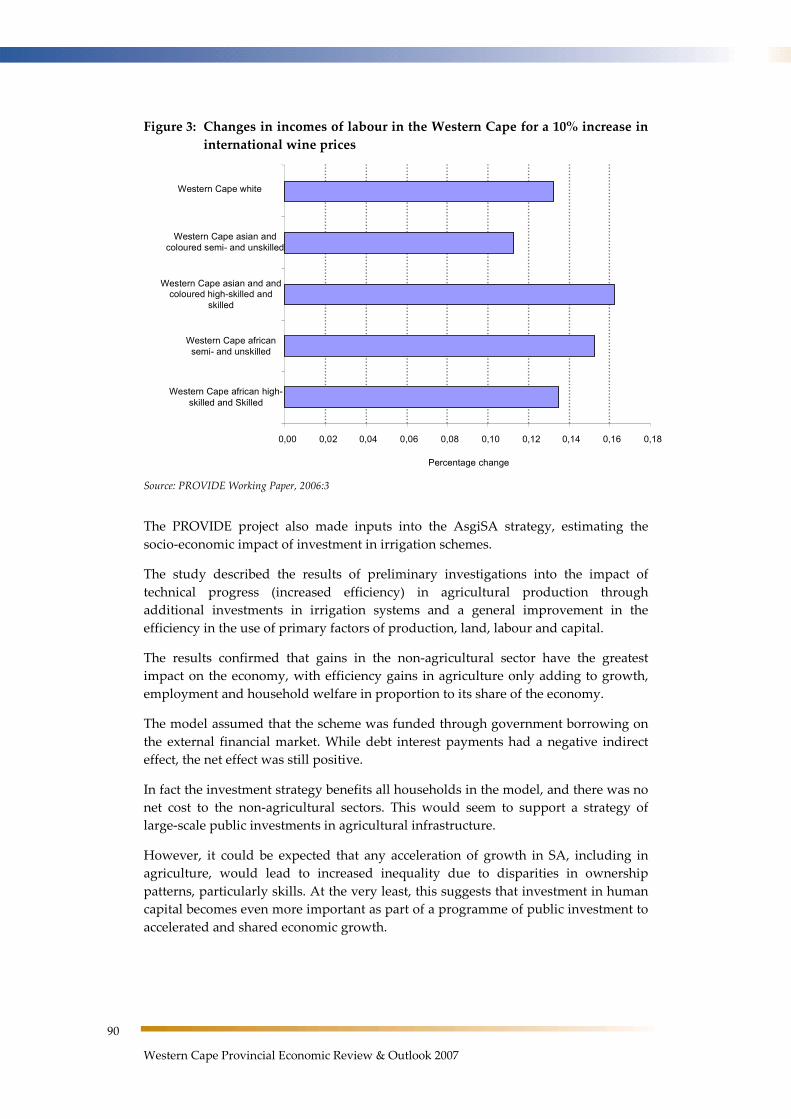
The SA Wine Industry Council requested additional analysis on the economic impact of an increase in wine industry exports to inform the process of development of a new marketing strategy for the wine industry14.
The increase in wine exports would result from heightened awareness of and demand for SA wines.
A 10 per cent increase in the international wine price would lead to an increase of 0,1 per cent in GDP and the creation of an additional 5 824 employment opportunities, of which 20 per cent would be located in the Western Cape.
Figure 3 below shows that factor incomes showed varied results, but were positive (ranging between 0,11% and 0,16%) for all five labour groups identified in the Western Cape.
Domestic production of wine increased by 4,5 per cent, while the volume of exports increased by 26,7 per cent and the volume of domestic sales by 1,45 per cent.
The simulation showed that capital might be a binding constraint over the short run. However, as the increase in the international wine price would be a gradual trend, short-term capital constraints may prove less of an obstacle. Furthermore, a successful marketing strategy would likely cause additional investment in the industry.
14 Working Paper 2006:3
90
Western Cape Provincial Economic Review & Outlook 2007
Figure 3: Changes in incomes of labour in the Western Cape for a 10% increase in international wine prices
0,00 0,02 0,04 0,06 0,08 0,10 0,12 0,14 0,16 0,18
Western Cape african high-skilled and Skilled
Western Cape african semi- and unskilled
Western Cape asian and and coloured high-skilled and
skilled
Western Cape asian and coloured semi- and unskilled
Western Cape white
Percentage change
Source: PROVIDE Working Paper, 2006:3
The PROVIDE project also made inputs into the AsgiSA strategy, estimating the socio-economic impact of investment in irrigation schemes.
The study described the results of preliminary investigations into the impact of technical progress (increased efficiency) in agricultural production through additional investments in irrigation systems and a general improvement in the efficiency in the use of primary factors of production, land, labour and capital.
The results confirmed that gains in the non-agricultural sector have the greatest impact on the economy, with efficiency gains in agriculture only adding to growth, employment and household welfare in proportion to its share of the economy.
The model assumed that the scheme was funded through government borrowing on the external financial market. While debt interest payments had a negative indirect effect, the net effect was still positive.
In fact the investment strategy benefits all households in the model, and there was no net cost to the non-agricultural sectors. This would seem to support a strategy of large-scale public investments in agricultural infrastructure.
However, it could be expected that any acceleration of growth in SA, including in agriculture, would lead to increased inequality due to disparities in ownership patterns, particularly skills. At the very least, this suggests that investment in human capital becomes even more important as part of a programme of public investment to accelerated and shared economic growth.
91
Chapter 3: Economic Modelling and Regional Impact Analysis
Real increases in wage rates of unskilled labourers were assumed, which seemed appropriate given an emphasis on equity as well as on growth. However, a separate simulation that excluded real wage increases for unskilled labour, obtained higher economic growth results, particularly in sectors employing relatively more unskilled labour, such as agriculture.
6. General equilibrium analysis and regional economic development
General equilibrium analysis undertaken on a regional level has a definite role to play in the policy debate on the Western Cape’s PGDS iKapa Elihlumayo.
The results give an indication as to which policy interventions will lead to an expansion of the regional economy and importantly, whether economic growth take the form of shared growth, ie. whether it that will address poverty and inequality, or whether it will have the unintended effect of reinforcing the duality in the economy.
For instance, a study15 on the dualistic nature of the agricultural sector in SA showed that inequalities within agriculture may be explained to a large extent by differences in the ownership of income-generating assets, such as land and productive capital. Given the high poverty rates and meagre incomes among african subsistence and small-scale farmer households, the returns to non-commercial agriculture would have to increase before land ownership per se will become a solution to poverty reduction.
An advantage of general equilibrium analysis is that once there is a detailed SAM of the economy, the data and models may be used with relatively little adjustment to analyse any economic sector or industry.
For example, the PROVIDE project undertook studies on the wine, sugar, maize and wheat industries. Although the agricultural sector has been the focus of the Western Cape Department of Agriculture, the model and data could just as easily be used to investigate sectoral policies of the textile or film industries or the impact of fiscal or trade policy on the manufacturing industry.
The level of detail in the SAM database usually dictates the possible focus areas for analysis. For instance, a highly aggregated SAM, which distinguishes only between food and non-food manufacturing, will not be suitable for analysis of the textile industry. However, if the textile industry is identified separately in the data, the SAM becomes suitable for a more detailed analysis of the industry.
15 PROVIDE, 2005 (b)

92
Western Cape Provincial Economic Review & Outlook 2007
The number of accounts included in SAMs varies greatly. The PROVIDE SAM for SA was constructed with the aim of retaining as much detail as possible, allowing researchers to form suitable aggregations for modelling depending on the focus of the analysis16.
A key area of applicability of general equilibrium analysis is to international trade. As the latter is an important driver of economic growth, it is essential to understand how international trade agreements and national trade policies affect the Western Cape.
This area of research is high on the agenda of the Western Cape Department of Agriculture. Analysis of the impacts of trade with China and India on the Western Cape economy is scheduled for the second half of 2007. Linkages with global models, which concentrate on inter-country rather than intra-country relations has been used extensively as part of the Global Trade Analysis Project run from Purdue University in the US. A similar global model, but based on SAM data, has been developed at the University of Sheffield. Links between this global model and the SA country model are in progress.
6.1 International application of CGE analysis
A scan of international literature on CGE model applications indicates that the approach is commonly used in policy making, particularly in developed economies.
Several examples exist in the literature of CGE studies on broader issues related to the tourism industry, environmental issues, including climate change, as well as energy issues such as biofuels and CO2 emissions.
General equilibrium analysis, when using dynamic models (models with a time dimension), could also be used for analysis of large investment projects to identify the expected impact on employment and changes in household incomes and welfare.
Multiplier analysis using regional datasets could be employed to conduct sectoral analyses in an attempt to identify industries with large linkage effects in the economy, where investment and growth would have the greatest overall impact for the regional economy.
In the context of spatial development within the Western Cape, standard CGE models using standard national SAMs are less suitable, as these models do not typically capture a true spatial dimension. In this case the potential role of CGE analysis would be to determine whether a certain investment project, such as a biofuels plant, has net benefits to the economy as a whole, rather than deciding the location of the plant.
16 For a full list of accounts included in the SAM see PROVIDE, 2006
93
Chapter 3: Economic Modelling and Regional Impact Analysis
Incorporation of provincial level information in the SAMs allows a certain degree of assessment of provincial level implications. A distinguishing feature of the PROVIDE SAMs is that they contain household and labour information on a provincial level, therefore obtaining a sense of the spatial distribution of socio-economic impacts. These effects are driven by the differences in consumption patters by households in different provinces, as well as by factor use in the economy and the patterns of factor ownership by households.
Examples of more sophisticated integrated models exist for detailed spatial analysis. For example, an integrated transport-multiregional CGE model was developed to assess the spatial economic effects of four highways out of the proposed national highway network on economic growth and regional income inequality in Korea17.
The transport model measured a change in inter-regional shortest distances and accessibility due to the highway project. The CGE model estimated the spatial economic effects of the project on GDP, prices, exports and the regional distribution of wages and population.
A spatial structural decomposition analysis, based on input-output tables, has also been used to measure the effects of the changes in intra-and inter-country linkages on energy demand18.
In Denmark spatial accounting methods were used to construct spatial SAMs19, which are an extension of the more general regional SAMs, driven by growing interest in regional and local economic performance and interactions with other regions and localities.
A key benefit of CGE analysis is that it allows for systematic economic analysis, taking a wide variety of issues into account. It also stimulates thought and careful consideration about the driving forces behind the economic changes, as required when deciding how to implement an experiment for simulation.
For example, an issue often neglected in the policy debate is the source of funding. If the source of funding is not explicitly accounted for, almost all investment projects or social transfers will have positive net benefits to the economy. A study on welfare transfers indicated that if the transfer is funded from increases in income tax, poverty of some household groups may actually increase due to the increased tax burden and the associated linkage effects20.
17 Kim et al., 2004 18 Kagawa and Inamura, 2004 19 Madsen and Jensen-Butler, 2005 20 PROVIDE, 2005 (c)
94
Western Cape Provincial Economic Review & Outlook 2007
7. Future initiatives The PROVIDE project came to a contractual end during 2006. The stakeholders are negotiating the details of a follow-up initiative, which will most likely take the form of a Research Centre with five permanent researchers, hosted at the Western Cape Department of Agriculture.
The Agricultural Economics Standing Committee, comprising representatives of the ten departments of agriculture, the Agricultural Research Council (ARC), the National Agricultural Marketing Council (NAMC) and the Land Bank, will prioritise the research agenda.
An update of the SAMs from a base year of 2000 to a base year of 2005 is planned as part of the short term work programme of PROVIDE. Some revisions with regard to the household and factor accounts are envisaged to allow for gender-based research, as well as a revision of the treatment of value added tax in the SAM. Envisaged CGE model extensions include global modelling for trade issues, energy modelling and regional modelling, but these extensions are dependent on securing funding for a follow-up initiative.
The network of CGE modellers is slowly growing and it is essential for researchers and modellers in specialised areas of expertise to collaborate in order to exchange information and to ensure that no duplication takes place. During April 2007 the NAMC convened the first meeting of a trade reference group to ensure synchronised efforts related to economic modelling of trade issues of importance to agriculture. The modellers included in this group use various, but complementary, modelling techniques.
Although general equilibrium analysis provides informative answers to policy makers, it has a specific focus and should therefore be regarded as a key tool among a range of analytical techniques that are an important part of evidence-based policy decision-making.
The CGE analysis conducted as part of the PROVIDE project appears to be a natural extension of the industry and farm level research conducted by the BFAP. The latter has largely focused on partial equilibrium (industry level) econometric projection models, as well as farm level models to assess financial risk. The results derived with the industry models provide limited information on indirect effects, impacts on consumers, welfare and employment; issues that are specifically addressed in general equilibrium analysis.
The joint study on wheat import tariffs confirmed synergy, and close collaboration is maintained. The partial equilibrium and farm level models used for the study on the import tariffs on wheat gave detailed results on the industry, and farm level risk profiles for different scenarios, whereas the CGE analysis presents the wider economic implications, indicating implications for welfare and employment.
95
Chapter 3: Economic Modelling and Regional Impact Analysis
8. Summary and conclusion This chapter presented an overview of the involvement of the Western Cape Department of Agriculture in general equilibrium analysis over the past decade. General equilibrium analysis captures the interdependencies in the economy and as such provides insight into the direct and indirect effects of policy changes, or other macro-economic shocks to the economy.
The techniques used in general equilibrium analysis include input-output models, SAM-Leontief models and CGE models. The underlying databases include input-output tables and SAMs.
Three main projects have been initiated by the Western Cape Department of Agriculture in the field of general equilibrium modelling and the studies that emanated from these projects cover a wide range of issues.
The most recent project, the PROVIDE project, was a collaborative project by the nine provincial departments of agriculture and the national Department of Agriculture. The project developed a national SAM, four regional SAMs and a multiregional SAM and conducted various CGE case studies.
Case studies include impact studies on issues such as the introduction of property rates and the fuel levy, increases in import tariffs or excise duties, and increases in the price of crude oil, issues related to basic grants and social transfers, to name a few.
The PROVDE project has not embarked on dynamic CGE models, but these models are suitable for analysis of, for example, the impact of large investment projects and HIV/Aids.
When provincial level data are included in the underlying dataset, general equilibrium models may be used to inform decision-makers of the implications of policy decisions and economic shocks on the provincial economy. Results may illustrate the impact on different prices in the economy, including consumer prices, producer prices, import prices, etc., as well as quantities of goods and services produced and traded. Estimates of the impact on factor incomes, employment, and household welfare may also be obtained.
These macro-economic tools are particularly valued for the information they present on the socio-economic impacts of policy decisions and economic shocks, which are of importance from a political perspective in order to gain insight into who will be the potential winners and losers when certain policy changes are considered.
A further advantage of CGE analysis is that it allows for systematic economic analysis, contributing towards a focused, disciplined and hence a more constructive policy debate.

96
Western Cape Provincial Economic Review & Outlook 2007
This page was left blank intentionally.