Economic Modeling of Cost Effective Hydrogen Production ... Jacobs.pdf · Hydrogen Production From...
46
Economic Modeling of Cost Effective Hydrogen Production From Water Electrolysis by Utilizing Iceland’s Regulating Power Market Jeffrey Jacobs Thesis of 60 ECTS Master of Science (M.Sc.) in Sustainable Energy Science January 2016
-
Upload
dinhkhuong -
Category
Documents
-
view
232 -
download
9
Transcript of Economic Modeling of Cost Effective Hydrogen Production ... Jacobs.pdf · Hydrogen Production From...

Economic Modeling of Cost Effective
Hydrogen Production From Water Electrolysis
by Utilizing Iceland’s Regulating Power Market
Jeffrey Jacobs
Thesis of 60 ECTS
Master of Science (M.Sc.) in Sustainable Energy Science
January 2016
i
Economic Modeling of Cost Effective Hydrogen
Production From Water Electrolysis by Utilizing
Iceland’s Regulating Power Market
Jeffrey Jacobs
Thesis of 60 ECTS credits submitted to the School of Science and
Engineering at Reykjavík University in partial fulfillment of the
requirements for the degree of
Master of Science (M.Sc.) in Sustainable Energy
Science
January 2016
Supervisors:
Einar Jón Ásbjörnsson, Supervisor Professor, Reykjavík University, Iceland
Gudmundur Gunnarsson, Advisor/Collaborator
Iceland Innovation Center
Examiner:
Hlynur Stefánsson
Associate Professor, School of Science and Engineering

ii
Copyright
Jeffrey Jacobs
January 2016
iii
Economic Modeling of Cost Effective Hydrogen
Production From Water Electrolysis by Utilizing
Iceland’s Regulating Power Market
Jeffrey Jacobs
Thesis of 60 ECTS credits submitted to the School of Science and
Engineering at Reykjavík University in partial fulfillment of the requirements for the degree of
Master of Science (M.Sc.) in Sustainable Energy Science
January 2016
Student:
Jeffrey Jacobs
Supervisors:
Einar Jón Ásbjörnsson
Gudmundur Gunnarsson
Examiner:
Hlynur Stefánsson

iv
The undersigned hereby grants permission to the Reykjavík University Library to
reproduce single copies of this Thesis entitled The Full Title of the Thesis: an
Especially Long One That Needs Two Lines and to lend or sell such copies for
private, scholarly or scientific research purposes only.
The author reserves all other publication and other rights in association with the
copyright in the Thesis, and except as herein before provided, neither the Thesis
nor any substantial portion thereof may be printed or otherwise reproduced in any
material form whatsoever without the author’s prior written permission.
Date
Jeffrey Jacobs
Master of Science
v
Economic Modeling of Cost Effective Hydrogen
Production From Water Electrolysis by Utilizing
Iceland’s Regulating Power Market
Jeffrey Jacobs
January 2016
Abstract
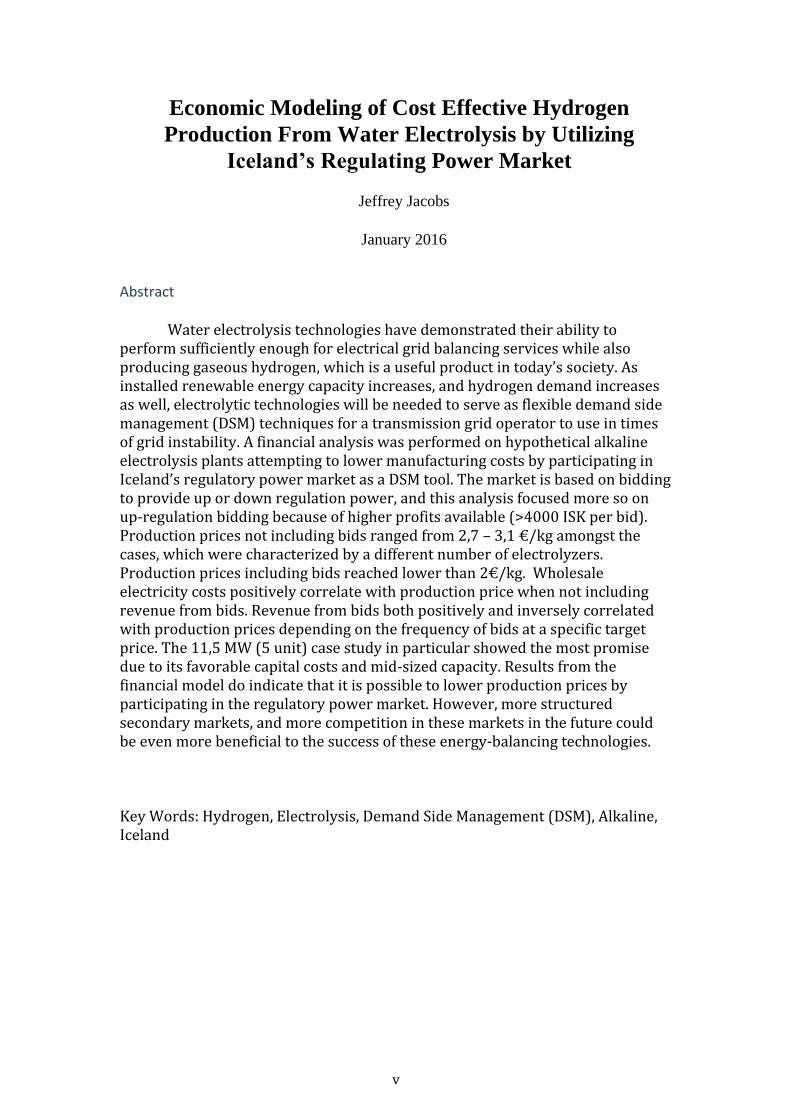
Water electrolysis technologies have demonstrated their ability to perform sufficiently enough for electrical grid balancing services while also producing gaseous hydrogen, which is a useful product in today’s society. As installed renewable energy capacity increases, and hydrogen demand increases as well, electrolytic technologies will be needed to serve as flexible demand side management (DSM) techniques for a transmission grid operator to use in times of grid instability. A financial analysis was performed on hypothetical alkaline electrolysis plants attempting to lower manufacturing costs by participating in Iceland’s regulatory power market as a DSM tool. The market is based on bidding to provide up or down regulation power, and this analysis focused more so on up-regulation bidding because of higher profits available (>4000 ISK per bid). Production prices not including bids ranged from 2,7 – 3,1 €/kg amongst the cases, which were characterized by a different number of electrolyzers. Production prices including bids reached lower than 2€/kg. Wholesale electricity costs positively correlate with production price when not including revenue from bids. Revenue from bids both positively and inversely correlated with production prices depending on the frequency of bids at a specific target price. The 11,5 MW (5 unit) case study in particular showed the most promise due to its favorable capital costs and mid-sized capacity. Results from the financial model do indicate that it is possible to lower production prices by participating in the regulatory power market. However, more structured secondary markets, and more competition in these markets in the future could be even more beneficial to the success of these energy-balancing technologies. Key Words: Hydrogen, Electrolysis, Demand Side Management (DSM), Alkaline, Iceland

vi
Fjárhagslíkan af arðbærri framleiðslu vetnis með
rafgreiningu á vatni sem notast við íslenska
reglunaraflsmarkaðinn
Jeffrey Jacobs
January 2016
Sýnt hefur verið fram á að rafgreining á vatni getur verið nýtt til að regla
raforkudreifikerfi, ásamt því að framleiða vetni sem er mikilvæg afurð í dag. Með
aukinni hlutdeild endurnýtanlegra orkugjafa í kerfinu og aukinni eftirspurn eftir vetni,
þá eykst þörfin fyrir tækni sem getur aðstoðað við að ráða við breytilega eftirspurn
(DSM) sem stjórnandi dreifikerfisins getur nýtt til að glíma við óstöðugleika.
Kostnaðargreining var framkvæmd á alkalískri rafgreiningarstöð þar sem reynt var að
lækka framleiðslukostnað á vetni með því að nýta stöðina einnig til reglunar á
dreifikerfi landsins. Markaðurinn byggir á uppboðum til að tryggja upp eða
niðurreglunar afl, en þessi rannsókn skoðaði meira uppreglun vegna þess að meiri
tekjur voru í boði (>4000 ÍSK í hverju boði). Framleiðslukostnaður á vetni án
uppboða var frá 2,7 – 3,1 €/kg eftir tilvikum, þar sem reiknað var með mismunandi
fjölda rafgreiningareininga. Framleiðslukostnaður á vetni með uppboðum lækkaði
niður í 2 €/kg. Það var jákvæð fylgni milli raforkuverðs og framleiðslukostnaðar
þegar ekki var gert ráð fyrir tekjum frá uppboðsmarkaði. Tekjur frá uppboðsmarkaði
sýndi bæði jákvæða og neikvæða fylgni við framleiðslukostnað en það stýrðist af tíðni
boða á gefnu verði. Í tilfelli 11,5 MW framleiðslustöðvar (5 rafgreiningareiningar) var
fjármagnskostnaður hagstæður og afkost í góðu samræmi við íslenska raforkukerfið.
Niðurstöður kostnaðarlíkans benda til að hægt sé að lækka framleiðslukostnað á vetni
með því að taka þá í uppboðsmarkaði reglunarafls á raforkumarkaðnum. Hins vegar,
mun aukin samkeppni og þróun undirmarkaða í framtíðinni geta stutt enn frekar við
tækni sem hægt er að nýta á reglunarorkumarkaði.
vii
TABLE OF CONTENTS 1. Introduction - 1
1.2 Water Electrolysis Origins and Theory - 2
1.3 Alkaline Electrolysis - 3
1.3.1 Alkaline Electrolysis: Real World Applications - 5
1.3.2 Alkaline Electrolysis: Limitations and Further Development - 6
1.4 Polymer Electrolyte Membrane (PEM) Electrolysis - 6
1.4.1 PEM Electrolysis: Real World Applications - 8
1.4.2 PEM Electrolysis: Limitations and Further Development - 8
1.5 High Temperature Electrolysis – Future Electrolysis - 9
1.5.1 HTE Electrolysis: Real World Applications - 10
1.5.2 HTE & Co-Electrolysis - 10
1.5.3 HTE: Limitations and Further Development - 10
1.6 Electrolysis Conclusion and Future Perspectives - 11
2.1 Introduction - 14
2.2 Hydrogen in today’s society - 14
2.3 Electrical Network Balancing - 15
2.3.1 Instantaneous Reserves - 15
2.3.2 Primary Reserves - 15
2.3.3 Secondary Reserves - 16
2.3.4 Tertiary Reserves - 16
2.4 Iceland’s Electricity Market - 17
2.5 Renewable Energy Installed Capacity - 20
2.6 Electrolysis - 20
2.7 Demand Side Management - 21
METHODS
2.8 Electrical Grid System Boundaries - 23
2.8.1 Electrolysis Review - 23
2.8.2 Case Study - 24
2.8.3 Electrolysis Methods - 24
2.8.4 Capital Cost - 26
2.8.5 Total Manufacturing Costs - 26
2.8.6 Electricity Costs - 27
2.8.7 Fixed Costs - 27
2.8.8 Model Limitations - 28
RESULTS
2.9 Capex - 28
2.9.1 Electricity Charges - 29
2.9.2 Hydrogen Production Prices - 31
2.9.3 75%, 50%, 25% Scenarios - 32
2.9.4 Wholesale Electricity Price - 33
2.9.5 Historical Regulating Power Market Prices and Trends - 33
2.10 Discussion/Conclusion - 34

viii
LIST OF TABLES/FIGURES
Figure 1: Worldwide hydrogen production - 1
Figure 2: Schematic of an alkaline electrolysis cell - 4
Figure 3: A typical solid electrolyte cell - 7
Figure 4: Thermal and electrical energy requirements for HTE - 9
Figure 5: Evolution of power reserves over time - 17
Figure 6: 5 year data on regulating power from Landsnet - 19
Figure 7: Graphical representations of DSM techniques - 21
Figure 8: NEL electrolyzer approximate energy consumption - 25
Figure 9: Electrolyzer CAPEX (€/kW) compared to plant capacity (MW) - 26
Figure 10: Manufacturing cost of hydrogen for each case including revenue from bids
- 32
Figure 11: Production price as a function of electricity price per MWh for the 11,5
MW (5 unit) case - 32
Figure 12: Reality scenarios at 75%, 50% and 25% including revenue from 6000 ISK
bids - 33
Figure 13: Manufacturing price at different wholesale electricity prices including
revenue from bids - 33
Table 1: Research and development necessary for future alkaline electrolysis
advancement - 6
Table 2: Operating and performance parameters for Alkaline and PEM electrolysis
technologies - 7
Table 3: Research and development goals for PEM electrolysis - 8
Table 4: Characteristics of NEL atmospheric pressure alkaline electrolyzer - 24
Table 5: Cases studied for analysis - 25
Table 6: Cost assumptions used for each case including auxiliary equipment - 26
Table 7: Electricity costs and tariffs assumed in financial model - 27
Table 8: CAPEX associated with different sized electrolysis plants - 28
Table 9: Wholesale electricity costs for each case assuming operation at 100%
capacity and 8760 hours per year and electricity price of 40€/year - 29
Table 10: Additional electricity charges expected for each case assuming operation at
100% capacity and 8760 hours per year - 29
Table 11: Ancillary Service and Transmission losses charges for each case assuming
operation at 100% capacity and 8760 hours per year - 29
Table12: Excel spreadsheet including all parameters and displaying manufacturing
costs without revenue (highlighted in yellow) - 30

ix
Part 1:
A Review of
Water Electrolysis Technologies

2
1. Introduction
In today’s society as global energy demands are addressed, it is expected that
hydrogen will play a crucial role in future energy infrastructure. Hydrogen is being
turned too as an energy carrier in hopes to wean our current society away from carbon
emitting fossil fuels and to mitigate their effects on the atmosphere. Hydrogen has a
gross energy or higher heating value of 142 MJ/kg compared to natural gas or crude
oil that register at 52 and 45 MJ/kg respectively1. Hydrogen also has demonstrated its
ability as fuel for vehicles, electricity storage via fuel cells and a number of other
useful attributes in the chemical and metallurgical industries.
Hydrogen (H2) is the single most abundant element on earth however, it does
not exist by it self in nature, and typically is bonded with oxygen to form water.
Methods do exist to split hydrogen’s bonds with other molecules and these are shown
in Figure 1 along with their respective production percentage share in the hydrogen
industry 2. The most popular method of hydrogen production is methane reforming
where a high temperature process cleaves hydrogen off of a carbon molecule. An
example of a lesser-utilized hydrogen production method is water electrolysis where
an electrical current splits water molecules into separate entities of hydrogen and
oxygen. Electrolysis is more ecofriendly from an emissions point of view, however
the process is energy intensive and non sustainable in this regard.
Sustainable hydrogen production via electrolysis can be achieved if the energy
consumed comes from a renewable source such as wind, solar or geothermal instead
of fossil fuels or nuclear uranium. With renewable energy installed capacity on the
rise, electrolysis is poised to become a much more important future hydrogen
production strategy. Also, as research and development drive costs down, production
prices can be expected to decrease and eventually become competitive with the likes
of methane reformation. Electrolysis also offers the potential of electrical grid
balancing where a transmission operator (TSO) may increase or curtail electrical loads
on an electrolysis plant depending on the overall supply and demand of energy in a
given network. Known as a Demand Side Management (DSM) technique, an
electrolysis plant can participate in up or down regulation for grid balancing and
possibly generate revenue while doing so. This presents another option for lowering
hydrogen production costs and eliminates the need to build additional electricity grid
infrastructure.
Figure 1: Worldwide hydrogen production methods 2.

3
With renewable energy penetration on the rise as well as global hydrogen
demand increasing, electrolytic technologies present a uniquely sustainable alternative
to conventional hydrogen production strategies. By utilizing renewable energy
sources and allowing electrical load flexibility at the transmission operator’s control,
it can be possible to significantly lower hydrogen manufacturing costs from today’s
market price.
The aim of this thesis is to a) Identify electrolysis technologies via a literature
review taking into account performance and real world applicability b) Perform an
economic analysis on a selected electrolysis technology for different capacity
electrolysis plants in an attempt to reduce production costs as much as possible by
acting as a DSM technique.
1.2 Water Electrolysis Origins and Theory
Water electrolysis is a centuries old technique first demonstrated by the
German chemist J. W. Ritter in the 1800s. English scholars then followed suit when
they noticed water decomposing when a current was applied during one of their
experiments. The French military then began utilizing this technique for their airship
fleets, and by the 1900s many industrial processes were producing hydrogen such as
the fertilizer industry. Since then, many more electrolysis units have been put on line
including the first large-scale unit capable of producing 10,000 Nm3 H2/h which was
introduced in 19393.
The equation for water electrolysis can be seen below and involves adding
electrical energy to water molecules and yielding hydrogen and oxygen gas.
( ) ⁄ ( ) (1)
This liquid to gas reaction takes place in a device known as an electrolyzer. The
electrolyzer uses electricity as an energy input from an external supply to split the
water into its separate entities of hydrogen and oxygen. The electrolyzer is comprised
of an electrochemical cell that is made up of two electrodes, an electrolyte reservoir
and a connection to an external power supply.
In the first electrolysis applications, an acidic water solution was used in the
electrolyte reservoir because pure water was known to be an ineffective electrical
conductor. Nowadays, both acidic and basic solutions are used and the reactions differ
slightly in overall reaction kinetics. However, regardless of what conductive
electrolyte is used, these all have been researched and designed so that no side
reactions are observed leading to undesirable byproducts.4
Electrolysis is an endothermic ( ) and non-spontaneous ( ) chemical reaction. During operation inside the cell, when a specific voltage, or the
‘critical voltage’ between electrodes is applied, H2O begins to decompose and H2
forms at the negatively charged cathode while O2 forms at the positively charged
anode. Hydrogen quantities produced per unit time is directly related to the current
applied in the system. Under standard temperature and pressure the required energy
for the reaction is determined by enthalpy change ( H). The following expression
shows the thermodynamic relationships inside the electrolysis cell.
(2)

4
In this equation, is the Gibbs Free energy change in the form of electricity. Q
represents the thermal energy needed and this equals the product of the reaction
temperature, T, and entropy change,
The necessary cell voltage required for electrolysis is called the reversible cell voltage
Vrev and is explained by the following equation.
(3)
The voltage can be found by dividing the Gibbs Free energy by the number of
electron moles transferred (z) multiplied by the Faraday constant, or the charge of one
mole of electrons (96.485 C/mol).
The electrical efficiency of an electrolysis system can be calculated by the following
equation:
( )
(4)
The HHV is defined as the amount of heat released after combusting a fuel and
allowing the products to return back to a standard temperature (25 C). Electrolysis
cells can be either singular or designed in stacks with multiple cells thus multiplying
capacity. Once the critical voltage in the cell is reached, the efficiency of the voltage
can be defined for an individual or a stack of electrolytic cells. This equation is as
follows:
( )
( ) (5)
Now that a brief introduction into the theory of electrolysis has been
presented, different electrolysis technologies will be explained. Each technology will
be described by providing a brief history, comments on design and performance, as
well as the demonstrated real world applicability and potential to be in tandem with
renewable energy.
1.3 Alkaline Electrolysis
Alkaline electrolysis is the most mature of the electrolysis methods, and is
considered the easiest as well. Applications include a variety of uses in the chemical
and metallurgical industries. A typical electrochemical alkaline cell is shown in
Figure 2. The cell consists of an electrolyte reservoir, two electrodes and a diaphragm
in between the electrodes.

5
The diaphragm is typically made from composite materials based on ceramic,
microporous or a combination of both materials. The electrodes are made from metals
like Ni or Ni alloys, however different metals can also be used. Other metals are
characterized by the potential difference (voltage) between a half-cell reaction’s
thermodynamically determined reduction potential and the potential at which the
reduction event is observed. This is commonly referred to as over-potential and can be
directly related to a cell’s voltage efficiency 5. Electrolytes used in an alkaline
electrochemical cell are typically corrosive agents like KOH or NaOH, and are often
found in tandem with neutralizers to help preserve the cell’s lifetime. The
electrolyte’s primary task is to facilitate ionic movement by carrying electrical charge
through the cell. An electrochemical catalyst can also be added and aides by diverting
both the anode and cathode reaction pathways to a lower activation energy state, thus
starting the reaction more easily.
Alkaline electrolyzers are capable of producing high quality hydrogen and
other methods do exist for additional purification. Commercial systems range in size
and production capacities. Average costs range from 1,000-1,200 €/kW.6
There are many examples of successful industrial hydrogen production
through alkaline electrolysis throughout the world. Systems sizes and design vary
widely from small laboratory set-ups to large-scale electrolysis plants. Despite
widespread application, energy requirements are high, energy costs can be volatile,
and this energy may be produced from CO2 emitting feedstock. These three factors
suggest the importance of electrolysis facilities to be coupled with renewable energy
in order to sustainably produce hydrogen.
In the next sections, various case studies, new research developments and
technology limitations will be discussed regarding alkaline electrolysis. Polymer
exchange membrane (PEM) and high temperature electrolysis (HTE) will then be
discussed in the same context.
Figure 2: Schematic of an alkaline electrolysis cell with a liquid electrolyte 5.
6
1.3.1 Alkaline Electrolysis: Real World Applications
Canada has developed wind power to hydrogen projects in order to bolster the
nation’s wind energy profile. Ramea Island, south of Newfoundland and Labrador is
the site of one such project where hydrogen production and storage was integrated
into the already existing wind power to diesel system in operation. Electrolysis was
performed with a 90 m3/h alkaline electrolyzer in tandem with a 2000 m
3 hydrogen
storage unit kept at 10-bar pressure. With this design, system operators demonstrated
ability to convert stored hydrogen back into electricity to power four 62.5 kW
hydrogen internal combustion engine generators for this remote island 7.
The United Kingdom established wind power to hydrogen technologies to
investigate its potential, and bolster its renewable energy profile. From 2001-2006 the
Hydrogen and Renewables Integration (HARI) project served as a research project to
demonstrate and gain experience from this power to gas system. The HARI project
consisted of wind, solar and micro hydro turbines totaling 79 kW capacity. For the
project, a 36 kW alkaline electrolyzer was installed, capable of 25-bar pressure output.
This was accompanied by a 2,856 Nm3 hydrogen storage capacity capable of 137-bar
pressure, and connected to two fuel cells at 2 kW and 5 kW, respectively. The system
was also mentioned to show potential for electrical grid support and act as a DSM
technique.
Along with demonstration projects coupled with renewable energy sources,
research and development has been an ongoing effort in the water electrolysis
industry. It can be expected that costs will be driven down as processes become more
optimized and parts become inexpensive. An example of further optimization and
design research has shown that high temperature and pressure alkaline electrolysis is a
viable option. New alkaline cells have been built and water electrolysis has been
successfully demonstrated at temperatures up to 250 C and 40 bar pressure. This same
cell demonstrated electrical efficiencies of 99% at 1.1 A cm-2
and 85% at 2.3 A cm-2
8.
Other optimization studies performed observed that creating an ultrasonic field
around the electrolyzer assisted in mass transfer and reduced energy requirements on
the cell. Experiments showed that performing electrolysis when using an ultrasound
increased production efficiency 4.5% and increased
energy efficiency 1.3% allowing for a total average production efficiency of 78%9.
Several models have also been created look at electrolytic alkaline hydrogen
production coupled with renewable energy. For example, successful simulations have
been observed of an alkaline electrolysis cell powered by a photovoltaic module, and
gas profiles generated showing production rates compared to solar intensities
throughout the day 10
.
1.3.2 Alkaline Electrolysis: Limitations and Further Development
Alkaline electrolysis is the oldest and simplest electrolysis method available
today, and is used in a wide variety of chemical and metallurgical processes. Perhaps
the single biggest problem associated with alkaline electrolysis is high-energy
requirements, however this can be addressed when coupled with renewable energy
resources. General limitations and problems that need to be addressed for future
improvements in alkaline electrolysis are presented in Table 1.

7
The improvements needed mainly involve development of cheap and better
performing materials capable of performing efficiently inside the cell’s harsh
environment created during electrolysis. It is also noted that the obstacles to higher
efficiency are resistances in the cell, including resistances generated by gas bubbles,
activation energies of electrochemical reactions, mass transfer and electrical
resistances in the circuit 11
. Also it is expected that compatibility issues between
electrolyzer, renewable energy and current grid infrastructure could arise in some
parts of the world, and these will need to be addressed in future energy infrastructure
developments.
1.4 Polymer Electrolyte Membrane (PEM) Electrolysis
Polymer exchange membrane (PEM) electrolysis, also known as ‘proton
exchange membrane’ is the next technique that will be discussed, and it is arguably
the better performing electrolysis technology available on the market today. General
Electric is credited with the first designed PEM electrolyzer spawning further
developments through the 80s and 90s. To date, PEM electrolysis has applications in
the chemical and metallurgical industries, as well as with NASA and the U.S. Navy.
PEM electrolysis is based off using a solid-state electrolyte versus a liquid
electrolyte. Figure 3 shows the layout of a typical solid electrolyte cell. Instead of a
Reducing dissolved gas bubble’s time on electrode surface and the associated
resistances
Development of cheaper and better performing liquid electrolyte solutions
Development of electrocatalysts to reduce overall reaction resistances (i.e.
activation energy)
Development of new cell additives to assist ionic movement and chemical
reaction stability
Development of safer and more durable materials
Table 1: Research and development necessary for future alkaline electrolysis advancement11,36
Figure 3: A typical PEM solid electrolyte cell used for water electrolysis

8
porous diaphragm, a solid membrane separates the electrodes. An electro catalyst is
also present, and the whole unit is commonly referred to as the Membrane Electrode
Assembly (MEA). A gas diffuser and steel bi-polar plates are also necessary to
promote ionic movement across the membrane, and the whole system requires a
purified H2O stream.
The MEA is the backbone of the operation and therefore constitutes a majority
of cost. The membrane itself is made from a perfluorosulfonic acid polymer and is
capable of providing high proton conductivity and withstanding higher pressures.
Low membrane thickness (20-300 μm) also allows for compact design, low ohmic
drop and high gas permeability12
. Electrodes are typically coated in noble metals plus
their oxides, which serve as the electro catalyst. For example, an electrode may be
coated in platinum or iridium in tandem with platinum or iridium oxide as the
catalyst.
PEM electrolyzer can provide ultra high purity hydrogen, and also range in
size and production capacity, however both are higher than in alkaline. Average costs
for these systems range from 1,900 – 2,300 €/kW 6. Table 2 shows the operating and
performance parameters of commercially available Alkaline and PEM technologies. Table 2: Operating and performance parameters for Alkaline and PEM electrolysis technologies 6
Alkaline PEM
Production Capacity Nm3
H2/h 0.25 – 760 0.01 – 240
Electrical Input kW 1.8 – 5,300 0.2 – 1,150
Operating Temperature C 40 – 90 20 – 100
Operating Pressure Bar <30 <200
Hydrogen Purity % 99.5 – 99.9998 99.9 – 99.9999
System Cost €/kW 1,000 – 1,200 1,900 – 2,300
*HTE not included because it is not commercially available.
1.4.1 PEM Electrolysis: Real World Applications
In 1987, a Swiss metallurgical specialty company placed the first commercial
scale PEM electrolyzer unit on line. The plant consisted of 120 cells, each with 20 x
20 cm2 active area, grouped into four separate modules. The unit was designed to
produce up to 20 Nm3/h hydrogen at 1-2 bar pressure
3.
Single cell PEM electrolyzers have been documented performed with 87%
efficiency. Multiple cell stacks (5 to 10) showed efficiencies around 80% and the
capability to produce hydrogen at 5 l/min while consuming 1280 kw 13
. The
GenHyPEM project in Germany also demonstrated stack efficiencies close to 80%
while operating at high current densities ~1 A cm-2
. The project also demonstrated
experimental storing hydrogen in pressurized vessels (1-130 bar)14
. In 2010, Oreion
Alpha designed a self-pressurizing transportable PEM electrolyzer and demonstrated
operation while coupled with a 2.4 kW photovoltaic solar array15
. PEM has been
noted to be especially well suited be powered by photovoltaic cells for both grid
connected and grid independent applications by matching both the panel and the
electrolyzer’s i-V polarization curves 16
.
German researchers have demonstrated solar-hydrogen production from a
dual-unit 100 kW commercial scale system. This power to gas research project aimed
to study the electrolysis cell’s lifetime and then adjust accordingly in a second
demonstration plant3. Hydrogen production from a geothermal source has also been
demonstrated with a binary geothermal power plant, heat exchanger and PEM
electrolyzer. At 160 C resource temperature, model outputs showed 3810 kW

9
electrical output and 0.0340 kg/s H2 production. The model also calculated overall
energy and exergy efficiencies of 6.7% and 23.8% respectively. The researchers
concluded that higher efficiencies were observed if water enters the PEM electrolyzer
preheated and that hydrogen production was proportional to geothermal resource
temperature17
.
1.4.2 PEM Electrolysis: Limitations and Further Development
PEM has been around for a much shorter time than alkaline electrolysis, and
faces some of the same main challenges like high-energy and capital cost
requirements. Table 3 shows some of these limitations regarding the system itself and
problems when coupling with renewable energy. Nonetheless, research and
development projects are ongoing and are expected to bring future costs down low
enough to be competitive with alkaline electrolysis.
Table 3: Research and development goals for PEM electrolysis12,14–16
Develop low cost substitutes for noble metal catalysts able to handle the acidic
conditions in the MEA
Maintain efficiency and low ohmic resistances in up scaled systems
Increase production capacity while maintaining overall system efficiencies
Achieve higher operating current densities and pressures to reduce capital cost
Renewable energy is intermittent and small drops in efficiency have been
observed due to coupling
Technology necessary to monitor electrolysis processes and act as fail safes
Develop low cost and corrosion resistant diffusers and bi-polar plates
Stack development into the MW range
1.5 High Temperature Electrolysis – Future Electrolysis
HTE is most recent electrolysis technology to be in the electrochemical
spotlight, and there is lots of intrigue and research currently surrounding this idea.
HTE is mostly attractive because it becomes thermodynamically favorable at higher
operating temperatures (800-1000 C). This allows for significantly less electricity to
Figure 4: Thermal and electrical energy requirements for HTE37.

10
be consumed by the reaction because a portion of the energy comes in the form of
heat. Heat is also generally cheaper than electricity making the economic benefits
associated with this technology to be rather appealing. High heat requirements are
usually achieved by exchanging heat from nuclear reactors, however geothermal heat
is also being explored as a possibility and research has demonstrated HTE viability
through a network of heat exchangers and 230 C resource temperature 18
.The Idaho
National Laboratory performed an economic analysis of HTE coupled with a high
temperature helium cooled nuclear power plant, and estimated hydrogen production
costs at $3.23 per kg hydrogen 19
.
HTE is performed in a solid oxide cell (SOC) and principally operates the
same as alkaline or PEM systems by using electrical current to split water molecules,
which in this case are in the form of pure steam or a steam liquid aqueous mixture.
HTE operates under the so called ‘thermoneutral voltage,’ where the electricity input
matches the total energy demand for the reaction. This occurs because electrical
energy required decreases as temperature increases and heat energy takes over to split
the molecule. It has been noted that in theory, this means that conversion can be
achieved at 100%20
. Figure 4 illustrates the principle behind which these high
temperature systems operate. In the vapor phase, both electrical and thermal energy
demands decrease dramatically, and this can be achieved while simultaneously
maintaining high efficiency levels. SOCs have been designed to act as both a fuel cell
and an electrolysis cell, and they are sometimes referred to as reversible solid oxide
fuel cells (RSOFC).
1.5.1 HTE Electrolysis: Real World Applications
The first prototype to demonstrate this was the HOT ELLY system designed
by German engineers in the 1980s. This system utilized the thermodynamic
advantages of high temperature and phase changes mentioned above to achieve much
higher efficiencies than PEM or alkaline methods. At the moment, only a few
materials have been considered applicable as HTE electrolytes. These include ZrO2,
CeO2, LaGaO3 and Bi2O3. These electrolytes are used because they have demonstrated
sufficient oxide ion conductivity over a wide range of operating pressures. Electrodes
for HTE are typically made from lanthanum strontium manganite (LSM) mixed with
an ionic conductor matching the solid electrolyte’s composition21
.
In some of the first demonstration trials, single SOCs were operated for long-
term periods at -0.3 A cm-2
current density. At low voltage around 1.07 V, the cells
reached 100% Faraday efficiency, which is possible in theory to do by utilizing the
favorable thermodynamics of the HTE system22
. A HTE process coupled with
geothermal energy was investigated from an overall energetic and exergetic
standpoint before as well. Overall energy and exergy efficiencies were calculated 87%
and 88%, respectively. The research also concluded that without including auxiliary
equipment, HTE consumed 3.34 kWhe at 230 C while generating 573 mol/s H2 2.
Despite demonstrated success with geothermal heat as an energy input, HTE is
more compatible with much higher temperature waste heat from nuclear reactors.
However, as geothermal drilling technology advances, higher temperatures may
become accessible in the near future.

11
1.5.2 HTE & Co-Electrolysis
When operating in electrolysis mode, the RSOFC device will electrolyze
water vapor or steam to produce hydrogen. The device also has demonstrated that it
can electrolyze a mixture of H2O and CO2, resulting in hydrogen and carbon
monoxide (CO). This process is known as co-electrolysis, and leads to the formation
of syngas (H2 + CO). Syngas, is a pre-cursor to alternative fuels, and there is a lot of
demand for this product in today’s green energy revolution. Syngas can be further
processed into higher carbon fuels by utilizing the Fischer-Tropsch chemical reaction
process. Co-electrolysis is therefore a highly anticipated technology and lots of
research is being conducted to make it commercially available.
1.5.3 HTE: Limitations and Further Development
HTE is still a very young and immature technology, however the potential
seems to be enormous. Performing electrolysis at high temperatures allows for a
highly favorable shift in reaction thermodynamics by introducing heat into the system
and effectively lowering overall energy requirements. Geothermal energy has shown
to be a viable heat source but requires a series of heat exchangers. Future technology
developments in concentrated solar power and geothermal drilling will determine the
role of HTE in future electrolytic industries and markets.
1.6 Electrolysis Conclusion and Future Perspectives
Hydrogen production methods from three water electrolysis techniques have
been presented above. The traditional alkaline and PEM electrolysis today are the
only commercially available technologies with HTE still in laboratory and pilot scale.
Despite being commercially available, alkaline and PEM are plagued by high-energy
requirements, consequently hindering these technologies from being economically
competitive with current and non-sustainable hydrogen production methods like
methane reformation. HTE is still under development, and this technology will
continue to attract much attention because of its thermodynamic advantages.
Lowering energy requirements is the main issue with electrolysis, and replacing
electrical energy with heat energy as HTE does is both novel and cost effective.
Alkaline electrolysis, despite its maturity and market saturation has comparatively
low efficiency operating parameters compared to other electrolysis technologies. PEM
and HTE clearly have higher performance capabilities however these are then
associated with high capital costs for PEM, while HTE is not yet commercially
available.
The future of electrolysis will continue to heavily depend on the demand for
hydrogen and the research and development progress made within these industries.
Demand will be influenced by a number of factors including progress in fuel cells,
hydrogen vehicles, syngas and renewable energy penetration. As progress is made, it
is expected that capital costs will decrease in the future.
In 2014, the United States Department of Energy stated that hydrogen
production costs will be under $4.90 by 2025. The European Union predicts between
$4-5 average across multiple countries by 203023
. Both of these estimates though
were calculated using mainstream grid electricity prices assumed to be generated by
nuclear or another non-sustainable feedstock. In reality, these prices can be lowered
by coupling electrolysis with renewable energy sources or by competing in electricity
spot markets as a flexible industrial entity that can help regulate electrical grids. In

12
order to do the latter, some more technical requirements are required for electrolyzers,
and reliable performance in necessary.
When a power disruption occurs, systems must respond quickly to reconcile
the imbalance. Thanks to smart grid equipment, signals can be sent very quickly, but
then it is up to the end receiver to read and perform the function. Therefore, machines
must be capable of reading these signals and responding immediately. The National
Renewable Energy Laboratory conducted a study to assess electrolyzer’s variable
operation performance, including tests on: response time and ramp rate after a load
change, frequency disturbance corrections and startup/shutdown times. Both PEM and
alkaline responded to load changes within milliseconds, demonstrated wide operating
range (10-90% capacity) and also showed capability of grid frequency restoration
during simulations on a mini-grid 24
.
These results indicate that electrolyzers have potential beyond just creating
hydrogen. Whether or not electrolyzers will be successful in grid stabilization will
heavily depend on the electricity markets, rate structures and guidelines put in place
by individual countries or governing regions. However, with the emergence of
intermittent renewable energy underway, it is clear that more options will be required
to balance energy supply with demand. The evidence suggests that electrolyzers can
be a solution to the growing energy infrastructure and can assist electrical grids in
maintaining balance and therefore a secure supply of electricity to all end users.
The next section of this paper will discuss the potential of electrolysis as an
electrical grid-balancing tool in the Icelandic electricity network. After conducting
research on the electrolysis technologies available for this, the next step forward is to
investigate whether or not an electrolysis plant competing in Iceland’s regulating
power markets can significantly lower hydrogen production costs.

13
Part 2:
Case Study

14
2.1 Introduction
A global initiative to combat climate change and reduce greenhouse gas
emissions has become of paradigm importance to most nations in the world today.
Perhaps the biggest contributor to reaching carbon emission goals is through the
development and utilization of renewable energy. Despite its good intentions,
increasing renewable energy capacity will require more ways to balance this energy
increase along national and international power grids.
An electricity grid must be kept properly in balance to ensure a safe and secure
supply of electricity to end-users. In theory, a perfectly functioning grid maintains
stability by matching electricity produced to the amount demanded in a particular grid
system. For example, a European TSO must maintain the nominal 50 Hz frequency
across a grid system as closely as possible to ensure smooth transmission and
distribution. It is of course impossible to perfectly forecast energy demand profiles
since daily fluctuations in consumer and industrial behavior often shift due to
unforeseen circumstances.
In cases where a grid is not in balance or a deviation from the nominal
frequency occurs, a grid operator must have mechanisms, like DSM techniques, at
their disposal to correct the fluctuation and restore harmony as quickly and smoothly
as possible. These options generally include power generators able to increase or
decrease production or energy intensive industries able to reduce their output or take
on excess energy in the grid and increase production. Depending on the scenario, and
the tactic deployed to restore grid harmony, energy is purchased, sold or traded in
energy spot markets developed by the energy authorities in that particular region.
In the next sections, an economical analysis will be detailed and analyzed to
estimate hydrogen production prices in Iceland for different capacity electrolysis
plants. The main goal of the analysis will be to determine the feasibility of an
electrolysis plant in lowering manufacturing costs by participating as a DSM
technology in Iceland’s regulating power market.
2.2 Hydrogen in today’s society
Current worldwide hydrogen production is around 600 billion m3/year, and is
used in a variety of industrial and chemical processes. Such processes include
hydrogenation of foods and oils, mixing with nitrogen to produce ammonia for
fertilizers and also as coolants in power plants because of hydrogen’s high heat
capacity. Almost all of hydrogen is produced from processes using fossil fuels, natural
gas and coal as feedstock.
In more recent times, hydrogen focus has shifted toward its potential as an
energy carrier. Hydrogen production from techniques like electrolysis and hydrogen
storage for electricity production via fuel cells are examples of such technologies that
can help make the switch towards sustainable energy and fuels. While our
understanding of fuel cells is not yet sophisticated enough for global deployment,
electrolysis is well understood and can be performed sustainably when using
renewable energy sources to power it. Recent focus has also shifted towards
electrolytic hydrogen production as an energy balancing mechanism in electrical
grids.
15
2.3 Electrical Network Balancing
Using the simple supply and demand theory, electrical grid operators attempt
to balance power consumption with power generation amongst a given transmission
and distribution system. This is done by energy forecasting, and attempts to use
mathematical models, historical data and operator experience to predict the short-term
and long-term changes in electricity demand. To do this perfectly is of course
unrealistic, because energy consumption can be sporadic and energy production can
become sporadic as well. Unpredictable changes in supply and demand behavior then
cause deviations from the designated 50 Hz frequency needed to be maintained in a
European electrical grid.
Whenever there is a deviation, or a change in frequency, a number of electrical
exchanges happens simultaneously in attempt to correct the imbalance as quickly and
coordinated as possible. Frequency deviations can change in both positive and
negative directions. A positive frequency refers to a situation when power production
exceeds demand at that point in time. A negative frequency therefore refers to when
power demand exceeds the power being supplied.
Failures in the power system, such as large power plant going offline, would
represent a large negative frequency deviation. When a situation like this arises, the
TSO must deploy reserve power in order to restore the grid to the nominal 50 Hz.
Reserve power can be broken into four categories and must be initiated in a timely
manner to minimize the impact of the frequency deviation. Each of the four categories
will be further explained along with requirements for these reserves as described by
European regulatory framework regarding reserve power25
.
2.3.1 Instantaneous Reserves
As the name indicates, this reserve acts immediately to restore the nominal
frequency, and is triggered by energy monitoring equipment that can relay quick
signals. This energy comes from the kinetic energy associated with the large rotating
masses still spinning yet slowing down (i.e. turbines and generators). Under normal
operating conditions, every single “large rotating mass” is synchronously spinning in
a given interconnected system. Therefore the available power in the instantaneous
reserve is restricted to the size of the overall system.
2.3.2 Primary Reserves
Also known as frequency containment reserves (FCR), primary reserves are
typically provided by large power generators. These reserves need to respond to a
TSOs signal within seconds, and must be able to provide both positive and negative
grid balancing depending on the TSOs request. FCR must be initiated within seconds
and must provide back up generation for up to 15 minutes.
The primary reserve aims to replace the lost frequency and restore the grid to
nominal conditions as quickly as possible. It does this by not only producing power
from large generators, but also by distributing the total reserve needed in equal
proportion to all power generators to ensure a synchronous power restoration amongst
all power producers in the overall system. Primary reserves are needed to establish a
steady rate constant amongst all generators to fulfill the imbalance.

16
2.3.3 Secondary Reserves
Also known as frequency restoration reserves (FRR), is next in line if the
frequency imbalance is not solved within 15 minutes. FRR take about 3-5 minutes to
start up and therefore are triggered during FCR to ensure smooth transition between
reserves. Typical FRR technologies include hydropower applications and are needed
to last at least 60 minutes.
FRR are selectively activated by TSOs in secondary control subsystems
depending on the location of the frequency imbalance. FRR takes over by calculating
the total work needed by the overall system to restore the imbalance and then
distributing this workload proportionally amongst its external neighboring secondary
control subsystems. Internally, the secondary control subsystems adapt either positive
or negative control power generation as turbine rates are calculated and adjusted to
match the rate of frequency increases from the secondary control subsystems. This
allows for primary reserves to be ready again for quick deployment if necessary.
2.3.4 Tertiary Reserves
By the time a tertiary reserve or “replacement reserve” is needed, offline or
idle power plants have had ample time (<60 minutes) to become operational. These
plants then take over and are required to provide balancing power for up to 4 hours or
until the original problem has been identified and appropriately dealt with.
The previous explanations of power reserves were used to illustrate an
example in which a negative frequency situation occurs and power is needed to be
restored in order to return the frequency to the nominal 50 Hz operating frequency.
It is important to understand that the opposite can occur as well. In a positive
frequency deviation, differing rates of consumption will lead to power supply being
greater than demand. These can be attributed to deviations from expected
consumption estimates all across an electrical grid area, and during positive frequency
times, a TSO must be able to reduce consumption across a grid area in order to restore
equilibrium.
It is important that these reserves are well maintained and functioning properly
because of how quickly they can be called upon and at varying degrees. All together,
these reserves must have enough capacity to withstand the longest expected grid
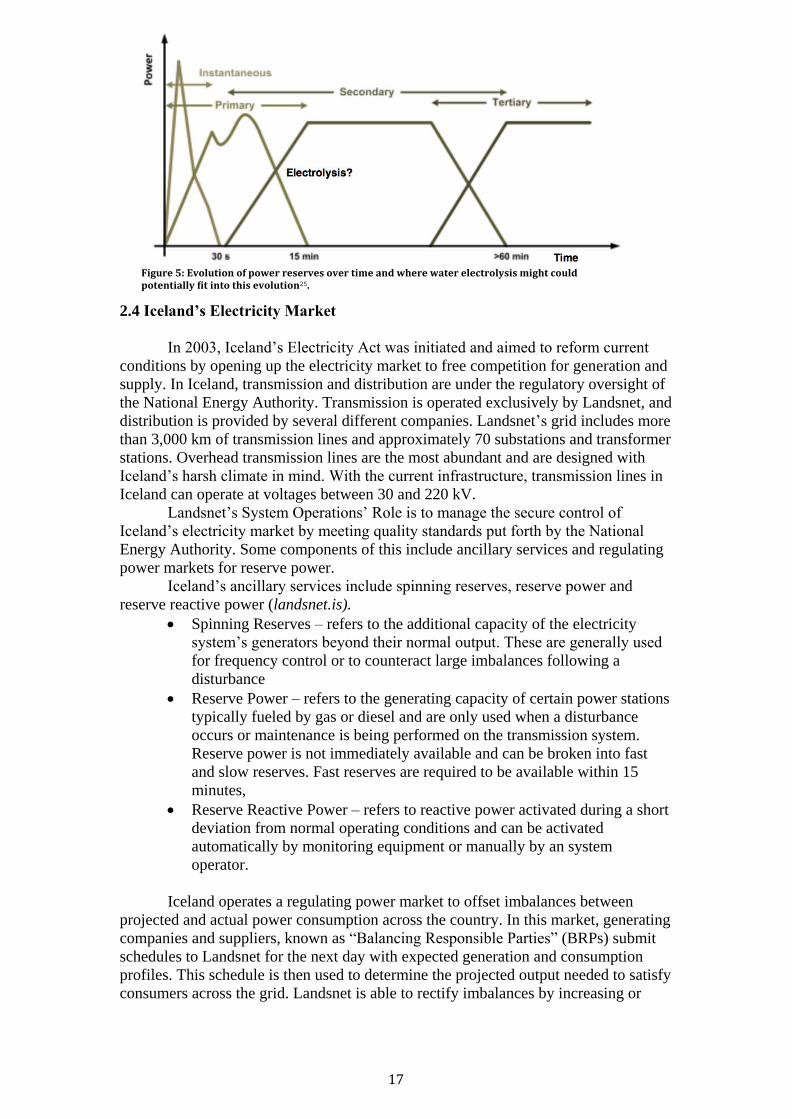
failure, in order to keep a secure supply of electricity flowing to end users. Figure 5
shows the general principle in which power reserves are called upon and summarizes
the above sections on reserve power. It is important that at the end of a reserves
capacity, the next reserve is already functioning properly enough to take the
responsibility from that point.
17
2.4 Iceland’s Electricity Market
In 2003, Iceland’s Electricity Act was initiated and aimed to reform current
conditions by opening up the electricity market to free competition for generation and
supply. In Iceland, transmission and distribution are under the regulatory oversight of
the National Energy Authority. Transmission is operated exclusively by Landsnet, and
distribution is provided by several different companies. Landsnet’s grid includes more
than 3,000 km of transmission lines and approximately 70 substations and transformer
stations. Overhead transmission lines are the most abundant and are designed with
Iceland’s harsh climate in mind. With the current infrastructure, transmission lines in
Iceland can operate at voltages between 30 and 220 kV.
Landsnet’s System Operations’ Role is to manage the secure control of
Iceland’s electricity market by meeting quality standards put forth by the National
Energy Authority. Some components of this include ancillary services and regulating
power markets for reserve power.
Iceland’s ancillary services include spinning reserves, reserve power and
reserve reactive power (landsnet.is).
Spinning Reserves – refers to the additional capacity of the electricity
system’s generators beyond their normal output. These are generally used
for frequency control or to counteract large imbalances following a
disturbance
Reserve Power – refers to the generating capacity of certain power stations
typically fueled by gas or diesel and are only used when a disturbance
occurs or maintenance is being performed on the transmission system.
Reserve power is not immediately available and can be broken into fast
and slow reserves. Fast reserves are required to be available within 15
minutes,
Reserve Reactive Power – refers to reactive power activated during a short
deviation from normal operating conditions and can be activated
automatically by monitoring equipment or manually by an system
operator.
Iceland operates a regulating power market to offset imbalances between
projected and actual power consumption across the country. In this market, generating
companies and suppliers, known as “Balancing Responsible Parties” (BRPs) submit
schedules to Landsnet for the next day with expected generation and consumption
profiles. This schedule is then used to determine the projected output needed to satisfy
consumers across the grid. Landsnet is able to rectify imbalances by increasing or
Figure 5: Evolution of power reserves over time and where water electrolysis might could potentially fit into this evolution25.

18
decreasing power output from BRPs. The balancing energy is traded in the regulating
power market and priced at market rates for each hour throughout the day.
BRPs submit bids into the market for either up-regulation (increasing
generation) or down-regulation (reducing generation) or both depending on the
capacity and capability of the BRP entity. The bids are valid for one hour and are
accepted in merit order. In the case of up-regulation, a BRP specifies a price to be
paid by Landsnet to the power generator. For down-regulation, a BRP states a price
that will be payable to Landsnet.
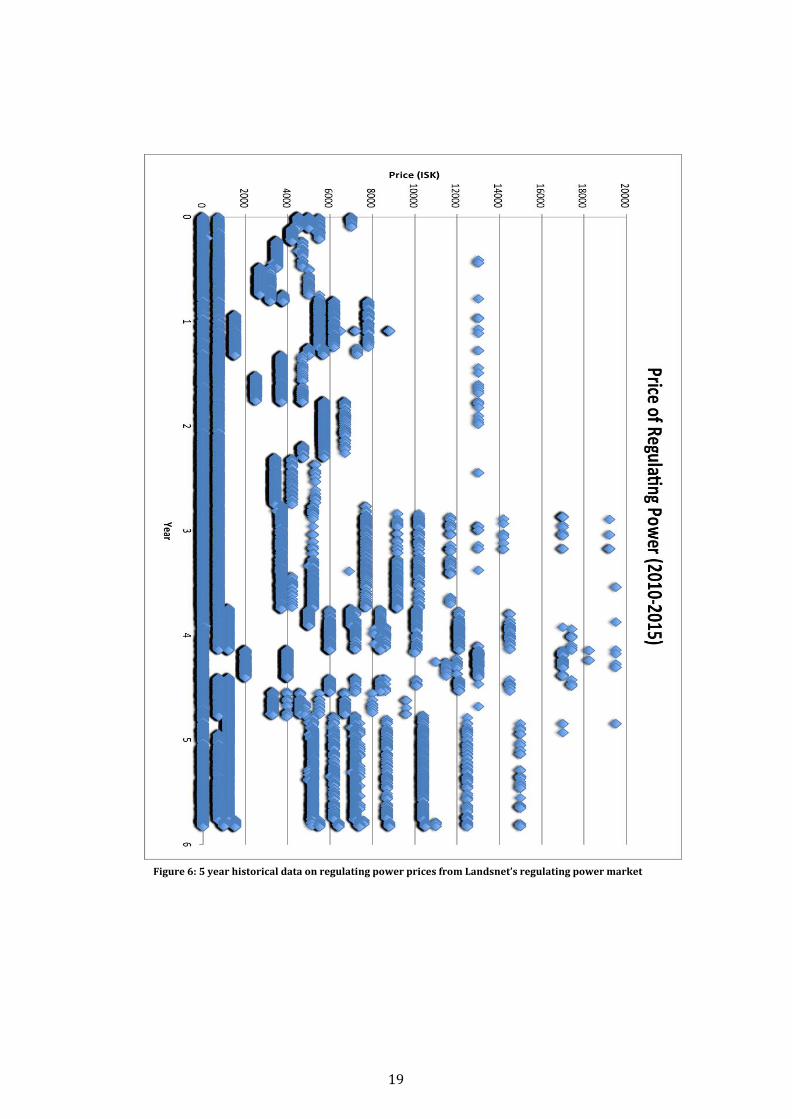
Historic regulating power prices are presented in Figure 6 for a five-year
period (2010-2015). This study used only prices from 2015, and it can be seen that
prices for up-regulation typically were higher than 4000 ISK/MWh and around 2000
ISK/MWh for down-regulation.
19
Figure 6: 5 year historical data on regulating power prices from Landsnet’s regulating power market

20
2.5 Renewable Energy Installed Capacity
If we think about the supply and demand theory of energy further, it is
important to factor in forecasts for renewable energy installed capacity. Driven by the
idea of global decarbonization, many more renewable energy technologies are slated
to come on line. When referring to solar and wind power technologies, it is crucial to
remember that these technologies are primarily dependent on weather conditions and
therefore are not always producing electricity at constant rates like generators using
other feedstock like coal, natural gas, hydro or geothermal. This means that more
balancing power will be needed to account for weather dependent production
variations that are seen in these technologies. Nevertheless, the increased capacity can
be dealt with in two ways: Increase infrastructure for larger electrical grids or by
implementing storage capacity to manage future installed capacity. The first would be
to build additional transmission and network infrastructure, which would result in
more power lines, transformers, sub stations etc. This option may face public
resistance and can often be costly as the price of a 380 kV power line can be up to 1
million €/km26
. The second way is through the use of fuel cells or flexible technology
like electrolysis that can be used as energy storage and also produce a valuable
product like hydrogen during times of electrical grid stabilization. The latter is known
as a DSM technique, and is of growing interest amongst energy mangers all across the
world for managing electricity efficiently.
2.6 Water Electrolysis
In 2014, the United States Department of Energy (DOE) Hydrogen and Fuel
Cells program conducted a study to estimate the hydrogen production cost from PEM
electrolysis. Prior to this, the DOE created a Hydrogen Analysis (H2A) model for
estimating production costs, and used this model to analyze the economics of four
case studies.
The four case studies were based off of current (2013) and future (2025)
electrolyzer technologies and distributed forecourt (500-1,500 kg/day) and centralized
(50,000 kg/day) plant capacity schemes. The current electrolyzer case assumed
operation at 1,500 mA/cm2 and 450-psi outlet pressure. The future case assumed
1,600 mA/cm2 and 1000-psi outlet pressure. The hydrogen production costs for each
case are summarized below. The prices were reported in 2007 dollars and converted
using a web-based inflation calculator to the price in 2015 dollars.
Current Forecourt - $5.90 kg/H2
Future Forecourt - $4.85 kg/H2
Current Centralized - $5.87 kg/H2
Future Centralized - $4.82 kg/H2
The H2A model also included sensitivity analyses, and showed that H2 costs
could be reduced $0.08-$0.09/kg for every 1 kWh/kg net energy reduction. Tornado
charts examined the impact of individual parameters on H2 costs as a single variable
sensitivity analysis, and in all four cases suggested that electricity price is the single
most impactful parameter for H2 production 27
.
It is interesting to note that the DOE did not use renewable electricity in this
report. Therefore, it is fair to assume some reduction in these prices if they had used a
renewable energy source. Another way to possibly reduce production prices for

21
hydrogen is to compete in electricity spot markets where energy can be purchased,
sold or traded. Depending on a number of factors particularly geographic location,
transmission and distribution guidelines, it can be possible to compete in electricity
spot markets as a Demand Side Management (DSM) technique.
2.7 Demand Side Management (DSM)
The idea of DSM has been around since the 70s and is now more important
than ever due to the evolution and coupling with smart grid technology. Being hooked
into a network of sophisticated metering and analysis tools, electricity customers can
really take into account their energy consumption and use information from smart
grids to make decisions about energy use. The idea of being able to control end usage
is a fundamental pillar in DSM.
DSM broadly refers to two principal activities, which gives end users more
involvement in their energy consumption by allowing them to shift their own demand
during peak periods and/or reduce their overall consumption. These two principals are
‘load shifting’ or energy efficiency and conservation programs28
.
Load shifting is a demand response technique where consumers can offer up
their individual electrical load during high demand periods. This shift can be daily or
during high demand periods throughout a year, depending on the willingness of the
consumer to curtail their personal demand. Load shifting therefore flattens the overall
load curve and allows for electricity to be generated by the least expensive suppliers.
Load shifting can be done in primarily three ways be reducing, increasing or
shifting consumption. When a load is reduced, this is commonly known as “peak
clipping.” When a load is increased, this is known as “valley shifting.” The three
types of load shifting are illustrated in Figure 7 and these variations provide
alternatives to storing electricity25
.
Energy efficiency and conservation programs also work as DSM techniques
and aim to have customers reduce their electricity consumption and save money by
doing so. These programs target appliances like air-conditioning units or refrigerators
to reduce overall yearly consumption. Coupling smart grid technology with DSM
techniques like energy efficient refrigerators etc. is propelling these technologies
Figure 7: Graphical representations of DSM techniques (powerwise.gov.ae)

22
towards further global integration. Smart grid technology can allow for real time
monitoring of energy consumption, and can allow customers and other energy
conscious entities to make smart and informed decisions about reducing consumption,
and ultimately save money.
DSM in the form of load shifting has the potential to be used in grid balancing,
frequency stabilization and in other facets in order to maintain electrical grid balance
and harmony. An economic analysis of electrolysis DSM in Germany has been
performed and suggested that DSM operations such as electrolysis would be
competitive in tertiary reserve power markets 29
. Currently, the wood pulp industry
performs the majority of load shifting in Germany to meet grid-balancing needs due
to its low opportunity costs and load bearing flexibility.
Spanish researchers investigated grid balancing by large-scale integration of
hydrogen technologies in the underutilized Spanish electrical grid. The study
identified a ‘critical ratio’ to determine the power generation for given demands
according to daily demand curve profiles and how much of this can be regulated by
hydrogen. The results suggested that as much as 42% of energy in the Spanish system
could be regulated by decarbonized sources such as large-scale hydrogen
production30
A related study suggested that in using electrolysis to produce hydrogen
as a grid balancing technique, Spanish utilities could multiply the amount of
electricity regulated without adding capacity31
. Future scenario analyses performed by
British researchers looked at possible UK energy supply pathways up until 2050. All
of the scenario results suggested that if the UK were to avoid being heavily dependent
on imported fossil fuels, then large amounts of hydrogen would need to be produced
by electrolysis using excess energy from the UK’s electrical grid. The UK therefore
views electrolysis as a beneficial DSM technique and predict it could be a common
practice by 203032
. Applying DSM in the UK electrical grid opens up opportunities to
reduce generation margin, improve transmission and distribution functions and drive
investment costs downward. It is also expected that applying DSM in the UK will
lead to more improvements in communication technology along the grid and relieve
stress on the aging grid and infrastructure in place33
. NREL was able to demonstrate
the effectiveness of electrolyzers acting as demand response devices due to fast
response rates and long durations. The exceptional operational performance led the
researchers to claim that at least all PEM electrolyzers should qualify to participate in
all regulation and reserve energy markets24
.
A MATLAB SIMULINK model was developed of a steam turbine
generation unit and simulated a scenario in which a sudden loss of generation
occurred and an electrolysis unit was used to stabilize the grid’s frequency. The
results showed that a pressurized alkaline electrolysis unit could respond sufficiently,
even without a spinning reserve as a backup in the system. The same research team
also suggested that pressurized alkaline electrolysis when used as a dynamic demand
response technology could help in the reduction of spinning reserves required to
support an electrical power system34
. Life cycle assessments were performed on two
power to gas scenarios being considered in Canada. Hydrogen storage systems linked
to wind and hydroelectric power were proposed and their global warming potential
(GWP) was calculated. It was noted that emissions are only accumulated in the
construction/production portion of the project, as emissions are negligible during
operation. The total GWP for the wind dependent system was 152x106 kg CO2
equivalent over its entire lifetime (20 year assumption) compared to a measured GWP
for a typical coal power plant is 964 g CO2 eq/kWh35
.

23
The above examples from previous research demonstrate that electrolytic
hydrogen production is a clean and sustainable DSM or grid balancing technique.
Hydrogen is an easily produced medium with the capability to generate and regulate
electricity through load shifting. Research from European countries suggest that
electrolysis, regardless of the hydrogen’s end use will be pivotal in future energy
infrastructure. The implementation of electrolysis will strongly depend on regulatory
energy authorities and the available spot markets for DSM technologies like
electrolysis to be competitive in. Expected challenges for DSM include lack of
advanced metering, control and communication methods as well as undeveloped or
inadequate market structures. There is also a notion that DSM technologies will add a
degree of complexity to the system operation as compared to traditional operating
standards33
.
METHODS
2.8 Electrical Grid System Boundaries
In order to discuss methods to assist electrical grids, it is important to first
understand the European electrical grid in general and highlight some challenges that
need to be addressed for a continued secure electrical network. An electrical grid can
be broken down into transmission networks and distribution networks, and European
electrical grids are kept at a constant 50 Hz. The task is to manage this 50 Hz
effectively between the transmission and distribution networks in order to maintain
complete system balance. The transmission system boundaries are defined by the
transmission lines and the substations where transformers step the power down to the
lower voltage distribution lines. Europe’s transmission networks are typically
operated at 400 kV and can span across many regions or countries. The distribution
system is then responsible for taking the lower voltage power from the transmission
lines and carrying it on to the end consumer. The system boundary for this can be
defined as the entire infrastructure necessary to move energy from the physical
connection with the transmission system to the furthest expected customer in the
distribution systems coverage area. These include low, medium and high voltage
distribution lines.
2.8.1 Electrolysis Review
A literature review was performed to collect information on hydrogen
production processes from renewable energy including geothermal. Electrolysis was
selected as the focus due to its wider applicability, mature technology and also
emerging potential. Other hydrogen production processes considered were
thermochemical cycles and hydrogen liquefaction however these were dismissed due
to high heat requirements that geothermal cannot regularly produce. The literature
review revealed that three electrolysis techniques were the most researched and
documented, and therefore they were chosen as the primary focus of the research.
These include Alkaline, PEM and HTE electrolysis. Other specialized technologies
like Anion Exchange Membrane (AEM) were not included because there was a lack
of information and recognition as a useful electrolysis technique. During the research
on the different types of electrolysis, sources were analyzed for performance
24
parameters, cost and real world applications. Special emphasis was placed on
performance in order to be candidates as an applicable DSM technique.
2.8.2 Case Study
Essentially, a model was created using Excel, to show hydrogen production
prices per kg as a function of bidding additional capacity in Iceland’s regulating
power market. The control variable was considered as each case’s hydrogen
production price as a function of not participating in the regulatory power market and
therefore not generating revenue. Other models exist such as the Department of
Energy’s H2A model, however it was determined that a simpler model would be
sufficient to estimate production hydrogen production prices. The H2A model
considered revenue from hydrogen selling and also assumed either compression or
storage for hydrogen vehicle gas stations. There was no profit from hydrogen sales
calculated into the model and neither end use assumed in the H2A was comparable to
the hydrogen’s end use intended in this study.
A constant dialogue was maintained with companies involved in this research
including Landsvirkjun, Landsnet and the Iceland Innovation Center, all located in
Reykjavik, Iceland. Data was obtained from a publicly available database on
Landsnet’s website. Relevant data included the price of electricity per MWh for each
hour of an entire year (November 1, 2014 to October 31 2015). These values were
plotted in Excel and graphed with a scatterplot to visually see the prices per year and
any correlations that may be associated. Another scatter plot, Figure 6 was also
created with five years (2010-2015) worth of price data to be analyzed for up and
down regulation trends.
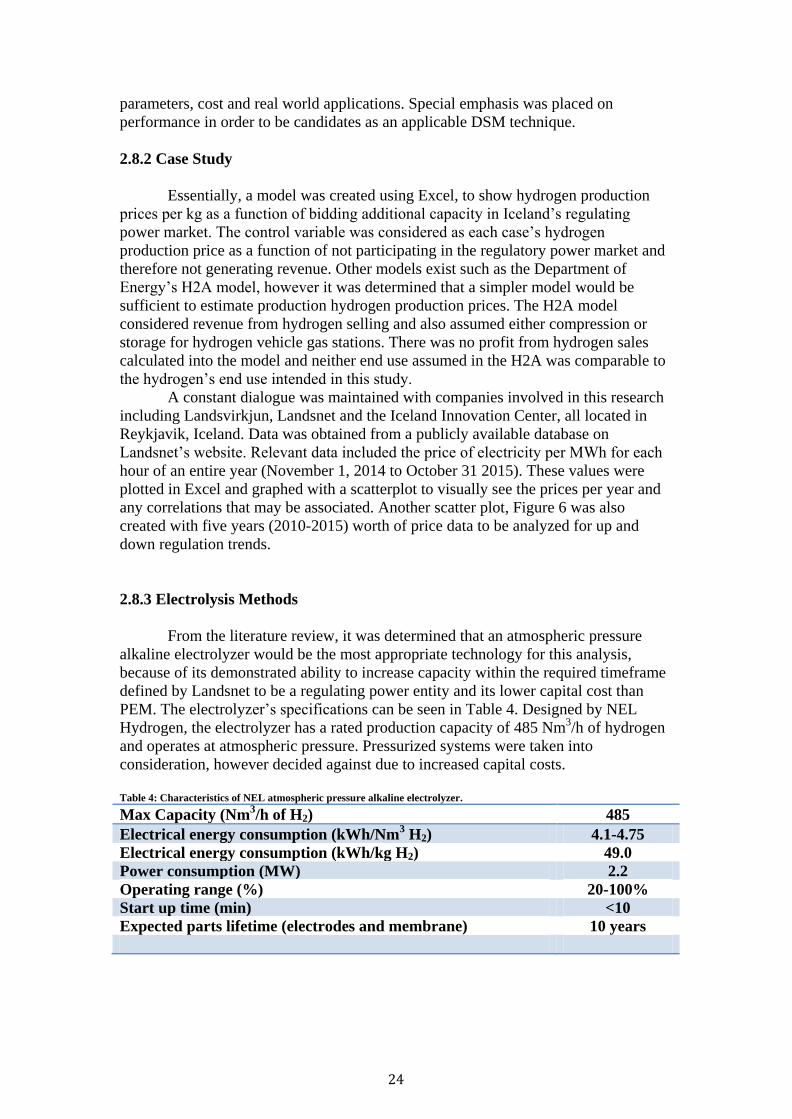
2.8.3 Electrolysis Methods
From the literature review, it was determined that an atmospheric pressure
alkaline electrolyzer would be the most appropriate technology for this analysis,
because of its demonstrated ability to increase capacity within the required timeframe
defined by Landsnet to be a regulating power entity and its lower capital cost than
PEM. The electrolyzer’s specifications can be seen in Table 4. Designed by NEL
Hydrogen, the electrolyzer has a rated production capacity of 485 Nm3/h of hydrogen
and operates at atmospheric pressure. Pressurized systems were taken into
consideration, however decided against due to increased capital costs.
Table 4: Characteristics of NEL atmospheric pressure alkaline electrolyzer.
Max Capacity (Nm3/h of H2) 485
Electrical energy consumption (kWh/Nm3 H2) 4.1-4.75
Electrical energy consumption (kWh/kg H2) 49.0
Power consumption (MW) 2.2
Operating range (%) 20-100%
Start up time (min) <10
Expected parts lifetime (electrodes and membrane) 10 years

25
Operation is assumed to remain at 80 C and use 25% KOH electrolyte solution in the
cell. The four cases studied, described in Table 5 were then identified on the based on
the number of electrolyzers.
Using both Excel models in conjunction, arbitrary prices were entered to show
a hypothetical scenario in which it would be favorable for the electrolysis plant to bid
in the regulating power market for either up or down regulation. During periods in
which the electrolysis plant is not submitting bids, or a submitted bid is not accepted,
capacity was assumed to be at 100%, and therefore producing 485 Nm3 hydrogen gas
per hour and consuming on average 4.75 kWh/Nm3 for the single electrolysis unit
case. If a bid is accepted, the capacity is assumed to be 20%, thus producing 97 Nm3
hydrogen per hour and consuming on average 4.10 kWh/Nm3 for the single
electrolysis unit case. Figure 8 shows the electricity consumption rates assumed
through different operating electric currents over the electrolyzer’s expected lifetime.
From Figure 8, it is assumed that energy consumption in year 5 will be used as an
average for the lifetime of the electrodes and membranes in the electrolysis unit.
The NEL alkaline electrolyzer was partly chosen because of its relatively
quick start up time and its demonstrated ability to perform at 20-100% capacity. This
then allowed the analysis to utilize the 80% capacity in between for regulating power
via submitted and accepted bids. It is assumed that production will be continuous and
therefore never lower than 20% operation.
Number of electrolyzers 1 5 10 20
Power consumption (MW) 2,3 11,5 23 46
Production capacity (Nm3/h) 485 2.250 4.500 10.000
Figure 8: NEL electrolyzer approximate energy consumption.
Table 5: Cases studied for analysis.
26
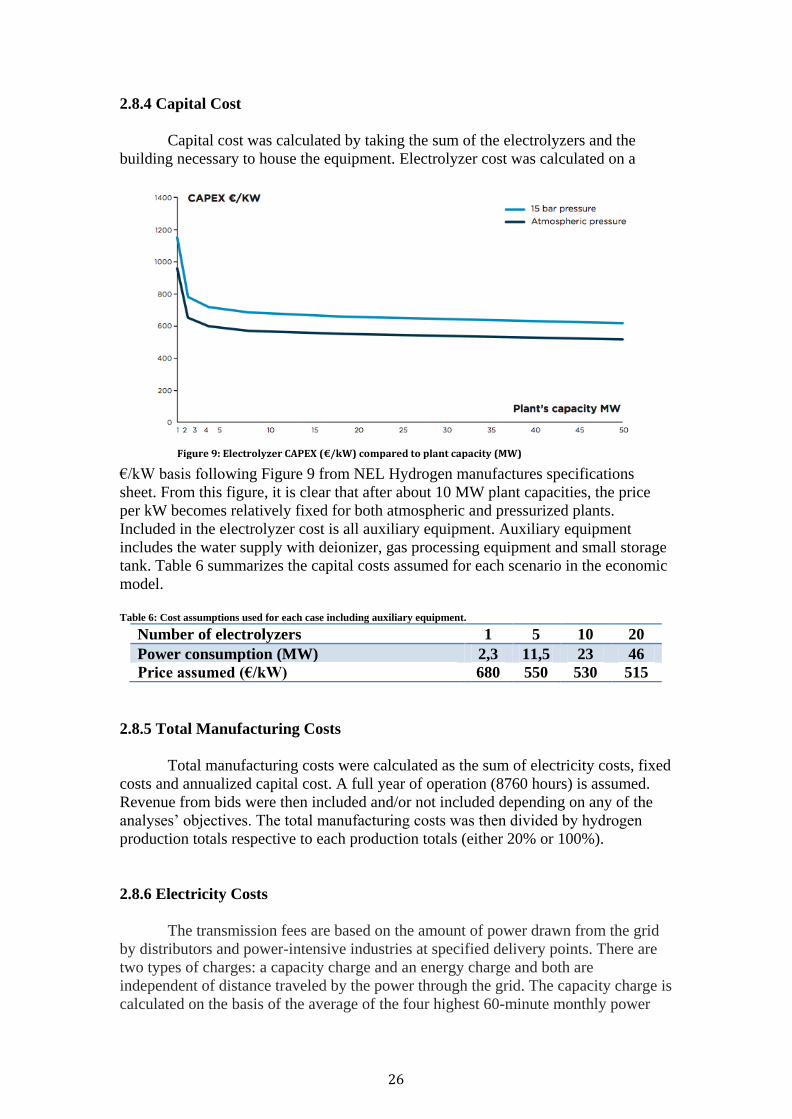
2.8.4 Capital Cost
Capital cost was calculated by taking the sum of the electrolyzers and the
building necessary to house the equipment. Electrolyzer cost was calculated on a
€/kW basis following Figure 9 from NEL Hydrogen manufactures specifications
sheet. From this figure, it is clear that after about 10 MW plant capacities, the price
per kW becomes relatively fixed for both atmospheric and pressurized plants.
Included in the electrolyzer cost is all auxiliary equipment. Auxiliary equipment
includes the water supply with deionizer, gas processing equipment and small storage
tank. Table 6 summarizes the capital costs assumed for each scenario in the economic
model.
Table 6: Cost assumptions used for each case including auxiliary equipment.
Number of electrolyzers 1 5 10 20
Power consumption (MW) 2,3 11,5 23 46
Price assumed (€/kW) 680 550 530 515
2.8.5 Total Manufacturing Costs
Total manufacturing costs were calculated as the sum of electricity costs, fixed
costs and annualized capital cost. A full year of operation (8760 hours) is assumed.
Revenue from bids were then included and/or not included depending on any of the
analyses’ objectives. The total manufacturing costs was then divided by hydrogen
production totals respective to each production totals (either 20% or 100%).
2.8.6 Electricity Costs
The transmission fees are based on the amount of power drawn from the grid
by distributors and power-intensive industries at specified delivery points. There are
two types of charges: a capacity charge and an energy charge and both are
independent of distance traveled by the power through the grid. The capacity charge is
calculated on the basis of the average of the four highest 60-minute monthly power
Figure 9: Electrolyzer CAPEX (€/kW) compared to plant capacity (MW)

27
peaks of the year for each delivery point. The energy charge is calculated from each
MWh transmitted via Landsnet’s grid. A fixed annual delivery charge is payable for
all supply/delivery points connected to the grid, whether for power supplied into or
drawn from it. There is also a charge for ancillary services and transmission losses, at
a fixed amount per each kWh drawn from the grid. The purpose of this charge is to
cover the expense of Landsnet’s purchasing of these services at any given time. The
tariff for consumption by power-intensive industries is in US dollars. Table 7 shows
the electricity costs and tariffs assumed in the financial model. All tariff prices were
publicly available online at Landsnet’s website, and electricity price was assumed to
be about 43$/MWh.
Table 7: Electricity costs and tariffs assumed in financial model
Electricity from grid (€/MWh) 40
Transmission capacity charge ($/year) 55.395
Transmission delivery charge ($/MW/year) 32.268
Transmission energy charge ($/MWh) 1.63
Ancillary service charge (€/MWh) 0.33
Transmission losses charge (€/MWh) 0.63
2.8.7 Fixed Costs
Fixed costs assumed were for maintenance, insurance and permits, as well as
operating personnel. Maintenance and permitting costs were assumed to be 1.5% of
total CAPEX based on EU recommendations. Personnel costs were assumed to be
€55,000 fixed salary to each operator. At maximum 4 operators were assumed to be
necessary for the larger plants to maintain round the clock operation. Annualized
capital cost was calculated and numerically describes the cost to purchase, install,
maintain and later dispose of the asset over its lifetime. A 6% interest rate over a 20-
year period was assumed and taken into consideration for this calculation, which was
then added to the total production cost. Revenue is also generated from simply
agreeing to be a regulating power entity, and therefore an additional 436 ISK/MWh
for remuneration is included in calculations.
2.8.8 Model Limitations
One of the problems with the methodology is that the excel model assumes
that all bids are accepted in the calculations. This presents then a most optimistic
analysis of these electrolysis cases. It is of course, inappropriate to assume that the
regulatory power market will accept every bid submitted from this particular
electrolysis plant. Therefore it is necessary to factor some real world scenarios into
this economic evaluation. One way to do so is to say that a percentage of bids would
be accepted. Calculations were made to show the prices if 75%, 50%, and 25% of the
bids were actually expected. These percentage scenario approaches were used in this
research to add more realism to the cases studied and as a comparison to the most
optimistic scenario, which is the main focus of this research. It is also assumed that
Iceland’s regulating power market has enough room to absorb the addition of capacity
up to the largest case study at 46 MW, which may be unrealistic since up regulating
power is seldom more than 20 MW.

28
Results
2.9 CAPEX
From the NEL capital costs graph mentioned above, see Figure 9, CAPEX was
calculated for each scenario. Table 8 shows the associated CAPEX for the four size
scenarios studied in this analysis.
Table 8: CAPEX associated with the different proposed case studies
No. of electrolyzers 1 5 10 20
Electrolyzer max power (MW) 2,3 11,5 23,0 46,1
Area of building (m2) 150 667 1334 2668
Cost of installed electrolyzer with
auxiliary equipment (€/kW)
680 550 530 515
No. of operators 1 2 2 4
CAPEX eletrolyzers
Electrolyzers with auxiliary
equipment (€)
1.566.550 6.335.313 12.209.875 23.728.625
Building* (€) 160.256 712.607 1.425.214 2.850.427
Total CAPEX electrolyzers 1.726.806 7.047.919 13.635.089 26.579.052
* Building cost of 150.000 ISK/m2 is assumed
As would be expected, larger capacity plants with more electrolysis units will
have a higher capital cost and will need more personnel on site to maintain constant
operation. What is unique to these scenarios is that there is a very small benefit from
scaling up in terms of the price of electrolyzer per kW. There is a large decrease
between one unit and five units, however after five units, the price does not reduce
much with added capacity. This suggests that the five to ten unit range may be ideal
candidates for further evaluation. It is also important to notice that the majority of the
capital costs are in the electrolyzer and not in the building or other infrastructure
needed. More specifically, the majority of the electrolyzer cost is in the cell, and it is
anticipated that these costs will go down in the future with further cell development.
The numbers indicate that an electrolyzer plant with 5 electrolyzers is also more in
line with the regulating power needed in the Icelandic context.
2.9.1 Electricity Charges
The price of electricity from the grid is kept constant at 40€/MWh from
Landsvirkjun. Table 9 presents the amount expected for wholesale electricity from the
grid for each scenario for an entire year of operation.
Table 9: Wholesale electricity costs for each case assuming operation at 100% capacity and 8760 hours per year and
electricity price of 40€/year
Number of electrolyzers 1 5 10 20
Electricity cost €/year 805.920 4.029.600 8.059.200 16.118.400
Other electricity charges associated are presented in Tables 10 and 11. These prices
are unavoidable and will be charged by Landsnet throughout the lifetime of the
operation. The delivery charge is the same for all the scenarios and the rest of the

29
costs increase as capacity increases. From the table it can be seen that as the number
of electrolysis units increases, the total amount of tariff’s decreases per MWh.
Table 10: Additional electricity charges expected for each case assuming operation at 100% capacity and 8760 hours per
year
Number of
electrolyzers
1 5 10 20
Rated Capacity
(MW)
2,3 11,5 23 46
Transmission charges
Delivery charge 55.395 USD/year 55.395 55.395 55.395 55.395
Capacity charge 32.268 USD/MW/yea
r 74.216 371.082 742.164 1.484.328
Energy charge 1,632 USD/MWh 32.882 164.408 328.815 657.631
SUM USD/year 162.493 590.885 1.126.374 2.197.354
EUR/year 153.442 557.974 1.063.638 2.074.965
EUR/MWh 7,62 5,54 5,28 5,15
Table 11: Ancillary Service and Transmission losses charges for each case assuming operation at 100% capacity and 8760
hours per year
Rated Capacity (MW) 2,3 11,5 23 46
Ancillary Service (45,64 ISK/MWh)* 6.550 32.748 65.495 130.991
Transmission Losses (87,87 ISK/MWh)* 12.610 63.049 126.097 252.194
Sum (€) 19.159 95.796 191.593 383.185
*Prices calculated in ISK then converted to €

30
Table 12: Excel spreadsheet including all parameters used for cost analysis and displaying manufacturing costs without
revenue (highlighted in yellow)
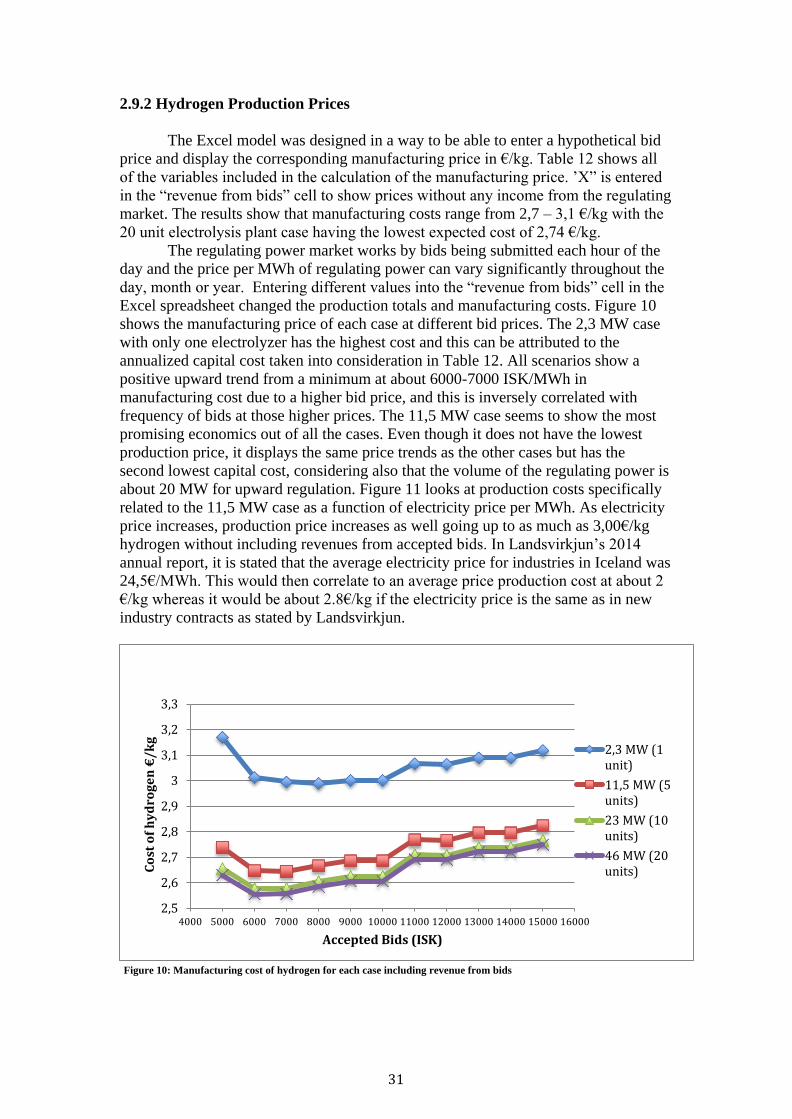
31
2.9.2 Hydrogen Production Prices
The Excel model was designed in a way to be able to enter a hypothetical bid
price and display the corresponding manufacturing price in €/kg. Table 12 shows all
of the variables included in the calculation of the manufacturing price. ’X” is entered
in the “revenue from bids” cell to show prices without any income from the regulating
market. The results show that manufacturing costs range from 2,7 – 3,1 €/kg with the
20 unit electrolysis plant case having the lowest expected cost of 2,74 €/kg.
The regulating power market works by bids being submitted each hour of the
day and the price per MWh of regulating power can vary significantly throughout the
day, month or year. Entering different values into the “revenue from bids” cell in the
Excel spreadsheet changed the production totals and manufacturing costs. Figure 10
shows the manufacturing price of each case at different bid prices. The 2,3 MW case
with only one electrolyzer has the highest cost and this can be attributed to the
annualized capital cost taken into consideration in Table 12. All scenarios show a
positive upward trend from a minimum at about 6000-7000 ISK/MWh in
manufacturing cost due to a higher bid price, and this is inversely correlated with
frequency of bids at those higher prices. The 11,5 MW case seems to show the most
promising economics out of all the cases. Even though it does not have the lowest
production price, it displays the same price trends as the other cases but has the
second lowest capital cost, considering also that the volume of the regulating power is
about 20 MW for upward regulation. Figure 11 looks at production costs specifically
related to the 11,5 MW case as a function of electricity price per MWh. As electricity
price increases, production price increases as well going up to as much as 3,00€/kg
hydrogen without including revenues from accepted bids. In Landsvirkjun’s 2014
annual report, it is stated that the average electricity price for industries in Iceland was
24,5€/MWh. This would then correlate to an average price production cost at about 2
€/kg whereas it would be about 2.8€/kg if the electricity price is the same as in new
industry contracts as stated by Landsvirkjun.
Figure 10: Manufacturing cost of hydrogen for each case including revenue from bids
2,5
2,6
2,7
2,8
2,9
3
3,1
3,2
3,3
4000 5000 6000 7000 8000 9000 10000 11000 12000 13000 14000 15000 16000
Co
st o
f h
yd
rog
en
€/
kg
Accepted Bids (ISK)
2,3 MW (1unit)
11,5 MW (5units)
23 MW (10units)
46 MW (20units)

32
Figure 11: Production price as a function of electricity price per MWh for the 11,5 MW (5 unit) case
2.9.3 75%, 50%, 25% Scenarios
Figure 12 shows the results of the scenarios that were applied in an attempt
using a self-developed method to make the data more realistic. As expected, the larger
the percentage of bids submitted that are accepted yields the lowest manufacturing
costs at a 6000 ISK bid scenario. All of the scenarios still resulted in prices being
mainly below 3€/kg.
2.9.4 Wholesale Electricity Price
Manufacturing costs including bid revenue are presented in Figure 13 from a
wholesale electricity cost point of view. All of the electricity prices show a distinct
rise around the 10.000 ISK mark and exhibit positive slopes as bids become higher.
The two highest electricity price cases (35 and 40 MW) show decreasing prices
between the 5000 and 6000 ISK bid prices due to the frequency of bids at this price
indicating cheap up-regulation.
0
0,5
1
1,5
2
2,5
3
20 25 30 35 40
Co
st o
f h
yd
rog
en
(€
/k
g)
Electricity price (€/MWh)
0
0,5
1
1,5
2
2,5
3
3,5
4
1 5 10 20
Co
st o
f h
yd
rog
en
(€
/k
g)
Number of Electrolysers
75%
50%
25%
Figure 12: Reality scenarios at 75%, 50% and 25% including revenue from 6000 ISK bids

33
Figure 13: Manufacturing price at different wholesale electricity prices including revenue from bids
2.9.5 Historical Regulating Power Market Prices and Trends
Regulating power market prices are provided on Landsnet’s website in a
database. Figure 14 shows the prices for each hour for five years (2010-2015). Two
separate trends from the data can be observed. Two zones can be seen clearly in the
scatterplot. The first zone includes lower prices <3000 ISK and these are attributed to
bids for down regulation, or when the electrical grid has too much supply and not
enough demand. Higher prices >3000 ISK indicate bids for up regulation where there
is not enough supply to match demand. In this up-regulation scenario, the
electrolyzers in this study would send power back into the grid with a submitted bid
into the regulating power market. From this scatterplot it is clear that over the years
the prices for regulating power have been increasing especially in the up-regulation
market. This suggests that as bid price increases, frequency of bids at that price may
increase as well, and this would significantly benefit the electrolysis plants in this case
study by having lots of high price bids available for the regulating power market.
2.10 Discussion/Conclusion
In the future, as renewable energy penetration increases and hydrogen demand
increases as well, water electrolysis technologies could serve as flexible energy
balancing mechanisms that simultaneously produce gaseous hydrogen.
Alkaline electrolysis has shown capability as a DSM technique, and it is very
likely that DSM techniques will be necessary in the future as society aims to reduce
consumption. The IEA Demand Side Management Program (IEADSM) is a task force
program that was developed by the IEA under the framework of the Economic
Cooperation and Development (OECD). The program currently consists of 25
member countries and its primary aim is to research, develop and demonstrate new
and energy efficient end use schemes. Participating countries acknowledge goals in
the form of Energy Efficiency Obligations (EEO) contracts. An EEO therefore
operates as a regulatory mechanism that pushes a country to meet energy saving
targets by implementing end-use energy efficiency measures. Currently, Iceland is not
involved in the IEADSM. Despite Iceland’s exceptional renewable energy profile,
0
0,5
1
1,5
2
2,5
3
0 5000 10000 15000 20000
Co
st o
f h
yd
rog
en
(€
/k
g)
Bids (ISK)
20 €/MWh
25 €/MWh
30 €/MWh
35 €/MWh
40 €/MWh

34
participating in such a program could still be beneficial particularly in efficient end-
use schemes.
A financial model of water electrolysis as a DSM technique has been created
to estimate hydrogen production costs from alkaline electrolysis while competing in
Iceland’s regulatory power market. A literature review of current electrolysis
technologies was also performed in order to select an appropriate electrolysis
technology for the financial assessment. Atmospheric alkaline electrolysis was chosen
over PEM and HTE because of its lower capital cost and fast start up and response
times. Landsnet defines that an energy regulating entity must be able to meet TSO
requests in less than 10 minutes, and the chosen technology has proven to be able to
do so. Results indicate that without revenue from bids, manufacturing costs range
from 2,7-3,1 €/kg. Including revenue from bids can bring the costs to be lower than
2€/kg. This suggests that participating in the regulatory power market can be
beneficial in driving costs down. Wholesale electricity prices need to be lower in
order to drive down production prices and correlates positively to production price,
and this can be achieved by coupling with renewable energy. The analysis mainly
took into consideration up-regulation bid because of the allure of higher profits,
however with the frequency of less expensive bids for down-regulation, it could be
worthy to approach this research again focusing on down-regulation. Of all the cases,
the 11,5 MW case shows the most promise and realism for future consideration due to
the second lowest capital cost and the fact that the volume of the regulating market
can currently support this.
Iceland currently regulates its power with hydropower reserves leaving not a
lot of diversity in the regulating power market. These reserves can be called upon
much quicker than alkaline, but about the same time as PEM electrolysis. With
competition lacking, there is really only a primary regulating power market in Iceland
compared to the rest of Europe that has secondary and tertiary regulating power
markets with different start up time regulations in each. It could be informative to
investigate PEM electrolysis further with this analysis because PEM capital costs are
expected to decrease in the future, and it could be competitive with Iceland’s
hydropower reserve as a regulating power entity.

35
References
1. Soediono, B. No Title No Title. J. Chem. Inf. Model. 53, 160 (1989).
2. Balta, M. T., Dincer, I. & Hepbasli, A. Thermodynamic assessment of
geothermal energy use in hydrogen production. Int. J. Hydrogen Energy 34,
2925–2939 (2009).
3. Zoulias, E., Varkaraki, E., Lymberopoulos, N., Christodoulou, C. N. &
Karagiorgis, G. N. A review on water electrolysis. at
<http://www.cres.gr/kape/publications/papers/dimosieyseis/ydrogen/A
REVIEW ON WATER ELECTROLYSIS.pdf>
4. Ursua, A., Sanchis, P. & Gandia, L. Water Electrolysis : Current Status and
Future Trends. Proc. IEEE 100, 1–17 (2012).
5. Rashid, M., Mesfer, M. K. Al, Naseem, H. & Danish, M. Hydrogen Production
by Water Electrolysis : A Review of Alkaline Water Electrolysis , PEM Water
Electrolysis and High Temperature Water Electrolysis. Int. J. Eng. Adv.
Technol. 4, 80–93 (2015).
6. Bertuccioli, L. (E4tech) et al. Fuel cells and hydrogen Joint undertaking
Development of Water Electrolysis in the European Union. (2014). at
<http://www.fch.europa.eu/sites/default/files/study electrolyser_0-
Logos_0_0.pdf>
7. Harrison, K. W., Remick, R., Martin, G. D. & Hoskin, A. Hydrogen
Production : Fundamentals and Case Study Summaries. in World Hydrogen
Energy Conference 1–16 (2010). at
<http://www.nrel.gov/hydrogen/pdfs/47302.pdf>
8. Allebrod, F. High Temperature and Pressure Alkaline Electrolysis 1 st revised
edition. (Technial University of Denmark, 2013).
9. Zadeh, S. H. Hydrogen Production via Ultrasound-Aided Alkaline Water
Electrolysis. J. Autom. Control Eng. 2, 1–7 (2014).
10. Vera, E., Ruiz, J., Rodríguez, C. & Escribano, P. Study of an Alkaline
Electrolyzer Powered by Renewable Energy. (2011). at
<http://www.cnh2.es/docs/Study-of-an-ALK-Electrolyzer-Powered-by-
Renewable-Energy.pdf>
11. Santos, D. M. F., Sequeira, C. A. C. & Figueiredo, J. L. Hydrogen Production
By Alkaline Water Electrolysis. Quim. Nov. 36, 1176–1193 (2013).
12. Carmo, M., Fritz, D. L., Mergel, J. & Stolten, D. A comprehensive review on
PEM water electrolysis. Int. J. Hydrogen Energy 38, 4901–4934 (2013).
13. Becerikli, F., Mat, M. D., Selamet, O. F. & Kaplan, Y. Development and
testing of a highly efficient proton exchange membrane ( PEM ) electrolyzer
stack. Int. J. Hydrogen Energy 36, 11480–11487 (2011).
14. Millet, P. et al. Electrochemical performances of PEM water electrolysis cells
and perspectives. Int. J. Hydrogen Energy 36, 4134–4142 (2011).
15. Clarke, R. E., Giddey, S. & Badwal, S. P. S. Stand-alone PEM water
electrolysis system for fail safe operation with a renewable energy source. Int.
J. Hydrogen Energy 35, 928–935 (2010).
16. Barbir, F. PEM electrolysis for production of hydrogen from renewable energy
sources. Sol. Energy 78, 661–669 (2005).
17. Yilmaz, C. & Kanoglu, M. Thermodynamic evaluation of geothermal energy
powered hydrogen production by PEM water electrolysis. Energy 69, 592–602
(2014).
18. Sigurvinsson, J., Mansilla, C., Lovera, P. & Werkoff, F. Can high temperature

36
steam electrolysis function with geothermal heat ? Int. J. Hydrogen Energy 32,
1174–1182 (2007).
19. Sohal, M., O’Brien, J., Stoots, C. & McKellar, M. Challenges in Generating
Hydrogen by High Temperature Electrolysis Using Solid Oxide Cells.
Development (2008). at
<http://www.inl.gov/technicalpublications/Documents/3920063.pdf>
20. Minh, N. Q. & Mogensen, M. B. Reversible Solid Oxide Fuel Cell Technology
for Green Fuel and Power Production. Electrochem. Soc. 55–62 (2013). at
<http://www.electrochem.org/dl/interface/wtr/wtr13/wtr13_p055_062.pdf>
21. Styring, P., Quadrelli, E. A. & Armstrong, K. Carbon Dioxide Utilisation:
Closing the Carbon Cycle. (Elsevier, 2015).
22. Laguna, Bercero, M. Recent advances in high temperature electrolysis using
solid oxide fuel cells : A review. J. Power Sources 203, 4–16 (2012).
23. Panel, I. R. Current ( 2009 ) State-of-the-Art Hydrogen Production Cost
Estimate Using Water Electrolysis Independent Review. (2009). at
<http://www.hydrogen.energy.gov/pdfs/46676.pdf>
24. Eichman, J. et al. Novel Electrolyzer Applications : Providing More Than Just
Hydrogen Novel Electrolyzer Applications : Providing More Than Just
Hydrogen. (2014). at <http://www.nrel.gov/docs/fy14osti/61758.pdf>
25. Schafer, A., Schuster, H., Kasper, U. & Moser, A. in Electrochemical Energy
Storage for Renewable Sources and Grid Balancing 23–32 (2015).
26. Droste-Franke, B. in Electrochemical Energy Storage for Renewable Sources
and Grid Balancing 61–86 (2015).
27. Ainscough, O. C., Peterson, D. & Miller, E. DOE Hydrogen and Fuel Cells
Program Record. (2014). at <file:///Users/jeffjacobs/Desktop/Thesis/Case
Study /Hydrogen Production Cost From PEM Electrolysis.pdf>
28. Davito, B., Tai, H. & Uhlaner, R. The smart grid and the promise of demand-
side management. (2009). at
<https://www.smartgrid.gov/document/smart_grid_and_promise_demand_side
_management>
29. Borggrefe, F. & Paulus, M. Economic potential of demand side management in
an industrialized country – the case of Germany. (2009). at
<https://www.researchgate.net/publication/229015036_Economic_potential_of
_demand_side_management_in_an_industrialized_countrythe_case_of_Germa
ny>
30. Gutierrez-Martin, F. & Guerrero-Hernandez, I. Balancing the grid loads by
large scale integration of hydrogen technologies : the case of the Spanish
power system.
31. Gutierrez-Martin, F., Ochoa-Mendoza, A. & Rodriguez-Anton, L. M.
ScienceDirect Pre-investigation of water electrolysis for flexible energy storage
at large scales : The case of the Spanish power system n. Int. J. Hydrogen
Energy 40, 5544–5551 (2015).
32. Barton, J. & Gammon, R. The production of hydrogen fuel from renewable
sources and its role in grid operations. J. Power Sources 195, 8222–8235
(2010).
33. Ã, G. S. Demand side management : Benefits and challenges. Energy Policy
36, 4419–4426 (2008).
34. Chladek, P., Kiaee, M., A., C. & Infield, D. Improvement of power system
frequency stability using alkaline electrolysis plants. J. Power Energy 1–11
(2012). doi:10.1177/0957650912466642

37
35. Ozbilen, A., Dincer, I., Naterer, G. F. & Aydin, M. Role of hydrogen storage in
renewable energy management for Ontario Modified Internal Rate of Return.
Int. J. Hydrogen Energy 37, 7343–7354 (2012).
36. Zeng, K. & Zhang, D. Recent progress in alkaline water electrolysis for
hydrogen production and applications. Prog. Energy Combust. Sci. 36, 307–
326 (2010).
37. Arnason, B. & Sigfusson, T. I. APPLICATION OF GEOTHERMAL ENERGY
TO HYDROGEN PRODUCTION AND STORAGE. at
<https://www.researchgate.net/publication/237613011_APPLICATION_OF_G
EOTHERMAL_ENERGY_TO_HYDROGEN_PRODUCTION_AND_STOR
AGE>