Economic Integration – Part 1. How rich is the EU compared to the rest of the world? EU...
14
Economic Integration – Part 1
-
Upload
polly-waters -
Category
Documents
-
view
213 -
download
0
Transcript of Economic Integration – Part 1. How rich is the EU compared to the rest of the world? EU...

Economic Integration – Part 1

How rich is the EU compared to the rest of the world?
EU China Japan Russia United States EU China Japan Russia United States
10 793
1 326
3676
468
10 035
24 700
6 400
27 800
10 000
37 300
Size of economy: Gross Domestic Product inbillion of euros, 2006
Wealth per person: Gross Domestic Productper person in Purchasing Power Standard, 2007
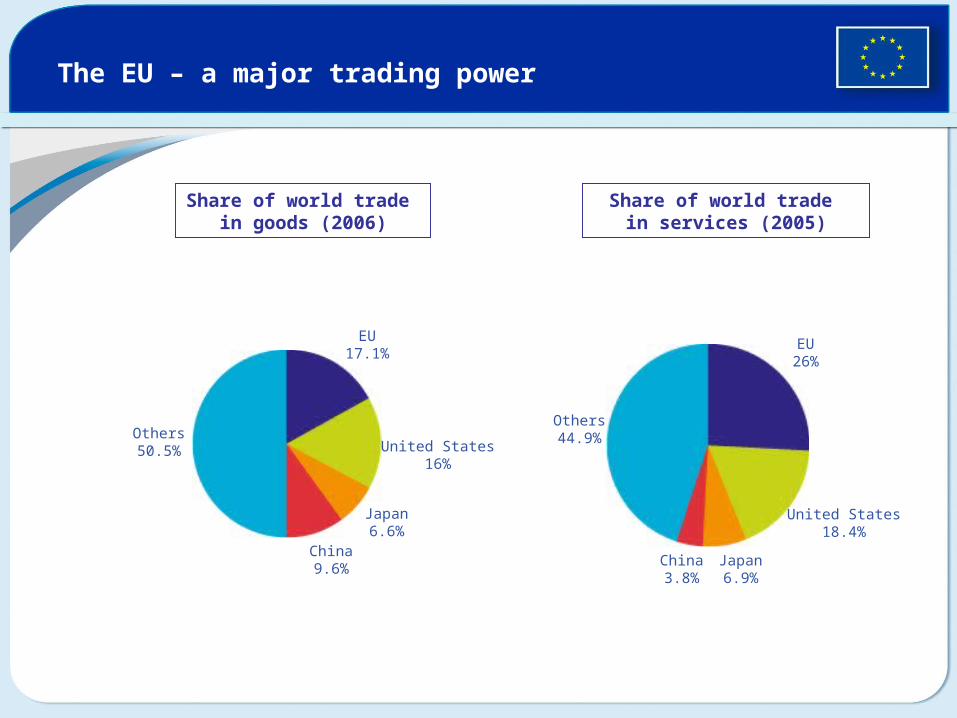
The EU – a major trading power
Share of world trade in goods (2006)
Share of world trade in services (2005)
Others50.5%
EU17.1%
United States16%
Japan6.6%
China9.6%
Others44.9%
EU26%
United States18.4%
Japan6.9%
China3.8%

Growth in Comparative Perspective

Common Market: Examples – Aerospace (Negative)
• Deregulation and competition– 1978 – Airline ticket: London-Madrid MORE EXPENSIVE THAN London-NYC-Madrid– State-owned, national airlines – “national champions”– Monopolies (Air France, Alitalia, Lufthansa)
• Arianespace– 10 Countries involved, 1/3 stake held by EADS– >50% all commercial satellite launches
• EADS – European Aeronautic, Defence, and Space– 2000 merger of Aerospatiale (Fr.); Daimeler(Chrysler) Aerospace (Germ.); CASA (Esp.); BAE (UK)– Airbus is a subsidiary, itself a consortium of European companies and governments

Common Market: Examples – TENs (Positive)
• Trans-European Networks– Infrastructure projects required for market’s efficient functioning– Transportation, Energy, Telecommunications
• Based in the Commission (Euro-bureaucracy)– Operate in any and all member states
• http://ec.europa.eu/avservices/video/video_prod_en.cfm?type=detail&prodid=681&src=1
• http://www.youtube.com/watch?v=XGPO-YmSbfs

Euro-zone membership status
• ERM II States– Denmark, Estonia, Latvia, Lithuania, (Sweden)
• Expected to Join ERM– Poland, Hungary, Czech Republic, Bulgaria– Romania in 2010-2012
• Britain is fully out

European Central Bank and EMU
• INDEPENDENT ORGANIZATION tasked with PRICE STABILITY– Inflation near, but not to exceed, 2% per annum (aside: do we know about interest rates?)
• Modeled on the Bundesbank– Executive Board (8 members, unanimous agreement among Council– Board of Governors (Head of each euro-zone central bank)– Located in Germany, Dutchman (Wim Duisenberg) 1st president of the Exec Board
• Exclusive Powers:– Set euro-zone interest rates– Authorize printing of euro notes and *coins*– Maintain national foreign reserves
• Eurosystem– Network of central banks of ALL member states (even Britain)– Carry out printing of money, application of ECB policy in the member states– ECB funding is FROM the Eurosystem’s banks, not from the EU budget

Convergence Criteria and SGP
• Convergence Criteria for euro membership– Budget deficit <= 3% GDP– National Debt <= 60% GDP– Inflation <= 1.5% of 3 best performers– Currency stability, +/-2.5% limit on ERM fluctuations– Interest rates not less than 2% lower than highest-rate state
• Stability and Growth Pact– Enforces convergence criteria among euro-zone members– Max 3% GDP deficits– Max 60% GDP debt– Amended in 2005 to allow “temporary” violations (loosely defined)
• http://www.nrc.nl/international/article2160480.ece • http://en.wikipedia.org/wiki/Stability_and_growth_pact#Member_states_by_SGP_crite
ria
Economic Integration – Part 2

GDP per inhabitant: the spread of wealth
GDP per inhabitants in Purchasing Power Standards, 2007
Index where the average of the 27 EU-countries is 100
280
144131 129 127 123 121 118 117 113 113
104 102 10094 89 87
79 77 7567 66 63 58 56 53
38 37
Lu
xe
mb
ou
rg
Irel
an
d
Net
he
rla
nd
s
Au
str
ia
Den
ma
rk
Bel
giu
m
Sw
ed
en
Un
ite
d K
ing
do
m
Fin
lan
d
Ger
ma
ny
Fra
nc
e
Ita
ly
Sp
ain
EU
-27
Cyp
rus
Gre
ec
e
Slo
ve
nia
Cze
ch
Re
pu
bli
c
Ma
lta
Po
rtu
ga
l
Est
on
ia
Hu
ng
ary
Slo
va
kia
Lit
hu
an
ia
La
tvia
Po
lan
d
Ro
ma
nia
Bu
lga
ria

Solidarity in practice: the EU cohesion policy
2007-2013: 347 billion euro invested for infrastructure, business, environment and training of workers for less well-off regions or citizens
Regional fund
Social fund
Cohesion fund
Convergence objective: regions with GDP per capita under 75% of the EU average. 81.5% of the funds are spent on this objective.
Regional competitiveness and employment objective.
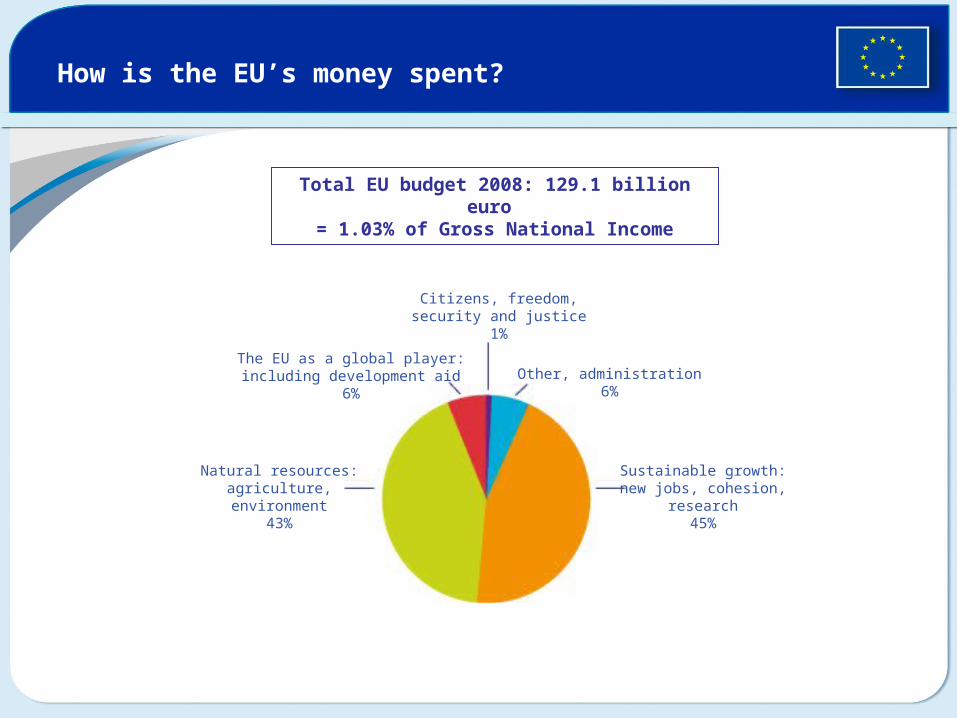
How is the EU’s money spent?
Total EU budget 2008: 129.1 billion euro
= 1.03% of Gross National Income
Citizens, freedom,security and justice
1%
Other, administration6%
Sustainable growth:new jobs, cohesion,
research45%
The EU as a global player:including development aid
6%
Natural resources:agriculture,
environment43%