Economic Insights into the Costs of Design Restrictions in ... · KROETZ AND SANCHIRICO i ECONOMIC...
50
Economic Insights into the Costs of Design Restrictions in ITQ Programs Kailin Kroetz and James N. Sanchirico RFF REPORT JANUARY 2010
Transcript of Economic Insights into the Costs of Design Restrictions in ... · KROETZ AND SANCHIRICO i ECONOMIC...

Economic Insights into the Costs of Design Restrictions in ITQ Programs Kailin Kroetz and James N. Sanchirico
RFF REPORT
JANUARY 2010

Table of Contents
Executive Summary .................................................................................................................................................. i
1. Introduction ........................................................................................................................................................... 1
2. Rights and Restrictions in ITQ fisheries .................................................................................................... 2
Characteristics of Fishing Rights or Privileges ....................................................................................... 2
Restrictions on Rights in ITQ Fisheries ...................................................................................................... 3
Restrictions in Existing Multispecies ITQ Programs ............................................................................ 5
3. West Coast Groundfish Fishery and Proposed ITQ Program ........................................................... 8
Description of the Fishery ............................................................................................................................... 9
Proposed Groundfish Trawl ITQ Program ............................................................................................. 12
Transfer Restrictions ...................................................................................................................................... 13
4. Theory and Empirics on Measuring Costs of Restrictions .............................................................. 18
Model of QP Prices in a Well‐Functioning Market .............................................................................. 18
Estimates of Transfer Restriction Costs ................................................................................................. 22
Empirical Measures of Transfer Restriction Costs ............................................................................. 23
5. Design and Costs in the WC Groundfish Limited‐Entry ITQ Program ....................................... 28
Discussion ................................................................................................................................................................. 41
References ................................................................................................................................................................ 44

KROETZ AND SANCHIRICO i
ECONOMIC INSIGHTS INTO THE COSTS OF DESIGN RESTRICTIONS IN ITQ PROGRAMS
Kailin Kroetz and James N. Sanchirico*
Executive Summary
ndividual transferable quotas (ITQs), a market‐based policy instrument, have been found to significantly reduce the likelihood that fish stocks are overfished and that fishermen compete to
catch as much as possible as fast possible by capping the aggregate industry‐wide catch and guaranteeing fishermen a share of the catch. Furthermore, when the quota takes on value through transferability, the owners have an incentive to invest in stewardship of the ocean resource.
The ability of firms to buy and sell quota in a well‐functioning market is necessary to achieve these gains. However, designing economically efficient multispecies ITQ systems is challenging because of the need to balance the necessary flexibility for quota owners to match catches with quota holdings against the risks of overexploitation.
Furthermore, the goals for ITQ programs encompass economic efficiency, but also include vibrant coastal communities, maintaining the culture of fishing communities, and healthy ocean ecosystems. Using a single policy instrument invented to eliminate the economic waste associated with derby‐style fisheries to accomplish all of these goals simultaneously increases the difficulties in the design stage and potentially reduces the economic efficiency of the policy. For example, designers of ITQ programs often develop rules to restrict quota ownership, to determine who can trade with whom, to constrain what sectors are in the program, and on whether quota can be borrowed and banked. A natural question to ask and the one at the core of the report is, what is the opportunity cost of imposing these rules?
We begin this report by providing background information on the characteristics of the right in ITQ fisheries and on the designs of multispecies ITQ programs around the world. Next we focus on estimation of the opportunity cost (in terms of a reduction in economic efficiency) from imposing restrictions. We do so by providing a review of the theory and empirical methods for estimating regulatory transaction costs, along with summaries on the current body of literature measuring them. Finally, we use the proposed West Coast limited‐entry groundfish trawl shoreside ITQ program as our case study and provide details on the current design and rough estimates on the
* Kroetz, Dept. of Agricultural and Resource Economics, University of California, Davis; email: [email protected]. Sanchirico, Dept. of Environmental Science and Policy, University of California, Davis; and nonresident fellow, Resources for the Future; email: [email protected].
We thank Merrick Burden (Environmental Defense Fund), Shannon Davis (The Research Group), Katherine Quigley (South Atlantic Fishery Management Council), Gil Silvia (Oregon State), Michael Harte (Oregon State), Shems Jud (Environmental Defense Fund) and Johanna Thomas (Environmental Defense Fund) for their helpful comments in framing the research and revising the report. Of course, we take full responsibility for any errors. Funding for this research was provided by the Environmental Defense Fund under contract.
I

KROETZ AND SANCHIRICO ii
potential costs. The goal is to provide guidance for regional fisheries management councils. A full evaluation of whether these rules are socially beneficial, however, requires the valuation of the social benefits from their imposition—a task that is beyond the scope of the current report.
The trawl shoreside ITQ program has, by design, focused on the trawl sector even though a fixed‐gear sector is harvesting some of the same species, mainly sablefish. We discuss the potential costs associated with sector‐based designs and the other restrictions in the proposed program, including accumulation limits and permit purchase requirements.
Given the large price differential for sablefish caught with fixed gear and with trawl gear, we find that the cost of the sector‐based approach is likely on the order of $3 million per year, or 20 percent of the trawl ex‐vessel revenues for sablefish, if none of the trawlers switch to fixed gear. If 40 trawlers remain in the fishery post‐ITQ, this translates into roughly $75,000 per boat per year. The cost decreases linearly as more of the trawl sablefish total allowable catch (TAC) is caught with fixed gear. Because trawlers catch sablefish with Dover sole and thornyheads, we estimate that approximately 40 to 50 percent of the trawl TAC for sablefish will be caught with fixed gear and the remainder will be used to harvest the multispecies complex. The higher the profit rate of the fixed‐gear sablefish fishery or the lower the profitability of the trawl ITQ fishery, the greater are the costs from creating regulatory barriers between the two sectors. The costs also increase when the current management restrictions on the fixed‐gear endorsed sector (block trading restrictions) and the other sectors that are not included in the program (open‐access and nonendorsed fixed‐gear sablefish) are taken into account.
The report presents a methodology to help understand the trade‐offs across various efficiency and nonefficiency goals. The methods used in the report can be adapted for other fisheries and complement more rigorous economic studies. In fact, fishery managers need only a spreadsheet, and in some cases, the calculations can be done with pencil and paper. The methods can therefore help stakeholders understand in real time the potential costs of restrictions and develop a more informed picture of whether the potential benefits of these restrictions outweigh the costs.

1KROETZ AND SANCHIRICO
1. Introduction Individual transferable quotas (ITQs) are a market‐based policy instrument that has been
shown to reduce the economic and ecological waste from the common pool nature of marine capture fisheries. ITQs limit fishing operations by setting a total allowable catch (TAC) for the fishery and allocating the shares of the TAC to fishermen. Often the allocation is based on historical catch and for perpetuity, but there are examples of limiting the duration of the privilege and including vessel characteristics in the allocation formula. ITQs significantly reduce the likelihood that fish stocks are overfished and that fishermen compete to catch as much as possible as fast possible by capping the aggregate catch and giving fishermen a claim to a guaranteed share.
Ownership of quota reduces the uncertainty on the catch both this year and in the future, and as a result, fishermen and fishing companies change their operations to maximize the value rather than the quantity of the catch.1 Associated gains include increases in profit, conservation, and safety. For example, with the race to fish dissipated, fishermen time fishing trips to coincide with high port prices and thus avoid the large supply gluts of fresh product that occur in fisheries with very short seasons. The elimination of the race also permits owners the time to handle their catch carefully, both increasing the product recovery rate and producing higher‐valued products (e.g., fresh instead of frozen fish). In the Pacific Whiting Cooperative, product recovery rates went from 17 to 24 percent, which corresponds to approximately 10 million more pounds of seafood from the same catch (Sylvia et al. 2008).
In addition, when the shares are transferable, the least efficient vessels will find it more profitable to sell their quota than to fish it. Over time, this should both reduce excess capacity and increase the efficiency of vessels operating in the fishery. Furthermore, when the quota takes on value through transferability, the owners have an incentive to invest in stewardship of the ocean resource (Wilen 2006).
The ability of firms to buy and sell quota in a well‐functioning market is necessary to achieve these gains. Potential concerns include illiquid markets (e.g., inadequate demand or supply of quota), individuals or groups that exert influence over the market, and information problems related to uncertainty and decision‐making complexity. Markets plagued with these problems may have “noisy” prices and little or no gains relative to traditional command‐and‐control regulations.
Implementation of ITQ programs throughout the world makes clear that the designers of ITQ programs are trying to find a balance between economic efficiency, social stability, environmental, and other community development based goals. To address these other goals, restrictions on the ITQ program are imposed and are generally tailored to meet fishery‐specific concerns. Examples include imposing restrictions on (1) who can own quota; (2) who can trade with whom; (3) what sectors are in the program; and (4) whether quota can be borrowed and banked. Economists have noted that in tradable permit markets such as ITQ systems, transaction costs due to the design of the system (known as regulatory transaction costs) can reduce the economic efficiency gains (Stavins 1995).
1 As the term is used in ITQ programs, quota ownership is not the same as ownership of the fish stock in situ. Moreover, in almost all ITQs around the world, quota ownership is a privilege that can be revoked by the government.
2KROETZ AND SANCHIRICO
A natural question to ask is, what is the potential magnitude of these regulatory transaction costs? It could be that in practice, these restrictions are inexpensive and are clearly outweighed by the associated benefits. For example, the latter is possible when they are intended to appease opposition so that the systems can be adopted sooner.
In this report, we develop a basis for how regional fisheries management councils might begin to measure the opportunity costs of these restrictions, using the multispecies west coast groundfish fishery as our case study. A full evaluation of whether these rules are socially beneficial, however, requires the valuation of the social benefits from their imposition—a task that is beyond the scope of the current report. We also undertake back‐of‐the‐envelope calculations on the likely magnitude of the costs for the proposed west coast limited‐entry groundfish trawl shoreside ITQ program (henceforth, GT ITQ program). The calculations can be done with a spreadsheet and many can be done with pencil and paper, providing economic insights without the need for time‐consuming economic studies. We use the more rigorous studies (e.g., Lian et al. 2008) to help us choose between different likely scenarios; researchers can use our methods to help develop the scenarios to investigate.
The report is organized as follows. In Section 2, we identify the different dimensions of the rights (or privileges), the potential restrictions, and the restrictions common to multispecies ITQ fisheries. Section 3 briefly describes the sectors involved in the west coast groundfish fishery and the proposed GT ITQ program. Section 4 provides a discussion of the possible methods available to measure the costs of the restrictions and reviews the studies that have addressed the issue. Section 5 provides a qualitative analysis on whether and when the current restrictions in the GT ITQ program might lead to significant costs.
2. Rights and Restrictions in ITQ fisheries Fishery managers often confront competing goals in the design of ITQ systems. On the one
hand, addressing the economic waste in the fishery is often the impetus to implement an ITQ regime. On the other hand, stakeholders often express concerns over equity, the importance of not exceeding the TAC, as well as other social and cultural issues. The goals are reconciled in the design of the annual and long‐term rights to the share of the TAC. Throughout the report, we refer to the annual allocation as quota pounds (QP) and the long‐term allocation as the quota share (QS). QP, the amount of fish each vessel can catch each year, is determined by multiplying the quota share and the corresponding TAC.
Characteristics of Fishing Rights or Privileges Characteristics of rights typically include exclusivity, durability, transferability, and quality of
title (Arnason 2005; Grafton et al. 2000; Harte and Bess 2000; Scott 1989, 2000). When the characteristics are limited in some way, the rights are said to be attenuated. In the following sections, we elaborate on the different characteristics.
Exclusivity
Exclusivity of a right ensures that any and all benefits and costs from the use of the resource accrue to the owner (Arnason 2005). In other words, the owner has exclusive use; all others are precluded from using the resource without consent of the owner. This requires that the right be

3KROETZ AND SANCHIRICO
enforceable and that there be penalties for those who infringe on other holders of the rights. In the case of ITQs, an example of enforceability is the existence of consequences for owners who go over their quota limit.
Under perfect exclusivity, each QS holder has a perpetual right to a specified percentage of the harvest from a fish stock each year and can expect to fish for his allocation any time during the year, at any unrestricted location within the fishery, and without interference from other fishermen.
Durability
Durability addresses the length of time over which the right holder is granted the right. The length of entitlement can range from short‐term leasing to perpetual ownership. A longer duration provides greater certainty of future access to fish and leads to long‐term capital planning by fishermen and fishing companies.
Perfect durability is perpetual ownership of the right.
Transferability
Transferability is the ability to freely exchange the right with someone else. Methods of transfer include sale, trade, or as a gift. Transferability results in the efficient allocation of quota because the users who have the highest‐value quota will be willing to purchase quota from less efficient fishermen, who will find it more profitable to sell their quota than remain in the fishery. Over time, the quota will reside with those who value it the most.
Perfect transferability occurs when there are no restrictions on who can trade with whom or on the amount that can be transferred.
Divisibility
Divisibility of the right, which allows for the division of the property right into smaller pieces, is important as it facilitates exchange and can improve the liquidity in the market. These outcomes can greatly reduce the noise in quota prices. An example of a constraint on divisibility within the context of ITQs is a minimum amount of QS required for a transaction to occur.
Quality of Title (security)
Quality of title addresses the safety of the right from obstruction or seizure by the government, individuals, or firms (Arnason 2005). From a legal standpoint, quality of title is a measure of how well the title or certificate of ownership is recognized by law. Within an ITQ system, a strong quality of title ensures that the owner will not be forced to expend time or money protecting or enforcing his right.
Restrictions on Rights in ITQ Fisheries Throughout the world, fishery managers have instituted restrictions that limit the nature of
fishing rights. Restrictions in ITQ systems can be loosely separated into two categories: restrictions imposed within the ITQ program and restrictions imposed by the larger regulatory scheme. Those imposed within the ITQ framework generally restrict transferability and ownership levels, such as accumulation limits. Table 1 lists restrictions on the use of fishing quota that have been implemented to date in ITQ systems worldwide.
4KROETZ AND SANCHIRICO
With respect to the larger regulatory structure, managers have imposed several restrictions on exclusivity, and quality of title. Exclusivity is attenuated, for example, when the individual is restricted in the way he harvests his catch, such as the gear type he uses, the size of the vessel he uses, the times of year he fishes, and the locations he fishes. Such restrictions reduce the flexibility of the fishermen or fishing operation to find the most economically efficient way to catch their quota.2
Table 1. Restrictions on Use of Quota
Restrictions on quota share (QS)
Ownership eligibility Citizenship, ownership of vessel, use‐it‐or‐lose‐it provisions
Accumulation limits Amount of QS (specified as percentage of TAC) that may be owned or controlled by one economic entity
Restrictions on quota pounds (QP)
Intersector trade Trading between vessels in different sectors (such as geographic regions or gear types)
Carry‐forward, carry‐back Ability to bank unused quota for subsequent year or borrow against subsequent year’s quota
Accumulation limits Amount of QP that may be fished by vessel or controlled by owner
Limits or prohibitions on …
Retrospective balancing Trading that occurs after landings to allow fisherman to cover overharvest of quota
Cross‐species exchange Quota of one species that can be used to cover catches of another species at prescribed trading ratio
Quota baskets Species‐specific quota. Instead, when quota baskets are permitted, species are grouped into one aggregate quota bundle where TAC applies to all species combined
Fishing‐on‐behalf‐of agreements Quota transfer requirements. Instead, when fishing‐on‐behalf‐of agreements are permitted, no formal trade is required for fisherman to cover his catch with QP of another fisherman.
Sources: Adapted from White (2006) and Sanchirico et al. (2006).
Potential restrictions on the quality of the title include the existence of deemed value payments and allowable discarding. A deemed value payment is a mechanism whereby fishermen are charged
2 Another restriction is when vessels are mandated to bring their catch to a particular processor. This restriction limits the ability of the rights holder to obtain the highest ex‐vessel revenue by selecting the processor willing to pay the highest travel cost–adjusted ex‐vessel price for fish.

5KROETZ AND SANCHIRICO
a fee for each unit of catch they land above their quota. Allowable discarding occurs when fishermen are permitted to surrender or discard catch they cannot match with quota. An issue with these practices is the extent to which they lead to TAC overages and closure of the fishery before other quota holders finish catching their quota. Another possibility is that these practices decrease expected future fish stocks.
Restrictions in Existing Multispecies ITQ Programs Issues that arise when ITQs are used to manage a multispecies fishery include the ability
(inability) of fishermen to alter the species mix caught with existing harvest technology or gear, the creation of incentives to discard low value fish, and bycatch of species fishermen do not hold quota for (Squires et al. 1998). The fisherman’s profit maximization decision also becomes more complex than with single‐species ITQs because he must consider the appropriate quantities of quota to buy and sell for all the species he catches that are managed under ITQs. Despite the complexities, Sanchirico et al. (2006) found that the programs around the world have been successful in meeting their goals.
Longstanding multispecies ITQ fisheries exist in Australia, Canada, Iceland, and New Zealand. Iceland and New Zealand ITQ systems cover all (or nearly all) commercial fish stocks, and the QS is allocated and fished without restriction on sector or gear type. The Australia South East Trawl, British Columbia Trawl, and Nova Scotia Mobile Gear differ from the Iceland and New Zealand systems because they are applied to only one sector (trawl, trawl, and mobile gear, respectively). Table 2 compares the restrictions in each of the multispecies fisheries. Shaded boxes correspond to rules that have changed since the inception of the program.
We provide a brief summary of each of the ITQ systems. Additional information on these programs is available in Sanchirico et al. (2006) and the citations therein.
Table 2. Instruments in multispecies ITQ fisheries
British Columbia Nova Scotia Iceland New Zealand Australia
Permanent transfer Yes Yes Yes Yes Yes
Temporary transfer Yes Yes Yes Yes Yes
Intersector trading Yes Yes Yes Yes Yes
Carry‐forward 30% 0% 20% 10% 20%
Carry‐back 30% 1:1 reduction (no limit)
5% Dropped 20%
Legal discarding — — — — Yes
Deemed values — — — Yes —
Species equivalence Yes Dropped Yes Dropped —
Retrospective balancing
30 days after landed
45 days after landed, plus 2 months at end of year
3 days after landed
15 days after last day of month landed
End of fishing year
Note: Shaded box indicates a change in the program.
6KROETZ AND SANCHIRICO
Australia South East Trawl Fishery
An ITQ program was first implemented in this fishery in 1992. Today, ITQs are in place for approximately 20 species, the majority of which are caught with otter board, Danish seine, and midwater trawl gear (Kompas and Che 2005). These various gear types are subject to additional nontransfer restriction in terms of use and size.
Fishery closures and uncertainty in future TACs exist within the fishery and compromise the exclusivity and quality of title of the fishing right. Over time, a large number of bycatch species have remained outside of the ITQ system (Sanchirico et al. 2006). This can pose an issue when there are TAC overruns of the non‐ITQ species and the fishery is forced to close. One provision to mitigate this potential, unique among the five fisheries, is to allow discarding without QP.
The transfer restrictions are fairly extensive. Permanent sale and leasing of QS and QP are currently allowed but historically have been limited. From March 1992 through January 1994, permanent QS trading was not allowed except for full QS buyouts (Kompas and Che 2005). Leasing across sectors or gears has been allowed for most species since 1998, but prior to 1998 no intersector trade was allowed (Sanchirico et al. 2006). Finally, carry‐forward and carry‐back of up to 20 percent of annual quota is allowed (increased from 10 percent in 1994).
British Columbia Trawl Fishery
The British Columbia Trawl ITQ program was implemented in 1997. Currently about 30 species across eight management areas are subject to regulation via ITQs. An additional 50 species are caught in conjunction with the ITQ species (Sanchirico et al. 2006). If the TAC for any species in or out of the ITQ program in an area is exceeded, the area is closed. Furthermore, if a vessel exceeds its allocation of a species for any area, it must stop fishing in any areas where the species occurs until quota is transferred to the vessel account to cover the overage.
Some flexibility with regard to overages does exist. Carry‐forward and carry‐back provisions exist and are symmetric for each species. The maximum carry‐forward and carry‐back amount per area 15 percent for hake and halibut and 37 percent for other groundfish species (Grafton et al. 2005). Additionally, restrictions on the overall individual species caps range from 4 to 10 percent, and a total quota holdings cap is based on species equivalence formulas (Grafton et al. 2005).
Although leasing is currently allowed, transferability was limited from 2004 to 2006. Specifically, 25 percent of the original allocation was considered “locked” onto the vessel and could be transferred only via permanent transfers. In addition, each vessel was limited to two one‐way permanent transfers of locked quota during the three‐year period (Grafton et al. 2005). The remaining 75 percent could be leased.
British Columbia began experimenting with intersector leasing beginning in the 2006–07 fishing season under the Pilot Groundfish Integration Program. The program was proposed as a means of more effectively managing bycatch of species (including sablefish, halibut, rockfish, dogfish, lingcod) by allowing limited intersector trade. The pilot program ended in February 2009, and as of the writing of this report, the final program outcomes and analysis are pending. Preliminary findings indicate that it is possible the program is affecting conservation, sustainable use, and economic performance of the groundfish resource, however, a longer time frame is needed

7KROETZ AND SANCHIRICO
before definitive assessments can be made (Fraser and Associates Economic and Business Consulting Services 2008).3
Nontransfer restrictions affecting the exclusivity of fishing rights include gear and vessel length restrictions, area closures, license limitations, and regulations regarding overfished species.
Iceland
Iceland was one of the first countries to manage commercial fishing effort via ITQs, beginning in 1976. In 1984 the ITQ program was expanded to include demersal fishery species. By 1991 Iceland’s ITQ system was essentially complete, with all major species included and uniform management strategies in place across all managed species. The species‐level management system permits vessels in the main quota pool to fish using any approved gear.
Originally, Iceland did not include small vessels in the ITQ system, and their catches were not regulated at the aggregate level. Through time more stringent restrictions have been implemented; today, vessels under 6 gross registered tonnage are in the main ITQ system, a special ITQ system for small boats, or a trip‐limit fishery (Arnason 2005).
The Icelandic ITQ system allows for transfer of QS and QP. The QS ownership is tied to a vessel, granted in perpetuity, and perfectly divisible. QS can also be transferred to any non‐Icelandic company or individual, but no company or individual can hold more than the accumulation limit for a species; these limits range from 12 percent of the TAC for cod to 35 percent of the TAC for ocean redfish, with an overall cap of no more than 12 percent of the value of quota shares for all fish stocks under ITQs (Arnason 2005; Sanchirico et al. 2006).
QP provisions are more numerous than QS provisions. Iceland has 20 percent carry‐forward and carry‐back provisions to allow for flexibility in catch‐quota balancing. Retrospective balancing is also allowed but limited to three days after landing. QP is transferable within the same geographic region, but transfer outside the region requires approval. Also, no more than 50 percent of a vessel’s QP can be transferred each year, and no vessel may purchase more QP than it can “reasonably” harvest. Finally, any vessel that does not harvest at least 50 percent of its QP at least every second year will forfeit its QS.
Nontransfer restrictions also exist in Iceland. These include size limitations on fishing gear, area restrictions on bottom trawling, and fishing area closures to protect spawning fish stocks.
New Zealand
ITQs were first implemented in New Zealand in 1986. As of 2004, of the approximately 130 species caught commercially in New Zealand, 93 species were managed via ITQs, and the goal is to incorporate all commercially valuable species or species where sustainability issues exist because of fishing effort (Sanchirico et al. 2006).
New Zealand manages its large fishing area by dividing species into quota markets that are species‐area combinations. The result is approximately 628 TAC designations and separate quota markets.
3 For example, the report discusses how the catch monitoring system resulted in greater certainty in data on catch levels and provided data to ensure that the allowable catch limits for species were not exceeded.

8KROETZ AND SANCHIRICO
Accumulation limits curtail QS ownership across all quota management areas. The limits range from approximately 20 percent for paua and bluenose to approximately 45 percent for hake, hoki, and orange roughy (Sanchirico et al. 2006). The only species subject to QP restrictions is the spiny lobster; ownership is restricted to 10 percent in each quota management area (Sanchirico et al. 2006). Although New Zealand constrains trade through its quota management areas and accumulation limits, the program includes various flexibility measures. It currently allows 10 percent carry‐forward of unfished quota but in 2001 eliminated the 10 percent carry‐back provision it had in place. Additionally, New Zealand allows retrospective balancing to occur until the 15th day of the month the catch was landed. If the catch is not balanced by the 15th day of the month, a deemed‐value must be paid. The deemed‐value payment is refunded if the catch is balanced by 15 days after the end of the fishing year (Sanchirico et al. 2006).
Nontransfer restrictions in New Zealand include closed areas, gear restrictions, and size limits.
Nova Scotia Mobile Gear
The Nova Scotia Mobile Gear ITQ program began in 1991 with three main species—cod, haddock, and pollock—and was later expanded to include more species (Dupont et al. 2005). For the first two years of the program, transfer of QP only (not QS) was permitted, but in subsequent years both types of transfer have been allowed. In 1996, to reduce capacity, the government mandated that every vessel have minimum QS of at least 2 tonnes of cod, 2 tonnes of haddock, 2 tonnes of pollock, and 1 tonne of flounder to participate in the fishery. Today the fleet consists of approximately 130 otter trawl vessels ranging from 25 to 65 feet in length (Dupont et al. 2005).
The fishery is organized into fishing areas. Species aggregation limits restrict quota holders to no more than 2 percent of the TAC per species per area. Retrospective balancing is permitted up to 45 days after landing, with a provision to allow for the donation of extra catch to the government. QP transfers are generally restricted during the open season to vessels of the same gear type, but after the season ends, out‐of‐season transfers are not subject to the same restrictions. Although retrospective balancing and other flexibility mechanisms are allowed, if the TAC is reached for a particular area, the area closes and thus constrains the catch of the other species in the area.
Two policies that were eliminated were a species exchange rate and a schedule for deducting overages from the following year’s catch.
3. West Coast Groundfish Fishery and Proposed ITQ Program Understanding the potential costs of the transfer restrictions in the proposed GT ITQ program
requires knowledge of the fishery as well as familiarity with specific attributes of the proposed program. To that end, we summarize available information on the west coast groundfish fishery and the proposed GT ITQ program. More information is available in Pacific Fishery Management Council documents (PFMC 2008, 2009).4
4 The final design had not been approved as of October 2009, and some characteristics and rules may change.

9KROETZ AND SANCHIRICO
Description of the Fishery The west coast groundfish fishery is located in the federal and state waters off the coasts of
California, Oregon, and Washington. Targeted species include rockfish, flatfish, and groundfish. Four primary nontribal sectors have been designated: limited‐entry (LE) trawl, LE fixed gear, open access, and recreational. As shown in Figure 1, these sectors can be further broken down based on distance from shore and targeted species. Each sector is described below. Descriptive statistics for each sector are presented in Table 3.
Figure 1. West Coast Groundfish Fishery Sectors
LimitedEntry Trawl
The LE trawl sector comprises shoreside whiting and nonwhiting sectors as well as the offshore catcher‐processor and mothership sectors. The two shoreside fleets are similar in terms of vessels but whiting vessels, on average, are slightly larger, have larger horsepower engines, and use different fishing gear. The whiting sector uses midtrawl gear and is able to primarily target whiting, whereas the nonwhiting sector uses bottom‐trawl gear and targets a range of species. The whiting sector delivers to land‐based processing facilities.
The offshore sectors target whiting and process the catch at sea. Currently, the catcher‐processor sector consists of six or seven large vessels that process the whiting onboard. The sector manages its catch allotment via a voluntary co‐op. The mothership sector comprises smaller boats that fish for whiting and bring their catch to central processing boats, called motherships, which process the whiting at sea.
The LE trawl shoreside sectors (i.e., not the offshore catcher‐processors or motherships) are currently managed using a system of two‐month accumulation landing limits for the nonwhiting
10KROETZ AND SANCHIRICO
species and season closures for whiting (PFMC 2008). The nonwhiting species landing limits specify, for every two‐month period, the weight limit for each species, stock, stock complex, or other management unit that permitted vessels in the fishery have a right to land (PFMC 2008).
The LE trawl shoreside sectors are also subject to a permit limitation program (referred to as limited entry) which was implemented in 1994 and requires that a vessel have a valid LE permit. Each permit has a “length endorsement” specifying the maximum‐length vessel that may use the permit. In 1994 the council also first allowed permits to be combined: permit owners could purchase additional permits and combine them to create a longer length endorsement. This allowed large vessels for which there were no available permits with long enough length endorsement to enter the fishery. By 2003, 114 trawl permits had been combined with other permits and eliminated (most of the 114 eliminated permits were purchased and/or combined by the catcher‐processor sector), leaving 274 permits. A buyback program in December 2003 reduced the LE trawl fleet from approximately 260 vessels to approximately 170 (NMFS 2004). Today, approximately 180 LE trawl permits exist and approximately 160 trawl vessels actively land fish.
LE FixedGear Sector
The LE fixed‐gear sector includes vessels fishing with longlines and pots. One of the main species fished using fixed gear is sablefish. There are two sectors within the limited entry fixed gear sector: sablefish‐endorsed and nonsablefish‐endorsed.
The sablefish‐endorsed sector is managed using a permit stacking system. This system has some attributes of an ITQ system, but divisibility is restricted to a greater degree than is typically the case in ITQ programs. Each permit was initially assigned a “tier” based on historical catch. There are three tiers, and each is associated with a landing limit. Tier 1 permits grant the holder the right to fish approximately 1.4 percent of the TAC; tier 2 permits, 0.64 percent; and tier 3 permits, 0.36 percent. In 2009, these percentages equated to 61,296 pounds, 27,862 pounds, and 15,921 pounds, respectively (50CFR§ 660.372: Fixed Gear Sablefish Management 2008).5 The permit stacking system allows a sablefish‐endorsed permit holder to hold up to three permits and fish the three permits over the seven‐month season (NMFS 2006). So, for example, a vessel holding three tier 1 permits could fish approximately 4.2 percent (or 183,888 pounds) of the sablefish‐endorsed TAC. In fact, this would be the maximum, since a tier 1 permit affords the vessel the highest allotment of QP of the three tiers and no more than three permits can be held.
Effectively, the aggregate landing limit serves as a fixed quota that can be fished anytime throughout the season. Transfers of sablefish permits may occur once per year and can occur even after a portion of the permit has been caught. Approximately 90 vessels fish approximately 165 sablefish‐endorsed permits (PFMC 2008). Once their quota of sablefish is caught, sablefish‐endorsed vessels can also take part in the nonsablefish‐endorsed fishery, although only a small percentage actually do (NMFS 2007a).
Of the 231 LE fixed‐gear permits issued in 2006, 67 were not sablefish‐endorsed. Nonsablefish‐endorsed vessels are subject to a trip limit fishery. In the trip limit fishery, catch is regulated by daily, weekly, or bimonthly trip limits. Vessels can choose to make one weekly landing that cannot exceed certain poundage, or fish subject to daily trip limits. In both cases catch may be capped by a
5 50CFR§ 660.372: Fixed Gear Sablefish Management (2008). United States.

11KROETZ AND SANCHIRICO
two month overall limit. In 2006–07 trip limits varied depending on where the vessel fished. For sablefish, daily trip limits ranged from 300 to 500 pounds, and weekly trip limits ranged from 900 to 1,500 pounds (NMFS 2007a).
Most nonsablefish‐endorsed fishing tends to occur off the coast of Southern California, though the fishery extends coast wide. Although technically the fishery is open year‐round, most fishing occurs during the summer months, when there is better weather. All the vessels fishing in the nonsablefish‐endorsed sector fish with longline gear (PFMC 2008).
OpenAccess and Recreational Sectors
The open‐access sector sets aside groundfish allocation for those without LE permits. This allocation is relatively insignificant. At this time there is no formal allocation of species to the recreational sector.
Table 3. West coast groundfish fishery sectors*
Vessels Revenue ($million)
Pounds (million)
Typical boat length (feet)
LE trawl** 160 37 578a 50–100
Whiting 34a 15 451a 60–100
Nonwhiting 137a 25 127a 50–80
Fixed gear 130+ 10–22c 7–12c 17–95e
Sablefish‐endorsed
90 17d 4.8f 33–95d
Nonsablefish‐ endorsed
67 — .8g <40
At sea <30 20 280 80–400
Catcher‐processor
6–7 NAe 174 250–400h
Open access 1,200b 7 3 <40
* All statistics from 2007 unless otherwise noted. We were not able to find information for the mothership sector. Source: PFMC (2008). ** Because of overlap between vessels that fish for whiting and those that fish nonwhiting, the total number of vessels does not equal the sum of the whiting vessels and nonwhiting vessels. a: 2006 statistics. Source: Lian et al. (2008). b: 2000–01 statistics. Source: PFMC (2008). This estimate includes all vessels incidentally landing groundfish (which all under the open access category) and directed open access. Directed open access only accounts for
approximetely 200 vessels. c: Range from 1996–2006. d: 2004 statistics. Source: Anderson and Holliday (2007). e: Catcher‐processors are not required to complete a landing receipt, so no traditional ex‐vessel revenue estimate is available. Source: Anderson and Holliday (2007). f: 2006 statistics. Source: NMFS (2007b). g: 2006 statistics. Source: NMFS (2007a). h: Date of statistic unknown. Source: Anderson and Holliday (2007).

12KROETZ AND SANCHIRICO
Proposed Groundfish Trawl ITQ Program The proposed GT ITQ program is part of an amendment to the Fishery Management Plan that
addresses the shoreside LE trawl sector as well as the catcher‐processor and mothership sectors. The Pacific Fishery Management Council proposed that an ITQ system be used to manage the shoreside LE trawl sector. The catcher‐processor sector currently manages its allotment of whiting and bycatch species through a voluntary co‐op. Under the amendment, this practice would continue, and a similar member‐managed co‐op would oversee the allocation provided to the mothership sector. In addition to co‐op management, the council is recommending that the mothership sector institute an LE permit endorsement to limit participation. At the beginning of the season, vessels opting to fish in the co‐op will need to designate a mothership. Those vessels wishing to fish outside the co‐op will be allowed to do so, and an allocation for non‐co‐op vessels will be made based on the collective catch history of the vessels opting to fish outside the co‐op. Because each vessel outside the co‐op will not be allocated a share of the catch, a race to fish will likely occur.
The annual allocation of pounds of target species and bycatch species to each of the sectors is the subject of a separate council action. Ultimately, this allocation will affect the efficacy of the proposed GT ITQ program relative to a more inclusive intersector ITQ program.
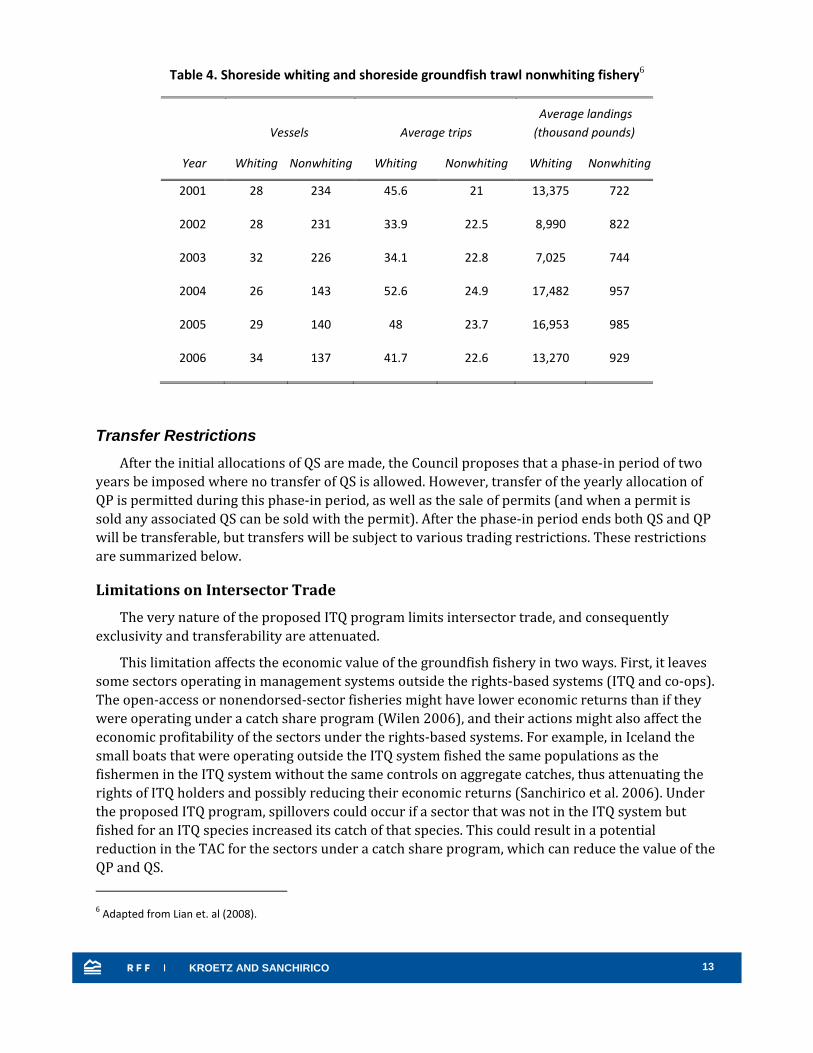
The proposed GT ITQ program covers shoreside whiting and shoreside groundfish trawl nonwhiting vessels. See Table 4 for summary statistics on the whiting and nonwhiting segments. Compared with the whiting sector, the nonwhiting sector consists of more vessels that take fewer trips per year and catch significantly fewer pounds. There were 137 vessels after the buyout in 2006.
If the GT ITQ program is implemented, an initial allocation of QS will be made to vessel permit holders. The QS allocations will be based on percentages of the TAC. Each season, QS owners will be allocated QP. To use the QP, the holder must transfer the pounds to a vessel account. Alternatively, a QS owner may sell some or all of his yearly QP allocation (essentially leasing the QP for the year).
The initial allocation of QS will be based on historical catch. Catcher vessel permit holders will be allocated 90 percent of the nonwhiting TAC based on historical catch plus an equal share of the fish associated with permits retired in the 2003 buyback. The remaining 10 percent of the TAC will be used to implement an adaptive management program. Eighty‐percent of the shoreside whiting TAC will be allocated to catcher vessel permit holders based on historical catch. The remaining 20 percent will be allocated to processors.
13KROETZ AND SANCHIRICO
Table 4. Shoreside whiting and shoreside groundfish trawl nonwhiting fishery6
Vessels Average trips Average landings (thousand pounds)
Year Whiting Nonwhiting Whiting Nonwhiting Whiting Nonwhiting
2001 28 234 45.6 21 13,375 722
2002 28 231 33.9 22.5 8,990 822
2003 32 226 34.1 22.8 7,025 744
2004 26 143 52.6 24.9 17,482 957
2005 29 140 48 23.7 16,953 985
2006 34 137 41.7 22.6 13,270 929
Transfer Restrictions After the initial allocations of QS are made, the Council proposes that a phase‐in period of two
years be imposed where no transfer of QS is allowed. However, transfer of the yearly allocation of QP is permitted during this phase‐in period, as well as the sale of permits (and when a permit is sold any associated QS can be sold with the permit). After the phase‐in period ends both QS and QP will be transferable, but transfers will be subject to various trading restrictions. These restrictions are summarized below.
Limitations on Intersector Trade
The very nature of the proposed ITQ program limits intersector trade, and consequently exclusivity and transferability are attenuated.
This limitation affects the economic value of the groundfish fishery in two ways. First, it leaves some sectors operating in management systems outside the rights‐based systems (ITQ and co‐ops). The open‐access or nonendorsed‐sector fisheries might have lower economic returns than if they were operating under a catch share program (Wilen 2006), and their actions might also affect the economic profitability of the sectors under the rights‐based systems. For example, in Iceland the small boats that were operating outside the ITQ system fished the same populations as the fishermen in the ITQ system without the same controls on aggregate catches, thus attenuating the rights of ITQ holders and possibly reducing their economic returns (Sanchirico et al. 2006). Under the proposed ITQ program, spillovers could occur if a sector that was not in the ITQ system but fished for an ITQ species increased its catch of that species. This could result in a potential reduction in the TAC for the sectors under a catch share program, which can reduce the value of the QP and QS. 6 Adapted from Lian et. al (2008).

14KROETZ AND SANCHIRICO
Second, the program design could lead to inefficiencies. The Pacific Fishery Management Council, which allocates the TAC across sectors, has proposed that a percentage of the TAC of each commercially caught species be allocated each year to the six sectors (catcher‐processor, mothership, shoreside trawl, fixed‐gear, open‐access, and recreational). Long‐term allocations guaranteeing a constant percentage of the TAC would be allocated to each sector each year for all trawl‐dominated species. Allocating each sector a constant percentage of the TAC year‐to‐year increases certainty in future catch amounts, thereby increasing security of capital investments. However, this allocation is unlikely to be efficient, especially if more sectors adopt rights‐based measures and vessels begin to make profit‐maximizing changes to their operations under the new management system. Furthermore, trawl portions of the TAC for other nontrawl‐dominated species will continue to be decided in the biennial specification process.
Without the potential for trade across sectors, the efficient solution will not be attainable. The current design limits fishermen’s options rather than allowing them the freedom and flexibility to determine the optimal combination of inputs for harvesting groundfish. Under the current restrictions, we should not expect that the overall TAC will be harvested at the lowest possible cost.
CarryForward and CarryBack Restrictions
If a vessel has excess QP at the end of a season, the QP owner can take advantage of the carry‐forward provision and bank the QP to use in the subsequent year. Inversely, if a QP owner is short QP to cover a catch, the owner may borrow against the subsequent year’s allocation of QS to cover the overage. Carry‐forward and carry‐back of quota pounds are allowed but only up to 10 percent of the year’s allocation.
Limitations on Retrospective Balancing
The proposed regulations allow for retrospective balancing but require that the QP be transferred to the vessel account within 30 days of landing to avoid penalty.
Limitations on Accumulation of Quota
The council has proposed that accumulation limits be imposed on both QS and QP (Table 5). The limits on QS apply to the percentage of the TAC a QS owner may control. The limits on QP are twofold. First, for overfished species and halibut, the council is proposing “unused” QP limits on the percentage of a given year’s TAC that a vessel can hold in its account at any point in time. Second, for all species, it is proposing “season” QP limits on the percentage of a given year’s TAC that any vessel can fish over the entire season.
For nonoverfished, nonhalibut species, the only binding QP limit is the season limit. For overfished species and halibut, the season QP limit is greater than or equal to the unused limit. Thus, if a vessel acquires the maximum unused QP allocation at the start of the season and then fishes down these QP, it could purchase additional QP from other QP holders to cover an overage, or with a plan to fish more. However, the maximum QP a vessel can purchase is bounded by the season limit. On the other hand, the unused limit is set below the season limit to restrict the amount of QP a vessel can potentially “hoard” and plan to sell at the end of the season, when QP prices may be higher.

15KROETZ AND SANCHIRICO
Table 5. Control and Vessel Limit Options: Council‐Preferred Alternative
Species category
Season QP limit
Unused QP limit QS
control limit
(vessel use limit)
QP limit
Nonwhiting groundfish 3.2% 2.7%
Lingcod (coastwide) 3.2% 2.5%
Pacific cod 20.0% 12.0%
Pacific whiting (shoreside) 15.0% 10.0%
Pacific whiting (mothership) 30.0% 20.0%
Sablefish
N. of 36° (Monterey north) 4.5% 3.0%
S. of 36° (Conception area) 15.0% 10.0%
Pacific ocean perch 6.0% 4.0% 4.0%
Widow rockfish* 8.5% 5.1% 5.1%
Canary rockfish 10.0% 4.4% 4.4%
Chilipepper rockfish 15.0% 10.0%
Bocaccio 15.4% 13.2% 13.2%
Splitnose rockfish 15.0% 10.0%
Yellowtail rockfish 7.5% 5.0%
Shortspine thornyhead
N. of 34°27' 9.0% 6.0%
S. of 34°27' 9.0% 6.0%
Longspine thornyhead
N. of 34°27' 9.0% 6.0%
Cowcod 17.7% 17.7% 17.7%
Darkblotched 6.8% 4.5% 4.5%
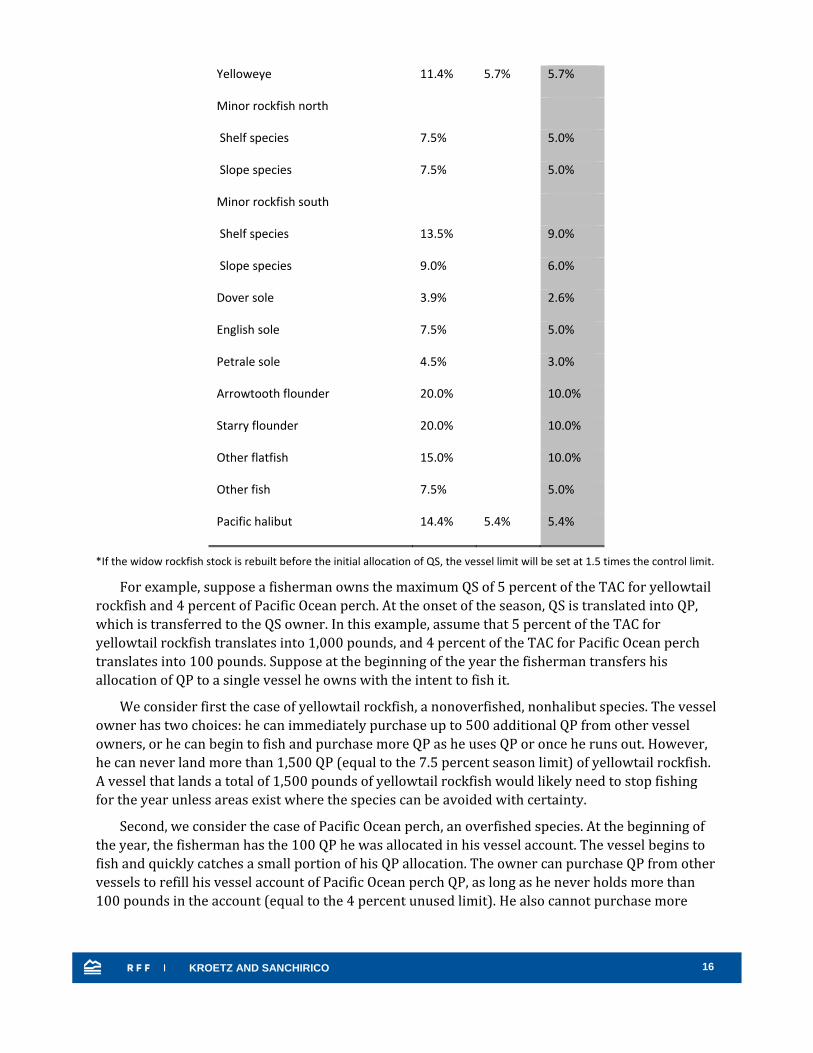
16KROETZ AND SANCHIRICO
Yelloweye 11.4% 5.7% 5.7%
Minor rockfish north
Shelf species 7.5% 5.0%
Slope species 7.5% 5.0%
Minor rockfish south
Shelf species 13.5% 9.0%
Slope species 9.0% 6.0%
Dover sole 3.9% 2.6%
English sole 7.5% 5.0%
Petrale sole 4.5% 3.0%
Arrowtooth flounder 20.0% 10.0%
Starry flounder 20.0% 10.0%
Other flatfish 15.0% 10.0%
Other fish 7.5% 5.0%
Pacific halibut 14.4% 5.4% 5.4%
*If the widow rockfish stock is rebuilt before the initial allocation of QS, the vessel limit will be set at 1.5 times the control limit.
For example, suppose a fisherman owns the maximum QS of 5 percent of the TAC for yellowtail rockfish and 4 percent of Pacific Ocean perch. At the onset of the season, QS is translated into QP, which is transferred to the QS owner. In this example, assume that 5 percent of the TAC for yellowtail rockfish translates into 1,000 pounds, and 4 percent of the TAC for Pacific Ocean perch translates into 100 pounds. Suppose at the beginning of the year the fisherman transfers his allocation of QP to a single vessel he owns with the intent to fish it.
We consider first the case of yellowtail rockfish, a nonoverfished, nonhalibut species. The vessel owner has two choices: he can immediately purchase up to 500 additional QP from other vessel owners, or he can begin to fish and purchase more QP as he uses QP or once he runs out. However, he can never land more than 1,500 QP (equal to the 7.5 percent season limit) of yellowtail rockfish. A vessel that lands a total of 1,500 pounds of yellowtail rockfish would likely need to stop fishing for the year unless areas exist where the species can be avoided with certainty.
Second, we consider the case of Pacific Ocean perch, an overfished species. At the beginning of the year, the fisherman has the 100 QP he was allocated in his vessel account. The vessel begins to fish and quickly catches a small portion of his QP allocation. The owner can purchase QP from other vessels to refill his vessel account of Pacific Ocean perch QP, as long as he never holds more than 100 pounds in the account (equal to the 4 percent unused limit). He also cannot purchase more

17KROETZ AND SANCHIRICO
than a total of 50 QP (equal to 2 percent of the TAC). If he purchases a 50 QP, his total QP fished would be equal to the unused cap of 6 percent of the TAC. If the vessel landed a total of 150 pounds of Pacific Ocean perch, it would likely need to stop fishing for the year unless areas exist where this species can be avoided with certainty. The other option would be for the vessel owner to borrow from next year’s allotment.
Role of Voluntary Risk Pools
The Pacific Ocean perch example illustrates how the unused limit affects LE trawl fishermen, but risk pools – mechanisms that may facilitate QP trading – can also help prevent QP hoarding while affording fishermen flexibility in matching their catch with quota.7 A risk pool occurs when multiple QP owners agree to allow each other access to their QP should anyone in the pool fish beyond their allocation. Specifically, the unused limit in addition to the season limit gives vessels the leeway to acquire additional QP to cover cases of accidental catch beyond the unused limit while simultaneously ensuring that no vessel can fish vigorously in anticipation of using up the QP of other vessels in the risk pool.
Within a risk pool, a vessel can plan to fish its unused allocation and at the same time expect others in the pool to cover an overage, should it occur. In the Pacific Ocean perch example, if the vessel owner was part of a risk pool and caught 105 pounds of Pacific Ocean perch his first day out, he could count on the other QP owners in the risk pool to sell him the 5 QP to cover his overage. This fisherman could also be called upon to contribute QP to another vessel in the pool. However, the vessel is protected by the season limit the other vessels face, and therefore the amount of QP the vessel will be called upon to contribute to other vessels is limited.
Suppose there were only two fishermen in the risk pool in the Pacific Ocean perch example. Near the end of the season, one vessel owner had left 60 QP of his initial allocation of 100, while the other vessel had 10 QP. If the latter fisherman caught 60 pounds of Pacific Ocean perch, he would have 50 outstanding pounds of Pacific Ocean Perch not covered by his QP. The former would be obligated to transfer 50 of his 60 QP to the vessel owner with the overage but would not have to contribute more than 50 QP because of the season limit. More specifically, because the vessel with the overage hit the season limit, it would not be permitted to catch anymore Pacific Ocean perch for the season. Therefore, the vessel without the overage will be guaranteed to keep his remaining 10 QPs.
Permit Transfer Restrictions
Length endorsements on a permit specify the maximum length of a vessel. Under the proposed GT ITQ program, length endorsements on LE groundfish trawl permits will remain in effect. Because a vessel outside the permitted trawl fleet looking to buy quota must first buy a trawl permit, the vessel would need to make sure the permit contains a valid length endorsement.
7 Precisely how these risk pools will form and function is not described. For example, we do not know how carry-over and carry-back restrictions would affect risk pools, what price the fisherman accessing risk pool QP would pay for the QP, what happens when the risk pool runs out of QP, or what the rules and regulations of risk pools would be. Given that under the proposed ITQ program the formation of risk pools is voluntary, we cannot predict the degree to which they will form. In general, the idea of risk pools is interesting, and additional research on how they will form and function is warranted.

18KROETZ AND SANCHIRICO
4. Theory and Empirics on Measuring Costs of Restrictions In general, imposing restrictions on the use of quota constrains the flexibility of fishermen to
adjust their capital and labor mix to find the combination that maximizes the economic return from fishing.
Without doing a theoretical or empirical analysis, we know that Le Chatelier’s principle applies to our problem. This principle states that a solution to a constrained maximization problem is always less than or equal to the solution of the unconstrained maximization problem. That is, these restrictions impose costs by constraining a fisherman’s ability to attain the greatest economic return. We also know that the more constraining the restriction (the more binding the constraint), the greater the costs. The corollary is that constraints that do not really change behavior will have lower costs, everything else being equal.
In this section, we use a stylized equilibrium model of QP prices to develop intuition on the likely costs of transfer restrictions. Our stylized equilibrium model does not include many important details, such as the transition to the equilibrium, the costs of management and science, and the potential heterogeneity in fishing skill. Developing a model with all of these factors would bring more realism to the analysis for a particular fishery but at the potential cost of obscuring the underlying intuition. After presenting the model, we discuss the different approaches to estimating the efficiency costs associated with regulatory transaction costs; we then review studies that have estimated the costs of various restrictions.
Model of QP Prices in a Well-Functioning Market Under our assumptions and in a well‐functioning market, QP and QS sale prices contain
information on the economic value of the fishery to society. The QP prices reflect the current profit (resource rent) generated in the fishery, and QS sale prices reflect the present value of future profit expectations (QP prices) (Newell et al. 2007).
In what follows, we present the following cases: (1) a single‐species fishery with perfect gear selectivity; (2) two sectors in a single‐species fishery with perfect gear selectivity; and (3) a multispecies setting with imperfect selectivity.
Case 1: SingleSpecies Fishery, Perfect Gear Selectivity
The equilibrium price per unit of QP equals the marginal revenue less the marginal cost of fishing for species i, or the per unit value of the fishery (or economic rent) (Grafton 1995; Squires and Kirkley 1995; Vestergaard 1999). At the equilibrium QP price, no vessel benefits from buying or selling an additional QP. In addition, every vessel’s marginal cost is equal to that of every other vessel.
Define p to be the ex‐vessel price of fish, s the per unit price of the QP, and let MC denote the marginal cost of fishing species i. The marginal cost of fishing includes labor, boat expenses, fuel, gear, steam time, species population level, and other factors. We consider the case where the ex‐vessel price is independent of catch level – a reasonable assumption for fisheries selling their catch in a world market with substitutes available (e.g., whitefish). Under our assumptions, the equilibrium price in the market is
19KROETZ AND SANCHIRICO
i i is p MC= − (1)
Equation (1) illustrates that the value of the fishery is greater the higher is the ex‐vessel price and/or lower is the marginal cost of fishing. If the search costs that fishing vessels incur when attempting to locate fish are significant, then the greater the fish population level, the lower the marginal cost of fishing. This is known as the stock effect in the fisheries economics literature. Many argue that the existence of a stock effect provides an economic incentive for quota owners to be advocates for sustainable, healthy fish populations (e.g., Wilen 2006). We can calculate the equilibrium economic value of the fishery by multiplying the QP price and the TAC. Specifically, we have Vi=si*TACi, where Vi is a measure of the annual economic value of the fishery for species i once an equilibrium is obtained.
Suppose that there exists a constraint on the amount of QP that each QP owner can use in any given year in the fishery. In this case, the quota price is
r
i i i is p MC λ= − − (2)
where λi is the cost of the constraint, and the superscript r represents price in the constrained setting. If the constraint is not binding, then λi is equal to zero and the prices are the same.
What is the economic cost of the restriction? On an annual basis, an estimate of the loss is equal to
( )*r ri i i iV V s s TAC− = − (3)
For example, consider a fishery with a TAC of 100,000 pounds and where the unrestricted QP price is estimated to be $1 greater than the restricted QP price. In this example, the cost of keeping the restriction in place for the year is $100,000 (Wilen and Brown 2000).
It is important to point out that these costs are not simply additional outlays on capital and labor of a particular fisherman but also include the opportunity costs, which are the lost returns from not using these resources in their next best available option. The distortions, therefore, result in societal costs.
Case 2: Two Sectors Harvesting One Species
We expand our analysis to include two sectors harvesting the same species but subject to different TACs. Initially, we assume that there is a separate ITQ program in place for each sector and that vessels operate in either one but not both sectors. For expositional reasons, we denote one sector the trawl sector, identified by a T subscript, and the other the fixed gear sector, identified by a G subscript.
We also assume that the quota market for each sector is well functioning (which includes sufficient liquidity). The equilibrium quota prices in each sector are
, , ,
, , .
i T i T i T
i G i G i G
s p MCs p MC
= −
= − (4)
Suppose that the quota pound price for the fixed‐gear sector is higher than for the trawl sector (si,T < si,G). The difference could be because of a higher ex‐vessel price or lower marginal costs or

20KROETZ AND SANCHIRICO
both. When the ex‐vessel prices are the same, the difference in quota prices will reflect the difference in marginal costs across the two fleets.
What is the potential cost of not permitting trading across the sectors? To answer this question, we need to predict what might happen to the equilibrium QP when the trading restriction is removed. After trading is permitted, it is unlikely that ex‐vessel prices for either sector will change, since both were already operating under an ITQ program. This also assumes that prices are not responsive to catches. In addition, the marginal cost of catching fish is unlikely to change after trading is permitted. If these conditions hold, then fixed‐gear fishermen will buy up the trawl quota and the equilibrium price will be equal to si,G. Then the economic cost of not allowing trade is
, ,( )*i G i T Ts s TAC− (5)
where TACT is the total allowable catch for the trawl fleet. We derived equation (5) under the assumption that the two ITQ markets were well functioning.8
What if accumulation limits are imposed on each sector? Equation (7) can be modified to account for this. Interestingly, the outcome is not clear ex ante because accumulation limits might be more constraining in one sector than the other. Suppose, for example, that the cost of the accumulation limit is more binding in the fixed‐gear sector. It is possible that the costs could be so great as to switch the relative value of the two fisheries. In other words, we could have si,T ‐ λi,T > si,G‐ λi,G. This might happen if the value of the quota is not significantly different between the two sectors and the limits are more binding in the fixed‐gear sector. The fact that the quota values were similar initially implies that the cost of imposing the restrictions is likely small in this case.
What are the effects on the costs if one fishery has an ITQ and the other fishery is regulated with a nonrights–based management system (e.g., trip limits)? Let’s assume that the trawl sector is operating under an ITQ and all of the other prices and costs are unchanged, except that the economic value of the fixed‐gear sector is dissipated. The economic costs of this management scenario are , , ,* ( )*i G G i G i T Ts TAC s s TAC+ − (6)
where si,G is the predicted equilibrium quota price in the fixed‐gear sector if it is operating under an ITQ system (which we assume for simplicity is the realized price in equation 4). The first component of the cost captures the forgone economic value by leaving the fixed‐gear sector out of the ITQ system. The second component is the same as before (assuming that the economic value is greater in the fixed‐gear sector).
If the economic conditions are reversed (si,T > si,G), then the costs of not managing the fixed‐gear sector with an ITQ and not allowing trading across the sectors is equal to GTi TACs *, (7)
8 Suppose, however, that the QP market for trawlers is thin (e.g., because demand is low). In this case, the quota pound price in the trawl fleet would be lower in equilibrium, and the gain from removing the trading restrictions across the sectors is even greater.

21KROETZ AND SANCHIRICO
Equation (7) is an estimate of the forgone economic value of leaving the fixed‐gear sector out of the ITQ program. This analysis could be expanded to include other sectors that are left out of the ITQ program. A similar analysis, for example, holds if the ITQ applies only to a specific length class.
A caveat is that our stylized depiction assumes no interactions between the sector in the ITQ and the one outside. It is possible that the non‐ITQ sector incurs an overage of its share of the TAC, and the result is a reduction in the entire TAC – not just this sector’s share. If this is the case, then there are additional costs that are not accounted for in equations (6) or (7). These kinds of interactions are likely in a multispecies context, especially with interactions that include prohibited and bycatch species.
Case 3: Multispecies ITQ settings
Moving from a single to a multispecies setting introduces some modeling complexities. For expositional reasons, we will focus on two species, but the intuition generalizes to the setting with more species. One complexity is how much the catch of one species can be targeted. If the species occur in different habitats (locations and/or depths), then catch is more likely to be selective. On the other hand, if the species are perfectly mixed throughout their lifecycles, then the share of the species in the catch follows on average the relative population sizes. In most settings, species mixing is imperfect. The implication is that fishermen have some ability to avoid areas with likely high bycatch, especially if not avoiding the species is costly, as is the case with overfished and prohibited species.
We generalize our single‐species model by assuming that the cost of fishing is a function of the total catch, h, which comprises some share of species 1 and species 2. We can represent the total catch function in general notation as h=h(q1 , q2) , where qi is the catch of each species that must be covered by QP. The previous single‐species analysis is a special case where the species can be selectively targeted. The QP equilibrium price for species i is
i i i ii
C hs p MC ph q
∂ ∂= − = −
∂ ∂ for i=1,2 (8)
where the marginal cost captures both the increase in cost from increasing total catch (∂C/∂h) and the change in total catch with a change in the catch of species i (∂h/∂qi).
In this setting, increasing the catch of one species increases the total catch (hence the catch of species 2). The owners therefore need to hold the necessary QP for species 2. In other words, the QP markets are integrated. We can see this by rearranging equation (8) for species j to get
( )j j
j
p sChhq
−∂=
∂∂∂
(9)
We can substitute equation (9) into the quota price for species i. The equilibrium quota price for species i is a function of the economic conditions of species j. In particular, we have
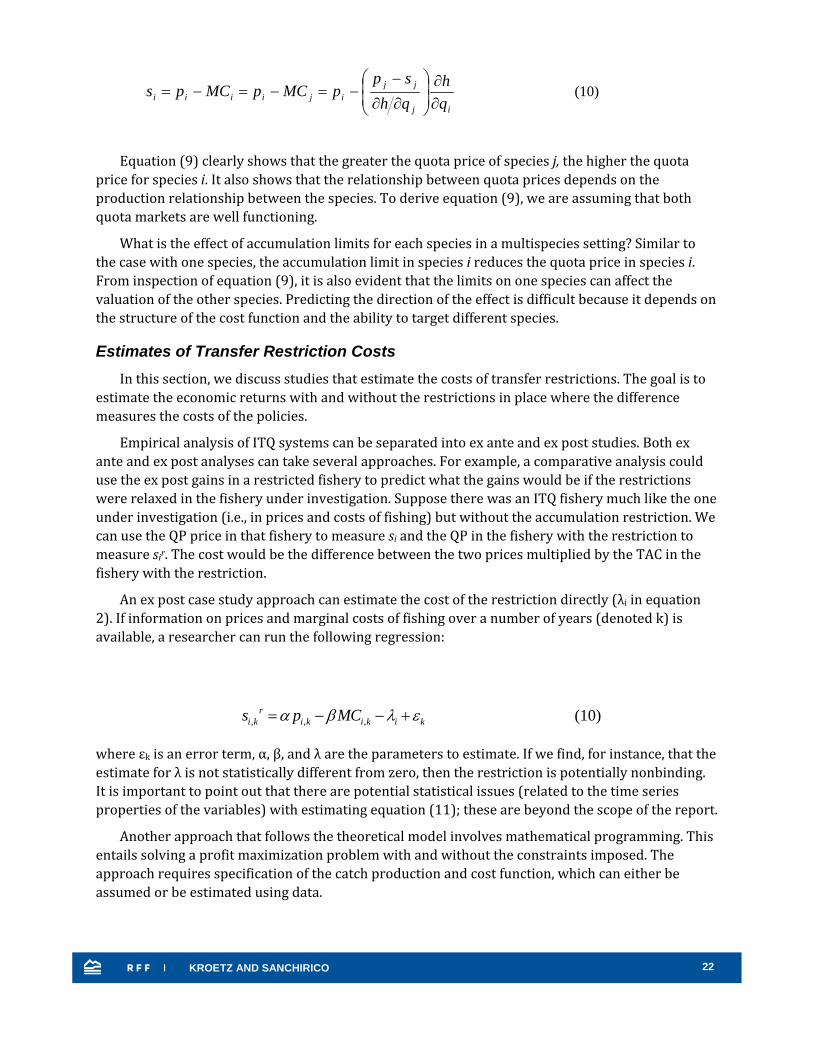
22KROETZ AND SANCHIRICO
ij
jjijiiii q
hqhsp
pMCpMCps∂∂
⎟⎟⎠
⎞⎜⎜⎝
⎛
∂∂
−−=−=−= (10)
Equation (9) clearly shows that the greater the quota price of species j, the higher the quota price for species i. It also shows that the relationship between quota prices depends on the production relationship between the species. To derive equation (9), we are assuming that both quota markets are well functioning.
What is the effect of accumulation limits for each species in a multispecies setting? Similar to the case with one species, the accumulation limit in species i reduces the quota price in species i. From inspection of equation (9), it is also evident that the limits on one species can affect the valuation of the other species. Predicting the direction of the effect is difficult because it depends on the structure of the cost function and the ability to target different species.
Estimates of Transfer Restriction Costs In this section, we discuss studies that estimate the costs of transfer restrictions. The goal is to
estimate the economic returns with and without the restrictions in place where the difference measures the costs of the policies.
Empirical analysis of ITQ systems can be separated into ex ante and ex post studies. Both ex ante and ex post analyses can take several approaches. For example, a comparative analysis could use the ex post gains in a restricted fishery to predict what the gains would be if the restrictions were relaxed in the fishery under investigation. Suppose there was an ITQ fishery much like the one under investigation (i.e., in prices and costs of fishing) but without the accumulation restriction. We can use the QP price in that fishery to measure si and the QP in the fishery with the restriction to measure sir. The cost would be the difference between the two prices multiplied by the TAC in the fishery with the restriction.
An ex post case study approach can estimate the cost of the restriction directly (λi in equation 2). If information on prices and marginal costs of fishing over a number of years (denoted k) is available, a researcher can run the following regression:
, , ,r
i k i k i k i ks p MCα β λ ε= − − + (10)
where εk is an error term, α, β, and λ are the parameters to estimate. If we find, for instance, that the estimate for λ is not statistically different from zero, then the restriction is potentially nonbinding. It is important to point out that there are potential statistical issues (related to the time series properties of the variables) with estimating equation (11); these are beyond the scope of the report.
Another approach that follows the theoretical model involves mathematical programming. This entails solving a profit maximization problem with and without the constraints imposed. The approach requires specification of the catch production and cost function, which can either be assumed or be estimated using data.
23KROETZ AND SANCHIRICO
Regardless of the case study methodology, the data required to estimate the costs of the restrictions include variable inputs and outputs for the production process.9 The variable inputs include population size, fuel, ice, provisions, bait, days or hours at sea, tow duration, crew size, crew hours, and crew pay. Output can be measured in pounds or in revenue or price per pound. Other variables to consider are measures of ecological uncertainty, such as weather variability and mortality of fish, which can lower the value of any quota.
Aside from the ex ante, ex post aspect of the analysis, the decision about which approach to use is generally based on data availability and the set of questions the researcher is addressing.
Empirical Measures of Transfer Restriction Costs We undertook an exhaustive literature search for studies measuring the actual costs of trading
restrictions on the efficiency of ITQs.10 These studies are listed in Table 6, in alphabetical order by primary author. We discuss a broader range of efficiency and technical analysis of ITQ schemes based on whether the study was ex ante or ex post. Our review highlights key literature and findings relevant to the west coast groundfish fishery.
Summaries of the articles and their methods and findings appear in chronological order by publication date.
9 Quasi‐fixed costs are also included in some analyses, when researchers are interested in predicting the long‐run fleet structure post‐ITQ implementation where quasi‐fixed costs affect the entry and exit decisions of vessels. Quasi‐fixed inputs include vessel length, vessel tonnage, vessel horsepower, vessel value, and maintenance and insurance (potential proxies for capital). 10 Google Scholar and major academic databases, including EBSCOHost, JSTOR, and ScienceDirect, were searched for ITQ, IFQ, dedicated access privilege, and catch share, in conjunction with terms including restriction, efficiency, profit, trade, and gain. Once relevant articles were identified, we reviewed their citations, as well as the literature that cited those articles.
24KROETZ AND SANCHIRICO
Table 6. A Selection of Studies Investigating Cost of Trading Restrictions
Fishery Restriction Method Finding Reference
Danish fishery
Species mix caught
Ex ante Increases in gross profit under ITQs were 23% higher when species mix was allowed to change, versus case when only trade from less to more efficient vessels was considered. In each instance technology was assumed fixed.
Anderson and Bogetoft (2007)
British Columbia salmon
Trading between sectors
Ex ante Total resource rent if intersector trade were allowed was predicted to be $1 million (about 1% of total resource rent) greater than if intersector trade were restricted.
Dupont (2000)
British Columbia halibut
(1) Vessel length
(2) Trading volume
(1) Ex post
(2) Ex post
(1) Long‐run technical cost efficiency could increase from 0.14 to 0.70 if vessel length could be adjusted.
(2) 4% higher producer surplus could have been achieved without trading restrictions.
Grafton et al. (2000)
Australia South East Trawl Fishery
Volume of quota traded
Ex post (1) 1% increase in volume of quota traded resulted in cost‐side efficiency gains ranging from 1% to 2.4% of total variable costs.
(2) Cost‐side gains decreased through time.
Kompas and Che (2005)
West coast groundfish fishery nonwhiting trawl sector
(1) Accumulation limits
(2) Trading across vessel classes
Ex ante (1) Accumulation limits of 1% would reduce expected cost‐side rent gain to fishery by 18.4%.
(2) Vessel class restriction would reduce expected cost‐side rent gain to fishery by 10.4%.
Lian et al. (2008)
Alaskan halibut
Divisibility of quota
Ex ante and ex post
Blocked QS prices traded approximately 10% below unblocked QS prices.
Wilen and Brown (2000)
Ex Ante Studies
Ex ante analyses predict the change in efficiency prior to implementation of the ITQ program. These studies typically assume that the fishing technology will be the same after implementation and that the price remains fixed. As such, they are able to account for technical efficiency gains: vessels make the most efficient use of inputs given current technology to make the greatest profit per QP.

25KROETZ AND SANCHIRICO
Harvesting activities, product quality, and costs, however, may be strongly influenced by the regulatory regime limiting the quality of the predictions. For instance, as we discussed earlier, moving from a non‐ITQ regime to an ITQ program has resulted in unanticipated gains in revenue and reductions in costs. Homans and Wilen (2005), for example, find evidence of revenue side gains in the British Columbia halibut, Australian southern bluefin tuna, Iceland demersal or groundfish, and U.S. wreckfish ITQ fisheries.
Potential allocative gains on the cost side of the ledger also fall outside the scope of these analyses. These gains can occur both at the fishery scale and for a vessel. With respect to the fishery, the allocation of capital will be more efficient, since less efficient vessels sell their quota to more efficient operations. At the vessel level, allocative gains result from shifts in the mix of species caught and fishing technology. These gains are due to the ability to better time trips, target specific areas, and take other measures to achieve the most profitable mix of species given the vessel capital and skill of the fishermen.
A possible outcome in a multispecies ITQ program is a fisherman targeting a particular group of species, especially in situations where species complexes can be fished with some precision. Fishermen specializing in certain species could be more efficient than if all vessels catch the same mix of species.
Ex ante modeling efforts, not surprisingly, are not be able to adequately predict all these changes. The studies do provide, however, a valuable window into the magnitude of the possible gains when switching to an ITQ program. Our summaries of these studies follow.
Squires et al. (1994) conducted an ex ante analysis of the outcome of implementing an ITQ management regime for sablefish in the west coast groundfish fixed‐gear sector. Using linear programming techniques, the authors solved a short‐run profit maximization problem subject to constraints including the TAC, vessel capital, and vessel size for the optimal number of fishing weeks for each vessel under an ITQ regime. They found an approximate 13 percent increase in efficiency from quota trading, resulting in rent per vessel under ITQs of approximately $74,000, and total rent to the fishery of approximately $10 million.
Dupont (2000) conducted an ex ante analysis of the British Columbia salmon fishery. The study utilized restricted cost functions for four vessel types (seine, gillnet, troll, and gill‐troll) and simulated the quota market that would occur under ITQs. She found that resource rent under ITQs would be approximately equal to one‐third the value of the fishery catch, and that an unrestricted ITQ system could generate quota rental prices of 31 to 93 cents per pound (18 to 53 percent of the average landed price). Additionally, restricting intersector trade by issuing separate TACs for each vessel type was shown to decrease total rent to the fishery by $1 million, or approximately 1 percent.
Guyader (2002) examined the effect of license allocation with and without driftnet regulation, individual nontransferable quotas, ITQs, and a driftnet ban on the profit of the French driftnet albacore fleet. Guyader used profit maximization models and simulated the results of the various management strategies to predict the total profit to the fishery under each scenario. The analysis indicated that among the management strategies, ITQs would generate the greatest rent. Guyader’s simulation of the quota lease market revealed that with ITQs, the more efficient vessels continued to fish and the less efficient vessels leased their albacore quota and targeted other species. The analysis assumed a well‐functioning and unrestrictive quota market.

26KROETZ AND SANCHIRICO
Weninger and Waters (2003) conducted an ex ante analysis of the cost‐side and revenue‐side gains for the Gulf of Mexico reef fishery to switch from its controlled‐access management system to an ITQ program. They assumed that no restrictions to trade (such as accumulation limits) exist under the ITQ program. They found that switching to unrestricted ITQs would result in a 48.6 percent increase in revenues and a 75 percent decrease in costs.
The estimated gains were based on a single year (1993) of data and are measured using a DEA‐style analysis.11 The authors placed species into three output groups using the criteria that species within each group were harvested at similar locations using the same technology. The authors predicted optimal vessel harvesting activity and the cost saving expected to occur under an ITQ program. Assumptions that might affect the results included error in predicting the potential harvest limit, the technology that would be available, and the optimal species mix once ITQs were in place.
To estimate revenue‐side gains, Weninger and Waters used a linear regression model and predicted the red snapper dockside price after ITQ implementation. They expected that the average ex‐vessel price per pound would increase from the observed $1.94 in 1993 to $2.88 if season closures were removed and fishermen could time landings to coincide with higher market prices.
Anderson and Bogetoft (2007) conducted an ex ante DEA‐style analysis for the Danish fishery and estimated the potential cost‐side efficiency gains from introducing ITQs. Their analysis revealed that reallocating catch from less to more efficient vessels without changes in technical efficiency or changing the output mix could increase gross profit by approximately 50 percent. They also investigated the potential efficiency gains from output mix changes while holding technology constant. They found that removing the stationary output mix assumption (common too many DEA‐style analyses) and modeling fishermen as being allocative efficient resulted in approximately a 73 percent increase in gross profit.
The drastic change in profit when the output mix was allowed to vary should be noted when reviewing the results of other DEA analyses for multispecies fisheries. Additionally, the analysis provided quantitative evidence that restrictions placed on QS or QP transfer that affect the degree to which vessels can change their species mix can result in substantial efficiency losses.
Lian et al. (2008) conducted a stochastic frontier analysis (SFA)12 to estimate the potential cost‐side efficiency gains from ITQ implementation in the west coast groundfish trawl sector. The
11 DEA measures how close the observed harvest levels (input levels) are to those output levels (input levels) corresponding to the production frontier, where the production frontier represents the efficient, or best practice, combination of inputs and outputs. DEA is a nonparametric approach, which means that no production, cost, or profit function is assumed. In other words, the relationship between inputs and outputs is not explicitly modeled. DEA is also nonstochastic, which means that all deviations from the frontier are attributed to inefficiency, not random error. Efficiency measures can be calculated based on deviations from the frontier. For example, technical efficiency, the degree to which inputs are overutilized, is calculated by taking the harvest quantity as given and calculating the ratio between the observed input levels to the calculated frontier input levels. If input price data are available, DEA can be used to examine the problem of cost minimization for a particular level of harvest. With price data, allocative efficiency, measured as the degree to which utilization of inputs in correct proportion relative to factor prices, can be measured in addition to technical efficiency. For a more detailed discussion of DEA, see Fare et al. (2000). 12 Unlike DEA analysis, which is nonstochastic, SFA assumes technical efficiency follows some statistical distribution, and includes an error term representing this relationship. SFA also includes an error for statistical noise. A potential drawback to SFA is that a functional form must be specified along with the distribution of the error terms. Similar to the case of DEA, if input

27KROETZ AND SANCHIRICO
authors focused on the nonwhiting portion of the trawl fleet. To address the multispecies nature of the nonwhiting trawl fleet, the authors grouped the species harvested into six output categories.
The first stage of the analysis estimated the groundfish harvest per vessel, number of vessels needed to harvest the LE trawl catch, designation of which vessels would exit the sector, and nongroundfish harvest per vessel that would exist under the ITQ regime. In the second step, the first‐stage results were used to estimate the potential economic benefits from the conversion to ITQs. The authors then calculated the harvesting costs under the current regime, harvesting costs under an unrestricted ITQ regime, and harvesting costs under the restricted ITQ regime (i.e., with accumulation limits).
The analysis predicted a 50 to 60 percent reduction in nonwhiting trawl vessels, or about 40 to 60 vessels post‐ITQ. The authors also estimated cost savings on the order of $18 million to $22 million per year, or about 60 percent of current costs. Additionally, they found that accumulation limits 2.5 percent or greater would not be binding (PFMC 2008). However, accumulation limits of 1 percent would reduce expected cost‐side rent gain to the fishery by 18.4 percent. They also investigated the costs associated with a limit on trading across vessel classes. Specifically, they analyzed the effects of setting aside 50 percent of the TAC to be harvested by boats 50 feet or less. Their model suggested that such a restriction would reduce expected cost gains 10.4 percent.13
Wilen (2009) used data from the British Columbia groundfish trawl fishery to estimate the potential gains of the west coast groundfish shoreside whiting and nonwhiting trawl sectors from switching to ITQs. The estimate was based on the assumption that the equilibrium quota prices in the west coast groundfish trawl sector would be similar to those in the province’s groundfish trawl fishery. Under these assumptions, the predicted quota value was approximately $200 million in the nonwhiting portion and $105 million in the whiting portion.
Ex post studies
Unlike ex ante studies, ex post analysis capture the potential changes in output and input mixes. A caution, however, is that the period of review may not be long enough to fully capture all the changes that will occur under ITQs. Vestergaard et al. (2005) find, for example, that restructuring post‐ITQ may be slower and more prolonged the greater the sunk costs in the fishery. Given that most fisheries are overcapitalized, a fisherman facing the prospect of exiting a fishery when ITQs are implemented may face a challenge in finding another productive use for the vessel. Therefore, this fisherman may continue to fish until some of the vessel capital has decayed (Vestergaard et al. 2005).
Wilen and Brown (2000) used ITQ prices from the Alaska halibut program to estimate efficiency losses from blocking restrictions. Blocking was introduced into the halibut ITQ program in an attempt to keep small, part‐time fishermen in the fishery. All initial allocations of less than 20,000 pounds were “blocked” from being traded in anything other than their original allocation amount. Furthermore, individuals were restricted from holding more than two blocks. Because blocking limits the divisibility of the ITQ right, blocked quota trades at lower QP and QS prices.
data are available, both technical and allocative efficiency can be estimated. For a more detailed discussion of SFA, see Kirkley et al. (2004). 13 In this study, maintenance and repair costs and vessel value estimates were based on data from the current regime, there was no accounting for skipper skill, and exploration of the potential for specialization was limited.

28KROETZ AND SANCHIRICO
Wilen and Brown observed that blocked QS prices traded $1, or approximately 10 percent, below unblocked quota prices. They estimated the total loss in efficiency as the difference in QS price times the TAC of 55 million pounds, resulting in a total present value efficiency loss of $55 million.
Grafton et al. (2000) conducted an SFA‐style analysis and measured efficiency pre‐ and post‐ITQ implementation in the British Columbia halibut fishery. This fishery has implemented its ITQ system in a unique way. Each vessel’s quota is divided in half, forming two shares. A vessel is allowed to fish a maximum of four shares; the maximum harvest of any vessel is therefore the sum of the four largest shares in the fleet, or 1.57 percent of the TAC. Permanent transfer of QS is permitted only if the vessel purchasing the QS does not have a halibut license, is purchasing a halibut license from the seller in conjunction with the quota share, and is no more than 10 feet longer than the vessel selling the quota share. Furthermore, halibut fishermen typically use their vessels in other fisheries that have length and size restrictions.
The authors found that length restrictions due to permitting requirements and volume of trade restrictions in the British Columbia halibut fishery significantly affected efficiency. The restrictions on vessel length selection were found to affect long‐run technical cost efficiency, which is measured as a ratio of the cost of the technically efficient set of inputs to the cost of the inputs actually used. The authors found that the long‐run technical cost efficiency would be five times greater if vessel length could be adjusted.
They also examined the effect of quota transfer on efficiency by using MP modeling. They found that if trade had not been restricted in the initial period, a 4 percent higher producer surplus could have been achieved.
Kompas and Che (2005) also conducted an ex post SFA‐style analysis. Their analysis focused on the Australian South East Trawl Fishery, where vessel efficiency was estimated at 90 percent at the beginning of the period under analysis. The authors used data from a four‐year period five years after ITQ implementation and found that a 1 percent increase in volume of quota traded resulted in cost‐side efficiency gains ranging from 1 to 2.4 percent of total variable costs. Cost savings through trade also decreased each of the final three years, which could be due to greater dissipation of the gains from trade the longer the system has been in place.
5. Design and Costs in the WC Groundfish Limited-Entry ITQ Program Using the methodology discussed in Section 4, we develop back‐of‐the‐envelope estimates of
the potential costs of the restrictions on intersector trade, accumulation limits, and length restrictions.14 The potential implications of the accumulation and length restrictions follow closely Lian et al. (2008).
Table 7 summarizes the design in the proposed ITQ program and compares it with the designs of multispecies programs around the world, as described in Sanchirico et al. (2006). The shaded boxes highlight rules that have changed since the inception of the ITQ program. All multispecies ITQ programs adapt and alter their rules over time, as economic, ecological, and social conditions change.
14 We also acknowledge that the two‐year moratorium on trading QS entails costs. However, we do not explicitly account for these costs in our analysis.
29KROETZ AND SANCHIRICO
The proposed program does not include deemed value payments or species equivalence components. Both of these instruments provide flexibility for the quota owner to match catches with quota holdings. Although Sanchirico et al. (2006) found that trading of quota pounds was by far the most utilized instrument for matching catches, deemed values and species equivalence are important features in New Zealand and Iceland, respectively. These instruments do entail additional monitoring and management costs, however, and they increase the risks associated with exceeding the TAC level in any given year.
Carry‐forward and carry‐back restrictions also provide flexibility to quota owners to match holdings and catches. In theory, restricting the ability of quota owners to smooth out their catches over time based on market and environmental conditions reduces the value of the enterprise. In practice, however, it is difficult to discern the magnitude of this cost. New Zealand, for example, removed the carry‐back provision after deciding that the increase in management costs to track the use of these provisions outweighed the benefits to the quota owners, especially since the owners had other flexibility measures at their disposal. In setting the levels of the restrictions, councils are balancing the need for flexibility against the risks of exceeding the TAC in any given year.
Table 7. Comparison of ITQ systems
British Columbia Nova Scotia Iceland
New Zealand Australia
West coast (proposed)
Permanent transfer Yes Yes Yes Yes Yes Delayed for 2 years
Temporary transfer Yes Yes Yes Yes Yes Yes
Intersector trading Yes Yes Yes Yes Yes —
Carry‐forward 30% 0% 20% 10% 20% 10%
Carry‐back 30% 1:1 reduction (no limit)
5% Dropped 20% 10%
Legal discarding — — — — Yes —
Deemed values — — — Yes — —
Species equivalence Yes Dropped Yes Dropped — —
Retrospective balancing
30 days after landed
45 days after landed, plus 2 months at end of year
3 days after landed
15 days after last day of month landed
End of fishing year
30 days after landed
Note: Shaded box indicates a change in the program.
The cost associated with relaxing the limit on retrospective balancing is also difficult to estimate. It depends on the penalty for not balancing in the specified period and on the ability of the quota owners to balance catches and holdings in the specified period (in terms of catch limitations, search costs, higher quota prices, etc.). With well‐functioning quota pound markets and the
30KROETZ AND SANCHIRICO
development of risk pools, 30 days should be ample time. Electronic report systems that include bid and ask prices and track vessel accounts in real time, such as Iceland’s quota management system (Sanchirico et al. 2006), can aid owners in the process of matching catches with holdings.
Intersector Trade Restrictions The proposed ITQ program is for the LE shoreside trawl sector. By limiting the scope of the
program, the council has essentially imposed ownership and transfer restrictions on the quota shares and pounds. As described in Section 4, the costs associated with the sector design can be estimated in several ways. Although the full cost requires taking into account the constraints that limit the interactions with the shoreside and offshore fleets, we focus only on the potential costs within a set of the shoreside sectors, including the fixed‐gear, open‐access, and trawl sectors.
In general, two aspects of the proposed program restrict intersector trade: (1) trawl vessels are limited to trawl TAC; and (2) fixed‐gear vessels and vessels in the open‐access sector are not permitted to purchase QP from the trawl allocation without the purchase of trawl permits.
In this section, our back‐of‐the‐envelope calculations focus on the sablefish fishery, for a number of reasons. First, as is evident in Table 8, the fixed‐gear sector targets sablefish, with a significant share of the 2006 landings coming from sablefish. Second, the ex‐vessel price differential between trawl‐caught and fixed‐gear‐caught sablefish is significant. The average price over the 2004–07 time frame for trawl is approximately $1.30 per pound and for fixed gear is approximately $2.25 per pound (PFMC 2008). The price differential implies that there are likely gains from catching the trawl TAC with fixed gear. Third, the fixed‐gear sablefish fishery is already managed with a quasi‐ITQ program (tiered permit stacking program), implying that the product prices currently observed are unlikely to change after implementation of the ITQ. Finally, the ex‐vessel price differential seems like a potentially important incentive for gear switching, making this fishery a good case study. We therefore investigate how the gear‐switching provisions can reduce the costs associated with a sector‐based design.
Table 8. Catch for Nonwhiting Trawl and Fixed‐Gear Sectors (2006 mt)
Species Nonwhiting trawl Fixed gear
Sablefish 2,654.3 3,119.3 Shortspine thornyhead 648.7 178.1 Longspine thornyhead 821.3 21.2 Dover sole 7,475.5 4.6 Petrale sole 2,690.1 4.1 English sole 1,291.4 0.0 Arrowtooth flounder 2,817.6 78.8 Other flatfish 1,854.9 4.1 Source: PFMC 2008.
We develop our back‐of‐the‐envelope calculations using equations (1) and (2) (from Section 4), which are derived under the assumption of a well‐functioning market, and the data presented in Table 9. Specifically, equation (1) illustrates that the quota pound price is equal to the difference between the ex‐vessel price and the marginal cost of fishing. We could, for example, estimate the

31KROETZ AND SANCHIRICO
marginal cost and subtract it from the ex‐vessel price to calculate the quota price (see discussion in Section 4 for more details).
Another possible method, and the one we use here, is to observe that a positive quota pound price implies that the ex‐vessel price is greater than the marginal cost. We also know, for example, that if the marginal cost is zero, then the quota price is equal to the ex‐vessel price. On the other hand, if the marginal cost is equal to the ex‐vessel price, then the quota price is equal to zero. This implies that the equilibrium quota pound price is some fraction (δ) of the ex‐vessel price, where δ is between zero and one. We depict this reasoning in equation (11).
0s p MC p MC s pδ= − > ⇒ > ⇒ = (11)
Of course, the magnitude of δ depends on the marginal cost. Substituting equation (11) into equation (2), we can show that the difference between the potential quota price for sablefish caught with fixed gear and the quota price for sablefish caught with trawl gear is
G T G G T Ts s p pδ δ− = − (12)
Equation (12) is the per pound cost of not permitting trades between the sectors.15 Using equation (12), we can develop a range for the costs. Without any calculation, we know that the upper and lower bounds on the costs per pound are simply the prices. That is, if δG=1 and δT=0, then the cost is equal to pG. Whether equation (12) is positive or negative depends on both the prices and the marginal costs of the fixed‐gear and trawl sectors. For example, even though we know that the ex‐vessel price is higher (pG> pT), the relative sizes of the marginal costs of fishing for sablefish by trawl and fixed gear are not immediately clear.
With respect to the ex‐vessel prices, two issues arise in using equation (12) to measure the costs. First, we are assuming that the ex‐vessel price does not change post‐ITQ. We do, however, have a significant body of evidence that shows that the focus on maximizing value rather than catch leads to investments in value‐added operations and in selling to higher‐end markets (e.g., fresh markets). If we fail to take into account these changes, we will underestimate the potential gains. Because the fixed‐gear (endorsed) sector has been operating for a number of years under a quasi‐ITQ system, any changes on the product side have most likely already occurred. Furthermore, most of the sablefish is sold in the fresh market (PFMC 2008). Introducing the ITQ system for the trawl fleet, therefore, is not likely to have significant changes to the product price, implying that in the long‐run our assumption of constant ex‐vessel prices before and after implementation is acceptable.16
15 Note that we are not yet considering the implications of the gear‐switching provisions. 16 There may be early price effects as the processing sector adjusts to the change in quantity of fish processed and the distribution of processing done over the course of the year. We concentrate on the long‐run where markets are operating efficiently and processors have adjusted to the new regime.

32KROETZ AND SANCHIRICO
Table 9. Variables and Data Used in Calculations
Variable Symbol Value Note and source
Ex‐vessel price of sablefish for fixed gear fleet
pG $2.25 per pound
Average price over 2004–07 (PFMC 2008)
Ex‐vessel price of sablefish for trawl fleet
pT $1.30 per pound
Average price over 2004–07 (PFMC 2008)
Ex‐vessel price of Dover sole for trawl fleet
PDS $.375 per pound
Average price over 2004–07 (PFMC 2008)
Ex‐vessel price of thornyhead for trawl fleet
pTH $ 1.29 per pound
Average price over 2004–07 (PFMC 2008)
Weighted price for Dover sole, shortspine thornyhead, and sablefish for trawl fleet
pDTS $ .43 per pound
Weights are TAC levels in table
Responsiveness of price of sablefish to increases in total catch
Θ .015 cents For every increase in 1,000 metric tons (based on Huppert and Best 2004)
Estimate for the sablefish allowable biological catch (ABC)
ABC 7,717 metric tons
(PFMC 2008)
Sablefish ABC estimate for trawl fleet in 2010 (North)
TACT 3,706 metric tons
**
Sablefish ABC estimate for open‐access fleet in 2010 (North)
TACOA 555.62 metric tons
**
Sablefish ABC estimate for fixed gear endorsed sector (North)
TACEFG 2,281.0 metric tons
**
Sablefish ABC estimate for fixed gear nonendorsed (North)
TACNEFG 402.55 metric tons
**
ABC estimate for trawl fleet for Dover sole
TACDS 27,153 metric tons
95% of ABC that is caught by trawl fleet (PFMC 2008)
ABC estimate for trawl fleet for shortspine thornyhead (North)
TACST 1820.2 metric tons
95% of ABC that is caught by trawl fleet (PFMC 2008)
Discount for block trading restrictions
Α 10% Based on Wilen and Brown (2000)
**We calculate the sector TAC levels from the allowable biological catch in 2010 using the formula employed by the council for the fishery north of Point Conception, where 10% of the total ABC is reserved for tribes, and of the remaining 90%, 8% goes to open access, 42% goes to the fixed‐gear sector, and 58% goes to the trawl sector. The fixed‐gear sector is then split, with 85% going to the endorsed and 15% to the nonendorsed sector. The proposed program does not change these shares.
Second, we are assuming that prices are not responsive to the additional fresh sablefish that would be on the market if the trawl quota is fished with fixed gear. We relax this assumption where we use a report by Huppert and Best (2004), who show that the price of sablefish is likely to decrease by 0.015 cents for every 1,000 metric ton increase in landings to investigate the effect of this assumption. To preview our results, we find that because the price differential in equation (1) will decrease with the increased catch, the costs from not permitting trade across the trawl and fixed‐gear sectors are lower, but only slightly.
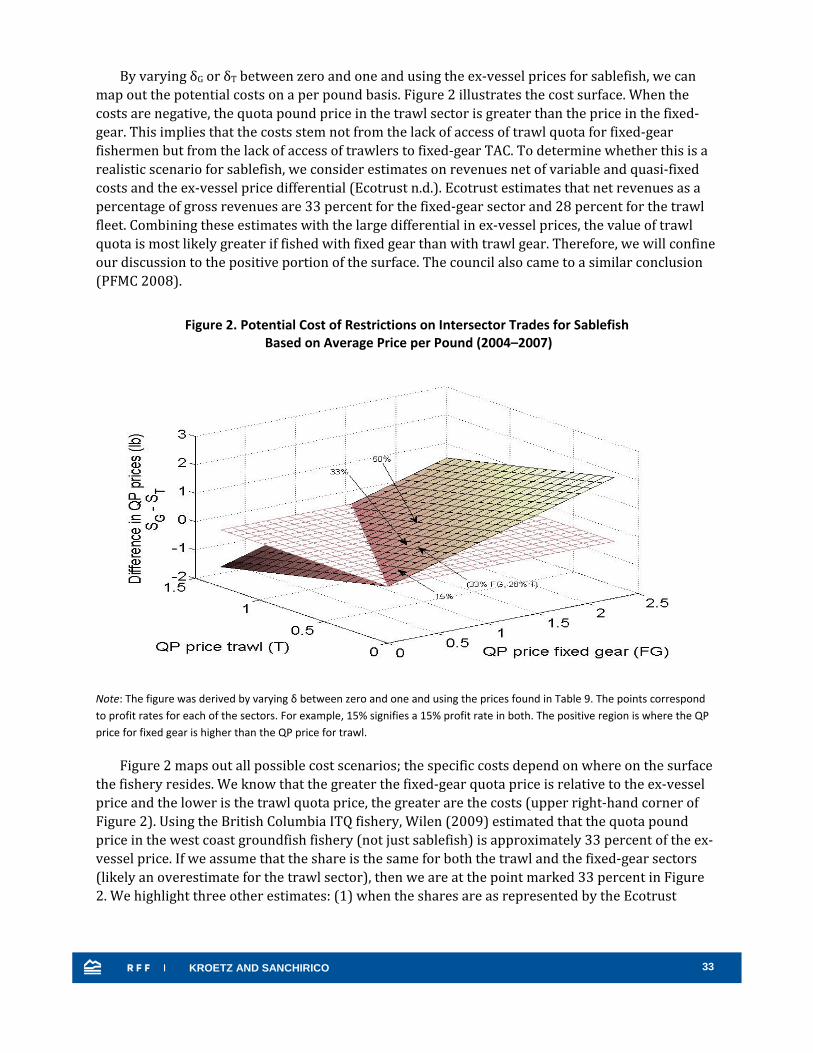
33KROETZ AND SANCHIRICO
By varying δG or δT between zero and one and using the ex‐vessel prices for sablefish, we can map out the potential costs on a per pound basis. Figure 2 illustrates the cost surface. When the costs are negative, the quota pound price in the trawl sector is greater than the price in the fixed‐gear. This implies that the costs stem not from the lack of access of trawl quota for fixed‐gear fishermen but from the lack of access of trawlers to fixed‐gear TAC. To determine whether this is a realistic scenario for sablefish, we consider estimates on revenues net of variable and quasi‐fixed costs and the ex‐vessel price differential (Ecotrust n.d.). Ecotrust estimates that net revenues as a percentage of gross revenues are 33 percent for the fixed‐gear sector and 28 percent for the trawl fleet. Combining these estimates with the large differential in ex‐vessel prices, the value of trawl quota is most likely greater if fished with fixed gear than with trawl gear. Therefore, we will confine our discussion to the positive portion of the surface. The council also came to a similar conclusion (PFMC 2008).
Figure 2. Potential Cost of Restrictions on Intersector Trades for Sablefish
Based on Average Price per Pound (2004–2007)
Note: The figure was derived by varying δ between zero and one and using the prices found in Table 9. The points correspond to profit rates for each of the sectors. For example, 15% signifies a 15% profit rate in both. The positive region is where the QP price for fixed gear is higher than the QP price for trawl.
Figure 2 maps out all possible cost scenarios; the specific costs depend on where on the surface the fishery resides. We know that the greater the fixed‐gear quota price is relative to the ex‐vessel price and the lower is the trawl quota price, the greater are the costs (upper right‐hand corner of Figure 2). Using the British Columbia ITQ fishery, Wilen (2009) estimated that the quota pound price in the west coast groundfish fishery (not just sablefish) is approximately 33 percent of the ex‐vessel price. If we assume that the share is the same for both the trawl and the fixed‐gear sectors (likely an overestimate for the trawl sector), then we are at the point marked 33 percent in Figure 2. We highlight three other estimates: (1) when the shares are as represented by the Ecotrust

34KROETZ AND SANCHIRICO
data—that is, 33 percent for the fixed‐gear sector and 28 percent for the trawl fleet; (2) when both are 15 percent of their respective ex‐vessel prices; and (3) when both are 50 percent of their respective ex‐vessel prices.17 All the estimates fall within the empirical estimates of profit rates from ITQ programs that are often in the 20 to 60 percent range (Sanchirico 2008).
To convert per pound annual costs to total annual costs (equation 2), we multiple the difference in quota prices with the estimated sablefish allowable biological catch (ABC) in 2010 for the trawl fleet, which is 3,704 metric tons. The maximum loss will occur when none of the trawl TAC is caught with fixed gear. The proposed ITQ program, however, permits trawlers to switch gears, and it also permits fixed‐gear fishermen to purchase trawl quota after purchasing a trawl permit and meeting the length requirements. Both of these provisions are likely to reduce the amount of the trawl TAC that is caught with trawl gear. However, the distributional impacts across both ports and types of fisherman will differ depending on whether the trawl TAC is fished by trawlers who switch gears or by fixed‐gear fishermen who acquire trawl quota.
Figure 3 illustrates how the annual loss changes as the percentage of the trawl TAC fished with fixed gear increases from zero to one. We show the costs for the same shares that we illustrate in Figure 2, except that we assume that the QP price for trawl‐caught sablefish is 28.6 percent of the trawl ex‐vessel price.
Figure 3. Annual Total Loss in Value as Function of Trawl TAC for Sablefish Caught with Fixed Gear
Note: Using the profit rates highlighted in Figure 2, we vary the amount of the trawl TAC that is fished with fixed gear
between zero and 100 percent. If no gear switching was allowed and fixed‐gear fishermen were restricted from
purchasing trawl vessel permits and quota, then the cost would be equal to the point where the line intersects the
vertical axis.
17 Dupont (2000) estimated a profit rate of 53 percent for the British Columbia salmon fishery.

35KROETZ AND SANCHIRICO
When the price of quota is 50 percent of the ex‐vessel price, which is on the high end of estimates for multispecies fisheries, the annual cost of the restriction is slightly below $4 million.
To put these costs into perspective, we calculate the expected sablefish revenue using the 2010 ABC and the ex‐vessel prices assumed in the analysis.18 The expected revenue is $13,515,000 for the fixed‐gear (endorsed) sector and $10,616,000 for the trawl sector. A cost of about $4 million, therefore, is equal to approximately 40 percent of the trawl ex‐vessel revenues in a given year. The loss from incurring an annual cost of $4 million over a 10‐year period at a 5 percent interest (discount) rate is about $35 million. Determining the per vessel costs in the trawl fleet requires an additional assumption on the number of vessels operating in the trawl sector in the equilibrium under the ITQ system. For example, using the estimated range of 40 to 60 equilibrium vessels in Lian et al. (2008), the cost is $100,000 per year with 40 vessels and $66,667 per year with 60 vessels.
Lower profit rates in the fisheries result in lower costs, everything else being equal. At a profit rate of 15 percent, the maximum cost is slightly above 1.2 million per year. Not surprisingly, increasing the amount of the trawl TAC fished with fixed gear lowers the cost, and when all the TAC is fished with fixed gear, there is no loss to imposing the restriction.
Up to now, our analysis has considered the restrictions between the trawl and fixed‐gear sectors. The total costs of the limitations in the program are higher, however, because the system does not address the current management systems for the nonendorsed fixed‐gear sector and the open‐access fishery. Furthermore, the ITQ program does not apply to the endorsed fixed‐gear fishery. To calculate the costs of all the limitations in the sector allocation, we use the intuition developed in equation (6). The total cost is19
( ) ( ) ( )G G OA NEFG G G EFG G G T T TTC p TAC TAC p TAC p p TACδ αδ δ δ= + + + − (13)
where G is fixed‐gear, TAC is total allowable catch, OA is open‐access, NEFG is nonendorsed fixed‐gear, EFG is endorsed fixed‐gear, T is trawl, and alpha is the discount in the value of the quota in the fixed‐gear endorsed sector due to the requirement to trade in blocks. We are assuming that if the other sectors are brought into the system, sablefish will be caught using fixed gear. The numbers used to calculate equation (13) are found in Table 9. For each of the runs, we assume that the QP price for trawl‐caught sablefish is 28.6 percent of the trawl ex‐vessel price.
Wilen and Brown (2000) observed in the Pacific halibut fishery that blocked QS prices traded $1, or approximately 10 percent, below unblocked quota prices. Based on their result, we set alpha equal to 0.1.20 Figure 4 illustrates how the total cost (equation 13) varies with the percentage of the 18 Throughout the analysis, we use the ABC rather than the OY, even though the OY is considered the management target for the regional fishery management councils. An implication of our assumption is that the (absolute) numbers will be an overestimate, but this will not systematically impact the percentage calculations. 19 Although the catcher‐processor, mothership, and recreational sectors are not under ITQs, we do not consider them in our analysis because the recreational sector is very small, and the catcher‐processor and mothership sectors primarily catch whiting. 20 Based on the economics of fishing for sablefish, it is very likely that some trawl TAC will be caught by trawl gear, but most will be taken by fixed gear. It is also likely that many vessels fishing the trawl quota with fixed gear will also be part of the sablefish endorsed tier permit trading system in the fixed‐gear sector. As more and more vessels begin to operate in both trading markets (trawl ITQ and sablefish tier permits), we expect the quota prices in the two markets to converge to values that are

36KROETZ AND SANCHIRICO
trawl TAC that is caught with fixed gear. As we found in the previous analysis, the greater the amount of trawl TAC that is caught using fixed gear, the lower the costs. Unlike Figure 3, however, the costs do not go to zero when the entire trawl TAC is caught using fixed gear. These additional costs represent the costs associated with leaving out the open‐access and nonendorsed sectors and maintaining the block trading restrictions in the endorsed sector.
Figure 4. Total Annual Cost (Loss in Value) as Function of Trawl TAC for Sablefish being Fished with Fixed Gear
Note: To derive the results in the figure, we use equation (13) and the data in Table 9. We vary the profit rate of the fixed‐gear fleet from 20 to 50 percent while holding the profit rate of the trawl sector at 28.6 percent. If the profit rate of the trawl fleet goes down, then the costs increase (lines shift upward).
The cost of not including all the shoreside sectors in the program is approximately double the cost when we considered only the trawl sector. When none of the trawl TAC is fished with fixed gear and the profit rate in fixed‐gear sector is 50 percent, the costs are slightly above $9 million per year. The trawl ex‐vessel revenue, using the data in Table 9, is $10,616,000. The costs, therefore, are 84 percent of the revenues. It is possible that the cost of omitting the other sectors could be greater than the gains from instituting the trawl ITQ. For example, if the trawl profit rate is 30 percent and the profit rate for fixed gear is 50 percent, which is likely a very high estimate, then the costs are approximately $9 million per year and the gains are slightly greater than $4 million. On the other hand, if the profit rate of sablefish in both sectors is 20 percent, then the costs are below $2 million per year and gains are slightly greater than $2 million. In general, whether the gains are greater than the costs depends on the relative profitability of sablefish fishing using fixed gear and trawl gear and the amount of trawl TAC caught with fixed gear (which, as we discuss below, is a function of the fishing profits from the trawl multispecies complex).
similar, but with slightly lower values in the sablefish endorsed permit market because of the lack of divisibility of the tiered permits. Our current assumption is that the values are 10 percent lower.
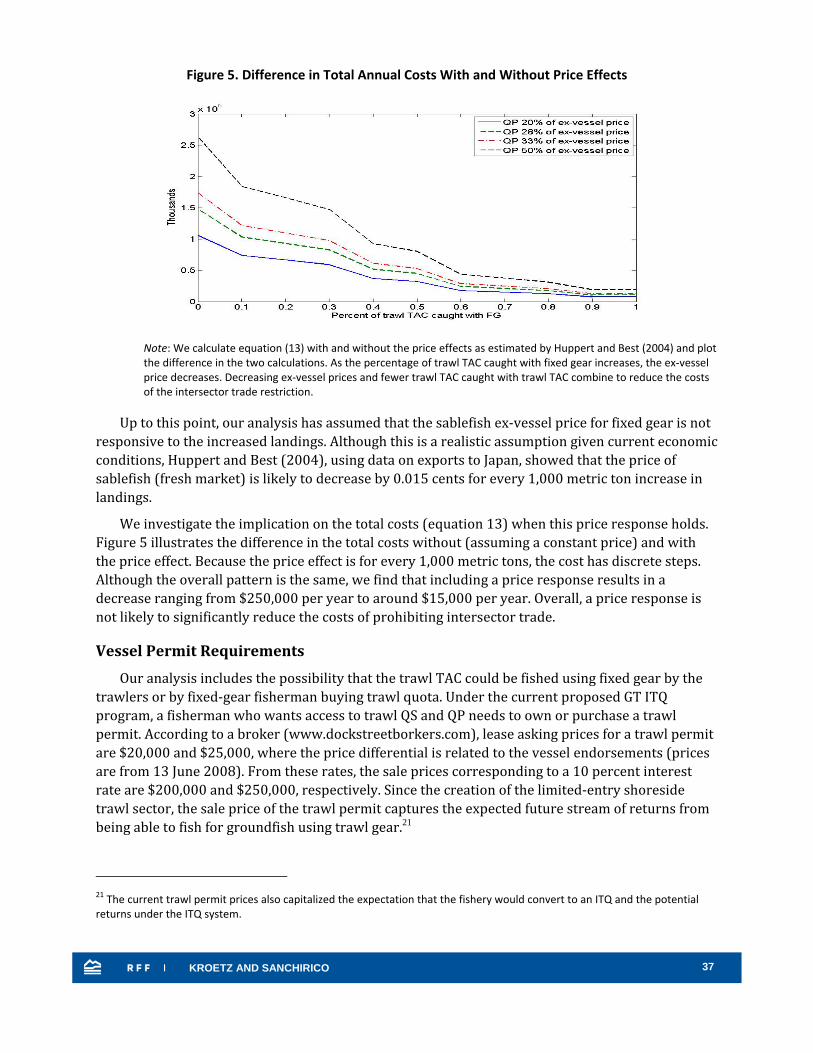
37KROETZ AND SANCHIRICO
Figure 5. Difference in Total Annual Costs With and Without Price Effects
Note: We calculate equation (13) with and without the price effects as estimated by Huppert and Best (2004) and plot the difference in the two calculations. As the percentage of trawl TAC caught with fixed gear increases, the ex‐vessel price decreases. Decreasing ex‐vessel prices and fewer trawl TAC caught with trawl TAC combine to reduce the costs of the intersector trade restriction.
Up to this point, our analysis has assumed that the sablefish ex‐vessel price for fixed gear is not responsive to the increased landings. Although this is a realistic assumption given current economic conditions, Huppert and Best (2004), using data on exports to Japan, showed that the price of sablefish (fresh market) is likely to decrease by 0.015 cents for every 1,000 metric ton increase in landings.
We investigate the implication on the total costs (equation 13) when this price response holds. Figure 5 illustrates the difference in the total costs without (assuming a constant price) and with the price effect. Because the price effect is for every 1,000 metric tons, the cost has discrete steps. Although the overall pattern is the same, we find that including a price response results in a decrease ranging from $250,000 per year to around $15,000 per year. Overall, a price response is not likely to significantly reduce the costs of prohibiting intersector trade.
Vessel Permit Requirements
Our analysis includes the possibility that the trawl TAC could be fished using fixed gear by the trawlers or by fixed‐gear fisherman buying trawl quota. Under the current proposed GT ITQ program, a fisherman who wants access to trawl QS and QP needs to own or purchase a trawl permit. According to a broker (www.dockstreetborkers.com), lease asking prices for a trawl permit are $20,000 and $25,000, where the price differential is related to the vessel endorsements (prices are from 13 June 2008). From these rates, the sale prices corresponding to a 10 percent interest rate are $200,000 and $250,000, respectively. Since the creation of the limited‐entry shoreside trawl sector, the sale price of the trawl permit captures the expected future stream of returns from being able to fish for groundfish using trawl gear.21
21 The current trawl permit prices also capitalized the expectation that the fishery would convert to an ITQ and the potential returns under the ITQ system.

38KROETZ AND SANCHIRICO
Upon first glance, these sale prices would seem to imply that there are significant transaction costs for fixed‐gear vessels acquiring trawl quota. We agree, however, with the Pacific Fishery Management Council that post‐ITQ, the value of the trawl sector will be captured in the value of the QS rather than the permit price (PFMC 2008).
Furthermore, capacity estimates suggest that an additional 50 to 60 trawl vessels may exit the trawl sector because of excess capacity relative to the present TAC in the fishery, which should lead to an excess supply of permits (Lian et al. 2008). Therefore, in a well‐functioning ITQ system, the permit prices should go to zero as the value is completely capitalized in the quota share price and there is excess supply of permits. Evidence from fisheries around the world, however, suggests this is not necessarily the case because of imperfections in management, such as when TACs are not binding, vessel accumulation limits and availability of permits constrain fishery harvest, and not all target species are included in the ITQ system (Pascoe and Gibson 2009).
A fixed‐gear fisherman who can purchase a trawl permit could fish his fixed‐gear sablefish allocation plus up to 4.5 percent (Monterey north) or 15 percent (Conception area) of the trawl sablefish TAC. Thus more of the trawl TAC would be caught by fixed gear, which as we have shown reduces the costs of the restrictions.
Accumulation Limits on Quota Accumulation limits are often implemented to address equity concerns and prevent monopolies
from forming. Anderson (2008) finds the concern over monopolies is likely exaggerated.
Lian et al. (2008) find that a 3 percent accumulation limit will not impose cost inefficiencies on the nonwhiting trawl sector, so long as prices and harvest volumes remain at or above their current levels. A 1 percent accumulation limit, however, reduces the expected gain by 18.4 percent. Using this analysis, the council has proposed accumulation limits on QS and QP and also instituted differences between holding and season limits.
As illustrated in Table 2, the quota share limit for sablefish north of Monterey is 3 percent. If the TAC per vessel is equally allocated and 50 vessels remain in the fishery,22 then each vessel has 2 percent of the TAC. A 3 percent cap, therefore, leaves some room for owners to expand their operations if it is economically profitable to do so. If, however, the prediction on the number of equilibrium vessels is incorrect and instead the range is 30 to 35 vessels, then the 3 percent cap is binding. Therefore, although at the current technology and costs the 3 percent constraint does not appear to be binding, it is possible that after the ITQ program is implemented and quota owners reorganize their business operations, it would bind. Binding accumulation limits can reduce the overall gains on the cost side from implementing an ITQ by potentially reducing the amount of rationalization.
Limits on accumulation can also affect the performance of the quota trading market. First, greater number of quota owners with small amounts of quota can increase the transaction costs for buyers. For example, a purchaser might need to buy quota from multiple owners to get the additional amount needed. Second, it is possible that the demand for quota will be suppressed, since potential buyers would be able to purchase only small amounts (given the constraints) and will decide that the transaction costs of making a sale outweigh the gains. Brokerage firms, 22 This estimate falls in between the 40–60 predicted by Lian et al. (2008).

39KROETZ AND SANCHIRICO
fishermen’s trade associations, and risk pools can help alleviate some of the transaction costs.
Figure 6. Measuring Costs from Accumulation Limits
Note: We derived the shaded area that measures the costs (equation 13) of a hypothetical accumulation limit in the following manner. First, we use the result in Kompas and Che (2005) that a 1% increase in the volume of quota traded resulted in a 1 to 2.4 percent reduction in total variable costs. Second, we assume that their result is symmetric with respect to a decrease in the volume of trade and that transaction costs reduce the volume of trading by 5 percent. Third, we suppose that the higher total variable costs due to the reduction in trades reduce the profit rate by 5 percent, which falls within the range estimated by Kompas and Che (2005) for both the trawl and the fixed‐gear sectors. The 5 percent reduction is illustrated by the difference between a profit rate of 33 and 28 percent. Finally, we assume that the restrictions on the amount of QP and QS lead to a reduction in the percentage of trawl TAC caught with fixed gear, from 50 to 40 percent.
Accumulation limits in conjunction with intersector trade restrictions can also reduce economic gains by prohibiting vessels from specializing in a particular species or species complexes. For example, some finfish, such as many species of flatfish, cannot be caught with nontrawl gear (PFMC 2008), and sablefish is better targeted with fixed gear.23 The date on relative catches in Table 8 illustrates the potential specializations. With greater accumulation limits, it is possible that a trawl vessel would prefer to specialize in flatfish. These larger shifts in economic operations are not easily accounted for in ex ante studies, such as Lian et al. (2008), that assume that the pre‐ITQ technologies and costs structures do not change.
Figure 6 highlights how to measure the costs associated with the cumulative effect of thin markets stemming from transaction costs and the restrictions on the amount of quota owned or held. To calculate the costs, we made certain assumptions regarding the potential reduction in the profit rate and the reduction in the amount of trawl TAC being fished due to the accumulation restrictions. For example, transaction costs could reduce trades and thus reduce efficiency, and if the fish are not being caught at the lowest cost, the profit rate of the fishery would fall (we assume it goes from 33 to 28 percent). Furthermore, the accumulation limit could prohibit vessels from 23 The Rationalization of the Pacific Coast Groundfish Limited Entry Trawl Fishery: Decision Document for the November 2008 Pacific Fishery Management Council meeting, indicates that if there is a shift to fixed gear in the trawl sector, some of the TACs for the flatfish might not be constraining.
40KROETZ AND SANCHIRICO
specializing in a particular fishery, and thus less of the trawl TAC would be caught with fixed gear (we assume it goes from 50 to 40 percent). Under our current assumptions, which are consistent with Kompas and Che (2005), the cost represented by the shaded area is equal to $270,950 per year, or less than 3 percent of the gross revenues for trawl‐caught sablefish.
Permit Transfer Restrictions When permit transfer restrictions are imposed, fishing operators may be restricted in their
ability to attain their optimal mix of capital and labor. Currently, the proposed ITQ program does not eliminate the length endorsements that exist in the limited‐entry trawl sector.
For example, a larger vessel’s entry may be constrained by the availability of permits for a longer length. If larger vessels are more efficient than smaller vessels, length endorsements could mean that smaller, inefficient vessels, which otherwise would sell their QS to larger vessels and exit, would stay in the fishery. Evidence from the British Columbia ITQ fishery, however, suggests that the largest vessels are not the most efficient, and over time the larger vessels gradually exit the fishery, opening up longer length endorsement permits. Consistent with that finding, Lian et al.’s (2008) analysis suggests that the optimal vessel length will be 60 to 70 feet, which is a midsized vessel within the current fleet. They did find, however, that a vessel class restriction could reduce the expected cost‐side rent gain to the fishery by 10.4 percent.
Although Lian et al.’s (2008) analysis fails to take into account gear switching, it is unlikely that the ability to switch gears would make the efficient vessel size larger. This is because most fixed‐gear vessels and open‐access vessels (the vessels most likely to enter) are smaller than most trawl vessels now.
Trawl Multispecies Complex Table 8 illustrates that the nonwhiting trawl catch comprises many species, including Dover
sole, shortspine and longspine thornyhead, and sablefish, together known as the DTS complex. The PFMC and NMFS (2008, 400) report considers it “unlikely that this entire amount [trawl TAC] would be caught with fixed‐gear, simply because some must be held in order to serve as incidental catch while targeting other, associated target species like Dover sole.”
We can include the potential value of catching DTS in our analysis by noting that although there might be economic gains from switching to fixed gear for sablefish, there is also an opportunity cost in terms of the forgone catch of Dover sole and thornyhead. We also know that the opportunity cost will increase as more of the trawl sablefish TAC is caught using fixed gear. We can get a rough measure of the cost by calculating the following:
( )T DS DS TH THOC p TAC p TACδ= + (15)
where δT is the profit rate for the trawl sector (28.6 percent), p is the ex‐vessel price, and TAC is the ABC estimate for 2010 in the Dover sole and shortspine thornyhead fisheries. Table 9 includes the levels we use in the estimate of opportunity cost. Equation (15) assumes that the catch shares of the DTS complex mirror the ratio of the ABC levels. We make this assumption for lack of more precise
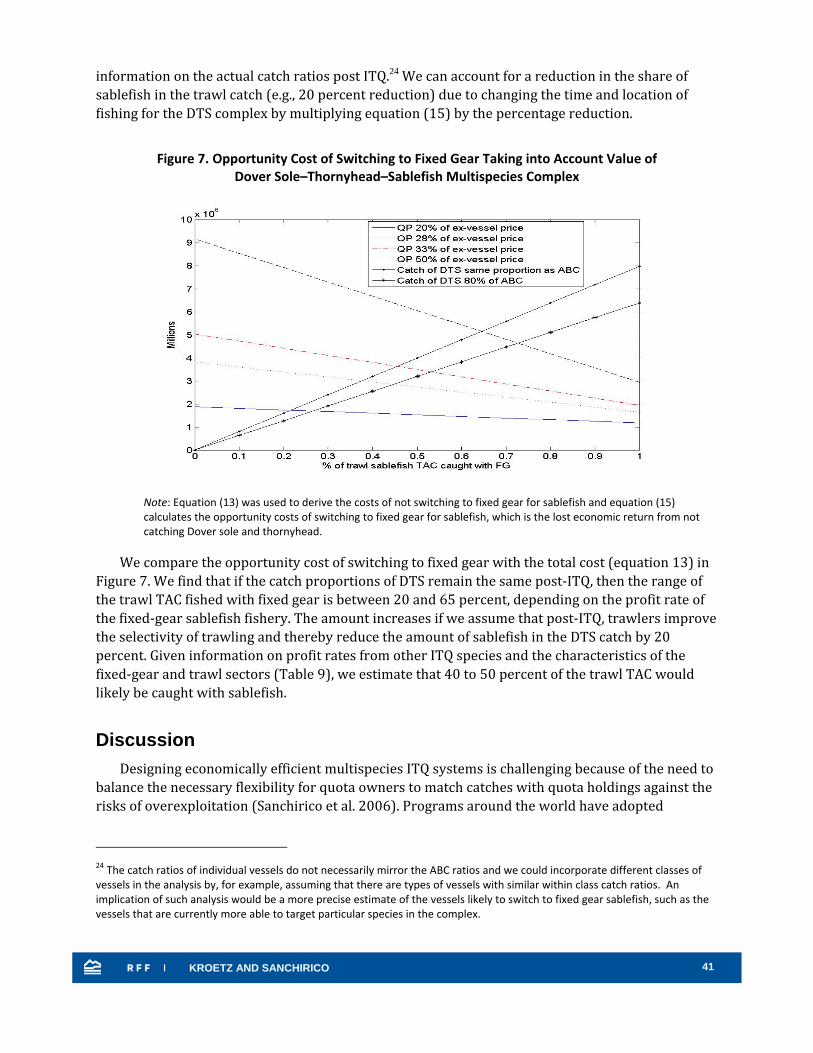
41KROETZ AND SANCHIRICO
information on the actual catch ratios post ITQ.24 We can account for a reduction in the share of sablefish in the trawl catch (e.g., 20 percent reduction) due to changing the time and location of fishing for the DTS complex by multiplying equation (15) by the percentage reduction.
Figure 7. Opportunity Cost of Switching to Fixed Gear Taking into Account Value of Dover Sole–Thornyhead–Sablefish Multispecies Complex
Note: Equation (13) was used to derive the costs of not switching to fixed gear for sablefish and equation (15) calculates the opportunity costs of switching to fixed gear for sablefish, which is the lost economic return from not catching Dover sole and thornyhead.
We compare the opportunity cost of switching to fixed gear with the total cost (equation 13) in Figure 7. We find that if the catch proportions of DTS remain the same post‐ITQ, then the range of the trawl TAC fished with fixed gear is between 20 and 65 percent, depending on the profit rate of the fixed‐gear sablefish fishery. The amount increases if we assume that post‐ITQ, trawlers improve the selectivity of trawling and thereby reduce the amount of sablefish in the DTS catch by 20 percent. Given information on profit rates from other ITQ species and the characteristics of the fixed‐gear and trawl sectors (Table 9), we estimate that 40 to 50 percent of the trawl TAC would likely be caught with sablefish.
Discussion Designing economically efficient multispecies ITQ systems is challenging because of the need to
balance the necessary flexibility for quota owners to match catches with quota holdings against the risks of overexploitation (Sanchirico et al. 2006). Programs around the world have adopted
24 The catch ratios of individual vessels do not necessarily mirror the ABC ratios and we could incorporate different classes of vessels in the analysis by, for example, assuming that there are types of vessels with similar within class catch ratios. An implication of such analysis would be a more precise estimate of the vessels likely to switch to fixed gear sablefish, such as the vessels that are currently more able to target particular species in the complex.

42KROETZ AND SANCHIRICO
flexibility mechanisms to address this issue, including trading of QS and QP, species equivalence, carry‐forward and carry‐back provisions, deemed value payments, and retrospective balancing.
The goals for ITQ programs go beyond economic efficiency, however, and encompass vibrant coastal communities, preservation of fishing communities and their culture, and healthy ocean ecosystems. Using a single tool developed to eliminate the economic waste associated with derby‐style fisheries to accomplish all these goals simultaneously only increases the difficulties in the design stage. Trade‐offs are inevitable.
Although we acknowledge the importance of considering these often‐competing goals in a full and comprehensive evaluation of the proposed west coast groundfish ITQ program, our study has highlighted the efficiency costs of these trade‐offs. Research has shown that restrictions on the characteristics of the fishing rights can have significant costs. For example, Wilen and Brown (2000) showed that restricting trading in blocks of quota in the Pacific halibut ITQ program has resulted in a 10 percent decrease in the value of the fishery.
We illustrate that the full cost of the proposed sector‐based design could be on the same order as the value of the proposed ITQ program. Whether this occurs depends on the profitability of fixed‐gear sablefish fishing. We also showed that the gear‐switching provisions and allowing fixed‐gear fisherman to purchase trawl quota can reduce this cost. Accumulation limits, however, can mitigate some of the gains of the gear‐switching provision by creating transaction costs in the market and reducing the ability of quota owners to determine the economically optimal mix of inputs. In our example, the cost associated with the limits is on the order of 2.5 percent of the gross revenues in the fixed‐gear sablefish fishery. Although our back‐of‐the‐envelop calculations illuminate the potential costs, care must be taken when interpreting them, as they depend on many economic factors that can change after implementation.
Arguments for restrictions on ownership and trading often revolve around the need to preserve the social fabric of coastal communities. Although these impose a cost in terms of the lost economic gains, this restriction can easily be changed over time as needed. Furthermore, as evident in the discussions of these systems in the United States, these limits have considerable value in terms of easing constituencies’ concerns about the transition to rights‐based approaches that could very well offset the efficiency costs. Because of these concerns, there appears to be a strong political‐economy reason to take an incremental approach to implementing ITQ programs and proceed one sector at a time. At the very least, the back‐of‐the‐envelope calculations highlight the significant gains to society from expanding the proposed ITQ program over time.
A legitimate concern that often encourages trading and accumulative restrictions is that a particular location on the coast can end up with no boats if, for example, vessels sell their quota to boats with other home ports or locate in areas closer to markets. Restrictions on trading quota across regions in Iceland’s program were instituted to reduce the likelihood of such situations. Another approach is the community‐based quota system, like that currently in place in Alaska, where a community is allocated the catch and determines who will fishes it. Although we are unaware of any programs with this feature, the catch could be allocated to port and harbor masters, or at the very least, these entities would be allowed to purchase and own quota. They could use the quota to entice fishermen to dock at their port, to encourage processors to locate or remain in the community, and to provide a stable source of demand for shipping and other infrastructure services.

43KROETZ AND SANCHIRICO
We conclude by noting that restrictions that lower the value of the fishery and restrict fishermen from maximizing the value of their operations can reduce the level of fees recovered for management.25 Imposing restrictions to meet social and cultural goals, therefore, implies that the councils will have fewer resources to monitor and enforce all dimensions of ITQ management.
25 Regarding the fee that can be levied on quota owners, the Magnuson‐Stevens Fishery Conservation Management Act reads, “such fee shall not exceed 3 percent of the ex‐vessel value of fish harvested under any such program, and shall be collected at either the time of the landing, filing of a landing report, or sale of such fish during a fishing season or in the last quarter of the calendar year in which the fish is harvested.”
44KROETZ AND SANCHIRICO
References Andersen, J., and P. Bogetoft. 2007. "Gains from Quota Trade: Theoretical Models and an Application
to the Danish Fishery." European Review of Agricultural Economics 34(1): 105–27. Anderson, L.G. 2008. "The Control of Market Power in Itq Fisheries." Marine Resource Economics
23(1): 25–35. Anderson, L.G., and M. Holliday. 2007. The Design and Use of Limited Access Privilege Programs. U.S.
Department of Commerce, National Oceanic and Atmospheric Administration, National Marine Fisheries Service.
Arnason, R. 2005. "Property Rights in Fisheries: Iceland’s Experience with ITQs." Reviews in Fish Biology and Fisheries 15(3): 243–64.
Dupont, D.P. 2000. "Individual Transferable Vessel Quotas and Efficient Restructuring of the Primary Harvesting Sector." Annals of Operations Research 94(1): 275–94.
Dupont, D.P., K.J. Fox, D.V. Gordon, and R.Q. Grafton. 2005. "Profit and Price Effects of Multi‐Species Individual Transferable Quotas." Journal of Agricultural Economics 56(1): 31–57.
Ecotrust. No date. Fisheries Economic Assessment Model (FEAM) Select Vessel Category Budgets. Fare, R., S. Grosskopf, J. Kirkley, and D. Squires. 2000. Data Envelope Analysis (DEA): A Framework
for Assessing Capacity in Fisheries When Data Are Limited. International Institute of Fisheries Economics and Trade 2000 Proceedings, Corvallis,OR.
Fraser and Associates Economic and Business Consulting Services. 2008. A Preliminary Review of the Groundfish Integration Pilot Program: August 2008. Victoria, BC. P.R. Fisheries and Oceans Canada, Fisheries Management Branch.
Grafton, R.Q. 1995. "Rent Capture in a Rights‐Based Fishery." Journal of Environmental Economics and Management 28(1): 48–67.
Grafton, R.Q., H.W. Nelson, and B. Turris. 2005. How to Resolve the Class II Common Property Problem? The Case of British Columbia’s Multi‐Species Groundfish Trawl Fishery. Economics and Environment Network Working Paper EEN0506. Australian National University.
Grafton, R.Q., D. Squires, and K.J. Fox. 2000. "Private Property and Economic Efficiency: A Study of Common‐Pool Resource." Journal of Law & Economics 43(2).
Guyader, O. 2002. "Simulating the Effect of Regulatory Systems in a Fishery, an Application to the French Driftnet Albacore Fleet." Environmental and Resource Economics 23(1): 1–8.
Harte, M., and R. Bess (eds). 2000. The Role of Property Rights in the Development of New Zealand's Marine Farming Industry. Rome: Food and Agriculture Organization.
Homans, F.R., and J.E. Wilen. 2005. "Markets and Rent Dissipation in Regulated Open Access Fisheries." Journal of Environmental Economics and Management 49(2): 381–404.
Huppert, D., and B. Best. 2004. Final Report: Study of Supply Effects on Sablefish Market Price. University of Washington. April 7.
Kirkley, J., C. Morrison Paul, and D. Squires. 2004. "Deterministic and Stochastic Capacity Estimation for Fishery Capacity Reduction." Marine Resource Economics 19: 23.
Kompas, T., and T.N. Che. 2005. "Efficiency Gains and Cost Reductions from Individual Transferable Quotas: A Stochastic Cost Frontier for the Australian South East Fishery." Journal of Productivity Analysis 23(3): 285–307.
Lian, C., R. Singh, and Q.R. Weninger. 2008. Economic Impacts of Individual Fishing Quota Management in the Pacific Coast Groundfish Fishery. Department of Economics, Iowa State University.
National Marine Fisheries Service (NMFS). 2004. United States National Plan of Action for the Management of Fishing Capacity. U.S. Department of Commerce.
45KROETZ AND SANCHIRICO
———. 2006. Observer Coverage Plan: Sampling Plan and Logistics for West Coast Groundfish Observer Program. Seattle: National Oceanic and Atmospheric Administration, Northwest Fisheries Science Center.
———. 2007a. Data Report and Summary Analyses of NonSablefishEndorsed FixedGear Permits West Coast Groundfish Observer Program. Seattle: Northwest Fisheries Science Center, Fishery Resource Analysis and Monitoring Division.
———. 2007b. Data Report and Summary Analyses of SablefishEndorsed FixedGear Permits: West Coast Groundfish Observer Program. Seattle: Northwest Fisheries Science Center, Fishery Resource and Analysis Monitoring Division.
Newell, R.G., K. Papps, and J.N. Sanchirico. 2007. "Asset Pricing in Created Markets for Fishing Quota." American Journal of Agricultural Economics 89(2).
Pacific Fishery Management Council (PFMC) and National Marine Fisheries Service (NMFS). 2009. Pacific Council Recommendations for Rationalization of the Groundfish Trawl Fishery (Including Whiting), Updated with Trailing Actions through April 2009. Portland, OR: Pacific Fishery Management Council.
———. 2008. Rationalization of the Pacific Coast Groundfish Limited Entry Trawl Fishery; Preliminary Draft Environmental Impact Statement Including Regulatory Impact Review and Initial Regulatory Flexibility Analysis. Portland, OR: Pacific Fishery Management Council.
Pascoe, S., and T. Gibson. 2009. "Do Boat Licenses Have a Role in Fisheries Managed through Individual Quotas? Experience in Australian Fisheries." Marine Policy 33(2): 297–304.
Sanchirico, J.N. 2008. An Overview of the Economic Benefits of Cooperatives and Individual Fishing Quota Systems. Subcommittee for Oceans, Atmosphere, Fisheries and Coast Guard of the Senate Committee on Commerce, Science, and Transportation.
Sanchirico, J.N., D. Holland, K. Quigley, and M. Fina. 2006. "Catch‐Quota Balancing in Multispecies Individual Fishing Quotas." Marine Policy 30(6): 767–85.
Scott, A.D. 1989. Conceptual Origins of Rights Based Fishing. In P.A. Nehar, R. Arnason, and N. Mollett (eds.), Rights Based Fishing. Boston: Kluwer Academic Publishers.
———. 2000. Introducing Property in Fishery Management. In R. Shotton (ed.), Use of Property Rights in Fisheries Management. Sections 3 and 4. Rome: Food and Agriculture Organization.
Squires, D., and J. Kirkley. 1995. "Resource Rents from Single and Multispecies Individual Transferable Quota Programs." Journal of Marine Science 52(2): 153–64.
Squires, D., M. Alauddin, and J. Kirkley. 1994. "Individual Transferable Quota Markets and Investment Decision in the Fixed Gear Sablefish Industry." Journal of Environmental Economics and Management 27(2): 19.
Squires, D., H. Campbell, S. Cunningham, C. Dewees, R.Q. Grafton, S.F. Herrick, J. Kirkley, S. Pascoe, K. Salvanes, B. Shallard, B. Turris, and N. Vestergaard. 1998. "Individual Transferable Quotas in Multispecies Fisheries." Marine Policy 22(2): 135–59.
Stavins, R.N. 1995. "Transaction Costs and Tradable Permits." Journal of Environmental Economics and Management 29(2): 133–48.
Sylvia, G., H.M. Mann, and C. Pugmire (eds). 2008. FAO Fisheries Technical Paper No. 504: Achievements of the Pacific Whiting Conservation Cooperative: Rational Collaboration in a Sea of Irrational Competition. Rome: Food and Agriculture Organization.
Vestergaard, N. 1999. "Measures of Welfare Effects in Multiproduct Industries: The Case of Multispecies Individual Quota Fisheries." Canadian Journal of Economics 32(3): 729–43.
Vestergaard, N., F. Jensen, and H.P. Jorgensen. 2005. "Sunk Cost and Entry‐Exit Decisions under Individual Transferable Quotas: Why Industry Restructuring Is Delayed." Land Economics 81(3): 363–78.
46KROETZ AND SANCHIRICO
Weninger, Q.R., and J.R. Waters. 2003. "Economic Benefits of Management Reform in the Northern Gulf of Mexico Reef Fish Fishery." Journal of Environmental Economics and Management 46(2): 207–30.
White, L.J. 2006. The Fishery as a Watery Commons: Lessons from the Experiences of Other Public Policy Areas for U.S. Fisheries Policy. Stern School of Business, New York University.
Wilen, J.E. 2006. "Why Fisheries Management Fails: Treating Symptoms Rather Than the Cause." Bulletin of Marine Science 78(3): 18.
———. 2009. "Stranded Capital in Fisheries: The Pacific Coast Groundfish/Whiting Case." Marine Resource Economics 24(1): 1–18.
Wilen, J.E., and G.M. Brown. 2000. Implications of Various Transfer and Cap Policies in the Halibut Charter Fishery. Seattle: National Marine Fisheries Service, Fishery Science Center.