ECONOMIC INDICATORS RUM: ANNUAL REPORT (Covering · RUM: ANNUAL REPORT (Covering 1988 and 1989) ON...
14
RUM: ANNUAL REPORT (Covering 1988 and 1989) ON SELECTED ECONOMIC INDICATORS Report to the Senate Committee on Finance, on Investigation No. 332-175 Under Section 332 of the Tariff Act of 1930 USITC PUBLICATION 2288 JULY 1990 (Revised) United States International Trade Commission Washington, DC 20436
-
Upload
trinhtuong -
Category
Documents
-
view
213 -
download
0
Transcript of ECONOMIC INDICATORS RUM: ANNUAL REPORT (Covering · RUM: ANNUAL REPORT (Covering 1988 and 1989) ON...

RUM: ANNUAL REPORT (Covering 1988 and 1989) ON SELECTED ECONOMIC INDICATORS
Report to the Senate Committee on Finance, on Investigation No. 332-175 Under Section 332 of the Tariff Act of 1930
USITC PUBLICATION 2288
JULY 1990 (Revised)
United States International Trade Commission
Washington, DC 20436

UNITED STATES INTERNATIONAL TRADE COMMISSION
COMMISSIONERS
Anne E. Brunsdale, Acting Chairman
Seeley G. Lodwick David B. Rohr
Don E. Newquist
Office of Industries
Robert A. Rogowsky, Director
This report was prepared principally by
Victoria Salin
Agriculture Crops and Products Branch
Agriculture Division
Address all communications to Kenneth R. Mason, Secretary to the Commission
United States International Trade Commission Washington, DC 20436

PREFACE
On January 13, 1984, at the request of the Chairman of the
Committee on Finance, U.S. Senate, and in accordance with the
provisions of section 332(b) of the Tariff Act of 1930 (19 U.S.C.
1332(b)), the United States International Trade Commission
instituted investigation No. 332-175, Rum: Annual Report on
Selected Economic Indicators. The purpose of the report is to
gather and compile data on the rum industry from public sources
and report such data to the Committee on an annual basis.
The report, as requested by the Finance Committee, contains
the following statistical information on rum: (1) U.S. production;
(2) U.S. exports; (3) imports for consumption (total and by
countries designated as eligible for the Caribbean Basin
Initiative (CBI)); (4) apparent U.S. consumption; and (5)
shipments from Puerto Rico and the U.S. Virgin Islands to the
United States.
The sixth annual report covers 1988 and 1989. Subsequent
reports will be issued on a calendar-year basis as long as rum is
accorded duty-free treatment pursuant to the Caribbean Basin
Economic Recovery Act; the next report covering calendar year 1990
will be issued in May 1991.

ii
CONTENTS
Page
Preface Highlights 1
Tables
1. Rum: U.S. production, exports of domestic merchandise, imports for consumption, and apparent consumption, 1987-89 2
2. Rum: U.S. imports for consumption, by designated CBI countries and other sources, 1988 and 1989 3
3. Rum in containers each holding not over 4 liters: U.S. imports for consumption, by designated CBI countries and other sources, 1988 and 1989 4
4. Rum in containers each holding over 4 liters: U.S. imports for consumption, by designated CBI countries and other sources, 1988 and 1989 5
5. Rum in containers each holding over 4 liters, valued at not over 53 cents per proof liter: U.S. imports for consumption, by designated CBI countries and other sources, 1988 and 1989 6
6. Rum in containers each holding over 4 liters, valued over 53 cents but not over 92 cents per proof liter: U.S. imports for consumption, by designated CBI countries and other sources, 1988 and 1989 7
7. Rum in containers each holding over 4 liters, valued over 92 cents per proof liter: U.S. imports for consumption, by designated CBI countries and other sources, 1988 and 1989 8
8. Rum: U.S. exports of domestic merchandise, by principal markets, 1988 and 1989 9
9. Rum: Shipments from Puerto Rico and the U.S. Virgin Islands to the United States, 1988 and 1989 10

HIGHLIGHTS
The following are highlights of the economic data collected
on rum for 1988 and 1989.
For 1989, U.S. production of rum increased to 96.8 million proof liters, 7 percent higher than the amount produced in 1988.
• U.S. exports of rum in 1989 were 16 percent above the quantity exported in 1987, although 1989 exports were 25 percent below the quantity exported in 1988. The value of such exports decreased from $3.0 million in 1987 to $2.7 million in 1989.
• For 1989, imports of rum amounted to 3.9 million proof liters, valued at $10.8 million, compared with 3.1 million proof liters, valued at $7.0 million, in 1988.
• Rum imports from CBI eligible countries accounted for 90 percent of the value of total rum imports during 1989, and rum imports from Jamaica made up 61 percent of the total value of U.S. rum imports from CBI countries. During 1988, the share of total import value supplied by CBI countries was 90 percent and Jamaica accounted for 52 percent of the imports from CBI countries.
• Apparent U.S. consumption of rum in 1989 amounted to 97.8 million proof liters, 3 percent higher than in 1988. The import-to-consumption ratio was 4.0 percent in 1989, compared with 3.3 percent in 1988.
• Rum shipments from Puerto Rico to the United States declined from 79.3 million proof liters in 1988 to 76.6 million proof liters in 1989. During the same 2 years, rum shipments from the U.S. Virgin Islands to the United States decreased from 7.9 million proof liters to 6.9 million proof liters.
1

2
Table 1. Rum: U.S. production, exports of domestic merchandise, imports for consumption, and apparent consumption, 1987-89
(Quantity in thousands of proof liters; value in thousands of dollars: unit value per proof liter)
Ratio (per- Apparent cent of
Produc- consump- imports to Year tionl Exports Imports tion2 consumption
Quantity
1987.... 89,182 2,006 3,641 91,790 4.0 1988.... 90,518 3,081 3,114 94,765 3.3 1989.... 96.821 2.324 3.936 97.767 4.0
Value
1987.... 141,125 3,037 7,176 ( 3 ) 1988.... 135,587 3,413 6,967 ( 3 ) 1989.... 107.833 2.692 10.814 ( 3 )
Unit value
1987.... $1.58 $1.51 $1.97 1988.... 1.50 1.11 2.24 1989.... 1.11 1.16 2.75
1 Represents rum bottled in the United States, as reported by the Bureau of Alcohol, Tobacco, and Firearms of the U.S. Department of the Treasury, and shipments of bottled rum into the United States from Puerto Rico and the Virgin Islands, reported by the Bureau of the Census of the U.S. Department of Commerce. Value is estimated from the average value of bottled rum shipped to the United States from Puerto Rico and the Virgin Islands.
2 Adjusted for stock changes as reported by the U.S. Department of the Treasury.
3 Not available.
Source: Production data compiled from official statistics of the U.S. Department of the Treasury and the U.S. Department of Commerce, with conversions by the staff of the U.S. International Trade Commission; imports and exports compiled from official statistics of the U.S. Department of Commerce.

3
Table 2. Rum: U.S. imports for consumption, by designated CBI countries and other sources, 1988 and 1989
Source
1988 1989
Quantity (1.000 proof liters) CBI countries:
Jamaica Barbados Dominican Republic Haiti British Virgin Islands All other
1,605 818 314 53 18
107
1,571 1,633
270 67 32 98
Total of CBI countries 2,915 3,671 All other 199 265
Total 3.114 3.936
Value (1.000 dollars) CBI countries:
Jamaica 3,283 5,973 Barbados 1,131 1,875 Dominican Republic 1,188 1,070 Haiti 222 245 British Virgin Islands 121 181 All other 337 364
Total of CBI countries 6,282 9,708 All other 685 1.106
Total 6.967 10.814
CBI countries: Unit value (per proof liter)
Jamaica $2.04 $3.80 Barbados 1.38 1.15 Dominican Republic 3.78 3.96 Haiti 4.19 3.66 British Virgin Islands 6.72 5.66 All other 3.15 3.71
Total of CBI countries 2.15 2.64 All other 3.44 4.17
Total 2.24 2.75
Source: Compiled from official statistics of the U.S. Department of Commerce.

4
Table 3. Rum in containers each holding not over 4 liters: U.S. imports for consumption, by designated CBI countries and other sources, 1988 and 1989
Source 1988 1989
Quantity (1.000 proof liters) CBI countries:
Jamaica Dominican Republic Barbados Haiti British Virgin Islands All other
338 173 42 54 18 95
1,496 161 35 67 23 98
Total of CBI countries 720 1,880 All other 184 258
Total 904 2.138
Value (1.000 dollars) CBI countries:
Jamaica 1,078 5,654 Dominican Republic 942 797 Barbados 123 401 Haiti 222 245 British Virgin Islands 121 176 All other 332 364
Total of CBI countries 2,818 7,637 All other 661 1.082 Total 3.479 8.719
CBI countries: Unit value (per proof liter)
Jamaica $3.19 $3.78 Dominican Republic 5.45 4.95 Barbados 2.93 11.46 Haiti 4.11 3.66 British Virgin Islands 6.72 7.65 All other 3.49 3.71
Average of CBI countries 3.91 4.06 All other 3.59 4.19
Average 3.85 4.08
Source: Compiled from official statistics of the U.S. Department of Commerce.
5
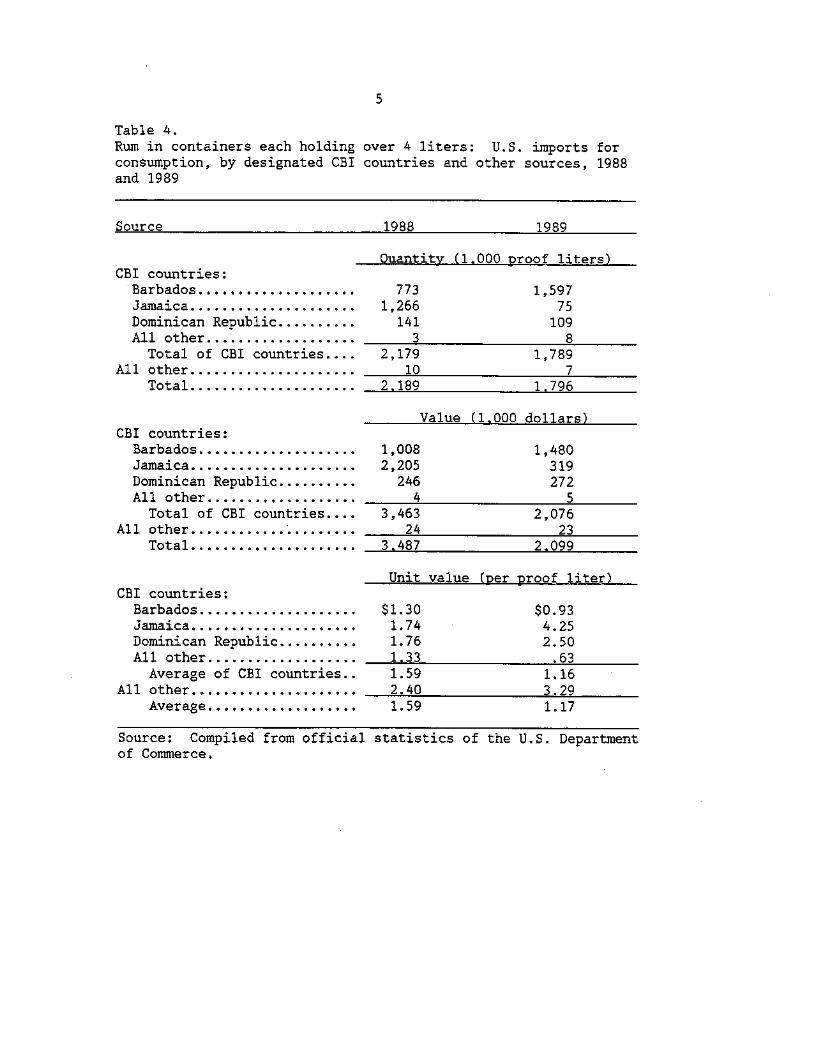
Table 4. Rum in containers each holding over 4 liters: U.S. imports for consumption, by designated CBI countries and other sources, 1988 and 1989
Source 1988 1989
Quantity (1.000 proof liters) CBI countries:
Barbados 773 1,597 Jamaica 1,266 75 Dominican Republic 141 109 All other 3 8
Total of CBI countries 2,179 1,789 All other 10 7
Total 2.189 1.796
Value (1.000 dollars) CBI countries:
Barbados 1,008 1,480 Jamaica 2,205 319 Dominican Republic 246 272 All other 4 5
Total of CBI countries 3,463 2,076 All other 24 23
Total 3.487 2.099
Unit value (per proof liter) CBI countries:
Barbados $1.30 $0.93 Jamaica 1.74 4.25 Dominican Republic 1.76 2.50 All other 1.33 .63 Average of CBI countries 1.59 1.16
All other 2.40 3.29 Average 1.59 1.17
Source: Compiled from official statistics of the U.S. Department of Commerce.

6
Table 5. Rum in containers each holding over 4 liters, valued at not over 53 cents per proof liter: U.S. imports for consumption, by designated CBI countries and other sources, 1988 and 1989
Source 1988 1989
Quantity (1.000 proof liters) CBI countries:
Barbados 0 762 All other 0 0
Total of CBI countries 0 762 All other 0 0
Total 0 762
Value (1.000 dollars) CBI countries:
Barbados 0 315 All other 0 0
Total of CBI countries 0 315
All other 0 0
Total 0 315
Unit value (per proof liter) CBI countries:
Barbados 0 $0.41 All other 0 0 Total of CBI countries 0 .41
All other 0 0 Total 0 0.41
Source: Compiled from official statistics of the U.S. Department of Commerce.

7
Table 6. Rum in containers each holding over 4 liters, valued at over 53 cents but not over 92 cents per proof liter: U.S. imports for consumption, by designated CBI countries and other sources, 1988 and 1989
Source 1988 1989
Quantity (1.000 proof liters) CBI countries:
Dominican Republic 61 43 Barbados 64 43 Jamaica 57 28 All other 0 8
Total of CBI countries 182 122 All other 0 0
Total 182 122
Value (1.000 dollars) CBI countries: Dominican Republic 42 27 Barbados 30 26 Jamaica 31 16 All other 0 5
Total of CBI countries 103 74 All other 0 0
Total 103 74
CBI countries: Unit value (per proof liter)
Dominican Republic $0.69 $0.63 Barbados .47 .60 Jamaica .54 .57 All other .63
Average of CBI countries .57 .61 All other -
Average .57 .61
Source: Compiled from official statistics of the U.S. Department of Commerce.

8
Table 7 Rum in containers each holding over 4 liters, valued over 92 cents per proof liter: U.S. imports for consumption, by designated CBI countries and other sources, 1988 and 1989
Source
1988 1989
Quantity (1,000 proof liters) CBI countries:
Barbados Jamaica Dominican Republic All other
709 1,209
80 3
792 47 66 0
Total of CBI countries 2,001 905 All other 10 8
Total 2,011 913
Value (1.000 dollars) CBI countries:
Barbados 978 1,139 Jamaica 2,174 303 Dominican Republic 204 245 All other 4 0
Total of CBI countries 3,360 1,687 All other 24 23
Total 3,384 1,710
Unit value (per proof liter) CBI countries:
Barbados $1.38 $1.44 Jamaica 1.80 6.45 Dominican Republic 2.55 3.71 All other 1.33
Total of CBI countries 1.68 1.86 All other 2.40 3.10
Total 1.68 1.87
Source: Compiled from official statistics of the U.S. Department of Commerce.

9
Table 8. Rum: U.S. exports of domestic merchandise, by principal markets, 1988 and 1989
Market
1988 1989
Quantity (1.000 proof liters)
Netherlands Antilles 384 758 Canada 108 273 Cayman Islands 7 204 Sweden 34 115 Netherlands 342 123 Belgium 82 67 Chile 47 90 Aruba 55 87 British Virgin Islands 51 54 All other 1.971 553
Total 3.081 2.324
Value (1.000 dollars)
Netherlands Antilles 556 913 Canada 115 292 Cayman Islands 12 220 Sweden 43 123 Netherlands 418 120 Belgium 140 113 Chile 74 109 Aruba 50 94 British Virgin Islands 90 83 All other 1.915 625
Total 3.413 2.692
Unit value (per proof liter)
Netherlands Antilles $1.45 $1.20 Canada 1.06 1.07 Cayman Islands 1.71 1.08 Sweden 1.26 1.07 Netherlands 1.22 .98 Belgium 1.71 1.69 Chile 1.57 1.21 Aruba .91 1.08 British Virgin Islands 1.76 1.54 All other .97 1.13
Total 1.11 1.16
Source: Compiled from official statistics of the U.S. Department of Commerce.

10
Table 9. Rum: Shipments from Puerto Rico and the U.S. Virgin Islands to the United States, 1988 and 1989
(In thousands of proof liters)
Source 1988 1989
Puerto Rico: In containers not over
4 liters 17,056 24,747 In containers over 4 liters 62.249 51.842 Total 79,305 76,589
U.S. Virgin Islands: In containers not over
4 liters 7 12 In containers over 4 liters 7.870 6,850 Total 7,877 6,862
Source: Compiled from official statistics of the U.S. Department of Commerce.