
Economic Impact of the Lawn and Landscape Industry
23
Economic Impact of the Lawn and Landscape Industry Tom Delaney Professional Lawn Care Association of America Vice President of Government Affairs
Transcript of Economic Impact of the Lawn and Landscape Industry

Economic Impact of the Lawn and Landscape Industry
Tom DelaneyProfessional Lawn Care Association of America
Vice President of Government Affairs


Between 1982 and 1997, approximately 7 million acres of agricultural land and 10 million acres of forest land
were converted to residential, transportation, industrial, urban, and other uses.
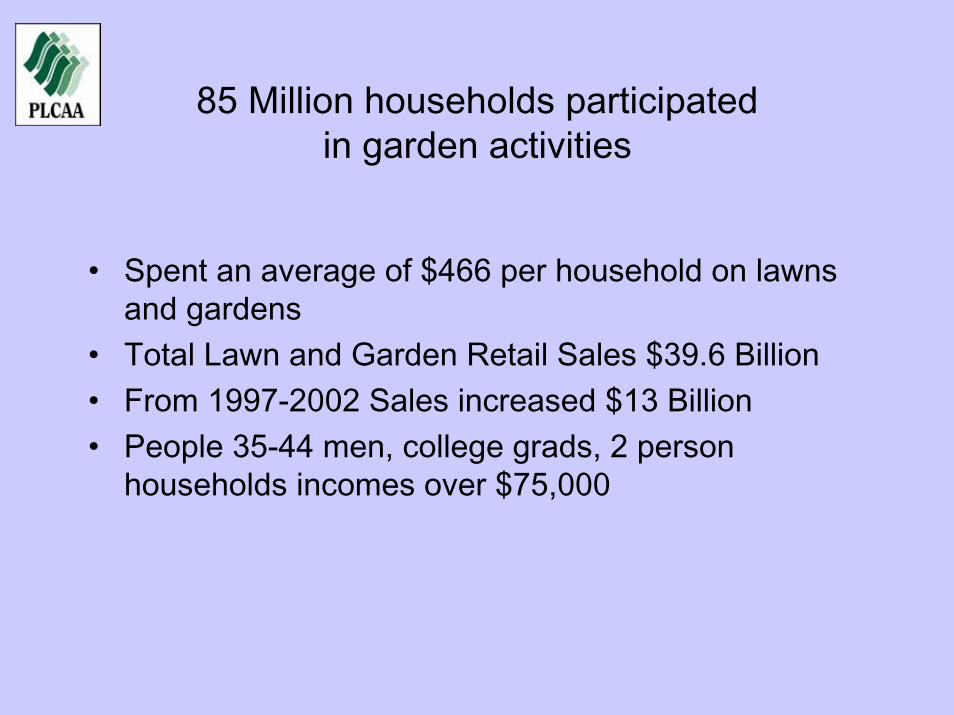
85 Million households participated in garden activities
• Spent an average of $466 per household on lawns and gardens
• Total Lawn and Garden Retail Sales $39.6 Billion • From 1997-2002 Sales increased $13 Billion• People 35-44 men, college grads, 2 person
households incomes over $75,000

Statistics of US Businesses LandscapingEmployment size
Number of Firms
# of Employees
Annual Payroll ($1,000)
Year 1998 64,584 363,906
Year 1999 64,683 393,575
Year 2000 66,331 415,873 9,770,825
Year 2001 72,504 446,000 11,258,488

Non-employer Statistics summarizes the number of establishmentsand sales or receipts of companies with no paid employees.
Year Firms Receipts ($1,000)
1997 153,414 3,028,391 Billion
2000 172,141 4,313,250 Billion

National Gardening SurveyQuestions By the Green Industry
Serv Hired
1997 1998 1999 2000 2001 2002
Mil. Mil. Mil. Mil. Mil. Mil.
L/L Maint
14.3 13.7 14.9 16.3 17.8 19.4
L/ In Const
2.0 2.4 2.6 2.8 2.9 3.2
L/ Design
1.1 1.2 1.3 1.6 1.8 2.1
Tree Care
5.6 4.1 4.9 5.9 7.1 8.6
Total 22.4 21.4 22.1 22.9 23.8 24.7

Average $ Spent$ Average Spent
1997 1998 1999 2000 2001 2002
$ $ $ $ $ $
L/L Maint.
$533 $581 $540 $543 $547 $550
L/ In Const
$1,772 $2,630 $2,825 $3,035 $3,260 $3,502
L/Design
$889 $742 $879 $1,043 $1,236 $1,465
Tree Care
$434 $411 $421 $431 $441 $452
Total AverageHouse
$647 $855 $925 $1,000 $1,082 $1,170

Total $ Spent$ TOL Spent
1997 1998 1999 2000 2001 2002
Billion Billion Billion Billion Billion Billion
L/L Maint
$7.6 $7.9 $9.0 $9.7 $10.4 $10.7
L/In Const
$3.6 $6.3 $7.3 $8.4 $9.7 $11.2
L/ Design
$1.0 $.9 $1.3 $1.7 $2.3 $3.1
Tree Care
$2.4 $1.7 $2.9 $3.2 $3.5 $3.9
Total Spent Billion
$14.6 $16.8 $20.5 $23.0 $25.9 $28.9

Plan to Hire Professional Landscape,Lawn or Tree Care Services In 2003
Households
Professional Services: % Mil.
Lawn/Landscape Maintenance 16 17.4Tree Care 7 7.6Landscape Installation/Construction 3 3.3Landscape Design 2 2.1Don’t Know 11 11.9None 66 71.6Plan to Hire Services (Net.) 23 24.9


Kinds of information from new 2002 Economic Census
Sales Shipments,Receipts, or Revenue
Employment (number)and Payroll (amount)
Leased Employment and Payroll
Kind of Business or ActivityLawn and garden servicesLandscaping servicesOther landscaping and maintenance services - SpecifyLandscape architectural services
Class of CustomerBusiness, IndividualOrnamental shrub and tree services


Quality of Life Benefits
A. Athletic FieldsB. Golf coursesC. Physical and emotional benefits to homeowners who
do their own landscape care “do people who garden live longer” horticultural therapy
D. Heat mitigation (compared with pavement)E. Noise abatement (compared with pavement)

Economic Benefits
A. Turf pesticides sales and advertisingB. Turf nutrients sales and advertisingC. Professional lawn care operators: sales employmentD. Sod Farms: sales and employmentE. Professional sports/stadiumsF. Increase in home resale valuesG.Tourism, e.g. parks and grounds around DC mall and
similar sites etcH. Golf courses: equity enhancements for associated
homes and employment

Environmental Benefits
A. Erosion control (e.g. Conservation Reserve Program)B. Cooling in urban areasC. Increase in biomassD. Oxygen productionE. Pollutant filtration, with a focus on effluentF. Aquifer recharge, with a focus on effluentG. Wildlife habitat

Need quantitative assessment of benefits. Could be used to helpbalance regulatory and legislative actions.
A clean, concise initiative on this is presently impossible.The scope is complicated, data sources are uneven, and the industry is
fragmented.
We need a strategy to identify critical factors and data sources. The strategyneeds to enable a team to develop a more accurate and precise benefit
assessment. It would also suggest how to integrate this information effectively.

Facts for which EPA doesn't have good data
• What application rates do homeowners actually use?• What is the cost and performance of alternative turf
management programs?• What is the extent of use of bio pesticides by
consumers and professionals?• How does the value of environmental benefits
change with different landscapes?• How much does pesticide and fertilizer use contribute
to overall non-point source pollution?

Green Industry/Turf Surveys
• 2004 Wisconsin Green Industry Survey• 2003 New Jersey Turfgrass Survey (will be
reported)• 2003 New York Turfgrass Survey (to be sent
out)• 2002 Michigan Turfgrass Survey (to be sent)• 2002 Georgia Golf Courses and Landscape
Maintenance• 2001 Iowa’s Turfgrass Industry • 2001 Illinois Green Industry• 2001 Florida Economic Impact Survey of
Nursery & Landscape Industry• 2000 Kansas State Horticulture Survey• 2000 Texas Economic Impact Study of Nursery
& Landscape Industry• 2000 Virginia Turfgrass Industry• 1999 North Carolina Turfgrass Industry• 1998 Arizona Green Industry Survey• 1999 Wisconsin Turfgrass Industry Survey
• 1998 Missouri Turfgrass Economic Impact Survey
• 1998 New England Environmental Horticulture Industry
• 1997 Florida’s Environmental Horticulture Industry
• 1997 Oregon Nursery and Greenhouse Industry Survey
• 1997 Louisiana Nursery and Turf Crop Survey• 1996 Maryland Turfgrass Survey• 1996 Mississippi Turfgrass Industry• 1996-97 Washington State Landscape and
Nursery Industry Survey• 1993-97 Industry Information and 1998 Outlook• 1996 Ohio Nursery Industry Survey• 1995-96 U.S. Landscape Tree Planting Survey• 1995 Albuquerque, New Mexico Potential
environmental and economic impacts of turfgrass
• 1995 Value of Louisiana’s Green Industry• 1994 Arizona Green Industry Study
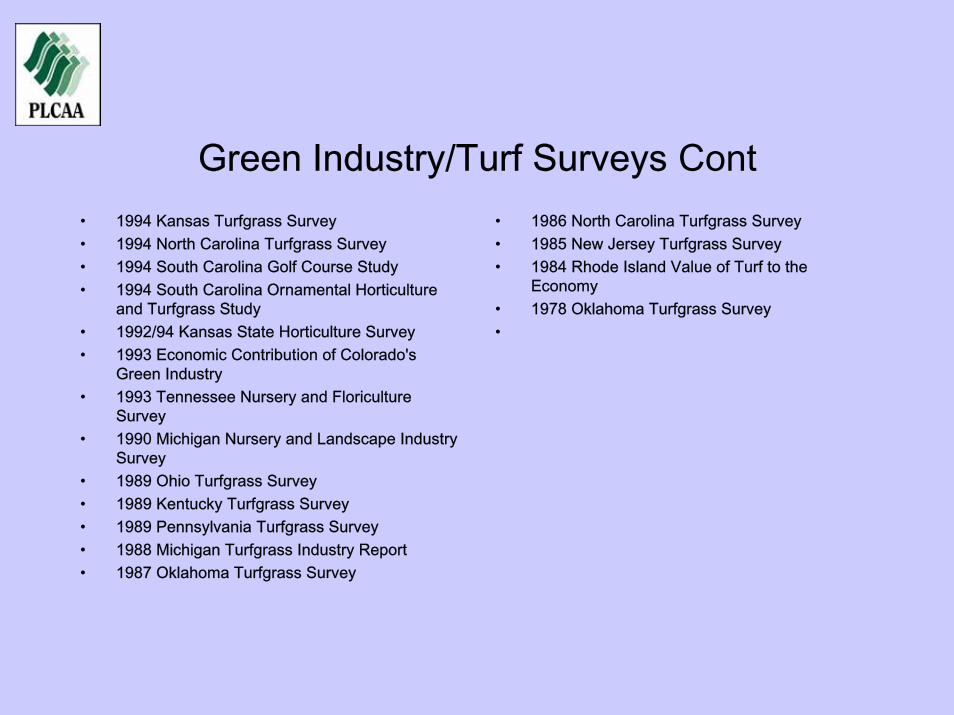
Green Industry/Turf Surveys Cont• 1994 Kansas Turfgrass Survey• 1994 North Carolina Turfgrass Survey• 1994 South Carolina Golf Course Study• 1994 South Carolina Ornamental Horticulture
and Turfgrass Study• 1992/94 Kansas State Horticulture Survey• 1993 Economic Contribution of Colorado's
Green Industry• 1993 Tennessee Nursery and Floriculture
Survey• 1990 Michigan Nursery and Landscape Industry
Survey• 1989 Ohio Turfgrass Survey• 1989 Kentucky Turfgrass Survey• 1989 Pennsylvania Turfgrass Survey• 1988 Michigan Turfgrass Industry Report• 1987 Oklahoma Turfgrass Survey
• 1986 North Carolina Turfgrass Survey• 1985 New Jersey Turfgrass Survey• 1984 Rhode Island Value of Turf to the
Economy• 1978 Oklahoma Turfgrass Survey•

Lobbying- Education on the “Economic Importance of Lawn/Landscape Industry”

EVERGREEN FOUNDATIONNational Campaign
“To raise the awareness of the environmental, economic and lifestyle benefits of landscapes and
promote the significance of those who preserve and enhance green spaces at home, work and play”

“More Information”
National Gardening Survey 20021100 Dorset StreetSouth Burlington,Vermont 05403Bruce Butterfield 800-538-7476www.rdenresearch.comEnvironmental & Turf Services Inc Stewart Z. Cohen 301- 933-4700www.nvironmentalandturf.comUS Census Bureau
2002 Economic Census Surveyhttp:/www/econ97.htmlKline & Company, Inc.
Overlook at Great Notch150 Clove Road, #410Little Falls, NJ 07424-0410 Telephone: (973) 435-6262 Fax: (973) 435-6291
Tom Delaney Vice President of Government Affairs Professional Lawn Care Association of America 1000 Johnson Ferry Rd., NE, #C-135 Marietta, GA 30068-2112 Phone: 770-977-5222 Fax: 770-578-6071 E-Mail: [email protected] www.plcaa.org "PLCAA: Your Business Partner" @up.com


