
ECONOMIC IMPACT OF SMALL BUSINESS DEVELOPMENT …
31
ECONOMIC IMPACT OF SMALL BUSINESS DEVELOPMENT CENTER COUNSELING ACTIVITIES IN THE UNITED STATES: 2015-2016 James J. Chrisman, Ph.D. 197 Edinburgh Drive Starkville, MS 39759 tel. 662-615-4373 [email protected] University Address (Day) Department of Management and Information Systems College of Business Mississippi State University Mississippi State, MS 39762-9581 tel: 662-325-1991 fax: 662-325-8651 [email protected] This report was prepared by the author acting as an independent consultant. Neither the project nor the contents of this report were endorsed or sponsored by Mississippi State University. Prepared September 25, 2017
Transcript of ECONOMIC IMPACT OF SMALL BUSINESS DEVELOPMENT …
ECONOMIC IMPACT OF SMALL BUSINESS DEVELOPMENT CENTER
COUNSELING ACTIVITIES IN THE UNITED STATES: 2015-2016
James J. Chrisman, Ph.D.
197 Edinburgh Drive
Starkville, MS 39759
tel. 662-615-4373
University Address (Day)
Department of Management and Information Systems
College of Business
Mississippi State University
Mississippi State, MS 39762-9581
tel: 662-325-1991
fax: 662-325-8651
This report was prepared by the author acting as an independent consultant.
Neither the project nor the contents of this report were endorsed or sponsored
by Mississippi State University.
Prepared September 25, 2017
1
THE ECONOMIC IMPACT OF SMALL BUSINESS DEVELOPMENT CENTER
COUNSELING ACTIVITIES IN THE UNITED STATES: 2015-2016
EXECUTIVE SUMMARY
This report presents the results of the 21st national study of the
economic impact of Small Business Development Center (SBDC) counseling
activities in the United States. The report analyzes the changes in sales and
employment, jobs and sales revenue maintained, and financing obtained by a
sample of 7,733 established businesses and 3,045 pre-ventures that received
five or more hours of counseling assistance (long-term clients) in 2015.
Data from 58 of the 63 SBDCs in the United States were used in the study.
The 10,778 responses represented 16.9% of the clients that were sent
questionnaires (63,943). The clients surveyed represented the entire long-term
client population of the 58 Small Business Development Center programs in the
United States that participated in the study. Analysis indicated that response
bias did not appear to be a threat to the study.
The performance improvements of the responding sample in the year after
receiving assistance were compared to the weighted average changes in
performance of all businesses in the United States. The incremental
improvements in the sample's performance -- over and above what they would have
been had they performed like the average business -- were extrapolated across
the entire long-term client population of the SBDC. To avoid overestimation of
the impact of the SBDC program, only those clients who indicated that the
SBDC's services were beneficial were used to calculate performance
improvements. These performance improvements were then used to estimate the
tax revenues generated for state and federal governments from SBDC counseling.
The tax revenues generated by the long-term clients were compared to the total
cost of providing the services offered by the SBDC. To gain additional
insights, the financing obtained by clients as a direct result of SBDC
assistance was analyzed.

2
The 58 participating SBDCs counseled 63,943 long-term clients in 2015:
38,194 (59.7%) were classified as established businesses and 25,749 (40.3%)
were classified as pre-ventures. Most respondents (92%) indicated that the
service received from the SBDC was beneficial. Of the pre-venture clients, it
was estimated that about 66.7% started new businesses subsequent to the
counseling (62.1% within one year).
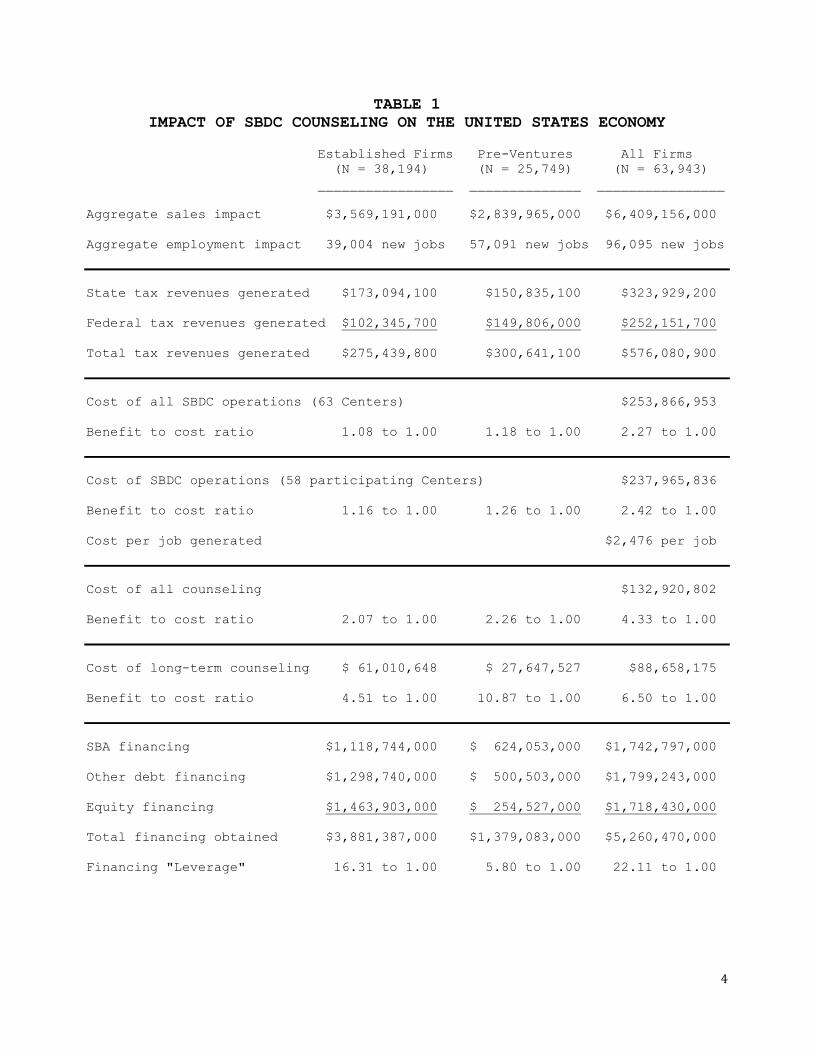
Results indicate that, after adjustments, the long-term clients of the
SBDC generated a total of approximately $6.4 billion in sales and 96,095 new
full time equivalent jobs from the assistance received (see Table 1). The
average cost of generating each job was $2,476.
The incremental performance improvements resulted in $275.44 million in
additional tax revenues from established businesses and $300.64 million from
pre-venture clients who started new businesses. This amounted to a total of
approximately $576.08 million in tax revenues, of which $323.93 million went to
the state governments and $252.15 million went to federal government. When
compared to the cost of operating the 58 SBDCs that participated in the study
($237.97 million), these counseling activities generated approximately $2.42 in
tax revenues for every $1 spent on the entire program. It should also be noted
that the tax revenues generated exceeded the direct cost of the counseling
provided to long-term clients by a ratio of 6.50 to 1.00.
Finally, approximately $5.26 billion in financing was obtained by clients
as a result of the counseling received ($1.74 billion in SBA loans, $1.80
billion in debt financing from other sources, and $1.72 billion in equity
financing). These figures suggest that every dollar expended on the operation
of the SBDC program in the U.S. was leveraged by approximately $22.11 in new
capital raised from external sources.
4
TABLE 1
IMPACT OF SBDC COUNSELING ON THE UNITED STATES ECONOMY
Established Firms Pre-Ventures All Firms
(N = 38,194) (N = 25,749) (N = 63,943)
_________________ ______________ ________________
Aggregate sales impact $3,569,191,000 $2,839,965,000 $6,409,156,000
Aggregate employment impact 39,004 new jobs 57,091 new jobs 96,095 new jobs
State tax revenues generated $173,094,100 $150,835,100 $323,929,200
Federal tax revenues generated $102,345,700 $149,806,000 $252,151,700
Total tax revenues generated $275,439,800 $300,641,100 $576,080,900
Cost of all SBDC operations (63 Centers) $253,866,953
Benefit to cost ratio 1.08 to 1.00 1.18 to 1.00 2.27 to 1.00
Cost of SBDC operations (58 participating Centers) $237,965,836
Benefit to cost ratio 1.16 to 1.00 1.26 to 1.00 2.42 to 1.00
Cost per job generated $2,476 per job
Cost of all counseling $132,920,802
Benefit to cost ratio 2.07 to 1.00 2.26 to 1.00 4.33 to 1.00
Cost of long-term counseling $ 61,010,648 $ 27,647,527 $88,658,175
Benefit to cost ratio 4.51 to 1.00 10.87 to 1.00 6.50 to 1.00
SBA financing $1,118,744,000 $ 624,053,000 $1,742,797,000
Other debt financing $1,298,740,000 $ 500,503,000 $1,799,243,000
Equity financing $1,463,903,000 $ 254,527,000 $1,718,430,000
Total financing obtained $3,881,387,000 $1,379,083,000 $5,260,470,000
Financing "Leverage" 16.31 to 1.00 5.80 to 1.00 22.11 to 1.00

5
INTRODUCTION
This report describes the results of a study designed to assess the
economic impact of the long-term counseling activities of the Small Business
Development Center (SBDC) Program in the United States in 2015. Long-term
clients are defined as those who received a minimum of five hours of
counseling assistance from the SBDC. The economic impact of counseling
activities was analyzed by comparing the increases in sales and employment
experienced by SBDC clients between 2015 and 2016 with the changes in
performance for businesses in the states and territories the program served
during this period. The growth in sales and employment in excess of national
averages was used to calculate the incremental federal and state tax revenues
generated the year after counseling assistance was provided. The tax revenues
generated by SBDC-counseled clients were then compared to the cost of the
service to determine if it was cost effective.
To supplement this analysis, clients were also asked to indicate whether
the SBDC program had assisted them to obtain financing and if so, the amount
of debt and equity financing they were able to obtain as a direct result of
the counseling received from the SBDC.
Finally, a host of qualitative questions was asked concerning the
availability of comparable assistance from private consultants and the quality
of the counselors.
The remainder of this report describes the methodology and results of
the study.
OVERVIEW: THE 2015-2016 NATIONAL IMPACT STUDY
In 2015, the 58 SBDCs (of 63) in the United States that participated in
this study provided long-term counseling assistance to a population of 63,943
clients, of which 38,194 were owners of established small businesses and
6
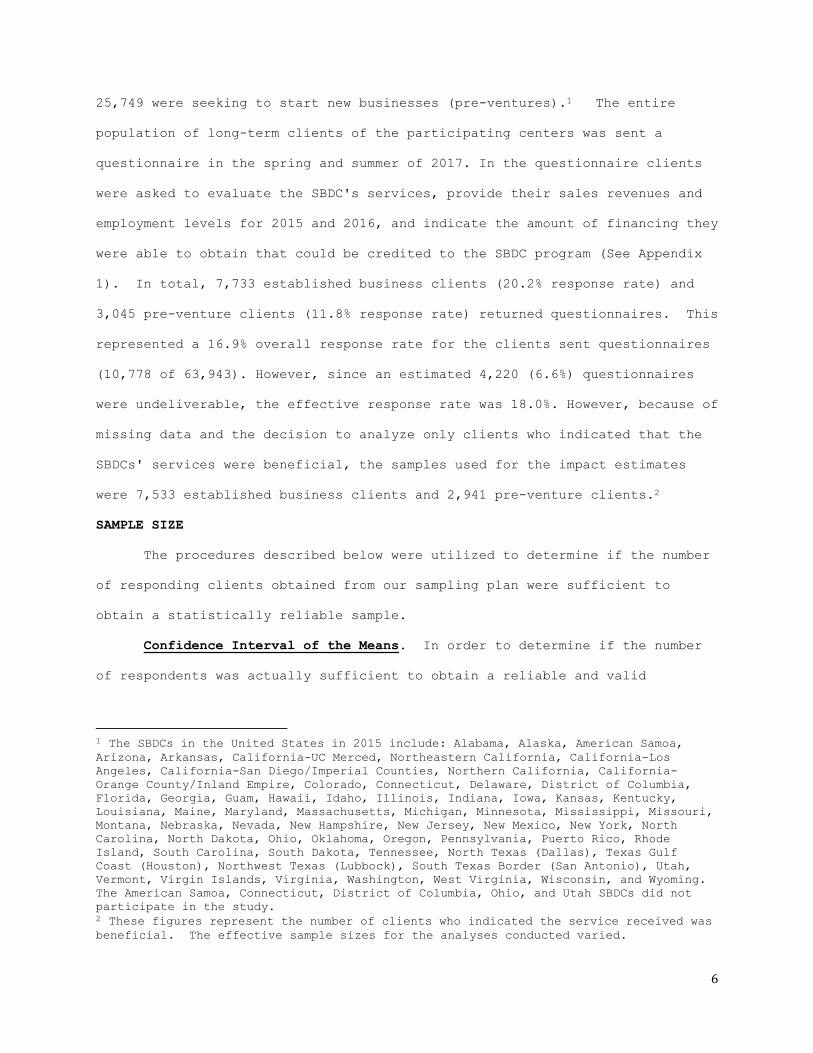
25,749 were seeking to start new businesses (pre-ventures).1 The entire
population of long-term clients of the participating centers was sent a
questionnaire in the spring and summer of 2017. In the questionnaire clients
were asked to evaluate the SBDC's services, provide their sales revenues and
employment levels for 2015 and 2016, and indicate the amount of financing they
were able to obtain that could be credited to the SBDC program (See Appendix
1). In total, 7,733 established business clients (20.2% response rate) and
3,045 pre-venture clients (11.8% response rate) returned questionnaires. This
represented a 16.9% overall response rate for the clients sent questionnaires
(10,778 of 63,943). However, since an estimated 4,220 (6.6%) questionnaires
were undeliverable, the effective response rate was 18.0%. However, because of
missing data and the decision to analyze only clients who indicated that the
SBDCs' services were beneficial, the samples used for the impact estimates
were 7,533 established business clients and 2,941 pre-venture clients.2
SAMPLE SIZE
The procedures described below were utilized to determine if the number
of responding clients obtained from our sampling plan were sufficient to
obtain a statistically reliable sample.
Confidence Interval of the Means. In order to determine if the number
of respondents was actually sufficient to obtain a reliable and valid
1 The SBDCs in the United States in 2015 include: Alabama, Alaska, American Samoa,
Arizona, Arkansas, California-UC Merced, Northeastern California, California-Los
Angeles, California-San Diego/Imperial Counties, Northern California, California-
Orange County/Inland Empire, Colorado, Connecticut, Delaware, District of Columbia,
Florida, Georgia, Guam, Hawaii, Idaho, Illinois, Indiana, Iowa, Kansas, Kentucky,
Louisiana, Maine, Maryland, Massachusetts, Michigan, Minnesota, Mississippi, Missouri,
Montana, Nebraska, Nevada, New Hampshire, New Jersey, New Mexico, New York, North
Carolina, North Dakota, Ohio, Oklahoma, Oregon, Pennsylvania, Puerto Rico, Rhode
Island, South Carolina, South Dakota, Tennessee, North Texas (Dallas), Texas Gulf
Coast (Houston), Northwest Texas (Lubbock), South Texas Border (San Antonio), Utah,
Vermont, Virgin Islands, Virginia, Washington, West Virginia, Wisconsin, and Wyoming.
The American Samoa, Connecticut, District of Columbia, Ohio, and Utah SBDCs did not
participate in the study. 2 These figures represent the number of clients who indicated the service received was
beneficial. The effective sample sizes for the analyses conducted varied.
7
estimation of the average changes in sales revenue and employment of SBDC
clients, the following formula was used.
Z = (nE2/s2)1/2 (1)
where: n = effective sample sizes (7,533 established, 2,941 pre-ventures).
s = standard deviation of the sample (standardized value = 1).
Z = confidence interval for the mean.
E = amount of error in the mean to be tolerated (5% of s).
With a tolerated error of .05 standard deviation, it was determined that
the confidence interval of the sales and employment means for the established
business and pre-venture respondents were reliable at the 99.9% and 99.3%
levels, respectively. In other words, we were more than 99% confident that our
sample means were no more than one-twentieth of one standard deviation from
the population means for the 58 centers that participated in this study.
SAMPLE VALIDATION
Although we surveyed the entire population of long-term clients, when a
mail survey is conducted, there is no way to ensure that 100% of those
surveyed will respond to the questionnaire. Therefore, it is necessary to
conduct statistical tests to ensure that respondents are representative of the
population, there is a minimum likelihood of response bias, and the data are
reliable. The following procedures were used.
Representativeness. Each center was asked to provide demographic
information (gender and ethnic background of client, industry in which
business competes) for all clients surveyed and for all respondents (See
Appendix 2).3 Comparisons and Chi-square goodness-of-fit tests using
standardized data indicated that both the established business and pre-venture
respondents were proportionally representative of the population.
3 The comparative statistical analysis of the population and respondents were
conducted with data from 58 participating SBDCs.

8
Response Bias. The questionnaire was sent to clients in several waves
in the spring and summer of 2017. Respondents were divided into groups of
according to when they responded to the questionnaire and compared in terms of
their reported sales revenue, employment, financing obtained, and evaluation
of the SBDC's services. This procedure made it possible to investigate the
issue of response bias. Taken together, t-tests and analysis of variance
(ANOVA) indicated that there were no differences in the responses of early and
late for responding established business and pre-venture clients. Given that
late respondents could be expected to be more similar to non-respondents than
earlier responders are, there does not appear to be any strong reason to
believe the estimates reported in this study are biased.
Reliability. The reliability of the questionnaire was assessed by a
point biserial correlation analysis comparing clients' perceptions of whether
the SBDC's services were beneficial and their (1) evaluations of the knowledge
and expertise of the counselors, (2) working relationships with the
counselors, and (3) willingness to recommend the SBDC to others. The results
of the respective comparisons were statistically significant at better than
the 1% level for both established business clients (r = .58; r = .60; r = .63)
and pre-venture clients (r = .64; r = .63; r = .73). Thus, clients' responses
to the questionnaire appeared to be reliable.
DATA ANALYSIS METHODS
The methods for estimating the economic impact of SBDC counseling
services are described below.
EXISTING BUSINESSES
The changes in sales and employment for the period before and after
counseling was received were calculated for businesses receiving at least five
hours of assistance. For employment, both regular employees and independent
contractors were considered. One full-time independent contractor was

9
considered equivalent to one full-time employee. Two part-time employees or
independent contractors were considered equivalent to one full-time employee.4
Rates of sales and employment growth for the existing clients were
compared with the weighted average growth rates in the home states or
territories of the centers on each measure. Statewide averages were weighted
according to the number of clients served by each center as a proportion of
the total number of clients served by the SBDC system. This procedure guards
against potential biases that might exist if the number of clients counseled
across the states and territories varied in proportion to their populations.
The difference between the growth rate of clients and weighted average
growth rates for all businesses was used to estimate the incremental or
marginal changes in sales and employment growth of the sample.5 Only clients
who indicated that the SBDC's services were beneficial were used to calculate
incremental growth rates.6 The incremental growth rates were multiplied by
the average sales and employment of the respondents for the year before
counseling was received.
Weighted averages of each tax figure (sales taxes, state and federal
income taxes) were calculated based on the proportion of clients served by
each state or territory compared to the total number of clients served by the
centers to guard against potential bias that might exist if counseling
4 All employment data reported in this study refers to full-time equivalent jobs. 5 GSP growth among private industries between 2015 and 2016 was used as a surrogate for the average rate of sales growth in each state. We used data obtained from the Bureau
of Economic Analysis to estimate state sales growth. The average rate of employment
growth in each state was obtained from the Bureau of Labor Statistics. The average
growth rates were computed using a weighting scheme that took into account the long-
term client population of the SBDCs. 6 Although reasons for client dissatisfaction may be unrelated to the quality of the
advice (e.g., it was not what the client wanted to hear), it did not seem appropriate
to count the performance improvements of clients who did not believe they received
value from the SBDC.

10
intensity differed by state or territory.7 The weighted average sales tax
rate was reduced by 25% to reflect the fact that not all businesses pay sales
taxes even though some of their sales may eventually "pass through" to the
final consumer. This adjustment may still overestimate taxes paid on sales.
However, this approach is more realistic and conservative in its assessment of
sales tax contributions than no adjustment, and still captures the value added
by those businesses whose sales are not directly taxed. Furthermore, any
overestimate must be weighed against the fact that other tax sources are not
measured in this study (e.g., payroll taxes, corporate income taxes, social
security payments).
Federal income tax data for 2014, the most recent year available, were
obtained from the online version of the Internal Revenue Service's Statistics
of Income Bulletin (2017). The estimated median (based on an analysis of tax
brackets), rather than the average, was used to be conservative and to better
reflect the types of employment opportunities offered by our respondents. The
median state income tax paid per return for each state was estimated by
dividing the median federal income taxed paid per return by the average
federal income tax paid per return within the state and multiplying that
proportion by the average state income tax paid per return. A weighted
national average was then computed based on the populations of clients served
by each SBDC.8
Adjusted weighted sales tax rates and personal income taxes (state or
territory and federal) were multiplied by the average incremental improvements
7 State sales tax information was available for the 58 of the participating SBDCs.
State income tax data were available from the 58 SBDCs. The average tax rates were
computed using a weighting scheme that took into account the long-term client
population of the SBDCs. Federal tax data were also available for all participating
centers. 8 Each responding SBDC provided state or territory income tax data for the most recent
year available. In most cases, this was 2015 or 2016; however, some SBDCs were only
able to obtain data for 2013 or 2014. Since experience shows these numbers do not vary
much from year to year, it is unlikely this had a significant impact on the results.

11
in sales and employment respectively to arrive at the value added figures. As
shown below, all these numbers were then multiplied by the total number of
existing business clients after adjusting for the proportion of the
respondents who indicated the SBDC's services were beneficial.9
Average X Tax X Proportion of Clients X Total Number = Total Tax (2)
Growth Rate Satisfied w/Service of Clients Revenues
PRE-VENTURE CLIENTS
Similar procedures were used for pre-venture clients who received at
least five hours of assistance, with the following exceptions. First, as pre-
ventures had no previous sales or employees from which to calculate growth,
the raw averages were used to assess economic impact. Second, this average
was adjusted to account for the number of pre-venture clients who failed or
did not start a business between 2015 and 2016 (about 37.9% of the sample did
not start a business by the end of 2016). The adjustments are shown below.
Average Performance = AS X (NS/NP) (3)
where: AS = average performance (sales, employment) of successful pre-
ventures
NS = number of successful pre-ventures
NP = number of pre-ventures (successful + unsuccessful)
Once this adjustment was made, the average performance of the pre-
venture respondents was multiplied by the corresponding tax rates, the
proportion of pre-ventures who judged the SBDC's services to be beneficial,
and the total number of pre-venture clients. The formula is shown below.
Average X Tax X Proportion of Clients X Total = Total Tax (4)
Performance Rate Satisfied w/Service Clients Revenues
BENEFIT OF SBDC SERVICES TO COST
The tax revenue generated by the SBDC was divided by the total cost of
operating the participating centers to arrive at a benefit to cost ratio.10
9 Aggregate figures for sales generated and jobs created were calculated by
multiplying average performance by the total number of clients. 10 We also compared the tax impact with the entire SBDC budget for the full complement
of 63 centers.
12
The total budget of the SBDC, per data supplied by the Small Business
Administration for fiscal year 2015, was used for this calculation. This was
a conservative approach since only part of the budgets of the centers was used
for counseling, and some of that amount was spent on short-term rather than
long-term clients.11 Thus, the calculations compare the impact of assistance
to long-term clients, which consumed about 37.3% of the United States SBDC
program’s budget, with the amount spent on the entire SBDC program.
To provide additional insights we also made cost-benefit comparisons
with the cost of the counseling for the participating centers, as well as the
portion of their counseling budget spent on assisting long-term established
and pre-venture clients.
OTHER ANALYSES
Evaluation of Quality of Counseling Services. Clients were asked
whether the services provided by the SBDC were beneficial. This question was
used to determine whether clients' performance improvements might have been
affected by SBDC counseling. As noted above, the performance improvements of
responding clients were adjusted to account for the proportion that believed
the SBDC's services were beneficial when extrapolating the results to the full
population of clients.
Clients were also asked to assess the knowledge and expertise of
counselors assigned to their cases as well as their working relationship with
the counselors. Clients evaluated their counselors’ knowledge/expertise and
working relationship on a five-point scale: (1) poor, (2) below average, (3)
average, (4) above average, and (5) excellent. These questions provide
further evidence of the quality of the counseling services. In the main,
however, these questions were used to assess the reliability of the question
concerning whether the SBDC's services were beneficial.
11 Estimates of counseling budgets were made from data supplied by 58 SBDCs.
13
Comparison with Private Consultants. Clients were asked if they could
have obtained assistance of the same quality from a private consultant at a
price they could afford. A primary rationale of government-funded programs is
that there is a paucity of private sector assistance available to resource
poor entrepreneurs. A major criticism of public programs is, on the other
hand, that they may squeeze out private sector initiatives by providing
unfair, subsidized competition. By analyzing the availability of alternative
sources of assistance, this question made it possible to test whether the
rationale for the SBDC program is valid, as well as whether criticisms about
unfair competition are warranted.
Financing. Established business and pre-venture clients were asked to
estimate the amounts of SBA guaranteed loans, other loans, and equity
financing obtained directly because of SBDC counseling activities. To remain
conservative, only those clients who indicated that the SBDC assisted them to
obtain financing were used for this analysis. Extrapolation to the entire
client population was made after adjusting for the proportion of clients who
indicated the SBDC assisted them in raising capital.
RESULTS
The results of the analysis of the counseling services provided by the
SBDC to established business and pre-venture clients are presented below.
ESTABLISHED BUSINESSES
Perceptions of the Quality of Counseling. Of the 7,533 clients who
provided usable responses to the service evaluation question, 92% indicated
that the SBDC's services were beneficial. Furthermore, clients gave a rating
of 4.55 out of a possible 5.00 on the knowledge and expertise of their
counselors and a rating of 4.55 on their working relationship with the
counselors (See Table 2). Finally, 94% of the 7,556 responding established
business clients indicated that they would recommend the SBDC's services to
other business owners.

14
Comparison with Private Consultants. Results indicated that 79% of the
responding clients (n = 6,390) believed that they could not have obtained
private consulting services of a similar quality at a price they could afford.
Economic Impact Estimates. Table 3 compares the 2015 and 2016 sales and
employment levels of established small business clients. As this Table shows,
these clients reported an average increase in sales of $128,243 (from $940,513
in 2015 to $1,068,756 in 2016). There was also an increase in the number of
individuals employed by clients in 2016 (9.76) compared to 2015 (8.50).12
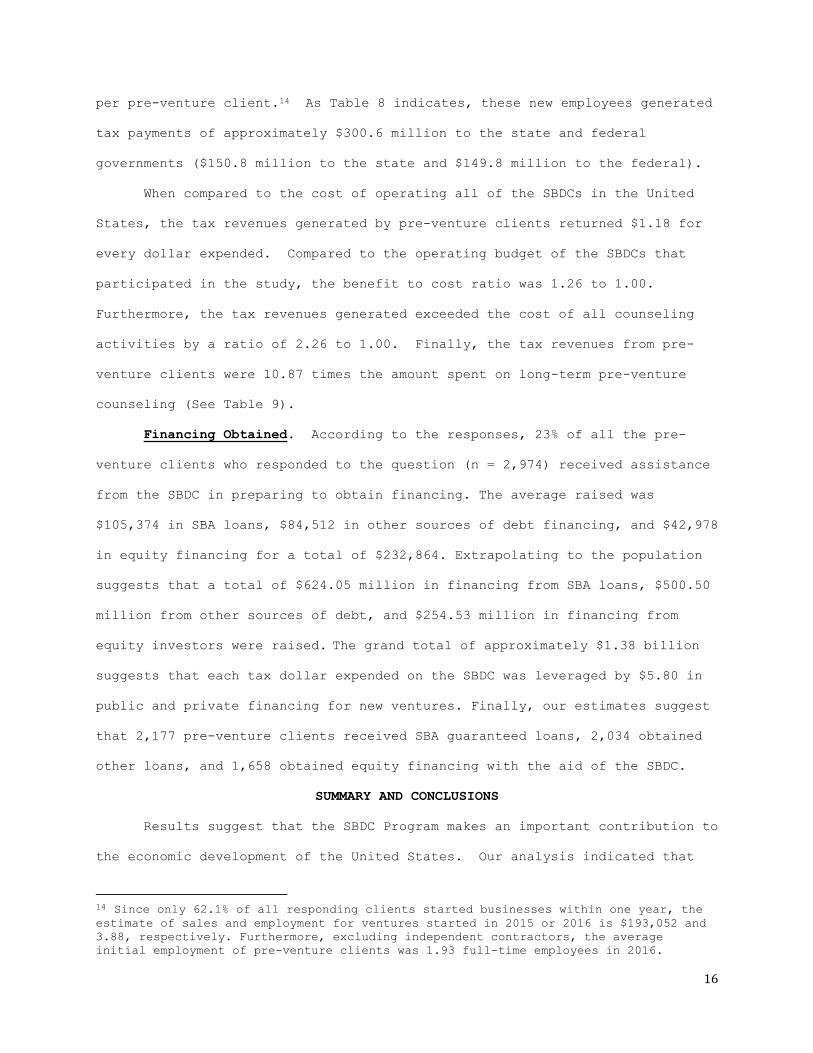
Table 4 compares the growth in sales and employment between 2015 and
2016 of SBDC clients with the growth experienced by the average business in
the United States. As shown, the sales of established business clients
increased by 13.6% compared to an increase of 2.8% for the average business in
the U.S. In addition, employment levels of established clients increased by
14.8% compared to a 1.8% increase for U.S. businesses in general.13
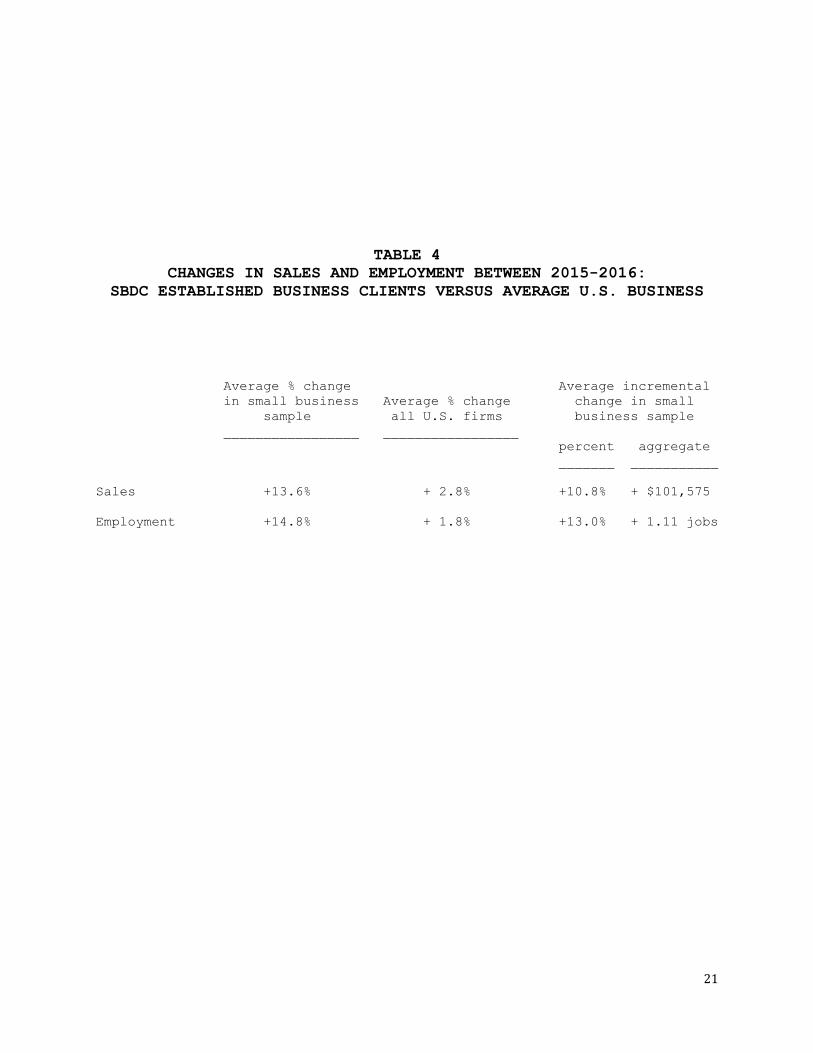
The overall impact estimate for established business clients suggests
that the SBDCs’ services led to a total of approximately $275.4 million in new
tax contributions: approximately $173.1 million went to state governments and
$102.3 million went to the federal government (Table 5). As shown in Table 6,
these additional tax revenues were 8% greater than the operating budget of the
entire SBDC program and 16% greater than the operating budget of the centers
that participated in the study. Furthermore, established clients generated
tax revenues that were 2.07 times greater than the total counseling budget of
the participating SBDCs; these revenues also represented a return of $4.51 for
every dollar those SBDCs spent on established business clients who received
long-term assistance.
12 If we exclude independent contractors, the employment of established business
clients grew from an average of 7.20 full-time employees in 2015 to 8.21 in 2016, a
14.0% increase. 13 Again, the national figures were calculated by state averages weighted by the number
of long-term clients served per SBDC.
15
Financing Obtained. According to the respondents, 28% of responding
established business clients (n = 7,464) were assisted in preparing to seek
financing. Those clients obtained an average of $362,939 in capital, of which
$104,611 came from SBA loans, $121,442 came from other forms of debt
financing, and $136,886 came from equity financing. Extrapolations indicate
that clients raised $1.12 billion in SBA loans, $1.30 billion in other debt
financing, and $1.46 billion in equity financing (approximately $3.88 billion
in total) with the help of the SBDC. This suggests that the total expenditure
of tax dollars on the SBDC was leveraged by public and private financing at a
ratio of 16.31 to 1.00 for long-term established business clients alone. Our
estimates also suggest that 2,824 established business clients received SBA
guaranteed loans because of SBDC assistance. Furthermore, 3,609 obtained
other loans and 3,264 obtained equity financing.
PRE-VENTURE CLIENTS
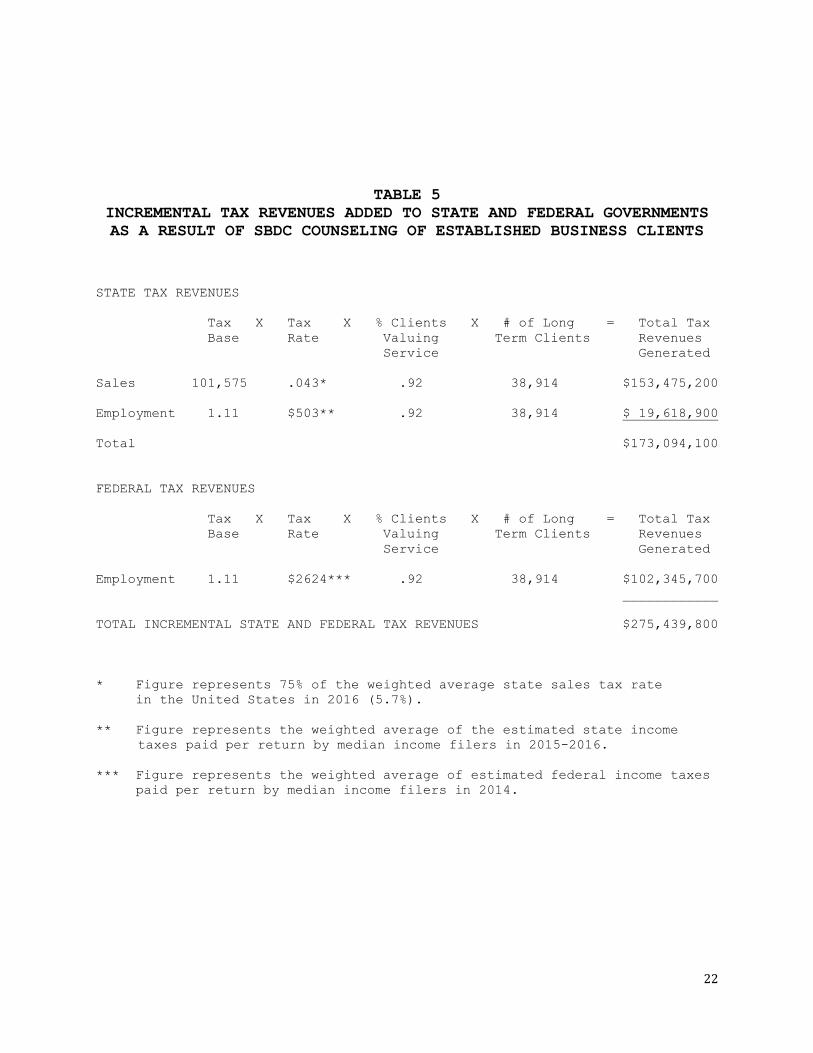
Perceptions of the Quality of Counseling. Of the 2,941 pre-venture
clients who provided an evaluation of the SBDC's services, 92% felt the
counseling was beneficial. In addition, clients gave a rating of 4.52 out of
a possible 5.00 on their counselors' knowledge and expertise and a rating of
4.48 on their working relationship with the counselors (See Table 7).
Finally, of the 2,953 clients who answered the question, 93% indicated they
would recommend the SBDC's services to other entrepreneurs.
Comparison with Private Consultants. In total, 78% of the responding
clients (n = 2,787) believed they would not have been able to obtain private
consulting services of a similar quality at a price they could afford.
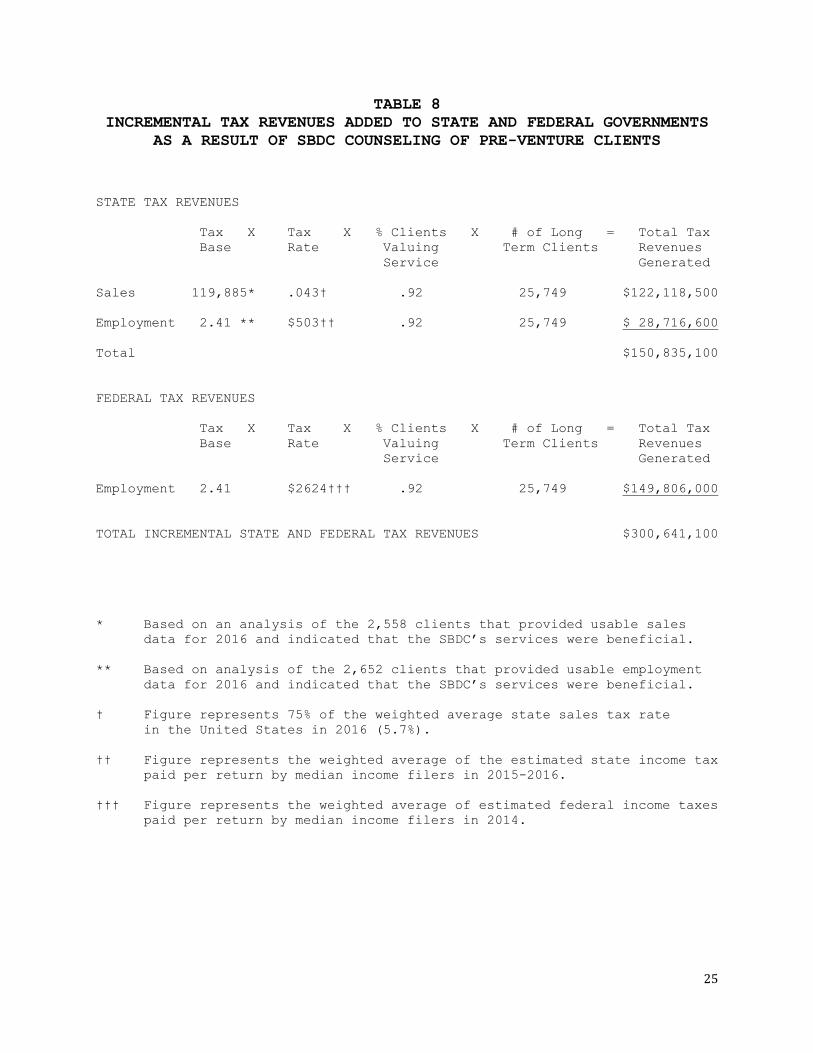
Economic Impact Estimates. After adjusting for unsuccessful clients, we
calculated that an average of $119,885 in sales and 2.41 new jobs were created
16
per pre-venture client.14 As Table 8 indicates, these new employees generated
tax payments of approximately $300.6 million to the state and federal
governments ($150.8 million to the state and $149.8 million to the federal).
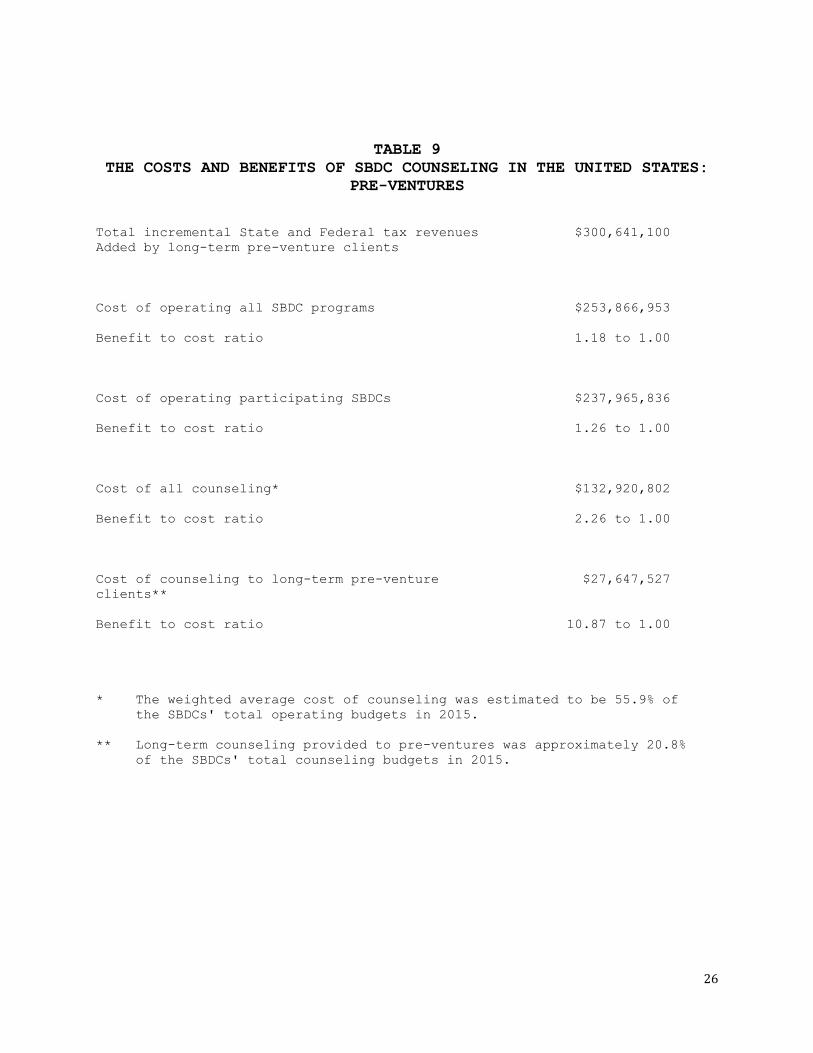
When compared to the cost of operating all of the SBDCs in the United
States, the tax revenues generated by pre-venture clients returned $1.18 for
every dollar expended. Compared to the operating budget of the SBDCs that
participated in the study, the benefit to cost ratio was 1.26 to 1.00.
Furthermore, the tax revenues generated exceeded the cost of all counseling
activities by a ratio of 2.26 to 1.00. Finally, the tax revenues from pre-
venture clients were 10.87 times the amount spent on long-term pre-venture
counseling (See Table 9).
Financing Obtained. According to the responses, 23% of all the pre-
venture clients who responded to the question (n = 2,974) received assistance
from the SBDC in preparing to obtain financing. The average raised was
$105,374 in SBA loans, $84,512 in other sources of debt financing, and $42,978
in equity financing for a total of $232,864. Extrapolating to the population
suggests that a total of $624.05 million in financing from SBA loans, $500.50
million from other sources of debt, and $254.53 million in financing from
equity investors were raised. The grand total of approximately $1.38 billion
suggests that each tax dollar expended on the SBDC was leveraged by $5.80 in
public and private financing for new ventures. Finally, our estimates suggest
that 2,177 pre-venture clients received SBA guaranteed loans, 2,034 obtained
other loans, and 1,658 obtained equity financing with the aid of the SBDC.
SUMMARY AND CONCLUSIONS
Results suggest that the SBDC Program makes an important contribution to
the economic development of the United States. Our analysis indicated that
14 Since only 62.1% of all responding clients started businesses within one year, the
estimate of sales and employment for ventures started in 2015 or 2016 is $193,052 and
3.88, respectively. Furthermore, excluding independent contractors, the average
initial employment of pre-venture clients was 1.93 full-time employees in 2016.

17
the SBDCs’ long-term clients added $6.4 billion in incremental sales and
96,095 new jobs to the nation. The latter number suggests that the cost of
generating a new job through investment in the SBDC was $2,476 per job. In
addition, 66.7% of all pre-venture clients started businesses after receiving
counseling (62.1% within one year).
Estimates suggest that the one-year tax benefits accruing as a
consequence of the performance improvements of SBDC-counseled long-term
clients returned $2.42 for every dollar spent on the 58 (of 63) SBDCs that
participated in the study. Furthermore, our estimates indicate that $6.50 was
returned for each dollar expended on counseling long-term clients. Finally,
our estimates indicate that approximately $5.3 billion in capital was raised
by clients as a direct result of the assistance received from the SBDC. This
suggests that each dollar expended on the SBDC Program was later leveraged by
approximately $22.11 in debt and equity capital.
The numbers presented in this report are only estimates based on
responses to a questionnaire. It is possible that the respondents were not
representative of the population of clients, factors such as social
desirability bias may have inflated the estimates, or that “self-selected”
SBDC clients tend to exceed the sales and employment growth rates of “average”
businesses in the United States for reasons unrelated to the counseling
provided. It is also possible that some of the gains of the clients were not
net gains to the economy.
Impact methodologies are always susceptible to potential problems of
obtaining adequate control groups, the possibilities of response bias or self-
selection bias, and displacement effects. Nevertheless, the tests conducted
for bias and reliability, as well as the use of weighted statewide comparison
groups, suggests that the results are accurate enough to conclude that the
SBDC program in the United States makes a positive contribution to the
economy. Furthermore, although the numbers presented in this report are only

18
estimates, their magnitude suggests that even if we greatly overestimated the
economic impact of the SBDC our overall conclusions would remain the same.
In addition, the estimates reported herein do not consider the
following. (1) The other programs the SBDC offers (e.g., workshops, seminars).
(2) The value added to the operations of short-term clients. (3) The tax
revenues long-term clients generate after the year of analysis. (4) The many
failures SBDC assistance helps stave off and the individuals with unviable
business ideas it discourages. (5) The other tax revenues generated by
corporate taxes, property taxes, unemployment taxes, and social security
payments. (6) The multiplier effects associated with a healthier small
business sector. Considering all these factors, we believe that the results
presented in this study tend to be conservative.
From a public policy standpoint, the implication of this study is that
the SBDC makes an important contribution to the economy of the United States.
By assisting established small businesses, SBDCs across the United States help
create new job opportunities in growing firms and contribute to the retention
of jobs in small companies trying to turn around or reorient their businesses.
The SBDC work with pre-venture clients helps individuals identify and initiate
viable new business ventures that invigorate the economy.
In conclusion, the evidence presented in this report indicates that
SBDC-assisted clients generate sales and employment opportunities that return
more tax revenues to state and federal governments than the cost of operating
the Program. Clients believe that the SBDC contributed substantially to the
performance improvements of their businesses and are better able to raise
capital to support the start-up and growth of their businesses. This is
justification for the continuation and proliferation of the SBDC Program.

19
TABLE 2
QUALITATIVE EVALUATIONS OF THE COUNSELING PROVIDED TO
ESTABLISHED BUSINESS CLIENTS BY THE SBDC PROGRAM
Knowledge and Expertise of Counselors
Number Percentage
5. Excellent 5,272 69.8%
4. Above Average 1,499 19.9%
3. Average 576 7.6%
2. Below Average 85 1.1%
1. Poor 116 1.5%
______ __________
Totals 7,548 100.0%
Average = 4.55
______________________________________________________________________________
Clients' Working Relationship with Counselors
Number Percentage
5. Excellent 5,471 72.5%
4. Above Average 1,176 15.6%
3. Average 639 8.5%
2. Below Average 119 1.6%
1. Poor 144 1.9%
______ __________
Totals 7,549 100.0%
Average = 4.55

20
TABLE 3
2015-2016 AVERAGE SALES AND EMPLOYMENT OF ESTABLISHED CLIENTS
WHO INDICATED THAT SBDC ASSISTANCE WAS VALUABLE
2015 2016 Average Change
__________ __________ ______________
Sales * $940,513 $1,068,756 + $128,243
13.6%
Employment ** 8.50 jobs 9.76 jobs + 1.26 jobs
14.8%
* Based on analysis of the 6,245 clients that provided usable sales data
for both 2015 and 2016 and indicated that the SBDC’s services were
beneficial.
** Based on analysis of the 6,558 clients that provided usable employment
data for both 2015 and 2016 and indicated that the SBDC’s services were
beneficial.
21
TABLE 4
CHANGES IN SALES AND EMPLOYMENT BETWEEN 2015-2016:
SBDC ESTABLISHED BUSINESS CLIENTS VERSUS AVERAGE U.S. BUSINESS
Average % change Average incremental
in small business Average % change change in small
sample all U.S. firms business sample
_________________ _________________
percent aggregate
_______ ___________
Sales +13.6% + 2.8% +10.8% + $101,575
Employment +14.8% + 1.8% +13.0% + 1.11 jobs
22
TABLE 5
INCREMENTAL TAX REVENUES ADDED TO STATE AND FEDERAL GOVERNMENTS
AS A RESULT OF SBDC COUNSELING OF ESTABLISHED BUSINESS CLIENTS
STATE TAX REVENUES
Tax X Tax X % Clients X # of Long = Total Tax
Base Rate Valuing Term Clients Revenues
Service Generated
Sales 101,575 .043* .92 38,914 $153,475,200
Employment 1.11 $503** .92 38,914 $ 19,618,900
Total $173,094,100
FEDERAL TAX REVENUES
Tax X Tax X % Clients X # of Long = Total Tax
Base Rate Valuing Term Clients Revenues
Service Generated
Employment 1.11 $2624*** .92 38,914 $102,345,700
____________
TOTAL INCREMENTAL STATE AND FEDERAL TAX REVENUES $275,439,800
* Figure represents 75% of the weighted average state sales tax rate
in the United States in 2016 (5.7%).
** Figure represents the weighted average of the estimated state income
taxes paid per return by median income filers in 2015-2016.
*** Figure represents the weighted average of estimated federal income taxes
paid per return by median income filers in 2014.

23
TABLE 6
THE COSTS AND BENEFITS OF SBDC COUNSELING IN THE UNITED STATES:
ESTABLISHED BUSINESSES
Total incremental State and Federal tax revenues $275,439,800
added by long-term established business clients
Cost of operating all SBDC programs $253,866,953
Benefit to cost ratio 1.08 to 1.00
Cost of operating participating SBDCs $237,965,836
Benefit to cost ratio 1.16 to 1.00
Cost of all counseling* $132,920,802
Benefit to cost ratio 2.07 to 1.00
Cost of counseling long-term established $ 61,010,648
business clients**
Benefit to cost ratio 4.51 to 1.00
* The weighted average cost of counseling was estimated to be 55.9% of
the SBDCs' total operating budgets in 2015.
** Long-term counseling provided to established businesses was approximately
45.9% of the SBDCs' total counseling budgets in 2015.
24
TABLE 7
QUALITATIVE EVALUATIONS OF THE COUNSELING PROVIDED TO
PRE-VENTURE CLIENTS BY THE SBDC PROGRAM
Knowledge and Expertise of Counselors
Number Percentage
5. Excellent 2,004 67.9%
4. Above Average 618 20.9%
3. Average 233 7.9%
2. Below Average 37 1.3%
1. Poor 58 2.0%
______ __________
Totals 2,950 100.0%
Average = 4.52
______________________________________________________________________________
Clients' Working Relationship with Counselors
Number Percentage
5. Excellent 2,034 68.9%
4. Above Average 497 16.8%
3. Average 301 10.2%
2. Below Average 53 1.8%
1. Poor 66 2.2%
______ __________
Totals 2,951 100.0%
Average = 4.48
25
TABLE 8
INCREMENTAL TAX REVENUES ADDED TO STATE AND FEDERAL GOVERNMENTS
AS A RESULT OF SBDC COUNSELING OF PRE-VENTURE CLIENTS
STATE TAX REVENUES
Tax X Tax X % Clients X # of Long = Total Tax
Base Rate Valuing Term Clients Revenues
Service Generated
Sales 119,885* .043† .92 25,749 $122,118,500
Employment 2.41 ** $503†† .92 25,749 $ 28,716,600
Total $150,835,100
FEDERAL TAX REVENUES
Tax X Tax X % Clients X # of Long = Total Tax
Base Rate Valuing Term Clients Revenues
Service Generated
Employment 2.41 $2624††† .92 25,749 $149,806,000
TOTAL INCREMENTAL STATE AND FEDERAL TAX REVENUES $300,641,100
* Based on an analysis of the 2,558 clients that provided usable sales
data for 2016 and indicated that the SBDC’s services were beneficial.
** Based on analysis of the 2,652 clients that provided usable employment
data for 2016 and indicated that the SBDC’s services were beneficial.
† Figure represents 75% of the weighted average state sales tax rate
in the United States in 2016 (5.7%).
†† Figure represents the weighted average of the estimated state income tax
paid per return by median income filers in 2015-2016.
††† Figure represents the weighted average of estimated federal income taxes
paid per return by median income filers in 2014.
26
TABLE 9
THE COSTS AND BENEFITS OF SBDC COUNSELING IN THE UNITED STATES:
PRE-VENTURES
Total incremental State and Federal tax revenues $300,641,100
Added by long-term pre-venture clients
Cost of operating all SBDC programs $253,866,953
Benefit to cost ratio 1.18 to 1.00
Cost of operating participating SBDCs $237,965,836
Benefit to cost ratio 1.26 to 1.00
Cost of all counseling* $132,920,802
Benefit to cost ratio 2.26 to 1.00
Cost of counseling to long-term pre-venture $27,647,527
clients**
Benefit to cost ratio 10.87 to 1.00
* The weighted average cost of counseling was estimated to be 55.9% of
the SBDCs' total operating budgets in 2015.
** Long-term counseling provided to pre-ventures was approximately 20.8%
of the SBDCs' total counseling budgets in 2015.
27
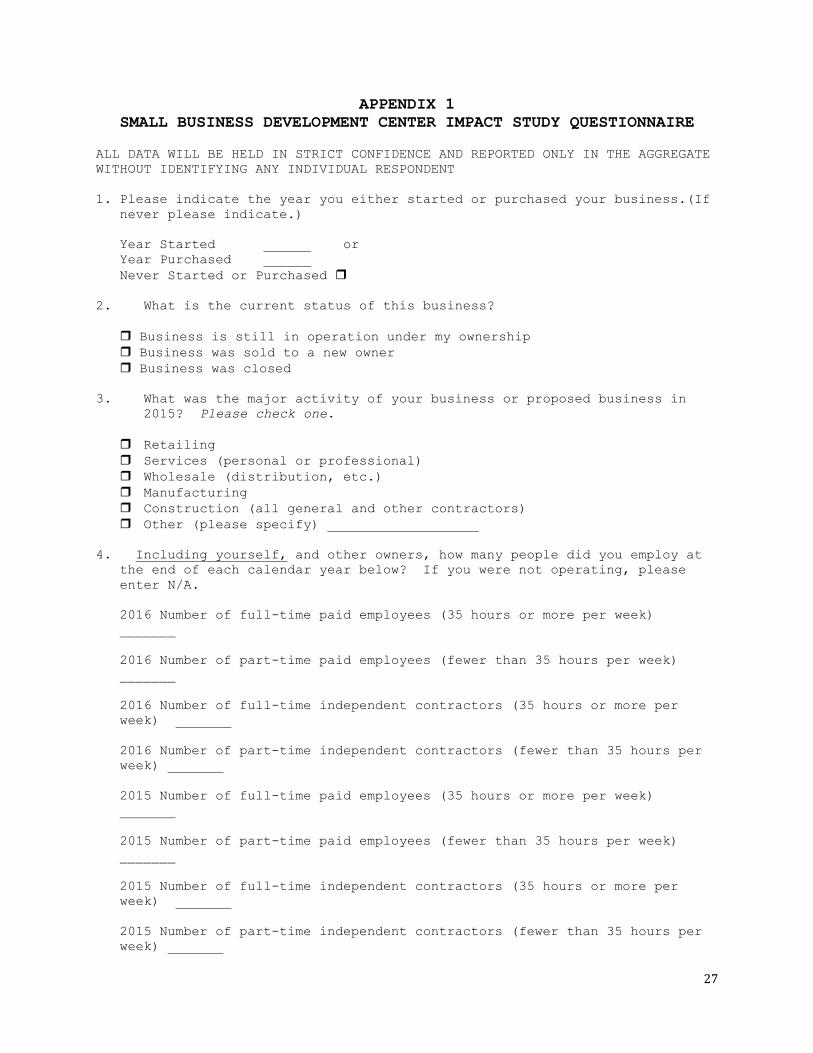
APPENDIX 1
SMALL BUSINESS DEVELOPMENT CENTER IMPACT STUDY QUESTIONNAIRE
ALL DATA WILL BE HELD IN STRICT CONFIDENCE AND REPORTED ONLY IN THE AGGREGATE
WITHOUT IDENTIFYING ANY INDIVIDUAL RESPONDENT
1. Please indicate the year you either started or purchased your business.(If never please indicate.)
Year Started ______ or
Year Purchased ______
Never Started or Purchased
2. What is the current status of this business?
Business is still in operation under my ownership
Business was sold to a new owner
Business was closed
3. What was the major activity of your business or proposed business in
2015? Please check one.
Retailing
Services (personal or professional)
Wholesale (distribution, etc.)
Manufacturing
Construction (all general and other contractors)
Other (please specify) ___________________
4. Including yourself, and other owners, how many people did you employ at
the end of each calendar year below? If you were not operating, please
enter N/A.
2016 Number of full-time paid employees (35 hours or more per week)
_______
2016 Number of part-time paid employees (fewer than 35 hours per week)
_______
2016 Number of full-time independent contractors (35 hours or more per
week) _______
2016 Number of part-time independent contractors (fewer than 35 hours per
week) _______
2015 Number of full-time paid employees (35 hours or more per week)
_______
2015 Number of part-time paid employees (fewer than 35 hours per week)
_______
2015 Number of full-time independent contractors (35 hours or more per
week) _______
2015 Number of part-time independent contractors (fewer than 35 hours per
week) _______
28
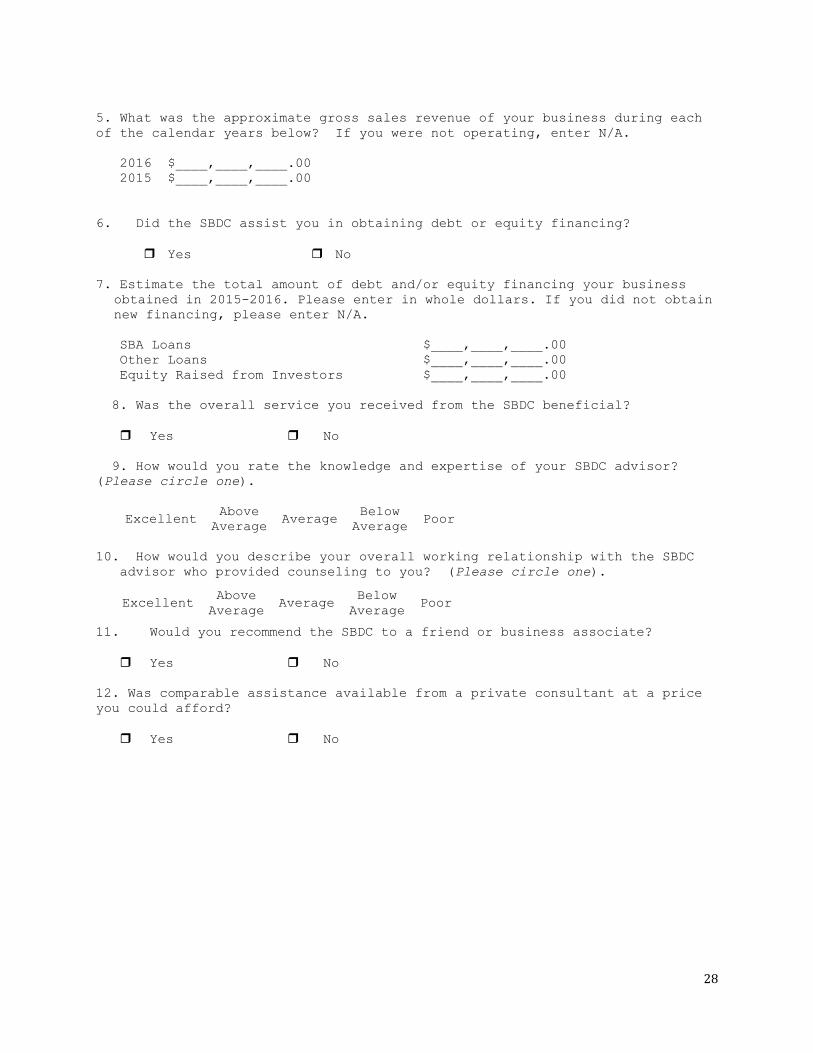
5. What was the approximate gross sales revenue of your business during each
of the calendar years below? If you were not operating, enter N/A.
2016 $____,____,____.00
2015 $____,____,____.00
6. Did the SBDC assist you in obtaining debt or equity financing?
Yes No
7. Estimate the total amount of debt and/or equity financing your business
obtained in 2015-2016. Please enter in whole dollars. If you did not obtain
new financing, please enter N/A.
SBA Loans $____,____,____.00
Other Loans $____,____,____.00
Equity Raised from Investors $____,____,____.00
8. Was the overall service you received from the SBDC beneficial?
Yes No
9. How would you rate the knowledge and expertise of your SBDC advisor?
(Please circle one).
Excellent Above
Average Average
Below
Average Poor
10. How would you describe your overall working relationship with the SBDC
advisor who provided counseling to you? (Please circle one).
11. Would you recommend the SBDC to a friend or business associate?
Yes No
12. Was comparable assistance available from a private consultant at a price
you could afford?
Yes No
Excellent Above
Average Average
Below
Average Poor

29
APPENDIX 2
DEMOGRAPHIC DATA COLLECTED FROM CLIENTS
DEMOGRAPHIC DATA FORM #1
THE FOLLOWING INFORMATION SHOULD BE PROVIDED FOR ALL CLIENTS WHO RECEIVED
FIVE HOURS OR MORE OF COUNSELING ASSISTANCE FROM YOUR STATE SBDC IN 2015
REGARDLESS OF WHETHER THEY RESPONDED TO THE SURVEY OR NOT.
1. Total number of clients served (5 hours or more) in 2015.
Pre-venture __________
Existing businesses __________
2. Type of Business (number)
PRE-VENTURES EXISTING
Retail ____________ ___________
Service ____________ ___________
Wholesale ____________ ___________
Manufacturing ____________ ___________
Construction ____________ ___________
Other ____________ ___________
3. Gender of clients (number)
PRE-VENTURE EXISTING
Male ___________ ___________
Female ___________ ___________
Male/Female ___________ ___________
4. Ethnic background (number)
PRE-VENTURE EXISTING
White ___________ ___________
Other ___________ ___________
CENTER: ____________________________________________________
CONTACT PERSON: ____________________________________________________
PHONE, FAX, EMAIL: ____________________________________________________

30
DEMOGRAPHIC DATA FORM #2
INFORMATION ON POINTS 1-4 SHOULD BE PROVIDED ONLY FOR CLIENTS SERVED IN 2015
(FIVE HOURS OR MORE OF COUNSELING ASSISTANCE) WHO RESPONDED TO THE SBDC
IMPACT STUDY SURVEY. PLEASE ALSO INDICATE THE NUMBER OF UNDELIVERABLE
QUESTIONNAIRES AT THE BOTTOM (POINT 5).
1. Total number of responding clients (5 hours or more) in 2015
Pre-venture __________
Established businesses __________
2. Type of Business (number)
PRE-VENTURES EXISTING
Retail ____________ ___________
Service ____________ ___________
Wholesale ____________ ___________
Manufacturing ____________ ___________
Construction ____________ ___________
Other ____________ ___________
3. Gender of clients (number)
PRE-VENTURE EXISTING
Male ___________ ___________
Female ___________ ___________
Male/Female ___________ ___________
4. Ethnic background (number)
PRE-VENTURE EXISTING
White ___________ ___________
Other ___________ ___________
5. UNDELIVERABLE QUESTIONNAIRES ___________
CENTER: ____________________________________________________
CONTACT PERSON: ____________________________________________________
PHONE, FAX, EMAIL: ____________________________________________________

31
DEMOGRAPHIC DATA FORM #3
THE FOLLOWING INFORMATION SHOULD BE PROVIDED AS IT PERTAINS TO YOUR SBDC.
1. Counseling hours*
a. Total number of counseling hours provided to all clients
(regardless of hours) in 2015 ____ hours
b. Total number of counseling hours LONG-TERM PRE-VENTURES ____ hours
provided to clients in 2015 who
received five (5) or more hours LONG-TERM EXISTING CLIENTS____ hours
of assistance
2. Proportion of total budget allocated to counseling ___________%
[counseling hours (from 1a above) + travel hours/
total hours worked by all counselors] in 2015
3. State sales tax rate in 2016 ___________%
4. Average state personal income tax
paid per return in 2016** $___________
____________________
* Counseling Hours: For the purpose of the national impact studies conducted
under the auspices of the ASBDC, counseling hours shall include all time
spent by counselors in the following activities: (1) direct one-on-one
contact with clients in person or by telephone, (2) preparation for client
meetings, (3) research activities on behalf of clients, (4) correspondence
with clients by mail, fax, or email.
** If data for this time period in not available please provide data for the
most recent year and indicate that time period.
CENTER: ____________________________________________________
CONTACT PERSON: ____________________________________________________
PHONE, FAX, EMAIL: ____________________________________________________


