Economic Impact of Agricultural Liberalisation Policies on Organic...
21
Economic Impact of Agricultural Liberalisation Policies on Organic Farming in Switzerland Jürn Sanders Published by DISSERTATION
Transcript of Economic Impact of Agricultural Liberalisation Policies on Organic...
Economic Impact of Agricultural Liberalisation Policies on Organic Farming in Switzerland
Jürn Sanders
Published by
DISSERTATION
Economic Impact of Agricultural Liberalisation Policies on Organic Farming in Switzerland
A thesis presented for the Degree of Doctor of Philosophy
Jürn Sanders
ii
Jürn Sanders: Economic Impact of Agricultural Liberalisation Policies on Organic Farming in Switzerland. Research Institute of Organic Agriculture / Forschungsinstitut für biologischen Landbau (FiBL), Frick, Switzerland
ISBN: 9783037360156
2007, Jürn Sanders, Research Institute of Organic Agriculture / Forschungsinstitut für biologischen Landbau (FiBL), Ackerstrasse, 5070 Frick, Switzerland, Tel. +41 62 865 7272, Fax +41 62 865 7273, Email: [email protected], Internet: www.fibl.org
Cover: Daniel Gorba, FiBL
Printed by: Verlag Die Werkstatt GmBH, D37083 Göttingen
Distribution: Paper copies may be ordered at www.fibl.org/shop

ii
Economic Impact of Agricultural Liberalisation Policies on Organic Farming in Switzerland A thesis presented for the Degree of Doctor of Philosophy
Jürn Sanders
Institute of Rural Sciences, University of Wales, Aberystwyth
Date of submission: 30. June 2007 Date of the viva: 18. September 2007
iii
ABSTRACT
The poor international competitiveness of Swiss agriculture and the high level of border protection in place have given rise to an ongoing public debate in Switzerland about whether agricultural markets should be comprehensively liberalised. More specifically, three different partial revisions of Swiss legislation on agriculture are currently under discussion (AP 2011 reform, WTO liberalisation agreement, EU agricultural free trade agreement), all of which aim to improve the competitiveness of the agrifood industry. Against this background, the overall aim of this thesis is to analyse the potential impact of these policies on land use, livestock husbandry and the financial performance of organic and nonorganic farms. An additional aim of the thesis is to explore the implications of agricultural liberalisation for the relative profitability of organic farming. The research makes use of the sectorconsistent farm group model CHFARMIS, which enables an assessment of the impact of policy measures on different farm types, regions and organic and nonorganic farming.
According to the model results, land use and the number of farm animals change in line with projected commodity prices. Due to considerable cost disadvantages, agricultural liberalisation affects arable and pig production in particular. At the same time the amount of grassland as a proportion of total farmland is expected to increase. Furthermore, the model results suggest that organic farms would respond to liberalisation policies in a similar way to nonorganic farms. However, changes in land use and livestock husbandry are expected to be somewhat more pronounced on nonorganic farms than on organic farms.
Due to falling commodity prices, it is expected that revenues from agricultural production will decrease and cause a significant reduction in agricultural incomes. It is anticipated that organic and nonorganic farms are only partially able to compensate for lower commodity prices by lower production costs, higher direct payments or changes in farm management. In line with anticipated producer prices, the highest income losses are expected for farms located in the valley region with large arable or pig production. The lowest income losses are expected for grassland farms in the mountain region. In addition, the results of this research indicate that, on average, organic farms are less severely affected by liberalisation policies than nonorganic farms. Accordingly, the relative profitability of organic farms is likely to improve with increased liberalisation.
Differences in prices, yields, production costs, direct payments and nonagricultural outputs are identified as the main determinants of the relative profitability of organic farms. Since revenues from agricultural production are expected to fall, price premiums and lower yields become somewhat less important for the relative economic success of organic farms. The opposite is true for direct payments and revenues from onfarm nonagricultural activities. An increase in direct payment rates, however, does not improve per se the relative profitability of organic farms. A positive impact can be expected especially if contributions for (extensive) grassland and animal welfare are increased, while an increase in arable area or dairy cow payments would be more beneficial for nonorganic farms.
iv
In view of the prospect that organic farms are likely to be less severely affected financially by liberalisation policies, it can be assumed that the number of organic farms will increase. Furthermore, the results of this thesis suggest that the number of organic / nonorganic part time farms as a proportion of total organic / nonorganic agricultural holdings in Switzerland will also rise.
v
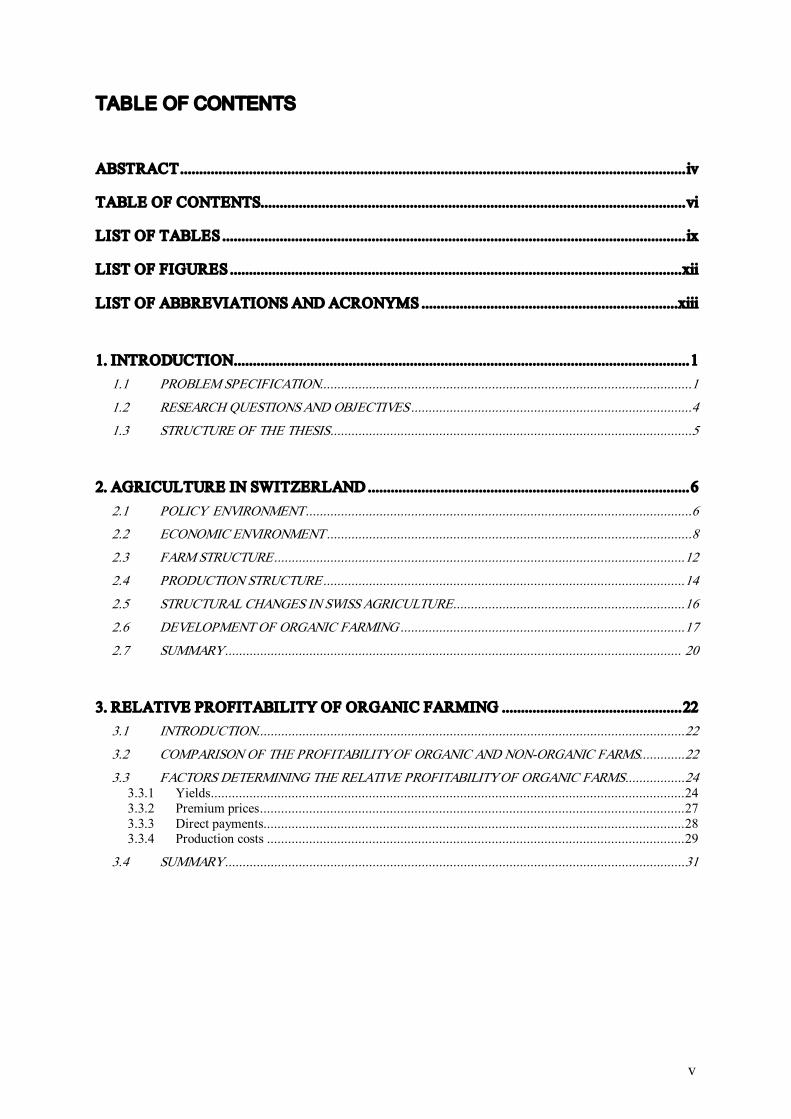
TABLE OF CONTENTS
ABSTRACT....................................................................................................................................iv
TABLE OF CONTENTS...............................................................................................................vi
LIST OF TABLES .........................................................................................................................ix
LIST OF FIGURES ......................................................................................................................xii
LIST OF ABBREVIATIONS AND ACRONYMS ...................................................................xiii
1. INTRODUCTION.......................................................................................................................1 1.1 PROBLEM SPECIFICATION..........................................................................................................1
1.2 RESEARCH QUESTIONS AND OBJECTIVES................................................................................4
1.3 STRUCTURE OF THE THESIS.......................................................................................................5
2. AGRICULTURE IN SWITZERLAND ....................................................................................6 2.1 POLICY ENVIRONMENT..............................................................................................................6 2.2 ECONOMIC ENVIRONMENT........................................................................................................8
2.3 FARM STRUCTURE.....................................................................................................................12
2.4 PRODUCTION STRUCTURE.......................................................................................................14
2.5 STRUCTURAL CHANGES IN SWISS AGRICULTURE..................................................................16
2.6 DEVELOPMENT OF ORGANIC FARMING .................................................................................17
2.7 SUMMARY.................................................................................................................................. 20
3. RELATIVE PROFITABILITY OF ORGANIC FARMING ...............................................22 3.1 INTRODUCTION..........................................................................................................................22
3.2 COMPARISON OF THE PROFITABILITY OF ORGANIC AND NONORGANIC FARMS.............22
3.3 FACTORS DETERMINING THE RELATIVE PROFITABILITY OF ORGANIC FARMS.................24 3.3.1 Yields.......................................................................................................................................24 3.3.2 Premium prices.........................................................................................................................27 3.3.3 Direct payments........................................................................................................................28 3.3.4 Production costs .......................................................................................................................29
3.4 SUMMARY...................................................................................................................................31
vi
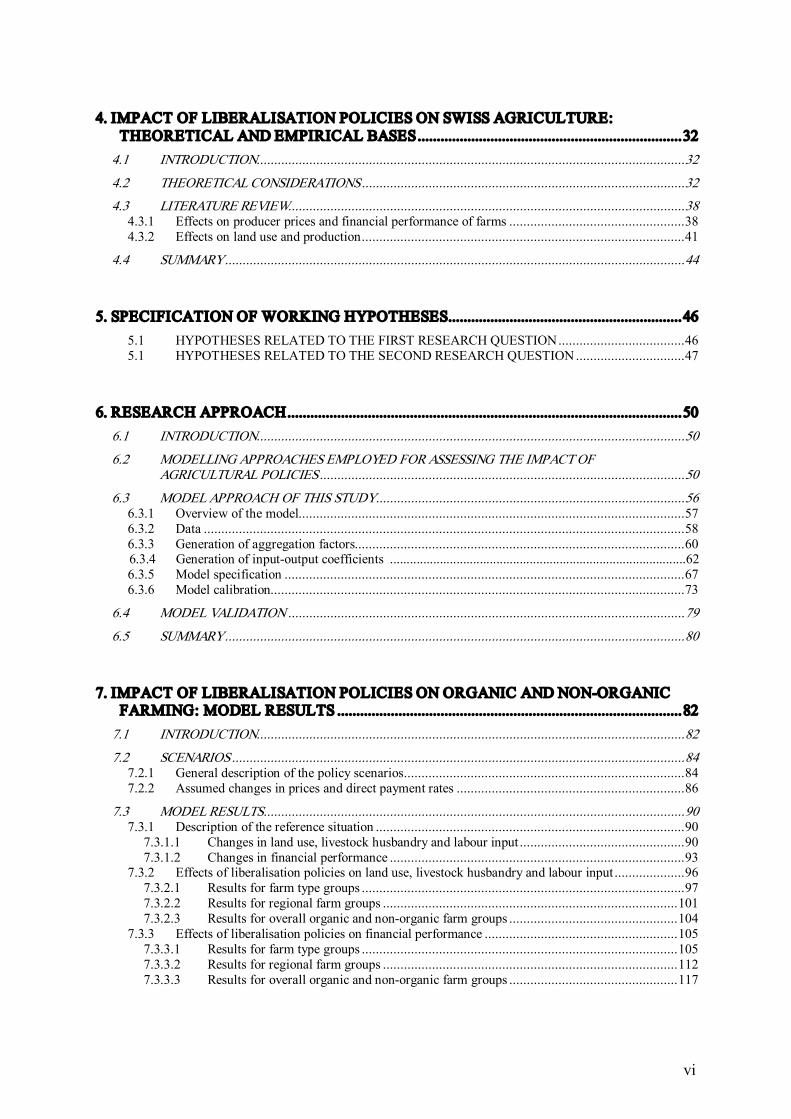
4. IMPACT OF LIBERALISATION POLICIES ON SWISS AGRICULTURE: THEORETICAL AND EMPIRICAL BASES.....................................................................32
4.1 INTRODUCTION..........................................................................................................................32
4.2 THEORETICAL CONSIDERATIONS............................................................................................32 4.3 LITERATURE REVIEW.................................................................................................................38
4.3.1 Effects on producer prices and financial performance of farms ..................................................38 4.3.2 Effects on land use and production............................................................................................41
4.4 SUMMARY...................................................................................................................................44
5. SPECIFICATION OF WORKING HYPOTHESES.............................................................46 5.1 HYPOTHESES RELATED TO THE FIRST RESEARCH QUESTION....................................46 5.1 HYPOTHESES RELATED TO THE SECOND RESEARCH QUESTION...............................47
6. RESEARCH APPROACH.......................................................................................................50 6.1 INTRODUCTION..........................................................................................................................50
6.2 MODELLING APPROACHES EMPLOYED FOR ASSESSING THE IMPACT OF AGRICULTURAL POLICIES........................................................................................................50
6.3 MODEL APPROACH OF THIS STUDY........................................................................................56 6.3.1 Overview of the model..............................................................................................................57 6.3.2 Data .........................................................................................................................................58 6.3.3 Generation of aggregation factors..............................................................................................60 6.3.4 Generation of inputoutput coefficients .........................................................................................62 6.3.5 Model specification ..................................................................................................................67 6.3.6 Model calibration......................................................................................................................73
6.4 MODEL VALIDATION .................................................................................................................79
6.5 SUMMARY...................................................................................................................................80
7. IMPACT OF LIBERALISATION POLICIES ON ORGANIC AND NONORGANIC FARMING: MODEL RESULTS ..........................................................................................82
7.1 INTRODUCTION..........................................................................................................................82
7.2 SCENARIOS.................................................................................................................................84 7.2.1 General description of the policy scenarios................................................................................84 7.2.2 Assumed changes in prices and direct payment rates .................................................................86
7.3 MODEL RESULTS........................................................................................................................90 7.3.1 Description of the reference situation ........................................................................................90
7.3.1.1 Changes in land use, livestock husbandry and labour input ...............................................90 7.3.1.2 Changes in financial performance ....................................................................................93
7.3.2 Effects of liberalisation policies on land use, livestock husbandry and labour input ....................96 7.3.2.1 Results for farm type groups ............................................................................................97 7.3.2.2 Results for regional farm groups ....................................................................................101 7.3.2.3 Results for overall organic and nonorganic farm groups ................................................104
7.3.3 Effects of liberalisation policies on financial performance .......................................................105 7.3.3.1 Results for farm type groups ..........................................................................................105 7.3.3.2 Results for regional farm groups ....................................................................................112 7.3.3.3 Results for overall organic and nonorganic farm groups ................................................117
vii
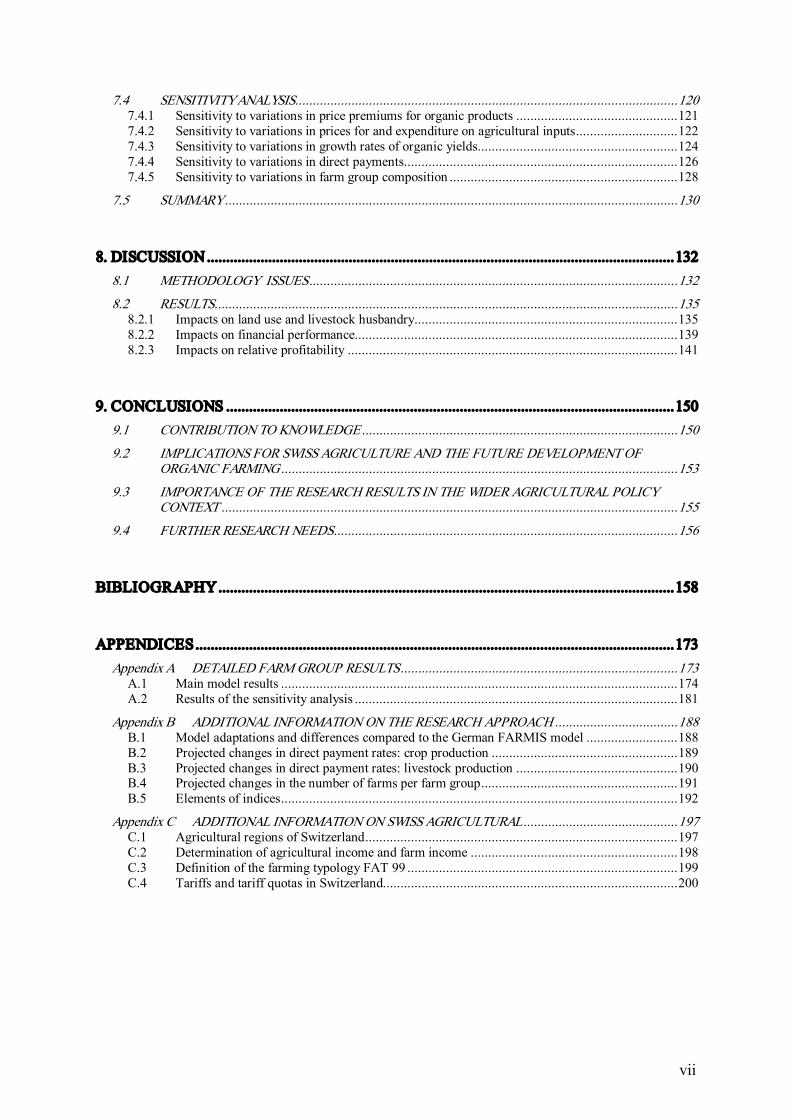
7.4 SENSITIVITY ANALYSIS.............................................................................................................120 7.4.1 Sensitivity to variations in price premiums for organic products ..............................................121 7.4.2 Sensitivity to variations in prices for and expenditure on agricultural inputs.............................122 7.4.3 Sensitivity to variations in growth rates of organic yields.........................................................124 7.4.4 Sensitivity to variations in direct payments..............................................................................126 7.4.5 Sensitivity to variations in farm group composition .................................................................128
7.5 SUMMARY.................................................................................................................................130
8. DISCUSSION..........................................................................................................................132 8.1 METHODOLOGY ISSUES.........................................................................................................132
8.2 RESULTS....................................................................................................................................135 8.2.1 Impacts on land use and livestock husbandry...........................................................................135 8.2.2 Impacts on financial performance............................................................................................139 8.2.3 Impacts on relative profitability ..............................................................................................141
9. CONCLUSIONS .....................................................................................................................150 9.1 CONTRIBUTION TO KNOWLEDGE..........................................................................................150
9.2 IMPLICATIONS FOR SWISS AGRICULTURE AND THE FUTURE DEVELOPMENT OF ORGANIC FARMING.................................................................................................................153
9.3 IMPORTANCE OF THE RESEARCH RESULTS IN THE WIDERAGRICULTURAL POLICY CONTEXT ..................................................................................................................................155
9.4 FURTHER RESEARCH NEEDS..................................................................................................156
BIBLIOGRAPHY.......................................................................................................................158
APPENDICES.............................................................................................................................173 Appendix A DETAILED FARM GROUP RESULTS...............................................................................173
A.1 Main model results .................................................................................................................174 A.2 Results of the sensitivity analysis ............................................................................................181
Appendix B ADDITIONAL INFORMATION ON THE RESEARCH APPROACH ...................................188 B.1 Model adaptations and differences compared to the German FARMIS model ..........................188 B.2 Projected changes in direct payment rates: crop production .....................................................189 B.3 Projected changes in direct payment rates: livestock production ..............................................190 B.4 Projected changes in the number of farms per farm group........................................................191 B.5 Elements of indices.................................................................................................................192
Appendix C ADDITIONAL INFORMATION ON SWISS AGRICULTURAL............................................197 C.1 Agricultural regions of Switzerland.........................................................................................197 C.2 Determination of agricultural income and farm income ...........................................................198 C.3 Definition of the farming typology FAT 99 .............................................................................199 C.4 Tariffs and tariff quotas in Switzerland....................................................................................200

viii
LIST OF TABLES
Table 2.1 Federal expenditure (CHF 1000) for agriculture in 1990/92 and 2005 ................ 7 Table 2.2 Monetary trading volume (CHF million) of the most important agricultural
trading countries for Switzerland in 2005 ........................................................... 9 Table 2.3 Trading volume (t) of imported and exported agricultural products in 2005........ 9
Table 2.4 Number of farms in Switzerland in 2005.......................................................... 12 Table 2.5 Number of parttime/fulltime and hobby/nonhobby farms in 2005................. 13
Table 2.6 Average farm size (ha) in selected European countries in 2005 ........................ 13 Table 2.7 Number of farms per farm size class in 2005.................................................... 14
Table 2.8 Overview of land use in 2005........................................................................... 15 Table 2.9 Number of farm animals and livestock units per livestock category in 2005 ..... 15
Table 3.1 Comparison of income and productivity of organic and nonorganic farms in different regions in 2003/05 ............................................................................. 23
Table 3.2 Organic crop yields as a percentage of conventional reference yields ............... 25 Table 3.3 Relative producer price premiums (% higher than nonorganic) for organic
produce in 2001 ............................................................................................... 27 Table 3.4 Comparison of direct payments paid to organic and nonorganic farms in
different regions in 2003/05 a ........................................................................... 29 Table 3.5 Comparison of production costs between organic and nonorganic farms in
2003/05............................................................................................................ 30 Table 6.1 Evaluation of different types of economic models ............................................ 55
Table 6.2 Average number of farms per farm group according to the farm census and in different farm samples for the period 2000/2001 .............................................. 59
Table 6.3 Representation (%) of the farming sector in CHFARMIS................................ 60 Table 6.4 Representation (%) of sector data on the basis of different weighting factors.... 61
Table 6.5 Overview of livestock activities ....................................................................... 63 Table 6.6 Overview of land use activities ........................................................................ 64
Table 6.7 Assumed annual yield growth (%) ................................................................... 66 Table 6.8 Assumed changes (%) in labour requirements .................................................. 67
Table 6.9 Changes (%) in family labour resources ........................................................... 67 Table 6.10 List of model restrictions ................................................................................. 70
Table 6.11 Validation results ............................................................................................. 79 Table 7.1 Composition of farm groups (%) in the base year period (2000/01).................. 83
Table 7.2 Most important changes in direct payment rates for different scenarios ............ 87 Table 7.3 Price projections for organically and nonorganically produced crop and
livestock products ............................................................................................ 88 Table 7.4 Price projections (%) for variable and fixed inputs ........................................... 89
ix
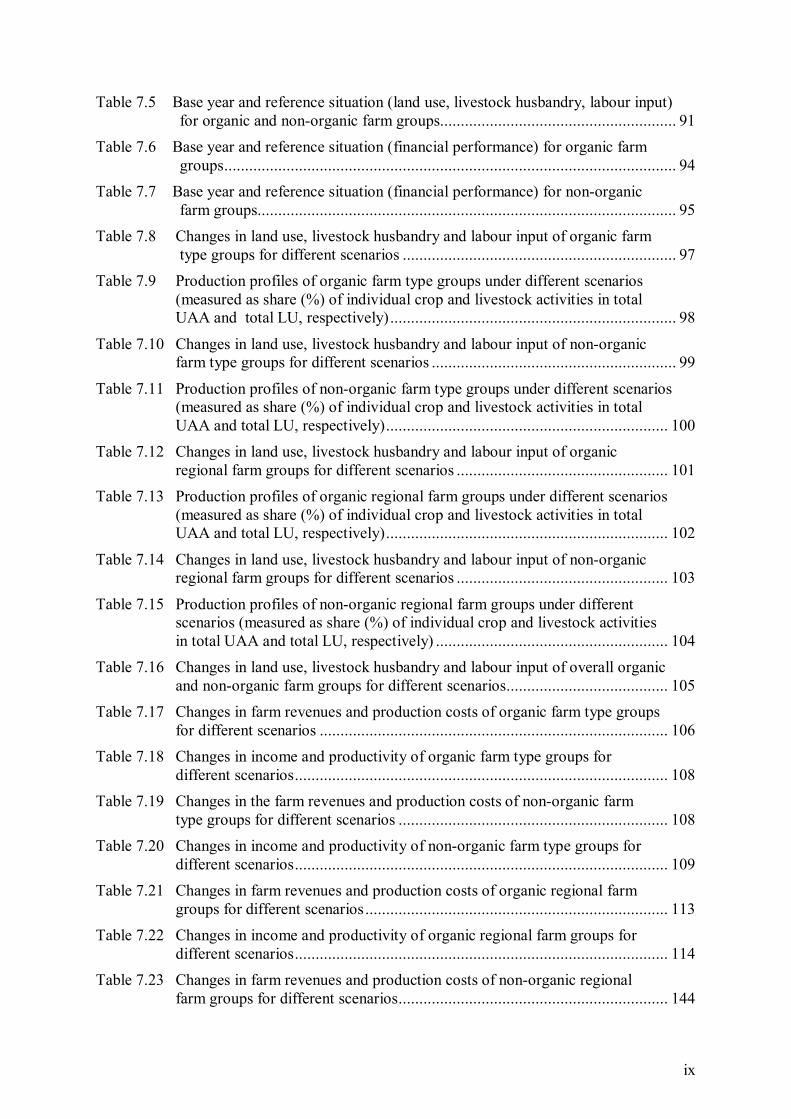
Table 7.5 Base year and reference situation (land use, livestock husbandry, labour input) for organic and nonorganic farm groups......................................................... 91
Table 7.6 Base year and reference situation (financial performance) for organic farm groups............................................................................................................. 94
Table 7.7 Base year and reference situation (financial performance) for nonorganic farm groups..................................................................................................... 95
Table 7.8 Changes in land use, livestock husbandry and labour input of organic farm type groups for different scenarios .................................................................. 97
Table 7.9 Production profiles of organic farm type groups under different scenarios (measured as share (%) of individual crop and livestock activities in total UAA and total LU, respectively)..................................................................... 98
Table 7.10 Changes in land use, livestock husbandry and labour input of nonorganic farm type groups for different scenarios ........................................................... 99
Table 7.11 Production profiles of nonorganic farm type groups under different scenarios (measured as share (%) of individual crop and livestock activities in total UAA and total LU, respectively).................................................................... 100
Table 7.12 Changes in land use, livestock husbandry and labour input of organic regional farm groups for different scenarios ................................................... 101
Table 7.13 Production profiles of organic regional farm groups under different scenarios (measured as share (%) of individual crop and livestock activities in total UAA and total LU, respectively).................................................................... 102
Table 7.14 Changes in land use, livestock husbandry and labour input of nonorganic regional farm groups for different scenarios ................................................... 103
Table 7.15 Production profiles of nonorganic regional farm groups under different scenarios (measured as share (%) of individual crop and livestock activities in total UAA and total LU, respectively) ........................................................ 104
Table 7.16 Changes in land use, livestock husbandry and labour input of overall organic and nonorganic farm groups for different scenarios....................................... 105
Table 7.17 Changes in farm revenues and production costs of organic farm type groups for different scenarios .................................................................................... 106
Table 7.18 Changes in income and productivity of organic farm type groups for different scenarios.......................................................................................... 108
Table 7.19 Changes in the farm revenues and production costs of nonorganic farm type groups for different scenarios ................................................................. 108
Table 7.20 Changes in income and productivity of nonorganic farm type groups for different scenarios.......................................................................................... 109
Table 7.21 Changes in farm revenues and production costs of organic regional farm groups for different scenarios......................................................................... 113
Table 7.22 Changes in income and productivity of organic regional farm groups for different scenarios.......................................................................................... 114
Table 7.23 Changes in farm revenues and production costs of nonorganic regional farm groups for different scenarios................................................................. 144
x
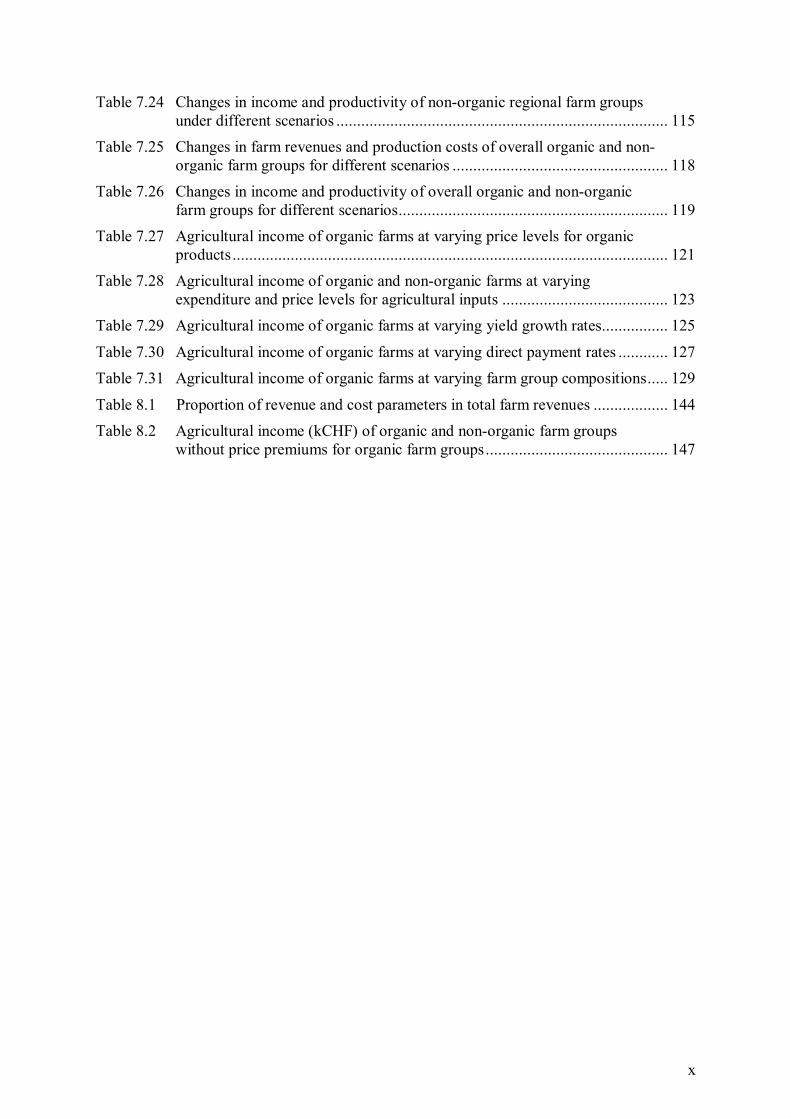
Table 7.24 Changes in income and productivity of nonorganic regional farm groups under different scenarios ................................................................................ 115
Table 7.25 Changes in farm revenues and production costs of overall organic and non organic farm groups for different scenarios .................................................... 118
Table 7.26 Changes in income and productivity of overall organic and nonorganic farm groups for different scenarios................................................................. 119
Table 7.27 Agricultural income of organic farms at varying price levels for organic products......................................................................................................... 121
Table 7.28 Agricultural income of organic and nonorganic farms at varying expenditure and price levels for agricultural inputs ........................................ 123
Table 7.29 Agricultural income of organic farms at varying yield growth rates................ 125
Table 7.30 Agricultural income of organic farms at varying direct payment rates ............ 127 Table 7.31 Agricultural income of organic farms at varying farm group compositions..... 129
Table 8.1 Proportion of revenue and cost parameters in total farm revenues .................. 144 Table 8.2 Agricultural income (kCHF) of organic and nonorganic farm groups
without price premiums for organic farm groups............................................ 147

xi
LIST OF FIGURES
Figure 2.1 Changes (%) in agricultural prices (1990/92 = 100%) ....................................... 10 Figure 2.2 Differences in agricultural prices between CH and EU...................................... 11
Figure 2.3 Occurrence of different farm types in Swiss agriculture and organic farming .... 16 Figure 2.4 Growth of organic farming in Switzerland ........................................................ 17
Figure 2.5 Organic holdings as a proportion of total agricultural holdings per canton in 2005.............................................................................................................. 20
Figure 3.1 Development of milk yields in the period 19962005 ........................................ 25 Figure 3.2 Development of wheat yields in the period 19962005 ...................................... 26
Figure 4.1 Impact of product price changes on revenues and resource use.......................... 35 Figure 4.2 Impact of factor price changes on revenues and resource use ............................ 36
Figure 6.1 Structure of the CHFARMIS model................................................................. 57 Figure 6.2 Model calibration based on the PMP approach.................................................. 74
Figure 7.1 Aggregation scheme for model results .............................................................. 83 Figure 7.2 Changes in the relative profitability and productivity of organic farm type
groups............................................................................................................. 111 Figure 7.3 Changes in the relative profitability of regional organic farm groups............... 116
Figure 7.4 Changes in the relative profitability and productivity of organic farms (farm group ‘Organic ALL’)..................................................................................... 120
Figure 7.5 Relative profitability of organic farms at varying price levels for organic products.......................................................................................................... 122
Figure 7.6 Relative profitability of organic farms at varying expenditure and price levels for agricultural inputs...................................................................................... 124
Figure 7.7 Relative profitability of organic farms at varying yield growth rates................ 125 Figure 7.8 Relative profitability of organic farms at varying direct payment rates ............ 128
Figure 7.9 Relative profitability of organic farms at varying farm group compositions..... 130 Figure 8.1 Differences between organic farm groups and nonorganic farm groups
regarding revenues from agricultural production, direct payments, onfarm nonagricultural outputs and production costs ................................................. 142
xii
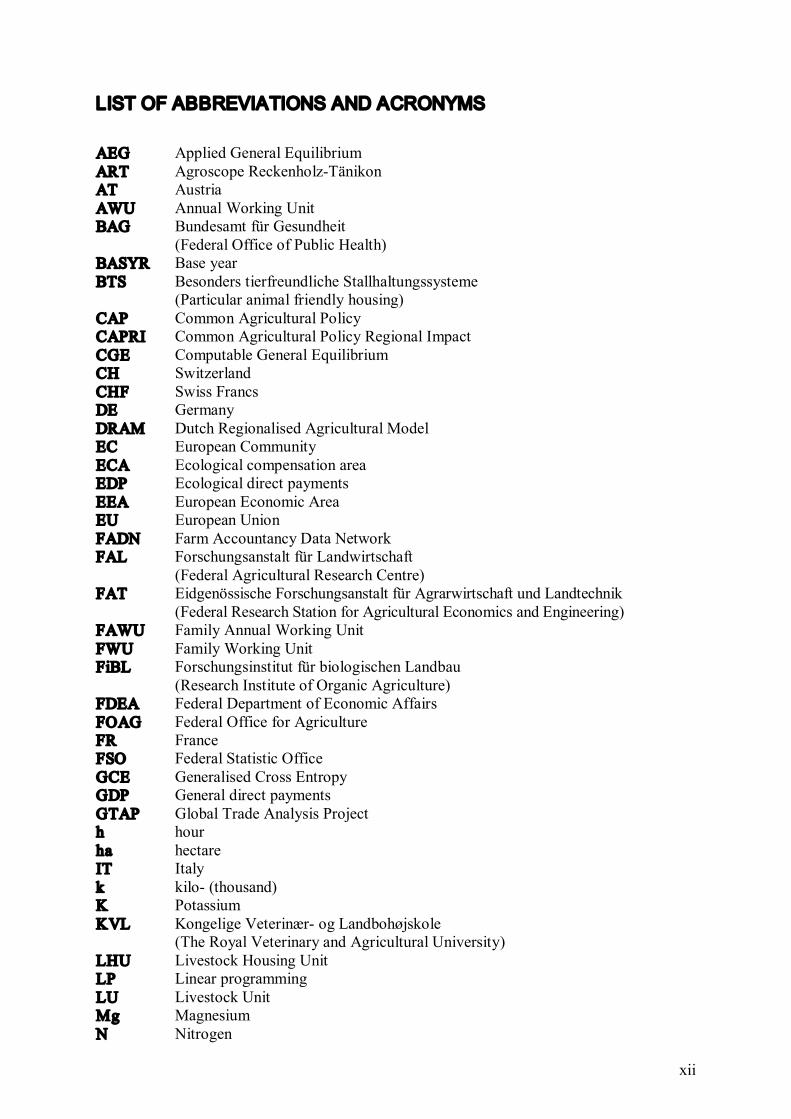
LIST OF ABBREVIATIONS AND ACRONYMS
AEG Applied General Equilibrium ART Agroscope ReckenholzTänikon AT Austria AWU Annual Working Unit BAG Bundesamt für Gesundheit
(Federal Office of Public Health) BASYR Base year BTS Besonders tierfreundliche Stallhaltungssysteme
(Particular animal friendly housing) CAP Common Agricultural Policy CAPRI Common Agricultural Policy Regional Impact CGE Computable General Equilibrium CH Switzerland CHF Swiss Francs DE Germany DRAM Dutch Regionalised Agricultural Model EC European Community ECA Ecological compensation area EDP Ecological direct payments EEA European Economic Area EU European Union FADN Farm Accountancy Data Network FAL Forschungsanstalt für Landwirtschaft
(Federal Agricultural Research Centre) FAT Eidgenössische Forschungsanstalt für Agrarwirtschaft und Landtechnik
(Federal Research Station for Agricultural Economics and Engineering) FAWU Family Annual Working Unit FWU Family Working Unit FiBL Forschungsinstitut für biologischen Landbau
(Research Institute of Organic Agriculture) FDEA Federal Department of Economic Affairs FOAG Federal Office for Agriculture FR France FSO Federal Statistic Office GCE Generalised Cross Entropy GDP General direct payments GTAP Global Trade Analysis Project h hour ha hectare IT Italy k kilo (thousand) K Potassium KVL Kongelige Veterinær og Landbohøjskole
(The Royal Veterinary and Agricultural University) LHU Livestock Housing Unit LP Linear programming LU Livestock Unit Mg Magnesium N Nitrogen
xiii
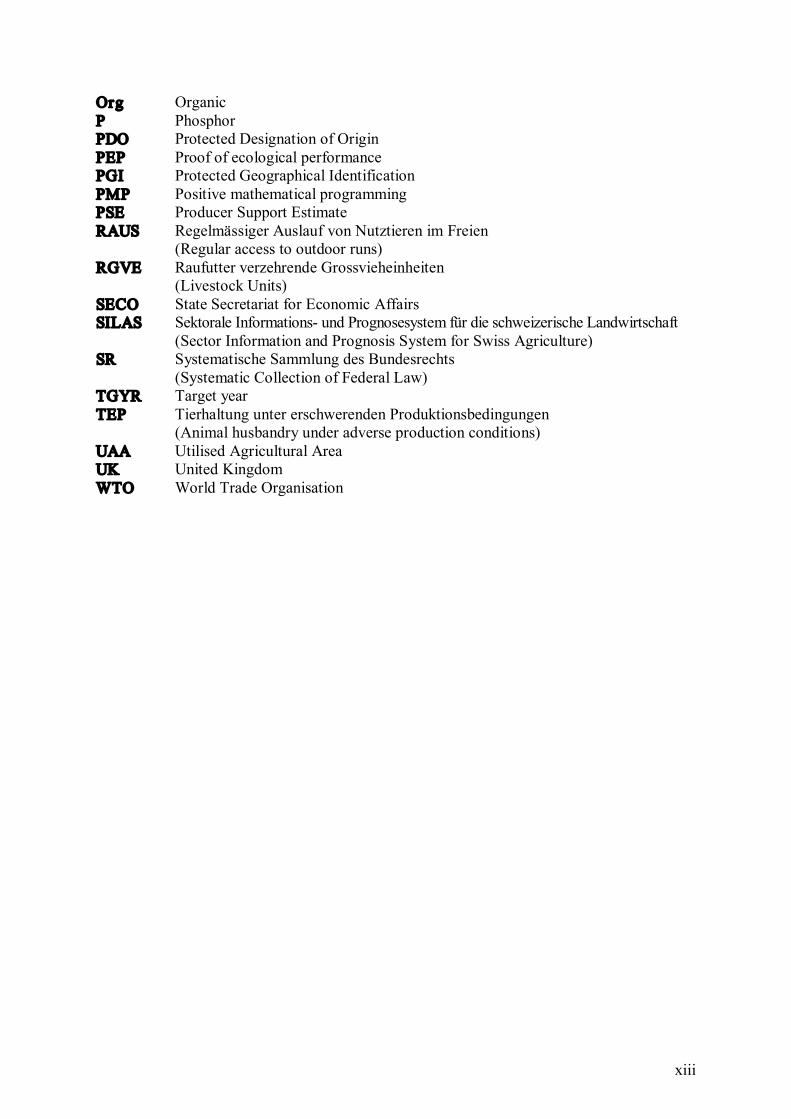
Org Organic P Phosphor PDO Protected Designation of Origin PEP Proof of ecological performance PGI Protected Geographical Identification PMP Positive mathematical programming PSE Producer Support Estimate RAUS Regelmässiger Auslauf von Nutztieren im Freien
(Regular access to outdoor runs) RGVE Raufutter verzehrende Grossvieheinheiten
(Livestock Units) SECO State Secretariat for Economic Affairs SILAS Sektorale Informations und Prognosesystem für die schweizerische Landwirtschaft
(Sector Information and Prognosis System for Swiss Agriculture) SR Systematische Sammlung des Bundesrechts
(Systematic Collection of Federal Law) TGYR Target year TEP Tierhaltung unter erschwerenden Produktionsbedingungen
(Animal husbandry under adverse production conditions) UAA Utilised Agricultural Area UK United Kingdom WTO World Trade Organisation
Chapter One _
1
CHAPTER ONE
INTRODUCTION
The aim of the research presented in this thesis is to analyse the impact of agricultural liberalisation policies on organic farms in Switzerland and to explore the implications for the relative profitability of organic farming compared to nonorganic farming. This chapter presents the background, main research questions and specific objectives of this work and provides an overview of the structure of the thesis.
1.1 PROBLEM SPECIFICATION
For more than fifteen years, Swiss agricultural policy has been subject to a continuous reform process. This process aims to compensate stepwise the negative effects and shortcomings of the post war policy 1 which led to severe environmental problems, massive overproduction with escalating budgetary costs, and the poor international competitiveness of the agricultural sector (Rieder, 1998; Popp, 2000). The start of the reform process can be attributed to the 7 th
report on agriculture and the subsequent introduction of direct payments in 1992, which was followed by the implementation of the GATT Uruguay agreement between 1995 and 2000, the revision of the Agriculture Act in 2000 (AP 2002) and 2004 (AP 2007), as well as two bilateral agreements with the European Union (EU) 2 in 2000 and 2004. Broadly speaking, the new policy trajectory has two main objectives: first, to improve the competitiveness of Swiss farms and to make agriculture more marketoriented and second, to encourage agriculture to provide various public goods and services. The policy reform undertaken involves the step bystep decoupling of price support from income support, the partial opening of agricultural markets, the abolition of the milk quota regime, and the introduction of crosscompliance measures.
Thanks to the agrarian reforms, major improvements have been made in recent years, although this has not occurred to the same extent in all areas. The policies implemented have led to a significant reduction in the negative externalities of agricultural production (Flury,
1 As a result of the experiences of food insecurity during the two world wars, it was the aim of agricultural policy to ensure a maximum of selfsufficiency until the 1970s. High guaranteed prices and border protection measures were introduced to achieve this aim. Not surprisingly, Swiss agriculture became one of the most protected and most state supported farm sectors in the world. In 19861988, overall financial support from public sources, measured in terms of Producer Support Estimate (PSE), was 78% (OECD, 2006). This means that at the end of the 1980s, more than threequarters of gross farm receipts consisted of direct and indirect state transfers. 2 In legal terms, Swiss free trade agreements with the EU refer to the European Community (EC) and not to the European Union (EU). However, because the term ‘EU’ is more common, this term will be used in this work.
Chapter One _
2
2005). Furthermore, various studies have shown that Swiss agriculture makes a significant contribution to rural development and landscape conservation (Mann and Mack, 2004; Rieder et al., 2004). In terms of market orientation and competitiveness, however, the progress achieved has proved to be minimal. Although average producer prices decreased by 2030% as a result of less direct state intervention in the market, they are still twice as high as in the EU, and three times as high as on the world market (BLW, 2006). Furthermore, Swiss agriculture still enjoys the highest level of government support among the OECD countries. Market price support and output payments still accounted for 68% of the total producer support estimate in 2004, which is more than twice the OECD average (OECD, 2006). Apart from certain processed agricultural products, most primary products are still highly protected by means of outofquota tariffs and very low tariff quota volumes. In view of the rather minor changes, the WTO critically concluded in its recent report on Swiss agricultural trade policy that the objectives of the marketoriented reforms have not been met (WTO, 2004b). Since progress in agricultural liberalisation has been slow from an international perspective, it is little surprise that the competitiveness of the Swiss farming sector has not improved significantly. Increase in labour productivity in agriculture has been much lower in Switzerland during the last two decades compared to Germany, France and the UK (Rieder, 2002; Dreher and Sturm, 2006). Swiss farms still produce at much higher costs than their colleagues in neighbouring countries. For example, specialised pig and poultry farms have production costs that are, on average, twice as high as those of comparable farms in the EU (Lehmann et al., 2005). Although dairy production has the lowest comparative cost disadvantages, Gazzarin (2002) reported that EU dairy farms have a breakeven point that is 3038% lower than comparable farms in Switzerland. According to Garmhausen and Gazzarin (2001) even the most competitive Swiss dairy farms have significant cost disadvantages compared to dairy farms in other European countries.
In light of the poor international competitiveness of Swiss agriculture, there is ongoing public debate about a further, more radical liberalisation of food markets and the deregulation of agricultural policies (Wasescha, 2002). More specifically, three different partial revisions of Swiss legislation on agriculture are currently under discussion that all aim to improve the competitiveness of the agrifood industry 3 :
As part of a new series of reforms aimed at boosting economic growth in Switzerland (SECO, 2004) 4 , a new agricultural policy package, “AP 2011”, was launched in 2005. The principal aim of the reform is to increase competition in the domestic market by further decoupling subsidies from production (mainly related to milk, root crops and oilseeds) and improving opportunities for product differentiation (Schweizerische Bundesrat, 2006). In total, it has been proposed that approximately CHF 330 million
3 In the following, these three reform packages are called “future liberalisation policies”. 4 Given the persistently weak growth of the Swiss economy, the State Secretariat for Economic Affairs (SECO) adopted in 2004 a broad agenda of reform called “Series of reforms to boost growth”. The new reform agenda includes 17 measures that are currently being implemented (OECD, 2006).
Chapter One _
3
be shifted from market support to direct payment measures. Furthermore, the AP 2011 aims to facilitate structural changes in the primary sector.
Since 2001, the WTO Doha Round seeks to reduce substantially existing trade distorting measures among member states. The latest draft of modalities on agriculture envisages the abolition of export subsidies, a reduction of domestic price support in the region of 50% and a reduction of tariffs in the region of 30% (WTO, 2004a). Negotiations on the Doha Development Agenda were officially suspended in July 2006, mainly because participants were not able to agree on specific targets for market access and domestic support. In February 2007, however, the Doha negotiations have officially been resumed (WTO, 2007). Regardless of the future of the WTO Doha Round, multilateral efforts towards liberalisation remain a highly relevant policy issue for Switzerland for two reasons (Wasescha, 2006). First, in view of the small size of the country, access to foreign markets is essential for the national economy of Switzerland; second, multilateral negotiations provide an opportunity for Switzerland to form alliances with other countries in order to increase its bargaining power.
In early 2006, the Federal Department of Economic Affairs (FDEA) launched a proposal for agricultural free trade between Switzerland and the EU. Free trade implies that Swiss producer prices would approximate to the EU price level, mainly due to a sharp increase of food imports from the EU. Equally, it is expected that the Swiss agrifood industry would be able to increase its export of highquality products and Swiss specialities (EVDb, 2006). This policy could be understood as a continuation of the two existing bilateral agreements between Switzerland and the EU.
These policy reforms are clearly a major challenge for Swiss agriculture. In the past, various studies have been conducted to analyse the potential impact of the AP 2011, WTO trade agreement and EU free trade agreement (or EU accession) on Swiss agriculture (see Chapter 4). The main emphasis of these studies was on the economic impact on the whole sector, specific regions or typical farms. To date, however, there is still a lack of research showing the impact of agricultural liberalisation policies on different farming systems (i.e. organic vs. integrated or intensive agriculture). Such an analysis, based on differentiations between farming systems, is of special interest because:
organic farming has become an important farming system in Switzerland. This is particularly true for mountain farms where approximately 20% of the farmland and of the farms themselves are managed organically, as well as for dairy and beef farms, of which 15% and 25% respectively are managed organically (FiBL, 2005). In view of the importance of organic farming, it is appropriate to take this aspect more specifically into account.
experiences from Austria (Kola et al., 2000) with EU accession as well as experiences from various EU countries with Agenda 2000 (Nieberg et al., 2005) and with the 2003 CAP reform (Offermann and Nieberg, 2006; Schmid and Sinabell, 2007) indicate that organic farms are likely to be less affected financially by liberalisation policies than
Chapter One _
4
nonorganic farms if price support is transferred to direct payments. However, due to different economic, geographical, structural and legal framework conditions, these experiences cannot be applied directly to the Swiss situation. Moreover, due to the high level of protection that exists and the extremely highcost environment, the liberalisation scenarios currently being discussed in Switzerland go beyond the policy changes analysed in the studies mentioned above.
Swiss organic food has significant export potential, particularly if trade barriers are increasingly removed (Güntert, 2007). This indicates that the expected pressure on domestic prices from increased imports could partly be compensated for through increased exports.
it is widely acknowledged that organic farming makes a significant and effective contribution towards achieving the objectives of Swiss agricultural policy particularly in terms of food quality, landscape management, enhancement of biodiversity and sustainable land, energy and water use (Stolze et al., 2000; Häring et al., 2001; Pfiffner et al., 2001; Alföldi et al., 2002; Dabbert et al., 2002). In view of the multiple outputs and services that are expected from Swiss agriculture, organic farming can be seen as an “ideal model” for the whole sector (Hugi, 2005; Fuhrer, 2006).
1.2 RESEARCH QUESTIONS AND OBJECTIVES
In the setting described above, this thesis aims to analyse the effects of possible future liberalisation policies, with a particular emphasis on organic farming, and thereby to contribute to the ongoing debate about the prospects for agriculture in Switzerland. The main research questions of this thesis can be formulated as follows:
What is the impact of future liberalisation policies (AP 2011, WTO Doha agreement, EU free trade agreement) on land use, livestock husbandry and the financial performance of organic and nonorganic farms in Switzerland?
How and why would these policies affect the relative profitability of organic farming compared to nonorganic farming in Switzerland?
In order to provide answers to these two questions a number of specific research objectives were established:
to present an overview of the Swiss agricultural sector; to review statistical data and research findings on the financial performance of both
farming systems and identify the factors determining the relative profitability of the organic farming system;
to develop a theoretical framework and outline the current state of the art with regard to the impact of liberalisation policies on Swiss agriculture;
to define several working hypotheses; to develop an appropriate methodological approach;

Chapter One _
5
to analyse the impact of different liberalisation scenarios on land use, livestock husbandry and the financial performance of organic and nonorganic farms;
to analyse the impact of different liberalisation scenarios on the relative profitability of organic farming;
to discuss the results and draw conclusions regarding the implications for Swiss agriculture and the future development of organic farming in Switzerland, as well as identify further research needs.
Thus, the overall aim of this thesis is to contribute to existing knowledge by, firstly, developing an appropriate approach to conducting policy impact assessments of organic farming and, secondly, by analyzing the impact of liberalisation policies on organic farming and the determinants of relative profitability.
1.3 STRUCTURE OF THE THESIS
This thesis is structured as follows. Chapter 2 provides an overview of the Swiss agricultural sector. This includes a presentation of the policy and economic framework of Swiss agriculture as well as of land use and livestock husbandry on organic and nonorganic farms. Chapter 3 contains a comparison, based on published statistical data, of the financial performance of organic and nonorganic farms. This chapter also contains a discussion of the most relevant factors determining the relative profitability of organic farming. In Chapter 4, the basic principles of neoclassical production economics are outlined and applied to the research topic of this thesis. This is followed by a review of the state of the art concerning the effects of future liberalisation policies on Swiss agriculture. Chapters 2 – 4 thus outline the general context and basis for this thesis. Against this background, Chapter 5 is devoted to deriving some working hypotheses for the analysis later on. Chapter 6 is concerned with methodological issues. The strengths and limitations of different modelling approaches that are commonly used for agricultural economic policy analysis are discussed. Furthermore, the modelling approach used in this work is described in detail. The assumptions of the model analysis along with the results are described and explained in Chapter 7 and subsequently discussed in Chapter 8. This chapter contains also a discussion on the adopted model approach. Finally, Chapter 9 describes how this thesis contributes to the existing body of knowledge and what conclusions can be drawn concerning the impact of agricultural liberalisation policies on organic and nonorganic farms. Subsequently, implications for Swiss agriculture and the future development of organic farming are described. This is followed by a discussion on the importance of the research results in the wider agricultural policy context. A concluding section outlines further research needs in this area.

6
Full paper copies may be ordered at www.fibl.org/shop