Economic Feasibility Cattle Feeding Industry - AgEcon...
40
Economic Feasibility of the Cattle Feeding Industry in the Northern Plains and Western Lakes States Marvin R. Duncan Richard D. Taylor David M. Saxowsky Won W. Koo Department of Agricultural Economics North Dakota State University March 1997 Agricultural Economics Report No. 370
Transcript of Economic Feasibility Cattle Feeding Industry - AgEcon...
Economic Feasibilityof the
Cattle Feeding Industryin the
Northern Plains andWestern Lakes States
Marvin R. DuncanRichard D. TaylorDavid M. SaxowskyWon W. Koo
Department ofAgricultural EconomicsNorth Dakota State University
March 1997
Agricultural Economics Report No. 370
Economic Reasibility of the Cattle Feeding Industry in the Northern Plains and Western Lakes States
Page 2
AcknowledgmentsThe authors extend appreciation to Dr. David Cobia, Dr. William Nelson,Dr. Harlan Hughes, and Professor Tim Petry for their helpful comments andsuggestions. Special thanks go to Ms. Charlene Lucken, who provided editorialcomments, and to Ms. Carol Jensen who helped to prepare the manuscript.
Special appreciation is extended to the Farmers Educational Foundation for itsfinancial support of this study.
Duncan is professor, Taylor is research specialist, and Saxowsky and Koo are professors,all in the Department of Agricultural Economics, North Dakota State University, Fargo.The authors are responsible for any errors in the report.
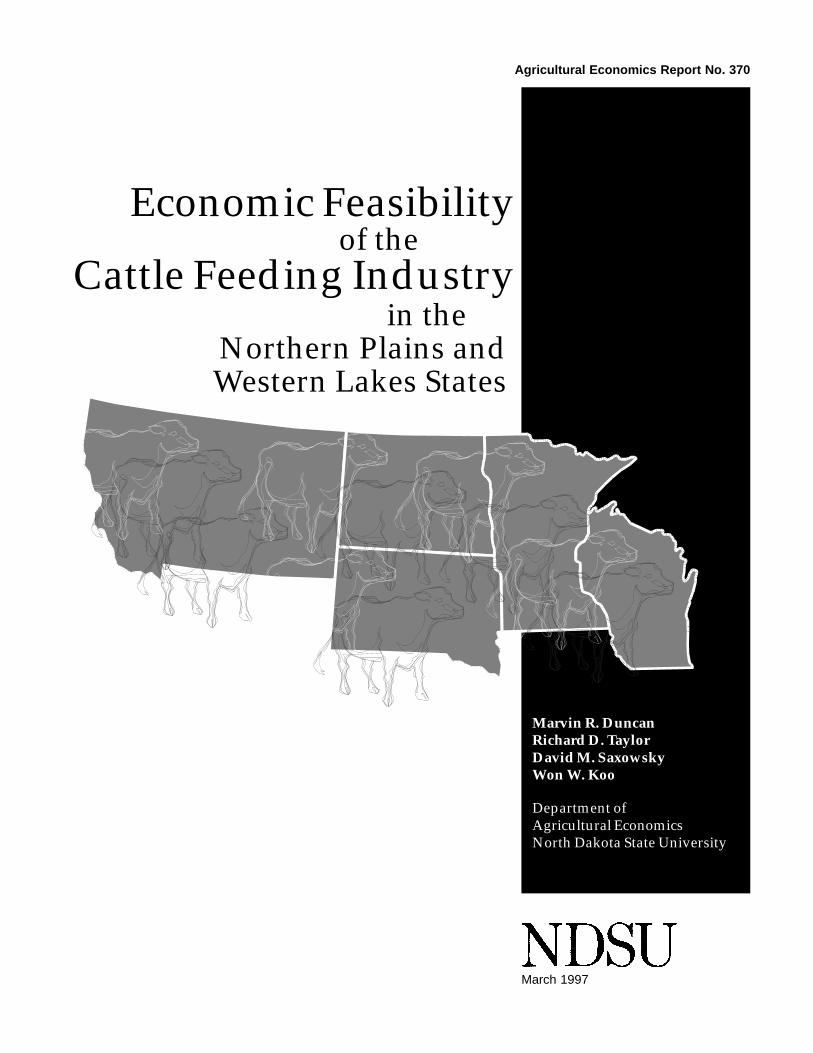
AbstractThe five-state study area of the Northern Plains and Western Lakes States,(Minnesota, Montana, North Dakota, South Dakota, and Wisconsin) has adequatefeed supplies and feeder cattle to markedly increase cattle feeding. Feed costs inthese states have historically been lower than in the Southern Plains States.However, higher transportation costs appear to offset that advantage. Close accessto slaughter plants in these states could offset that transportation disadvantage.Backgrounding of cattle appears to be quite profitable and cattle feeding, especiallyin larger sized feedlots, can be profitable. However, the cattle feeding industry hasan increasing level of excess capacity. To be successful, new feedlots in the NorthernPlains and Western Lakes States would need cost efficiencies to offset higherproduction costs, compared to Nebraska and Kansas, or would need to produce for aniche market unaffected by the lower operating costs of already established feedlotsin the Central and Southern Plains States. Finally, a range of strategies are availablein developing value-added cattle production in the Northern Plains and WesternLakes States. These strategies embody differing levels of capital investment, risk,and profitability.
Key words: cattle feeding, Northern Plains, economies of scale,cooperativeownership, entrance strategies.

Page 3
Table of Contents
IX. Community Impacts ...................................... 28Local Economic Impact of Cattle Feeding .... 28Broader Community Impacts ......................... 29Impact of Cattle Feeding and Beef Slaughter
Plants on Community Business ................ 29Impact of Cattle Feeding and Beef
Slaughter Plants on CommunityPopulation and Demographics .................. 30
Impact of Cattle Feeding and BeefSlaughter Plants on Schools .................... 30
Impact of Cattle Feeding and BeefSlaughter Plants on Law Enforcement ...... 30
Impact of Cattle Feeding and BeefSlaughter Plants on Social Problems ....... 30
Impact of Cattle Feeding and BeefSlaughter Plants on Housing Supplyand Demand .............................................. 30
Stability of Work Force ................................. 30Overall Impact on Quality of
Community Life ......................................... 31X. Alternative Entrance Strategies for
Value-Added Cattle Production in theNorthern Plains States ................................... 31
Backgrounding Calves ................................. 31Feeding to Finish ......................................... 31Purchasing Existing Feedlots and
Slaughter Plants in Other States ............... 32Backgrounding in Owned Feedlots,
Custom Feeding, andCustom Slaughter ...................................... 32
XI. Summary ........................................................ 33References ......................................................... 35Apendix A
A-Table 1. Net Returns for Various SizeFeedlots with Various Corn Prices andLivestock Prices, Two Groups of Cattle,One Fed From 550 to 1200 lbs,One Fed From 700 to 1200 lbs .................. 36
Appendix BCommunity Survey Results .......................... 37
Appendix CC-Table 1. Price Relationships
Between Corn and Barley ......................... 39C-Table 2. Price Relationships
Between Fed Cattle, 700 lb FeederCattle and 550 lb Calves ........................... 39
List of Tables .................................................... 4List of Figures .................................................. 4Highlights ......................................................... 5
I. Introduction and Study Objectives .................. 6II. Characteristics of the U.S. Cattle Industry ..... 7
Feeder Calf Production ................................... 7Cattle Feeding ................................................ 7Cattle Slaughtering ......................................... 8The Cattle Cycle ............................................. 8U.S. Meat Consumption .................................. 8
III. Feedlot Design and Construction Cost ........ 9Design ............................................................. 9Feedlot Construction Costs ............................ 9Grain and Feed Handling Facilities .............. 10Machinery and Equipment Requirements .... 11Interregional Competitive Issues .................. 12
IV. Availability of Feedstuffs .............................. 12V. Feedlot Siting Regulations ............................ 15
Water Permits ................................................ 17Soil Grade, Type, and Permeability ............... 17
VI. Feedlot Operational Issues .......................... 17Labor Requirements ..................................... 18Feeding Rations ........................................... 18Networking Alternatives ................................ 18Financing the Feedlot ................................... 20
VII. Feeding Profitability ..................................... 21Return to Equity and Risk ............................. 21Break-even Prices for Feeder Cattle
and Calves ................................................ 23Backgrounding Calves ................................. 23Dairy Cattle Feeding ..................................... 23Cattle Feeding in Northern States
vs. Kansas ................................................. 24VIII. Developing a Cattle Feeding
Cooperative .................................................... 25Organizing Discussions and Defining
the Project ................................................. 25Initial Feasibility Assessment ....................... 26Decision 1 ..................................................... 26Detailed Feasibility Study ............................. 26Decision 2 ..................................................... 27Capitalization Phase ..................................... 27Decision 3 ..................................................... 27Construction Phase ...................................... 28Questions Investors Should Consider .......... 28
Table of Contents
Economic Reasibility of the Cattle Feeding Industry in the Northern Plains and Western Lakes States
Page 4
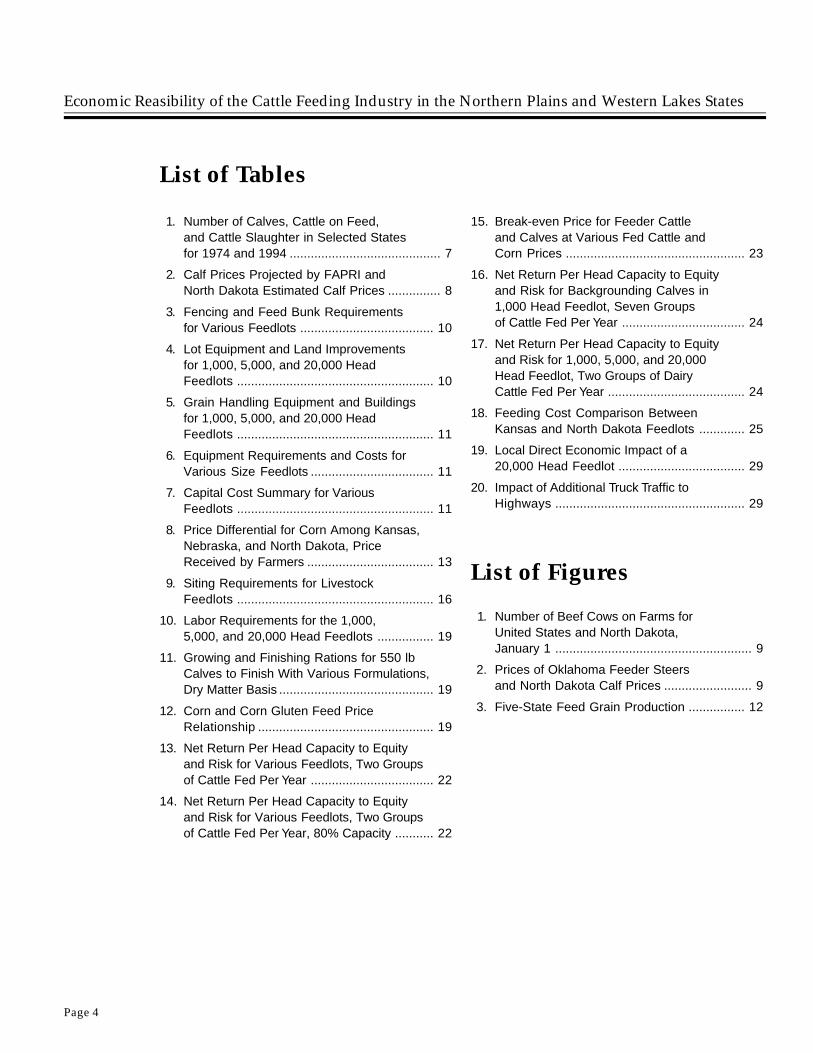
List of Tables
1. Number of Calves, Cattle on Feed,and Cattle Slaughter in Selected Statesfor 1974 and 1994 ........................................... 7
2. Calf Prices Projected by FAPRI andNorth Dakota Estimated Calf Prices ............... 8
3. Fencing and Feed Bunk Requirementsfor Various Feedlots ...................................... 10
4. Lot Equipment and Land Improvementsfor 1,000, 5,000, and 20,000 HeadFeedlots ........................................................ 10
5. Grain Handling Equipment and Buildingsfor 1,000, 5,000, and 20,000 HeadFeedlots ........................................................ 11
6. Equipment Requirements and Costs forVarious Size Feedlots ................................... 11
7. Capital Cost Summary for VariousFeedlots ........................................................ 11
8. Price Differential for Corn Among Kansas,Nebraska, and North Dakota, PriceReceived by Farmers .................................... 13
9. Siting Requirements for LivestockFeedlots ........................................................ 16
10. Labor Requirements for the 1,000,5,000, and 20,000 Head Feedlots ................ 19
11. Growing and Finishing Rations for 550 lbCalves to Finish With Various Formulations,Dry Matter Basis ............................................ 19
12. Corn and Corn Gluten Feed PriceRelationship .................................................. 19
13. Net Return Per Head Capacity to Equityand Risk for Various Feedlots, Two Groupsof Cattle Fed Per Year ................................... 22
14. Net Return Per Head Capacity to Equityand Risk for Various Feedlots, Two Groupsof Cattle Fed Per Year, 80% Capacity ........... 22
15. Break-even Price for Feeder Cattleand Calves at Various Fed Cattle andCorn Prices ................................................... 23
16. Net Return Per Head Capacity to Equityand Risk for Backgrounding Calves in1,000 Head Feedlot, Seven Groupsof Cattle Fed Per Year ................................... 24
17. Net Return Per Head Capacity to Equityand Risk for 1,000, 5,000, and 20,000Head Feedlot, Two Groups of DairyCattle Fed Per Year ....................................... 24
18. Feeding Cost Comparison BetweenKansas and North Dakota Feedlots ............. 25
19. Local Direct Economic Impact of a20,000 Head Feedlot .................................... 29
20. Impact of Additional Truck Traffic toHighways ...................................................... 29
List of Figures
1. Number of Beef Cows on Farms forUnited States and North Dakota,January 1 ........................................................ 9
2. Prices of Oklahoma Feeder Steersand North Dakota Calf Prices ......................... 9
3. Five-State Feed Grain Production ................ 12
Page 5
HighlightsAmple cattle production occurs in the five states to
support a dramatically higher level of cattle feeding. Sixto seven hundred thousand more fed cattle would not beconstrained by the supply of calves and feeder cattle.
Producers of calves would have to markedly changetheir herd management techniques, shifting to spring andfall calving in order to provide calves and feeder cattleto the feedlots each week of the year.
Ample feed grains and agricultural processing by-products are available to support this increased level offed cattle production.
By-product utilization would be determined by itsprice relative to other feedstuffs; it is unlikely by-productscould profitably be transported more than about twohundred miles to feedlots.
Although feed grains are less expensive in theNorthern Plains than in Nebraska and Kansas, thatadvantage is more than offset by higher transportationcosts due to the distance from Northern Plains feedlotsto slaughter plants in the Southern Great Plains.
Potential rates of gain from cattle feeding in theNorthern Plains appear competitive with those ofNebraska and the Southern Plains.
Substantial economies of scale exist in cattle feeding.While feed costs do not significantly change, capitalcosts range from $468 per head for the projected 1,000head feedlot to $243 for the 20,000 head feedlot. Laborcost range from $52 per head for the 1,000 head feedlotto $23 per head for the 20,000 head feedlot.
Cattle feeding in the Northern Plains is profitableif both feed cost and cattle prices are favorable. If cornprice rises above $2.50 per bushel, fed cattle pricesneed to be above $70 per cwt to cover all productioncosts.
Backgrounding of cattle appears to be much moreprofitable than finishing cattle in the five-state area.
Feeding dairy cattle to finished weights is lessprofitable than feeding beef cattle to finished weights.
Northern Plains cattle feeding is more feasible iffinished cattle are transported 150 miles or less toslaughter plants, as compared to three to four hundredmiles to slaughter plants in Nebraska.
Strategies for value-added livestock production rangefrom farmer owned feedlots and slaughter plants in theNorthern Plains to retained ownership of cattle customfed in Nebraska feedlots, and custom slaughtered withsale of a branded boxed beef product.
The U.S. cattle industry has been declining in sizeon a secular basis for several decades. Excess cattlefeeding capacity exists in Nebraska and in the SouthernPlains, along with sufficient cattle slaughter capacity tohandle all cattle fed in the Great Plains.
Sustained profitability for Northern Plains cattlefeeders will require achieving cost economies compa-rable to cattle feedlots in Nebraska and the SouthernPlains.
Cattle feeding has not stopped out-migration of youngadults from rural communities or prevented loss inpopulation from rural areas. Little additional labor isrequired for feedlot operation, about one worker for each1,000 head of cattle on feed.
A variety of vertical networking arrangements mayhold substantial promise for farmers in value-added cattleproduction systems. Successful horizontal networkingarrangements were not identified.
The economic benefit to a community from cattlefeeding is relatively modest, though not insignificant.Benefits are higher if the feedlot is owned by communityresidents and as a result, more profits from successfuloperation are spent within the community, than if profitsflow to investors outside the community.
Widespread cattle feeding in the Northern Plainscould offer career opportunities for a limited number ofveterinarians, nutritionists, and trucking firms.
More stringent siting and permit requirements seemlikely to limit the nuisance cost to neighbors and adjacentcommunities as a result of feedlot development. In manycases, local siting and permit requirements are morestringent than either federal or state requirements.
Cattle feeding does add certain costs to be borneby the community, such as additional maintenance oncounty roads and limited nuisance aspects related todust, odor, and insects.
The overall impact on a community as a result ofcattle feeding is generally viewed as positive.
Highlights
Economic Reasibility of the Cattle Feeding Industry in the Northern Plains and Western Lakes States
Page 6
Economic Feasibility of the CattleFeeding Industry in the NorthernPlains and Western Lakes States
Marvin R. Duncan, Richard D. Taylor, David M. Saxowsky, Won W. Koo
profit opportunities, and community impact. Atten-tion will be given to the impact on local businesses,job formation, income generation, community well-being, and quality of life.
This study explored the viability of cattle feedingin Northern Plains and Western Lakes States. Thestudy objectives were to1. Evaluate the profitability of cattle feeding for
family farmers, taking into account the availabilityof agricultural processing by-products, sizeconsiderations, farmers networks, marketconditions, and financing and organizationalalternatives;
2. Identify and evaluate the impact of legal/regulatory issues on the siting of feedlots, wastemanagement, and odor abatement; and
3. Identify and evaluate the economic and socialimpacts on communities where livestock feedingoccurs.The study was conducted by researchers in
the Department of Agricultural Economics at NorthDakota State University in Fargo, North Dakota, withfinancial support from the Farmers EducationalFoundation.
One aspect of the study was interviewing feedlotoperators and community leaders in regions withextensive feeding activities. These areas includedGarden City, Kansas; the Platte River area of centralNebraska; southern Iowa; southwestern Minnesota;and southeastern South Dakota. The survey findingsare discussed in relevant sections of the report.Others findings are summarized in Appendix B.
I.Introduction andStudy Objectives
Many policy analysts and farm organizationleaders are concerned about the impact of substan-tial reductions in federal farm programs on the U.S.agricultural economy. The changes in federal policywill require new initiatives by farmers to replacelost farm income. Among the initiatives likely to beconsidered is the development of high value agri-culture production to sustain the viability of familyfarms and rural communities. Livestock feedingcould be such a high value alternative in majoragricultural states.
Northern Plains and Western Lakes States,mainly Minnesota, Montana, North Dakota, SouthDakota, and Wisconsin, have both substantialquantities of feeder cattle and feed grains. Moreover,many farmer-owned processing cooperatives haveincreased amounts of by-products available toadd to feeding rations.
This study considers a range of issues in evalu-ating the potential feasibility and income enhance-ment capacity of livestock feeding in the five-statearea. These include issues related to cattle and feedavailability, feedlot design and cost, optimum feedlotsize, cost-effective feed rations, feedlot siting issues,
Livestock feeding could be ahigh value alternative.
Page 7
II.Characteristics of theU.S. Cattle Industry
The reason for examining the characteristics ofthe U.S. cattle industry is to better understand itsstatus and the trends affecting the industry. Such aunderstanding will enable farmers and ranchers inthe five states that are the focus of the study to betterdetermine opportunities that might exist for them inthe industry.
Feeder Calf ProductionThe cattle industry is an important segment of
U.S. agriculture. Sales from cattle and calvesaccounted for $46.7 billion (USDA) in the UnitedStates in 1995. Sales from the five-state areatotaled $3.8 billion in 1994 (USDA).
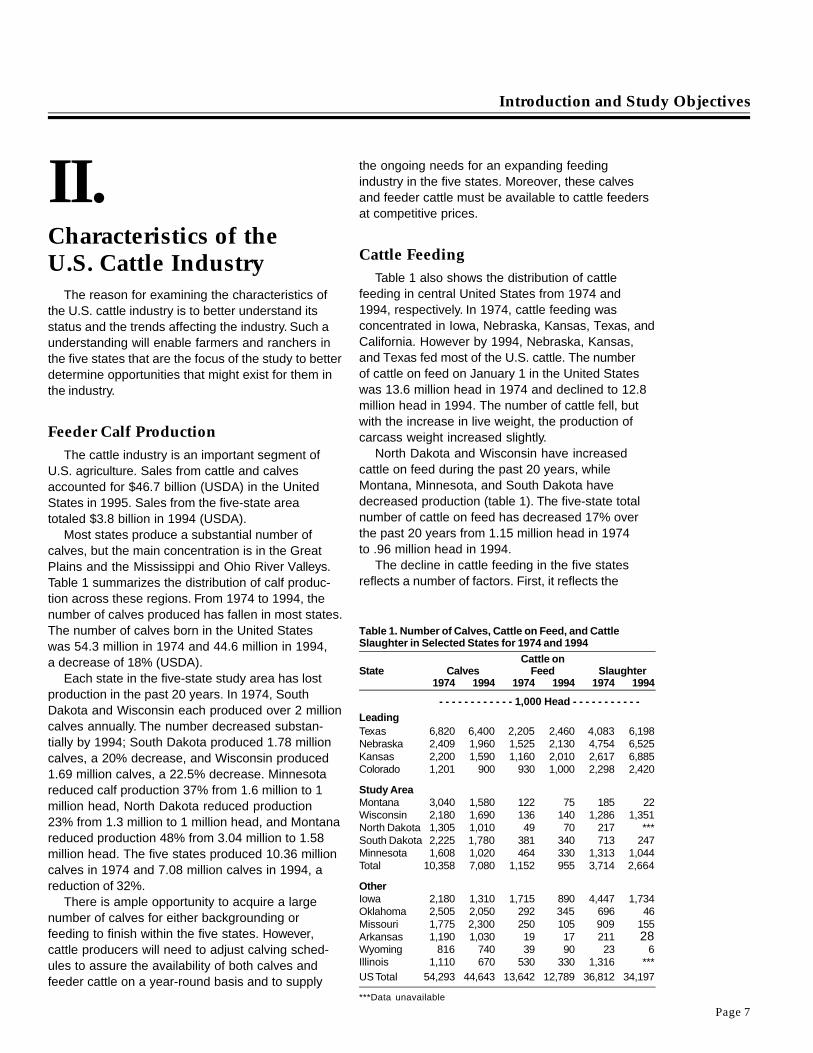
Most states produce a substantial number ofcalves, but the main concentration is in the GreatPlains and the Mississippi and Ohio River Valleys.Table 1 summarizes the distribution of calf produc-tion across these regions. From 1974 to 1994, thenumber of calves produced has fallen in most states.The number of calves born in the United Stateswas 54.3 million in 1974 and 44.6 million in 1994,a decrease of 18% (USDA).
Each state in the five-state study area has lostproduction in the past 20 years. In 1974, SouthDakota and Wisconsin each produced over 2 millioncalves annually. The number decreased substan-tially by 1994; South Dakota produced 1.78 millioncalves, a 20% decrease, and Wisconsin produced1.69 million calves, a 22.5% decrease. Minnesotareduced calf production 37% from 1.6 million to 1million head, North Dakota reduced production23% from 1.3 million to 1 million head, and Montanareduced production 48% from 3.04 million to 1.58million head. The five states produced 10.36 millioncalves in 1974 and 7.08 million calves in 1994, areduction of 32%.
There is ample opportunity to acquire a largenumber of calves for either backgrounding orfeeding to finish within the five states. However,cattle producers will need to adjust calving sched-ules to assure the availability of both calves andfeeder cattle on a year-round basis and to supply
the ongoing needs for an expanding feedingindustry in the five states. Moreover, these calvesand feeder cattle must be available to cattle feedersat competitive prices.
Cattle FeedingTable 1 also shows the distribution of cattle
feeding in central United States from 1974 and1994, respectively. In 1974, cattle feeding wasconcentrated in Iowa, Nebraska, Kansas, Texas, andCalifornia. However by 1994, Nebraska, Kansas,and Texas fed most of the U.S. cattle. The numberof cattle on feed on January 1 in the United Stateswas 13.6 million head in 1974 and declined to 12.8million head in 1994. The number of cattle fell, butwith the increase in live weight, the production ofcarcass weight increased slightly.
North Dakota and Wisconsin have increasedcattle on feed during the past 20 years, whileMontana, Minnesota, and South Dakota havedecreased production (table 1). The five-state totalnumber of cattle on feed has decreased 17% overthe past 20 years from 1.15 million head in 1974to .96 million head in 1994.
The decline in cattle feeding in the five statesreflects a number of factors. First, it reflects the
Introduction and Study Objectives
Table 1. Number of Calves, Cattle on Feed, and CattleSlaughter in Selected States for 1974 and 1994
Cattle onState Calves Feed Slaughter
1974 1994 1974 1994 1974 1994
- - - - - - - - - - - - 1,000 Head - - - - - - - - - - -
LeadingTexas 6,820 6,400 2,205 2,460 4,083 6,198Nebraska 2,409 1,960 1,525 2,130 4,754 6,525Kansas 2,200 1,590 1,160 2,010 2,617 6,885Colorado 1,201 900 930 1,000 2,298 2,420
Study AreaMontana 3,040 1,580 122 75 185 22Wisconsin 2,180 1,690 136 140 1,286 1,351North Dakota 1,305 1,010 49 70 217 ***South Dakota 2,225 1,780 381 340 713 247Minnesota 1,608 1,020 464 330 1,313 1,044Total 10,358 7,080 1,152 955 3,714 2,664
OtherIowa 2,180 1,310 1,715 890 4,447 1,734Oklahoma 2,505 2,050 292 345 696 46Missouri 1,775 2,300 250 105 909 155Arkansas 1,190 1,030 19 17 211 28Wyoming 816 740 39 90 23 6Illinois 1,110 670 530 330 1,316 ***US Total 54,293 44,643 13,642 12,789 36,812 34,197
***Data unavailable
Economic Reasibility of the Cattle Feeding Industry in the Northern Plains and Western Lakes States
Page 8
relative price strength in cash grain markets overthe early and latter parts of this period. Second, itreflects the growing lack of nearby slaughter plantsto support cattle feeding in the five states. Finally,it also reflects the growth in cattle feeding in Ne-braska, Kansas, and other Southern Plains andRocky Mountain states.
Cattle SlaughteringNebraska, Iowa, and Texas led in federally
inspected slaughtering with 4.8 million, 4.4 million,and 4.0 million head slaughtered, respectively,in 1974. California slaughtered 2.9 million headfollowed by Kansas with 2.6 million head. In 1994,Kansas led the nation with 6.9 million head, fol-lowed by Nebraska, 6.5 million; Texas, 6.2 million;and Colorado, 2.4 million head slaughtered. Mostother states have reduced slaughtering, whileKansas, Nebraska, and Texas have increasedproduction substantially during the past 20 years.
The five-state area has reduced slaughter num-bers, from 3.7 million head in 1974 to 2.7 millionhead in 1994, a reduction of 28%.
The sharp decline in cattle slaughter in the fivestates reflects the combined forces in Nebraska,Kansas, and other Southern Plains and RockyMountain states of growth in irrigated corn pro-duction, large-size feedlot development, and theconsolidation/relocation of modern livestockslaughter plants.
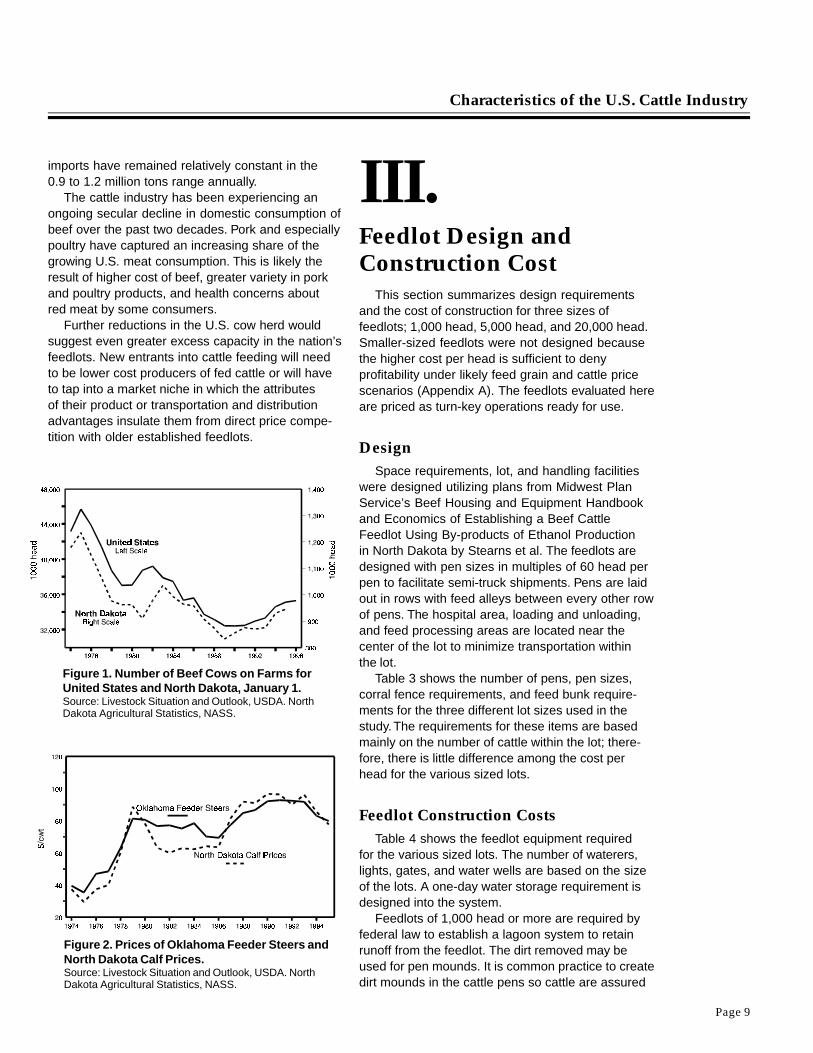
The Cattle CycleFigure 1 shows the number of beef cows on
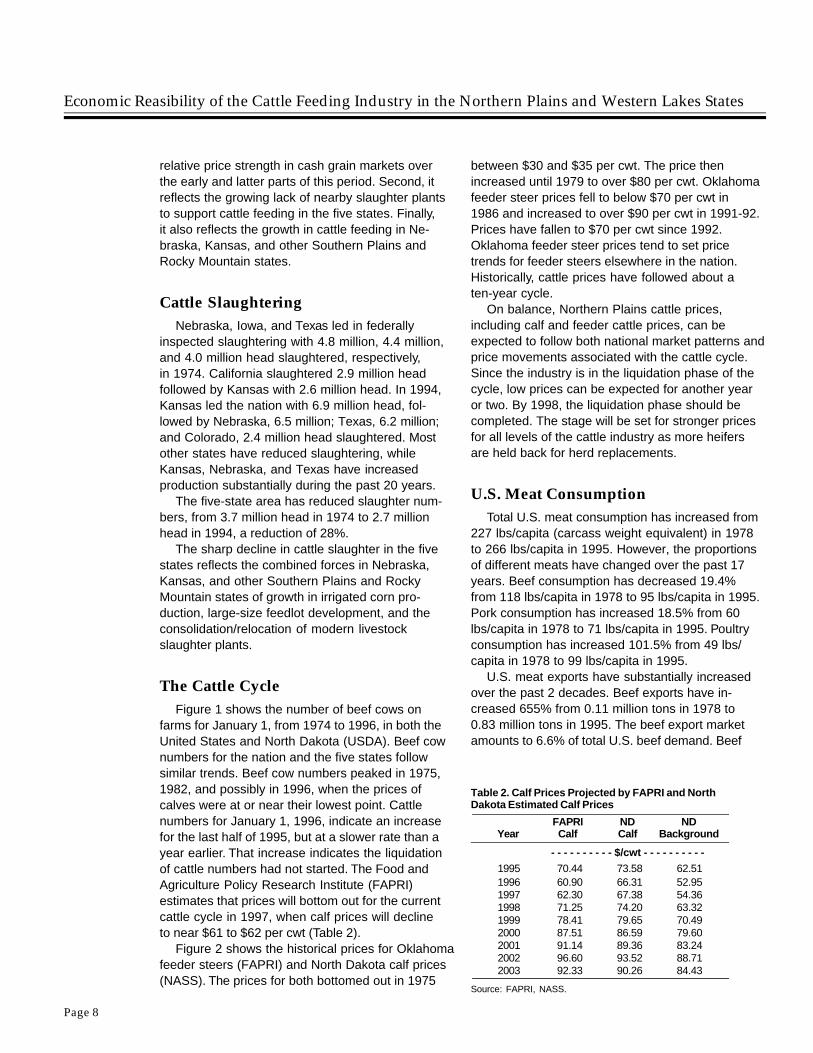
farms for January 1, from 1974 to 1996, in both theUnited States and North Dakota (USDA). Beef cownumbers for the nation and the five states followsimilar trends. Beef cow numbers peaked in 1975,1982, and possibly in 1996, when the prices ofcalves were at or near their lowest point. Cattlenumbers for January 1, 1996, indicate an increasefor the last half of 1995, but at a slower rate than ayear earlier. That increase indicates the liquidationof cattle numbers had not started. The Food andAgriculture Policy Research Institute (FAPRI)estimates that prices will bottom out for the currentcattle cycle in 1997, when calf prices will declineto near $61 to $62 per cwt (Table 2).
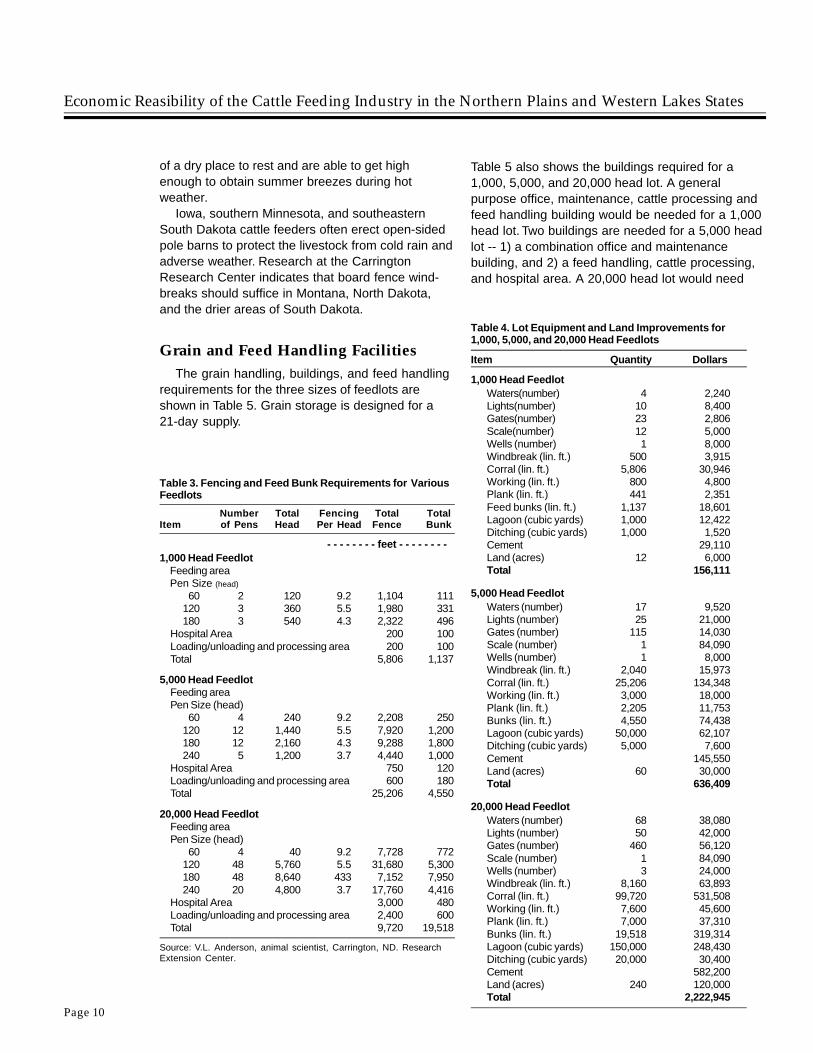
Figure 2 shows the historical prices for Oklahomafeeder steers (FAPRI) and North Dakota calf prices(NASS). The prices for both bottomed out in 1975
between $30 and $35 per cwt. The price thenincreased until 1979 to over $80 per cwt. Oklahomafeeder steer prices fell to below $70 per cwt in1986 and increased to over $90 per cwt in 1991-92.Prices have fallen to $70 per cwt since 1992.Oklahoma feeder steer prices tend to set pricetrends for feeder steers elsewhere in the nation.Historically, cattle prices have followed about aten-year cycle.
On balance, Northern Plains cattle prices,including calf and feeder cattle prices, can beexpected to follow both national market patterns andprice movements associated with the cattle cycle.Since the industry is in the liquidation phase of thecycle, low prices can be expected for another yearor two. By 1998, the liquidation phase should becompleted. The stage will be set for stronger pricesfor all levels of the cattle industry as more heifersare held back for herd replacements.
U.S. Meat ConsumptionTotal U.S. meat consumption has increased from
227 lbs/capita (carcass weight equivalent) in 1978to 266 lbs/capita in 1995. However, the proportionsof different meats have changed over the past 17years. Beef consumption has decreased 19.4%from 118 lbs/capita in 1978 to 95 lbs/capita in 1995.Pork consumption has increased 18.5% from 60lbs/capita in 1978 to 71 lbs/capita in 1995. Poultryconsumption has increased 101.5% from 49 lbs/capita in 1978 to 99 lbs/capita in 1995.
U.S. meat exports have substantially increasedover the past 2 decades. Beef exports have in-creased 655% from 0.11 million tons in 1978 to0.83 million tons in 1995. The beef export marketamounts to 6.6% of total U.S. beef demand. Beef
Table 2. Calf Prices Projected by FAPRI and NorthDakota Estimated Calf Prices
FAPRI ND NDYear Calf Calf Background
- - - - - - - - - - $/cwt - - - - - - - - - -
1995 70.44 73.58 62.511996 60.90 66.31 52.951997 62.30 67.38 54.361998 71.25 74.20 63.321999 78.41 79.65 70.492000 87.51 86.59 79.602001 91.14 89.36 83.242002 96.60 93.52 88.712003 92.33 90.26 84.43
Source: FAPRI, NASS.
Page 9
imports have remained relatively constant in the0.9 to 1.2 million tons range annually.
The cattle industry has been experiencing anongoing secular decline in domestic consumption ofbeef over the past two decades. Pork and especiallypoultry have captured an increasing share of thegrowing U.S. meat consumption. This is likely theresult of higher cost of beef, greater variety in porkand poultry products, and health concerns aboutred meat by some consumers.
Further reductions in the U.S. cow herd wouldsuggest even greater excess capacity in the nation’sfeedlots. New entrants into cattle feeding will needto be lower cost producers of fed cattle or will haveto tap into a market niche in which the attributesof their product or transportation and distributionadvantages insulate them from direct price compe-tition with older established feedlots.
III.Feedlot Design andConstruction Cost
This section summarizes design requirementsand the cost of construction for three sizes offeedlots; 1,000 head, 5,000 head, and 20,000 head.Smaller-sized feedlots were not designed becausethe higher cost per head is sufficient to denyprofitability under likely feed grain and cattle pricescenarios (Appendix A). The feedlots evaluated hereare priced as turn-key operations ready for use.
DesignSpace requirements, lot, and handling facilities
were designed utilizing plans from Midwest PlanService’s Beef Housing and Equipment Handbookand Economics of Establishing a Beef CattleFeedlot Using By-products of Ethanol Productionin North Dakota by Stearns et al. The feedlots aredesigned with pen sizes in multiples of 60 head perpen to facilitate semi-truck shipments. Pens are laidout in rows with feed alleys between every other rowof pens. The hospital area, loading and unloading,and feed processing areas are located near thecenter of the lot to minimize transportation withinthe lot.
Table 3 shows the number of pens, pen sizes,corral fence requirements, and feed bunk require-ments for the three different lot sizes used in thestudy. The requirements for these items are basedmainly on the number of cattle within the lot; there-fore, there is little difference among the cost perhead for the various sized lots.
Feedlot Construction CostsTable 4 shows the feedlot equipment required
for the various sized lots. The number of waterers,lights, gates, and water wells are based on the sizeof the lots. A one-day water storage requirement isdesigned into the system.
Feedlots of 1,000 head or more are required byfederal law to establish a lagoon system to retainrunoff from the feedlot. The dirt removed may beused for pen mounds. It is common practice to createdirt mounds in the cattle pens so cattle are assured
Figure 1. Number of Beef Cows on Farms forUnited States and North Dakota, January 1.Source: Livestock Situation and Outlook, USDA. NorthDakota Agricultural Statistics, NASS.
Figure 2. Prices of Oklahoma Feeder Steers andNorth Dakota Calf Prices.Source: Livestock Situation and Outlook, USDA. NorthDakota Agricultural Statistics, NASS.
Characteristics of the U.S. Cattle Industry
Economic Reasibility of the Cattle Feeding Industry in the Northern Plains and Western Lakes States
Page 10
of a dry place to rest and are able to get highenough to obtain summer breezes during hotweather.
Iowa, southern Minnesota, and southeasternSouth Dakota cattle feeders often erect open-sidedpole barns to protect the livestock from cold rain andadverse weather. Research at the CarringtonResearch Center indicates that board fence wind-breaks should suffice in Montana, North Dakota,and the drier areas of South Dakota.
Grain and Feed Handling FacilitiesThe grain handling, buildings, and feed handling
requirements for the three sizes of feedlots areshown in Table 5. Grain storage is designed for a21-day supply.
Table 5 also shows the buildings required for a1,000, 5,000, and 20,000 head lot. A generalpurpose office, maintenance, cattle processing andfeed handling building would be needed for a 1,000head lot. Two buildings are needed for a 5,000 headlot -- 1) a combination office and maintenancebuilding, and 2) a feed handling, cattle processing,and hospital area. A 20,000 head lot would need
Table 3. Fencing and Feed Bunk Requirements for VariousFeedlots
Number Total Fencing Total TotalItem of Pens Head Per Head Fence Bunk
- - - - - - - - feet - - - - - - - -1,000 Head Feedlot
Feeding areaPen Size (head)
60 2 120 9.2 1,104 111120 3 360 5.5 1,980 331180 3 540 4.3 2,322 496
Hospital Area 200 100Loading/unloading and processing area 200 100Total 5,806 1,137
5,000 Head FeedlotFeeding areaPen Size (head)
60 4 240 9.2 2,208 250120 12 1,440 5.5 7,920 1,200180 12 2,160 4.3 9,288 1,800240 5 1,200 3.7 4,440 1,000
Hospital Area 750 120Loading/unloading and processing area 600 180Total 25,206 4,550
20,000 Head FeedlotFeeding areaPen Size (head)
60 4 40 9.2 7,728 772120 48 5,760 5.5 31,680 5,300180 48 8,640 433 7,152 7,950240 20 4,800 3.7 17,760 4,416
Hospital Area 3,000 480Loading/unloading and processing area 2,400 600Total 9,720 19,518
Source: V.L. Anderson, animal scientist, Carrington, ND. ResearchExtension Center.
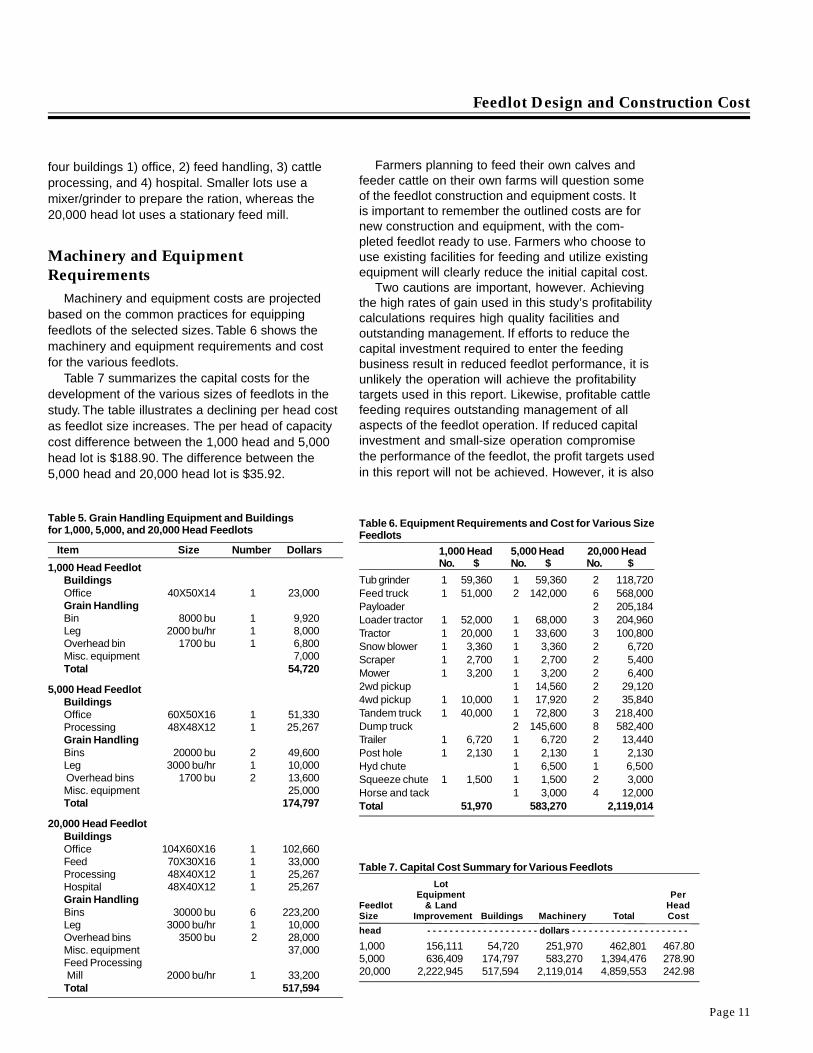
Table 4. Lot Equipment and Land Improvements for1,000, 5,000, and 20,000 Head Feedlots
Item Quantity Dollars
1,000 Head FeedlotWaters(number) 4 2,240Lights(number) 10 8,400Gates(number) 23 2,806Scale(number) 12 5,000Wells (number) 1 8,000Windbreak (lin. ft.) 500 3,915Corral (lin. ft.) 5,806 30,946Working (lin. ft.) 800 4,800Plank (lin. ft.) 441 2,351Feed bunks (lin. ft.) 1,137 18,601Lagoon (cubic yards) 1,000 12,422Ditching (cubic yards) 1,000 1,520Cement 29,110Land (acres) 12 6,000Total 156,111
5,000 Head FeedlotWaters (number) 17 9,520Lights (number) 25 21,000Gates (number) 115 14,030Scale (number) 1 84,090Wells (number) 1 8,000Windbreak (lin. ft.) 2,040 15,973Corral (lin. ft.) 25,206 134,348Working (lin. ft.) 3,000 18,000Plank (lin. ft.) 2,205 11,753Bunks (lin. ft.) 4,550 74,438Lagoon (cubic yards) 50,000 62,107Ditching (cubic yards) 5,000 7,600Cement 145,550Land (acres) 60 30,000Total 636,409
20,000 Head FeedlotWaters (number) 68 38,080Lights (number) 50 42,000Gates (number) 460 56,120Scale (number) 1 84,090Wells (number) 3 24,000Windbreak (lin. ft.) 8,160 63,893Corral (lin. ft.) 99,720 531,508Working (lin. ft.) 7,600 45,600Plank (lin. ft.) 7,000 37,310Bunks (lin. ft.) 19,518 319,314Lagoon (cubic yards) 150,000 248,430Ditching (cubic yards) 20,000 30,400Cement 582,200Land (acres) 240 120,000Total 2,222,945
Page 11
Farmers planning to feed their own calves andfeeder cattle on their own farms will question someof the feedlot construction and equipment costs. Itis important to remember the outlined costs are fornew construction and equipment, with the com-pleted feedlot ready to use. Farmers who choose touse existing facilities for feeding and utilize existingequipment will clearly reduce the initial capital cost.
Two cautions are important, however. Achievingthe high rates of gain used in this study’s profitabilitycalculations requires high quality facilities andoutstanding management. If efforts to reduce thecapital investment required to enter the feedingbusiness result in reduced feedlot performance, it isunlikely the operation will achieve the profitabilitytargets used in this report. Likewise, profitable cattlefeeding requires outstanding management of allaspects of the feedlot operation. If reduced capitalinvestment and small-size operation compromisethe performance of the feedlot, the profit targets usedin this report will not be achieved. However, it is also
four buildings 1) office, 2) feed handling, 3) cattleprocessing, and 4) hospital. Smaller lots use amixer/grinder to prepare the ration, whereas the20,000 head lot uses a stationary feed mill.
Machinery and EquipmentRequirements
Machinery and equipment costs are projectedbased on the common practices for equippingfeedlots of the selected sizes. Table 6 shows themachinery and equipment requirements and costfor the various feedlots.
Table 7 summarizes the capital costs for thedevelopment of the various sizes of feedlots in thestudy. The table illustrates a declining per head costas feedlot size increases. The per head of capacitycost difference between the 1,000 head and 5,000head lot is $188.90. The difference between the5,000 head and 20,000 head lot is $35.92.
Feedlot Design and Construction Cost
Table 5. Grain Handling Equipment and Buildingsfor 1,000, 5,000, and 20,000 Head Feedlots
Item Size Number Dollars
1,000 Head FeedlotBuildingsOffice 40X50X14 1 23,000Grain HandlingBin 8000 bu 1 9,920Leg 2000 bu/hr 1 8,000Overhead bin 1700 bu 1 6,800Misc. equipment 7,000Total 54,720
5,000 Head FeedlotBuildingsOffice 60X50X16 1 51,330Processing 48X48X12 1 25,267Grain HandlingBins 20000 bu 2 49,600Leg 3000 bu/hr 1 10,000 Overhead bins 1700 bu 2 13,600Misc. equipment 25,000Total 174,797
20,000 Head FeedlotBuildingsOffice 104X60X16 1 102,660Feed 70X30X16 1 33,000Processing 48X40X12 1 25,267Hospital 48X40X12 1 25,267Grain HandlingBins 30000 bu 6 223,200Leg 3000 bu/hr 1 10,000Overhead bins 3500 bu 2 28,000Misc. equipment 37,000Feed Processing Mill 2000 bu/hr 1 33,200Total 517,594
Table 6. Equipment Requirements and Cost for Various SizeFeedlots
1,000 Head 5,000 Head 20,000 HeadNo. $ No. $ No. $
Tub grinder 1 59,360 1 59,360 2 118,720Feed truck 1 51,000 2 142,000 6 568,000Payloader 2 205,184Loader tractor 1 52,000 1 68,000 3 204,960Tractor 1 20,000 1 33,600 3 100,800Snow blower 1 3,360 1 3,360 2 6,720Scraper 1 2,700 1 2,700 2 5,400Mower 1 3,200 1 3,200 2 6,4002wd pickup 1 14,560 2 29,1204wd pickup 1 10,000 1 17,920 2 35,840Tandem truck 1 40,000 1 72,800 3 218,400Dump truck 2 145,600 8 582,400Trailer 1 6,720 1 6,720 2 13,440Post hole 1 2,130 1 2,130 1 2,130Hyd chute 1 6,500 1 6,500Squeeze chute 1 1,500 1 1,500 2 3,000Horse and tack 1 3,000 4 12,000Total 51,970 583,270 2,119,014
Table 7. Capital Cost Summary for Various Feedlots
LotEquipment Per
Feedlot & Land HeadSize Improvement Buildings Machinery Total Cost
head - - - - - - - - - - - - - - - - - - - - dollars - - - - - - - - - - - - - - - - - - - - -
1,000 156,111 54,720 251,970 462,801 467.805,000 636,409 174,797 583,270 1,394,476 278.9020,000 2,222,945 517,594 2,119,014 4,859,553 242.98
Economic Reasibility of the Cattle Feeding Industry in the Northern Plains and Western Lakes States
Page 12
conceivable that farmers feeding cattle in relativelysmall farm feedlots could achieve acceptable ratesof gain during the feeding period.
An additional and critically important issue forfarmers planning to feed calves or feeder cattle isthe adequacy of feed supply. Cattle feeding is morelikely to be profitable in a location where feedstuffsare in excess supply. In those circumstances, cattlefeeders are able to buy feed grains delivered to theirfeedlots at little or no premium over the price offeredby local grain elevators. The experience of cattlefeeders is that it is always more profitable to takethe feeder cattle to the feed supplies rather than tomove feed supplies to the source of the cattle. Cattlefeeding in Kansas, Minnesota, Nebraska, and SouthDakota occurs principally in areas of dependableand surplus feedstuff supplies.
Interregional Competitive IssuesDeciding to construct a new feedlot is more
complex than the design and construction costanalysis would suggest. It is also necessary to eval-uate the cattle feeding capacity in the cattle industry,relative to the number of cattle to be fed. Beef cattlenumbers in the United States continue to be in along-term decline. Hence, to successfully add newcapacity in the cattle feeding industry, it is necessaryto displace some of the feedlot capacity in placein other regions of the country. To do so, productionfrom new feedlots must be more cost effective thanfrom feedlots in place, or it must serve a nichemarket that is not affected by the established feedlotcapacity with its potentially lower costs.
Our interviews with feedlot operators in otherstates, especially Kansas and Nebraska, revealedthat many feedlot operators in these two states wereplanning expansions in cattle feeding capacity. Atthe same time farm-size feedlots typically stoodempty, having been abandoned as unprofitable.The evidence of abandonment of these farm-sizefeedlots was particularly common in southern Iowa.Cattle feeders in Kansas and Nebraska indicatedthey could add feedlot capacity for about $160 perhead. Some feeders indicated new fixed investmentmight have to be constrained to no more than $125per head to be competitive. Moreover, most feedlotsin these two states have been in use for severalyears to a few decades, and their initial fixedinvestment is at least partially amortized. Thus, thefixed cost of feeding cattle in those feedlots will besignificantly less than in a newly constructed feedlotin the Northern Plains in which the total investmentis projected to exceed $240 per head.
IV.Availability of Feed Stuffs
Feedstuff availability is a primary consideration indetermining whether a region will be competitive incattle feeding. Cattle feeders interviewed in GardenCity, Kansas; the Platte River Valley of Nebraska;southern Iowa; western Minnesota; and easternSouth Dakota all emphasized the importance ofreadily available feed grains supplies producedreasonably close to the feedlot. Cattle feeders inKansas and Nebraska noted that large-size cattlefeeding did not develop until irrigated corn produc-tion brought an assured and abundant supply ofcorn to the cattle feeding areas. This section dis-cusses the production and, hence, the availability, offeedstuffs nationally and in the five-state study area.
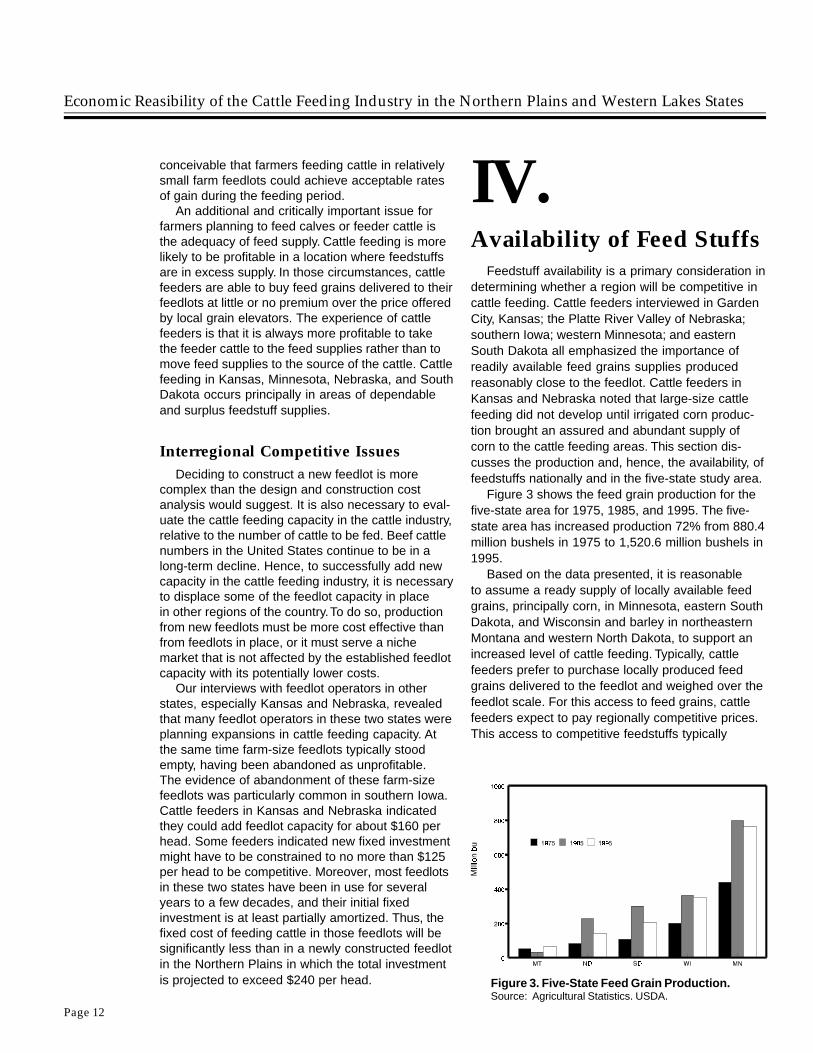
Figure 3 shows the feed grain production for thefive-state area for 1975, 1985, and 1995. The five-state area has increased production 72% from 880.4million bushels in 1975 to 1,520.6 million bushels in1995.
Based on the data presented, it is reasonableto assume a ready supply of locally available feedgrains, principally corn, in Minnesota, eastern SouthDakota, and Wisconsin and barley in northeasternMontana and western North Dakota, to support anincreased level of cattle feeding. Typically, cattlefeeders prefer to purchase locally produced feedgrains delivered to the feedlot and weighed over thefeedlot scale. For this access to feed grains, cattlefeeders expect to pay regionally competitive prices.This access to competitive feedstuffs typically
Figure 3. Five-State Feed Grain Production.Source: Agricultural Statistics. USDA.
Page 13
requires that feedlots be located in areas of surplusfeed grain production.
Some difference of opinion exists as to whethercattle finished on barley will sell as favorably ascattle finished on a corn ration. The issue is whetherthe white fat covering and marbling associated withbarley-fed cattle is as attractive to the consumer asthe yellow fat covering and marbling associated withcorn-fed cattle. Cattle feeders interviewed indicateda preference for corn in finishing cattle althoughbarley-fed cattle gain about as well, and there doesnot appear to be any adverse taste associated withbarley-fed cattle. Cattle feeders interviewed inKansas, Nebraska, and Iowa believed slaughterplants with which they did business would preferthe yellow marbling, resulting from feeding corn.Researchers at the Carrington Research Centersuggested this issue is more individual preferencefor yellow marbling than one of better feedlot per-formance. Moreover, barley is a primary feedstuffin the Pacific Northwest and Western Canada withno apparent price penalty for the cattle fed on abarley ration.
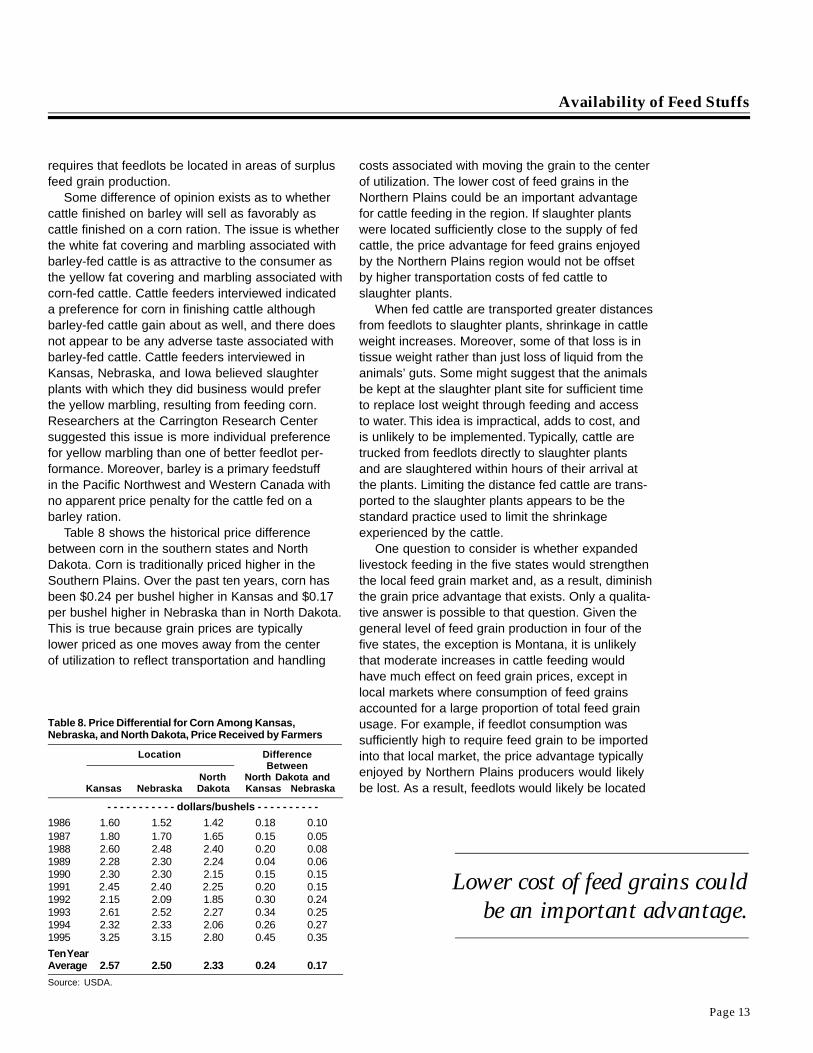
Table 8 shows the historical price differencebetween corn in the southern states and NorthDakota. Corn is traditionally priced higher in theSouthern Plains. Over the past ten years, corn hasbeen $0.24 per bushel higher in Kansas and $0.17per bushel higher in Nebraska than in North Dakota.This is true because grain prices are typicallylower priced as one moves away from the centerof utilization to reflect transportation and handling
costs associated with moving the grain to the centerof utilization. The lower cost of feed grains in theNorthern Plains could be an important advantagefor cattle feeding in the region. If slaughter plantswere located sufficiently close to the supply of fedcattle, the price advantage for feed grains enjoyedby the Northern Plains region would not be offsetby higher transportation costs of fed cattle toslaughter plants.
When fed cattle are transported greater distancesfrom feedlots to slaughter plants, shrinkage in cattleweight increases. Moreover, some of that loss is intissue weight rather than just loss of liquid from theanimals’ guts. Some might suggest that the animalsbe kept at the slaughter plant site for sufficient timeto replace lost weight through feeding and accessto water. This idea is impractical, adds to cost, andis unlikely to be implemented. Typically, cattle aretrucked from feedlots directly to slaughter plantsand are slaughtered within hours of their arrival atthe plants. Limiting the distance fed cattle are trans-ported to the slaughter plants appears to be thestandard practice used to limit the shrinkageexperienced by the cattle.
One question to consider is whether expandedlivestock feeding in the five states would strengthenthe local feed grain market and, as a result, diminishthe grain price advantage that exists. Only a qualita-tive answer is possible to that question. Given thegeneral level of feed grain production in four of thefive states, the exception is Montana, it is unlikelythat moderate increases in cattle feeding wouldhave much effect on feed grain prices, except inlocal markets where consumption of feed grainsaccounted for a large proportion of total feed grainusage. For example, if feedlot consumption wassufficiently high to require feed grain to be importedinto that local market, the price advantage typicallyenjoyed by Northern Plains producers would likelybe lost. As a result, feedlots would likely be located
Availability of Feed Stuffs
Lower cost of feed grains couldbe an important advantage.
Table 8. Price Differential for Corn Among Kansas,Nebraska, and North Dakota, Price Received by Farmers
Location DifferenceBetween
North North Dakota andKansas Nebraska Dakota Kansas Nebraska
- - - - - - - - - - - dollars/bushels - - - - - - - - - -
1986 1.60 1.52 1.42 0.18 0.101987 1.80 1.70 1.65 0.15 0.051988 2.60 2.48 2.40 0.20 0.081989 2.28 2.30 2.24 0.04 0.061990 2.30 2.30 2.15 0.15 0.151991 2.45 2.40 2.25 0.20 0.151992 2.15 2.09 1.85 0.30 0.241993 2.61 2.52 2.27 0.34 0.251994 2.32 2.33 2.06 0.26 0.271995 3.25 3.15 2.80 0.45 0.35
Ten YearAverage 2.57 2.50 2.33 0.24 0.17
Source: USDA.

Economic Reasibility of the Cattle Feeding Industry in the Northern Plains and Western Lakes States
Page 14
in those regions in the Northern Plains where asurplus of feed grains would exist even after thefeedlot was in operation. This means locatingfeedlots where feed grain is in surplus, rather thanwhere the cattle are raised.
In the absence of cattle slaughter capacity within200 miles of cattle feedlots, the price advantagefor feed grains in the Northern Plains States is morethan offset by the cost of transporting NorthernPlains finished livestock to slaughter plants.
With a corn-barley ration, a steer or heiferconsumes about 21 bushels of corn and 13 bushelsof barley during the feeding cycle. The feed graincost advantage for feeding cattle in North Dakota,compared to feeding in Kansas, is between $3.57and $5.04 per head of finished livestock.
Cattle feeders interviewed during this study allindicated a willingness to utilize agricultural pro-cessing by-products in their feeding rations to lowertheir feeding costs. By-products must be competi-tively priced with available feed grains before theywill be fed. This causes some confusion. Availabilityof agricultural by-products does not necessarilycreate a more favorable environment for cattlefeeding. By-products all move in domestic andexport markets and are priced based on the sourcegrain and the feed value remaining after processingthat grain.
This means that by-products are not available atdistress prices for use by local cattle feeders. Cattlefeeders will be expected to pay for the remainingfeed value in the by-product, as compared to theprice of the predominant feed grain. Corn is the feedgrain against which the remaining feed value ismeasured and against which the by-products arepriced. Wet by-products would be priced substan-tially below the same by-products after drying,because of the difference in feed value.
Cattle feeders indicated it was difficult to haulby-products from a distant location and still havethem competitively priced. A 200-mile distancewas mentioned by Nebraska feedlot operators asnearing the maximum transportation distance. Cattlefeeders indicated they fed by-products only whenthey were able to secure a reliable source of theproduct for the entire feeding period in which theywere used. Cattle feeders were reluctant to changefeedstuffs in the ration once cattle are on feed.
The ProGold Corn Processing plant located insoutheastern North Dakota will be operationalduring the winter of 1996-97. The plant will beprocessing more than 25 million bushels of cornannually into corn syrup, starch, corn gluten feed,corn gluten meal, and corn germ. The plant will beproducing about 280,000 tons of corn gluten feed(CGF) annually, a satisfactory feed supplement forcattle on feed. CGF has 92% of the energy of cornand 2.3 times the protein (Owens).
Operations of the Dakota Growers Pasta Plant inCarrington add approximately 66 thousand tons ofby-products to the available supply in North Dakota(Northern Crops Institute). The location of new large-size potato processing facilities in central NorthDakota could add to the amount of potato process-ing by-products in North Dakota and westernMinnesota.
By-products available from sugar beet processingplants in western Minnesota and eastern NorthDakota totaled 6 million tons in 1995 (Midwest Agri).Other by-products suitable for use in cattle feedingare available from ethanol and other agriculturalcommodity and food processing facilities in Minne-sota, South Dakota, and Wisconsin. Any processingplant by-products that can be utilized for energyby rumen bacteria are potentially useful in cattlefeeding.
Adequate supplies of feed grains, principally cornand barley, along with growing amounts of agricul-tural processing by-products exist in much of thefive-state area to support a marked increase in cattlefeeding. Cattle producers could reasonably think interms of an increase of at least 600,000 to 700,000head of cattle fed in the five states of the study area,based on the availability of feedstuffs.
Supplies of feed grains areadequate to support a markedincrease in cattle feeding.

Page 15
V.Feedlot Siting Regulations
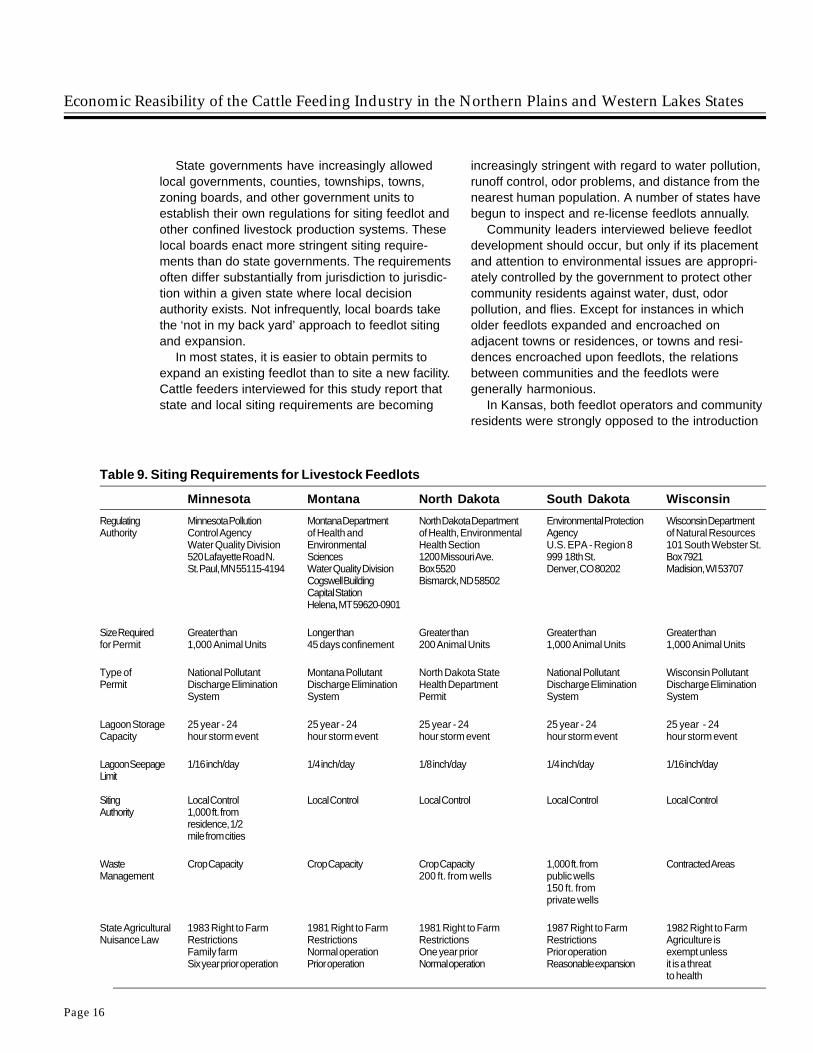
Feedlot siting requires compliance with a web ofinterlocking requirements at the federal, state, and,increasingly, local government levels. While thefederal Environmental Protection Act sets the overalldimensions for the requirements, most state regula-tions are often more stringent. There is a growingtrend for local governments to impose even morestringent pollution management controls on feedlotsiting. Table 9 of this report outlines state feedlotsiting requirements for the five states that are thefocus of this study.
A key component of these siting requirements isthe control of runoff from feedlots. The 1972 CleanWater Act prohibits the discharge of pollutants intowater of the United States without a NationalPollutant Discharge Permit. The Act regulates cattlefeedlots with a one-time capacity of 1,000 heador more. All runoff from the feedlot, manure storageareas, feed processing, and feed alleys must beretained in a lagoon. The Act states that the lagoonmust be constructed at least 3 ft. above bedrockand at least 2 ft. above the water table. Most statesrequire a clay liner that permits less than 1/16 inchseepage per day and groundwater monitor stations.
The dirt removed from the lagoon can be usedto create mounds in the feeding pens to assure dryareas for the cattle to rest in the feedlot. In additionto the lagoon, the feedlot and manure storage areasmust be protected from surface running waterduring a storm event. In Minnesota, for example, thelagoon, feedlot, and manure storage area must beprotected against a 100-year flood (Copeland).
Local government entities in some locations alsohave developed their own pollution control stan-dards. For example, in Minnesota, the Blue EarthCounty Livestock Waste Management Ordinancerequires specified setbacks from public and privateditches, surface tile inlets, water wells, sinkholes,residential dwellings, and public roads for the landapplication of manure. Where the manure is spreadwithout incorporation, separation distance fromsurface waters is governed by whether soil is frozen,soil texture, and soil slope. The lagoon contents arespread on growing crops using sprinkler or gatedpipe irrigation systems.
To obtain siting permits, access contracts mustbe in place for land to spread the expected manurefrom the feedlot. One acre of land is required forevery two slaughter steers or heifers of feedlotcapacity (two animal units per acre). The participat-ing county or the Minnesota Pollution ControlAgency may set additional requirements regulatingwaste storage and management.
The EPA does not consider airborne particlesthat are discharged from a feedlot to be pollution.State and local governments control odors withsiting regulations that determine the location of thefacility with reference to adjacent human population.However, courts have ruled that odor does createa nuisance in a number of cases where nuisanceodors suits have been filed (George).
There is no legally defined distance within whichodors of a nuisance level are not permitted, but afeedlot should be located at least 1.2 miles fromneighboring residences and housing developments.Future court decisions may define this issue. Futurepopulation development should be projected beforesiting to minimize problems resulting from growth ofhousing developments near an established feedlot.
In states with ‘right to farm’ laws, farms operatingin areas zoned for farming cannot be charged withnuisance violations from farm operations, such asodor problems. However, in some states, courtshave decided that large commercial feedlots do notqualify for protection under those statutes. Courtsdo not consider them to be farms.
Several methods are available to minimize dustand odor releases from a feedlot. Dust control canbe established with proper housekeeping in thefeedlot. Routine cleaning of pens and feed process-ing areas, proper storage of dry manure, and well-designed windbreaks surrounding the feedlot arehelpful steps. Odors can be controlled with propermanagement at each step in the manure-handlingsystem. Excessive odors are generally the result ofa breakdown in one of the pollution managementsystems (Ritter) rather than a result of day-to-dayoperations. Many of the feedlot operators surveyedas part of this study make similar observations.
Feedlot Siting Regulations
Odors can be controlled withproper managment.
Economic Reasibility of the Cattle Feeding Industry in the Northern Plains and Western Lakes States
Page 16
State governments have increasingly allowedlocal governments, counties, townships, towns,zoning boards, and other government units toestablish their own regulations for siting feedlot andother confined livestock production systems. Theselocal boards enact more stringent siting require-ments than do state governments. The requirementsoften differ substantially from jurisdiction to jurisdic-tion within a given state where local decisionauthority exists. Not infrequently, local boards takethe ‘not in my back yard’ approach to feedlot sitingand expansion.
In most states, it is easier to obtain permits toexpand an existing feedlot than to site a new facility.Cattle feeders interviewed for this study report thatstate and local siting requirements are becoming
Table 9. Siting Requirements for Livestock Feedlots
Minnesota Montana North Dakota South Dakota Wisconsin
Regulating Minnesota Pollution Montana Department North Dakota Department Environmental Protection Wisconsin DepartmentAuthority Control Agency of Health and of Health, Environmental Agency of Natural Resources
Water Quality Division Environmental Health Section U.S. EPA - Region 8 101 South Webster St.520 Lafayette Road N. Sciences 1200 Missouri Ave. 999 18th St. Box 7921St. Paul, MN 55115-4194 Water Quality Division Box 5520 Denver, CO 80202 Madision, WI 53707
Cogswell Building Bismarck, ND 58502Capital StationHelena, MT 59620-0901
Size Required Greater than Longer than Greater than Greater than Greater thanfor Permit 1,000 Animal Units 45 days confinement 200 Animal Units 1,000 Animal Units 1,000 Animal Units
Type of National Pollutant Montana Pollutant North Dakota State National Pollutant Wisconsin PollutantPermit Discharge Elimination Discharge Elimination Health Department Discharge Elimination Discharge Elimination
System System Permit System System
Lagoon Storage 25 year - 24 25 year - 24 25 year - 24 25 year - 24 25 year - 24Capacity hour storm event hour storm event hour storm event hour storm event hour storm event
Lagoon Seepage 1/16 inch/day 1/4 inch/day 1/8 inch/day 1/4 inch/day 1/16 inch/dayLimit
Siting Local Control Local Control Local Control Local Control Local ControlAuthority 1,000 ft. from
residence, 1/2mile from cities
Waste Crop Capacity Crop Capacity Crop Capacity 1,000 ft. from Contracted AreasManagement 200 ft. from wells public wells
150 ft. fromprivate wells
State Agricultural 1983 Right to Farm 1981 Right to Farm 1981 Right to Farm 1987 Right to Farm 1982 Right to FarmNuisance Law Restrictions Restrictions Restrictions Restrictions Agriculture is
Family farm Normal operation One year prior Prior operation exempt unlessSix year prior operation Prior operation Normal operation Reasonable expansion it is a threat
to health
increasingly stringent with regard to water pollution,runoff control, odor problems, and distance from thenearest human population. A number of states havebegun to inspect and re-license feedlots annually.
Community leaders interviewed believe feedlotdevelopment should occur, but only if its placementand attention to environmental issues are appropri-ately controlled by the government to protect othercommunity residents against water, dust, odorpollution, and flies. Except for instances in whicholder feedlots expanded and encroached onadjacent towns or residences, or towns and resi-dences encroached upon feedlots, the relationsbetween communities and the feedlots weregenerally harmonious.
In Kansas, both feedlot operators and communityresidents were strongly opposed to the introduction
Page 17
of large-size confinement hog production becauseof the perceived odor and pollution problems. Iowa,Nebraska, and South Dakota seemed to take a morebenign approach to both hog production and cattlefeedlots.
Water PermitsAll users of substantial amounts of well water are
required, in most states, to obtain water permits fromthe state. In North Dakota, any user of more than12.5 acre-feet per year is required to obtain a permitfrom the state engineer (North Dakota State WaterCommission). Any feedlot with over 600 head ofcattle on feed will utilize that amount of water. Thewater use permit requires information on the sourceof the water, where it will be used, what it will beused for, the withdrawal rate, the period of use, andother conditions required by the state engineer. Thestate engineer requires that all landowners withinone mile of the site be notified when a requiredpublic hearing is scheduled.
It is unlikely, however, that shortfall of water willseriously constrain feedlot development in the five-state study area. Ample water appears availableto support this development across most of thefive-state area.
Soil Grade, Type, and PermeabilitySoil grade, type, and permeability are major
factors in determining the appropriate siting of afeedlot. A natural grade which allows for surfacedrainage is needed to remove unwanted surfacewater from the feedlot. A natural grade of 2% to 3%is satisfactory to drain a feedlot without causingexcessive buildup of soil in the storage lagoon(Cook). Soil types vary from fine-textured soils(like clay) to sandy soils. Most states require that arecord of soil type underlying the proposed feedlotbe filed with a state office.
Feedlot Operational Issues
There is a trend for local governments to imposemore stringent pollution controls.
VI.Feedlot Operational Issues
Labor RequirementsThe team of workers for a feedlot are critically
important to its successful operation. Since success-ful feedlot operation requires careful attention toevery detail, skilled workers are indispensable.It would seem prudent to hire a manager withextensive and successful experience in operatinga large feedlot.
The duties of the manager consist of overseeingthe entire operation. The manager is expected toconduct business with creditors, customers, andthe board of directors. Buying and selling decisionsconcerning cattle, feed, and other inputs must bemade in a timely and responsible manner. Themanager is responsible for the oversight of person-nel in each area of operation. Future working andexpansion plans are to be developed and imple-mented. The manager needs to supervise theenvironmental protection plan of the feedlot.
The assistant manager is responsible for theday-to-day operation of the feedlot. This individualmaintains inventory of all needed supplies. Theassistant manager is responsible for managing thecattle, feed, and maintenance teams, developingnutrition programs and least-cost-rations, and over-seeing the cattle health and performance plans.
The secretary/accountant is responsible formaintaining personnel information and payroll. Thesecretary is to conduct receptionist, secretarial, andaccounting duties of the feedlot.
The head cow handler and assistants areresponsible for processing cattle upon arrival to thefeedlot. They need to check cattle daily, remove sickcattle to the hospital area, and treat cattle in thehospital. The daily operation of the handling facili-
Economic Reasibility of the Cattle Feeding Industry in the Northern Plains and Western Lakes States
Page 18
ties, the cleaning of pens, and the support of otherareas when needed are also required.
The duties of the feed team include operating andmaintaining the feed mill, delivering feed to bunks,conducting quality assurance of feed ingredients,and maintaining records of feeds received and fed.
The maintenance team is responsible for main-taining facilities and equipment as required, includ-ing feed yard maintenance and general repair ofmachinery and yard.
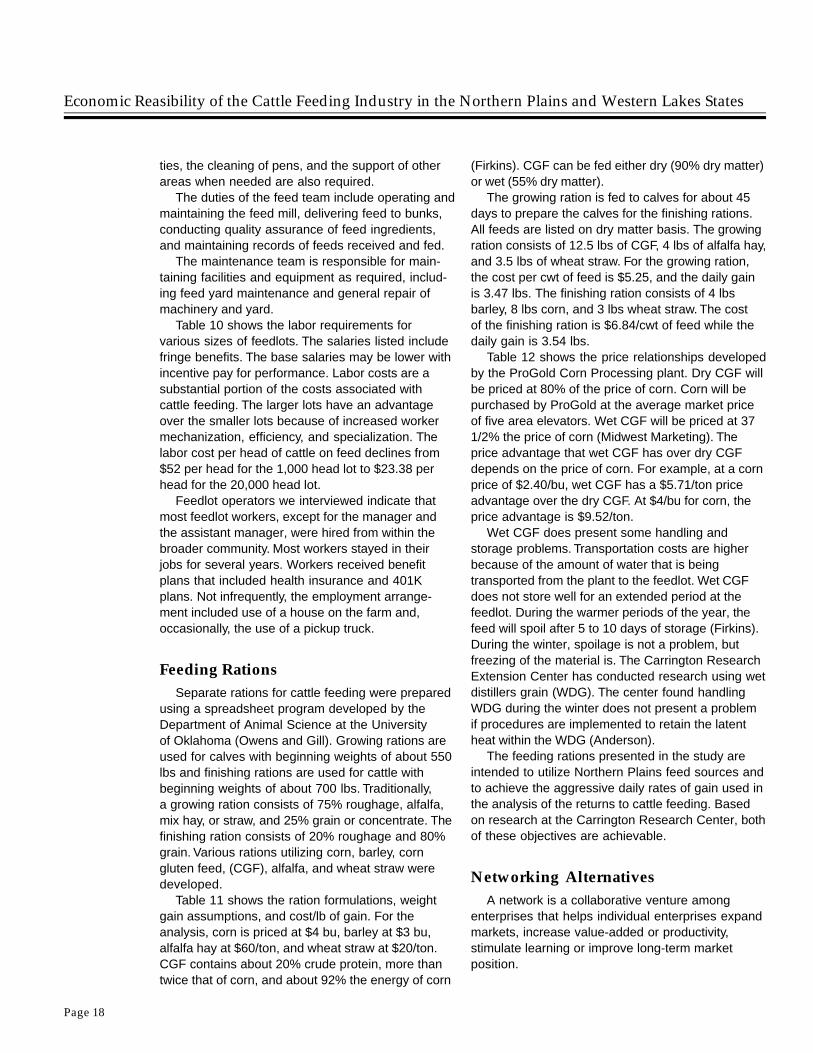
Table 10 shows the labor requirements forvarious sizes of feedlots. The salaries listed includefringe benefits. The base salaries may be lower withincentive pay for performance. Labor costs are asubstantial portion of the costs associated withcattle feeding. The larger lots have an advantageover the smaller lots because of increased workermechanization, efficiency, and specialization. Thelabor cost per head of cattle on feed declines from$52 per head for the 1,000 head lot to $23.38 perhead for the 20,000 head lot.
Feedlot operators we interviewed indicate thatmost feedlot workers, except for the manager andthe assistant manager, were hired from within thebroader community. Most workers stayed in theirjobs for several years. Workers received benefitplans that included health insurance and 401Kplans. Not infrequently, the employment arrange-ment included use of a house on the farm and,occasionally, the use of a pickup truck.
Feeding RationsSeparate rations for cattle feeding were prepared
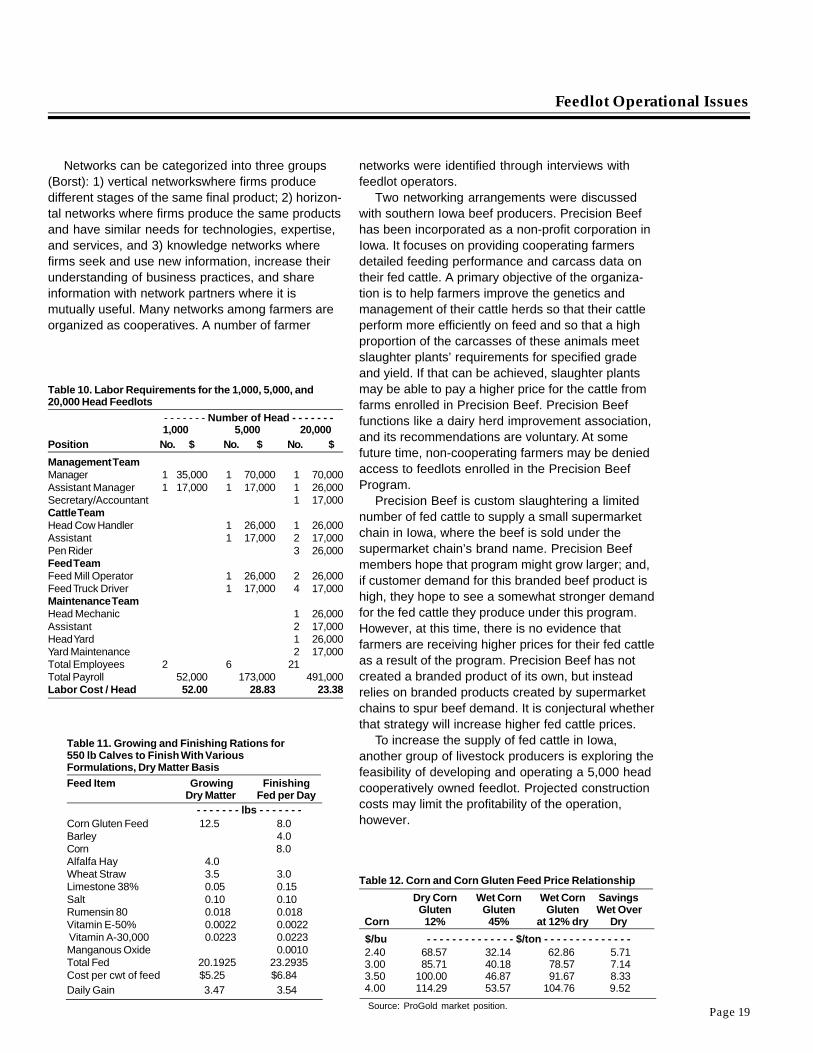
using a spreadsheet program developed by theDepartment of Animal Science at the Universityof Oklahoma (Owens and Gill). Growing rations areused for calves with beginning weights of about 550lbs and finishing rations are used for cattle withbeginning weights of about 700 lbs. Traditionally,a growing ration consists of 75% roughage, alfalfa,mix hay, or straw, and 25% grain or concentrate. Thefinishing ration consists of 20% roughage and 80%grain. Various rations utilizing corn, barley, corngluten feed, (CGF), alfalfa, and wheat straw weredeveloped.
Table 11 shows the ration formulations, weightgain assumptions, and cost/lb of gain. For theanalysis, corn is priced at $4 bu, barley at $3 bu,alfalfa hay at $60/ton, and wheat straw at $20/ton.CGF contains about 20% crude protein, more thantwice that of corn, and about 92% the energy of corn
(Firkins). CGF can be fed either dry (90% dry matter)or wet (55% dry matter).
The growing ration is fed to calves for about 45days to prepare the calves for the finishing rations.All feeds are listed on dry matter basis. The growingration consists of 12.5 lbs of CGF, 4 lbs of alfalfa hay,and 3.5 lbs of wheat straw. For the growing ration,the cost per cwt of feed is $5.25, and the daily gainis 3.47 lbs. The finishing ration consists of 4 lbsbarley, 8 lbs corn, and 3 lbs wheat straw. The costof the finishing ration is $6.84/cwt of feed while thedaily gain is 3.54 lbs.
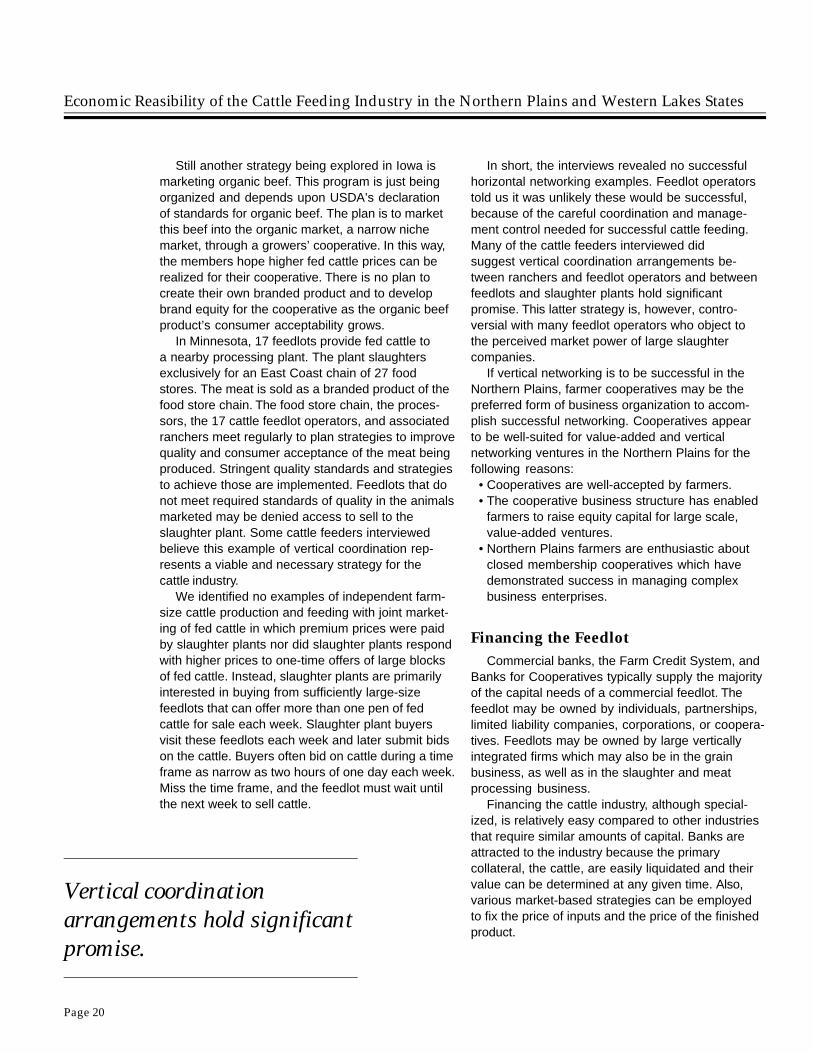
Table 12 shows the price relationships developedby the ProGold Corn Processing plant. Dry CGF willbe priced at 80% of the price of corn. Corn will bepurchased by ProGold at the average market priceof five area elevators. Wet CGF will be priced at 371/2% the price of corn (Midwest Marketing). Theprice advantage that wet CGF has over dry CGFdepends on the price of corn. For example, at a cornprice of $2.40/bu, wet CGF has a $5.71/ton priceadvantage over the dry CGF. At $4/bu for corn, theprice advantage is $9.52/ton.
Wet CGF does present some handling andstorage problems. Transportation costs are higherbecause of the amount of water that is beingtransported from the plant to the feedlot. Wet CGFdoes not store well for an extended period at thefeedlot. During the warmer periods of the year, thefeed will spoil after 5 to 10 days of storage (Firkins).During the winter, spoilage is not a problem, butfreezing of the material is. The Carrington ResearchExtension Center has conducted research using wetdistillers grain (WDG). The center found handlingWDG during the winter does not present a problemif procedures are implemented to retain the latentheat within the WDG (Anderson).
The feeding rations presented in the study areintended to utilize Northern Plains feed sources andto achieve the aggressive daily rates of gain used inthe analysis of the returns to cattle feeding. Basedon research at the Carrington Research Center, bothof these objectives are achievable.
Networking AlternativesA network is a collaborative venture among
enterprises that helps individual enterprises expandmarkets, increase value-added or productivity,stimulate learning or improve long-term marketposition.
Page 19
networks were identified through interviews withfeedlot operators.
Two networking arrangements were discussedwith southern Iowa beef producers. Precision Beefhas been incorporated as a non-profit corporation inIowa. It focuses on providing cooperating farmersdetailed feeding performance and carcass data ontheir fed cattle. A primary objective of the organiza-tion is to help farmers improve the genetics andmanagement of their cattle herds so that their cattleperform more efficiently on feed and so that a highproportion of the carcasses of these animals meetslaughter plants’ requirements for specified gradeand yield. If that can be achieved, slaughter plantsmay be able to pay a higher price for the cattle fromfarms enrolled in Precision Beef. Precision Beeffunctions like a dairy herd improvement association,and its recommendations are voluntary. At somefuture time, non-cooperating farmers may be deniedaccess to feedlots enrolled in the Precision BeefProgram.
Precision Beef is custom slaughtering a limitednumber of fed cattle to supply a small supermarketchain in Iowa, where the beef is sold under thesupermarket chain’s brand name. Precision Beefmembers hope that program might grow larger; and,if customer demand for this branded beef product ishigh, they hope to see a somewhat stronger demandfor the fed cattle they produce under this program.However, at this time, there is no evidence thatfarmers are receiving higher prices for their fed cattleas a result of the program. Precision Beef has notcreated a branded product of its own, but insteadrelies on branded products created by supermarketchains to spur beef demand. It is conjectural whetherthat strategy will increase higher fed cattle prices.
To increase the supply of fed cattle in Iowa,another group of livestock producers is exploring thefeasibility of developing and operating a 5,000 headcooperatively owned feedlot. Projected constructioncosts may limit the profitability of the operation,however.
Feedlot Operational Issues
Networks can be categorized into three groups(Borst): 1) vertical networkswhere firms producedifferent stages of the same final product; 2) horizon-tal networks where firms produce the same productsand have similar needs for technologies, expertise,and services, and 3) knowledge networks wherefirms seek and use new information, increase theirunderstanding of business practices, and shareinformation with network partners where it ismutually useful. Many networks among farmers areorganized as cooperatives. A number of farmer
Table 10. Labor Requirements for the 1,000, 5,000, and20,000 Head Feedlots
- - - - - - - Number of Head - - - - - - -1,000 5,000 20,000
Position No. $ No. $ No. $
Management TeamManager 1 35,000 1 70,000 1 70,000Assistant Manager 1 17,000 1 17,000 1 26,000Secretary/Accountant 1 17,000Cattle TeamHead Cow Handler 1 26,000 1 26,000Assistant 1 17,000 2 17,000Pen Rider 3 26,000Feed TeamFeed Mill Operator 1 26,000 2 26,000Feed Truck Driver 1 17,000 4 17,000Maintenance TeamHead Mechanic 1 26,000Assistant 2 17,000Head Yard 1 26,000Yard Maintenance 2 17,000Total Employees 2 6 21Total Payroll 52,000 173,000 491,000Labor Cost / Head 52.00 28.83 23.38
Table 11. Growing and Finishing Rations for550 lb Calves to Finish With VariousFormulations, Dry Matter Basis
Feed Item Growing FinishingDry Matter Fed per Day
- - - - - - - lbs - - - - - - -Corn Gluten Feed 12.5 8.0Barley 4.0Corn 8.0Alfalfa Hay 4.0Wheat Straw 3.5 3.0Limestone 38% 0.05 0.15Salt 0.10 0.10Rumensin 80 0.018 0.018Vitamin E-50% 0.0022 0.0022 Vitamin A-30,000 0.0223 0.0223Manganous Oxide 0.0010Total Fed 20.1925 23.2935Cost per cwt of feed $5.25 $6.84Daily Gain 3.47 3.54
Table 12. Corn and Corn Gluten Feed Price Relationship
Dry Corn Wet Corn Wet Corn SavingsGluten Gluten Gluten Wet Over
Corn 12% 45% at 12% dry Dry
$/bu - - - - - - - - - - - - - - $/ton - - - - - - - - - - - - - - 2.40 68.57 32.14 62.86 5.71 3.00 85.71 40.18 78.57 7.14 3.50 100.00 46.87 91.67 8.33 4.00 114.29 53.57 104.76 9.52
Source: ProGold market position.
Economic Reasibility of the Cattle Feeding Industry in the Northern Plains and Western Lakes States
Page 20
Still another strategy being explored in Iowa ismarketing organic beef. This program is just beingorganized and depends upon USDA’s declarationof standards for organic beef. The plan is to marketthis beef into the organic market, a narrow nichemarket, through a growers’ cooperative. In this way,the members hope higher fed cattle prices can berealized for their cooperative. There is no plan tocreate their own branded product and to developbrand equity for the cooperative as the organic beefproduct’s consumer acceptability grows.
In Minnesota, 17 feedlots provide fed cattle toa nearby processing plant. The plant slaughtersexclusively for an East Coast chain of 27 foodstores. The meat is sold as a branded product of thefood store chain. The food store chain, the proces-sors, the 17 cattle feedlot operators, and associatedranchers meet regularly to plan strategies to improvequality and consumer acceptance of the meat beingproduced. Stringent quality standards and strategiesto achieve those are implemented. Feedlots that donot meet required standards of quality in the animalsmarketed may be denied access to sell to theslaughter plant. Some cattle feeders interviewedbelieve this example of vertical coordination rep-resents a viable and necessary strategy for thecattle industry.
We identified no examples of independent farm-size cattle production and feeding with joint market-ing of fed cattle in which premium prices were paidby slaughter plants nor did slaughter plants respondwith higher prices to one-time offers of large blocksof fed cattle. Instead, slaughter plants are primarilyinterested in buying from sufficiently large-sizefeedlots that can offer more than one pen of fedcattle for sale each week. Slaughter plant buyersvisit these feedlots each week and later submit bidson the cattle. Buyers often bid on cattle during a timeframe as narrow as two hours of one day each week.Miss the time frame, and the feedlot must wait untilthe next week to sell cattle.
In short, the interviews revealed no successfulhorizontal networking examples. Feedlot operatorstold us it was unlikely these would be successful,because of the careful coordination and manage-ment control needed for successful cattle feeding.Many of the cattle feeders interviewed didsuggest vertical coordination arrangements be-tween ranchers and feedlot operators and betweenfeedlots and slaughter plants hold significantpromise. This latter strategy is, however, contro-versial with many feedlot operators who object tothe perceived market power of large slaughtercompanies.
If vertical networking is to be successful in theNorthern Plains, farmer cooperatives may be thepreferred form of business organization to accom-plish successful networking. Cooperatives appearto be well-suited for value-added and verticalnetworking ventures in the Northern Plains for thefollowing reasons:
• Cooperatives are well-accepted by farmers.• The cooperative business structure has enabled
farmers to raise equity capital for large scale,value-added ventures.
• Northern Plains farmers are enthusiastic aboutclosed membership cooperatives which havedemonstrated success in managing complexbusiness enterprises.
Financing the FeedlotCommercial banks, the Farm Credit System, and
Banks for Cooperatives typically supply the majorityof the capital needs of a commercial feedlot. Thefeedlot may be owned by individuals, partnerships,limited liability companies, corporations, or coopera-tives. Feedlots may be owned by large verticallyintegrated firms which may also be in the grainbusiness, as well as in the slaughter and meatprocessing business.
Financing the cattle industry, although special-ized, is relatively easy compared to other industriesthat require similar amounts of capital. Banks areattracted to the industry because the primarycollateral, the cattle, are easily liquidated and theirvalue can be determined at any given time. Also,various market-based strategies can be employedto fix the price of inputs and the price of the finishedproduct.
Vertical coordinationarrangements hold significantpromise.
Page 21
Financing for fixed investment in feedlots is,however, more difficult to acquire, since feedlotshave specialized uses and are not readily convertedto other uses. The cattle feedlot operators inter-viewed indicate that they prefer to maintain $2 ofequity in the business for each $1 of debt. Most ofthese operators have built equity into their businessover an extended period.
Financing the feedlot industry can be divided intotwo areas: term loans for financing of the facilitiesand the loans for operating capital. Term loans forthe construction of facilities usually have maturitiesof 15 to 20 years. The amount loaned as a percentof the construction and development cost dependson several factors. Two of the most important factorsare 1) the profitability of the industry at the timethe financing is arranged and 2) the managementexperience of the ownership group in the cattleindustry (Cook, J.R.).
The Saint Paul Bank for Cooperatives indicatedit can lend feedlot developers up to 50% of the costof the feedlot and of the funding needed for feedlotoperation. That implies a substantial amount ofequity capital that would be required for a newfeedlot.
Feedlot operators and lenders revealed duringthe interviews that most cattle on feed are ownedby persons other than the owners of the feedlot.Custom feeding represents an important riskminimization strategy by feedlot operators. Forexample, we were told that about 70% of the cattlefed in southwest Kansas were owned by personsoutside Kansas.
VII.Feeding Profitability
This section discusses the profitability of cattlefeeding under three assumptions about fed cattleprices and three corn price levels. The profitabilityis evaluated under different feedlot sizes, feedingcattle to slaughter weights as compared tobackgrounding cattle, and feeding dairy calves.While other combinations of cattle and feed pricescould be considered and other feedlot sizes evalu-ated, the examples presented here provide anevaluation of cattle feeding under the most likelyprice scenarios for feed grains and fed cattle.
Return to Equity and RiskThe return to equity and risk was calculated using
three prices for corn, $3, $2.50, and $2 per bushelsand three prices for fed cattle, $65, $70, and $75per cwt. Owner equity in the feedlot, equipment andcattle is assumed to be 50%. The interest rate forlong- and intermediate-term debt is 10%. Theinterest rate for the purchase of cattle is 10.5%.These interest rates are similar to those charged bybanks and FCS associations. Depreciation costs arecalculated using the projected life for the feedlot andequipment. It is assumed that in one year a 550-lbfeeder would be fed a growing ration and a finishingration, sold at 1,200 lbs, and then replaced withanother 700-lb feeder that also would be finishedand sold at 1,200 lbs.
Average daily weight gain for cattle on feed is3.47 lbs for growing and 3.59 lbs for finishing. Therates of gain are aggressive and would requireexcellent management to achieve. However,research at the Carrington Research Center indi-cates such gains are achievable. The CooperativeExtension Service at North Dakota State Universitynoted that North Dakota cattle feeders obtain ratesof gain ranging from 3.2 to 3.3 lbs per day. Deathloss was assumed to be 1.5%, and shippingshrinkage would be 5%.
Table 13 shows the return to equity and risk,when assuming transportation distance of 100 milesto ship calves and feeders into the feedlot and 150miles to ship fed cattle to a local slaughter plant or340 miles to a slaughter plant in Dakota City,
Feedlot Operational Issues
Substantial amount ofequity capital
would be requiredfor a new feedlot.
Economic Reasibility of the Cattle Feeding Industry in the Northern Plains and Western Lakes States
Page 22
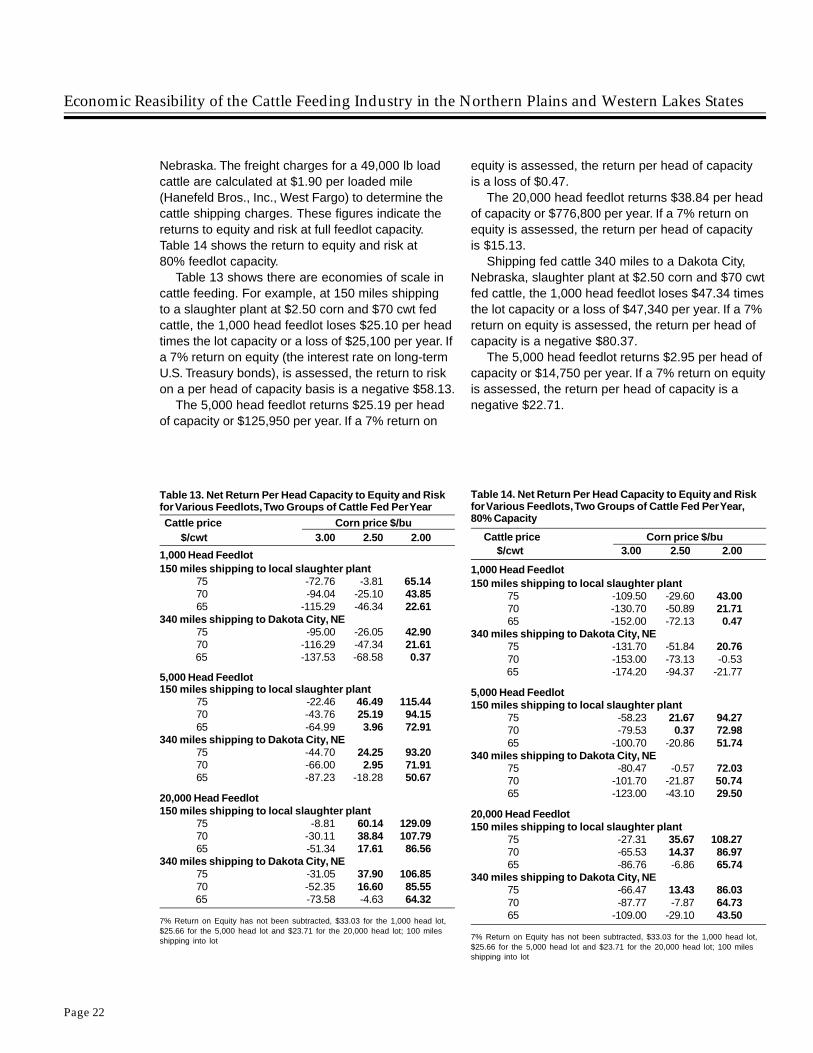
Nebraska. The freight charges for a 49,000 lb loadcattle are calculated at $1.90 per loaded mile(Hanefeld Bros., Inc., West Fargo) to determine thecattle shipping charges. These figures indicate thereturns to equity and risk at full feedlot capacity.Table 14 shows the return to equity and risk at80% feedlot capacity.
Table 13 shows there are economies of scale incattle feeding. For example, at 150 miles shippingto a slaughter plant at $2.50 corn and $70 cwt fedcattle, the 1,000 head feedlot loses $25.10 per headtimes the lot capacity or a loss of $25,100 per year. Ifa 7% return on equity (the interest rate on long-termU.S. Treasury bonds), is assessed, the return to riskon a per head of capacity basis is a negative $58.13.
The 5,000 head feedlot returns $25.19 per headof capacity or $125,950 per year. If a 7% return on
equity is assessed, the return per head of capacityis a loss of $0.47.
The 20,000 head feedlot returns $38.84 per headof capacity or $776,800 per year. If a 7% return onequity is assessed, the return per head of capacityis $15.13.
Shipping fed cattle 340 miles to a Dakota City,Nebraska, slaughter plant at $2.50 corn and $70 cwtfed cattle, the 1,000 head feedlot loses $47.34 timesthe lot capacity or a loss of $47,340 per year. If a 7%return on equity is assessed, the return per head ofcapacity is a negative $80.37.
The 5,000 head feedlot returns $2.95 per head ofcapacity or $14,750 per year. If a 7% return on equityis assessed, the return per head of capacity is anegative $22.71.
Table 14. Net Return Per Head Capacity to Equity and Riskfor Various Feedlots, Two Groups of Cattle Fed Per Year,80% Capacity
Cattle price Corn price $/bu $/cwt 3.00 2.50 2.00
1,000 Head Feedlot150 miles shipping to local slaughter plant
75 -109.50 -29.60 43.0070 -130.70 -50.89 21.7165 -152.00 -72.13 0.47
340 miles shipping to Dakota City, NE75 -131.70 -51.84 20.7670 -153.00 -73.13 -0.53
65 -174.20 -94.37 -21.77
5,000 Head Feedlot150 miles shipping to local slaughter plant
75 -58.23 21.67 94.2770 -79.53 0.37 72.9865 -100.70 -20.86 51.74
340 miles shipping to Dakota City, NE75 -80.47 -0.57 72.0370 -101.70 -21.87 50.7465 -123.00 -43.10 29.50
20,000 Head Feedlot150 miles shipping to local slaughter plant
75 -27.31 35.67 108.2770 -65.53 14.37 86.9765 -86.76 -6.86 65.74
340 miles shipping to Dakota City, NE75 -66.47 13.43 86.0370 -87.77 -7.87 64.7365 -109.00 -29.10 43.50
7% Return on Equity has not been subtracted, $33.03 for the 1,000 head lot,$25.66 for the 5,000 head lot and $23.71 for the 20,000 head lot; 100 milesshipping into lot
Table 13. Net Return Per Head Capacity to Equity and Riskfor Various Feedlots, Two Groups of Cattle Fed Per Year
Cattle price Corn price $/bu $/cwt 3.00 2.50 2.00
1,000 Head Feedlot150 miles shipping to local slaughter plant
75 -72.76 -3.81 65.1470 -94.04 -25.10 43.8565 -115.29 -46.34 22.61
340 miles shipping to Dakota City, NE75 -95.00 -26.05 42.9070 -116.29 -47.34 21.61
65 -137.53 -68.58 0.37
5,000 Head Feedlot150 miles shipping to local slaughter plant
75 -22.46 46.49 115.4470 -43.76 25.19 94.1565 -64.99 3.96 72.91
340 miles shipping to Dakota City, NE75 -44.70 24.25 93.2070 -66.00 2.95 71.9165 -87.23 -18.28 50.67
20,000 Head Feedlot150 miles shipping to local slaughter plant
75 -8.81 60.14 129.0970 -30.11 38.84 107.7965 -51.34 17.61 86.56
340 miles shipping to Dakota City, NE75 -31.05 37.90 106.8570 -52.35 16.60 85.55
65 -73.58 -4.63 64.32
7% Return on Equity has not been subtracted, $33.03 for the 1,000 head lot,$25.66 for the 5,000 head lot and $23.71 for the 20,000 head lot; 100 milesshipping into lot
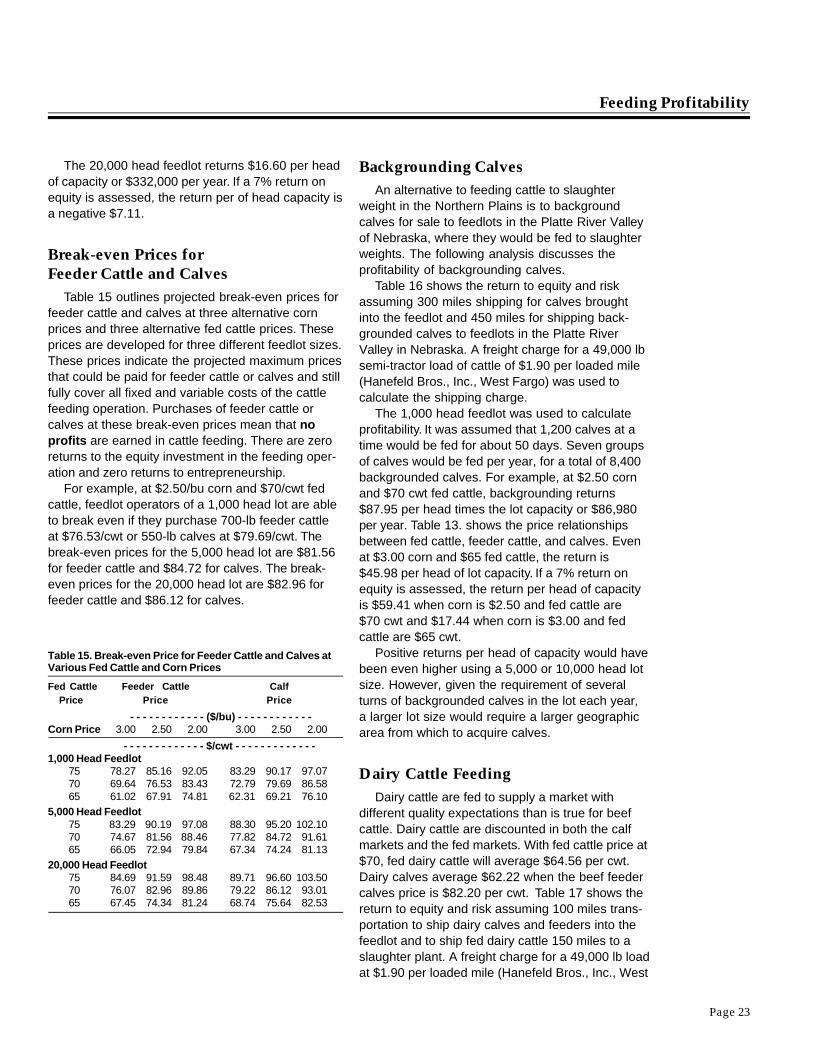
Page 23
The 20,000 head feedlot returns $16.60 per headof capacity or $332,000 per year. If a 7% return onequity is assessed, the return per of head capacity isa negative $7.11.
Break-even Prices forFeeder Cattle and Calves
Table 15 outlines projected break-even prices forfeeder cattle and calves at three alternative cornprices and three alternative fed cattle prices. Theseprices are developed for three different feedlot sizes.These prices indicate the projected maximum pricesthat could be paid for feeder cattle or calves and stillfully cover all fixed and variable costs of the cattlefeeding operation. Purchases of feeder cattle orcalves at these break-even prices mean that noprofits are earned in cattle feeding. There are zeroreturns to the equity investment in the feeding oper-ation and zero returns to entrepreneurship.
For example, at $2.50/bu corn and $70/cwt fedcattle, feedlot operators of a 1,000 head lot are ableto break even if they purchase 700-lb feeder cattleat $76.53/cwt or 550-lb calves at $79.69/cwt. Thebreak-even prices for the 5,000 head lot are $81.56for feeder cattle and $84.72 for calves. The break-even prices for the 20,000 head lot are $82.96 forfeeder cattle and $86.12 for calves.
Backgrounding CalvesAn alternative to feeding cattle to slaughter
weight in the Northern Plains is to backgroundcalves for sale to feedlots in the Platte River Valleyof Nebraska, where they would be fed to slaughterweights. The following analysis discusses theprofitability of backgrounding calves.
Table 16 shows the return to equity and riskassuming 300 miles shipping for calves broughtinto the feedlot and 450 miles for shipping back-grounded calves to feedlots in the Platte RiverValley in Nebraska. A freight charge for a 49,000 lbsemi-tractor load of cattle of $1.90 per loaded mile(Hanefeld Bros., Inc., West Fargo) was used tocalculate the shipping charge.
The 1,000 head feedlot was used to calculateprofitability. It was assumed that 1,200 calves at atime would be fed for about 50 days. Seven groupsof calves would be fed per year, for a total of 8,400backgrounded calves. For example, at $2.50 cornand $70 cwt fed cattle, backgrounding returns$87.95 per head times the lot capacity or $86,980per year. Table 13. shows the price relationshipsbetween fed cattle, feeder cattle, and calves. Evenat $3.00 corn and $65 fed cattle, the return is$45.98 per head of lot capacity. If a 7% return onequity is assessed, the return per head of capacityis $59.41 when corn is $2.50 and fed cattle are$70 cwt and $17.44 when corn is $3.00 and fedcattle are $65 cwt.
Positive returns per head of capacity would havebeen even higher using a 5,000 or 10,000 head lotsize. However, given the requirement of severalturns of backgrounded calves in the lot each year,a larger lot size would require a larger geographicarea from which to acquire calves.
Dairy Cattle FeedingDairy cattle are fed to supply a market with
different quality expectations than is true for beefcattle. Dairy cattle are discounted in both the calfmarkets and the fed markets. With fed cattle price at$70, fed dairy cattle will average $64.56 per cwt.Dairy calves average $62.22 when the beef feedercalves price is $82.20 per cwt. Table 17 shows thereturn to equity and risk assuming 100 miles trans-portation to ship dairy calves and feeders into thefeedlot and to ship fed dairy cattle 150 miles to aslaughter plant. A freight charge for a 49,000 lb loadat $1.90 per loaded mile (Hanefeld Bros., Inc., West
Feeding Profitability
Table 15. Break-even Price for Feeder Cattle and Calves atVarious Fed Cattle and Corn Prices
Fed Cattle Feeder Cattle Calf Price Price Price
- - - - - - - - - - - - ($/bu) - - - - - - - - - - - -Corn Price 3.00 2.50 2.00 3.00 2.50 2.00
- - - - - - - - - - - - - $/cwt - - - - - - - - - - - - -1,000 Head Feedlot
75 78.27 85.16 92.05 83.29 90.17 97.0770 69.64 76.53 83.43 72.79 79.69 86.5865 61.02 67.91 74.81 62.31 69.21 76.10
5,000 Head Feedlot75 83.29 90.19 97.08 88.30 95.20 102.1070 74.67 81.56 88.46 77.82 84.72 91.6165 66.05 72.94 79.84 67.34 74.24 81.13
20,000 Head Feedlot75 84.69 91.59 98.48 89.71 96.60 103.5070 76.07 82.96 89.86 79.22 86.12 93.0165 67.45 74.34 81.24 68.74 75.64 82.53
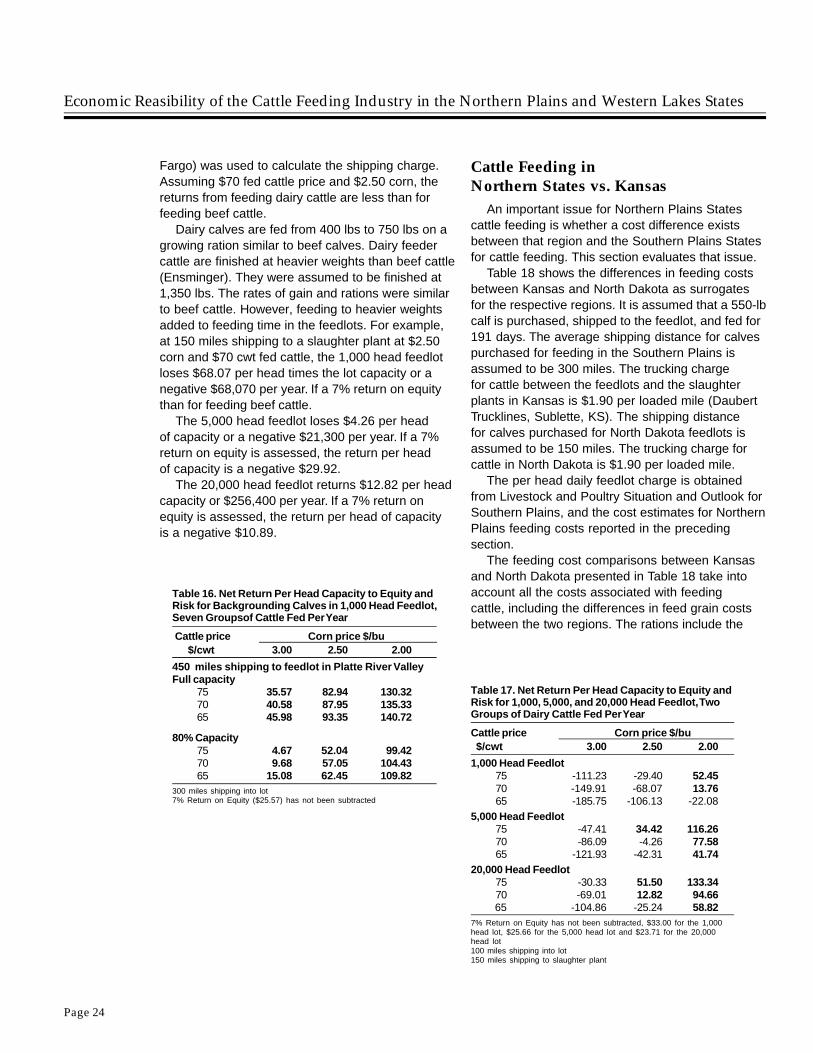
Economic Reasibility of the Cattle Feeding Industry in the Northern Plains and Western Lakes States
Page 24
Fargo) was used to calculate the shipping charge.Assuming $70 fed cattle price and $2.50 corn, thereturns from feeding dairy cattle are less than forfeeding beef cattle.
Dairy calves are fed from 400 lbs to 750 lbs on agrowing ration similar to beef calves. Dairy feedercattle are finished at heavier weights than beef cattle(Ensminger). They were assumed to be finished at1,350 lbs. The rates of gain and rations were similarto beef cattle. However, feeding to heavier weightsadded to feeding time in the feedlots. For example,at 150 miles shipping to a slaughter plant at $2.50corn and $70 cwt fed cattle, the 1,000 head feedlotloses $68.07 per head times the lot capacity or anegative $68,070 per year. If a 7% return on equitythan for feeding beef cattle.
The 5,000 head feedlot loses $4.26 per headof capacity or a negative $21,300 per year. If a 7%return on equity is assessed, the return per headof capacity is a negative $29.92.
The 20,000 head feedlot returns $12.82 per headcapacity or $256,400 per year. If a 7% return onequity is assessed, the return per head of capacityis a negative $10.89.
Cattle Feeding inNorthern States vs. Kansas
An important issue for Northern Plains Statescattle feeding is whether a cost difference existsbetween that region and the Southern Plains Statesfor cattle feeding. This section evaluates that issue.
Table 18 shows the differences in feeding costsbetween Kansas and North Dakota as surrogatesfor the respective regions. It is assumed that a 550-lbcalf is purchased, shipped to the feedlot, and fed for191 days. The average shipping distance for calvespurchased for feeding in the Southern Plains isassumed to be 300 miles. The trucking chargefor cattle between the feedlots and the slaughterplants in Kansas is $1.90 per loaded mile (DaubertTrucklines, Sublette, KS). The shipping distancefor calves purchased for North Dakota feedlots isassumed to be 150 miles. The trucking charge forcattle in North Dakota is $1.90 per loaded mile.
The per head daily feedlot charge is obtainedfrom Livestock and Poultry Situation and Outlook forSouthern Plains, and the cost estimates for NorthernPlains feeding costs reported in the precedingsection.
The feeding cost comparisons between Kansasand North Dakota presented in Table 18 take intoaccount all the costs associated with feedingcattle, including the differences in feed grain costsbetween the two regions. The rations include the
Table 16. Net Return Per Head Capacity to Equity andRisk for Backgrounding Calves in 1,000 Head Feedlot,Seven Groupsof Cattle Fed Per Year
Cattle price Corn price $/bu $/cwt 3.00 2.50 2.00
450 miles shipping to feedlot in Platte River ValleyFull capacity
75 35.57 82.94 130.3270 40.58 87.95 135.3365 45.98 93.35 140.72
80% Capacity75 4.67 52.04 99.4270 9.68 57.05 104.4365 15.08 62.45 109.82
300 miles shipping into lot7% Return on Equity ($25.57) has not been subtracted
Table 17. Net Return Per Head Capacity to Equity andRisk for 1,000, 5,000, and 20,000 Head Feedlot, TwoGroups of Dairy Cattle Fed Per Year
Cattle price Corn price $/bu $/cwt 3.00 2.50 2.00
1,000 Head Feedlot75 -111.23 -29.40 52.4570 -149.91 -68.07 13.7665 -185.75 -106.13 -22.08
5,000 Head Feedlot75 -47.41 34.42 116.2670 -86.09 -4.26 77.5865 -121.93 -42.31 41.74
20,000 Head Feedlot75 -30.33 51.50 133.3470 -69.01 12.82 94.66
65 -104.86 -25.24 58.827% Return on Equity has not been subtracted, $33.00 for the 1,000head lot, $25.66 for the 5,000 head lot and $23.71 for the 20,000head lot100 miles shipping into lot150 miles shipping to slaughter plant
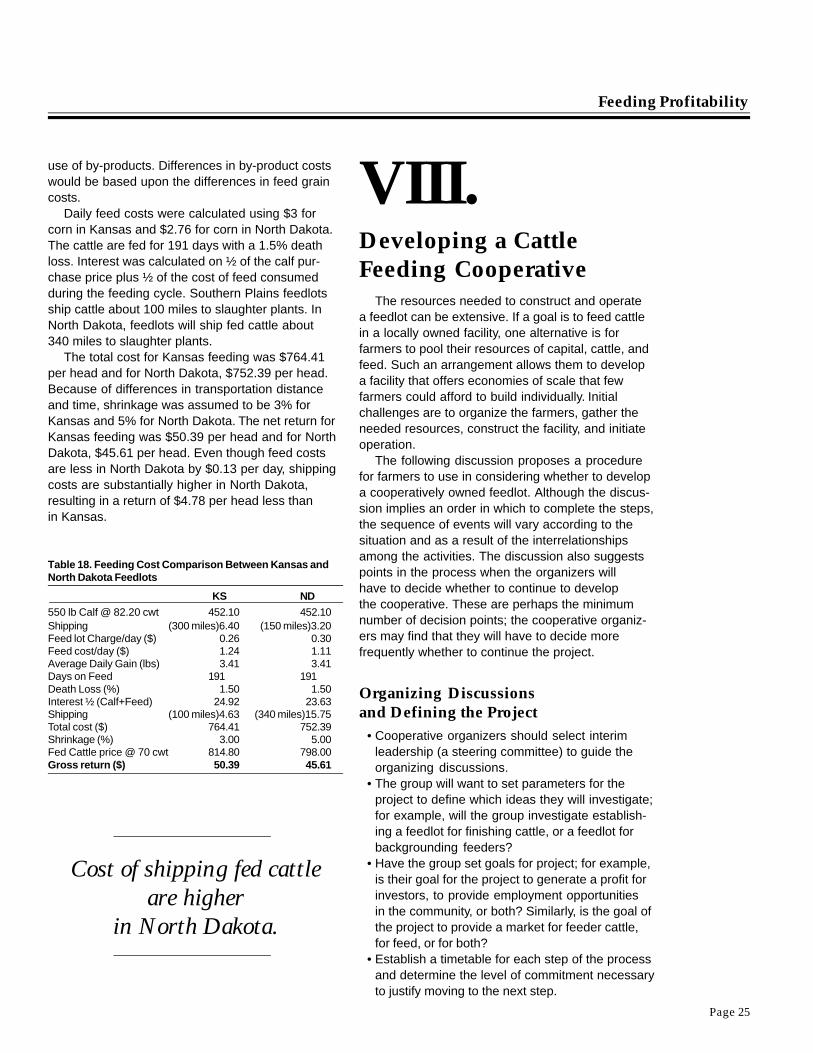
Page 25
use of by-products. Differences in by-product costswould be based upon the differences in feed graincosts.
Daily feed costs were calculated using $3 forcorn in Kansas and $2.76 for corn in North Dakota.The cattle are fed for 191 days with a 1.5% deathloss. Interest was calculated on ½ of the calf pur-chase price plus ½ of the cost of feed consumedduring the feeding cycle. Southern Plains feedlotsship cattle about 100 miles to slaughter plants. InNorth Dakota, feedlots will ship fed cattle about340 miles to slaughter plants.
The total cost for Kansas feeding was $764.41per head and for North Dakota, $752.39 per head.Because of differences in transportation distanceand time, shrinkage was assumed to be 3% forKansas and 5% for North Dakota. The net return forKansas feeding was $50.39 per head and for NorthDakota, $45.61 per head. Even though feed costsare less in North Dakota by $0.13 per day, shippingcosts are substantially higher in North Dakota,resulting in a return of $4.78 per head less thanin Kansas.
VIII.Developing a CattleFeeding Cooperative
The resources needed to construct and operatea feedlot can be extensive. If a goal is to feed cattlein a locally owned facility, one alternative is forfarmers to pool their resources of capital, cattle, andfeed. Such an arrangement allows them to developa facility that offers economies of scale that fewfarmers could afford to build individually. Initialchallenges are to organize the farmers, gather theneeded resources, construct the facility, and initiateoperation.
The following discussion proposes a procedurefor farmers to use in considering whether to developa cooperatively owned feedlot. Although the discus-sion implies an order in which to complete the steps,the sequence of events will vary according to thesituation and as a result of the interrelationshipsamong the activities. The discussion also suggestspoints in the process when the organizers willhave to decide whether to continue to developthe cooperative. These are perhaps the minimumnumber of decision points; the cooperative organiz-ers may find that they will have to decide morefrequently whether to continue the project.
Organizing Discussionsand Defining the Project
• Cooperative organizers should select interimleadership (a steering committee) to guide theorganizing discussions.
• The group will want to set parameters for theproject to define which ideas they will investigate;for example, will the group investigate establish-ing a feedlot for finishing cattle, or a feedlot forbackgrounding feeders?
• Have the group set goals for project; for example,is their goal for the project to generate a profit forinvestors, to provide employment opportunitiesin the community, or both? Similarly, is the goal ofthe project to provide a market for feeder cattle,for feed, or for both?
• Establish a timetable for each step of the processand determine the level of commitment necessaryto justify moving to the next step.
Feeding Profitability
Table 18. Feeding Cost Comparison Between Kansas andNorth Dakota Feedlots
KS ND
550 lb Calf @ 82.20 cwt 452.10 452.10Shipping (300 miles)6.40 (150 miles)3.20Feed lot Charge/day ($) 0.26 0.30Feed cost/day ($) 1.24 1.11Average Daily Gain (lbs) 3.41 3.41Days on Feed 191 191Death Loss (%) 1.50 1.50Interest ½ (Calf+Feed) 24.92 23.63Shipping (100 miles)4.63 (340 miles)15.75Total cost ($) 764.41 752.39Shrinkage (%) 3.00 5.00Fed Cattle price @ 70 cwt 814.80 798.00Gross return ($) 50.39 45.61
Cost of shipping fed cattleare higher
in North Dakota.
Economic Reasibility of the Cattle Feeding Industry in the Northern Plains and Western Lakes States
Page 26
• Discuss how much the organizers are willing toinvest in studying the opportunity, if and how theywill receive a return on that investment if thecooperative does become operational, whetherthere are sources of “seed money” for the studyphase, and who will apply for that assistance.
Initial Feasibility AssessmentConduct a “windshield” assessment of the
project, informally gather information and surveyinterests without much public exposure.
• Market for Fed or Backgrounded Cattle. Visitwith potential buyers to ascertain their reactionsand interests when investigating the market forbackgrounded cattle or fed cattle; are therefinishing feedlots for backgrounded cattle, arethere nearby slaughter plants for fed cattle? Arethere retail outlets interested in establishing arelationship with a feedlot and packer?
• Availability of Inputs. Visit with potential suppliersto ascertain their reactions and interests, anddetermine availability of feeder cattle andfeedstuffs with which to feed the cattle. Are thereranchers or feed producers who are interested ina working relationship with a feedlot? This stepmay include a survey of producers. The surveymay request information on the amount of equityinvestment that farmers would be willing to makein such a cooperative.
• Availability of Workers. The group may find that itwill need to hire an experienced feedlot managerfrom another region. The group may also need toretain a nutritionist on a consulting basis. Theseindividuals do not need to be hired or retained atthis time; but the group may find it will have toattract key individuals from outside the region.
• Location. Consider the location of the proposedfeedlot relative to feeder cattle, feedstuffs, andslaughter plants in order for a proposed feedlotto have a realistic potential for profitability.
• Size of Operation. What are the alternative sizesof operation for the feedlots? Which size feedlotoffers the best economies of scale? What is theminimum size necessary to earn an acceptablerate of return? At what size are diseconomiesof scale likely to be experienced? What size ofoperation are the communities and permittingagencies willing to accept?
• Capital Needs. Is the necessary capital avail-able? Determine the investment required todevelop/construct and operate the desired sizeof feedlot.
• Organizational Structure. Who will be eligible formembership in the cooperative; that is, who willbe the investors? What will be the minimum andmaximum investment? Will they be cattle produc-ers, feed producers, or both? The organizerswill need to decide whether a closed or an openmembership cooperative will be proposed toinvestors. These decisions should reflect thegroup’s goals.
Decision 1Does the preliminary information justify a deci-
sion to continue to study the project by completinga formal feasibility assessment? Has an adequategeneral description of the project been developedso a detailed study can proceed? What is thegeneral description of the project? Will it finish cattleor background them? What will be the feedlot’s sizeof operation?
Are producers willing to work together? Will theysupport the cooperative after it begins operating?These questions likely will be discussed andanswered at a meeting of the organizers.
Detailed Feasibility StudyWith this preliminary set of information, the group
is ready to complete a formal feasibility study todetermine profitability and feasibility (cash flow).This study will include market and financialanalyses. A thorough market analysis is critical fornew businesses. The feasibility study must be doneby an unbiased company, persons, or group; or itmust be reviewed by an unbiased source.
The group likely will consider retaining a consult-ant to assist in the market and financial analyses.
• Finalize Business Plan. Develop a formalbusiness plan to accompany disclosures, permitapplications, and loan applications. Finalizingthe business plan will require that the organizersresolve questions similar to those describedbelow:
Organizers should determine whether all cattlefed in the cooperative feedlot will be owned bythe feedlot, or whether the feedlot also will feedcattle owned by stockholders in the feedlot.Organizers should decide whether any customfeeding of cattle will be undertaken for farmers orlivestock investors who are not stockholders inthe cooperative. Feeder cattle will be required bythe feedlot on as frequent as a weekly scheduleand on no less than a monthly schedule. Feeding
Page 27
to finish in the lot would require two turns of cattleper year, while backgrounding would requireabout seven turns of cattle per year. Thus, thebusiness plan should clarify that potential stock-holders may need to adopt new managementpractices on their own ranches, including stag-gered calving times across the year, to assurethat they will be able to supply the necessarycalves and feeder cattle to the cooperativefeedlot.
The method of determining value of feeder cattlepurchased by the feedlot from its stockholdersmust be agreed upon and explained; for example,cattle could be priced by an outside order buyeror by an order buyer employed by the feedlot.
Marketing strategies for fed cattle sales must bedeveloped. Will fed cattle be marketed to a singleslaughter plant, based on preferred supplierarrangements with the packer, or will fed cattlebe marketed to whomever provides the highestbid when the cattle are ready for sale?
The par value of equity stock shares must bedetermined, along with a definition of the inves-tors’ obligations to supply cattle or feed to thefeedlot.
Decision 2Does the project appear feasible? If the project
appears to be reasonable, the next step is to revisitmany of the same issues in more depth and toconstruct the feedlot. This will involve organizingthe cooperative, arranging equity and debt capital,completing detailed studies of potential sites,acquiring the selected site, applying for necessarypermits, constructing the facility, negotiating withsuppliers and buyers, and hiring employees.
Capitalization PhaseThe group is now ready, based on the business
plan, to develop necessary documentation of theproject to prepare an information package forpotential investors and for lenders. Based uponthe success of this phase, the project can eithermove forward to the construction phase, berethought, or abandoned.
• Retain professionals necessary to complete theproject; for example, an attorney, constructionengineer, and financial/business planner.
• Form the Cooperative. An attorney skilled information of cooperatives should be employedto assist in setting up and organizing a board ofdirectors for the prospective cooperative, todevelop the cooperative feedlot informationpackages for potential investors, to attend toneeded legal requirements associated withmarketing the cooperative proposal, and tonegotiate loan agreements, siting permits,construction contracts, and trademark registra-tion. A financial advisor should also be employedto assure that business reality is reflected inthe information packages provided potentialinvestors.
• Financing. Formal documentation for the stockoffering and loan applications will need to becompleted; some of this will have already beendeveloped as part of the business plan.
Solicit equity investors. Potential farmer equityinvestors in the feedlot must be identified. Aseries of informational and sign-up meetingsshould be held to discuss the proposal and to sellshares in the cooperative. Provision for returningmoney invested must be clearly indicated if themembership target is not met within a specifiedtime period.
Negotiate for debt capital. As stock sales meetspecified levels, discussions should proceedwith potential lenders regarding loan amounts,covenants, maturity, and price. Lenders will likelyspecify a level of equity for the individual inves-tors before they will consider the loan application.
Organizers should also investigate state andlocal economic development assistance alterna-tives that could be included in a debt capitalpackage. Some assistance packages may alsoinclude contributions to the required equity levels.
Decision 3Can the project be capitalized?
If the project organizers have been successfulin obtaining the necessary equity capital, and iflenders have given approval to the necessary loansto provide debt capital, the project is ready toproceed to the construction phase. Alternatively, ifeither equity capital or debt capital has not beensecured, project organizers must re-evaluate theproject proposal. The proposal must be adapted tofit available capital, postponed, or abandoned.
The permanent CEO should be recruited and inplace before the start of the construction phase.
Developing a Cattle Feeding Cooperative
Economic Reasibility of the Cattle Feeding Industry in the Northern Plains and Western Lakes States
Page 28
Construction Phase• Location. A specific site for the proposed feedlot
should be identified and purchase optionssecured on the land necessary for the feedlot.
• Business Contracts. The cooperative’s manage-ment will want to negotiate necessary contractswith input suppliers and product buyers. Acontract will not be needed for all suppliers andbuyers; the primary focus may be on those firmswhose long-term commitment is critical to thesuccess of the cooperative. The negotiations arean opportunity for the group to help suppliersunderstand how the suppliers can meet theneeds of the cooperative.
• Construction Design. An engineer, along with theCEO or production committee, will study selectedsites and design a feedlot facility.
• Prepare to Operate. The CEO will developdelivery schedules for feeder cattle and informshareholders in preparation for feedlot start-up.
Questions Investors Should ConsiderIn addition to the steps outlined above, farmers
and ranchers interested in forming a cooperativefeedlot also should ask at least five questionsregarding the impact of that investment on theirown farm and ranch businesses. The following fivequestions are from a July 1996 publication, FiveQuestions to Ask Before Joining a New ProcessingCooperative, of the Quentin Burdick Center forCooperatives at North Dakota State University.The questions are as follows:
What are the potential returns from cooperativemembership?
What risks is the cooperative business exposed to?
How will cooperative membership influence yourfarm/ranch operation? Will the business riskyou experience in your farm/ranch increase ordecrease? Will your farm or ranch business bejeopardized if you lose your investment in thecooperative?
How will your lender view the cooperativeinvestment?
How will cooperative membership impact yourpersonal or business goals?
IX.Community Impacts
The impacts of developing and operating afeedlot are not limited to the feedlot owners, thelivestock owners, and the firms which conductbusiness with the feedlot. The operation of a feedlotis likely to affect the community and surroundingareas. For example, operating a feedlot requiressubstantial truck traffic to haul the livestock to andfrom the feedlot, as well as to haul feed to the siteand move waste to a disposal area. This additionaltraffic impacts others working and living in thecommunity.
The focus of this section is on how communitiesnear feedlots are impacted by cattle feeding. Theinformation in this section is primarily based onresults of a survey of feedlot operators, businesspeople, and community leaders. This survey focusedon areas of the Great Plains and Middle West wherecattle are being fed. These areas included south-western Kansas, the Platte River Valley of Ne-braska, southern Iowa, southwestern Minnesota,and eastern South Dakota. Some of the personsinterviewed were from communities that have bothcattle feeding and slaughter plant activities. Someof their responses emphasized the impacts ofslaughter plants, rather than feeding, because theyfelt the slaughter plant had a more substantial effecton the community than the feeding activities.
Local Economic Impact of CattleFeeding
It is often assumed that cattle feeding will have amajor economic impact on the community in whichit occurs. A major source of overestimation occurswhen the sale of locally produced feeder calves andfeed grains is attributed to the feedlot. In fact, thefeeder calves and feed grain would be sold atprevailing market prices with or without the feedlotbeing present.
Nonetheless, there is some modest additionalcommunity economic impact. Table 19 shows thedirect economic impact of the construction of a20,000 head feedlot. Purchases of labor, materialand supplies, and building and equipment availablelocally amount to $3.79 million, of a total construc-
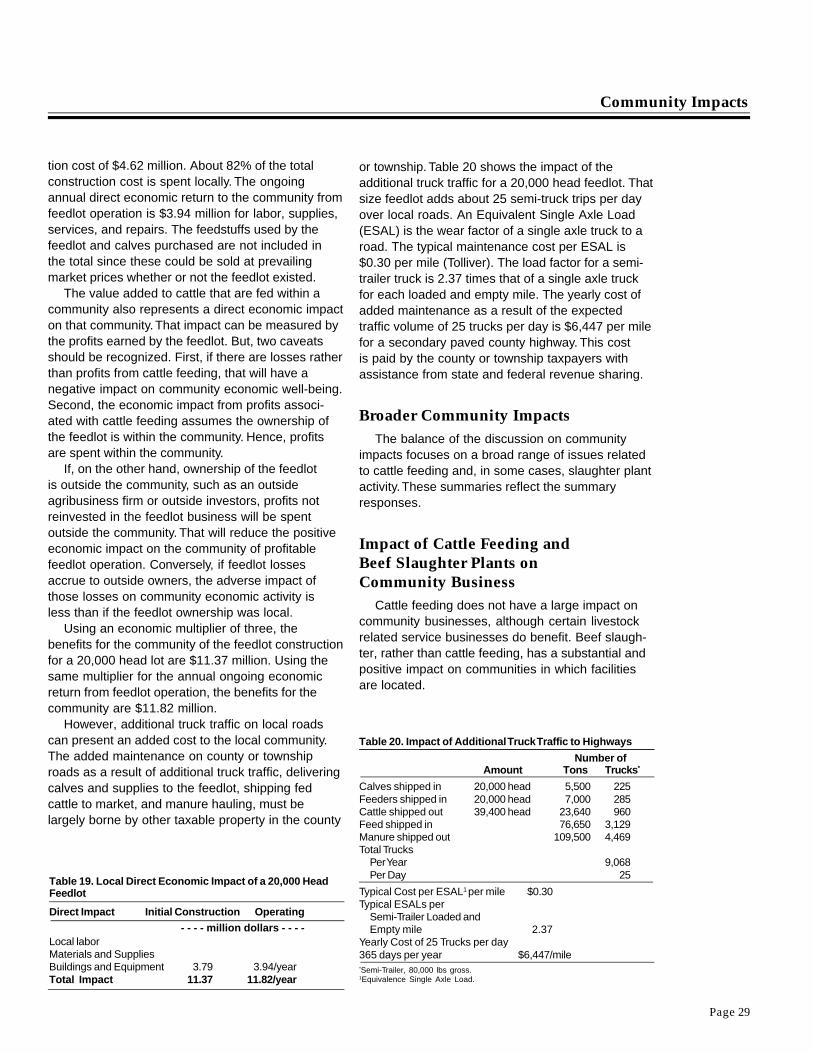
Page 29
tion cost of $4.62 million. About 82% of the totalconstruction cost is spent locally. The ongoingannual direct economic return to the community fromfeedlot operation is $3.94 million for labor, supplies,services, and repairs. The feedstuffs used by thefeedlot and calves purchased are not included inthe total since these could be sold at prevailingmarket prices whether or not the feedlot existed.
The value added to cattle that are fed within acommunity also represents a direct economic impacton that community. That impact can be measured bythe profits earned by the feedlot. But, two caveatsshould be recognized. First, if there are losses ratherthan profits from cattle feeding, that will have anegative impact on community economic well-being.Second, the economic impact from profits associ-ated with cattle feeding assumes the ownership ofthe feedlot is within the community. Hence, profitsare spent within the community.
If, on the other hand, ownership of the feedlotis outside the community, such as an outsideagribusiness firm or outside investors, profits notreinvested in the feedlot business will be spentoutside the community. That will reduce the positiveeconomic impact on the community of profitablefeedlot operation. Conversely, if feedlot lossesaccrue to outside owners, the adverse impact ofthose losses on community economic activity isless than if the feedlot ownership was local.
Using an economic multiplier of three, thebenefits for the community of the feedlot constructionfor a 20,000 head lot are $11.37 million. Using thesame multiplier for the annual ongoing economicreturn from feedlot operation, the benefits for thecommunity are $11.82 million.
However, additional truck traffic on local roadscan present an added cost to the local community.The added maintenance on county or townshiproads as a result of additional truck traffic, deliveringcalves and supplies to the feedlot, shipping fedcattle to market, and manure hauling, must belargely borne by other taxable property in the county
or township. Table 20 shows the impact of theadditional truck traffic for a 20,000 head feedlot. Thatsize feedlot adds about 25 semi-truck trips per dayover local roads. An Equivalent Single Axle Load(ESAL) is the wear factor of a single axle truck to aroad. The typical maintenance cost per ESAL is$0.30 per mile (Tolliver). The load factor for a semi-trailer truck is 2.37 times that of a single axle truckfor each loaded and empty mile. The yearly cost ofadded maintenance as a result of the expectedtraffic volume of 25 trucks per day is $6,447 per milefor a secondary paved county highway. This costis paid by the county or township taxpayers withassistance from state and federal revenue sharing.
Broader Community ImpactsThe balance of the discussion on community
impacts focuses on a broad range of issues relatedto cattle feeding and, in some cases, slaughter plantactivity. These summaries reflect the summaryresponses.
Impact of Cattle Feeding andBeef Slaughter Plants onCommunity Business
Cattle feeding does not have a large impact oncommunity businesses, although certain livestockrelated service businesses do benefit. Beef slaugh-ter, rather than cattle feeding, has a substantial andpositive impact on communities in which facilitiesare located.
Community Impacts
Table 19. Local Direct Economic Impact of a 20,000 HeadFeedlot
Direct Impact Initial Construction Operating
- - - - million dollars - - - -Local laborMaterials and SuppliesBuildings and Equipment 3.79 3.94/yearTotal Impact 11.37 11.82/year
Table 20. Impact of Additional Truck Traffic to Highways
Number ofAmount Tons Trucks*
Calves shipped in 20,000 head 5,500 225Feeders shipped in 20,000 head 7,000 285Cattle shipped out 39,400 head 23,640 960Feed shipped in 76,650 3,129Manure shipped out 109,500 4,469Total Trucks
Per Year 9,068Per Day 25
Typical Cost per ESAL1 per mile $0.30Typical ESALs per
Semi-Trailer Loaded andEmpty mile 2.37
Yearly Cost of 25 Trucks per day365 days per year $6,447/mile*Semi-Trailer, 80,000 lbs gross.1Equivalence Single Axle Load.
Economic Reasibility of the Cattle Feeding Industry in the Northern Plains and Western Lakes States
Page 30
Impact of Cattle Feeding and BeefSlaughter Plants on CommunityPopulation and Demographics
Little change on either the community work forceor population has occurred as a result of cattlefeeding. Cattle feeding has little impact on commu-nity demographics and has not stopped populationout-migration nor the trend to larger farm operations.In many communities, cattle feeding is more readilyaccepted than confinement hog production.
Unlike cattle feeding, beef slaughter plants havea major impact on communities where they arelocated. New people settle in communities sur-rounding a slaughter plant. They often are relativelyyoung, and are likely to have young families. InKansas and Nebraska, slaughter plants haveactively recruited workers of Hispanic and South-east Asia descent. Worker turnover in beef slaughterplants is quite high, sometimes more than 100%per year. In a state with a very homogeneouspopulation, such as Iowa, communities often do notwant slaughter plants larger in size than what canbe staffed with indigenous workers living withincommuting distance.
Impact of Cattle Feeding andBeef Slaughter Plants on Schools
Cattle feeding has little impact on school popula-tion. Beef slaughter plants, however, often attractemployees with young families. The cultural diver-sity such workers bring to a community oftenrequires second language skills in schools and localbusinesses. But, on balance, community leadersindicate the cultural diversity has been positive forthe community and for the schools.
Impact of Cattle Feeding and BeefSlaughter Plants on Law Enforcement
Cattle feeding has little impact on law enforce-ment requirements. Beef slaughter plant employeesplace increased demand on law enforcementauthorities, but generally in proportion to populationincreases. Increases in crime have focused onproperty crimes and alcohol/drug addiction-relatedproblems in communities impacted by slaughterplants, and these problems also have increased incommunities not impacted by slaughter plants.
Impact of Cattle Feeding and BeefSlaughter Plants on Social Problems
Cattle feeding has little or no impact on commu-nity social problems. Minority populations linked toslaughter plants result in some dislike or distrust ofthe new residents by the established communityresidents. Ultimately, most people interviewedthought the increased diversity was a positiveexperience for the communities affected. Socialwelfare problems have not grown out of proportionto population increases.
Impact of Cattle Feeding andBeef Slaughter Plants on HousingSupply and Demand
Cattle feeding has little impact on employmentgrowth and, hence, little impact on housing supplyand demand. Cattle feeders often provide housingor mobile home hookups for employees. Slaughterplants result in substantial numbers of new residentswithin the impacted communities. The result is thathousing shortages are apparent and often longstanding. Communities have been slow to usegovernment programs to add new housing, andlocal private developers have often been slow torespond to increased housing demand.
Stability of Work ForceFeedlot employees, often coming from within
the communities, have little impact on the stabilityof the work force. In the case of slaughter plants,the impact is considerable. Many employees arerecruited from outside of the community. In partbecause of the nature of slaughter plant work, theplants experience high and ongoing levels ofemployee turnover.
Cattle feeding has a modest,but positive, impact on thecommunity.
Page 31
Overall Impact onQuality of Community Life
Cattle feeding has a modest, but positive, impacton the communities in which it occurs. Its presencehas not materially slowed the transition adjustmentsthat result from larger size farming and from commu-nity residents bypassing smaller towns in favor ofpatronizing businesses in larger centers. However,for some livestock related businesses such as feeddealers, veterinarians, and trucking firms, cattlefeeding has a positive effect.
Perhaps more important, cattle feeding is neces-sary to support slaughter plants. Slaughter plantsdo have a substantial, and largely positive, impacton the economic life of a community. Most personsinterviewed indicate slaughter plants have a positiveimpact on their communities. Slaughter plants aregenerally viewed as responsible communitycitizens. Business persons and political leaders areemphatic about the positive impact. Slaughter plantsdirectly stimulate new employment and populationgrowth and tend to stimulate other related businessenterprises, such as trucking firms or cardboardbox factories. For some persons in the community,however, the diversity of population, the pressureson housing, changes in schools, increase in socialand law enforcement problems linked to populationgrowth, and the occasional smell of slaughter plantlagoons are negative factors that outweigh theplant’s positive impacts.
X.Alternative Strategies forValue-Added CattleProduction in theNorthern Plains States
A range of strategies can be employed to entervalue-added cattle production. These strategiesvary in terms of capital investment required, in riskassumed, and in potential profitability. This sectionoutlines a number of strategies and the attributeslikely to be associated with each strategy.
Backgrounding CalvesThis strategy envisions building feedlots to be
used in backgrounding calves. Because back-grounding utilizes more roughage in a growingration and need not be closely linked to feed-to-finish and slaughter plants, the location of back-grounding feedlots is less critical than for feed-to-finish. These feedlots could likely be located closerto concentrations of ranching activity, since theirhigh energy feed requirements would be less thanwith a feed-to-finish feedlot operation. It would beimportant to obtain a number turns of cattle in thebackgrounding feedlot to reduce the charge perhead for fixed costs.
Backgrounded cattle could be sold to feedlots inNebraska or elsewhere, perhaps to operators withwhom the backgrounding feedlots have establishedpreferred supplier relationships. Alternatively,ownership of backgrounded cattle could be retainedby ranchers or the backgrounding feedlot with thecattle custom fed in a feed-to-finish feedlot.
Feeding to FinishThis strategy envisions building a number of
relatively large-size feedlots, each around 20,000head capacity, for feeding-to-finish cattle producedin the Northern Plains. Since feeding-to-finishrequires a high energy ration, it would be importantto locate such feedlots in areas of surplus corn andbarley production. Surplus feed grains would enablefeedlots to purchase feedstuffs locally, at no price
Alternative Strategies for Value-Added Cattle Production in the Northern Plains States
Slaughter plants aregenerally viewed as
responsiblecommunity citizens.
Economic Reasibility of the Cattle Feeding Industry in the Northern Plains and Western Lakes States
Page 32
premium to local elevator prices. Reasonably closeaccess to agricultural processing by-products couldbe an advantage in obtaining low-cost feedstuffs,as well.Since it is unlikely that feed-to-finish cattlecould be profitably transported more than about200 miles to a slaughter plant, it would likely benecessary to construct one or more slaughter plantslocated in the Northern Plains and West LakesStates. The number of feedlots constructed wouldlikely be dictated in part by the requirements ofthe slaughter plants for fed cattle. Again, to reducefixed cost charges per head of cattle fed, it wouldbe necessary to keep feedlots in use on a year-round basis.
This alternative has a higher risk than back-grounding and requires a larger capital investmentin feedlots and slaughter plants. Feeding cattle tofinish has proven to be unprofitable for extendedperiods in other parts of the Great Plains wheresubstantial feeding occurs.
A lower risk and lower cost alternative couldinvolve custom feeding cattle in Nebraska orpurchasing feedlots there to feed Northern Plainscattle. Existing feedlots can be purchased substan-tially cheaper in Nebraska and Kansas than theirnew construction cost would be in the NorthernPlains and West Lakes States. Substantial excesscapacity exists in cattle feeding facilities in theMiddle West and the Great Plains States.
Purchasing Existing Feedlots andSlaughter Plants in Other States
Both feedlots and slaughter plants in other states,such as Nebraska, Kansas, and Colorado, poten-tially are for sale. If profitability from value-addedcattle production is the primary objective of NorthernPlains and West Lakes States cattle producers, thatmight be an attractive opportunity.
Existing facilities can usually be purchased atless than the cost of new construction. Age andobsolescence of facilities must be considered in anyanalysis of the relative merits of purchasing existingfacilities versus building new facilities. If creating avalue-added cattle industry in the Northern Plainsand West Lakes States is the primary objective ofcattle producers, this alternative may be unattractive.
Backgrounding in Owned Feedlots,Custom Feeding, and Custom Slaughter
This strategy retains a great deal of flexibilityfor Northern Plains and West Lakes States cattleproducers. Backgrounding cattle in producer orcooperatively owned feedlots in these statespromises attractive profits. Custom feeding inNebraska feedlots, under a preferred supplierarrangement, minimizes the capital cost of construct-ing feedlots in the Northern Plains and West LakesStates. Custom slaughter at an existing slaughterplant, located close to where the cattle are fed tofinish, offers cattle producers the opportunity tomarket a high quality branded product to supermar-ket chains. Cattle producers would, thus, retain theopportunity to move through the beef value chain allthe way to the retail customer, while having to makeonly limited capital investment in fixed facilities.Additionally, the ownership of the cattle couldchange hands at a number of different points inthe value chain, depending upon profitability andrisk considerations.
A range of strategies can beemployed to enter value-addedcattle production.

Page 33
XI.Summary
The five-state study area has adequate feedsupplies and feeder cattle to markedly increasecattle feeding. The feed costs in the Northern PlainsStates historically have been less than in theSouthern Plains; however, higher transportationcosts appear to offset that advantage. The recentand future increases in agricultural by-productswill increase available feedstuffs across all states,except Montana.
The cattle feeding industry in the Great Plainsand Middle West has a growing problem of overca-pacity. To be successful, new feedlots in the North-ern Plains would need to have cost efficienciesto offset their higher operating costs, compared toNebraska and Southern Plains feedlots, or toproduce for a niche market unaffected by the loweroperating costs of established feedlots.
The population density in the five-state areadecreases from east to west. Population densityin the eastern regions of the five-state area couldpresent a barrier to the establishment of largefeedlots. All states have siting requirements forestablishing feedlots. In addition, a number of stateshave local government regulations, more restrictivethan either federal or state regulations.
Calving in the Northern Plains region is donein the spring. To provide a dependable year-roundsupply of calves, herd management techniqueswould need to be changed. Calves and feeder cattlewould need to be available to the feedlot on a year-round basis.
The shortage of slaughter plants in the NorthernPlains represents an economic burden to northernfeeders. Transportation costs from Northern PlainsStates to slaughter plants in Nebraska amount toover $15 per head. Increases in profitable NorthernPlains feeding-to-finish will depend upon lowertransportation costs to slaughter plants; probablythis will result from establishment of one or morenew slaughter plants in the Northern Plains States.
There are substantial economies of scale in thecattle feeding industry. Capital costs vary from $468per head for the 1,000 head feedlot to $243 perhead for the 20,000 head feedlot. Even then, cattlefeeders in Kansas and Nebraska assert they would
need to add capacity at a cost of no more than$160 per head to be profitable. Projected labor costsvary from $52 per head for the 1,000 head feedlot to$23 per head for the 20,000 head feedlot.
Cattle feeding in the Northern Plains is profitableif both feed costs and cattle prices are favorable. Ifcorn is in the $2 to $2.50 range, all three sizes offeedlots evaluated are generally profitable. If cornrises above $2.50, all three feedlots are unprofitable.
The backgrounding of calves appears to be moreprofitable than finishing cattle in the five-state area.Reasons for this include; fixed costs are spread overa larger number of cattle, feed costs are lower forgrowing calves, and transportation costs are less asa result of shipping 700 lb calves instead of 1,200 lbfed cattle.
A 20,000 head feedlot would provide $3.79million in direct economic benefits for constructionof the feedlot and $3.94 million in direct economicbenefit annually for payroll, goods, and services.With a multiplier of three, total benefits to a commu-nity would be greater than $11 million annually. Thismeasure of economic benefit to the local area fromcattle feeding is limited to the feedlot payroll and tofirms directly providing goods and services to thefeedlot. In addition, profits from the feedlot opera-tions have a direct impact that can be increased bya factor of three to reflect overall community impactfrom feedlot profits. This is true only if the profitsaccrue to investors within the community. If feedlotowners are from outside the community, it is con-ceivable that none of the profits would be spent orreinvested.
Cattle feeding does not employ a large number ofworkers. Hence, there is a limited impact on schools,housing, population, and law enforcement. One areawhere added costs for the community are involvedwould be in maintaining highways. A 20,000 headfeedlot would add 25 semi-trailer trucks per day tolocal highways. The cost estimate for the addedrepair on secondary paved roads as a result of thatfeedlot is estimated at $6,400 per mile per year onroads affected by feedlot-generated traffic. Thesecosts would be borne primarily by county andtownship landowners, who may receive no benefitfrom the feedlot operation.
Social and environmental costs can be largelyaddressed during the siting process. Quality of lifeaspects are protected by federal regulations and bystate and local zoning boards. Increasingly, morestringent siting regulations and permit requirementsare intended to protect communities from adverse
Summary
Economic Reasibility of the Cattle Feeding Industry in the Northern Plains and Western Lakes States
Page 34
environmental and quality-of-life costs associatedwith feedlot operations. Distance from population,adequate water supplies, soil permeability, andfeedlot drainage are some of the areas addressed.Environmental interests are protected by federal,state, and local regulations concerning surfaceand groundwater pollution, feedlot drainage, andwaste storage and spreading. In addition, courtshave begun to find in favor of plaintiffs who argueodor problems represent an actionable nuisance.
Communities with cattle feeding support thatactivity and, as long as prudent siting requirementsare met, they support increased levels of cattlefeeding. There are some complaints against estab-lished feedlots. These complaints are, however,infrequent and probably will grow less frequentas states and local governments move towardrigorous siting requirements and annual licensingfor feedlots.
Opportunities for vertical networking appear to bemore promising than those for horizontal networking.The needs for consistent quality and cost effective-ness, and management coordination required toachieve those, seem to weigh against horizontalnetworking. Conversely, vertical networking arrange-ments appear to fit these requirements well. Agricul-tural cooperatives may prove to be the preferredbusiness structure in the Northern Plains aroundwhich to organize vertical networking arrangements.
Finally, a range of strategies can be pursued indeveloping value-added cattle production in theNorthern Plains and Western Lakes States. Thesestrategies embody differing levels of capital invest-ment and involve different levels of risk.
Page 35
ReferencesAmes Sand and Gravel, Fargo, ND. Personal
Communication. 1996.Anderson, V.L. Animal Scientist, Carrington Re-
search Extension Center, Carrington, ND.Personal Communication. 1996.
Bill’s Volume Sales, Inc., Central City, NE. PersonalCommunication. 1996.
Borst, Alan. Networking: Flexible Networks FollowCooperative Example. Farmer Cooperatives.Washington, DC. October 1994.
Butler Grain Handling, Fargo, ND. Personal Com-munication. 1996.
Cook, James R. “Cattle Financing - A Banker’sView.” In Cattle Feeding: A Guide To Manage-ment. Edited by Robert C. Albin and G.B.Thompson. Trafton Printing. Amarillo, TX. 1990.
Cook, R.L. Soil Management for Conservation andProduction. John Wiley & Sons, Inc. New York.1962.
Copeland, John D. Environmental Laws ImpactingMinnesota Livestock Producers. National Centerfor Agricultural Law Research and Information.University of Arkansas. Fayetteville, AR. 1994.
Copeland, John D. Environmental Laws ImpactingSouth Dakota Livestock Producers. NationalCenter for Agricultural Law Research andInformation. University of Arkansas. Fayetteville,AR. 1994.
Copeland, John D. Environmental Laws ImpactingWisconsin Livestock Producers. National Centerfor Agricultural Law Research and Information.University of Arkansas. Fayetteville, AR. 1994.
Daubert Trucklines, Sublette, KS. Personal Commu-nication. 1996.
Environmental Protection Agency. Guide Manual onNPDES Regulations for Concentrated AnimalFeeding Operations. Washington, DC. December1995.
FAPRI Baseline Projection. April 1996. Food andAgricultural Policy Research Institute, Columbia,MO.
Fargo Implement, Inc., Fargo, ND. Personal Commu-nication. 1996.
Farm Credit Services of Fargo, ND. PersonalCommunication. 1996.
Faultz Builders. Detroit Lakes, MN. PersonalCommunication. 1996.
Firkins, J.L., L.L. Berger, and G.C. Fahey, Jr. Wet andDry Corn Gluten Feeds as Protein and EnergySources for Feedlot Steers and Lambs. 1983Beef Cattle Report. Agricultural ExperimentStation and Cooperative Extension Service,University of Illinois at Urbana-Champaign. 1993.
The Forum. Fargo, ND. October 7, 1996.Fritz Electric. Fargo, ND. Personal Communication.
1996.George, J.A., C.D. Fulhage, and S.W. Melvin. “A
Summary of Midwest Livestock Odor CourtActions.” In: Agricultural Waste Management andUtilization, Proceedings of the 5th InternationalSymposium on Agricultural Wastes, ASAEPublications. St. Joseph, MI. 1985.
Grainger. Fargo, ND. Personal Communication.1996.
Haberstroh, Gary. Managing Livestock Waste forEnvironment and Economic Benefit. NorthDakota Department of Health. Bismarck, ND.1994.
Hall-GMC. Fargo, ND. Personal Communication.1996.
Hamilton, Neil D. A Livestock Producer’s LegalGuide to: Nuisance, Land Use Control, andEnvironmental Law. Drake University AgriculturalLaw Center. Des Moines, IA. January 1992.
Hanefeld Bros., Inc. West Fargo, ND. PersonalCommunication. 1996.
Haybuster Equipment. Jamestown, ND. PersonalCommunication. 1996.
Heinisch Scale Service. Fargo, ND. PersonalCommunication. 1996.
JD Precast. Plankinton, SD. Personal Communica-tion. 1996.Linn Enterprises. Linn, KS. PersonalCommunication. 1996.
Looker, Dan. “Strength in Numbers.” SuccessfulFarming. November 1994.LTP Enterprises. Fargo,ND. Personal Communication. 1996.
Midwest Agri. Fargo, ND. Personal Communication.1996.
Midwest Industrial Machinery, Inc. Fargo, ND.Personal Communication. 1996.
Midwest Marketing. Fargo, ND. Personal Communi-cation. 1996.
Midwest Plan Service. Beef Housing and EquipmentHandbook. Agricultural Engineering, NorthDakota State University. Fargo, ND. 1987.
North Dakota Agricultural Statistics Service. NorthDakota Agricultural Statistics. Various issues.Fargo, ND.
References

Economic Reasibility of the Cattle Feeding Industry in the Northern Plains and Western Lakes States
Page 36
North Dakota State Water Commission. NorthDakota’s Water Permitting Process. Bismarck,ND.
Northern Crops Institute. Fargo, ND. PersonalCommunication. 1996.
Northern Improvement Company. Fargo, ND.Personal Communication. 1996.
Owens, Fred, and Donald Gill. Ration BalancingSoftware Series. Animal Science Department,Oklahoma State University. Stillwater, OK. 1996
Quentin Burdick Center for Cooperatives. FiveQuestions to Ask Before Joining a New Process-ing Cooperative. North Dakota State University.Fargo, ND. 1996
Ritter, William F. “Odor Control of Livestock Wastes:State-of-the-Art in North America.” Journal ofAgricultural Engineering Research Vol. 42 No. 1.January 1989.
St. Paul Bank for Cooperatives. Fargo, ND. PersonalCommunication. 1996.
South Dakota Department of Agriculture. LivestockFacility Development Information Guide. SouthDakota Department of Agriculture. Pierre, SD.March 1996.
Stearns, Larry, Randall Sell, David Watt, and V.L.Anderson. Economics of Establishing a BeefCattle Feedlot Using By-Products of EthanolProduction in North Dakota. Agricultural Econom-ics Report No. 229. Department of AgriculturalEconomics, Agricultural Experiment Station,North Dakota State University. Fargo, ND. May1993.
Stockmen’s Supply, Inc. West Fargo, ND. PersonalCommunication. 1996.
Taylor Trailer Sales, Inc. West Fargo, ND. PersonalCommunication. 1996.
Tolliver, Denver. Upper Great Plains TransportationInstitute. Fargo, ND. Personal Communication.1996.
United States Department of Commerce. ClimateAtlas of the U.S. Washington, DC. 1968.
United States Department of Agriculture. AgriculturalStatistics. Various issues. Washington, DC.
United States Department of Agriculture. Livestockand Poultry Situation and Outlook. Various issues.Washington, DC.
Wallwork Truck Center. Fargo, ND. Personal Commu-nication. 1996.
Water Quality Division of Montana Department ofHealth and Environmental Sciences. CommonSense and Water Quality: A Handbook forLivestock Producers. Helena, MT. 1994.
Appendix A.A-Table 1. Net Returns for Various Size Feedlots withVarious Corn Prices and Livestock Prices, Two Groups ofCattle, One Fed From 550 to 1200 lbs, One Fed From 700to 1200 lbs
Fed Cattle Corn Price $/buPrice $/cwt 4.00 3.50 3.00 2.50 2.00
100 Head Feedlot80 -207.84 -138.98 -69.37 -0.42 68.5375 -229.13 -160.27 -90.67 -21.72 47.2370 -250.49 -181.62 -112.02 -43.07 25.8865 -271.78 -202.92 -133.31 -64.36 4.59
60 -293.2 -224.34 -154.74 -85.79 -16.84 250 Head Feedlot
80 -189.68 -120.82 -51.21 17.74 86.6975 -210.97 -142.11 -72.51 -3.56 65.3970 -232.33 -163.46 -93.86 -24.91 44.04
65 -253.62 -184.76 -115.15 -46.20 22.75 60 -275.04 -206.18 -136.58 -67.63 1.32
1,000 Head Feedlot80 -190.90 -122.04 -52.44 16.51 85.4675 -212.20 -143.34 -72.76 -3.81 64.1470 -233.48 -164.62 -94.04 -25.10 43.8565 -254.73 -185.86 -115.29 -46.34 22.6160 -276.15 -210.29 -137.68 -68.73 0.22
5,000 Head Feedlot 80 -139.63 -70.77 -1.16 67.79 136.7475 -160.92 -92.06 -22.46 46.49 115.4470 -182.22 -113.36 -43.76 25.19 94.1565 -203.46 -134.60 -64.99 3.96 72.91
60 -224.88 -156.02 -86.42 -17.47 51.48 20,000 Head Feedlot
80 -125.63 -56.77 12.84 81.79 150.7475 -146.92 -78.06 -8.81 60.14 129.0970 -168.23 -99.36 -30.11 38.84 107.7965 -189.45 -120.59 -51.34 17.61 86.5660 -210.87 -142.01 -72.41 -3.46 65.49
50,000 Head Feedlot 80 -117.51 -48.65 20.96 89.91 158.8675 -138.80 -69.94 -0.34 68.61 137.56
70 -160.15 -91.29 -21.69 47.26 116.2165 -181.45 -112.59 -42.98 25.97 94.9260 -202.87 -134.01 -64.41 4.41 73.49
100 Miles shipping into lot. 150 miles shipping to slaughter
Page 37
Appendix B
COMMUNITY SURVEY RESULTSFeedlot operators, community officials, and
business persons were interviewed, as a part of thisresearch project, to determine attitudes regardingthe impact of cattle feeding on the economic andsocial well-being of communities in which cattlefeeding occurred. The areas in which surveying wasdone were the Garden City, Kansas, area, the PlatteRiver Valley of Nebraska, southern Iowa, south-western Minnesota, and eastern South Dakota. Thesurvey results are summarized by topic. A seriesof bullet points under each category reflects inter-viewee comments on the topic.
Cattle AcquisitionNorthern Plains feedlot operators would likely
gather cattle to feed primarily from the five statesthat are the focus of this study: Minnesota, Montana,North Dakota, South Dakota, and Wisconsin. Cattlecould conceivably be drawn from the CanadianPrairie Provinces as well, although doing so wouldbe somewhat cumbersome because of constraintson taking live cattle across the international border.Canadian feedlot operators may also feed more oftheir own cattle to finish because of the increasedgrain freight rates to Canadian West Coast portsof export and due to their expanded beef slaughterplant capacity coming on-line in south centralAlberta.
Nebraska and Iowa cattle feeders will be strongcompetitors for Northern Plains calves and feedercattle. These feedlot operators receive much of theirfeeder cattle from the Northern Plains. Feedlotoperators in Kansas and Colorado will, to a lesserextent, be competitors for Northern Plains feedercattle, as well. Feedlot operators are focusing ondeveloping preferred supplier relationships withproducers of reputation feeder cattle.
Feeding StrategiesMost feedlot operators prefer to purchase
backgrounded calves for placement in their feedlots.However, an increasing number of operators arepurchasing weaned calves and feeding them toslaughter. These operators prefer to retain someflexibility in stocking strategies for their feedlots andin the type of ration to be fed; for example, very highcorn prices will increase the amount of alfalfa andsilage being fed.
Feeding RationFeedlot operators believe ready access to locally
produced corn is important to financial success ofthe feedlots. Irrigated corn and alfalfa have beenimportant to the growth of cattle feeding in Kansasand Nebraska. In almost every instance, feedlotsuse on-site preparation of the feeding ration andemploy independent nutritionist consultants to guidethem in feeding ration selection.
Use of By-productsBy-product use is particularly attractive to feedlot
operators in the environment of high corn prices(summer 1996). Feedlot operators believe a stablesource of by-products within less than 200 milesis necessary to profitably use by-products in thefeeding ration. A wide array of agricultural process-ing by-products are utilized, including surplusand discarded food products; but, the choice of by-product use is determined by whether it is costeffective in achieving weight gains for cattle on feed.
Scale of ProductionFeedlot operators report that feedlots of below
2,000 head capacity are unlikely to attain necessarythreshold economies of scale. Most feedlot opera-tors indicated optimal operating efficiency occurredat between 15,000 to 25,000 head capacity. Sincesuccess in cattle feeding requires careful attentionto the details of feed use and livestock care, theybelieved replicating lots of that size range is moreefficient than adding to the size of a given lot. Small-size feedlot operators continue to leave the busi-ness. Across the interview area, there are substan-tial numbers of abandoned small-size feedlots.Nonetheless, adequate feedlot capacity exists tofeed each year’s U.S. feeder calf crop to slaughterweight.
Appendix A-B
Economic Reasibility of the Cattle Feeding Industry in the Northern Plains and Western Lakes States
Page 38
Cost of FeedlotsFeedlot operators interviewed indicate they could
build new capacity for about $160 per head. InKansas and Nebraska, feedlot operators indicatednew fixed investment must be no more than $125per head for the lot to be competitive. Engineeringdata indicate fixed investment in new feedlots wouldtop $200 per head, perhaps raising doubts abouthow competitive these new facilities would be in anindustry where most of the capacity is long estab-lished and investment costs have been largelyrecouped by investors. Alternatively, it is possiblethat Kansas and Nebraska feedlot operators are notfully accounting for all costs of new feedlot develop-ment. In Kansas and Nebraska, most investment infeedlots was owner equity built up over an extendedperiod. Construction costs in Iowa, Minnesota, andSouth Dakota may prove higher because of theneed to provide more shelter and relief from mudthan is needed in Kansas or Nebraska.
Financing for Feedlot OperationsMost equity investment comes from within the
community in Kansas and Nebraska. Most of thecattle on feed, however, are owned by persons otherthan the feedlot owners. Local lenders provide mostfinancing for feedlot operators and for owners ofcustom fed cattle. Several feedlot operators inter-viewed suggest outside equity capital may becomenecessary in the future, as the scale of cattle feedinggrows and new entrants start to take over ownershipof existing feedlots.
Managing Production and Price RiskFeedlot operators interviewed used relatively
simple techniques to manage production and pricerisk. When profits are negative, they focus on customfeeding; when profits are positive, they own moreof the cattle on feed in their feedlots. Only limiteduse is made of futures contracts, for either feed orfeeder cattle on the input supply side or for fedcattle on the output side. Feedlot operators like tobuy and sell cattle on the same market as a riskmanagement tool. They also see opportunities forenhancing profitability through vertical networking,although they have found no advantage in horizon-tal networking.
Professional ServicesFeedlot operators rely on veterinarian consultants
to develop health care programs and to prescribeprescription drugs. Day-to-day animal care ishandled by feedlot employees; veterinarian serviceswould be too expensive. Every feedlot visitedemployed an independent nutritionist consultant todevelop least cost rations to achieve weight gaintargets. Feedlot operators are reluctant to rely onnutrition consultants employed by their feed suppli-ers. Feed is purchased by the feedlot on a deliveredbasis. Livestock trucking services are almost alwaysprovided by outside trucking firms.
Feedlot Labor IssuesLabor requirements in feedlots are one employee
per 1,000 head of feedlot capacity. These workersare hired near to the feedlot and are paid from$22,000 to $40,000 per year, plus benefits thatinclude health insurance and 401K plans. Workerturnover is infrequent. Substantial specialization ofduties by employees is used to attain the desiredefficiency in feedlot operations.
Marketing StrategiesFeedlot operators have difficulty attracting
slaughter plant buyers with less than pen size lotsof cattle offered for sale. Buyers prefer to deal withfeedlot operators who can market several pens (atabout 100 cattle per pen) each week year-round.Cattle are sold to the highest bidder without prefer-ence as to slaughter plant. Feedlot operators do notbelieve fed cattle can be profitably transported morethan about 150 to 200 miles to a packer. Cattlefeeders preferred to be located within one hour fromslaughter plants.
Only a few of the larger feedlot operators inter-viewed indicated that they have considered and,in a few instances, achieved a preferred supplierstatus with a particular slaughter plant. Everyoneworries about slaughter plant concentration, butat this point, no feedlot operators have openedalternative marketing channels that assure widermargins to the cattle producer, although someefforts at marketing a branded beef product toretail customers are being tried.
Page 39
Coordination EffortsDespite great interest in coordination across
the livestock production and processing chain, noone has thus far created a clearly successful mode.Efforts at branded products, such as certified AngusBeef or Precision Beef in Iowa, have not demon-strated a higher return to producers on a regularbasis, although consumers may be able to purchasebeef with greater uniformity of quality as a result.
Feedlot operators are unhappy about slaughterplant consolidation, but have taken no decisivemoves to change the resulting concentration ormarketing system. Feedlot operators indicate theneed for vertical coordination between cattlemenand feedlots with a focus on preferred supplierrelationships and coordination of rancher breedingprograms to produce animals that best meet feedlotoperators’ requirements. Feedlot operators dismissthe concept of horizontal networking among small-size feedlot operations as unworkable.
Pollution Control IssuesPollution control requirements are becoming
more demanding for feedlots. Small feedlots areoften able to work with local officials on sitingrequirements; large lots must work with state officialsas well as local officials. Expanding an existingfeedlot appears to be easier to accomplish from aregulatory perspective than developing a newfeedlot. However, most feedlots are regarded asdoing a good job of pollution control. Specialattention is focused on controlling surface waterrunoff and protecting the integrity of the aquifer.Plans for manure and liquid waste must meetfederal and state/local requirements, and minimumdistance requirements from neighbors must beobserved. In both Kansas and Nebraska, licensingand regular inspections of feedlots will be required.Odor and dust complaints about feedlots weremost often mentioned by neighbors.
Apendix C
Appendix C.
C-Table 1. Price Relationships Between Corn and Barley
Corn Barley- - - - - - $/bu - - - - - -
2.00 1.592.50 1.853.00 2.113.50 2.374.00 2.63
Pbt = 0.545 + 0.521*Pct(3.323) (4.202)
R2 = 0.638Where
Pbt is the price of barley in time tPct is the price of corn in time tnumber in parenthesis is t-statistic
C-Table 2. Price Relationships Between Fed Cattle, 700 lbFeeder Cattle and 550 lb Calves
Fed Feeder Calves
- - - - - - - - - - $ / cwt - - - - - - - - -
60.00 66.05 65.4965.00 72.54 73.8470.00 79.04 82.2075.00 85.54 90.55 80.00 92.04 98.91
Pft = -11.922 + 1.299*Pst(2.041) (16.706)
R2 = 0.921Pft = -34.772 + 1.671* Pvt
(4.526) (11.793)R2 = 0.880
WherePft is the price of Fed cattle in time tPst is the price of Feeder cattle in time tPvt is the price of calves in time tnumber in parenthesis is t-statistic

NDSU is an equal opportunity institution.
This publication will be made available in alternative formats for people with disabilities upon request (701)231-7441.