
ECONOMIC EVALUATION OF SMART WELL TECHNOLOGY A ...
63
ECONOMIC EVALUATION OF SMART WELL TECHNOLOGY A Thesis by ABDULLATIF A. AL OMAIR Submitted to the Office of Graduate Studies of Texas A&M University in partial fulfillment of the requirements for the degree of MASTER OF SCIENCE May 2007 Major Subject: Petroleum Engineering
Transcript of ECONOMIC EVALUATION OF SMART WELL TECHNOLOGY A ...

ECONOMIC EVALUATION OF SMART WELL TECHNOLOGY
A Thesis
by
ABDULLATIF A. AL OMAIR
Submitted to the Office of Graduate Studies of Texas A&M University
in partial fulfillment of the requirements for the degree of
MASTER OF SCIENCE
May 2007
Major Subject: Petroleum Engineering

ECONOMIC EVALUATION OF SMART WELL TECHNOLOGY
A Thesis
by
ABDULLATIF A. AL OMAIR
Submitted to the Office of Graduate Studies of Texas A&M University
in partial fulfillment of the requirements for the degree of
MASTER OF SCIENCE
Approved by:
Chair of Committee, Richard Startzman Committee Members, W. John Lee Wayne Ahr Head of Department, Stephen A. Holditch
May 2007
Major Subject: Petroleum Engineering

iii
ABSTRACT
Economic Evaluation of Smart Well Technology. (May 2007)
Abdullatif A. Al Omair, B.S., The University of Tulsa
Chair of Advisory Committee: Dr. Richard A. Startzman
The demand of oil and gas resources is high and the forecasts show a trend for higher
requirements in the future. More unconventional resource exploitation along with an
increase in the total recovery in current producing fields is required. At this pivotal time
the role of emerging technologies is of at most importance.
Smart or intelligent well technology is one of the up and coming technologies that
have been developed to assist improvements in field development outcome. In this paper
a comprehensive review of this technology has been discussed. The possible reservoir
environments in which smart well technology could be used and also, the possible
benefits that could be realized by utilizing smart well technology has been discussed.
The economic impact of smart well technology has been studied thoroughly. Five
field cases were used to evaluate the economics of smart well technology in various
production environments. Real field data along with best estimate of smart well
technology pricings were used in this research. I have used different comparisons
between smart well cases and conventional completion to illustrate the economic
differences between the different completion scenarios.
Based on the research, I have realized that all the smart well cases showed a better
economic return than conventional completions. The offshore cases showed a good
economic environment for smart well technology. Large onshore developments with

iv
smart well technology can also provide a lucrative economic return. These situations can
increase the overall economic return and ultimate recovery which will assist in meeting
some of the oil demand around the globe.

v
DEDICATION
This work is dedicated
To my parents for their constant support through out my life to achieve this goal;
To my beloved wife, Nouf, and my beautiful daughter, Nourah, for all the sacrifice they
gave during the time I was away from them during my studies. I tell them that we can
enjoy this together and reunite forever. To all my brothers and sisters, thanks for all the
support you provided for me and my family during my studies.

vi
ACKNOWLEDGEMENTS
I wish to express my sincere appreciation to the following members of my graduate
advisory committee for their contribution and continuous support to accomplish this
research.
Thank you to the chairman of my graduate advisory committee, Dr. Startzman,
for his constant support and continuous guidance during this research
Thank you to Dr. John Lee and Dr. Wayne Ahr for serving as members of my
advisory committee and for the knowledge I gained from them.
I would like to thank my fellow friends at the Harold Vance Department of
Petroleum Engineering that made my stay here a memorable one.
Thanks also to faculty and staff of the Harold Vance Department of Petroleum
Engineering at Texas A&M University for providing the facilities and accommodations
to conduct my research.
Finally, I would like to thank Saudi Aramco for giving me this opportunity to
pursue my degree. I appreciate the chance they gave me to come to the best school in the
world.

vii
TABLE OF CONTENTS Page
ABSTRACT ................................................................................................................ iii
DEDICATION...............................................................................................................v
ACKNOWLEDGEMENTS......................................................................................... vi
TABLE OF CONTENTS............................................................................................ vii
LIST OF FIGURES ..................................................................................................... ix
LIST OF TABLES....................................................................................................... xi
CHAPTER
I INTRODUCTION.............................................................................................1
1.1 Motivation.................................................................................................1 1.2 Research Goals..........................................................................................3 1.3 Organization of Thesis..............................................................................3 II SMART WELL TECHNOLOGY OVERVIEW ..............................................4 2.1 Definitions..................................................................................................4 2.1.1 Schlumberger’s Definition...............................................................4 2.1.2 WellDynamics’ Definition...............................................................5 2.1.3 Intelligent Well Reliability Group (IWRG) Definition ...................5 2.1.4 Baker Hughes’ Definition ................................................................6 2.1.5 Definition Discussion ......................................................................6 2.2 Possible Applications of Smart Well Technology....................................6 2.2.1 Optimal Sequential Production ........................................................7 2.2.2 Commingled Stacked Pay ...............................................................7 2.2.3 Oil Rims in Single Compartments ...................................................8 2.2.4 Oil Rims in Compartmentalized Reservoirs ....................................8 2.2.5 Drive-Recovery Processes ...............................................................8 2.2.6 Flow Profiling ..................................................................................8 2.2.7 Intelligent Multilaterals....................................................................9 2.2.8 Fluid Transfer for Sweep or Pressurization ....................................9 2.2.9 Intelligent Waterflooding in Partially Fractured Reservoirs..........10 2.2.10 Auto Gas Lift ...............................................................................10 2.2.11 Swing Producers ..........................................................................10 2.2.12 Other Possible Uses .....................................................................11 2.3 Possible Benefits of Smart Wells ...........................................................12 2.3.1 Accelerated Production..................................................................12

viii
CHAPTER Page 2.3.2 Increase Ultimate Recovery..........................................................14 2.3.3 Reduction in Capital Expenditure.................................................14 2.3.4 Reduction in Operating Expenditure ............................................15 2.3.5 Reduce Risk ..................................................................................15 2.4 Design Criteria .......................................................................................16 III ECONOMICAL MODELS FOR SMART WELL TECHNOLOGY .............19 3.1 Gai Model ..............................................................................................19 3.2 Sakowski, Anderson and Furui Model...................................................21 IV ECONOMIC REVIEW OF ACTUAL FIELD CASES ..................................23 4.1 Giant Field Development of Onshore Carbonate Field ..........................23 4.1.1 Development Scenarios and Economic Analysis ..........................26 4.1.2 Economic Requirements ................................................................26 4.2 Commingled Production for an Offshore Nigerian Field ......................27 4.2.1 Economic Analysis ........................................................................29 4.3 Multi-Lateral Well Overlain by a Gas Cap Offshore Norway................33 4.3.1 Why Smart Well Technology?.......................................................33 4.3.2 Economic Analysis ........................................................................34 4.4 Multi-Lateral Well Under Pattern Injection Offshore Norway...............36 4.4.1 Economic Analysis ........................................................................37 4.5 A Small Onshore Field Development in the Middle East.......................41 V CONCLUSIONS AND RECOMMENDATIONS ..........................................45 5.1 Conclusions.............................................................................................45 5.2 Recommendations...................................................................................46 NOMENCLATURE ....................................................................................................47 REFERENCES ............................................................................................................48 VITA............................................................................................................................51

ix
LIST OF FIGURES FIGURE Page 1.1 Hydrocarbon World Demand under High World Economical Growth ............1 1.2 New Technologies Role in Saudi Arabian Fields .............................................2 2.1 Schlumberger’s Model for Smart Well Technology Process ...........................4 2.2 WellDynamics Elements of Smart Well Technology.......................................5 2.3 Production Forecast for Producing Each Reservoir By Iteslf .........................13 2.4 Production Forecast for Commingled Production Utilizing Smart Well Technology .................................................................................13 2.5 Example of a Smart Well Completion Layout................................................17 2.6 Well’s Rate Based on Smart Choke Settings ..................................................17 3.1 Flowchart of the Smart Technology Value Assessment Method ...................20 3.2 Reservoir and Economical Analysis Processes for Smart Well Completion ..................................................................................21 4.1 Super-Permeable Zone Acts as a Productivity Enhancer ...............................24 4.2 Super-Permeable Zone Acts as a Productivity Detractor ...............................25 4.3 Horizontal Well Intersecting Vertical Fracture...............................................25 4.4 Garben Field General Geology .......................................................................28 4.5 Garben Field’s Reservoirs Productivity Tests ................................................29 4.6 Pay Back Period for All Development Scenarios in the Garben Field ...........32 4.7 Cumulative Production History for the Osberg Field .....................................34 4.8 Pay Back Period Graph for the Osberg Field...................................................36

x
FIGURE Page 4.9 Production History for the Smart Well in GullFaks Field ...............................38 4.10 Expected Well’s Rate if Smart Well is Used after 2.5 Years .........................38 4.11 Production Rate if the Well was Abandoned after 3 Years ............................39 4.12 NPV Analysis for the Three Development Scenarios under Different Oil Prices ..........................................................................................40 4.13 H and K Reservoir Structure Map ...................................................................42

xi
LIST OF TABLES TABLE Page 4.1 Haradh Field Requirements for Full Field Development……………............26 4.2 Haradh Field Wells’ Drilling Costs Data………………..……....…………..27 4.3 Final Development Costs for all Scenarios for the Haradh Field ...................27 4.4 Productivity Index Values for Each Reservoir ...............................................29 4.5 All Wells Are Producing at a Drawdown of 120 psig ....................................30 4.6 Smart Well Producing at 120 psig and all the Other Wells are Producing at a Drawdown of 200 psig ...........................................30 4.7 Drilling and Completion Time Breakdown for the Garben Field...................31 4.8 Cost Data for the Garben Field .......................................................................31 4.9 Cost per Barrel Produced for all the Development Scenarios for the Garben Field ........................................................................................32 4.10 Drilling Time Estimates for the Osberg Field................................................35 4.11 Drilling Cost Estimates for the Osberg Field.................................................35 4.12 Cost per Barrel Produced for all the Development Scenarios for the Osberg Field ........................................................................................36 4.13 Estimated Rig Time and Cost Data for the GullFaks Field ............................39 4.14 Sample NPV Calculation for Case 1 and Oil Price of 60 $/bbl ......................40 4.15 AH Field Reservoir Properties........................................................................41 4.16 Expected Rates for Horizontal Well Designs .................................................42 4.17 Multilateral Well Production Rate Prediction.................................................42 4.18 Number of Wells Required for Field Development........................................43

xii
TABLE Page 4.19 Estimated Drilling Cost per Well....................................................................43 4.20 Overall Development Costs for All Scenarios................................................44

1
CHAPTER I
INTRODUCTION
1.1 Motivation The demand of energy has been rising steadily in the past few years as shown in figure
1.1. Sources of hydrocarbons are still abundant around the globe. Many of these
resources are harder to produce than the reserves being produced currently. Another
important challenge in this current situation is to maximize recovery at a profitable rate.
World Oil and Gas Demand (High Economic Growth)
0.050.0
100.0150.0200.0250.0300.0350.0400.0
1990 2002 2003 2010 2015 2020 2025 2030
Year
Oil
and
Gas
Dem
and
ForecastedNatural Gas(BCF)
Forecasted OilDemand(MMSTB)
Figure 1.1: Hydrocarbon World Demand under High World Economic Growth (EIA1)
The positive aspect of this situation is that the technology is progressing as those
reserves get more challenging to produce. Many petroleum engineering technologies
have been developed in order to ease the production of new reservoir.
_____________ This thesis follows the style of SPE Journal.

2
Slanted and horizontal well technology was developed in the early 1920’s but was rarely
used until the 1980’s. However with the technology advancement in the industry
horizontal wells are not uncommon anymore.
The industry has a tendency of being careful with new technologies till the
technology is proved both theoretically and operationally. The change usually takes place
in more than one aspect i.e. production, drilling and reservoir strategies. However,
adapting some of the new technologies will be a must in order to produce the resources in
the best manner that will yield profit to these companies. Saudi Aramco2 has indicated a
steady increase in technology use with time. The author emphasized on the role of
technology advancement in order to produce the more challenging resources available
around the world as shown in figure 1.2.
Figure 1.2: New Technologies Role in Saudi Arabian Fields (courtesy of Saudi Aramco2)
One of the new technologies that have emerged in the past 10 years is what is
called “Smart Well Technology” or “Intelligent Well Technology”. The main driver for
this technology is the emergence of horizontal and multi-lateral wells around the world.

3
The main aspect of the smart well technology is the ability to control flow from many
laterals or zones utilizing down-hole control valves.
1.2 Research Goals The goals of this research are the following:
1. Review the current state of smart well technology.
2. Evaluate the economic factors of fields developed with smart well technology.
3. Create solid conclusions in the economic viability of smart well technology in the
different oil field environments.
1.3 Organization of Thesis This thesis is organized in five chapters, including this introduction. Chapter II will give
an overview of smart well technology. Topics such as the industry’s definitions, possible
applications, and the possible benefits of smart well technology will be discussed in this
chapter. Chapter III will focus in the available economic models for smart well
technology development. Chapter IV will investigate five field cases developed using
smart well technology. Economic evaluations of this project will be carried out to
evaluate the technology’s economic viability. Chapter V contains the conclusions and the
recommendations of this study.

4
CHAPTER II
SMART WELL TECHNOLOGY OVERVIEW
2.1 Definitions In this chapter, I will state the definition of “smart or intelligent well” as stated in the
industry.
2.1.1 Schlumberger’s Definition A well equipped with monitoring equipment and completion components that can be
adjusted to optimize production, either automatically or with some operator intervention3.
Figure 2.1 shows the dynamic process of the Schlumberger model.
Figure 2.1: Schlumberger’s Model for Smart Well Technology Process (courtesy of Schlumberger4)

5
2.1.2 WellDynamics’ Definition WellDynamics defines a smart well as a well that combines a series of components that
collect, transmit and analyze completion, production and reservoir data, and enable
selective zonal control to optimize the production process without intervention5 as shown
in figure 2.2.
Figure 2.2 WellDynamics Elements of Smart Well Technology (Courtesy of WellDynamics5)
2.1.3 Intelligent Well Reliability Group (IWRG) Definition The intelligent Well Reliability Group (IWRG) defines an intelligent well as a well
equipped with means to monitor specified parameters (e.g. fluid flow, temperature,
pressure) and controls enabling flow from each of the zones to be independently
modulated from a remote location (eg at the wellhead, or a nearby offshore platform, or a
distant facility)6.
6
2.1.4 Baker Hughes’ Definition Baker Hughes defines an intelligent well as implementation of fundamental process
control downhole. Intelligent wells enable surveillance, interpretation and actuation in a
continuous feedback loop, operating at or near real-time7.
2.1.5 Definition Discussion Many other companies have different organization of the word but the base definition is
the same. However, the main question to be asked is these wells smart? The answer is
simply not yet. Merriam-Webster dictionary defines intelligence as the ability to learn or
understand or to deal with new or trying situations. The systems being installed around
the world have very significant advantages than regular completions but they can not
learn nor deal with any situation yet. For the sake of this study I am going to reference
this technology as smart well technology (SWT).
2.2 Possible Applications of Smart Well Technology As mentioned above, the main features of SWT is to provide the ability to control
downhole fluid intake from reservoir while monitoring the pressure and temperature of
the reservoir. As in any other technology in different industries, SWT should be utilized
in areas with viable applications. Glandt8 has discussed the reservoir management
applications of the smart wells from an operator point of view. The paper discussed the
prospects that could be possible fits for smart well technology. The following are the
reservoir opportunities that the author discuses in his paper:

7
2.2.1 Optimal Sequential Production In many fields reservoir are stacked on top of each other and wells usually cut through
these banks. Many government agencies and reserves owners will not allow commingled
flow and will require sequential production. In this case the well will be produced from
one reservoir only tell the well reaches its economic limit and then it will be plugged and
the next reservoir will be perforated and produced. This might result in long periods of
time where the reservoirs are producing at a low rate till the economic limit and
abandonment. However, smart wells could be deployed in such wells where alternations
between productions from different reservoirs could be utilized to accelerate production
from the reservoirs without the need for abandoning a reservoir to produce the other.
2.2.2 Commingled Stacked Pay Achieving the maximum possible commingled rate (tubing restriction) of a well in
stacked reservoirs is a lucrative project that would return high net present values for the
well. However, differences in reservoir pressure and regulatory rules limit the possibility
of achieving this goal. Smart well technology provides possible method to produce
commingled reservoir in a sound engineering manner. Pressure balancing utilizing
downhole chokes will allow the reservoirs to be co-produced without cross-flow and fluid
loss. Produced volumes could be allocated utilizing production logging, geochemical
fingering and individual pressure and rate calculations from each reservoir. These values
can be reported to government agencies and should be utilized in reservoir simulation
studies.

8
2.2.3 Oil Rims in Single Compartments Horizontal wells have been very effective in thin oil rims gas and water zones. However,
the production of such wells declines rapidly as soon as water or gas breaks through in
well. Installing a inflow control valves in different locations along the horizontal section
might help shut-off the unwanted effluent.
2.2.4 Oil Rims in Compartmentalized Reservoirs Wells that are planned to produce different thin oil rims form different zones can utilize
smart well completions to control flow from different zones. As producing zones get
excessive gas or water production, these zones could be shut-in utilizing the downhole
valves.
2.2.5 Drive-Recovery Processes Many of fields in the world utilize some type of pressure support processes to recover
hydrocarbons. Some of these drives are natural such as the gas cap or a strong water
aquifer; other processes are designed by engineers to help support the pressure.
Secondary recovery mechanisms include water flooding, gas injection, steam injection
and polymer floods. However, these processes sometimes affect producing wells by
having excessive injected fluid production through reservoir heterogeneities such natural
fractures and super permeable zones.
2.2.6 Flow Profiling Distributed temperature sensing technology is a part of smart technology (fiber optics)
that could be used to provide an idea of flow profiles along the tubing. It could be used

9
to detect flow behind pipe and crossflow. This technology could be deployed in areas
where production profiling is expensive or suspect.
2.2.7 Intelligent Multilaterals Multilateral wells in the same formation have been proven to increase well productivity
at a lower unit development cost. Maximum reservoir contact (5 Km of contact) wells
have been developed in many fields and are showing great results. However, the
possibility of unwanted effluent premature breakthrough in one of the laterals is strong.
The premature breakthrough can adversely affect the whole well’s productivity. Inflow
control valves could be deployed in such wells to detect the lateral affecting the flow and
remedial action could be taken.
2.2.8 Fluid Transfer for Sweep or Pressurization The process of dump flooding has been used in the industry for a long time. The basic
concept of such process is to utilize higher pressure gas or water zones to pressure up the
producing formation to assist pressure maintenance. This method is economically sound
due to the lack of injection surface facilities and the injection fluid cost. The main flaw in
such process is the lack of control of the amount of the volumes being transferred from
the high pressure zone into the producing zone. Smart well technology can provide
operator some leverage on the amount of fluids being transferred. Downhole chocking is
the only possible method to control the amount of fluids being injected.

10
2.2.9 Intelligent Waterflooding in Partially Fractured Reservoirs Water injection is a common method of secondary recovery process or pressure
maintenance practices in oil fields around the world. In many partially fractured
reservoirs many injectors encounter natural fractures in the wellbore. These fractures
could act as a pathway for water and might lead it the oil producing well. The water
might load the well with water leading to premature rate decline. Smart valves could be
installed along the path of the injector (segments), which leads to adequate identification
of the thieve zone. This zone then could be controlled by the downhole valve and better
injection efficiency could be obtained.
2.2.10 Auto Gas Lift Oil producing wells usually intercept other reservoirs that contain an active gas cap.
Smart well technology could be deployed in such setting and use the gas from the upper
reservoir to lift the oil in the producing zone. Inflow control valves can control the
amount of gas being used to lift the oil to meet the gas lift design standards.
2.2.11 Swing Producers The author discusses a very interesting swing producer layout employing smart well
technology. In this project an oil producer that utilizes auto-gas lift system where a gas
zone is perforated and the gas is used to lift a deeper oil zone. However, gas production
demands increase in certain times of the year. Utilizing the smart completion, the gas
could be produced to surface instead of the oil and the gas demands could be met.

11
2.2.12 Other Possible Uses The author mentioned some technically sound situations where smart well technology
could be deployed in the future. Connector well is a concept that suggests connecting
reserves from a different formation to an active well without installing any surface
facilities. This idea is designed for offshore projects and should help reduce the cost of
development by reducing the number of platforms.
Downhole production testing is a concept that explores the possibility of flowing
a prospect formation to a depleted formation. Smart completion will allow measuring the
average rate of production without the need to flow the well to surface. This concept is
both practical and environmentally friendly. Smart abandonment is another application
that the author explored in his review. In essence, smart abandonment concept suggests
the installation of downhole monitoring systems for wells to be abandoned. The pressure
and temperature data could be used in reservoir simulation studies and sweep monitoring
projects. Many oil companies have adopted this concept in their reservoir monitoring
wells.
Downhole geophones could be installed with permanent downhole monitoring
system to provide reservoir imaging data. These repeatable seismic data should assist
reservoir engineers and geologists in monitoring the sweep efficiency of the enhanced
recovery technique.

12
2.3 Possible Benefits of Smart Wells Smart well technology as noted in the section above has many applications in the oil
industry. These applications can yield many operational and economic benefits. In the
next section I will speak about the possible benefits of smart well technology.
2.3.1 Accelerated Production One of the important aspects of current hydrocarbon production strategies is to accelerate
the production from proved reserves. As oil prices reach record highs and the future
market conditions are almost impossible to predict, acceleration of production will yield
the best NPV for the project. Smart well systems can play a vital role in accelerating
production especially in multi-layer reservoirs.
Commingled production from different reservoirs in the same well can be
detrimental to the ultimate recovery. Crossflow and fluid dumping from different zones
will cause unflattering recovery values. Drilling different wells to produce these zones
can be very costly and will require high initial development cost. However, wells
equipped with inflow control valves (smart wells) can produce different layers without
reservoir communication.
A case study in the North Sea was developed by WellDynamics Company to
investigate the possibility of accelerating the production of a two reservoir field9. Two
simulation studies were performed to compare the regular zone by zone (conventional)
production to avoid crossflow. The second simulation run was developed to illustrate the
production profile by utilizing the smart well technology. Figures 2.3 and 2.4 show the
results of the simulation.

13
Figure 2.3: Production Forecast for Producing Each Reservoir By Itself (courtesy of WellDynamics)9
Figure 2.4: Production Forecast for Commingled Production Utilzing Smart Well Technology (courtesy of WellDynamics)9

14
2.3.2 Increase Ultimate Recovery As energy demands increase rapidly, the goal of energy companies is to maximize
ultimate recovery in an economically sound manner. Many hurdles meet the industry
when trying to maximize ultimate recovery while operating under the economic limit.
Intervention costs such as workovers, coil-tubing operations and other production
enhancing operations are the main reasons for limiting the increase ultimate recovery.
However, the new SW technology minimizes the future costs associated with intervention
and reduce the safety issues that can be costly for operators. Maximum ultimate recovery
for current producing fields and future development will be an important driver in the
future oil demands.
A case study offshore Brunei was used to determine the applicability of smart
well technology10. The simulation results indicate that both accelerated production and
maximizing ultimate recovery were realized.
2.3.3. Reduction in Capital Expenditure Reduction in capital cost can be categorized as the most important aspect of SW
technologies. In the profit driven environment that oil and gas companies operate under,
maximizing NPV is the main driver for any development project. The time value of
money concepts implies that high capital expenditures will delay the payback period
along with an overall reduction of NPV9. However, the applications under which CAPEX
could be reduced are specific and it is not a global application. The specific viable
applications will be discussed in section 4.1.

15
2.3.4 Reduction in Operating Expenditure Operating expenditure (OPEX) is one of the most important aspects that control the
economic visibility of the project. High OPEX will yield a high abandonment rate which
will shorten the project life. I believe that SWT can help in reducing OPEX in some
certain environments. Reducing the number of wells, less intervention (workovers) can
be achieved by developing suitable fields with SWT technology which might reduce the
OPEX costs9.
2.3.5 Reduce Risk During the research of SWT technology, many companies elected to use the term reduce
operational risk. I will just use the phrase “Reduce Risk” to account for both operational
risk “safety” and reservoir uncertainties. In terms of safety, SWT suitable fields may
require smaller number of wells than conventional fields. The possible reduction of
number of wells should reduce the risk of having safety problems that might cause
operational failure. The risk of having operation problems in smart wells is present but
the risk discussed in this section is the overall well drilling and completion risk.
The second type of risk reduction is associated with reservoir uncertainties9. This
type can be linked to multi-lateral wells with many uncertainties in the reservoir such as
fractures, faults and super-k zones. Inflow control valves (ICV) can eliminate pre-mature
fluids breakthrough that might reduce the productivity of the well and affect production
from other laterals in the well.

16
2.4 Design Criteria As displayed in the definitions section, the main components of a smart well are the
permanent downhole monitoring system along with the inflow-control valve (ICV). The
permanent downhole monitoring system (PDHMS) provides the valuables real time or
(near real time) pressure measurement of the zones. To date only one (PDHMS) could be
installed in a single well in a location above of all downhole valves and zones. This limits
the collecting of pressure data up and down stream from the inflow-control-valve.
Service companies are working on providing pressure measurement down and upstream
from each downhole choke valve.
Nodal analysis is a main factor in assessing the size of the valve and the tubing in
smart well design11. Reservoir properties such as productivity index and expected rate
govern the design size. If the smart well design contains more than one formation, all the
formations properties should be used to design the best combinations of valves to provide
best production or injection results.
Figures 2.5 and 2.6 are some results of field design:

17
Figure 2.5: Example of a Smart Well Completion Layout
The following are the field results of the above illustrated well:
Choke Performance (Q and P)
0500
1000150020002500300035004000
0 2 4 6 8 10 12
Choke Setting (1 through 10 (fully open))
Pre
ssu
re in
Psi
a
0612182430364248
Pro
duct
ion
Rat
e M
BP
D
Lat. 0 Pressurevs. Choke L-1 Pressure vs.Choke L-2 Pressure vs.ChokeProduction Point(Pressure)L-0 Choke vs.RateL-1 Choke vs.RateL-2 Choke vs.Rate
Proudction point: All laterals at 30%, P = 2358
Rate = 14.5 MBOD
Figure 2.6: Well’s Rate Based on Smart Choke Settings

18
Such tests indicate the productivity of each lateral and optimum rate could be found
utilizing different combinations of choke settings or even shutting-in poor laterals that
reduce that productivity of the well.

19
CHAPTER III
ECONOMIC MODELS FOR SMART WELL TECHNOLOGY
Petroleum projects as any business development project should be technically and
economically feasible to be executed. Every project has to be thoroughly checked and
many scenarios should be run and the best project to meet the company goals should be
selected. Many oil companies select development projects based on the best economic
outcome of the projects (maximizing NPV). However, some oil companies have different
goals in field development projects such as maximizing ultimate recovery, reducing water
production or minimizing intervention cost and many other goals.
In smart well projects standard petroleum engineering economics practices are
used to evaluate projects. Many authors have written about ways to find the value of
smart well completions and possible ways to assess their value prior to starting the
projects.
3.1 Gai Model Gai12 has discussed the challenges and the difficulties that surround the measurement of
smart well benefits. The author elaborated on different industrial points of view in
regarding the benefits and the set backs that affect the overall values of smart well
technology. The end product that the author proposed was a models that encounters
options and risk analysis. Figure 3.1 is the proposed flowchart of the value assessment
method proposed by the author:

20
Figure 3.1: Flowchart of the Smart Technology Value Assessment Method (Reproduced from SPE 77941)12
This method is a process that is carried out in several steps with many scenarios in
order to find the best economic case. The author proposes a very interesting and logical
method to examine the applicability and the profitability of smart well technology in new
field developments.
DO
CU
ME
NTA
TIO
N
DO
CU
ME
NTA
TIO
N

21
3.2 Sakowski, Anderson and Furui Model Sakowski et.al13 have explored the possible impact of smart well on the economics of
field developments. The main idea discussed in this paper is the possible incremental
NPV increase by utilizing smart well technology over conventional completions. This
method as in the previous one uses reservoir simulation data and then economical data
are generated based on the reservoir model. Figure 3.2 is a flowchart of this method:
Figure 3.2: Reservoir and Economical Analysis Processes for Smart Well Completion (Reproduced From SPE 94672)13
The model described above is simple and fluid and complies with most of the
project analysis methodologies. Completion architecture and reservoir simulation models
Identify a Possible Application of IWS
Define Architecture of Basic and IWS Completion
Simulate Behavior of IWS (Nodal analysis and Simulation)
Increase Production Rate or Recovery Factor
Redefine Architecture Of IWS Completion
Carry-Out Economic Analysis of Project
Desired Deliverability
Execute the IWS Project
Consider other Alternatives

22
are the main drivers in this model. Most of project should carry out similar analysis prior
to selecting development type.
Both methods discussed above are great ways to generate different scenarios and
their probable economic outcomes. Reservoir simulation, nodal analysis and cost data
should be accurate, and reliable. Reservoir simulation is the least accurate of the other
data but nevertheless it is still a great tool to estimate the rate of the development project.
In this next section I will take the task of reviewing fields already developed by
smart well technology. Different scenarios will be suggested to draw a solid comparison
between the SWT and the regular completions scenarios.

23
CHAPTER IV
ECONOMIC REVIEW OF ACTUAL FIELD CASES
4.1 Giant Field Development of Onshore Carbonate Field Haradh-III field is part of the great Ghawar field in Saudi Arabia. The reservoir geology
along with the completion design is discussed in a paper by Afaleg et.al14. I will discuss
the geology of the reservoir along with the reasons for smart completion applicability in
the field.
The Arab-D reservoir is a carbonate reservoir overlain by an anhydrite layer. The
reservoir is divided into four zones according to rock quality. The top zone is referred to
as zone-1 and it is a thin low porosity zone. The rock is predominately dolomitic lime
grainstone.
Zone-2 is separated from zone-1 by a thin anhydritic dolomite layer. Zone-2 is
subdivided into two sub-zones zone-2A and zone-2B. Zone-2A is a high porosity and
high permeability rock that is composed of skeltel-peloidal lime grainstones. The quality
of the rock in zone-2A worsen upward with lower permeability and porosity with
burrowed packstone and dolomitized mudstones. Vugs are common in the quality parts of
zone-2A which capitulate super-permeable zones.
Zone-2B follows zone-2A and its lower part show moderate porosity and
permeability of stromatoporoid rudstone to floatstone with a a wackestone/packstone
matrix. This rock then improves upward to a high prosity/permeability skeletal-peoloidal
packstone to grainstone at the bottom to a burrowed packstone at the top. The uppers
zones usually show higher presence of dissolution vugs that cause local super-

24
permeability zones. Zones 3 and 4 show lower quality rock with low permeability and it
is observed that the zones have high abundance of natural fractures due to the drap
folding of the reservoir.
The fluid flow characteristics of the reservoir indicate that the combination of the
super-permeable streaks along with the natural fractures will have a significant role in the
reservoir recovery processes. The fluid flow mechanisms were discussed thoroughly in
the paper by Pham et al15. The main concept to be understood in this reservoir is that the
reservoir is not a naturally fractured reservoir but it is a reservoir with fractures.
Super-permeable zones act as productivity enhancers when the one phase (oil) is
being produced (Figure 4.1). However, as water moves upward in the reservoir and
reaches the super-permeable zone it acts as a productivity detractor and most of the time
causes the well to die (Figure 4.2).
Figure 4.1: Super-Permeable Zone Acts as a Productivity Enhancer15

25
Figure 4.2: Super-Permeable Zone Acts as a Productivity Detractor15
The same analogy can be transformed for vertical fractures in the reservoir.
Horizontal wells have shown high production rates after intersecting fractures but as soon
as injection water has reached the bottom of the reservoir and connected with the vertical
fracture the productivity of these wells had decreased with high water cuts (Figure 4.3).
Figure 4.3: Horizontal Well Intersecting Vertical Fracture15

26
4.1.1 Development Scenarios and Economic Analysis The field could be developed in several completion strategies such as vertical, horizontal
and multi-lateral developments. The large field is planned to be produced at 300,000
BBL/day16. Vertical, horizontal and multi-lateral development scenarios were prepared
from early trial wells and table 4.1 indicates their requirements.
Table 4.1: Haradh Field Requirements for Full Field Development.
Type Rate/well STB/D Number of Well Required for Field Development Vertical 1,100 280
Horizontal 3,500 80 MRC 10,000 32
Maximum reservoir contact (MRC) wells consist of three laterals with a minimum
of 5 kilometers of reservoir contact. However, the reservoir’s geology necessitates the
installation of downhole control valves to control fluids inflow from each lateral.
4.1.2 Economic Requirements The field is planned to be produced at 300,000 STB/D, hence the income out of the field
will be the same. In such projects the main controllable factor is to reduce the capital
expenditure to maximize the economic outcome of the project. The costs of the
previously mentioned development scenarios will be examined to find the lowest
development cost. Table 4.2 reveals the average costs of drilling and tie-in.

27
Table 4.2: Haradh Field Wells’ Drilling Costs Data. Type Cost/Well, $
Vertical 1,200,000
Horizontal 2,800,000
Smart 5,700,000
The formula used for the calculation of the cost development cost is;
Cost)in -Tie * WellsOf (# )WellCost * WellsOf # (Cost += ………………4.1
The results of these calculations are shown in table 4.3:
Table 4.3: Final Development Costs for all Scenarios for the Haradh Field.
Type CAPEX, Million $ Relative Cost to Vertical Development Vertical 546 1
Horizontal 284 0.52 Smart 206.4 0.38
The high cost of vertical well development was a result of the high number of
wells and surface tie-ins required to operate the field under the required rate. Horizontal
well development indicated a 50% savings from the vertical development due to the less
well and surface requirements. Maximum reservoir contact wells equipped with smart
well technology showed the cheapest results of the other types.
4.2 Commingled Production for an Offshore Nigerian Field The Garben field is located in the Nigerian delta near the developed Usari field17. The
field consists of seven reservoirs with many uncertainties due to the bad seismic data and
lack of wells drilled in the area. All the reservoirs are sandstones with heavy faulting in
the area.

28
Figure 4.4: Garben Field General Geology (After Brock et al)17
As indicated in figure 4.4 the reservoirs are small and only require three wells for
development for all seven reservoirs. The first well was drilled to produce three
reservoirs under commingled flow with smart well completion.
The three reservoirs were tested separately utilizing the smart well completion
and test results are illustrated in figure 4.5:

29
Reservoir Productivity Index Test
0
2000
4000
6000
8000
10000
0 200 400 600 800
Drawdown Pressure in Psig
Pro
duct
ion
Rat
e in
B
BL/
D 7 US1G
8 US1G
9 US1G
Figure 4.5: Garben Field’s Reservoirs Productivity Tests (Reproduced From SPE 101021)17
The production tests indicated that the productivity indexes of the reservoirs are
shown in table 4.4:
Table 4.4: Productivity Index Values for Each Reservoir. Reservoir Productivity Index, STB/D/psi 9-US1G 20 8-US1G 9 7-US1G 85
4.2.1 Economic Analysis The main concept applied in this project to calculate the smart well cost and compare it to
the development cost of the three wells (one well per reservoir). The first year of
production for the smart well is provided. The expected rates for the single reservoir
wells will be calculated using the productivity index values for the reservoirs along with
the operational drawdown.
DrawdownPIQ reservoirreservoir *= …………………………………………………….4.2

30
Tables 4.5 and 4.6 show the production results for the two cases:
Table 4.5: All Wells Are Producing at a Drawdown of 120 psig.
Month Qsmart, STB/D Qus7g, STB/D Qus8g, STB/D Qus9g, STB/D
1 12,400 10,080 1,129 2,354 2 12,000 10,080 1,129 2,354 3 11,500 10,080 1,129 2,354 4 11,000 10,080 1,129 2,354 5 11,000 10,080 1,129 2,354 6 11,000 10,080 1,129 2,354 7 11,000 10,080 1,129 2,354 8 11,000 10,080 1,129 2,354 9 11,000 10,080 1,129 2,354
10 11,000 10,080 1,129 2,354 11 11,000 10,080 1,129 2,354 12 11,000 10,080 1,129 2,354
Table 4.6: Smart Well Producing at 120 psig and all the Other Wells Are Producing at a Drawdown
of 200 psig.
Month Qsmart, STB/D Qus7g, STB/D Qus8g, STB/D Qus9g, STB/D
1 12,400 16,800 1,882 3,923 2 12,000 16,800 1,882 3,923 3 11,500 16,800 1,882 3,923 4 11,000 16,800 1,882 3,923 5 11,000 16,800 1,882 3,923 6 11,000 16,800 1,882 3,923 7 11,000 16,800 1,882 3,923 8 11,000 16,800 1,882 3,923 9 11,000 16,800 1,882 3,923
10 11,000 16,800 1,882 3,923 11 11,000 16,800 1,882 3,923 12 11,000 16,800 1,882 3,923
The wells are being produced at constant rate due to the low pressure drawdown
from the reservoir. This low drawdown is selected to avoid early water and gas
breakthrough from aquifer and the gas cap. The aquifer and the gas will not be a big

31
factor unless the wells are being overproduced which will cause water and gas
encroachment through conning.
The completion time data along with the price estimates of drilling and smart well
completion equipment were used to calculate the cost of the smart well. The same
concept was used to calculate the cost of the conventional wells.
[ ] [ ] Cost Equipement Well (days) time DrillingdayCOSTrig
equipement smartSmart +��
���
���
��+= *$$ …..4.3
[ ] Cost Equipement Well (days) time DrillingdayCOSTrig
gular +��
���
���
��= *$
Re ……….4.4
The time of smart completion installation was incorporated in the drilling time
calculation. Tables 4.7 and 4.8 illustrate the factors taken into account for the cost
calculations:
Table 4.7: Drilling and Completion Time Breakdown for the Garben Field. Well Type Drilling Time, Days Completion Time, Days Smart well 40 40
Regular Well 40 19
Table 4.8: Cost Data for the Garben Field.
Rig Cost, $/Day 95,000 Well's Equipment Cost, $ 3,000,000 Smart Completion Cost, $ 1,700,000
The calculations showed that a smart well will cost 19.3 Million dollars and a
regular well for one reservoir will cost 15.6 Million dollars. Due to the lack of
information of the wells’ future performance net present value could not be performed.
Furthermore, to normalize the comparison between the smart well and the three wells
32
other economic factors were used. The concepts of dollars spent per barrel produced after
one year along with the payback period were used. The operating expenditures were
assumed to be 10% of the income of the wells’ production. The results found are
illustrated in figure 4.6 and table 4.9:
Payback Period for All Cases
-4.E+07
-2.E+07
0.E+00
2.E+07
4.E+07
6.E+07
8.E+07
1.E+08
0 0.5 1 1.5 2 2.5 3 3.5 4 4.5 5 5.5 6 6.5
Time, Months
Cum
lativ
e N
et C
ash
Flow
, $
3 Well at 200 Psig Drawdown
3 Wells at 120 psig Drawdown
1 Smart Well at 120 psig Drawdown
Figure 4.6: Pay Back Period for All Development Scenarios in the Garben Field Table 4.9: Cost per Barrel Produced for all the Development Scenarios for the Garben Field.
case $ spent/bbl produced
payback period, months
smart well 5.5 1.3 3 wells at 120 psi
drawdown 7.7 2.5
3 wells at 200 psi drawdown
5.6 1.5
33
The results indicate that smart well completion provide cheaper cost per barrel
produced when compared to conventional completion in this case. However, this does not
mean that NPV analysis should agree with these results. Moreover, the ultimate recovery
may not be higher for the smart well.
4.3 Multi-Lateral Well Overlain by a Gas Cap Offshore Norway The Oseberg Field is located offshore Norway in the North Sea18. This field is considered
a giant field with access of 3 billion barrels in place. The Tarbert, Ness and the ORE
formations make up the good reservoir quality zones for the field. The well in focus in
this study was drilled in the Ness formation. Sand channels are present in the formation
which confines the communication between quality rock sections in the reservoir.
4.3.1 Why Smart Well Technology? The field was initially developed on deviated well technology. However, with the long
production history in the field the oil column shrunk from 200 ft to 20-40 ft. The deviated
wells have experienced high GOR as the gas-oil contact got deeper in the reservoir.
Therefore, horizontal wells were introduced to the field to mitigate the gas encroachment
problem and avoid high water cuts from the water aquifer.
However, as production continued the horizontal wells were also experiencing
access gas production. Therefore, multi-lateral wells with smart completion were
suggested as a solution to continue production without access gas production. Laterals
with high gas oil ratio can be restricted or shut-in while other laterals can be still
produced from the same well.
34
The well that is being examined in this study is a four-lateral horizontal well in
the Ness formation. A smart well completion was installed in this field as a mean of
controlling unwanted fluids when necessary. Initial production tests indicated access gas
production from well (all laterals open). The ICVs were adjusted to minimize the gas
production which might increase the water production. After several test a certain
combination of ICV positions showed a smaller GOR from the well along with oil
production increase. Figure 4.7 shows the results of the smart well case against the
conventional well:
Cumulative Production
0
200,000
400,000
600,000
800,000
1,000,000
1,200,000
1,400,000
0 0.5 1 1.5 2 2.5 3 3.5
Time in months
Cum
ulat
ive
Pro
duci
ton,
BB
L
With ICV
Without ICV
Figure 4.7: Cumulative Production History for the Osberg Field (Reproduced from SPE -62953)18
4.3.2 Economic Analysis The results of the wells production tests will be used to create an economic comparison
between the smart well and a multi-lateral well without any inflow control option. The

35
method used in this case is similar to the method used in the Nigerian field discussed
earlier. The first three months of production will be used to create the dollars spent bbl
produced.
The cost data along with the drilling time analysis are given in tables 4.10 and
4.11:
Table 4.10: Drilling Time Estimates for the Osberg Field.
Well Type Time, Days Multi-Lateral 70
Multi-Lateral With Smart Completion 80
Table 4.11: Drilling Cost Estimates for the Osberg Field. Rig Cost, $/Day 95,000
Well's Equipment Cost, $ 3,000,000 Smart Completion Cost, $ 2,200,000
The results of the economic review revealed that the smart well completion has a
cheaper cost per barrel produced than the conventional multi-lateral completion. Also,
more reserves have been exploited in the production time period. Furthermore, the
payback period is slightly quicker for smart well completion than the multi-lateral well.
Figure 4.8 and table 4.12 show the economic analysis from this field.

36
Pay Back Period Graph
-1.5E+07
-1.0E+07
-5.0E+06
0.0E+00
5.0E+06
1.0E+07
1.5E+07
2.0E+07
0 0.5 1 1.5 2 2.5 3 3.5
Time, Months
Cum
ulat
ive
Cas
h Fl
ow, $
Smart Well
Multi-LateralWell
Figure 4.8: Pay Back Period Graph for the Osberg Field
Table 4.12: Cost per Barrel Produced for all the Development Scenarios for the Osberg Field
case $/bbl produced payback period, months
smart well 11 1.25 multi-lateral well 14 1.2
4.4 Multi-Lateral Well Under Pattern Injection Offshore Norway
The Gullfaks South Statjford field is located offshore Norway. The limestone reservoir
has low permeability and is the fluid type if light oil19. Multi-lateral wells in an injection-
production pattern were introduced to seize the pressure decline in this mature field.
However, the water cut started increase in the field with some wells reaching 99% WC
and a field wide average of 75%.
The smart completion was suggested to restore productivity in some of the high
water cut producers. A four-lateral horizontal well was picked as a trial well to check the

37
applicability of smart completion in the filed. The well was initially drilled as a four-
lateral horizontal on a producer-injector pattern. A workover was performed to install the
downhole control valves in this well. The smart completion revealed that two laterals are
producing mostly water without any oil. These laterals were then shut-in and productivity
was restored to the well.
4.4.1 Economic Analysis This field presents itself as a very interesting case because of the long production history
with smart well completion. I have chosen to run three completion installation cases with
different oil price scenarios. The first case consists of the actual production and
completion history. The second case will assume that the smart completion was installed
after the well was drilled. However, the production will be back to production after two
and a half year as the operated can quickly detect the ineffective laterals by the use of
smart well testing.
The third case will assume that the well was abandoned after three years of
production without any remedial actions. The production profiles of the three cases are
shown in figure 4.9-4.11.
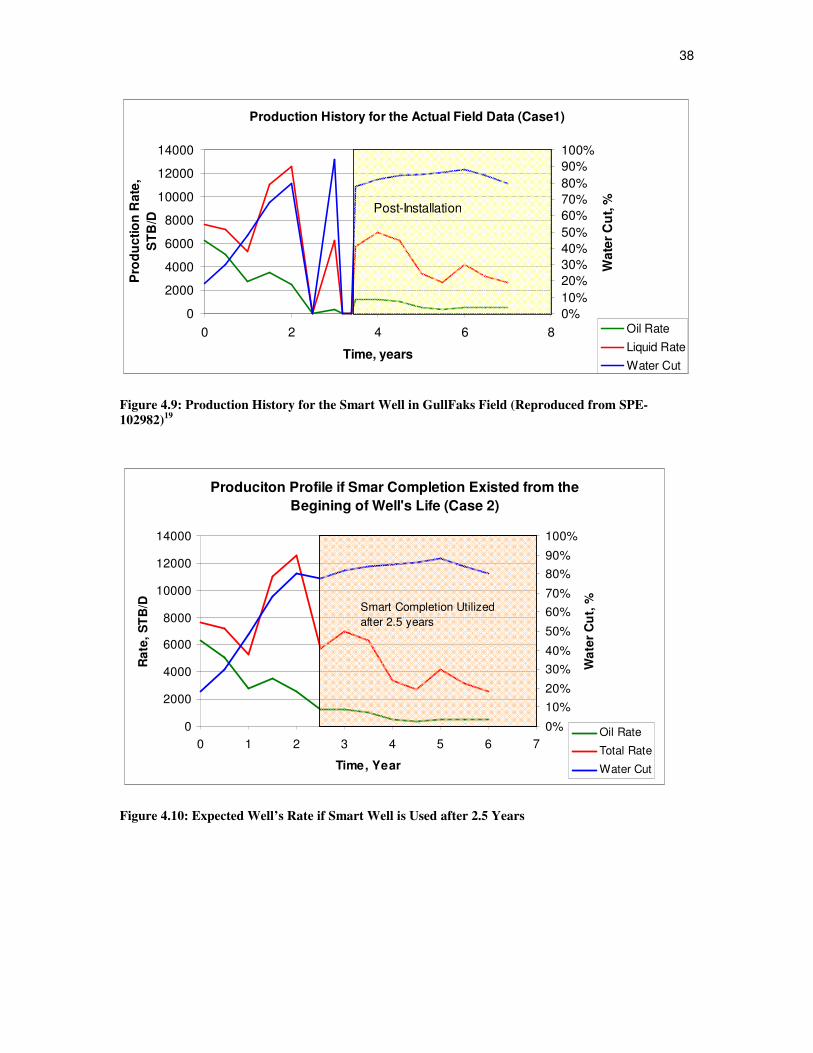
38
Production History for the Actual Field Data (Case1)
0
2000
4000
6000
8000
10000
12000
14000
0 2 4 6 8
Time, years
Pro
duct
ion
Rat
e,
ST
B/D
0%10%20%30%40%50%60%70%80%90%100%
Wat
er C
ut,
%
Oil RateLiquid RateWater Cut
Post-Installation
Figure 4.9: Production History for the Smart Well in GullFaks Field (Reproduced from SPE-102982)19
Produciton Profile if Smar Completion Existed from the Begining of Well's Life (Case 2)
0
2000
4000
6000
8000
10000
12000
14000
0 1 2 3 4 5 6 7
Time, Year
Rat
e, S
TB
/D
0%
10%20%
30%40%
50%
60%70%
80%90%
100%
Wat
er C
ut,
%
Oil Rate
Total Rate
Water Cut
Smart Completion Utilized after 2.5 years
Figure 4.10: Expected Well’s Rate if Smart Well is Used after 2.5 Years

39
Production Profile When the Well is Abondened after 3 YearsCase 3
0
2000
4000
6000
8000
10000
12000
14000
0 0.5 1 1.5 2 2.5 3 3.5
Time, Years
Rat
e, S
TB/D
0%10%20%30%40%50%60%70%80%90%100%
Oil RateTotal RateWater Cut
Figure 4.11: Production Rate if the Well was Abandoned after 3 Years Simple net present value analysis will be used to determine the economic values
of these projects. These projects are all assumed to reach economic limit. Table 4.13 will
illustrate the economic factors used in this study. These three cases will be run for three
oil price scenarios to investigate the role of oil price in the economics of this project.
Table 4.13: Estimated Rig Time and Cost Data for the GullFaks Field. Rig Rate, $/Day 95,000
Drilling Time, Days 90Workover Time 10
Well Equipement Cost, $ 3,000,000Smart Completion Cost, $ 2,200,000
Water Treatement Cost, Cents/BBL 50.0OPEX,% of Revenue 5%
Discount Rate 10%
A sample calculation for the first case under 40 $/BBL is shown in table 4.14 to
show the methodology of the calculations20.

40
Table 4.14: Sample NPV Calculation for Case 1 and Oil Price of 60 $/bbl.
Time, Years CAPEX Produced Oil, STB Produced Water, STB Income, MM$ OPEX, MM$ Profit, MM$ NPV, $0 11,550,000 -11.55 -11.551 1,715,357 1,583,407 102.92 5.94 96.98 88.172 1,072,098 1,905,952 64.33 4.17 60.16 49.723 352,261 2,850,111 21.14 2.48 18.65 14.014 4,150,000 258,511 2,091,591 15.51 1.82 9.54 6.525 321,629 1,516,253 19.30 1.72 17.57 10.916 183,788 1,177,606 11.03 1.14 9.89 5.587 187,234 982,980 11.23 1.05 10.18 5.22
168.58Project NPV, $ =
The results of the calculations indicated that the installation of the smart
completion will improve the economic outcome of the well. Furthermore, the ultimate
recovery will be more if the completion is installed.
NPV Comparison for the Three Cases with Different Oil Prices
168.58 172.36
143.80
45.1937.12
43.71
106.14 108.77
90.46
0.00
20.00
40.00
60.00
80.00
100.00
120.00
140.00
160.00
180.00
200.00
Case-1 Case-2 Case-3
NP
V, M
illio
n $
Oil Price - 20 $/BBL
Oil Price = 40 $/BBL
Oil Price = 60 $/BBL
Figure 4.12: NPV Analysis for the Three Development Scenarios under Different Oil Prices
The analysis suggests (as shown in figure 4.12) that the oil price plays a pivotal
role in the decision making process for smart well installation. The high oil price case
showed the better results which suggests that the higher the price the more attractive the

41
installation. It has to be noted that the project could have not put the well back in
production which will reduce the overall NPV of the project. However, risk is a part of
the petroleum industry and in this case the project has returned a good increase in the
NPV.
4.5 A Small Onshore Field Development in the Middle East The AH field is an onshore field with two carbonate commercial reservoirs. Some of the
reservoir properties are significantly different in the two reservoirs. Table-4.15 illustrates
the complete reservoir properties for both formations.
Table 4.15: AH Field Reservoir Properties.
Reservoir K H
Depth, ft 8,400 9,800 Khoriz, md 290 100 h, ft 80 100 KH, md-ft 23,200 10,000 µ, cp 1.70 0.75 Bo, BBL/STB 1.06 1.19 φ, % 21 19 Kv, md 26 25 API 28 35 Pressure, psi 4,140 4,843
The field is expected to be produced at a plateau of 100 MSTB/Day. The
reservoirs are different in size as illustrated in figure 4.13.

42
Figure 4.13: H and K Reservoir Structure Map
The Babu and Odeh21 method was used to calculate the expected rates of the
horizontal well cases.
ssCr
AB
ppbkkq
RHw
o
wfzy
++−+��
���
����
�
�
��
�
� −=
−
75.0lnln2.1415.0
µ ………………………………………….4.5
The multi-lateral wells calculations were also estimated using the Babu and Odeh
model. However, the junction pressure where the two reservoir fluids met had to be
equalized. Tables 4.16 and 4.17 show the expected rates for all the cases run in this study.
Table 4.16: Expected Rates for Horizontal Well Designs. Design 500 m Well 750 m Well 1 Km Well
Reservoir Rate, STB/D Pth, psi Rate,
STB/D Pth, psi Rate, STB/D
Pth, psi
K 8911 586 12500 485 16800 430
H 8000 586 11000 900 14900 778
Table 4.17: Multilateral Well Production Rate Prediction. Pjunction 3340 psi
Rate 22,500 STB/D Pth 685 psi

43
4.5.1 Economic Analysis Utilizing the above mentioned production predictions the following development
scenarios were found (table 4.18).
Table 4.18: Number of Wells Required for Field Development.
Well Type 500 m Well 750 m Well 1 Km Well Smart Well
Reservoir K H K H K H Both H Number of Wells 2 10 2 7 2 5 2 4
The number of wells for K reservoir was limited to two wells due to the small
size of the reservoir. Two commingled wells equipped with smart well completion along
with four H reservoir wells were chosen for the smart well development plan. The
commingled wells were equipped with smart completion to control the flow from each
reservoir.
The average drilling costs were collected from fields nearby the AH field. This
data was used to compile the capital expenditure values for the development scenarios.
The results are tabulated in tables 4.19 and 4.20.
Table 4.19: Estimated Drilling Cost per Well.
Well Type 500 m Well 750 m Well 1 Km Well Smart Well
Reservoir K H K H K H Both Reservoirs
Cost/Well, MM $ 2.80 3.00 2.90 3.10 3.00 3.20 5.50

44
Table 4.20: Overall Development Costs for All Scenarios.
Well Type 500 m Well 750 m Well 1 Km Well Smart Well
Drilling Cost, MM$ 35.60 27.50 22.00 24.20
Tie-In Cost, MM $ 9.00 6.75 5.25 4.50
CAPEX, MM $ 44.60 34.25 27.25 28.70
The calculations indicate that the best development scenario is the 1 Km
horizontal wells for both reservoirs. The smart well scenario does provide a good
development cost but it is still not the most economic scenario. This higher cost is caused
by the low number of conventional wells required to develop this small field.

45
CHAPTER V
CONCLUSIONS AND RECOMMENDATIONS
5.1 Conclusions On the basis of this research I have come up with following conclusions:
1. The actual field data for smart well technology suggests a greater economic
return than conventional completion.
2. Smart well technology economics are dependent on oil prices. In many
instances, the installation looks more attractive as the oil price increases.
3. Offshore multi-laterals and commingled pay production projects are excellent
environments for smart well technology implementations.
4. Smart completion wells cost in average 35% more than conventional drilling
in offshore development. They cost 48% more in onshore developments.
5. The cost of the smart completion in smart wells is in average 15% of the
well’s total cost in offshore developments. In onshore developments it usually
averages 28% of the total well’s cost.
6. Smart multi-laterals can provide a significant capital expenditure reduction.
7. Smart well technology can increase the development cost in small onshore
fields with limited number of wells.

46
5.2 Recommendations Based on this research, the following recommendations are suggested:
1. The implementation of pre-development or re-development trial tests are
encouraged for smart well completions.
2. Smart well technology should be used in multi-lateral wells that are developed
in high geological risk areas.
3. Evaluate the economic impact of smart wells that do not produce any oil, such
as, smart injectors and dump flooding wells as more data is collected.

47
NOMENCLATURE SWT Smart Well Technology
NPV Net Present Value
WC Water cut, %
STB Stock-Tank-Barrel
CH Shape Factor
B0 Oil Volume Formation Factor, BBL/STB
h Net thickness, ft
Sr Partial Penteratoin skin
S Skin Factor
k Reservoir permeability (horizontal if not denoted), md
kz, Permeability in the Z-Direction, md
zy Permeability in the y-Direction, md
pavg Average reservoir pressure, psi
pwf Flowing bottomhole pressure, psi

48
REFERENCES
1. “Annual Energy Outlook 2006 with Projections to 2030 Overview,” DOE/EIA,
Office of Integrated Analysis and Forecasting, EIA, Washington DC (2006).
2. Saleri, N.G.: “Technology Tomorrow: The Next Trillion: Anticipating and Enabling
Game-Changing Recoveries”, JPT Online (April 2006).
3. “Oil Field Glossary”, Schlumberger, http://www.glossary.oilfield.slb.com/
Display.cfm?Term=intelligent%20well , February 2007.
4. “Intelligent Well Overview”, http://www.slb.com/content/services/
completion/intelligent/intelligent_completions.asp? , February 2007.
5. “The Definition SmartWell”, Well Dynamics, http://www.welldynamics.com/
technology/smartwell_definition.htm., February 2007.
6. “What Exactly is an Intelligent Well?”, IWRG, http://www.iwellreliability.com/
IntelligentWells.cfm, February 2007.
7. “Introduction to IWS”, Baker Hughes, http://www.bakerhughesdirect.com/cgi
/bot/resources/ExternalFileHandler.jsp?path=/private/BOT/public/iws
/intro.html&BV_SessionID=@@@@1861850180.1170370781@@@@&BV_Engin
eID=ccccaddkdfmehhicefecfefdfmldhfl.0&channelId=-4200541, February 2007.
8. Glandt C.A.: “Reservoir Management Employing Smart Wells: A Review”, SPE
Drilling & Completion Journal, December 2005. 20(4): p. 281-288.
9. “Accelerated Production”, Well Dynamics, http://www.welldynamics.com/
technology/applications/applications.htm , February 2007.

49
10. Snaith, N. et.al: “Experience with Operation of Smart Wells to Maximize Oil
Recovery from Complex Reservoirs,” paper SPE-84855 presented at the 2003
International Improved Oil Recovery Conference, Malaysia October 20-21, 2003.
11. Konopczynski, M. and Ajayi, A.: “Design of Intelligent Well Downhole Valves for
Adjustable Flow Control”, Presented in the 2004 SPE Annual Technical Conference
and Exhibition, Houston, September 26-29, 2004.
12. Gai, H.: “A Method to Asses the Value of Intelligent Wells”, Presented in the 2002
SPE Asia Pacific Oil and Gas Conference and Exhibition, Melbourne, October 8-10,
2002.
13. Sakowski, S. A, et.al.: “Impact of Intelligent Well System on Total Ecnomics of Field
Development”, Presented in the 2005 SPE Hydrocarbon Economics and Evaluation
Symposium, Society of Petroleum Engineers: Dallas, April 3-5, 2005.
14. Afaleg N.I. et.al: “Design and Deployment of Maximum Reservoir Contact Wells
with Smart Completion in the Development of a Carbonate Reservoir”, Presented in
the 2005 SPE Pacific Oil and Gas Conference and Exhibition, Jakarta, April 5-7,
2005.
15. Pham T.R.: “Field Development of a Carbonate Reservoir with Super-K and Natural
Fractures Using Maximum Reservoir Contact Wells with Smart Completion”,
Presented in the 2006 SPE Asia Pacific Oil and Gas Conference and Exhibition,
Adelaide, September 11-13, 2006.
16. Saleri, N.G.: “Haradh III A Milestone for Smart Fields”, JPT Online (November
2006).
17. Brock, W.R.: “Application of Intelligent-Completion Technology in a Triple-Zone
Gravel Packed Commingled Producer”, Presented in the SPE Annual Technical
Conference and Exhibition, San Antonio, September 24-27, 2006.

50
18. Elrandsen, S. M.: “Production Experience from Smart Wells in the Oseberg Field”,
Presented in the 2000 SPE Annual Technical Conference and Exhibition, Dallas,
October 1-4, 2000.
19. Ajayi, A. and Konopczynski, M.: “Intelligent-Well Technology Reduced Water
Production in a Multilateral Oil Producer”, Presented in the 2006 SPE Annual
Technical Conference and Exhibition, San Antonio, September 24-27, 2006.
20. Mian, M. A, Project Economics and Decision Analysis (Volume 1: Deterministic
Models), PennWell Corporation, Tulsa (2002).
21. Babu, D. K. and Odeh, A.S.: “Productivity of a Horizontal Well” SPE Reservoir
Engineering, p. 417, November, 1989.

51
VITA
NAME: ABDULLATIF A. Al OMAIR PERMANENT ADDRESS: Saudi Aramco P.O.Box, 1446 Dhahran, 31311 Saudi Arabia EDUCATION: B.S., Petroleum Engineering (Cum Laude) The University of Tulsa Tulsa, Oklahoma May 2002 M.S., Petroleum Engineering (Sponsored by Saudi Aramco) Texas A&M University, May 2007


