ECONOMIC & ENVIRONMENTAL BENEFITS OF A … · ECONOMIC & ENVIRONMENTAL BENEFITS OF A ... • the...
60
ECONOMIC & ENVIRONMENTAL BENEFITS OF A DEPOSIT SYSTEM FOR BEVERAGE CONTAINERS IN THE STATE OF WASHINGTON Prepared by: Dr. Jeffrey Morris Sound Resource Management Group Olympia, Washington 360-867-1033 [email protected] Bill Smith City of Tacoma Tacoma, Washington 253-593-7719 [email protected] Rick Hlavka Green Solutions South Prairie, Washington 360-897-9533 [email protected] Prepared for: City of Tacoma Solid Waste Management 3510 S. Mullen Street Tacoma, WA 98409 April 2005
Transcript of ECONOMIC & ENVIRONMENTAL BENEFITS OF A … · ECONOMIC & ENVIRONMENTAL BENEFITS OF A ... • the...

ECONOMIC & ENVIRONMENTAL BENEFITSOF A
DEPOSIT SYSTEM FOR BEVERAGE CONTAINERSIN THE STATE OF WASHINGTON
Prepared by:
Dr. Jeffrey MorrisSound Resource Management Group
Olympia, Washington360-867-1033
Bill SmithCity of Tacoma
Tacoma, Washington253-593-7719
Rick HlavkaGreen Solutions
South Prairie, Washington360-897-9533
Prepared for:
City of Tacoma Solid Waste Management3510 S. Mullen StreetTacoma, WA 98409
April 2005

Economic and Environmental Benefits of a Deposit System for Beverage Containers in Washington State
Prepared by Sound Resource Management Group, Green Solutions and the City of Tacoma i
ACKNOWLEDGMENTS
The authors would like to give special thanks to the following for providing information that wasused in this report:
• the Northwest Product Stewardship Council (NWPSC),
• various organizations and staff in other states,
• several Washington State Department of Ecology staff, and
• the Container Recycling Institute (CRI).
This study was funded by the City of Tacoma Environmental Services Division.
Printed on recyclable, recycled-content paper

Economic and Environmental Benefits of a Deposit System for Beverage Containers in Washington State
Prepared by Sound Resource Management Group, Green Solutions and the City of Tacoma ii
CONTENTS
PageExecutive Summary
The National Overview .......................................................................................................... E-1The Situation in Washington State ......................................................................................... E-2
A. Amount of Materials Captured through a Deposit System ........................................ E-3B. Quantifiable Benefits ................................................................................................. E-3C. Non-Quantifiable Benefits ......................................................................................... E-4D. Bottle Bill: Significant Additional Benefits at Reasonable Cost ............................... E-4
Conclusion .............................................................................................................................. E-5
I. Current Systems
A. Current Programs in Washington State and the City of Tacoma ........................................ 1B. Deposit Programs in Other States ........................................................................................ 3C. Potential Results of a Deposit System in Washington State ............................................... 4
II. Container Deposit Systems
A. What are the Possible Approaches to a Container Deposit System? .................................. 7B. Compatibility with Existing Recycling Programs ............................................................. 11
III. Public Health and Environmental Benefits of Increased Bottle Recovery
A. What are the Public Health and Environmental Benefits of IncreasedBottle Recovery and How Much are They Worth? .......................................................... 13
B. Additional Public Health and Environmental Cost Savings .............................................. 22C. Public Health and Environmental Benefits of Increased Beverage Container
Recovery that have not yet been Quantified ..................................................................... 27
IV. Economic Benefits of Increased Bottle Recovery
A. Deposit Dollars .................................................................................................................. 29B. Economic Benefits ............................................................................................................. 31
V. Cost of Deposit System
A. Administrative and Handling Costs for Deposit Systems ................................................. 37B. Loss of Market Revenues for Residential and Commercial Recycling Programs ............. 42C. Other Potential Costs ......................................................................................................... 43
VI. Conclusions
A. Summary of Environmental and Economic Costs and Benefits ........................................ 45B. Next Steps .......................................................................................................................... 45

Economic and Environmental Benefits of a Deposit System for Beverage Containers in Washington State
Prepared by Sound Resource Management Group, Green Solutions and the City of Tacoma iii
Table of Contents, continued
GLOSSARY ................................................................................................................................. G-1
REFERENCES ............................................................................................................................. R-1
LIST OF TABLESPage
E-1. Summary of Costs and Benefits ................................................................................... E-31-1. Historical Recycling Rate ................................................................................................ 11-2. Amount of Cans and Bottles in Litter ............................................................................. 21-3. Percent of Cans and Bottles in the Waste Stream ........................................................... 31-4. Amount of Cans and Bottles Recycled and Disposed ..................................................... 53-1. Public Health and Environmental Impacts from Used Beverage
Containers in Washington State in 2002 ....................................................................... 233-2. Public Health and Environmental Impacts from Used Beverage
Containers in the City of Tacoma in 2002 .................................................................... 243-3. Estimated Cost of Public Health and Environmental Impacts from
Used Beverage Container Wasting ................................................................................ 254-1. Amount of Deposit Funds Collected ............................................................................. 304-2. Garbage Collection Cost Savings .................................................................................. 324-3. Recycling Collection Cost Savings ............................................................................... 345-1. Cost for Administrating and Handling Deposit Containers .......................................... 395-2. Table of Fees for Ontario Blue Box Recycling Program .............................................. 425-3. Lost Market Revenues for Existing Recycling Programs ............................................. 446-1. Summary of Costs and Benefits .................................................................................... 46
LIST OF FIGURESPage
2-1. Flow of Containers and Deposits in Traditional System ................................................ 83-1. Life Cycle Inventory and the Waste Management System ........................................... 153-2. Comparative Energy Usage for Recycled vs. Virgin-Content Products ....................... 183-3. Total Energy Usage for Recycling vs. Disposal Life Cycle .......................................... 193-4. Net Energy Usage for Recycling vs. Landfilling with Energy Recovery .................... 203-5. Net Greenhouse Gas Reduction for Recycling vs. Landfilling with
Energy Recovery ........................................................................................................... 203-6. Net Human Toxicity Reductions for Recycling vs. Waste-to- Energy Incineration ..... 214-1. Average Market Value for Wasted Beverage Containers ............................................. 31

Economic and Environmental Benefits of a Deposit System for Beverage Containers in Washington State
Prepared by Sound Resource Management Group, Green Solutions and the City of Tacoma E-1
Executive Summary
The National OverviewRecycling has now come full circle. Where once recyclers collected various materials with hope and aprayer that they could find markets for them, demand now exceeds supply for most materials. At thesame time, results of recycling programs across the country have stagnated, and the best efforts forcurbside and commercial recycling programs can only expect a 30% to 50% recovery rate. Clearly it istime to examine new approaches to recycling, or perhaps to re-consider old approaches. One suchapproach is a “bottle bill,” or a deposit on containers, which provides a financial incentive for people torecycle their bottles and cans. Granted, this approach only addresses a portion of the resources that arecurrently being wasted, but other materials in our discards are being addressed through various otherprograms under development now (as in the case of electronics and compostable materials) or will needto have their own solutions developed soon.
There is no doubt that “bottle bills” are an effective method of boosting recovery rates. The eleven statesthat have container deposits account for 55% of the national recovery rate with only 29% of thepopulation. These residents account for 490 containers per capita per year at a cost of 1.53 cents percontainer. The 40 non-deposit states which rely solely on curbside or drop off recycling programsrecycle less than half as much, only 191 containers per capita per year, at a cost of 1.25 cents per unit.Either the residents of these 11 states are more environmentally aware and concerned than the rest of usor the container deposits have something to do with the increased recovery rate.Beverage container sales are growing, particularly for new beverages such as bottled water and othernon-carbonated drinks. As sales have increased, so has waste. In 2002, an estimated 118 billionaluminum, glass and plastic beverage containers were wasted nationwide, an 83% increase in wastingsince 1992, and a 109% increase since 1982. There are costs associated with managing discarded one-way beverage containers, whether through recycling, disposal or litter clean up. The question forpolicymakers is “Who should pay these costs?” Refundable deposits shift the costs of managingdiscarded containers from government and taxpayers to producers and consumers of the beverageproducts.Container recovery is down nationwide for all types of containers even though the number of householdswith access to curbside recycling has increased 600% since the early 1990’s. Aluminum recovery isdown from a high of 65% in 1992 to 48% in 2002; plastic bottle recovery is down from a high of 40% in1995 to less than 20% in 2002. Glass container recovery has remained fairly constant at 30% but glass israpidly becoming a contaminant to the recycling stream because of the way it is collected.
Most recycling systems collect glass commingled or mixed with other recyclables for faster, moreefficient collection, which unfortunately results in a mixture of the colors of glass that is highlycontaminated. Glass processors would prefer that glass be collected separately and separated by colorbut to do this is very slow and expensive for the collectors, and difficult for the recycling participants.The advent of “single stream” or commingled recycling has reduced the market value of glass to anegative in most cases. It is estimated that single stream recycling will be the dominant collectionmethod within 5 years. In addition, because of the move away from glass as a container, the volumes ofglass in the recycling mix are decreasing as well. As a result of the changes in collection and theresulting negative market value, many jurisdictions already have or are considering dropping curbsideglass collection.
At the same time that recovery rates are declining, our domestic aluminum and plastics recyclers are indanger of going out of business for lack of supply. China’s emergence as an economic power hasenabled the Chinese to effectively compete for the increasingly limited supply of aluminum and plastic
Economic and Environmental Benefits of a Deposit System for Beverage Containers in Washington State
Prepared by Sound Resource Management Group, Green Solutions and the City of Tacoma E-2
containers collected for recycling. This has left our domestic recyclers short of supply, so short that theyare in danger of collapse. One major trade group for the plastics bottle recyclers has recently closed allof their satellite offices and another is sponsoring federal legislation to ban the export of bottles to China.
This wasting of containers has environmental impacts as well. Since the first Earth Day in 1970, 2.3trillion beverage containers have been wasted (landfilled, littered or incinerated) in the United States.This includes:
• 961 billion wasted aluminum beverage cans weighing about 17 million tons,• 324 billion wasted steel beverage cans weighing about 28 million tons,• 276 billion wasted PET plastic beverage bottles weighing about 11 million tons,• 190 billion wasted HDPE plastic beverage bottles weighing about 12 million tons, and• 600 billion wasted one-way glass beverage bottles weighing about 166 million tons.
While all this beverage container waste has taken up landfill space, and has contributed to litter on ournation’s roads, parks, beaches and other public places the more significant environmental impacts ofwasting these containers are in replacement production. That is, using virgin materials and vast amountsof energy to make new containers to replace those that were never recycled. Pound for pound,replacement production also creates more pollution - in the air, water and on land - than recycling does.Had the 2 trillion containers been recycled, the equivalent of 800 million barrels of crude oil could havebeen saved, and the emission of an estimated 600 million tons of greenhouse gasses could have beenavoided.
Many other environmental impacts could have been avoided as well, including the strip mining of rawbauxite ore and the flooding of vast forests to provide hydropower for the primary aluminum industry; oildrilling and its associated spills; many of the impacts of coal mining and burning; the generation of sulfurand nitrogen oxides (contributors to acid rain and smog) from energy production and other industrialprocesses and the emissions of toxic fluorides which harm livestock and vegetation.
The Situation in Washington StateCurrent recycling programs in Washington State are doing much to provide economic and environmentalbenefits. Economic benefits include the additional jobs created by industries using the recoveredresources and reductions in disposal costs. Environmental benefits are numerous and widespread. Theexisting approach to recycling, however, appears to have hit a point of maximum returns, unfortunatelywell short of the actual amount of recyclable materials being generated. At the same time, other stateshave clearly demonstrated the success of deposit systems for increasing the amount of bottles and cansrecycled. With the existing programs, approximately 33% of the beverage containers are being recycled.If a 10¢ deposit were placed on beverage bottles and cans, the recycling rate could climb to 90% or more.
A deposit system in the State of Washington would provide quantifiable economic and environmentalbenefits with an estimated annual monetary value of $93 million (see Table E-1, or see Table 6-1 formore detail). For the City of Tacoma, the benefits would amount to $2.1 million. There would also beextensive economic and environmental benefits that cannot yet be quantified.
The costs of a deposit system depend critically on the structure of the container redemption and handlingsystem. This report examines three different approaches for how returned containers and deposits couldbe handled: 1) redemption by retail stores, 2) the use of redemption centers, and 3) involvement by third-party organizations. The cost for each of these different approaches is shown in Table E-1. As can beseen by the results, a well designed and effective system could have a positive bottom line, even without

Economic and Environmental Benefits of a Deposit System for Beverage Containers in Washington State
Prepared by Sound Resource Management Group, Green Solutions and the City of Tacoma E-3
Table E-1Summary of Costs and Benefits
Cost or Benefit State of Washington City of TacomaBenefits from Reduced PublicHealth and Environmental Impactsof Beverage Container Disposal
$20,900,000 $707,000
Economic Benefits of IncreasedBeverage Container Recovery
$72,361,000 $1,400,400
Total Environmental andEconomic Benefits $92,969,000 $2,102,400Total Cost of Deposit System:
Option A) “Retail Store” Approach
Option B) Redemption Centers
Option C) Third-Party Organization
Range of Costs
$150,293,500
$61,043,500
$82,533,500
$61,043,500 to $150,293,500
$4,423,300
$1,801,300
$2,433,300
$1,801,300 to $4,423,300
Total Net Gain or CostTotal impact ranges from anet gain of $31,925,500 to a
net cost of $57,324,500
Total impact ranges froma net gain of $301,100 to a
net cost of $2,320,900
counting part of the benefits (such as additional employment opportunities or the economic value of partof the reduced public health costs and environmental damages).
The benefits of a container deposit system can be summarized as shown below.
A. Amount of Materials Captured through a Deposit SystemThe deposit system’s benefits result from a projected total recovery of 190,100 tons per year of beveragecontainers statewide. This includes an additional 112,500 tons per year of beverage containers, plus the77,550 tons already being recycled. Total collections would include:
• 135,500 tons of glass bottles;• 21,600 tons of plastic bottles; and• 32,380 tons of aluminum cans.
B. Quantifiable BenefitsA container deposit system would have many economic and environmental benefits, some of which arequantified in the following report. Quantifiable benefits include:
• $28.1 million in revenues from selling recovered beverage containers to recycling markets;• $10.4 million from reduced litter and waste management costs;• $11.3 million in reduced greenhouse gas emissions, mostly from energy savings as a result of not
manufacturing as many beverage containers from virgin materials; and• Another $9.6 million in reduced public health and environmental costs.

Economic and Environmental Benefits of a Deposit System for Beverage Containers in Washington State
Prepared by Sound Resource Management Group, Green Solutions and the City of Tacoma E-4
C. Non-Quantifiable BenefitsMany other positive impacts of the container deposit system are discussed in the report, but are notincluded in the monetary estimates for economic and environmental benefits because these impacts havenot yet been accurately quantified. Non-quantifiable benefits include:
• Stronger and more sustainable local economies as a result of using recycled materials to manufactureproducts;
• Recreational and aesthetic gains from reduced litter;• Reduced emissions of pollutants whose public health and environmental costs have not yet been
quantified;• Slower on-site accumulation of solid and hazardous wastes at resource extraction and processing,
energy generation, and manufacturing operations; and• Productivity improvements in agriculture, fishing and forestry due to reduced ecosystem impacts.
D. Bottle Bill: Significant Additional Benefits at Reasonable CostBased on the data and analysis contained in the report, we expect that a beverage container depositsystem would:
1. Recover more containers at a more reasonable cost than other recycling systems:
• Existing recycling systems are estimated to recover only 28% (by weight) of the beverage containers;• Many of the targeted containers are being lost during the recycling process, either due to breakage of
glass or by being incompletely sorted and then sent to the wrong market (such as cans and bottlesbeing carried along in bales of paper);
• Glass containers are causing problems for recycling programs throughout the state, and a depositsystem would provide an alternative method to handle over two-thirds of these;
• The results of curbside recycling programs have neared their peak, and there is no other method (noteven mandatory recycling) that can achieve the same recovery rate for containers as a deposit system.
2. Generate additional public health and environmental benefits totaling approximately $20.9 millioneach year from recovery of additional containers, as a result of:
• Substitution of recycled containers for virgin raw materials in manufacturing new containers andother products (which reduces the amount of pollution that occurs during virgin raw materialsdrilling, digging, or cutting and refining, smelting, or pulping);
• Reduced disposal of beverage containers (which lessens the release of chemical pollutants duringgarbage collection and landfill/incinerator disposal);
• Reduced greenhouse gas and other emissions (because the use of virgin materials in manufacturingbeverage containers and other products is very energy intensive); and
• Decreased litter, which: reduces public health costs because of fewer hospital emergency room visits resulting from cuts
on broken glass, reduces agricultural damage, and reduces private and public costs from cleanup.
ConclusionContainer deposits increase container recovery, reduce environmental pollution, create jobs and place thecost of recovery on those who produce and consume the containers. If these are legitimate public policygoals, then container deposits are a proven way to get there.

Economic and Environmental Benefits of a Deposit System for Beverage Containers in Washington State
Prepared by Sound Resource Management Group, Green Solutions and the City of Tacoma E-5
If there is interest in pursuing container deposits for Washington State, there needs to be a process thatincludes the key stakeholders in discussions that result in the preferred type of deposit system. Severalmethods exist for setting up deposit systems, and some of those will work better in Washington thanothers.

Economic and Environmental Benefits of a Deposit System for Beverage Containers in Washington State
Prepared by Sound Resource Management Group, Green Solutions and the City of Tacoma E-6

Economic and Environmental Benefits of a Deposit System for Beverage Containers in Washington State
Prepared by Sound Resource Management Group, Green Solutions and the City of Tacoma 1
I. Current Systems
A. Current Programs in Washington State and the City of Tacoma1. Recycling Programs: recycling programs in Washington State have successfully mined the wastestream for valuable materials for the past 20 years. Recycling and waste reduction existed long before 20years ago, of course, but the 1980s saw the beginnings of municipal involvement and joint partnershipsthat have helped expand the universe of recycling to new sources and new materials. As shown in the13th Annual Status Report from the Department of Ecology (Ecology 2004), the measurable overallrecycling rate grew from 15% to 38% during that period (see Table 1-1).
In terms of current (2003) tonnage, the difference between 15% and 38%means that another 1.8 million tons of material was recycled in 2003 thatmight otherwise have been wasted if society had not deemed it importantin the 1980s to start doing things differently. The 13th Annual StatusReport also tells us that we have done a good job of providing citizenswith the opportunity to recycle. In 2003, residents in 159 cities andunincorporated areas were able to recycle through curbside pickup. Mostof those areas (77%) also received curbside collection of yard debris. Asof late 2004, 81.5% of the state’s population had access to curbsiderecycling services. The number of commercial and industrial recyclingopportunities is more difficult to count, but in most areas the commercialsector is also doing its share of recycling.
But what can a closer look at the recycling rate tell us? Examining thetrend in the recycling rate shows that the state repeatedly hit a level ofabout 38% only to drop back a little and then start climbing again. Thiscould be a sign that we have achieved nearly the maximum potential withthe current systems, and are “bumping against a glass ceiling” with therecycling rate. At the same time, we know that there are still a lot morerecyclable materials left in the garbage, and that there is substantialdemand for those resources. Perhaps it is time to try new ideas to help usachieve greater levels of recycling?
In the City of Tacoma, recycling programs have also been stable for the past few years, although the Citycontinues to seek a better solution for the collection of glass. Glass bottles and jars are kept separate intheir collection system, but all other materials are commingled. The City collects from all single-familyhomes, some of the apartment units (participation by apartment buildings is on a sign-up basis), and fromsmall businesses that are on the same routes as residential collections. The City also conducts specialcollections with one truck to pick up source-sorted glass and other materials from larger commercialgenerators, and another recycling route that collects cardboard from apartments and businesses.
Tacoma’s recyclable materials are brought to a local processor (JMK Recycling) and the city receives thesales revenues minus a processing fee for those materials. In a recent month (March 2005), the Cityreceived $55,102 for 1,527 tons of material delivered by city trucks to the processor. The payments forthe recyclables varied from a high of $860 per ton of aluminum cans to a low of -$20 per ton (in otherwords, a fee of $20 per ton) for mixed glass (the price for glass reflects the fact that it is not separated bycolor). The amount of the processing fee is currently $23.65 per ton for the commingled materials, and$2.00 per ton for the glass. The fee for glass is simply for handling and transferring it, since it iscollected and delivered separately by the City of Tacoma, and then JMK Recycling transfers the glass toFibres International in Seattle for processing.
Table 1-1:Historical Recycling Rate
1986 15%1988 28%1989 27%1990 34%1991 33%1992 35%1993 38%1994 38%1995 39%1996 38%1997 33%1998 35%1999 33%2000 35%2001 37%2002 35%2003 38%

Economic and Environmental Benefits of a Deposit System for Beverage Containers in Washington State
Prepared by Sound Resource Management Group, Green Solutions and the City of Tacoma 2
2. Litter Programs: the Litter Tax was adopted in 1971 as part of the Washington State Model LitterControl and Recycling Act. A tax of fifteen thousandths of one percent (0.015%) is imposed on the grossproceeds of sales by manufacturers, wholesalers and retailers for the items that have been identified aslikely contributors to litter (including beverage containers). The product categories are defined in statelaw (RCW 82.19.020) and shown in the sidebar. In 2003, this program generated $6.4 million inrevenues. Funds collected through this tax are placed into a special account within the state treasuryknown as the Waste Reduction, Recycling, and Litter Control Account. RCW 70.93.180 provides cleardirection on how litter account funds are to be allocated:
• 20% is to fund the Community Litter Cleanup Program (CLCP);• 30% is to help fund waste reduction and recycling efforts; and• 50% is to fund litter cleanup by Ecology and other state agencies.
Besides funding the Ecology Youth Corps, the 50% dedicated to thestate’s cleanup efforts also funds litter activities carried out by otheragencies (Natural Resources, Corrections, Transportation, Parks, andRevenue). The 20% for CLCP is provided to counties to conductlitter cleanup programs. The 30% used to help recycling pays for thestate recycling hotline, some staff and other activities.
The litter cleanup programs are an important part of keeping ourenvironment clean and livable, but picking up pieces of litter ispossibly the most expensive method of solid waste management. In2002, a total of 7,401,004 pounds were picked up from 51,740 milesof road and 4,245 illegal dumps by the various litter cleanup crews.This was done at a cost of $4.4 million, or $1,200 per ton of litter.
In 2003, Pierce County ranked second in the state in terms ofpopulation (12.0% of the State’s total) and also in terms of miles driven on roads in the county (10.6% ofState’s total), although the county only ranked 10th in terms of total miles of interstate, state and countyroads (3.8% of the State’s total). In 2003, a total of 164,060 pounds were collected from roads andillegal dumps, of which 14,328 pounds (11.5%) was recycled. In addition to receiving litter grant fundsfrom Ecology, Pierce County also has its own program (Pierce County Responds). Most of this effort ison illegal dumps, and hence is outside of Tacoma city limits (for problems within Tacoma, codeenforcement and other methods are usually able to address the problems).
Several surveys and studies have been conducted for litter. The Department of Ecology conducted littersurveys in 1982, 1983, 1985, 1987, 1990, and contracted out for studies in 1999 and 2004. The results ofthe 2004 study were not available at the time this report was prepared, but the results from the 1999 studyare shown in Table 1-2.
Table 1-2Amount of Cans and Bottles in Litter
Roads InterchangesState and
County Parks AverageAluminum Cans 4.2 1.6 4.1 4.0Plastic Bottles 1.6 0.9 1.4 1.5Glass Bottles 23.7 12.6 16.1 21.2Totals 29.5 15.1 21.6 26.7
All figures are percent by weight. The average is a weighted average based on the amount of litter at each location.
Litter Tax Categories:1. food for humans or pets2. groceries3. cigarettes and tobacco4. soft drinks and carbonated
waters5. beer and other malt beverages6. wine7. newspaper and magazines8. household paper and paper
products9. glass containers10. metal containers11. plastic or fiber containers
made of synthetic material12. cleaning agents and toiletries13. nondrug drugstore sundry
products

Economic and Environmental Benefits of a Deposit System for Beverage Containers in Washington State
Prepared by Sound Resource Management Group, Green Solutions and the City of Tacoma 3
3. Disposal Programs: solid waste collected throughout the state has repeatedly been shown to containsubstantial amounts of recyclable beverage containers. Aluminum cans, for instance, have been found inamounts ranging from 0.28% by weight in Seattle to 0.93% in Lewis County (GS 2003a). A recent studydone for Clallam County (GS 2003b) provides a breakdown of the glass containers by color and bybeverage versus non-beverage (see Table 1-3). Table 1-3 also shows averages of the data from threeother studies (for Thurston County, King County and Seattle, all conducted in the year 2000), whichprovides “best-fit” data for Tacoma, and data from the Waste Composition Analysis for the State ofWashington (GS 2003a).
Table 1-3Percent of Cans and Bottles in the Waste Stream
Clallam County, 2003
Residential CommercialCounty-wide
Average
Average ofThree
CountiesStatewide
DataAluminum Cans 0.85 0.81 0.91 0.40 0.5PET Bottles 0.86 1.23 1.15 0.41 0.5HDPE, Natural 0.59 0.32 0.57 0.25HDPE, Pigmented 0.67 0.50 0.53 0.31
All HDPE =0.6
Glass Bottles: Beverage only; Clear Brown Green All bottles & jars; Clear Brown Green
3.341.521.140.684.312.461.150.70
3.171.600.950.623.541.960.960.62
2.731.290.910.533.301.840.920.54
2.511.470.620.43
2.81.70.70.4
All figures are percent by weight.
B. Deposit Programs in Other StatesIt was not until after World War II that cans began replacing glass bottles in the beer industry. Theconvenience and disposability of cans helped boost sales at the expense of refillable glass bottles, and by1960 approximately 47% of beer sold in the U.S. was packaged in cans and no-return bottles. Softdrinks, however, were still sold almost exclusively in refillable glass bottles requiring a deposit. Themarket share for cans was just 5%. With the centralization of the beverage industry, and a more mobileand convenience-oriented society, the decade of the sixties witnessed a dramatic shift from refillable softdrink “deposit” bottles to “no-deposit, no-return, one-way” bottles and cans.
The gradual demise of refillable beer and soft drink bottles in the fifties and sixties and the rise in one-way, no-deposit cans and bottles resulted in an explosion of beverage container litter. This promptedenvironmentalists to propose bottle bills in their state legislatures that would place a mandatoryrefundable deposit on beer and soft drink containers.
The first bottle bill was passed in Vermont in 1953. It merely banned the sale of beer in non-refillablebottles, however, and it did not institute a deposit system. The law subsequently expired four years laterafter strong lobbying from the beer industry.

Economic and Environmental Benefits of a Deposit System for Beverage Containers in Washington State
Prepared by Sound Resource Management Group, Green Solutions and the City of Tacoma 4
By 1970, cans and one-way bottles had increased to 60% of the beer market, and one-way containers hadgrown from just 5% in 1960 to 47% of the soft drink market. British Columbia enacted the first beveragecontainer recovery system in North America in 1970.
In 1971, Oregon passed the first bottle bill requiring refundable deposits on all beer and soft drinkcontainers. By 1987, ten states (representing over one-quarter of the U.S. population) had enacted someform of beverage container deposit law or bottle bill.
These “bottle bills” were intended not only to reduce beverage container litter, but to conserve naturalresources through recycling and reduce the amount of solid waste going to landfills. They proved to beextremely successful in achieving those goals.
Seven states reported a reduction of beverage container litter ranging from 70 to 83%, and a reduction intotal litter ranging from 30 to 47% after implementation of the bottle bill. High recycling rates were alsoachieved.
Today, eleven states and eight Canadian provinces have bottle bills requiring refundable deposits oncertain beverage containers. No state bottle bill or deposit law has ever been repealed. In fact, severalstates and provinces have expanded their laws to cover beverages such as juice and sports drinks, teasand bottled water -- beverages that did not exist when most bottle bills were passed. (The precedingsection is excerpted from the Container Recycling Institute’s website, http://www.bottlebill.org/).
C. Potential Results of a Deposit System in Washington StateFor the purpose of the analysis provided in this report, we are assuming that a 10¢ deposit system inWashington State would recover 90% of the eligible bottles and cans, just as the dime deposit doescurrently in Michigan. The following analysis illustrates the results of a 90% recovery level, althoughother sections of this report show the relative impacts of both a 5¢ and 10¢ deposit.
Table 1-4 uses the following data:
• The statewide annual tonnage for 2002 (4,703,879 tons) and recycling tonnages (total and bymaterial) are from the 13th Annual Status Report (Ecology 2004).
• Recycling tonnages for Tacoma are from reports by their processor plus source-sorted tonnages fromthe City’s recycling center and glass collections. The amount of aluminum includes an estimated 200tons handled by local buy-back centers. Disposal tonnages for Tacoma are from the City’s recordsfor 2002.
• The statewide amounts of each material in the waste stream were calculated using the figures shownin Table 6 (statewide totals) of the Waste Composition Analysis for the State of Washington (GS2003a) and the total waste amount (4,703,879 tons) for 2002. For Tacoma, the amount of eachmaterial in the waste stream was calculated using Tacoma’s annual waste quantity from 2002(202,918 tons) and the averages of results from three waste composition studies: Thurston County(2000), King County (2000) and Seattle (2000).
• “Beverage Containers Potentially included in a Deposit” includes all types of beverage containersexcept milk and dairy products (which are typically not covered by deposits), and foil pouches (forwhich no data is available).
• Assumptions for the percentages of beverage containers contained in each material category are: aluminum cans are estimated to be 96% beverage cans in both the recycling and waste streams
based on previous research conducted for the BEAR report. steel cans (tin cans) are assumed to be 0% for the sake of simplicity, but a very small amount of
fruit juice containers can be found in this category.

Economic and Environmental Benefits of a Deposit System for Beverage Containers in Washington State
Prepared by Sound Resource Management Group, Green Solutions and the City of Tacoma 5
Table 1-4Amount of Cans and Bottles Recycled and Disposed
Statewide AmountsBeverage ContainersPotentially includedin Deposit, % by wt.
Total Amount of ContainersGenerated in 2002 (tons)
Type ofContainer
TonsRecycled
(2002)
TonsDisposed
(2002) Recycled Disposed Deposit Containers Non-Deposit
Total TonsRecycled at
90% Recovery
AdditionalTons
Recycled with10¢ Deposit
Aluminum Cans 12,718 24,761 96% 96% 35,980 1,499 32,382 20,173Steel Cans 9,417 49,779 0 0 0 59,196 0 0PET Bottles 5,886 23,666 90% 75% 23,047 6,505 20,742 15,445HDPE Bottles 6,029 13,295 5% 5% 966 18,358 870 568Glass 64,937 131,531 92% 69% 150,499 45,970 135,449 75,707Milk Cartons, Aseptic 26 13,577 5% 5% 680 12,923 612 611Total Packaging 99,013, or 27.8% 256,609 211,172 144,450 190,055 112,503Total, All Materials 2,512,788, or 35% 4,703,879
City of TacomaBeverage ContainersPotentially includedin Deposit, % by wt.
Total Amount of ContainersGenerated in 2002 (tons)
Type ofContainer
TonsRecycled
(2002)
TonsDisposed
(2002) Recycled Disposed Deposit Containers Non-Deposit
Total TonsRecycled at
90% Recovery
AdditionalTons
Recycled with10¢ Deposit
Aluminum Cans 423 812 96% 96% 1,186 49 1,067 661Steel Cans 169 1,738 0 0 0 1,907 0 0PET Bottles 419 825 90% 75% 996 248 896 519HDPE, Clear 253 506 5% 5% 38 721 34 22HDPE, Colored 225 620 5% 5% 42 803 38 27Glass: Clear Brown Green
1,657543636478
5,0932,9831,248
862
92%76%98%98%
69%49%98%98%
5,0391,8741,8461,314
1,7111,652
3827
4,5351,6871,6621,182
3,010
Milk Cartons, Aseptic NA 639 5% 5% NA NA NA NATotal Packaging 3,146, or 23.5% 10,234 6,571 4,239Total, All Materials 43,324, or 17.6% 202,918

Economic and Environmental Benefits of a Deposit System for Beverage Containers in Washington State
Prepared by Sound Resource Management Group, Green Solutions and the City of Tacoma 6
PET bottles are estimated to be 90% beverage containers in the recycling stream based on a studyconducted for NAPCOR, and are estimated to be 75% of the waste stream based on a Seattlewaste composition study (Cascadia 2002).
HDPE bottles are assumed to not contain many beverage containers once milk is excluded.Personal observations of the recycled materials in Tacoma were the basis for assuming 5% inboth the recycling and waste streams.
glass bottles are estimated at 92% beverage bottles in the recycling stream based on data from theSeattle study (Cascadia 2002), and 69% based on data from the Waste Composition Analysis forthe State of Washington (GS 2003a). For Tacoma, the percentage of each color that is beveragebottles comes from the same studies, but the breakdown by color for the total recycled glasstonnage is based on the relative amounts of source-sorted materials received at Tacoma’srecycling center.
gabletop cartons and aseptic containers are almost entirely milk, and so the amount of non-milkbeverages was assumed to be about 5% in both the recycling and waste streams.
no data is available from the recycling survey or waste composition studies for the amount of foilpouches currently recycled or disposed in Washington, but CRI estimates that gabletop cartons,aseptic containers and foil pouches altogether are only about 5% of the State’s beverage market,excluding dairy (CRI 2005).
• the recovery rate of 90% is hypothetical, and the actual recovery rate will depend on the depositvalue and the convenience of the redemption system. In addition, the figures shown in Table 1-4assume that all beverage containers (except dairy products) would be included in the deposit system.If only carbonated beverages were included in the deposit, then the results would still be 72% ofwhat is shown (in other words, non-carbonated beverages, including wine and distilled spirits, makeup about 28% of the total containers).
• the last column, “additional recycling,” is calculated based on the 90% recovery figure minus thebeverage containers already being recycled.
The last two rows for the statewide and Tacoma columns for the amount of recycling also shows therecycling rate for packaging and for all materials. For Tacoma, this only represents the city’s efforts anddoes not include the large amount of private recycling occurring in the city.

Economic and Environmental Benefits of a Deposit System for Beverage Containers in Washington State
Prepared by Sound Resource Management Group, Green Solutions and the City of Tacoma 7
II. Container Deposit Systems
This part of the report provides a general description of how beverage container deposit systems workand what this means for Washington in general and for the City of Tacoma in particular. Since thisreport was prepared for the City of Tacoma, as an analysis of what a deposit system would mean for itsrecycling programs, much of the following analysis focuses on the City’s programs and impacts to thoseprograms. Much of the initial data, however, is only available on a statewide basis, and so this is wherethe analysis begins for many of the factors and issues addressed in this report.
A. What are the Possible Approaches to a Container Deposit System?There are several different deposit systems that are in use or that could be used. The primary factorsdefining such systems are the point at which deposits are collected and by whom, the manner in whichthe unredeemed deposits are handled, the amount of deposit and the types of beverages covered by thedeposit. One way to look at these variations is to combine them into three categories:
1. Retail Stores. Retail stores accept returned containers from consumers and refund their deposits(often called the “traditional” method or the “return to retail” method). This method is currently usedin Oregon and several other states.
2. Redemption Centers. Consumers redeem containers at staffed “redemption centers.” Variations ofthis system exist in California, Hawaii, Massachusetts, and Maine.
3. Third-Party Organizations (TPOs). The redemption system is operated by third-party organizations(used in Canada and Europe, and proposed change to Oregon system).
There are many different variations possible with these approaches. For instance, deposits can bereturned to consumers through the use of automated machines (“reverse-vending machines”) in retailsettings, redemption centers, and other commercial or public places.
1. Retail Stores for Collecting and Returning Deposits: most of the existing deposit programs usethis approach, where the consumer can return containers to a retailer. The containers make their waythrough a handling and processing system, eventually reaching end markets. Historically, depositsystems relied on manual labor to collect and sort bottles, and redeem deposits to consumers. By 1999,however, an estimated 30% of containers redeemed through traditional deposit systems were redeemedthrough the use of unattended reverse vending machines (RVMs). These machines return the depositrefund to the consumer and have the capability to sort containers by brand, material type and color.These machines can also reduce volume by compacting, shredding or crushing.
Each party involved in handling and processing empty containers incurs a cost. The mechanics of eachdeposit system determine the distribution of those system costs.
Under a traditional deposit system, bottlers and distributors are responsible for collecting redeemedbottles and cans from retailers and redemption centers, and transporting them to processing centers forsale to recycling markets, and they incur equipment and labor costs from doing so. These costs can beoffset in two ways: by revenue from material sales, and by retaining consumers’ unclaimed deposits.Industry representatives argue that materials revenue and unclaimed deposits only partially offset theircollection and processing costs, while others argue that unclaimed deposits are a windfall profit forbottlers and distributors amounting to tens of millions of dollars.
Retailers and redemption centers also incur operating costs. Most deposit laws require bottlers anddistributors to pay retailers and redemption center owners a handling fee of 1 to 3¢ per containerredeemed to offset operating costs.

Economic and Environmental Benefits of a Deposit System for Beverage Containers in Washington State
Prepared by Sound Resource Management Group, Green Solutions and the City of Tacoma 8
Figure 2-1Flow of Containers and Deposits in Traditional System
Figure courtesy of Container Recycling Institute, www.container-recycling.org.
Figure 2-1 shows the typical flow of the deposit and handling fees in a traditional deposit system. Insome deposit systems, third-party recyclers, redemption centers and retailers share the redemption andhandling fees, while in other states there are no third-party recyclers or redemption centers. A recentchange in Massachusetts allows redemption center operators to refund only 4¢ of the 5¢ deposit toconsumers, but consumers can receive the full refund by returning bottles and cans to a retailer.
In Massachusetts, 100% of the unclaimed deposits, or about $35 million per year, become the property ofthe state through an “escheat” provision. The funds were originally used for administering the depositsystem, promoting recycling, and for other environmental purposes, but since 2004, they have beenabsorbed by the Commonwealth’s General Fund. In Michigan, 25% of the unclaimed deposits are keptby retailers in lieu of a handling fee; 75% are retained by the state and used for environmental programs.Maine has experimented with both approaches.
Containers collected through traditional deposit systems are of high quality and yield the highest marketvalue available, particularly for PET and color-sorted glass.
2. Redemption Centers: this approach is used in California (the “California Redemption System”) andHawaii. The California redemption system has many characteristics that are similar to a traditionaldeposit system, but some that are fundamentally different. The original law was enacted in 1986 as AB

Economic and Environmental Benefits of a Deposit System for Beverage Containers in Washington State
Prepared by Sound Resource Management Group, Green Solutions and the City of Tacoma 9
2020 and has been expanded and modified through legislation several times. The California programdiffers from the other nine “traditional” deposit programs1 in several ways:
• The program established the California Redemption Value (CRV). As originally drafted, the CRVwas 1¢ per container. The law was later amended to establish a CRV of 2.5¢ for containers under 24ounces, and 4¢ for containers 24 ounces and greater, and then amended again in 2004 to 4¢ and 8,respectively.
• Deposits are not physically handled by bottlers or distributors. Instead, deposits are handled througha state fund managed by the California Department of Conservation. Deposits are paid to the state bydistributors and bottlers, and can be returned to consumers at state-certified redemption centers andprograms, including buy-back recycling centers that existed prior to the law (called “old linerecyclers,” some argue these centers are far less prevalent in other states), and supermarket-basedrecycling centers (called “convenience zone recyclers,” similar to redemption centers operating insome other deposit states). Deposit containers can also be recycled through municipal curbsideprograms. While consumers do not receive their deposits back directly this way, the curbsideprograms do receive deposit credit from the state, according to periodic surveys of CRV-containerweight in the curbside stream (the audited “commingled rate”). All containers are ultimately handledthrough certified processors, which cancel the deposit on the container and handle the transfer offunds between the state and recyclers.
• Containers are not required to be segregated by brand. Instead, materials can be collected on aweight basis separated only by material type.
• Manufacturers are responsible for covering the cost of recycling each container type. The stateestablishes a processing fee based upon the net cost of recycling each container type. Processing feesare paid to the state, which distributes them to all types of recycling programs in the form ofprocessing payments.
• Unredeemed deposits are held by the state and used for various programs, including: programadministration, handling fees paid to convenience zone recycling centers, supplemental payments tocurbside programs, and grants to local governments and non-profit organizations. Recently,unredeemed deposits have also been used to offset (lower) the processing fees paid by manufacturers.
The California system has generated a significant amount of controversy. It has been critiqued for thelarge government bureaucracy that administers it, its complexity, its inability to quickly adjust tochanging market conditions (since processing fee surveys are conducted only annually), and the steadystream of legislation and litigation it has spawned. In spite of these critiques, however, the system hasrelatively low costs and yields significant recovery, although not as much as in states with higher depositrefund values.
The first change in California’s system took effect in January 2000, and this change expanded thecoverage from just carbonated soft drinks, beer and wine coolers to include virtually every beveragepackaged in aluminum, glass, plastic or bimetal containers. The only beverages now excluded from thelaw are milk, wine, and distilled spirits. In the first year of the expanded program, the percentage ofredeemed containers collected through curbside increased from seven to 15%, and the redemption rate(all recovery excluding curbside) decreased from 69% to 52%. Some feel this was a matter of a lag ineducation about the expanded system, but as of 2003 the redemption was still only 54%. Others feel thelow redemption rate is to be expected in a state with strong curbside infrastructure and a relatively lowdeposit amount. Effective January 1, 2004, the CRV was increased to 4¢ for containers under 24 ounces,and 8¢ for containers 24 ounces and larger. As a result of this increase, the redemption rate increased to65% in the first six months of 2004.
1 “Traditional programs” include Connecticut, Delaware, Iowa, Maine, Massachusetts, Michigan, New York,Vermont, and Oregon.

Economic and Environmental Benefits of a Deposit System for Beverage Containers in Washington State
Prepared by Sound Resource Management Group, Green Solutions and the City of Tacoma 10
3. Third-Party Organizations: a third-party organization (“TPO”) is a private, not-for-profitorganization that is established to implement and administer programs to recover and manage particularused consumer products for reuse and recycling. A TPO may be formed voluntarily by interested partiesor in response to legislation. Membership may be comprised entirely of industry representatives,including manufacturers and retailers, or include other stakeholders, such as non-profit organizations,independent groups, and/or governments. Typically, a TPO’s responsibilities include recruitingmembers; collecting fees and managing program funding; establishing and managing a product collectionsystem; monitoring, evaluating and reporting program results; and program promotion.
Select industries have formed TPOs to assume product stewardship responsibilities. Examples ofexisting TPOs that illustrate different approaches to collective stewardship programs follow.
Rechargeable Battery Recycling Corporation (RBRC): RBRC was established in 1995 to managethe collection and recycling of nickel-cadmium (Ni-Cad) rechargeable batteries. The rechargeablebattery industry voluntarily launched the organization after eight states mandated take-back programsfor Ni-Cad batteries. RBRC was formed as an alternative to establishing separate mandated take-back systems in each state, as well as to preempt future legislation in other states.
Licensing fees are used to fund the organization’s takeback program. The RBRC licenses its logo tomanufacturers of rechargeable batteries and products that contain them. More than 95% of theportable rechargeable power industry in North America participates in the RBRC program. RBRCdoes not publish any cost or recovery data.
Carpet America Recovery Effort (CARE): in January 2002, members of the carpet industry,governmental agencies, and non-governmental organizations signed a Memorandum ofUnderstanding (MOU) for management of waste carpet. This MOU was the result of a two-yearnegotiation process, in which participants joined together to implement a product stewardship plan tochange how post-consumer carpet is managed in the U.S.
CARE is responsible for achieving an escalating target for diversion of waste carpet from landfills,with the ultimate goal of diverting 40% of post-consumer carpet within 10 years. CARE functions toenhance collection infrastructure for post-consumer carpet by creating demand in the marketplace forproducts that contain post-consumer recycled content from carpet; serve as a resource for technicalassistance; and measure and report on progress toward fulfilling the MOU goals.
CARE is funded by a tiered sponsorship system. Current sponsors include carpet manufacturers,equipment and material suppliers, a professional trade association, and the US EPA. CARE employsan executive director and most likely an administrative assistant. The board consists of volunteersfrom the carpet industry.
Product Care: Product Care is an industry-sponsored association that manages stewardshipprograms in British Columbia, Canada for manufacturers of paint, flammable liquids, pesticides, andpetroleum products. Developed in response to Canadian provincial stewardship regulations, ProductCare partners with local governments, private industry and nonprofit groups to offer a depotcollection system where consumers may return leftover paint, flammables, pesticides, and gasoline atno charge. Collectors may be compensated by Product Care for providing collection services at arate negotiated by both parties, and then Product Care pays for transportation and disposal. Theprogram is funded by a separate “eco fee” which manufacturers remit to Product Care. The eco feeranges from $0.10 to $2.40 per container, depending on product type and container size.Manufacturers of impacted products have the option to absorb the eco fee or recapture the fee fromconsumers by adding the fee into the sale price of the product. (Thanks to the Northwest ProductStewardship Council, www.productstewardship.net, for the information on TPOs shown in the abovesection.)

Economic and Environmental Benefits of a Deposit System for Beverage Containers in Washington State
Prepared by Sound Resource Management Group, Green Solutions and the City of Tacoma 11
B. Compatibility with Existing Recycling ProgramsMany different recycling programs operate in Washington State to collect paper, cans and bottles fromresidential and commercial customers. Addressing these in detail would require a lengthy discussion andmany assumptions about how these facilities would fit into a deposit system, but some generalizationscan be made:
1. Compatibility with Single-Stream Recycling: many programs in the state have recently convertedto “single-stream recycling,” where all of the recyclable materials are placed into the same container forcollection purposes. Materials are sorted after collection at processing facilities equipped with acombination of mechanical and manual methods, but this technology has yet to achieve the same qualityof separation as previous source-sorting methods. Glass in particular is a problem, as much of it isbroken during collection and then a portion of it is either not recycled or is shipped out with paper orother materials. It is not known what proportions of cans and bottles collected for recycling are beingshipped out in paper bales to the wrong market. It is also uncertain what is happening to these containersin China and other foreign markets, but at U.S. paper mills these cans and bottles typically end up in thelocal landfill after causing numerous problems for the paper mill operations (GS 2003b, AOR 2004).
Single stream programs will lose some revenues from the sale of aluminum cans and PET bottles, butwill have lower financial losses associated with handling glass. All in all, these facilities shouldprobably embrace deposits as a method to eliminate at least part of the glass problem, thus reducing theirresidue stream and increasing the marketability of paper and other materials. If manual picking stationsat these facilities can be modified to recover deposit containers, they will be able to offset the loss ofmarket revenues by claiming the deposit for recovered cans and bottles, but only for the glass bottles thatremain unbroken and only if the deposit system is designed to allow this redemption method. In a recentstudy for King County (Green Solutions, unpublished), it was found that about one-third of the glassbottles were crushed during collection.
2. Compatibility with Commingled Programs that Keep Glass Separate: for commingled recyclingprograms that collect glass separately, collection costs are higher than for fully-commingled (single-stream) programs, but processing costs are lower and the marketability of the collected materials isbetter. Even with improved marketability of the glass, however, this material is typically handled at a netcost due to the low market value of glass. Removing part of the glass through a deposit system willimprove the overall economics of these programs, but it is hard to say at this point how the loss ofrevenues for aluminum cans and plastic bottles will affect these programs (that is, whether theseprograms might be able to capture the deposit funds and thus offset any market revenue losses). Thealuminum cans for this type of program, as well as for most other types of recycling programs, are animportant question because the value of these cans helps to pay for the program and for handling othermaterials.
This is the approach used by the City of Tacoma for residential and small business customers. Glass iskept separate from other (commingled) recyclables, and the City is paid for the commingled materials bythe processing facility that separates those materials for marketing. In their case, diverting part of theglass through a deposit system would make collections more cost-effective (see Section IV.B.4 for amore detailed discussion of this), but in urban areas such as Tacoma there will also be an increase inscavenging of recyclables (deposit containers) from curbside bins, with the subsequent litter problemsand complaints. For the rest of Pierce County, where glass is no longer being collected through curbsideprograms and must instead be taken to a drop-off site, having most of the glass handled through analternative system (deposits) will greatly increase results and reduce costs.
3. Compatibility with Source-Sorted Programs: programs that require sorting at the source, whetherthis means 2, 3 or more bins used at the homes and businesses, will fare well with a deposit system ifthey are allowed to claim the deposit. The greater degree of sorting at the source usually leads to the

Economic and Environmental Benefits of a Deposit System for Beverage Containers in Washington State
Prepared by Sound Resource Management Group, Green Solutions and the City of Tacoma 12
ability to keep materials clean and not crushed, and thus a higher percentage of the deposit containerswould be still eligible for the refund, again assuming these bottles can be kept intact and can berecovered cost-effectively.
4. Compatibility with Drop-Off and Buy-Back Programs: drop-off and buy-back centers usuallyrequire the highest level of sorting by the source, and so would be in the best position to claim thedeposit, except that their customers will probably take their deposit containers to a redemption siteinstead if they have to keep them separate and bring them somewhere. If the drop-off and buy-backcenters can act as redemption sites, however, they can still capture these materials and also have theirhandling costs covered, and might experience an increase in other materials.
5. Compatibility with Commercial Programs: commercial programs vary widely in their collectionmethods, participation rates, and potential impacts due to a deposit system. For businesses generatingsmall amounts of cans and bottles, perhaps through a pop machine in an employee lunch room or througha small cafeteria, it seems safe to assume that the employees will find a way to collect the depositcontainers. In general, this will probably represent an improvement over existing conditions, since somany of these types of businesses across the state are not recycling currently. For larger generators ofcans and bottles, such as bars and restaurants, it also seems safe to assume that some type of convenientarrangement will be worked out between the business and their suppliers to handle the deposit funds andthe containers.
In Tacoma, small businesses are served as part of the residential curbside program. There are alsoseparate collection efforts for some types of businesses. The City collects cardboard separately frommany businesses and apartments, and also collects other materials (such as glass) using a special truck.Private companies also collect some recyclables in the City, but their efforts are primarily targetingcardboard and sorted office paper. A deposit system might provide a strong incentive for thesecompanies to offer container recycling at no charge to these business customers as an additional service.The compartmentalized truck used by the City to run a special route to collect source-sorted glass andother materials from bars and restaurants is not the most cost-effective aspect of their operations, and itcan be assumed that much of this would go away or could be absorbed by other recycling programs ifthere was a deposit that included the bottles generated by bars and restaurants.
Economic and Environmental Benefits of a Deposit System for Beverage Containers in Washington State
Prepared by Sound Resource Management Group, Green Solutions and the City of Tacoma 13
III. Public Health and Environmental Benefits of Increased Bottle Recovery
Most public health and environmental benefits from increased beverage container recycling come fromthe substitution of recycled beverage containers for raw materials in the product manufacturing processand the reduced energy requirements for making new beverage containers, as well as other products suchas clothing and recycling containers, from recycled rather than virgin raw materials. The existence, if notthe extent, of environmental impacts from virgin material and energy resource acquisition and processingis widely acknowledged. Drilling, digging, or cutting and refining, smelting, or pulping creates rawmaterials to feed our industrial system and, at the same time:
• release chemical substances, carbon dioxide, waste heat and processing residues into air and waterand onto land;
• impair the health of people exposed to polluting chemical releases;• dislocate and destroy habitat for a wide variety of non-human creatures and organisms;• diminish productivity in natural resource industries that depend on healthy species and ecosystems;• impair the functioning of ecosystems that clean our air and water and provide nutrients, among other
beneficial functions, and, as well, impair the biological diversity in those ecosystems; and• alter the sights, sound, smells and feelings humans enjoyed in many previously pristine, natural
places.
Similarly acknowledged is the existence of environmental impacts resulting from disposal of leftoversfrom our use and consumption of manufactured products and foodstuffs. Burying these wastes creates avariety of problems, from potential releases into the environment of toxic leachate and landfill gases tonoise and traffic impacts on residences and businesses neighboring landfills. Waste incineration createsair and water emissions, as well as potential releases at incinerator ash landfills.
Modern day recycling, e.g., curbside collection from residences, was initiated largely because of a beliefthat we were running out of landfill space, and because we wanted to reduce the environmental risksassociated with waste disposal. Beverage container deposit systems often were put in place largely as ameans of reducing litter along our roadways. By now, however, use of recycled materials as substitutesfor virgin manufacturing feedstocks is understood as the most significant environmental benefit fromcurbside recycling and bottle deposits. This chapter provides the scientific background for thisunderstanding, as well as estimates of some of the economic costs of wasting the resources contained inused beverage containers that we currently are throwing in the garbage.
A. What are the Public Health & Environmental Benefits of Increased Bottle Recoveryand How Much are they Worth?
In this section we report our estimates of both quantity and economic value for several categories ofpublic health and environmental impacts that are reduced when more beverage containers are recycledrather than wasted by being thrown in the garbage. We also report estimates of the energy savings fromrecycling beverage containers. Reported results are based on several studies that Sound ResourceManagement Group (SRMG) conducted recently for the Washington State Department of Ecology andfor the San Luis Obispo Integrated Waste Management Authority (SRMG 2005). Those studiescalculated public health and environmental benefits of recycling, and conversely the public health andenvironmental costs of wasting, for a variety of materials including all the common beverage containertypes.
1. Life Cycle Analysis and Public Health/Environmental Impact Categories: there has beenextensive research over the past fifteen years on identifying and quantifying the public health andenvironmental benefits of recycling versus disposal. This research is based on the rapidly developingfield of life cycle analysis. Some of this research involved summarizing the types of emissions that cause

Economic and Environmental Benefits of a Deposit System for Beverage Containers in Washington State
Prepared by Sound Resource Management Group, Green Solutions and the City of Tacoma 14
particular environmental impacts such as global warming, acid rain, and ozone layer depletion, andparticular public health impacts such as increased disabilities and deaths from diseases caused by airpollution. That research has focused on learning which particular emissions cause a particular impact,and then indexing those emissions by potency.
For example, researchers thus far have identified the following atmospheric emissions as greenhousegases that cause global warming:
• carbon dioxide (1)• methyl bromide (5)• methylene chloride (10)• methyl chloride (16)• methane (23)• chloroform (30)• trichloroethane (140)• nitrous oxide (296)• HCFC 22 (1,700)• carbon tetrafluoride (5,700)• Halon 1301 (6,900)• CFC 12 (10,600)
The number in parenthesis after each of these twelve atmospheric pollutants indicates their globalwarming potential relative to carbon dioxide. These numbers allow us to add up the various pollutants asa common denominator, in the case of greenhouse gases in either carbon dioxide or carbon equivalents.This is similar to the way we add up all the disparate products and services produced in the economy interms of the common denominator of dollars to calculate gross domestic product (GDP). In the case ofenvironmental impacts, we add up all the disparate pollutants in terms of a common denominator so thatit is possible to quantitatively compare the environmental impact of one course of action versus another.
For comparing the recycling life cycle against the disposal life cycle we make use of a databasedeveloped by the US Environmental Protection Agency (EPA) over the course of a nearly ten-yearproject managed by Research Triangle Institute (RTI 1999). That project involved stakeholderconsultation and review followed by peer review of emissions and energy usage data from life cyclestudies conducted over the years since the first energy crisis in 1974.
Figure 3-1, Life Cycle Inventory (LCI) and the Waste Management System, is a graphic from theWashington State Department of Ecology (Ecology 2002) study that illustrates the material flows andenvironmental releases associated with the life cycle of used products that end up in our wastemanagement systems. These environmental releases cause public health and environmental costs that areimposed indirectly on society at large rather than being directly internalized in the costs of the productswhose manufacture creates those emissions. These are the external costs of product manufacturing and,as we demonstrate in this report, these external costs are much larger for virgin-content products thanthey are for products made from recycled materials.
For the solid waste management system there is enough information on releases of various types ofpollutants to calculate the life cycle impacts for energy and six categories of public health orenvironmental impacts. These categories, as well as a number of other impact categories, were laid outin several recent scientific reports. Impact categories are based on the Environmental Problems approachto impact assessment as developed in the early 1990s within the Society for Environmental Toxicologyand Chemistry (SETAC). This approach is codified in the National Institute of Standards and

Economic and Environmental Benefits of a Deposit System for Beverage Containers in Washington State
Prepared by Sound Resource Management Group, Green Solutions and the City of Tacoma 15
Figure 3-1
Traditional Municipal Solid Waste System Impacts (collection, transfer, processing, storage, disposal)
Downstream Impacts(Disposal of waste and residues, landfill closure and post closure care)
Upstream Product Impacts(Resource extraction, processing, transportation, manufacturing, delivery)
PRODUCTMANUFACTURE
SOURCE
NATURALENVIRONMENT
RESOURCESAIR, WATER,
LAND-MINERALS,FLORA, FAUNA,
PETROLEUM,SOLAR
ENERGY(Exraction,productionand use)
MATERIAL(Extraction
andproduction) CONSUMPTION OF
GOODS ANDSERVICES
WASTEMANAGEMENT
SYSTEM
REUSE ANDREFURBISH
PROCESSED FORRECYCLING
RECYCLEDMATERIAL
ENVIRONMENTALRELEASE
(Impacts to Air,Water, Land, Flora
and Fauna )
WASTE TO ENERGY(Incineration)Ash Residues
Post ClosureResiduals
ACTIVE LANDFILL
Post ClosureManagement
Figure 1. Life Cycle Inventory (LCI)and the Waste Management System
DISPOSAL
Technology’s Building for Environmental and Economic Sustainability (BEES) 3.0 model, and supportedby US EPA Office of Research and Development’s recent development of TRACI (Tool for theReduction and Assessment of Chemical and other environmental Impacts).2
The six impact categories, as described in the BEES model (Lippiatt 2002), and current estimates of theeconomic cost of these public health and environmental impacts are as follows:
a. Global Warming Potential: this index characterizes the increase in the greenhouse effect due toemissions generated by humankind. Life Cycle Analyses (LCAs) often use a 100-year time horizonto delineate which type emissions of greenhouse gases have a global warming potential. Carbondioxide (CO2) from burning of fossil fuels to generate energy is the most common source ofgreenhouse gases. Methane from anaerobic decomposition of organic material is another largesource of greenhouse gases. Estimates of the dollar cost of a ton of greenhouse gases, measured asCO2 equivalents, range between about $1 per ton CO2, which is a current spot market price for
2 TRACI is a set of state-of-the-art, peer-reviewed US life cycle impact assessment methods. See US EnvironmentalProtection Agency Office of Research and Development (2002): Tool for the Reduction and Assessment of Chemicaland Other Environmental Impacts (TRACI): User’s Guide and System Documentation, EPA/600/R-02/052. Theweights for assembling pollutant emissions into impact categories are given in the BEES 3.0 manual (Lippiatt 2002).

Economic and Environmental Benefits of a Deposit System for Beverage Containers in Washington State
Prepared by Sound Resource Management Group, Green Solutions and the City of Tacoma 16
emissions permits traded under voluntary greenhouse gas emission limitation agreements, and $36per ton, which is Seattle City Light’s impact cost estimate used in long range planning. Recent spotmarket trades of CO2 emissions permits under the European Union’s compulsory system have beenat about $11 per ton. For this evaluation we used $36 as the long run cost of greenhouse gasemissions.
b. Acidification Potential: this index characterizes the release of acidifying compounds from humansources, principally fossil fuel and biomass combustion, which affect trees, soil, buildings, animalsand humans. The main pollutants involved in acidification are sulfur and nitrogen compounds (sulfuroxides, sulfuric acid, nitrogen oxides and ammonia) and hydrochloric acid (HCl).
For purposes of evaluating the economic benefit of recycling in terms of the resulting reductions inreleases of acidifying compounds (due to decreased reliance on virgin materials in manufacturingproducts), we denominated the acidification potential index in tons of sulfur dioxide (SO2)equivalents. One estimate of the impact cost of releases of acidifying compounds is provided by thespot market price for SO2 emissions permit trading under the Clean Air Act’s cap and trade program.EPA’s March 2004 spot market auction for emissions permits resulted in a clearing price of $260 perton of SO2.
c. Eutrophication Potential: this index characterizes the addition of mineral nutrients to the soil orwater. In both media, the addition of large quantities of mineral nutrients, such as nitrogen andphosphorous, results in generally undesirable shifts in the number of species in ecosystems and areduction in ecological diversity. In water, it tends to increase algae growth, which can lead to lackof oxygen and therefore death of species such as fish.
For purposes of evaluating the economic benefit of recycling in terms of the resulting reductions inreleases of nutrifying compounds (due to decreased reliance on virgin materials in manufacturingproducts), we denominated the eutrophication potential index in tons of nitrogen (N) equivalents.Our estimate of the impact cost of releases of nutrifying compounds is based on EPA’s cost-effectiveness analysis for the NPDES regulation on effluent discharges from concentrated animalfeeding operations. That analysis estimated that costs up to $4 per ton of nitrogen removed fromwastewater effluents were economically advantageous (EPA 2002).
d. Disability-Adjusted Life Year (DALY) Losses: criteria air pollutants are solid and liquid particlescommonly found in the air, including coarse particles known to aggravate respiratory conditions suchas asthma and fine particles that can lead to more serious respiratory symptoms and diseases such aslung cancer. In particular, air emissions included in the criteria air pollutants category that causethese human health effects are nitrogen oxides, sulfur oxides, and particulates. Disability-adjustedlife years, or DALYs, have been developed to measure health losses from these air pollutants. Theyaccount for years of life lost and years lived with disability, adjusted for the severity of the associatedunfavorable health conditions.
One of the economic benefits of recycling due to manufacturing products with recycled rather thanvirgin materials is a reduction in DALY losses. We measured the economic value of that benefit bythe Seattle-Tacoma-Bellevue Metropolitan Statistical Area’s average wage per job in 2002 of$44,050 (Bureau of Economic Analysis, U.S. Department of Commerce, Table CA34: Average wageper job for 2002.) Inflating this value to 2004 yields our dollar value for a DALY of $45,771.
e. Human Toxicity Potential: EPA in its TRACI software (Tool for the Reduction and Assessment ofChemical and Other Environmental Impacts) developed toxicity equivalency potentials for a numberof chemical compounds that measure the relative health concern associated with various chemicalsfrom the perspective of a generic individual in the U.S.
For purposes of evaluating the economic benefit of recycling in terms of the resulting reductions inreleases of compounds toxic to humans (due to decreased reliance on virgin materials in

Economic and Environmental Benefits of a Deposit System for Beverage Containers in Washington State
Prepared by Sound Resource Management Group, Green Solutions and the City of Tacoma 17
manufacturing products), we denominated the human toxicity potential index in tons of lead (Pb) airemissions equivalents rather than the toluene equivalents used in TRACI. This was so that we coulduse a Minnesota Public Utilities Commission quantification of the externalized environmental costsof criteria air pollutant emissions, in particular lead, associated with electricity generation to measurethe human health costs of toxics. The Commission’s cost estimates, developed under direction of theMinnesota legislature, were challenged in court, but were affirmed by the Minnesota Court ofAppeals, and then Minnesota’s Supreme Court in 1998 denied a requested review of the AppealsCourt’s affirmation. The MN PUC’s externalized cost for lead in urban areas was $3,500 per ton in1995 dollars. Inflating this estimate to 2004 dollars yields our economic benefit value of $4,293 perton for reductions in air emissions of lead.
f. Ecological Toxicity Potential: EPA’s TRACI software also developed toxicity equivalencypotentials for a number of chemical compounds that measure the relative potential for chemicalsreleased into the environment to harm terrestrial and aquatic ecosystems.
For purposes of evaluating the economic benefit of recycling in terms of the resulting reductions inreleases of compounds toxic to terrestrial and aquatic ecosystems (due to decreased reliance on virginmaterials in manufacturing products), the ecological toxicity potential is expressed in terms of tons of2,4-D. The toxicity cost to plants and wildlife from the application of a ton of 2,4-D herbicide isestimated at $2,900. This estimate is based on research work by Joe Kovach, Integrated PestManagement Program, Ohio State University (J. Kovach, et al, A Method to Measure theEnvironmental Impact of Pesticides, available through Online Publications of the New York StateIntegrated Pest Management Program at www.nysipm.cornell.edu/publications/EIQ.html#table2).
2. The Importance of Upstream Impacts Relative to Collection and Processing Impacts: one of thefrequent criticisms of recycling is that it puts extra trucks on the road, incurs high collection andprocessing costs, and then ships processed materials long distances to recycled-content manufacturingestablishments. This subsection displays results from SRMG research that puts the public health andenvironmental impacts of recycling systems into real world perspective. These results are consistent witha number of other studies on the life cycle of used products that can either be thrown away in the garbageor recycled into further beneficial uses. These studies all demonstrate that the upstream public health andenvironmental impacts caused by extraction, refining and manufacturing products with virgin materialsso substantially outweigh the impacts of manufacturing products from recycled materials that theyoverwhelm the public health and environmental impacts of recycling. In other words the impacts ofrecycling trucks and processing facilities, which to be sure do exist, are insignificant compared with thepollution prevention and resource conservation reductions that result from making products out ofrecycled rather than virgin raw materials.
The following five graphs illustrate this conclusion for energy use, greenhouse gas emissions, and humantoxicity. Figure 2, Comparative Energy Usage for Recycled- vs. Virgin-Content Products, shows energysavings for several closed-loop, recycled-content products which can use recycled beverage containers asfeedstocks. The graph also shows comparative energy usage for two important paper industry products,newsprint and cardboard. These two products do not typically use beverage containers for recycled-content production, but the fiber from recycled gabletop and aseptic beverage containers yields a highquality recycled fiber that can be used in a variety of paper industry products.
As indicated in Figure 3-2, recycled-content products require much less energy than virgin-contentproducts. This is due to their reduction or elimination of demands for virgin raw materials. Recycled-content aluminum sheet and plastic pellets require only between 5% and 7% of the energy needed tomake these items from virgin raw materials. Recycled-content steel requires about 37% of the energy

Economic and Environmental Benefits of a Deposit System for Beverage Containers in Washington State
Prepared by Sound Resource Management Group, Green Solutions and the City of Tacoma 18
Figure 3-2Comparative Energy Usage for Recycled- vs. Virgin-Content Products
0
60
120
180
AluminumSheet
PET Pellets HDPEPellets
Newsprint Cardboard Steel Bar GlassContainers
Mill
ion
Btu
s P
er T
on
Additional Energy forVirgin-ContentRecycled-Content
required for virgin steel. Glass containers only require 65% of the energy needed to produce virgin-content glass jars. The magnitude of these energy savings foreshadows the conclusion that the recyclinglife cycle has far less impact on public health and the environment than does the disposal life cycle,whether disposal is via landfill with or without recovery of energy from landfill gases, or via waste-to-energy incineration.
Figure 3-3, Total Energy Usage for Recycling vs. Disposal Life Cycle, shows energy usage for materialsrecycled in San Luis Obispo County, California, and used to produce new products. The figure alsoshows the comparative energy usage for collecting those same materials in garbage and replacing themwith virgin materials for the next round of product use. The garbage life cycle shown on the right handside of Figure 3-3 includes an offset (negative or below the zero line portion of the stacked bar) for theenergy produced from collecting and burning landfill gases.
As indicated in Figure 3-3, the recycling life cycle’s total energy usage is just 45% of the garbage lifecycle’s energy usage. Figure 3-3 also shows the relatively small amounts of energy usage associated withthe collection, processing and shipping to market of recycled materials.
Figure 3-4, Net Energy Usage for Recycling vs. Landfilling with Energy Recovery – The Energy Savingsfrom Recycling, is the same as Figure 3-3 except that the bar showing energy usage for extraction,refining and manufacturing products from virgin materials is now shown as an offset to the energy usesfor the recycling life cycle. The second bar from the left shows that the recycling life cycle actuallysaves energy when account is taken of the energy saved by making recycled- rather than virgin-contentproducts. This is what is meant by the oft-repeated statement that recycling saves energy. As indicated,the energy savings from recycling is much greater than the energy savings from landfilling materials andturning the resultant landfill gases into energy. A similar result holds for recycling versus waste-to-energy incineration of recyclable materials.
Figure 3-5, Net Greenhouse Gas Reductions for Recycling vs. Landfilling with Energy Recovery, showsthe extent to which recycling reduces pollution from releases of greenhouse gases. In fact, as indicated

Economic and Environmental Benefits of a Deposit System for Beverage Containers in Washington State
Prepared by Sound Resource Management Group, Green Solutions and the City of Tacoma 19
Figure 3-3Total Energy Usage for Recycling vs. Disposal Life Cycle
���������������� ������������������������������������������������
������������������������������������������������������������������������������������������������
����������������
-25.0
-20.0
-15.0
-10.0
-5.0
0.0
5.0
10.0
15.0
20.0
25.0
Recycling LifeCycle Energy
Usage
Total RecyclingLife Cycle
Energy Usage
Total GarbageLife Cycle
Energy Usage
Net GarbageLife Cycle
Energy Usage
Mill
ion
Btu
s Pe
r Ton
Col
lect
ed
Net EnergyImpact
LFG EnergyRecoveryOffset����Landfilling
VirginContentMfg.����RecycledContentMfg.����Shipping
����Processing
�������� Collection
Recyclingwith ClosedLoop RecycledContentManufacturing
Garbage Landfillingwith LFG EnergyRecovery
by the two solid dark blue color bars, recycling reduces emissions of greenhouse gases by 74% comparedwith manufacturing products from virgin materials. Furthermore, the greenhouse gas reductions fromrecovering landfill gases produced from decaying materials in the landfill is de minimus in comparison tothe greenhouse gas reductions from recycling.
Finally, Figure 3-6, Net Human Toxicity Reductions for Recycling vs. Waste-to-Energy Incineration,shows the impact of the recycling life cycle on releases of compounds that are toxic to humans comparedwith the impact on human toxicity of incineration with recovery of energy from the destroyed materials.As indicated, recycling reduces the release of toxic substances by 65%, while incineration actuallyincreases releases to the atmosphere of those toxics. This despite the reduction in releases of toxics fromconventional means of energy generation that is credited to incineration for the energy generated fromthe recyclable materials that incineration destroys.
3. Estimates of Magnitude and Value for Six Public Health & Environmental Benefits of IncreasedBeverage Container Recycling: based on the San Luis Obispo County and Washington Department ofEcology studies previously discussed, and our estimates of beverage container recycling and wasting inthe state of Washington and the City of Tacoma, we estimated the amount of public health andenvironmental protection attained by current levels of beverage container recycling and the amount ofpublic health and environmental damages caused by current levels of beverage container wasting. Table3-1 shows these estimates for Washington and Table 3-2 shows the estimates for Tacoma. Both tablesalso show energy conservation achieved by our current beverage container recycling efforts, and energywastage from current levels of beverage container disposal.

Economic and Environmental Benefits of a Deposit System for Beverage Containers in Washington State
Prepared by Sound Resource Management Group, Green Solutions and the City of Tacoma 20
Figure 3-4Net Energy Usage for Recycling vs. Landfilling with Energy Recovery – The Energy Savings from Recycling
Figure 3-5Net Greenhouse Gas Reductions for Recycling vs. Landfilling with Energy Recovery
������������������������������ ��������������������������������������������
��������������������������������������������������������������������������� ��������������
��������������
-25.0
-20.0
-15.0
-10.0
-5.0
0.0
5.0
10.0
15.0
20.0
25.0
RecyclingImpacts
Net RecyclingImpact
GarbageImpacts
Net GarbageImpact
Mill
ion
Btus
Per
Ton
Col
lect
ed
.
Net EnergyImpact
LFG EnergyRecoveryOffset����Landfilling
Virgin Mfg.Offset
����RecycledContentMfg.����Shipping
����Processing
����Collection
Recyclingwith ClosedLoop Recycled-ContentManufacturing
GarbageLandfillingwith LFGEnergyRecovery
�������������� ��������������������������������������������������������
��������������������������������������������������������
����������������������������������������������������������������������
-7500.0
-5000.0
-2500.0
0.0
2500.0
RecyclingImpacts
Net RecyclingImpact
GarbageImpacts
Net GarbageImpact
Gre
enho
use
Gas
Em
issi
ons
Per T
on C
olle
cted
Net Green-house GasImpactLFG EnergyRecoveryOffset����Landfilling
Virgin Mfg.Offset����
���� RecycledContentMfg.����
���� Shipping
����Processing
����Collection
Recyclingwith ClosedLoop Recycled-ContentManufacturing
GarbageLandfillingwith LFGEnergyRecovery
Pounds of Carbon Dioxide Equivalents

Economic and Environmental Benefits of a Deposit System for Beverage Containers in Washington State
Prepared by Sound Resource Management Group, Green Solutions and the City of Tacoma 21
Figure 3-6Net Human Toxicity Reductions for Recycling vs. Waste-to-Energy Incineration
Both tables indicate that damages from beverage containers still being thrown in the garbage are greaterfor all six public health and environmental impact categories we examined than are the levels ofenvironmental protection provided by current levels for beverage container recycling. For example,beverage container wasting in Washington currently results in release of at least 313,000 tons ofgreenhouse gases each year, nearly double the amount of greenhouse gas reductions currently beingachieved by beverage container recycling efforts in the state. In the City of Tacoma, greenhouse gasreleases caused by beverage container wasting is 90% greater than greenhouse gas reductions fromcurrent recycling levels in Tacoma. The results for the other public health and environmental impactsshown in the two tables are similar.
In other words, while current beverage container recycling efforts in our state do achieve significantenvironmental benefits, we continue to create more environmental damages through our beveragecontainer wasting. We could readily more than double the environmental benefits attained frombeverage container recycling by capturing for recycling a significant additional portion of the usedbeverage containers currently being put in our garbage.
What are these levels of wasting for used beverage containers costing us? Using the estimates listed inSubsection A.1 of this chapter for the costs of releases of pollutants in each of the six public health orenvironmental impact categories, we can estimate the current cost levels associated with 2002 levels ofbeverage container wasting in Tacoma and Washington. These estimates are reported in Table 3-3,Estimated Cost of Public Health and Environmental Impacts from Used Beverage Container Wasting. AsTable 3-3 shows, beverage container wasting in Washington State costs over $19 million, $650 thousandfor the City of Tacoma alone, in terms of costs to public health and the environment for increases in
���������������������������� �����������������������������
������������������������������������������
���������������������������������������������������������������������������������������������������������
-1500.0
-1000.0
-500.0
0.0
500.0
1000.0
RecyclingImpacts
Net RecyclingImpact
GarbageImpacts
Net GarbageImpact
Hum
an T
oxic
ity P
oten
tial P
er T
on C
olle
cted
.
Net HumanToxicityImpactEnergyRecoveryOffset����
���� Incineration
Virgin Mfg.Offset
���� RecycledContentMfg.����Shipping
����Processing
����Collection
Recyclingwith ClosedLoop Recycled-ContentManufacturing
GarbageIncinerationwith EnergyRecovery
Pounds of Toluene Equivalents

Economic and Environmental Benefits of a Deposit System for Beverage Containers in Washington State
Prepared by Sound Resource Management Group, Green Solutions and the City of Tacoma 22
global warming, acidification, eutrophication, disabilities and deaths, human toxicity and ecologicaltoxicity. As discussed later in this chapter, these quantifiable costs are likely just the tip of the iceberg inpublic health and environmental impact costs associated with used beverage container wasting.
B. Additional Public Health and Environmental Cost SavingsThe previous section developed estimates of the public health and environmental benefits from reducingthe quantity of beverage containers thrown away in garbage. Those estimates quantified the benefits ofreduced impacts for six categories of public health and environmental impacts as a result of substitutingused containers for virgin raw materials in manufacturing new beverage containers and other products.In addition to these upstream benefits from recycling used beverage containers there are other benefitsfrom increased beverage container recycling that we address in this section.
1. Downstream Public Health & Environmental Benefits from Reducing Disposal of UsedBeverage Containers: in their four-year study of the social costs of packaging materials, recycling andpackaging alternatives, Tellus Institute conducted a life cycle inventory of the emissions of nearly 200chemical substances associated with the production and disposal of packaging materials, includingemissions from acquisition and processing of raw materials used to manufacture packaging (Tellus1992). In the study on beverage container recycling that SRMG conducted for Massachusetts PublicInterest Research Group (SRMG 1998), we used the Tellus study to estimate the public health costs forcollection and disposal of used beverage containers at a dollar per ton for disposal via landfill and $2 perton for disposal in a waste-to-energy incinerator.
These estimates suggest that current levels of beverage container wasting in Washington State costbetween $200 and $400 thousand annually in public health and environmental costs from collecting anddisposing of beverage containers in the garbage stream. These costs are in addition to the $19.2 millionin upstream costs discussed in the previous section of our report.
2. Public Health & Environmental Benefits of Reducing Litter: in SRMG’s study for MASSPIRGwe used another Tellus Institute study (Tellus 1997) to estimate some of the costs from roadside litteringof used beverage containers. One significant cost investigated and quantified by Tellus for the State ofMassachusetts involved hospital emergency room visits to deal with cuts from littered glass (Tellus1997). Based on the proportion of glass beverage containers being wasted we estimate that eachadditional ton of beverage containers recovered for recycling saves about $7 in avoided hospital visits todeal with littered glass cuts. This amounts to a potential savings of $1.4 million in Washington, withnearly $50 thousand of this in Tacoma alone, should all the used beverage containers currently beingwasted in Washington State get recycled.
Although at this point we have no quantified estimate of their economic costs, other costs from usedbeverage container litter are likely of greater economic import than cuts from littered glass. Theseinclude litter on public beaches3, bicycle and other vehicle tire punctures from broken glass bottles on theroadways, equipment and livestock damage and crop contamination from beverage containers thrownonto farmlands from passing vehicles4, and degraded aesthetics along our nation’s highways.
3 According to the Center for Marine Conservation’s 1995 International Coastal Cleanup, beach cleanup in Texas, anon-bottle bill state, yielded 2,461 pounds of litter per mile of beach, while cleanup efforts in two bottle bill states,Maine and Michigan, yielded, respectively, just 152 and 35 pounds of litter per mile of beach.4 For a personal account see Ed Fielder’ testimony before US Senate Committee on Commerce, Science, andTransportation, hearing to consider Beverage Container and Recycling Act, 5 Nov. 1981 (Y4.C73/7.97-83). For aquantified assessment see Daniel B. Taylor and John B. Hodges, “Impacts of Beverage Container Litter on VirginiaFarms,” Virginia Agricultural Economics, September-October 1985.

Economic and Environmental Benefits of a Deposit System for Beverage Containers in Washington State
Prepared by Sound Resource Management Group, Green Solutions and the City of Tacoma 23
Table 3-1Public Health and Environmental Impacts from Used Beverage Containers in Washington State in 2002
EnergyGreenhouse
Gases Acidification Eutrophication DALYsHumanToxicity
EcologicalToxicity
Btus Carbon Dioxide Sulfur Dioxide Nitrogen Lead 2,4-D(million Btus) (pounds) (pounds) (pounds) (life years) (pounds) (pounds)
Aluminum Cans 1,824,780 248,453,283 3,500,021 35,648 28.9 882 803,409Steel Cans 0 0 0 0 0.0 0 0PET 266,037 18,937,354 446,356 9,204 2.1 85,938 38,660HDPE 15,451 848,269 7,101 196 0.0 1,231 912Glass Bottles 145,479 47,644,903 343,061 3,651 10.0 192 21,507Gable-topCartons/AsepticBoxes 16 8,688 16 1 0.0 0 1Foil Pouches * * * * * * *Total All Materials 2,251,763 315,892,496 4,296,555 48,700 41 88,244 864,489
EnergyGreenhouse
Gases Acidification Eutrophication DALYsHumanToxicity
EcologicalToxicity
Btus Carbon Dioxide Sulfur Dioxide Nitrogen Lead 2,4-D(million Btus) (pounds) (pounds) (pounds) (life years lost) (pounds) (pounds)
Aluminum Cans 3,552,711 483,720,062 6,814,281 69,405 56 1,718 1,564,178Steel Cans 0 0 0 0 0 0 0PET 891,384 63,451,610 1,495,562 30,840 7 287,943 129,533HDPE 34,072 1,870,580 15,659 432 0 2,715 2,012Glass Bottles 221,003 72,379,172 521,157 5,547 15 292 32,673Gable-topCartons/AsepticBoxes 8,502 4,536,746 8,374 311 0 0 322Foil Pouches * * * * * * *Total All Materials 4,707,672 625,958,171 8,855,033 106,533 79 292,669 1,728,717
Sources for environmental impacts per ton of virgin- or recycled-contentd t1. Research Triangle Institute, Franklin Associates, and Roy F. Weston, Data Sets for the Manufacturing of Virgin
and Recycled Aluminum, Glass, Paper, Plastic and Steel Products, ES UPA, Air Pollution Prevention and Control Division, National Risk Management Research Laboratory, March 2000.2. Research Triangle Institute, Municipal Solid Waste Life-Cycle Database, US EPA, National Risk Management Research Laboratory, Atmospheric Protection Branch, Version 1.0, 2003.3. Swiss Federal Agency for the Environment, Forests and Landscape, Life Cycle Inventories for Packaging, Environ- mental Series No. 250/11, 1996.4. US EPA, Solid Waste Management and Greenhouse Gases, A Life-Cycle Assessment of Emissions and Sinks, May 2002.5. Morris, Jeffrey, Comparative LCAs for curbside recycling versus either landfilling or incineration with energy recovery, International Journal of Life Cycle Analysis (Online First, forthcoming in print in 2005).
Environmental Protection from Recycling of Beverage Continers
Environmental Damages from Disposal of Beverage Containers
2002 Washington State Beverage Container Environmental Impacts

Economic and Environmental Benefits of a Deposit System for Beverage Containers in Washington State
Prepared by Sound Resource Management Group, Green Solutions and the City of Tacoma 24
Table 3-2Public Health and Environmental Impacts from Used Beverage Containers in the City of Tacoma in 2002
EnergyGreenhouse
Gases Acidification Eutrophication DALYsHumanToxicity
EcologicalToxicity
Btus Carbon Dioxide Sulfur Dioxide Nitrogen Lead 2,4-D(million Btus) (pounds) (pounds) (pounds) (life years) (pounds) (pounds)
Aluminum Cans 60,692 8,263,543 116,411 1,186 1.0 29 26,721Steel Cans 0 0 0 0 0.0 0 0PET 18,938 1,348,072 31,774 655 0.2 6,118 2,752HDPE 6,351 348,650 2,919 80 0.0 506 375Glass Bottles 3,712 1,215,757 8,754 93 0.3 5 549Gable-topCartons/AsepticBoxes 0 0 0 0 0.0 0 0Foil Pouches * * * * * * *Total All Materials 89,693 11,176,021 159,857 2,015 1 6,658 30,397
EnergyGreenhouse
Gases Acidification Eutrophication DALYsHumanToxicity
EcologicalToxicity
Btus Carbon Dioxide Sulfur Dioxide Nitrogen Lead 2,4-D(million Btus) (pounds) (pounds) (pounds) (life years lost) (pounds) (pounds)
Aluminum Cans 116,506 15,862,877 223,464 2,276 2 56 51,295Steel Cans 0 0 0 0 0 0 0PET 31,074 2,211,932 52,135 1,075 0 10,038 4,516HDPE 2,886 158,426 1,326 37 0 230 170Glass Bottles 8,557 2,802,587 20,180 215 1 11 1,265Gable-topCartons/AsepticBoxes 400 213,521 394 15 0 0 15Foil Pouches * * * * * * *Total All Materials 159,423 21,249,343 297,500 3,617 3 10,335 57,261
Sources for environmental impacts per ton of virgin- or recycled-contentd t1. Research Triangle Institute, Franklin Associates, and Roy F. Weston, Data Sets for the Manufacturing of Virgin
and Recycled Aluminum, Glass, Paper, Plastic and Steel Products, ES UPA, Air Pollution Prevention and Control Division, National Risk Management Research Laboratory, March 2000.2. Research Triangle Institute, Municipal Solid Waste Life-Cycle Database, US EPA, National Risk Management Research Laboratory, Atmospheric Protection Branch, Version 1.0, 2003.3. Swiss Federal Agency for the Environment, Forests and Landscape, Life Cycle Inventories for Packaging, Environ- mental Series No. 250/11, 1996.4. US EPA, Solid Waste Management and Greenhouse Gases, A Life-Cycle Assessment of Emissions and Sinks, May 2002.5. Morris, Jeffrey, Comparative LCAs for curbside recycling versus either landfilling or incineration with energy recovery, International Journal of Life Cycle Analysis (Online First, forthcoming in print in 2005).
Environmental Protection from Recycling of Beverage Continers
Environmental Damages from Disposal of Beverage Containers
2002 Tacoma Beverage Container Environmental Impacts
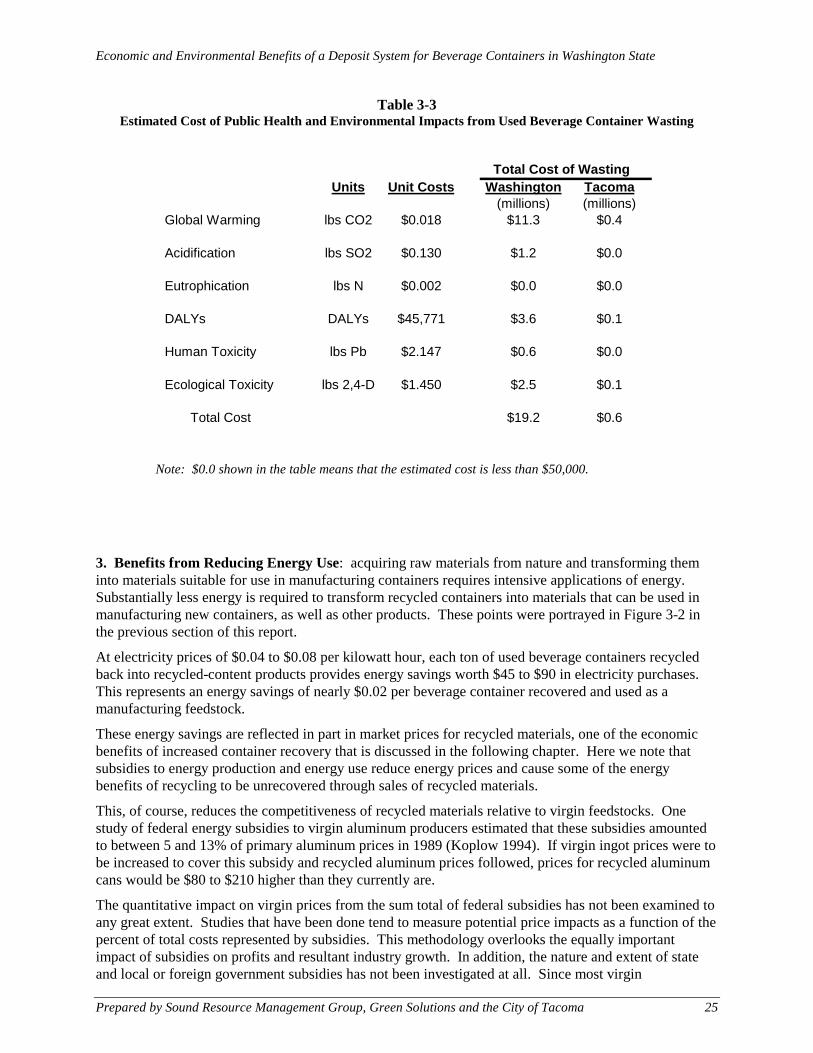
Economic and Environmental Benefits of a Deposit System for Beverage Containers in Washington State
Prepared by Sound Resource Management Group, Green Solutions and the City of Tacoma 25
Table 3-3Estimated Cost of Public Health and Environmental Impacts from Used Beverage Container Wasting
Total Cost of WastingUnits Unit Costs Washington Tacoma
(millions) (millions)Global Warming lbs CO2 $0.018 $11.3 $0.4
Acidification lbs SO2 $0.130 $1.2 $0.0
Eutrophication lbs N $0.002 $0.0 $0.0
DALYs DALYs $45,771 $3.6 $0.1
Human Toxicity lbs Pb $2.147 $0.6 $0.0
Ecological Toxicity lbs 2,4-D $1.450 $2.5 $0.1
Total Cost $19.2 $0.6
Note: $0.0 shown in the table means that the estimated cost is less than $50,000.
3. Benefits from Reducing Energy Use: acquiring raw materials from nature and transforming theminto materials suitable for use in manufacturing containers requires intensive applications of energy.Substantially less energy is required to transform recycled containers into materials that can be used inmanufacturing new containers, as well as other products. These points were portrayed in Figure 3-2 inthe previous section of this report.
At electricity prices of $0.04 to $0.08 per kilowatt hour, each ton of used beverage containers recycledback into recycled-content products provides energy savings worth $45 to $90 in electricity purchases.This represents an energy savings of nearly $0.02 per beverage container recovered and used as amanufacturing feedstock.
These energy savings are reflected in part in market prices for recycled materials, one of the economicbenefits of increased container recovery that is discussed in the following chapter. Here we note thatsubsidies to energy production and energy use reduce energy prices and cause some of the energybenefits of recycling to be unrecovered through sales of recycled materials.
This, of course, reduces the competitiveness of recycled materials relative to virgin feedstocks. Onestudy of federal energy subsidies to virgin aluminum producers estimated that these subsidies amountedto between 5 and 13% of primary aluminum prices in 1989 (Koplow 1994). If virgin ingot prices were tobe increased to cover this subsidy and recycled aluminum prices followed, prices for recycled aluminumcans would be $80 to $210 higher than they currently are.
The quantitative impact on virgin prices from the sum total of federal subsidies has not been examined toany great extent. Studies that have been done tend to measure potential price impacts as a function of thepercent of total costs represented by subsidies. This methodology overlooks the equally importantimpact of subsidies on profits and resultant industry growth. In addition, the nature and extent of stateand local or foreign government subsidies has not been investigated at all. Since most virgin

Economic and Environmental Benefits of a Deposit System for Beverage Containers in Washington State
Prepared by Sound Resource Management Group, Green Solutions and the City of Tacoma 26
commodities trade on international markets, foreign subsidies are also an important factor in low virginmaterial prices.
Suffice it to note for this report that governmental subsidies and regulatory exemptions of all kinds, aswell as externalized public health and environmental costs, contribute significant unearned benefits tovirgin materials producers and users, and uncompensated costs to the public and the environment. Acorollary result is prices for virgin materials that most likely are substantially lower than they would be inthe absence of these unearned benefits.
This is significant for evaluating waste material recovery programs that would reduce used beveragecontainer wasting, because it means that revenues from selling recovered materials will be much lowerthan they would be in the absence of subsidies. Net costs of the recovery program, thus, will appearhigher than they should, which may lead to unwarranted rejection of a program that is beneficial from asociety-wide point of view.
4. Benefits from Reducing Ecosystem Impacts: a 1997 article in Nature magazine (Costanza 1997)and the Paul Hawken and Amory Lovins book Natural Capitalism: Creating the Next IndustrialRevolution (1999) brought mainstream recognition for the important role that ecosystems and naturalcapital play in creating and maintaining life, health and wealth for humans. A 2002 publication in thejournal Ecological Economics (de Groot 2002) refined the concept of ecosystem services; provided acategorization of ecosystem functions, goods and services; and catalogued the economic valuationestimates obtained from studies in the scientific and professional literature on valuation.
We had neither the time nor the budget to attempt to fully estimate the negative impacts on ecosystemsand ecosystem services caused by wasting used beverage containers and therefore having to make newcontainers from virgin materials for every used container thrown in the garbage can. There are, however,a few pollutants that are toxic to ecosystems whose emissions are quantified in the RTI/EPA database.We used those emissions factors to estimate the ecological toxicity costs of beverage container wastingshown in Table 3-3.
Because so few ecosystem toxins are measured in the RTI/EPA database, we believe that the $2.5 millionestimated annual cost for the negative impacts on ecosystems from toxic emissions substantiallyunderestimates the full cost of used beverage container wasting. Furthermore, the Costanza study andsubsequent work in the field of ecological economics suggest that direct human health costs fromenvironmental externalities caused by the production of virgin-content beverage containers are likelydwarfed by costs from impacts on ecosystem functions as a result of the use of virgin materials and fuelsin beverage container production and disposal.
Expenditures for clean up at abandoned mine sites5, remediation of old dumps, containment and clean upof oil spills, and other attempts to mitigate or repair ecosystems damaged by our use of virgin materialsand energy resources provide concrete examples of the value of ecosystems and what we have to pay tomaintain them. Until they are damaged, the role of ecosystems in supporting human activities often goesunnoticed.
In conclusion, when ecosystems are damaged, clean up and mitigation costs often are borne by taxpayersand, thus, not directly included in prices we pay for materials, fuels and electrical power. Virginmaterials prices set an upper bound on prices for recovered materials. Anytime that an environmentalcost of virgin materials acquisition and processing is not charged directly to virgin material producers,the probable result is that a virgin material’s price is lower than it would otherwise be. In turn this meanslower prices paid by manufacturers to buy recovered materials for use in making recycled-contentproducts. Thus, ecosystem services that the virgin producer uses free of charge and clean up costs that
5 Estimated by Mineral Policy Center in its recent publication Golden Dreams, Poisoned Streams to total $32 - $72billion in taxpayer absorbed costs for 557,000 abandoned mine sites in just the US alone.

Economic and Environmental Benefits of a Deposit System for Beverage Containers in Washington State
Prepared by Sound Resource Management Group, Green Solutions and the City of Tacoma 27
are funded by government programs impair the financial viability of recycling and recovery programsimplemented to reduce the wasting of used beverage containers.
C. Public Health & Environmental Benefits of Increased Beverage Container Recoverythat have not yet been Quantified
A 1987 review by the Conservation Foundation (CF 1987) revealed that the Toxic Substances ControlAct (TSCA) inventory listed over 63,000 chemical substances used commercially since 1975, with nearly1,500 additions to the inventory occurring each year. Some of these substances are not toxic undernormal usage - e.g., that inventory even included water because people can drown in it.
In 1992 the National Research Council reported that,
“About 70,000 chemicals are used in commerce, of which several hundred are known tobe neurotoxicants. However, except for pharmaceuticals, less than 10% of all chemicalsin commerce have been tested at all for neurotoxicity, and only a handful have beenevaluated thoroughly” (NRC 1992).
The Toxics Release Inventory provisions of the Emergency Planning and Community Right to Know Actof 1986 require certain industrial facilities to annually disclose large releases to air, land and water for alist of some 654 chemicals. In 1995, EPA added 280 more chemical substances to the required reportinglist. In addition, seven non-manufacturing industries -- metal mines, coal processors, waste disposal,solvent recyclers, oil- and coal-fired utilities, chemical wholesalers and petroleum bulk storage -- arerequired to report annual releases starting with 1998.
The estimates for human health impacts from virgin container production that have been discussed in thisreport cover only a handful of chemical substances. These relatively few chemical substances may be theones that cause significant impacts during the production of beverage containers, but this suppositionremains unproven until releases from all chemicals are measured and evaluated through life cycleinventories similar to those that yielded the RTI/EPA database used for the impact quantity and costestimates from beverage container wasting shown in Tables 3-1, 3-2 and 3-3.
Data presented in this chapter cover several of the public health and environmental benefits that wouldresult from expanded recovery and reduced wasting of used beverage containers. Numerous otherpotential benefits have not been addressed because they have not been adequately studied and quantifiedas of yet. Omissions include:
• Direct human health impacts from releases of currently unregulated substances or substances thathave been overlooked in available studies;
• Human health and other environmental impacts from currently unregulated on-site disposal orimpoundment of a wide variety of processing and manufacturing wastes, and
• Valuation of ecosystem impairments caused by exploration and harvesting of material and energyresources necessary for virgin-content beverage container production.
From this we conclude that this chapter’s estimate of over $20 million in public health and environmentalcosts from current levels of used beverage container wasting in Washington is actually a substantialunderestimate of the total costs to public health and the environment from throwing used beveragecontainers in the garbage can.

Economic and Environmental Benefits of a Deposit System for Beverage Containers in Washington State
Prepared by Sound Resource Management Group, Green Solutions and the City of Tacoma 28

Economic and Environmental Benefits of a Deposit System for Beverage Containers in Washington State
Prepared by Sound Resource Management Group, Green Solutions and the City of Tacoma 29
IV. Economic Benefits of Increased Bottle Recovery
Direct economics benefits from increased bottle recovery include revenues earned from selling recoveredcontainers on recycled commodity markets, savings in garbage collection and disposal expenditures,savings in litter control costs, and new jobs processing and marketing recovered containers, as well asnew manufacturing jobs in businesses that make recycled-content products. Offsetting these directbenefits is the potential for job and income losses in garbage collection and disposal, as well as in virginmaterials manufacturing.
Indirect benefits include additional income and jobs created via the multiplier or ripple effects fromrecovered container sales revenue and net job and income creation.
A. Deposit Dollars1. Total Deposits: deposits are generally paid by consumers and then held temporarily by retailers orothers, and so by themselves are not an economic gain or loss. The total deposits paid are shown here,however, as a first step in showing the amount of unredeemed deposits.
The total deposits collected will depend on two factors:
• the types of beverages included in the deposit system, and• the amount of deposit per container (5¢, 10¢ or other amount).
The following table (see Table 4-1) addresses all beverage containers that could potentially be includedin a deposit system, including:
• carbonated, such as pop, carbonated water, and beer.• non-carbonated, non-alcoholic, including fruit juices but excluding milk.• non-carbonated, alcoholic, such as wine and liquor.• carbonated alcoholic, such as wine coolers, sparkling wines and champagne.
None of these categories include milk containers. The non-carbonated, non-alcoholic beveragecontainers represent about 25% of the total number of containers, and non-carbonated, alcoholicbeverage containers (for wine and distilled spirits) are about another 3%. In other words, if a depositsystem were adopted in the state that only included carbonated beverages (as some states have done), thatwould still include 72% of the total number of containers.
2. Unredeemed Deposits: for all of the possible deposit systems, a percentage of the containers are notreturned for the deposit. Most of these are probably disposed along with wastes, but a small amount areprobably also littered (in locations where they are not recovered), or broken or otherwise damaged to thepoint the container is no longer eligible for a deposit. The amount of unredeemed deposits will dependon:
• the amount of the deposit itself (10¢ provides more incentives for returns than 5¢).• the type of deposit and return system.• the convenience of return centers.
For the purposes of calculating the amount of unredeemed deposits (containers that are still thrown outwith garbage or otherwise lost from the system), this analysis assumes an 80% return rate for 5¢ depositsystems and 90% for 10¢ deposits. These figures are consistent with the experience of existing depositsystems. Coincidentally, the amount of unredeemed deposits are the same in both cases (5¢ deposit and80% returns versus 10¢ deposit and 90% returns), since twice as many containers are not returned in the5¢ system, which only collects half as much funds in the first place.

Economic and Environmental Benefits of a Deposit System for Beverage Containers in Washington State
Prepared by Sound Resource Management Group, Green Solutions and the City of Tacoma 30
Table 4-1Amount of Deposit Funds Collected
STATEWIDE FIGURES
Deposit Paid, inmillions
Deposits Returned, inmillionsMaterial Tons per
Year (2002)Containers per
TonMillions ofContainers 5¢ 10¢ 5¢ 10¢
UnredeemedDeposits, in
millionsAluminum cans 35,980 67,500 2,428.6 121.4 242.9 97.2 218.6 24.3Steel Cans 0 11,430 0 0 0 0 0 0PET 23.050 25,500 587.7 29.4 58.8 23.5 52.9 5.9HDPE 970 25,500 24.6 1.2 2.5 1.0 2.2 0.25Glass Bottles 150,500 4,000 602 30.1 60.2 24.1 54.2 6.0Gabletop Cartons 680 16,000 NA NA NA NA NA NAAseptic Boxes NA 56,800 NA NA NA NA NA NATotal 211,170 3,643 182 364 145.7 327.9 36.4TACOMA FIGURESAluminum cans 1,186 67,500 80.0 4.0 8.0 3.2 7.2 0.8Steel Cans 0 11,430 0 0 0 0 0 0PET 1,000 25,500 25.4 1.3 2.5 1.0 2.3 0.25HDPE 80 25,500 2.05 0.1 0.2 0.08 0.18 0.02Glass Bottles 5,040 4,000 20.2 1.01 2.02 0.81 1.81 0.2Gabletop Cartons NA 16,000 NA NA NA NA NA NAAseptic Boxes NA 56,800 NA NA NA NA NA NATotal 7,306 128 6.4 12.8 5.1 11.49 1.28

Economic and Environmental Benefits of a Deposit System for Beverage Containers in Washington State
Prepared by Sound Resource Management Group, Green Solutions and the City of Tacoma 31
B. Economic Benefits1. Recovered Materials Sales Revenue: revenues from selling the used beverage containers that arecurrently being wasted in Washington and Tacoma will provide significant economic benefits. As shownin Figure 4-1, Average Market Value for Wasted Beverage Containers, prices paid over the past elevenyears for a ton of recycled beverage containers, processed and packaged to end-user specification, wherethe ton contains the same average mix of container types as are currently being wasted in WashingtonState.
The prices used to calculate the average price graph shown in Figure 4-1 are end-user prices (net oftransportation costs – i.e., FOB at a material recovery facility) paid for used beverage containers thathave been collected by Puget Sound area curbside recycling programs. Market values for glass bottlesare based on market prices for color-sorted, whole glass containers, although many programs are mixingand breaking bottles during collection. Thus, market revenues for glass containers collected curbside arein reality near or below zero due to the quantities of broken, mixed-color glass needing to be sold. Thekind of product stewardship program that would recover most of the wasted beverage containers wouldlikely result in much lower levels of broken bottles and mixing of colors, and therefore attain marketrevenues for glass in the neighborhood of a current combined weighted average price of $7.50 per ton forthe three colors. A deposit-refund beverage container recovery system would also likely increase themarket values for recycled PET and HDPE bottles due to easier separation by color, but the market pricesshown in Figure 4-1 do not included any adjustment for this upgrade in quality of the collected plasticbottles.
Based on recent market trends as shown in Figure 4-1 we would expect market prices for used beveragecontainers collected through deposit systems to average more than $250 per ton for the mix of beveragecontainer types currently thrown in the garbage in Washington State.
Figure 4-1
Average Market Value for Wasted Beverage ContainersPuget Sound Region, 1994-2004
$0.00
$50.00
$100.00
$150.00
$200.00
$250.00
$300.00
$350.00
$400.00
94 95 96 97 98 99 00 01 02 03 04 05
$/ton

Economic and Environmental Benefits of a Deposit System for Beverage Containers in Washington State
Prepared by Sound Resource Management Group, Green Solutions and the City of Tacoma 32
2. Decreased Garbage Collection Costs: another benefit that would accrue from a container depositsystem would be the increased efficiencies during the garbage collection process from fewer containersin the waste stream.
The City of Tacoma does not have current waste composition data so we have utilized the averages fromthree Western Washington urban waste sorts; King County, City of Seattle and Thurston County. Datafrom these three studies were used to determine the amount of containers subject to a deposit that are stillin the waste stream. Using this data along with estimates of the percentage of each type of container thatwould be covered under a deposit system (see Table 1-4), density figures for each material andoperational data from the City’s garbage collection operations, we were able to estimate the garbagevolume reduction that would result from a deposit system. The density figures used were an average ofdata from the American Plastics Council (APC 1995), the Business Recycling Cost Model (GS 1997) andthe National Solid Waste Management Association (Miller, various dates). The results of this analysisare presented in Table 4-2.
Table 4-2Garbage Collection Cost Savings
Current Garbage Collection Operations for the City of Tacoma
DateNumber ofTrucks/Day Tons Collected
Ave. Tons/Truck/Day
Ave. Stops/Truck Pounds /Stop
2-21-05 16.5 290.5 17.6 750 47.02-22-05 16.5 301.3 18.3 750 48.72-23-05 16.5 285.2 17.3 750 46.12-24-05 16.5 302.1 18.3 750 48.82-25-05 16.5 308.2 18.7 750 49.8
Averages 16.5 297.4 18.0 750 48.1Reduction in Volume due to Deposit Containers
Material Density,lb/cy
Amt. inWaste,
% by wt% DepositContainers
90%Redeemed
Poundsper Load
CubicYards (cy)per Load
AfterCompaction,cy per load
Aluminum 62 0.40% 96% 90% 62.3 1.00 0.25PET 34 0.41% 75% 90% 49.9 1.47 0.37HDPE, nat. 23 0.25% 5% 90% 2.0 0.09 0.02HDPE, pigm. 44 0.31% 5% 90% 2.5 0.06 0.01Glass 515 2.51% 69% 90% 281.0 0.55 0.27Milk, Aseptic 51 0.32% 5% 90% 2.6 0.05 0.01Totals 400 3.22 0.94Savings Cubic Yards per Day (for 33 loads) 31.0
Equivalent Number of Trucks per Day 0.57Savings:
Driver (unit cost = $109,750)Truck Repair, Maint. and
Replacement (unit cost = $26,254)Total Savings
$63,064
$15,086$78,149

Economic and Environmental Benefits of a Deposit System for Beverage Containers in Washington State
Prepared by Sound Resource Management Group, Green Solutions and the City of Tacoma 33
The analysis shown in Table 4.2 begins with actual data from a recent week of garbage collections inTacoma. The City uses 27 cubic yard automated trucks for the collection of garbage. The truck routesconsist of approximately 750 stops and each truck collects two loads per day from that route. Theaverage weight per load for the week was nine tons (18 tons per truck per day). Based on typicalperformance, we have assumed a compaction rate of 4:1 for all materials other than glass. Glass iscalculated at a 2:1 compaction rate (i.e., some but not all of the bottles are broken during collection).
We estimate the City will save almost one cubic yard per load per day with 90% of the deposit containerstaken out. For 16.5 trucks and two loads per day, that is equal to 31.0 cubic yards per day, or theequivalent of 0.57 trucks per day (at 54 cubic yards collected per truck per day). At current wage ratesfor the drivers and maintenance rates for the garbage trucks, this translates to an annual savings to theCity of $78,149. This is a conservative estimate, since the data used to develop this cost figure is from aperiod of the year when waste volumes are typically at their lowest.
3. Decreased Disposal Costs: in addition to reduced collection expenses, less garbage also meansreduced disposal costs. The City of Tacoma currently has a contract with LRI to dispose of garbage atthe LRI Landfill located at South 304th and Meridian in Pierce County. That contract provides for asliding scale of fees based on the amount of waste delivered by the City of Tacoma to the landfill. Forthe tonnages that the City has been delivering to the landfill in the past few years, the average cost is $26per ton. If the deposit system eliminates 4,239 tons per year (see Table 1-4), that is the equivalent of$110,214 in disposal savings.
In addition to reductions in the disposal charges, there would also be a reduction in the cost oftransporting the waste from Tacoma to the landfill. This is done by City employees, at a cost of about$9.50 per ton. For 4,239 tons per year, the transportation savings would be $40,271, for a total disposalsavings of $150,485 per year.
4. Decreased Recycling Collection Costs: the same approach that was used to analyze the decreasedgarbage costs can be used to estimate decreased recycling collection costs. In this case, the average mixof the City’s curbside recyclables is provided by the monthly reports from the materials processor. Thesereports give the percentage breakdown of each commodity in the recycling stream. The percentage ofthese containers that are assumed to be from beverages changes slightly from the garbage collectionanalysis because studies have shown that beverage containers are recycled more often than foodcontainers for these two materials. The City’s recycling trucks are also 27 cubic yard capacity for themost part although there are a few 18 cubic yard rear loaders that are still used when needed. Forpurposes of this report, we have not taken these smaller trucks into consideration. Had we done so, theoperational savings would be even greater than what we show below.
Collection is semi-automated with the glass set out and collected separately from the rest of thecommingled recyclables. The average recycling route has 368 stops and each stop averages 30 pounds ofmaterial. On a typical day, Tacoma sends out 12 recycling trucks and each truck collects two loads.With the current mix of containers in the recycling stream, we estimate that a deposit system would saveapproximately 1.24 cubic yards of space on each recycling load. We used a 4 to 1 compaction rate on allmaterials except glass which we estimated at 2 to 1. This space savings on each load translates to 29.54less cubic yards per day, or the equivalent of 0.55 trucks per day. This represents a savings of $60,035 indriver’s salary and benefits and $ 14,361 in truck maintenance and depreciation for a total collectionsavings of $74,396 (see Table 4-3).
5. Decreased Litter Control Costs: as mentioned earlier in this report, a total of 7,401,004 pounds oflitter were picked up in 2002 at a cost of $4.4 million, which is the equivalent of $1,200 per ton of litter.As shown in Table 1-2, 26.8% of this litter was aluminum cans, plastic bottles and glass bottles.According to the definitions used by the 1999 litter study, all of these materials were beverage

Economic and Environmental Benefits of a Deposit System for Beverage Containers in Washington State
Prepared by Sound Resource Management Group, Green Solutions and the City of Tacoma 34
Table 4-3Recycling Collection Cost Savings
Current Recycling Collection Operations for the City of Tacoma
Date Number ofTrucks/Day
TonsCollected
Ave. Tons/Truck/Day
TotalNumber of
StopsAve, Stops
/TruckPounds/Stop
3-14-05 12 73.8 6.2 5,151 429 28.73-15-05 12 65.5 5.5 4,347 362 30.13-16-05 12 67.9 5.7 4,746 395 28.63-17-05 12 59.2 4.9 4,011 334 29.53-18-05 14 76.4 5.5 5,025 359 30.43-21-05 11 72.1 6.6 4,231 385 34.13-22-05 11 59.9 5.5 4,066 370 29.53-23-05 11 50.0 4.6 3,696 336 27.13-24-05 12 73.0 6.1 4,378 364 33.43-25-05 12 58.7 4.9 4,103 342 28.6
Averages 11.9 65.7 5.5 4,375 368 30.0Reduction in Volume due to Deposit Containers
Material Density,lb/cy
Amt. inRecy. Mtl,% by wt
% DepositContainers
90%Redeemed
Poundsper Load
CubicYards (cy)per Load
AfterCompaction,
cy per dayAluminum 62 1.00% 96% 90% 47.7 0.77 0.19PET 34 1.55% 90% 90% 69.3 2.04 0.51HDPE, nat. 23 1.32% 5% 90% 3.3 0.14 0.04HDPE, pigm. 44 1.57% 5% 90% 3.9 0.09 0.02Glass 515 8.11% 92% 90% 370.6 0.72 0.36Milk, Aseptic 51 1.75% 5% 90% 4.3 0.08 0.02Totals 500 3.84 1.14Savings Cubic Yards per Day (for 24 loads) 27.4
Equivalent Number of Trucks per Day 0.51Savings:
Driver (unit cost = $109,750)Truck Repair, Maint. and Replacement (unit cost =
$26,254)Total Savings
$55,973
$13,390$69,362
containers, and so would potentially be included in the deposit system. The savings from eliminating90% of these bottles and cans from the litter would be 24.1% of the total cost, or $1,071,245 per year.
This analysis ignores the fact that part of the litter control costs may be fixed expenses that do not varyaccording to the amount of litter, but there is no information available as to the proportion of fixed andvariable expenses for the litter control programs. This analysis also ignores the very small, presumablyinsignificant, number of milk containers that might be included in the plastic or glass bottle categories forthe litter composition study. This analysis also does not, however, include the other types of containers(such as gabletop cartons and foil pouches) that would contribute to the amount beverage containers andhence increase the savings. More importantly, previous research has found that deposit systems not only

Economic and Environmental Benefits of a Deposit System for Beverage Containers in Washington State
Prepared by Sound Resource Management Group, Green Solutions and the City of Tacoma 35
reduce the amount of beverage containers that end up as litter but also reduce other litter by up to 47%(CRI 2004).
6. Increased Jobs: a report for the Arizona Department of Commerce estimates that 4.1 new jobs inrecyclables processing and recycled-content manufacturing are created for every 1,000 additional tonsrecovered, without regard to type of recycled material (RW Beck 1996). We are projecting an additionalrecovery of over 112,000 tons of beverage containers, which could yield 460 new processing andmanufacturing jobs. Based on data from The Institute for Local Self-Reliance presented in theMASSPIRG report (SRMG 1998), we expect at least half of these jobs to be in processing and pre-manufacturing.
We did not have the time or budgetary resources to accurately determine the extent of job losses in virginmaterials industries that might occur in Washington as a result of increased beverage container recycling.However, three beverage container material types account for virtually all of the increased recycling –glass containers, aluminum cans, and PET bottles. We do not believe that there would be significant joblosses in virgin aluminum manufacturing in the state because most virgin aluminum manufacturing hereappears to be devoted to materials other than can sheet. For glass, we would expect the increased use ofrecycled glass to offset any reductions in virgin-content glass container manufacturing. Due to thecurrent shortage of recycled PET in the US, the large offshore demand for it, and the lack of muchrecycled content in PET beverage containers, we would not expect the additional volume of recycledPET bottles to have any serious consequences for virgin PET production activities that may presently beoccurring in Washington State. In conclusion, we do not expect to see many job losses in virgin-contentproduct manufacturing as a result of increased beverage container recycling.
One could posit an impact on garbage and recycling truck operator jobs as a result of such a significantincrease in beverage container recovery as well as a switch from recovery through curbside as a result ofimplementation of some sort of container deposit refund recycling system. Indeed we expect certaingarbage and recycling collection route and recyclables processing efficiencies, as discussed in thesections on decreased garbage and recycling collection costs. However, we would not expect theinstitution of a deposit-refund system to result in any actual collection truck operator lay offs. Rather thechange would most likely mean a delay in new hires to cover population growth in the state, but not adecrease in current employment levels.
In summary, then, we would expect to see significant new employment opportunities in recyclablesprocessing and recycled-content manufacturing as a result of implementation of a beverage containerdeposit-refund system in this state. The reader should note that our minimum estimate of over 200 netnew jobs in the state does not include any jobs that might be created as part of the infrastructure put inplace to collect deposits, refund deposits and handle the beverage containers returned for deposit refundand shipment to recycled container processing centers. We treat these jobs as costs of the deposit-refundsystem rather than increased job benefits, but such jobs would also provide gainful employment for thosewho got and held them. It would be legitimate, however, to apply an economic multiplier effect to thesejobs as well as to the recycling jobs created as a direct result of container deposit legislation. Based oninformation from the Office of Financial Management (OFM 2004, see www.ofm.wa.gov/economy/io/),the indirect job gains factor would be about 2.74. Hence, a net gain of 200 jobs would also result in anadditional 348 jobs due to ripple effects.

Economic and Environmental Benefits of a Deposit System for Beverage Containers in Washington State
Prepared by Sound Resource Management Group, Green Solutions and the City of Tacoma 36

Economic and Environmental Benefits of a Deposit System for Beverage Containers in Washington State
Prepared by Sound Resource Management Group, Green Solutions and the City of Tacoma 37
V. Cost of Deposit System
This part of the report addresses the increased costs associated with deposit systems. There are twoprimary costs: 1) the administrative/handling expense for the companies or organizations that need tohandle the deposits and the returned containers and 2) the loss of market revenues from existingrecycling programs.
A. Administrative and Handling Costs for Deposit SystemsThe following is an analysis of the additional handling and other overhead expenses associated with thethree main types of deposit systems. This analysis is by necessity based on existing experiences in otherstates and organizations, but this provides a “reality check” that other approaches to cost estimatingmight lack. On the other hand, it also requires several built-in assumptions about what a deposit systemin Washington might look like.
1. Retail Stores for Collecting and Returning Deposits: much of the following analysis of costs forthis approach (and for the next approach, on redemption centers, as well) is taken from the BEAR report(RW Beck 2002). As shown in that report, the costs vary among the nine traditional deposit systems, andthe factors leading to those differences include:
• Labor rates paid to employees who handle returned containers at retail stores and at distributors, andthe cost per square foot attributed to the space to recycle.
• The extent to which redemptions occur through retailers, redemption centers, third-party recyclers,old-line recyclers or reverse vending machines. Reverse vending machines (RVMs) and “old-linerecyclers” generally have the lowest costs (RVM costs are discussed separately below).
• Although documentation is scarce, the sorting of containers by brand name, which most traditionaldeposit systems require, adds a cost compared to systems in which brand sorting is not required.
Revenue sources also vary. Factors affecting revenue include:
• The deposit amount and redemption rate.• The existence of a state “escheat” law (which determines whether unredeemed deposits are available
to offset system costs).• The existence and basis of handling fees (which transfer costs from retailers and redemption centers
to bottlers and/or producers).• Differences in market value resulting from regional market conditions, the mix of containers
redeemed and/or the business relationships of the program operators. Deposit systems yield thehighest quality materials and, especially for glass and plastic, are often are sold at higher values thanmaterials collected in curbside programs.
There is a wide range in the availability and quality of cost data on the nine traditional deposit systems,partly because the systems are largely private sector-based. Due to concerns over differingmethodologies, the BEAR report based its estimates of typical program costs on a detailed study that hadbeen performed by Franklin Associates Ltd. for a confidential client. That study only examined onetraditional deposit system but those estimates are adjusted as appropriate in the BEAR report. Some ofthe key assumptions in the Franklin study include:
• Covered beverage containers. In this cost model, Franklin Associates, Ltd. assumed the coveredbeverages to be soft drink and beer, the types most frequently covered by traditional deposit systems.

Economic and Environmental Benefits of a Deposit System for Beverage Containers in Washington State
Prepared by Sound Resource Management Group, Green Solutions and the City of Tacoma 38
• Redemption Rate. Based on redemption rates for the three states with the best documentation (whichhappen to be the three most populous traditional deposit states – New York, Massachusetts andMichigan), a 1999 average redemption rate of 78% was used.
• Study Year. The deposit system cost model uses 1999 data.• Redemption Only. The cost model addresses only the costs and revenues associated with redemption
of covered beverage containers. Additional recycling occurring in deposit states through curbsideand other programs was not addressed.
• Fraudulent Redemption. Container redemption fraud through containers being transported acrossstate lines from a non-deposit state to a deposit state is accounted for in the model, since it considersaverage redemption rates (presumably including some degree of fraudulent redemption). A studyprepared for the Michigan Great Lakes Protection Fund in July 2000 estimated statewide fraud at2.5% of the containers redeemed in Michigan, although Michigan’s deposit is 10¢ per container ortwice the national average for states with deposit laws. Fraudulent return rates are likely higher forthose communities located on the border of a state that does not have deposit/redemption legislation.
• Flow of containers. Consumers redeem used containers at either retailers or redemption centers,which return the containers to either the distributor or a third-party recycler. Most distributorsprocess the redeemed containers for sale to scrap markets. In this analysis, 72% of the redeemedcontainers are assumed to be processed by distributors and sold directly to markets. The remaining28% are assumed to flow first to an intermediate processor and are then marketed.
• Percentage of Containers Handled by Each Party. The BEAR report makes specific assumptionsabout the relative amounts of containers that are handled by the retailers, redemption centers,distributors, third-party recyclers, and intermediate processors. These assumptions in particular arelikely to vary significantly by state depending on the deposit system in place.
• Container Mix Handled by Each Party. The container mix (aluminum, glass and plastic) will alsodiffer for each party involved in the system, and this mix will vary from state to state depending onthe deposit system in place.
• Handling Fee. Handling fees help offset retailer and/or redemption center program costs. Handlingfees do not reduce or increase the overall system costs, but only shift the cost burden. In the BEARreport, distributors are assumed to pay 2¢ per container handling fee to the retailers or the redemptioncenters, and third-party recyclers receive the handling fee from the retailer. Seven of the ninetraditional deposit states have similar handling fees, ranging from 1¢ per container in Iowa to 3¢ inMaine and Vermont. Legislation in Michigan and Oregon do not provide for a handling fee,although Michigan does return 25% of the escheat fund to retailers to offset their costs.
• Processing Costs. The BEAR report assumes that the processing costs for deposit containers wouldbe similar to those estimated for a curbside sort or drop-off program in which containers arecompletely source separated. Processing costs may sometimes be less than this, since the materialscollected through a deposit system are generally cleaner and better separated than other recyclingprograms.
• Market Value. Finally, the BEAR report assumes that market values for recovered materials in thedeposit system are the same as those used in the curbside and drop-off collection program analyses,which understates deposit revenues in relation to curbside and drop-off programs. In this report, weused market revenues for glass based on the sales value for color-sorted glass containers instead.
Typical costs are shown in the BEAR report for each party involved in the deposit system, and areexpressed in terms of dollars per ton of material (aluminum, glass, and plastic) as well as cents percontainer. The figure for cents per container is used here because it avoids the need to convert from thenumber of containers based on assumptions about container weights and material densities. This figureis used in Table 5-1 to calculate the cost of a deposit system.

Economic and Environmental Benefits of a Deposit System for Beverage Containers in Washington State
Prepared by Sound Resource Management Group, Green Solutions and the City of Tacoma 39
Table 5-1Costs for Administrating and Handling Deposit Containers
Retail StoresRedemption
CentersThird-Party
Organizations AverageStatewide:Millions ofContainers 3,643 3,643 3,643 3,643Cost per Container $0.0407 $0.0162 $0.0221 $0.0263Total Cost $148,270,000 $59,020,000 $80,510,000 $95,811,000Tacoma Only:Millions ofContainers 107 107 107 107Cost per Container $0.0407 $0.0162 $0.0221 $0.0263Total Cost $4,355,000 $1,733,000 $2,365,000 $2,814,000
The costs shown in Table 5-1 are not “net costs” (do not take into account material revenues, forinstance). The net cost for a deposit system is borne ultimately by the consumer, but costs are incurredinitially at several different levels:
• Consumers. Consumers pay the deposit on covered beverages at the time of purchase. If thecontainer is not returned to the retailer or redemption center, the consumer absorbs the cost of thedeposit. If the consumer redeems the container, there is a cost associated with transporting thecontainer back for the redemption, which is borne by the consumer. In this analysis, it was assumedthat most consumers combine travel for returning containers with other objectives such as groceryshopping and therefore this cost impact is negligible.
• Retailers. Retailers include grocery stores, convenience stores, specialized markets, and otherlocations that sell deposit beverages. Retailer costs include allocating floor space to recyclingactivities, investment in equipment and supplies, daily operation and labor. Labor expenses includesorting, cashier, accounting and management work related to handling deposit containers, refunds,handling fees, etc.
The average hourly retail wage rate assumed in the BEAR report, $9.50, was developed frompreviously administered industry surveys. Each job classification wage rate for employees involvedin handling redeemed containers was weighted according to the amount of time spent handling thecontainers. For example, the salary range for employees in the redemption area and sorting andstorage areas ranged from $7.50 to $11.50 per hour. The cashier and accounting pay range was $8.00to $12.00 and management was over $15.00 per hour. Since over 80% of the labor was assumed atthe redemption, sorting and storage areas, the average labor rate reflects these entry-level positions.Operational costs included items like pest control, additional cleaning, storage boxes, etc.Investments such as building modification and equipment were included. Space set aside forhandling containers, such as sorting, storage and redemption areas, was included in the model aswell.
• Redemption Centers. The labor costs to redemption centers are associated with sorting the beveragecontainers and collecting the deposit and handling fees. Redemption centers also incur investmentcosts for buildings and equipment and the cost of providing space for sorting and handlingoperations.

Economic and Environmental Benefits of a Deposit System for Beverage Containers in Washington State
Prepared by Sound Resource Management Group, Green Solutions and the City of Tacoma 40
• Distributors. The labor costs to distributors involve collecting the beverage containers andprocessing them for recycling markets. Distributors also incur investment costs for buildings andequipment, the cost of providing space for operations, and the costs of any handling fees and themanagement of those fees.
• Third-Party Recyclers. The cost of handling deposit containers through third-party recyclers wasestimated similarly to the other entities. Labor costs involve some sorting and processing of thebeverage containers. Third-party recyclers also incur investment costs for buildings and equipmentand the cost of providing space for sorting and handling operations.
1b. Reverse Vending Machines: the above cost analysis assumes that all collection and processing isdone by hand. A potentially less expensive alternative is the use of reverse vending machines (RVMs).In traditional deposit systems, labor accounts for about 76% of the retailer costs and 82% of theredemption center costs. The use of RVMs in some bottle redemption states has reduced labor costsassociated with redeeming containers.
RVMs are typically located in supermarkets or recycling centers. The machine identifies the containerand brand owner by the barcode marking. It sorts containers by material type, then compacts or shredsthe containers in order to destroy the barcode, increase storage capacity, and reduce transportation costs.RVMs can accept aluminum cans, glass and plastic bottles, and steel cans.
The cost of using an RVM is estimated by the BEAR report to be $0.0253 per container (versus manualsorting methods at $0.0407 per container).
2. Redemption Centers: this approach has been used in California for the past few years and is also thesystem recently implemented in Hawaii. Some of the differences between this system and traditionaldeposit systems, which affect costs and revenues, are:
• Unlike traditional deposit systems, distributors and retailers do not handle containers.• Unlike traditional deposit systems, redeemed containers are not sorted or shipped by brand.
The California system has an on-going comprehensive audit and documentation reporting systemcompiled annually by the California Department of Conservation, Division of Recycling (DOC). This ispossible because all funds flow directly into the DOC and are dispersed from the DOC to other entities.The California Redemption System cost analysis shown in the BEAR report is based on data for 1999 asprovided by the California DOC.
In the California system, containers are returned by consumers to one of three parties (figures shown arethe percentage of returned containers that each handled in 1999):
1) “old-line recyclers” (67%);2) convenience zone recyclers located close to retail stores (24%); or3) curbside programs (7%).
In addition, a very small percentage of containers are recycled at other locations such as office or venuerecycling programs.
The BEAR report shows gross system costs of 1.62¢ per container, while the net cost is of course lowerdue to the offsetting material revenues. Unredeemed deposits are used to help finance the system pluspay for grants and other recycling promotion programs.
The Convenience Zones receive both a processing fee and a handling fee for glass and PET containers,but not for aluminum containers. In aggregate, the Convenience Zone recyclers, which account for 24%of the recovery of beverage containers, have revenue exclusive of scrap value (processing fees +

Economic and Environmental Benefits of a Deposit System for Beverage Containers in Washington State
Prepared by Sound Resource Management Group, Green Solutions and the City of Tacoma 41
administrative fees + handling fees) amounting to $279 per ton of materials recovered. By contrast, old-line recyclers, which handle 67% of returned containers, receive revenue from the same sourcesamounting to $93 per ton of materials recovered. The contrast there shows how much the old-linerecyclers benefit the redemption program, again partly because of the way the California system works,and partly because pre-existing infrastructure benefits the system from a cost standpoint.
3. Third-Party Organizations: TPO operating costs are difficult to determine because they arerelatively new organizations and since they are mostly voluntarily funded by private business, costinformation is usually not available. Some observations, however, can be made from published data.
In its 2003 annual report, the Carpet Industry TPO, CARE lists 15 sponsoring members. Based on thepublished membership schedule for CARE, these 15 organizations contribute approximately $300,000per year. For 2003, they reported 43,300 tons of carpet recycled for a per ton cost of $6.92 for the TPO.
TPOs have been established in many Canadian provinces to handle not only containers but packaging andmany other products. In 2002, the Ontario Waste Diversion Act (WDA) established Waste DiversionOntario (WDO), a permanent, non-governmental corporation whose mandate is to oversee thedevelopment of waste diversion programs for specific wastes as requested by the Minister of theEnvironment. The Act specifies the composition of the WDO and its responsibilities.
The WDA authorizes and charges the WDO with establishing Industry Funding Organizations (IFO) foreach designated material. The IFOs are a second tier of producer responsibility organizations. TheWDA outlines the roles and responsibilities of the WDO and the industry funding organizations.
The materials are not designated in statute. The Minister is able to designate materials through“minister’s regulations,” which do not have to be approved by the provincial legislature. There is aconsultation process between the affected parties and local governments and then the Minister files theregulation and it becomes law. The actual process consists of the following steps:
• The Minister of the Environment designates a waste material, and requires WDO to develop adiversion program for the material.
• WDO creates an IFO, or works with an existing one. WDO establishes an agreement with the IFO,and together they develop a program, which will include an industry fee structure to pay for theprogram, performance targets and implementation details.
• The WDO submits the agreement and program to the Minister for approval.• The Minister approves the agreement and program.• The IFO begins implementing the program, and may make rules, as authorized in statute, to designate
stewards (stewards are usually brand owners and first importers) of the specified waste material, andset the amount of the fee to be paid by the stewards.
• The IFO submits an annual report to the WDO, which submits an annual report to the Ministry ofEnvironment.
Ontario not only requires that the IFO’s cover the cost of collecting their materials through a takebacknetwork, they require that the fees cover 50% of the cost of the municipal recycling programs. Thecurrent fee structure for the blue box (curbside recycling) program is shown in Table 5-2. Note thenegative value for aluminum packaging for food and beverage cans. The municipality actually pays themanufacturer to use aluminum cans which is indicative of their high market value and recyclability.
Glass weighs 0.5 pounds per bottle and 33 plastic bottles or aluminum cans equal a pound. Hence, thecost to the producer for 33 plastic bottles is $0.19 per bottle and for a glass bottle producer $0.85 to $1.00per bottle depending on color. The Ontario system shows how a Product Stewardship system transfersthe cost of collecting packaging materials from the ratepayers of a recycling system to the manufacturerand ultimately the consumer of the product being manufactured.

Economic and Environmental Benefits of a Deposit System for Beverage Containers in Washington State
Prepared by Sound Resource Management Group, Green Solutions and the City of Tacoma 42
Table 5-2Table of Fees for Ontario Blue Box Recycling Program (2005)
Category Material Annualized Fee
Aluminum packaging Food and beverage cans - 0.37 ¢/lbFoil and other aluminum packaging 1.88 ¢/lb
Glass packaging Clear 1.28 ¢/lbColored 1.51 ¢/lb
Other Packaging Paper based packaging 2.69 ¢/lbPlastic packaging 4.74 ¢/lbSteel packaging 1.62 ¢/lb
Printed Paper Newspaper CNA/ OCNA Members 0.09 ¢/lbNewspaper Non CNA/OCNA 0.27 ¢/lbMagazine and Catalogs 0.29 ¢/lbTelephone Directories 0.44 ¢/lbOther Printed Paper 3.08 ¢/lb
Figures in the above table have been converted from Canadian currency to U.S. Dollars based on anexchange rate of $0.75 U.S. to $1.00 Canadian.
Finally, a report from Clarissa Morawski of CM Consulting (CMC 2003) identifies system costs for mostof the Provincial container deposit programs. For provinces in the report with TPOs and with availablecost data (British Columbia, Alberta, and Saskatchewan), the costs of the system ranged from 2.5¢ to3.4¢ per unit without the unredeemed container revenue as an offset, and from 0.83¢ to 1.8¢ per unit withthe unredeemed deposits as system cost offsets. For 2.5¢ to 3.4¢ per unit in Canadian dollars, at acurrent exchange rate of 75¢ Canadian to $1.00 USD, this is the equivalent of 1.9 to 2.6¢ per container oran average of 2.21¢ per container in U.S. dollars.
B. Loss of Market Revenues for Residential and Commercial Recycling ProgramsIf that portion of the beverage containers that are currently being recycled were instead handled through adeposit system, existing recycling programs will lose the revenues that they are currently receiving forthose containers. The existing recycling programs might also retain that portion (and more) of theirrevenues if they were part of the system for returning deposits to consumers (such as is done inCalifornia), but that benefit is discussed in Section IV.B.1 (market revenues would benefit someone inthe system, if not the existing recyclers, assuming the containers were recycled).
Even if existing recyclers were not part of the container redemption system, they could potentiallybenefit from deposit containers that are still recycled through the traditional recycling programs (i.e.,deposit containers that are set out for curbside recycling, etc.), but only if:
• existing recycling systems can be modified to recover intact deposit containers (see discussion inSection II.B).
• existing recyclers are allowed to redeem the recovered containers. In Oregon, for instance, fewrecyclers can redeem containers for the deposit due to the structure of their deposit system.

Economic and Environmental Benefits of a Deposit System for Beverage Containers in Washington State
Prepared by Sound Resource Management Group, Green Solutions and the City of Tacoma 43
Preliminary data from a study being conducted in Oregon (Spendelow 2005) indicates that about 5% ofthe deposit containers are being received by curbside and drop-off recycling programs. If the depositwere 10¢ instead of 5¢ (as it is in Oregon), then this figure may be higher or lower. It could be lowerthan 5% due to people having a greater incentive to bring the containers back to a location where thedeposit is reimbursed, or the figure could be higher due to an overall higher recycling rate. For thepurposes of this analysis, it is assumed that existing recyclers would receive 5% of the deposit containersin either case.
Due to the wide range of market prices received by recyclers across the state, plus concerns abouttransportation costs and other factors, it is nearly impossible to accurately project what the loss of marketrevenues means on a statewide basis. The best that can be done within the scope of this report is tocalculate the impact for the City of Tacoma’s system and then project that to the entire state. Needless tosay, this approach has a number of drawbacks and so the statewide figure should only be taken as anindication of the order of magnitude of the impact on a statewide basis.
Table 5-3 shows the impact to the City of Tacoma in terms of loss of market revenues for beveragecontainers that are instead handled through a deposit system, minus the increase in revenues from therecovery of deposit containers that are still in their recycling program. This table uses the following data:
• Lost market revenues are based on the city’s recycled tonnages, taking into account only that portionthat is contributed by beverage containers (see Table 1-4). In this case, 100% of the amount ofbeverage containers in each material category is assumed to be lost (although we add back in 5% inthe next step), because the assumption is that the portion of containers that is not recycled orredeemed (20% loss with a nickel deposit and 10% with a dime) is instead landfilled or otherwisegone. These tonnages are multiplied by the current value per ton (as of March 2005) received byTacoma for each material, minus the current processing fee (see Section I.A.1 for a more detaileddescription of Tacoma’s existing recycling system). The amount of aluminum was also adjusted byremoving the estimated 200 tons handled by local buy-back centers (since those tons aren’t assesseda processing fee, etc.) that had been added in for Table 1-4.
• The statewide figure for the net revenue loss is calculated by working backwards from Tacoma’s netfigure per ton.
• For the figures for recovery of deposit containers, colored HDPE is not shown for the statewidefigures because a breakdown is not available for the amount of natural versus pigmented HDPE thatis recycled statewide. In other words, for the statewide figures, all HDPE bottles (natural andpigmented) are shown under natural HDPE.
C. Other Potential Costs1. Loss of Litter Funds: a potential concern for enacting a bottle bill in Washington State is the loss oflitter funds. Originally, the litter tax was proposed and adopted in Washington as an alternative to abottle bill being considered at about the same time that Oregon’s law was adopted. Should a bottle billbe enacted in this state, some may argue for relief from the litter tax, at least for beverage containers.Only a portion of the litter tax is paid for beverage containers (see list in Chapter 1), however, and itwould unreasonable at this point to argue for a complete cancellation of the litter fund on this basis.Furthermore, the litter funds are already at risk and a portion of the funds may not be available in thefuture because Governor Gregoire is proposing to shift $2 million out of this fund and put it into thegeneral revenues for other programs.

Economic and Environmental Benefits of a Deposit System for Beverage Containers in Washington State
Prepared by Sound Resource Management Group, Green Solutions and the City of Tacoma 44
Table 5-3Lost Market Revenues for Existing Recycling Programs
City of Tacoma Statewide
Commingled Materials:Aluminum CansPET BottlesHDPE, NaturalHDPE, Pigmented
Total Commingled TonsLost Market Revenue
Tons214377
13 11615
Value per ton$860$220$200$40
MarketValue
$184,352$82,955$2,530 $450
$270,287Lost Market RevenueProcessing Fee ($23.65/ton)Net Loss for Commingled Mtl.
$270,287 - $14,545$255,742
Glass Bottles:TonsValue (Cost) per tonTotal Value (Cost)Handling Fee ($2/ton)
Net Revenue (Cost) from Glass
1,524($20)
($30,480) + ($3,048)
($33,528)Net Revenue LossTotal TonsNet Loss per Ton
$222,2142,140
$103.84Net Loss per TonTotal TonsNet Revenue Loss
Assumed to be same as Tacoma77,550
$8,052,800Deposits Redeemed throughRecovered Containers:
Aluminum CansPET BottlesHDPE, NaturalHDPE, PigmentedGlass Bottles
Millions ofContainers
0.720.480.020.010.301.54
Valueat 5¢
$36,174$24,038
$806$717
$15,245$76,981
Valueat 10¢$72,348$48,076$1,613$1,424
$30,491$153,961
Millions ofContainers
41.216.750.38NA
11.9560.29
Valueat 5¢
$2,060,320$337,710
$19,220NA
$597,420$3,014,660
Valueat 10¢
$4,120,632$675,419
$38,435NA
$1,194,840$6,029,330
Net Loss (lost revenues minusredeemed deposits) $68,250 – $145,230 $2,023,470 – $5,038,140

Economic and Environmental Benefits of a Deposit System for Beverage Containers in Washington State
Prepared by Sound Resource Management Group, Green Solutions and the City of Tacoma 45
VI. Conclusions
A. Summary of Environmental and Economic Costs and BenefitsTable 6-1 shows a summary of the direct and indirect costs and benefits for Washington State and theCity of Tacoma. These figures are explained in the previous chapters of this report but the primaryassumptions made to allocate these costs are also shown below:
• the costs associated with public health and environmental impacts are explained in Chapter 3, andmost of these figures were first calculated for Washington State and then prorated to Tacoma basedon the city’s share of the total population (3.2%).
• the reverse approach was used for many of the economic benefit figures, where costs and revenuesfor the City of Tacoma were first calculated and then scaled up to the rest of Washington State. Thisapproach was necessitated by the lack of comprehensive statewide data for garbage and recyclingcosts. To scale up from Tacoma to the rest of the state, figures were prorated based on the number oftons disposed (a factor of 23.2) or recycled (a factor of 58).
• figures for “reduced disposal impacts” were calculated as a range and so the average value is shownin Table 6-1 for simplicity.
• no figure is shown for Tacoma for unredeemed deposits because the city would not collect these.• material sales is based on the additional amount of recycling (see Table 1-4) and an average value for
beverage containers of $250 per ton (see Figure 4-1).• there should be a net increase in jobs for Washington State and Tacoma, but a figure for the value of
these jobs is beyond the scope of this report.• for the cost of the deposit system, we show the range of costs for the three different approaches in
Table 6-1. Note that the costs for two of the three deposit systems are in the neighborhood of $60million, which results in a net gain for a deposit system. Only the retail store based system has coststhat result in a negative bottom line.
• loss of market revenues (see Table 5-3) was calculated based on both a 5¢ or 10¢ deposit amount, butonly the value for 10¢ is shown in Table 6-1.
B. Next StepsAn important next step in considering a container deposit system for Washington State is to provide abetter definition of the ideal system, since there are several different approaches that could be used. Thiswould perhaps be best accomplished through a facilitated, consensus-based process, involving the keystakeholders in such a system, to define how a deposit system could work best in Washington. Once aproposed system had been developed, the details could be distributed to a larger group for review andcomment. The list of possible stakeholders includes:
• private and public recyclers.• cities, towns and counties.• non-governmental organizations (NGO’s) and others who would be likely proponents.• NGO’s and others who would be likely opponents.• Washington State Soft Drink Association and various retail groups.• Washington State Recycling Association (WSRA) and Washington Refuse and Recycling
Association (WRRA).• many others, including the Washington Citizens for Resource Conservation (WCRC), the State Solid
Waste Advisory Committee (SWAC), Eastern Washington and Western Washington RecyclingCoordinators, Washington State Association of Counties (WSAC), Association of Washington Cities(AWC), and other environmental and business organizations.

Economic and Environmental Benefits of a Deposit System for Beverage Containers in Washington State
Prepared by Sound Resource Management Group, Green Solutions and the City of Tacoma 46
Table 6-1Summary of Costs and Benefits
Cost or Benefit State of Washington City of Tacoma
Benefits from Reduced Public Health and Environmental Impacts of Beverage Container DisposalReduced Greenhouse Gases $11,300,000 $400,000Avoided Acidification $1,200,000 $39,000Avoided Eutrophication less than $500 less than $500Reduced DALY $3,600,000 $100,000Reduced Human Toxicity $600,000 $22,000Reduced Ecological Toxicity $2,500,000 $100,000Reduced Disposal Impacts $300,000 (ave.) $9,600Public Health Benefits from
Reduced Litter $1,400,000 $45,000Subtotal, Environmental
Benefits $20,900,000 $707,000
Economic Benefits of Increased Beverage Container RecoveryUnredeemed Deposits $36,400,000 NAIncreased Material Sales $28,126,000 $1,063,000Decreased Garbage Coll. Costs $1,813,100 $78,150Decreased Disposal Costs $3,491,400 $150,500Decreased Recycling
Collection Costs $4,023,000 $69,400Decreased Litter Costs $1,071,000 $34,300Increased Jobs Net benefit Net benefit Subtotal, Economic Benefits $72,361,000 $1,400,400
Total Environmental andEconomic Benefits $92,969,000 $2,102,400
Cost of Deposit SystemAdministrative Costs** $59,020,000 to $148,270,000 $1,733,000 to $4,355,000Loss of Market Revenues for
Recycling Programs $2,023,500 $68,300Total Costs $61,043,500 to $150,293,500 $1,801,300 to $4,423,300
Total***Total impact ranges from anet gain of $31,925,500 to a
net cost of $57,324,500
Total impact ranges from anet gain of $301,100 to a
net cost of $2,320,900
* DALY = Disability Adjusted Life Years.** Redemption centers and third-party organizations are both at the low end of the range. Retail
takeback is the high number of the range.*** Both redemption centers and TPOs show a net gain for the State, and the redemption center approach
shows a net gain of $301,000 for the City. Only the retail takeback option shows a net cost in allcases.

Economic and Environmental Benefits of a Deposit System for Beverage Containers in Washington State
Prepared by Sound Resource Management Group, Green Solutions and the City of Tacoma G-1
Glossary
The following definitions are for terms used in this report.
BEAR stands for Businesses and Environmentalists Allied for Recycling.Beverage Containers are the primary container types used to package beverages for shipment frommanufacturers or wholesalers to consumers. This report addresses aluminum, glass, PET and HDPEbeverage containers. Transport and secondary packaging are not considered beverage containers.Buy-Back Center refers to mainly privately operated centers that accept beverage containers (primarilyaluminum cans) for recycling and pay consumers a portion of the material’s market value.California Redemption System is the unique deposit system adopted by California in 1987.Convenience Zone Recycler is the term for a type of redemption center in the California redemptionsystem.Curbside Programs operated by municipal governments and private haulers collect recyclable materialsprimarily from residences.Deposit System is the generic term for any recycling program that includes a deposit on beveragecontainers paid by the consumer, some or all of which can be recouped through participation in aqualified recycling program. Types of deposit programs include traditional U.S. deposit systems, theCalifornia Redemption System, several distinctive variations adopted by Canadian provinces andNorthern European states and the deposit programs traditionally operated voluntarily by industry.Discarded means used beverage containers (of all material types) that a consumer has returned forrecycling or reuse through a recovery program, placed in a container for ultimate disposal at a landfill orincinerator facility, thrown away as litter or otherwise disposed (legally or illegally).Disposed means discarded beverage containers that have been placed in a container for transport to alandfill or incinerator, or otherwise thrown away (legally or illegally).Downstream refers to those impacts that occur after a product or packaging is disposed.Drop-Off Programs means a facility or (unstaffed) containers where people can leave material to berecycled.Escheat is a provision of two traditional deposit systems (in Michigan and Massachusetts) that allows thestate to obtain unredeemed deposits. (California also retains unredeemed deposits but no escheat isnecessary since the bottlers pay the state directly.)Fraudulent Redemption refers to beverage containers from out-of-state that are illegally redeemed in astate’s deposit program.Handling Fee refers to per container payments paid by bottlers to retailers to offset their costs to redeembeverage containers in a traditional deposit system.HDPE means High-Density Polyethylene, which is a type of plastic often used to produce water and milkjugs, among other products.Intermediate Processing refers to cleaning, sorting and size reduction performed prior to shippingrecovered beverage containers to a beneficiator, reclaimer or manufacturer for recycling.MRF means Material Recovery Facility.Old-Line Recycler refers to recycling centers in California that were in operation before the advent of the1987 California Redemption Center. Old-line recyclers usually operate as buy-back centers and arecertified by the state to redeem deposits to consumers.PET means Polyethylene Terephthalate, which is a type of plastic used to make soda pop bottles and agrowing list of other beverages and food products.

Economic and Environmental Benefits of a Deposit System for Beverage Containers in Washington State
Prepared by Sound Resource Management Group, Green Solutions and the City of Tacoma G-2
Recovery means the collection of discarded beverage containers for the purpose of recycling or reuse.Recycling means using recovered beverage containers as a raw material to manufacture a new product orpackage.Redemption Center is a location where consumers may redeem deposits on covered beverage containers.Reverse Vending Machine (RVM) are automated devices that return the deposit refund to the consumerand that may have the capability to sort containers into refillable and nonrefillable containers and directthem to appropriate bottlers or processors.Source-Sorted refers to materials that have sorted by the generator into the different materials, or at leastinto basic categories, for recycling purposes.TPO means Third-Party Organization.Third-Party Recycler refers to recycling processing companies that contract with bottlers to undertaketheir assigned recycling operations.Traditional Deposit System refers to the type of deposit program adopted in nine U.S. states. Intraditional deposit programs, beverage containers are typically returned to a retailer or redemption center,sorted by brand, shipped to the bottler or a contracted third-party recycler and processed for sale to anend-use market.Unredeemed Deposits are the funds resulting from the fact that not all beverage containers for whichdeposits are paid are redeemed. Unredeemed deposits may be used to offset bottler costs or may flow tostates through an escheat provision.Upstream refers to those impacts that occur due to the production process for a product or packaging.

Economic and Environmental Benefits of a Deposit System for Beverage Containers in Washington State
Prepared by Sound Resource Management Group, Green Solutions and the City of Tacoma R-1
References
AOR 2004. Association of Oregon Recyclers newsletter. Tour of the Month – NORPAC, Longview, WA,August 2004.
APC 1995. American Plastics Council. How to Collect Plastics for Recycling, 1995.
Cascadia 2002. Cascadia Consulting Group. Residential Recycling Composition Study, prepared forSeattle Public Utilities, October 2002.
CF 1987. The Conservation Foundation, State of the Environment: A View toward the Nineties, 1987.
CMC 2003. CM Consulting. Who Pays What-An Analysis of Beverage Container Recovery and Costs inCanada, 2003.
Costanza 1997. Robert Costanza, et al. “The value of the world’s ecosystem services and naturalcapital,” Nature, Vol. 387, 15 May 1997.
CRI 2004. Container Recycling Institute. The 10¢ Incentive to Recycle, 2004.
CRI 2005. Container Recycling Institute. Washington State Beverage Container Market Data Analysis,prepared for the City of Tacoma, April 2005.
deGroot 2002. Rudolf S. de Groot, et al, “A typology for the classification, description and valuation ofecosystem functions, goods and services,” Ecological Economics, Vol. 41, 2002, pp. 393-408.
Ecology 2002. Washington State Department of Ecology. Beyond Waste, Washington State Solid WastePlan Issue Paper 10: Solid Waste Costs and Barriers to Recycling, Publ. No. 02/07-030, December 2002.
Ecology 2004. Washington State Department of Ecology. Thirteenth Annual Status Report, December2004.
EPA 2002. Environmental Protection Agency. Economic Analysis of the Final Revisions to the NationalPollutant Discharge Elimination System Regulation and the Effluent Guidelines for Concentrated AnimalFeeding Operations, EPA-812-R-03-002, December 2002.
GS 1997. Green Solutions. The Business Recycling Cost Model, 1997.
GS 2003a. Green Solutions. Waste Composition Analysis for the State of Washington, prepared forWashington Department of Ecology, June 2003.
GS 2003b. Green Solutions. Solid Waste Composition Study, prepared for Clallam County, Washington,June 2003.
Koplow 1994. Douglas Koplow. Federal Energy Subsidies and Recycling: A Case Study, ResourceRecycling, November 1994.

Economic and Environmental Benefits of a Deposit System for Beverage Containers in Washington State
Prepared by Sound Resource Management Group, Green Solutions and the City of Tacoma R-2
Lippiatt (2002). Lippiatt B. BEES 3.0 Building for Environmental and Economic Sustainability,Technical Manual and User Guide, Office of Applied Economics, Building and Fire ResearchLaboratory, National Institute of Standards and Technology, Technology Administration, US Departmentof Commerce, October 2002.
Miller, various. Chaz Miller, National Solid Wastes Management Association. Profiles in Garbage,articles highlighting specific materials, Waste Age magazine, various dates of publication.
NRC 1992. National Research Council, Environmental Neurotoxicology, National Academy Press, 1992.
OFM 2004. Washington State Office of Financial Management. 1997 Washington Input-Output Model,revised July 2004.
RTI 1999. Research Triangle Institute. A Decision Support Tool for Assessing the Cost andEnvironmental Performance of Integrated Municipal Solid Waste Management Strategies: UsersManual, Draft, prepared for the US Environmental Protection Agency, 1999, and Application of Life-Cycle Management to Evaluate Integrated Municipal Solid Waste Management Strategies, Draft, USEnvironmental Protection Agency, 1999.
RW Beck 1996. R.W. Beck. Arizona Recycling Market Development Study: Economic Impact ofRecycling in Arizona, prepared for Arizona Department of Commerce, December 1996.
RW Beck 2002. R.W. Beck, Franklin Associates, Sound Resource Management Group, and TellusInstitute. Understanding Beverage Container Recycling, prepared for Businesses and EnvironmentalistsAllied for Recycling, January 16, 2002.
Spendelow 2005. Personal communication with Peter Spendelow about preliminary results of Oregonstudy.
SRMG 1998. Sound Resource Management Group. Economic & Environmental Benefits of UpdatingMassachusetts’ Bottle Bill, prepared for Massachusetts Public Interest Research Group, March 1998.
SRMG 2005. Sound Resource Management Group. Comparative LCAs for Curbside Recycling versuseither Landfilling or Incineration with Energy Recovery,” article printed in International Journal of LifeCycle Analysis (Online First 2004; forthcoming in print summer 2005).
Tellus 1992. Tellus Institute. CSG/Tellus Packaging Study, prepared for The Council of StateGovernments, US Environmental Protection Agency, and New Jersey Department of EnvironmentalProtection and Energy, May 1992.
Tellus 1997. Tellus Institute. An Analysis of the Costs and Benefits of Expanding the Scope of the BottleBill in Massachusetts, prepared for Massachusetts Department of Environmental Protection, June 1997.