
Impact of Air Services Liberalisation on Growth of Tourism in Asia
Ministry of Transport
Report 13 August 2013
Economic Effects of Air Services Liberalisation in New Zealand
Prepared for

Disclaimer
Although every effort has been made to ensure the accuracy of the material and the integrity
of the analysis presented herein, Covec Ltd accepts no liability for any actions taken on the
basis of its contents.
Authorship
Aaron Schiff and John Small
[email protected] | (09) 916 2012
© Covec Ltd, 2013. All rights reserved.

Contents
Executive Summary i
Effects of Liberalisation ii
Analysis of Foreign Airline Capacity iii
1 Introduction 1
2 Measuring Liberalisation 4
2.1 Background 4
2.2 Air Liberalisation Indexes 4
2.3 Case Studies 7
3 Estimating the Effects of Liberalisation 12
3.1 Theory 12
3.2 Empirical Methodology 14
3.3 Data 16
3.4 Determining which ALIs are Relevant 17
3.5 Regression Results 18
3.6 Interpretation of Results 21
3.7 Limitations of the Analysis 23
4 Analysis of Foreign Airline Capacity 24
4.1 General Trends 24
4.2 Volatility Analysis 26
4.3 Tenure Analysis 32
4.4 Discussion 34
5 Concluding Remarks 36
References 37
Appendix 1: Calculation of ALIs 38
Appendix 2: Regression Results 39
International visitor arrivals models 39
NZ Resident Departure Models 42
Trade Models 44
New Zealand Real GDP Models 46
New Zealand Outbound Travel Price Index Models 47

i
Executive Summary
New Zealand has progressively deregulated markets for commercial air services since
the mid-1980s, and now has one of the most liberal international air transport policies in
the world. The New Zealand government has renegotiated existing air services
agreements (ASAs) with other countries and negotiated new ASAs, in order to reduce
regulatory barriers to competition on international air routes to and from New Zealand,
and in some cases on domestic routes within New Zealand.
Many of New Zealand’s ASAs are now “open skies” agreements, with no restrictions on
routes and capacity, and a liberal attitude towards foreign airline ownership. New
Zealand played a key role in the introduction of the Multilateral Agreement on the
Liberalisation of International Air Transportation (MALIAT). The MALIAT provides for
open skies between member states, and unlike standard bilateral ASAs it is open to
accession by other states, thus allowing open skies to propagate between members
without the need for bilateral negotiations.
Overall, liberalisation of New Zealand’s ASAs has been successful at attracting foreign
airlines to operate on international routes to and from New Zealand, although
competition on domestic routes remains limited. In 2013, 17 foreign airlines operated
services on New Zealand international routes, providing around 60% of total
international capacity, up from 50% in 2000 (Figure 1). The period of liberalisation has
coincided with strong growth in international travel volumes to and from New Zealand,
and falling real international airfares, in spite of increasing real fuel costs.
Figure 1 Total inbound capacity on flights arriving in New Zealand (seats per month).
Source: Covec calculations from Sabre-ADI data. Air New Zealand capacity includes Freedom Air.
0
100,000
200,000
300,000
400,000
500,000
600,000
20
00-1
20
00-7
20
01-1
20
01-7
20
02-1
20
02-7
20
03-1
20
03-7
20
04-1
20
04-7
20
05-1
20
05-7
20
06-1
20
06-7
20
07-1
20
07-7
20
08-1
20
08-7
20
09-1
20
09-7
20
10-1
20
10-7
20
11-1
20
11-7
20
12-1
20
12-7
20
13-1
20
13-7
Air NZ Foreign TotalAir NZ - Moving Average Foreign - Moving Average Total - Moving Average

ii
Effects of Liberalisation
We examined the effects of New Zealand’s air services liberalisation since the mid-1990s
on international visitor arrivals, outbound travel by New Zealand residents, exports and
imports by air, real GDP and real international outbound airfares. We tested for
relationships between these variables of interest and the liberalisation of New Zealand’s
ASAs with four countries: Australia, the United States, China and Singapore.
We calculated “air liberalisation indexes” (ALIs) using a methodology developed by the
World Trade Organisation, for each of the four case studies (Figure 2). We used time-
series econometric models to estimate relationships between the ALIs and the variables
of interest while controlling for other factors and trends that occurred at the same time.
Figure 2 Calculated ALIs for New Zealand’s ASAs with the case study countries. Higher values reflect
more liberal terms in the ASA; the maximum possible value is 50.
Source: Calculated from Ministry of Transport data.
The ALIs reflect policy settings that affect market outcomes indirectly via the
commercial decisions of airlines to take advantage of the opportunities created. It is
therefore difficult to empirically isolate the effects of liberalisation, particularly on
aggregate measures of economic activity. With this caveat in mind, the econometric
analysis leads us to the following conclusions for the four case studies:
International visitor arrivals: Liberalisation does not appear to be associated
with a significant increase in international visitors travelling point-to-point, ie
visitors from the case study countries. Rather, the effects appear to be on indirect
travel via the case study countries to New Zealand. This highlights the
importance of connectivity provided by ASAs, given New Zealand’s geographic
isolation from many inbound visitor markets.
0
5
10
15
20
25
30
35
40
45
50
19
88
19
89
19
90
19
91
19
92
19
93
19
94
19
95
19
96
19
97
19
98
19
99
20
00
20
01
20
02
20
03
20
04
20
05
20
06
20
07
20
08
20
09
20
10
20
11
20
12
20
13
Air
lib
era
lisat
ion
in
de
x
Australia USA China Singapore

iii
Short-term departures by New Zealand residents: There is relatively strong
evidence of a relationship between the total number of short-term departures by
New Zealand residents and all of the ALIs except for the United States. This
suggests positive welfare benefits to New Zealanders from increased
competition in international air services and greater access to international
destinations. We analysed the total number of departures only; substitution by
outbound travellers between destinations may reflect additional welfare benefits
of liberalisation.
Real outbound travel prices: Real airfares have been falling in spite of
increasing fuel costs, likely due to increased competition and technological
improvements. There is evidence of a relationship between real outbound travel
prices and the ALI for China, suggesting that opening access to new markets
where there is substantial travel demand may reduce travel prices and generate
welfare benefits for travellers.
Imports and exports by air: There is no clear evidence of a relationship between
liberalisation and the real value of New Zealand’s international trade by air,
except for weak evidence of a link to the ALI for Australia. This likely reflects
the small amount of New Zealand trade by air, while Australia is New
Zealand’s largest trading partner and a relatively low cost destination for air
freight compared to elsewhere. Effects on trade appear to be secondary benefits
of liberalisation, relative to benefits from competition in passenger services.
Real GDP: There is no empirical evidence of a relationship between
liberalisation and total economic activity in New Zealand. This is likely due to
the fact that GDP is affected by a large number of factors, and it is difficult to
empirically isolate the effects of liberalisation from other trends.
Analysis of Foreign Airline Capacity
As noted above, foreign airlines now provide more than half of the international air
capacity to and from New Zealand. Between 2000 and 2013 foreign airlines increased
capacity by about 1.5 million seats per annum on flights arriving in New Zealand, while
Air New Zealand increased capacity by about 0.5 million seats per annum.
Foreign airlines have different incentives to operate routes to and from New Zealand
compared to domestic airlines, given the place of New Zealand in their route networks.
For most foreign airlines, New Zealand is at the end of a long ‘spoke’ in their network,
while New Zealand is a hub for domestic airlines.
Given these differences, we analysed the volatility of capacity on flights arriving in New
Zealand between 2000 and 2013, and the duration of time over which airlines
continuously operate routes to New Zealand (route tenure). The objective was to
determine whether foreign airlines behave differently to Air New Zealand in terms of
volatility and route tenure. The analysis was performed using capacity data published
by Sabre-ADI, which is based on flight schedules.

iv
Capacity Volatility
Volatility is measured by variance over time around an average or trend. Capacity on
air routes to New Zealand is affected by short-term seasonal factors as well as medium-
and long-term strategic behaviour by airlines.
Figure 3 shows variations of 12-month moving averages of capacity around a linear
trend. The moving averages remove seasonal effects, so this figure shows medium-term
volatility around the long-term trend. On this measure, total capacity provided by
foreign airlines on international routes to New Zealand is around twice as volatile as Air
New Zealand’s capacity. However, there are some individual foreign airlines that have
similar capacity volatility as Air New Zealand for this and other measures (Figure 4).
Figure 3 Analysis of deviations of 12-month moving average capacity from a linear trend.
Monthly normalised deviation Distribution of normalised deviations
Source: Calculated from Sabre-ADI data.
Figure 4 Normalised deviations of capacity for all airlines.
Source: Calculated from Sabre-ADI data.
-0.15
-0.10
-0.05
0.00
0.05
0.10
0.15
0.20
20
00
-12
200
1-8
200
2-4
20
02
-12
200
3-8
200
4-4
20
04
-12
200
5-8
200
6-4
20
06
-12
200
7-8
200
8-4
20
08
-12
200
9-8
201
0-4
20
10
-12
201
1-8
201
2-4
20
12
-12
201
3-8
No
rmal
ise
d D
evi
atio
n
Air NZ Foreign
05
101520253035404550556065
-0.15to -0.11
-0.11to -0.07
-0.07to -0.03
-0.03to
0.01
0.01to
0.05
0.05to
0.09
0.09to
0.13
0.13to
0.17
0.17to
0.21
0.21to
0.25
Co
un
t
Normalised Deviation
Air NZ Foreign
0.00 0.05 0.10 0.15 0.20 0.25 0.30 0.35 0.40 0.45 0.50 0.55 0.60 0.65
Normalised Deviation
Foreign airlines Total foreign capacity Air NZ
Monthly capacity relative to
constant mean
Monthly capacity relative to 12-month
moving average
Monthly capacity relative to
linear trend
12-month moving average relative to
linear trend

v
Route Tenure
We calculated route tenure as the duration of time that an airline operated a route,
taking account of the fact that some routes are seasonal. Figure 5 shows the distribution
of route tenure (calculated over the period from 2000 to 2013) for Air New Zealand and
all foreign airlines combined. Overall we estimate average route tenure of 97 months for
Air New Zealand (median 87 months) and 70 months for foreign airlines (median 44
months). In aggregate, foreign airlines were more likely than Air New Zealand to
operate New Zealand routes for a short period only.
Figure 5 Number of international routes to New Zealand operated for various durations between 2000
and 2013.
Source: Calculated from Sabre-ADI data.
Figure 6 compares average route tenure for Air New Zealand with individual foreign
airlines. Several foreign airlines have route tenures similar to Air New Zealand.
However, Air New Zealand operates a significantly greater number of international
routes than any foreign airline. Those airlines that have the highest route tenure operate
only one or two unique routes.
Summary
There are some differences in volatility and route tenure between Air New Zealand and
foreign airlines as a group, although some large individual foreign airlines have similar
characteristics to Air New Zealand. Therefore, if stability is a desirable characteristic, it
is difficult to suggest favouring domestic over foreign airlines in air transport policy.
Furthermore, it is not clear that stability is desirable. There is uncertainty about the
profitability of routes, and profitability changes over time. Markets work to discover
new economically viable routes partly through a process of experimentation. Thus a
0
5
10
15
20
25
< 1
yea
r
1 -
2 y
ear
s
2 -
3 y
ear
s
3 -
4 y
ear
s
4 -
5 y
ear
s
5 -
6 y
ear
s
6 -
7 y
ear
s
7 -
8 y
ear
s
8 -
9 y
ear
s
9 -
10
ye
ars
10
- 1
1 ye
ars
11
- 1
2 ye
ars
12
- 1
3 ye
ars
13
- 1
4 ye
ars
14
ye
ars
Air NZ Foreign

vi
pattern of entry on routes followed by quick exit may be a sign of an efficiently
functioning market responding to changes in costs, demand and technology, and
working to discover new viable routes, rather than a problem that needs to be solved.
Figure 6 Average route tenure and number of unique international routes operated by airlines serving
New Zealand between 2000 and 2013.
Source: Calculated from Sabre-ADI data.
0
5
10
15
20
25
30
35
40
45
50
55
60
0
20
40
60
80
100
120
140
160
180
CX
NF
SB SQ LA
QF/
JQ AR
TN NZ
MH TG BR BI
GA EK
DJ/
VA FJ KE
PH CZ CI
UA
OZ
D7
WR
HA
CA YE
Nu
mb
er
of
Un
iqu
e R
ou
tes
Op
era
ted
Ave
rage
Te
nu
re (
mo
nth
s)
Average Tenure (left)
Number of Unique Routes (right)

1
1 Introduction
Markets for commercial air services in New Zealand have been progressively
deregulated since the mid-1980s, facilitating greater competition on international and
domestic routes. Liberalisation of New Zealand’s air services agreements (ASAs) with
other countries has been a key part of deregulation. This report examines the effects of
New Zealand’s international air services liberalisation since the mid-1990s across a
number of dimensions. The objectives are to estimate the observed effects of
liberalisation, and to give guidance for future air services negotiating priorities.
Liberalisation has involved the New Zealand government renegotiating ASAs with
existing partner countries, and negotiating new agreements with other countries, in
order to reduce regulatory barriers to competition on international routes to and from
New Zealand, and in some cases competition on domestic routes within New Zealand.
This has included New Zealand granting additional “freedoms of the air” to foreign
airlines,1 and reduction or removal of restrictions on capacity, price setting, ownership,
and cooperative arrangements such as code-sharing. Under the bilateral agreements,
New Zealand airlines also face lower barriers to operating services to and from other
countries.
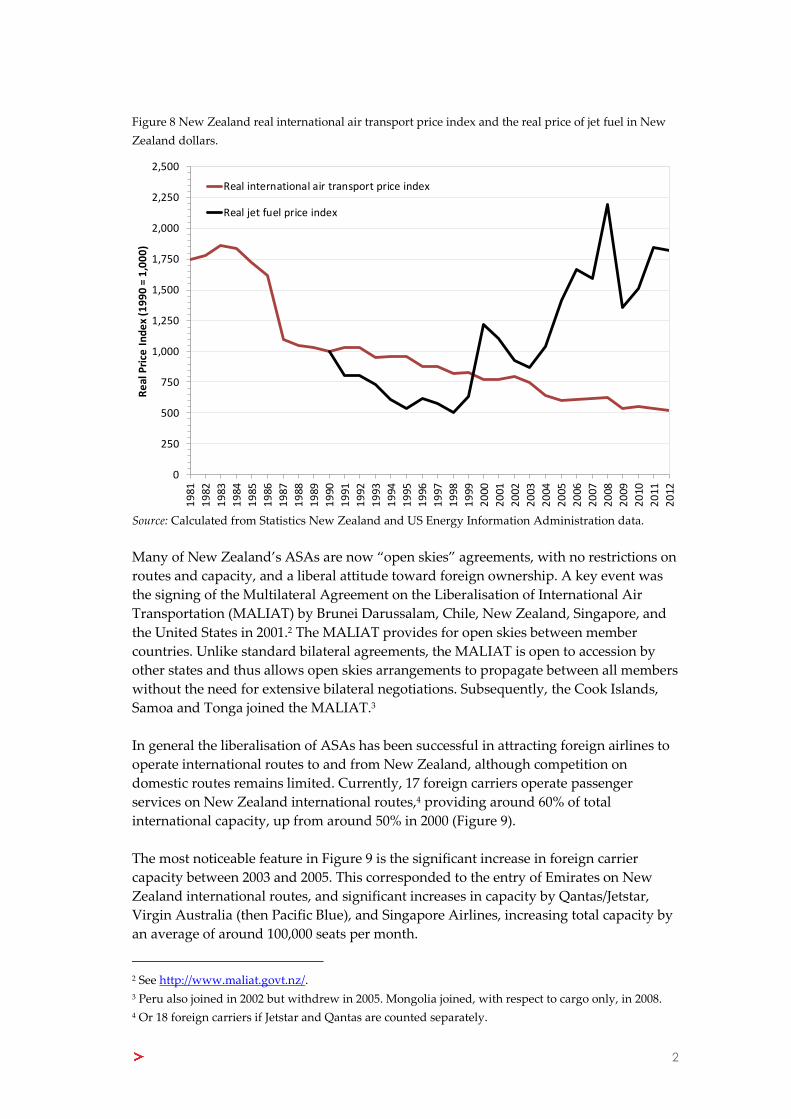
The period of liberalisation has coincided with strong growth in international travel to
and from New Zealand (Figure 7), and falling prices for international travel, in spite of
increasing fuel costs (Figure 8).
Figure 7 International travel to and from New Zealand.
Source: Statistics New Zealand.
1 See http://en.wikipedia.org/wiki/Freedoms_of_the_air for an overview of the standard air freedoms.
0.0
0.5
1.0
1.5
2.0
2.5
3.0
1979 1981 1983 1985 1987 1989 1991 1993 1995 1997 1999 2001 2003 2005 2007 2009 2011
Mill
ion
s
International Visitor Arrivals
NZ Resident Short-Term Departures
2
Figure 8 New Zealand real international air transport price index and the real price of jet fuel in New
Zealand dollars.
Source: Calculated from Statistics New Zealand and US Energy Information Administration data.
Many of New Zealand’s ASAs are now “open skies” agreements, with no restrictions on
routes and capacity, and a liberal attitude toward foreign ownership. A key event was
the signing of the Multilateral Agreement on the Liberalisation of International Air
Transportation (MALIAT) by Brunei Darussalam, Chile, New Zealand, Singapore, and
the United States in 2001.2 The MALIAT provides for open skies between member
countries. Unlike standard bilateral agreements, the MALIAT is open to accession by
other states and thus allows open skies arrangements to propagate between all members
without the need for extensive bilateral negotiations. Subsequently, the Cook Islands,
Samoa and Tonga joined the MALIAT.3
In general the liberalisation of ASAs has been successful in attracting foreign airlines to
operate international routes to and from New Zealand, although competition on
domestic routes remains limited. Currently, 17 foreign carriers operate passenger
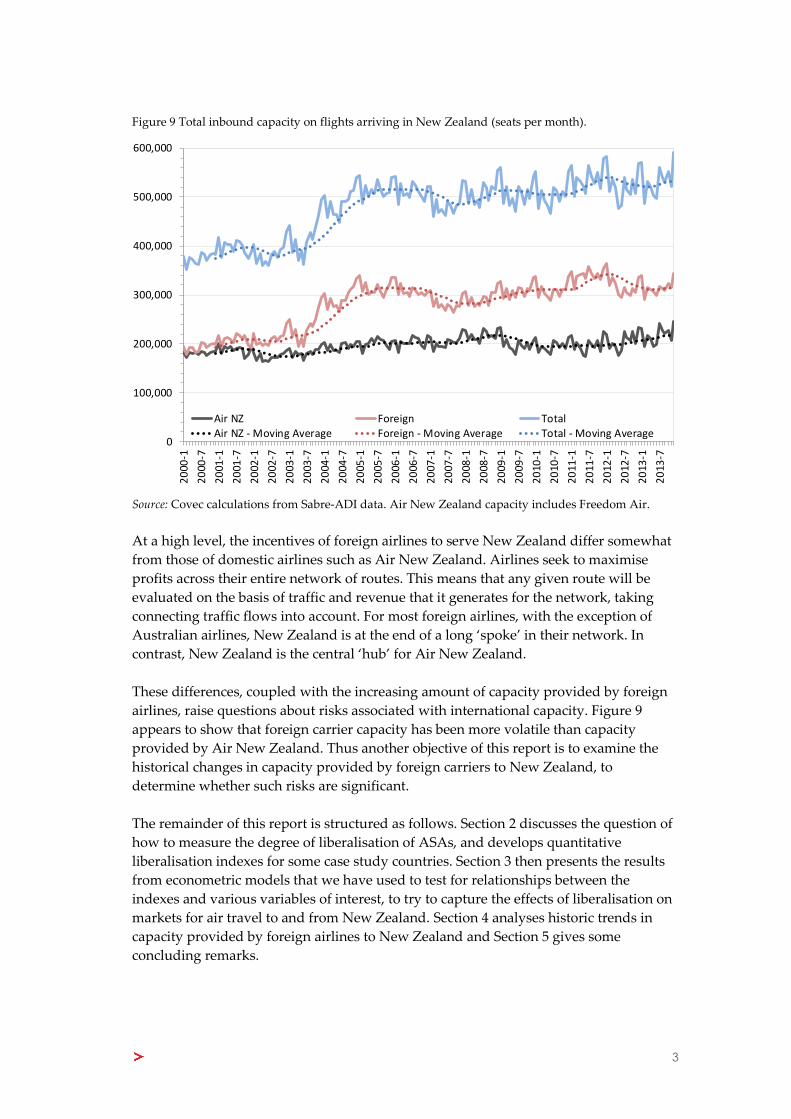
services on New Zealand international routes,4 providing around 60% of total
international capacity, up from around 50% in 2000 (Figure 9).
The most noticeable feature in Figure 9 is the significant increase in foreign carrier
capacity between 2003 and 2005. This corresponded to the entry of Emirates on New
Zealand international routes, and significant increases in capacity by Qantas/Jetstar,
Virgin Australia (then Pacific Blue), and Singapore Airlines, increasing total capacity by
an average of around 100,000 seats per month.
2 See http://www.maliat.govt.nz/.
3 Peru also joined in 2002 but withdrew in 2005. Mongolia joined, with respect to cargo only, in 2008. 4 Or 18 foreign carriers if Jetstar and Qantas are counted separately.
0
250
500
750
1,000
1,250
1,500
1,750
2,000
2,250
2,500
19
81
19
82
19
83
19
84
19
85
19
86
19
87
19
88
19
89
19
90
19
91
19
92
19
93
19
94
19
95
19
96
19
97
19
98
19
99
20
00
20
01
20
02
20
03
20
04
20
05
20
06
20
07
20
08
20
09
20
10
20
11
20
12
Re
al P
rice
In
de
x (1
99
0 =
1,0
00
)
Real international air transport price index
Real jet fuel price index
3
Figure 9 Total inbound capacity on flights arriving in New Zealand (seats per month).
Source: Covec calculations from Sabre-ADI data. Air New Zealand capacity includes Freedom Air.
At a high level, the incentives of foreign airlines to serve New Zealand differ somewhat
from those of domestic airlines such as Air New Zealand. Airlines seek to maximise
profits across their entire network of routes. This means that any given route will be
evaluated on the basis of traffic and revenue that it generates for the network, taking
connecting traffic flows into account. For most foreign airlines, with the exception of
Australian airlines, New Zealand is at the end of a long ‘spoke’ in their network. In
contrast, New Zealand is the central ‘hub’ for Air New Zealand.
These differences, coupled with the increasing amount of capacity provided by foreign
airlines, raise questions about risks associated with international capacity. Figure 9
appears to show that foreign carrier capacity has been more volatile than capacity
provided by Air New Zealand. Thus another objective of this report is to examine the
historical changes in capacity provided by foreign carriers to New Zealand, to
determine whether such risks are significant.
The remainder of this report is structured as follows. Section 2 discusses the question of
how to measure the degree of liberalisation of ASAs, and develops quantitative
liberalisation indexes for some case study countries. Section 3 then presents the results
from econometric models that we have used to test for relationships between the
indexes and various variables of interest, to try to capture the effects of liberalisation on
markets for air travel to and from New Zealand. Section 4 analyses historic trends in
capacity provided by foreign airlines to New Zealand and Section 5 gives some
concluding remarks.
0
100,000
200,000
300,000
400,000
500,000
600,000
20
00-1
20
00-7
20
01-1
20
01-7
20
02-1
20
02-7
20
03-1
20
03-7
20
04-1
20
04-7
20
05-1
20
05-7
20
06-1
20
06-7
20
07-1
20
07-7
20
08-1
20
08-7
20
09-1
20
09-7
20
10-1
20
10-7
20
11-1
20
11-7
20
12-1
20
12-7
20
13-1
20
13-7
Air NZ Foreign TotalAir NZ - Moving Average Foreign - Moving Average Total - Moving Average
4
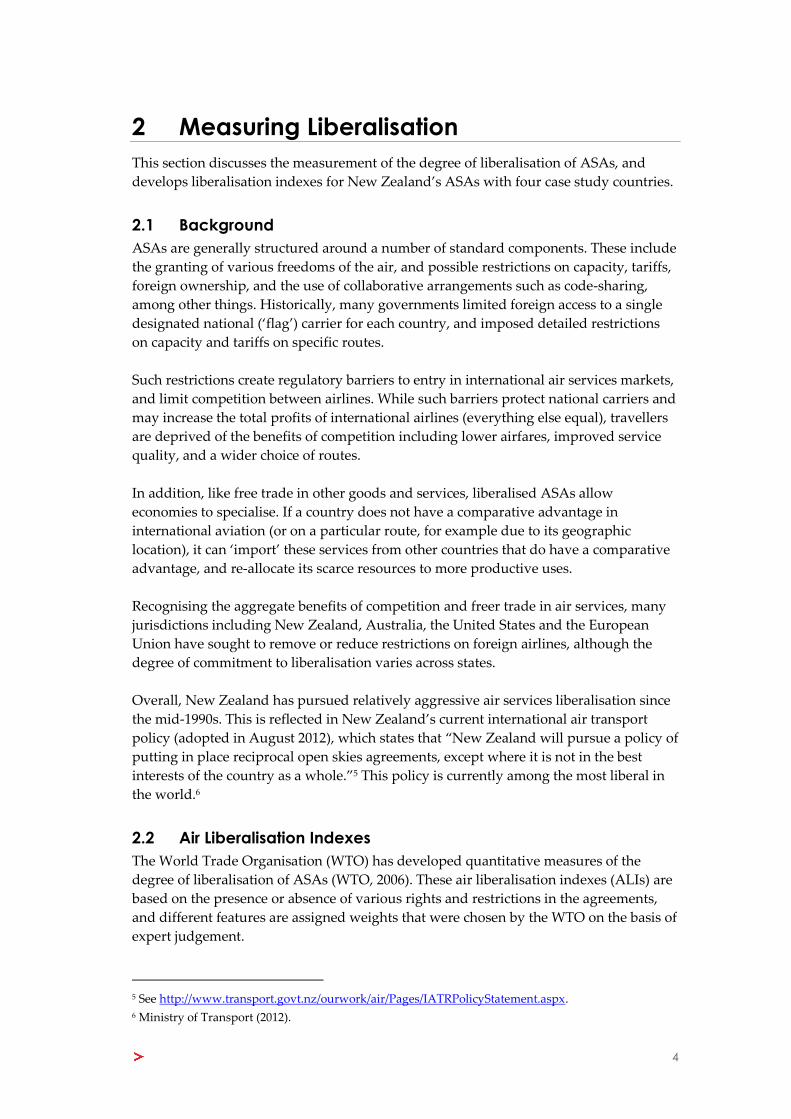
2 Measuring Liberalisation
This section discusses the measurement of the degree of liberalisation of ASAs, and
develops liberalisation indexes for New Zealand’s ASAs with four case study countries.
2.1 Background
ASAs are generally structured around a number of standard components. These include
the granting of various freedoms of the air, and possible restrictions on capacity, tariffs,
foreign ownership, and the use of collaborative arrangements such as code-sharing,
among other things. Historically, many governments limited foreign access to a single
designated national (‘flag’) carrier for each country, and imposed detailed restrictions
on capacity and tariffs on specific routes.
Such restrictions create regulatory barriers to entry in international air services markets,
and limit competition between airlines. While such barriers protect national carriers and
may increase the total profits of international airlines (everything else equal), travellers
are deprived of the benefits of competition including lower airfares, improved service
quality, and a wider choice of routes.
In addition, like free trade in other goods and services, liberalised ASAs allow
economies to specialise. If a country does not have a comparative advantage in
international aviation (or on a particular route, for example due to its geographic
location), it can ‘import’ these services from other countries that do have a comparative
advantage, and re-allocate its scarce resources to more productive uses.
Recognising the aggregate benefits of competition and freer trade in air services, many
jurisdictions including New Zealand, Australia, the United States and the European
Union have sought to remove or reduce restrictions on foreign airlines, although the
degree of commitment to liberalisation varies across states.
Overall, New Zealand has pursued relatively aggressive air services liberalisation since
the mid-1990s. This is reflected in New Zealand’s current international air transport
policy (adopted in August 2012), which states that “New Zealand will pursue a policy of
putting in place reciprocal open skies agreements, except where it is not in the best
interests of the country as a whole.”5 This policy is currently among the most liberal in
the world.6
2.2 Air Liberalisation Indexes
The World Trade Organisation (WTO) has developed quantitative measures of the
degree of liberalisation of ASAs (WTO, 2006). These air liberalisation indexes (ALIs) are
based on the presence or absence of various rights and restrictions in the agreements,
and different features are assigned weights that were chosen by the WTO on the basis of
expert judgement.
5 See http://www.transport.govt.nz/ourwork/air/Pages/IATRPolicyStatement.aspx. 6 Ministry of Transport (2012).

5
The result is an index that generally reflects the degree of liberalisation of an ASA, with
a higher index corresponding to a more liberal agreement, although the absolute level of
the index does not have a meaningful interpretation. Thus it is only possible to interpret
changes in the index for an ASA over time, or relative differences between ASAs.
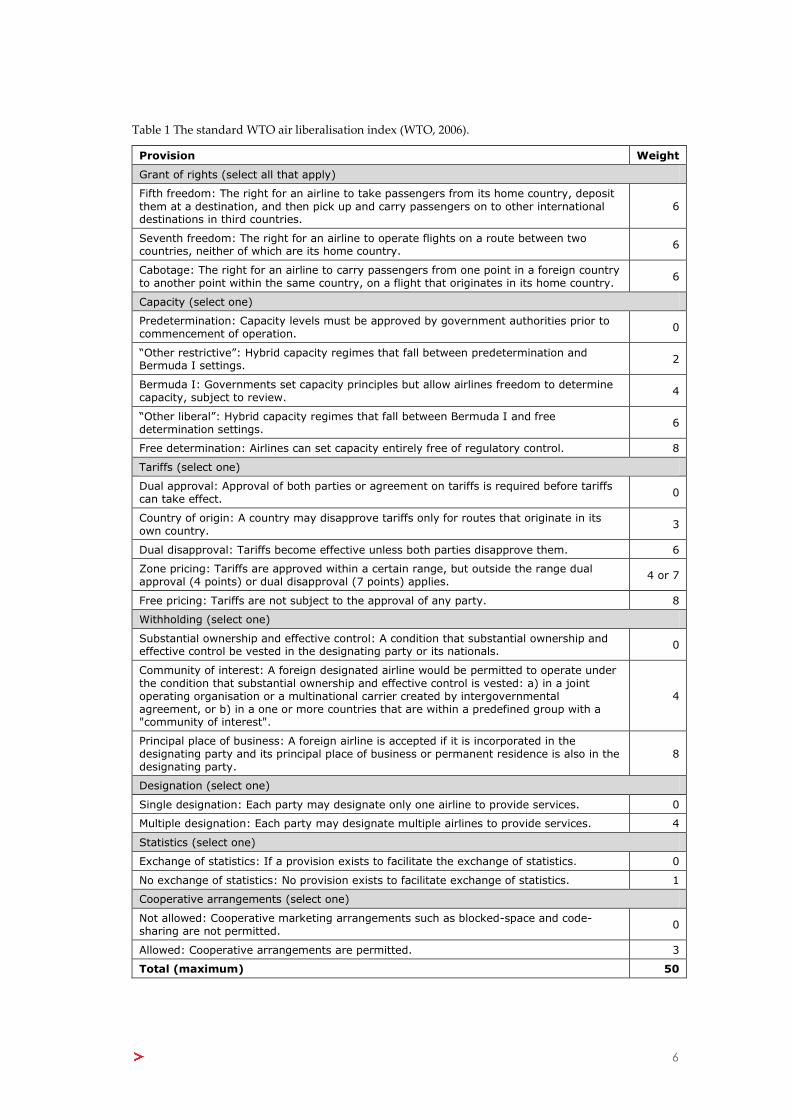
Table 1 on the next page summarises the calculation of the WTO index for a given ASA.
The maximum value is 50, representing very minimal regulatory barriers to entry.
Piermartini and Rousová (2008) calculated average ALIs for a sample of 184 countries.
The data used to calculate the ALIs were from around 2005, and at the time New
Zealand was ranked the 145th most liberal country out of 184 countries overall, with an
average ALI of 15.7. This compared with 10.4 for Australia, 12.3 for Singapore, 18.9 for
the United Kingdom and 25.0 for the United States. Around 70% of ASAs were found to
have an ALI of below 15, while only 15% were found to be in excess of 40 (and none in
excess of 45). Most of the high ALIs were for ASAs within the European Union, for
which the ALI was calculated to be 43.
Piermartini and Rousová used the ALIs, together with a sample of air passenger
volumes between 2,299 country pairs, to test the effects of liberalisation on the volume
of passengers. Everything else equal, it is expected that greater liberalisation will
increase passenger volumes. In general the increase in passenger volumes as a result of
liberalisation is a proxy for the increase in wellbeing (or welfare) as it can be assumed
that a voluntary increase in consumption of a good or service corresponds to an increase
in wellbeing in proportion to the change in quantity.
Cross-country regression models were used by Piermartini and Rousová to explain
passenger volumes as a function of the ALIs, while controlling for the distance between
countries using a ‘gravity’ model,7 and controlling for whether or not the countries
shared a border, whether or not one country was a former colony of the other, whether
the countries shared a common language, income levels in the two countries, and the
age of each ASA.
The results from that study, using various regression methodologies, strongly
supported a positive relationship between greater liberalisation and increased passenger
volumes. Overall it was estimated that increasing the degree of liberalisation from the
25th to the 75th percentile of ASAs increases passenger traffic by around 30%, everything
else equal. The most beneficial liberalisation measures were found to be the removal of
restrictions on capacity and tariffs, granting cabotage (eighth and ninth freedom) rights,
and multiple designation, ie allowing airlines other than a nominated flag carrier of the
foreign country to operate services.
7 Gravity models assume that the ‘attraction’ of travel between two places decreases exponentially with
distance, similar to the effect of physical gravity.
6
Table 1 The standard WTO air liberalisation index (WTO, 2006).
Provision Weight
Grant of rights (select all that apply)
Fifth freedom: The right for an airline to take passengers from its home country, deposit
them at a destination, and then pick up and carry passengers on to other international destinations in third countries.
6
Seventh freedom: The right for an airline to operate flights on a route between two countries, neither of which are its home country.
6
Cabotage: The right for an airline to carry passengers from one point in a foreign country to another point within the same country, on a flight that originates in its home country.
6
Capacity (select one)
Predetermination: Capacity levels must be approved by government authorities prior to commencement of operation.
0
“Other restrictive”: Hybrid capacity regimes that fall between predetermination and Bermuda I settings.
2
Bermuda I: Governments set capacity principles but allow airlines freedom to determine capacity, subject to review.
4
“Other liberal”: Hybrid capacity regimes that fall between Bermuda I and free determination settings.
6
Free determination: Airlines can set capacity entirely free of regulatory control. 8
Tariffs (select one)
Dual approval: Approval of both parties or agreement on tariffs is required before tariffs can take effect.
0
Country of origin: A country may disapprove tariffs only for routes that originate in its own country.
3
Dual disapproval: Tariffs become effective unless both parties disapprove them. 6
Zone pricing: Tariffs are approved within a certain range, but outside the range dual approval (4 points) or dual disapproval (7 points) applies.
4 or 7
Free pricing: Tariffs are not subject to the approval of any party. 8
Withholding (select one)
Substantial ownership and effective control: A condition that substantial ownership and effective control be vested in the designating party or its nationals.
0
Community of interest: A foreign designated airline would be permitted to operate under
the condition that substantial ownership and effective control is vested: a) in a joint operating organisation or a multinational carrier created by intergovernmental agreement, or b) in a one or more countries that are within a predefined group with a "community of interest".
4
Principal place of business: A foreign airline is accepted if it is incorporated in the designating party and its principal place of business or permanent residence is also in the designating party.
8
Designation (select one)
Single designation: Each party may designate only one airline to provide services. 0
Multiple designation: Each party may designate multiple airlines to provide services. 4
Statistics (select one)
Exchange of statistics: If a provision exists to facilitate the exchange of statistics. 0
No exchange of statistics: No provision exists to facilitate exchange of statistics. 1
Cooperative arrangements (select one)
Not allowed: Cooperative marketing arrangements such as blocked-space and code-sharing are not permitted.
0
Allowed: Cooperative arrangements are permitted. 3
Total (maximum) 50

7
2.3 Case Studies
For the purposes of the empirical analysis in section 3 below, case studies were selected
to test the effects of New Zealand’s air services liberalisation. The case studies were
chosen on the basis of significant liberalisation occurring over time since the mid-1990s:
between New Zealand and Australia, the United States, China and Singapore.
Appendix 1 gives details of the calculation of the four ALIs. The standard WTO (2006)
methodology was applied, with two minor modifications:
While all the relevant ASAs provide for the exchange of statistics, in practice this
is never enforced in New Zealand, hence the weight for “no exchange of
statistics” was used. In any case this condition has not changed in any of the
ASAs and so will not affect the value of the ALIs over time.
The allowance of cooperative arrangements was further divided into two sub-
categories to better reflect the detail of New Zealand’s ASAs:
o Regular codesharing allowed (2 points)
o Regular and third-country codesharing allowed (3 points)
The resulting ALIs for the four case studies are shown in Figure 10. All have increased
substantially over time. Following the 2001 MALIAT Protocol, the ASA with Singapore
achieves the maximum possible ALI of 50. The MALIAT itself achieves an ALI of 38.
Figure 10 Calculated ALIs for New Zealand’s ASAs with the case study countries.
Source: Calculated from Ministry of Transport data.
0
5
10
15
20
25
30
35
40
45
50
19
88
19
89
19
90
19
91
19
92
19
93
19
94
19
95
19
96
19
97
19
98
19
99
20
00
20
01
20
02
20
03
20
04
20
05
20
06
20
07
20
08
20
09
20
10
20
11
20
12
20
13
Air
lib
era
lisat
ion
in
de
x
Australia USA China Singapore
8
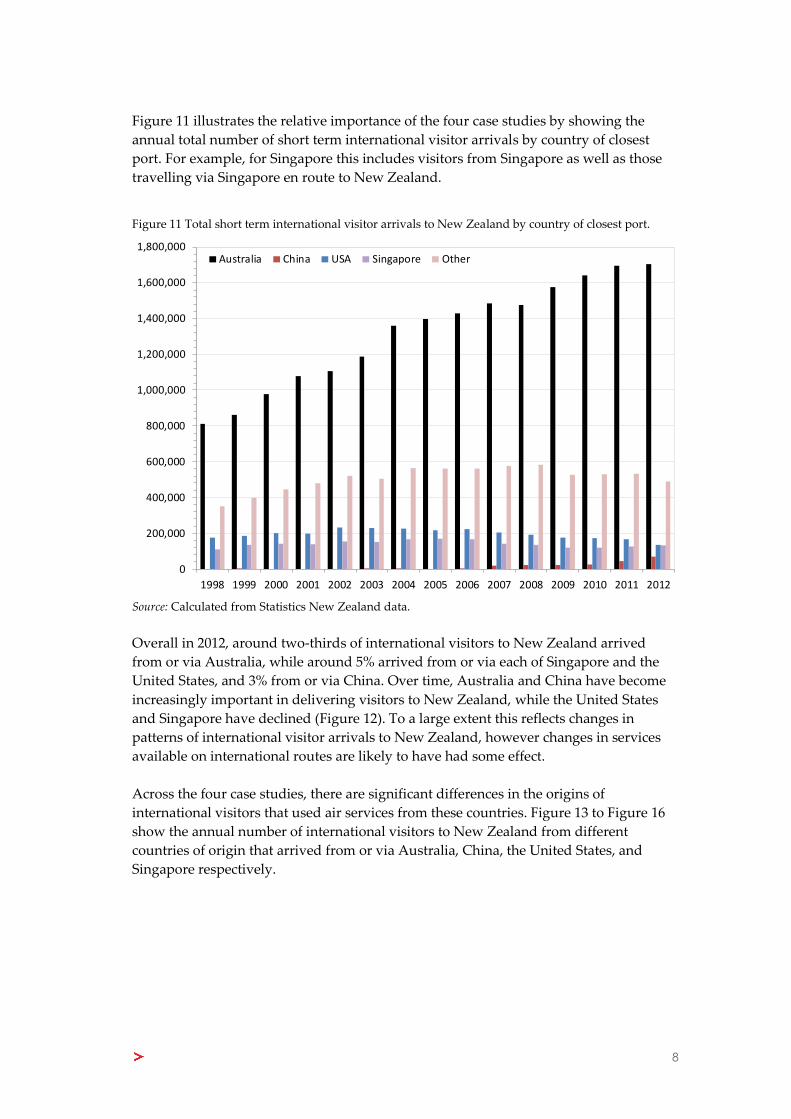
Figure 11 illustrates the relative importance of the four case studies by showing the
annual total number of short term international visitor arrivals by country of closest
port. For example, for Singapore this includes visitors from Singapore as well as those
travelling via Singapore en route to New Zealand.
Figure 11 Total short term international visitor arrivals to New Zealand by country of closest port.
Source: Calculated from Statistics New Zealand data.
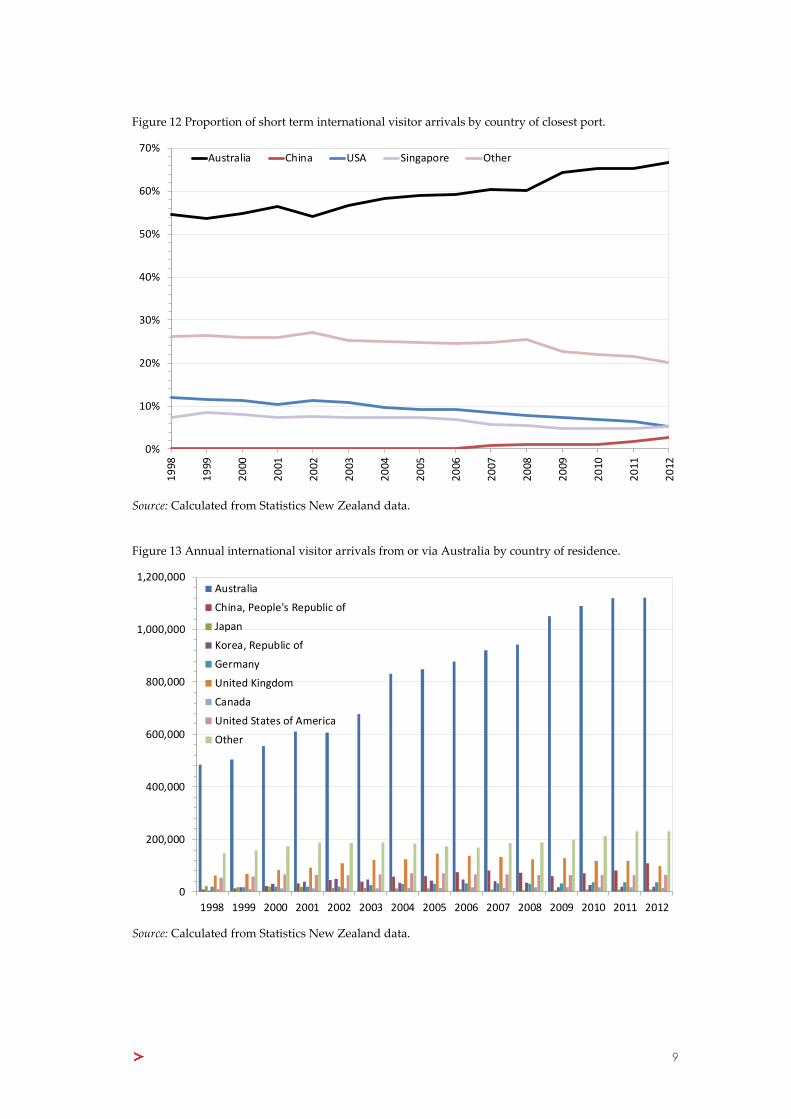
Overall in 2012, around two-thirds of international visitors to New Zealand arrived
from or via Australia, while around 5% arrived from or via each of Singapore and the
United States, and 3% from or via China. Over time, Australia and China have become
increasingly important in delivering visitors to New Zealand, while the United States
and Singapore have declined (Figure 12). To a large extent this reflects changes in
patterns of international visitor arrivals to New Zealand, however changes in services
available on international routes are likely to have had some effect.
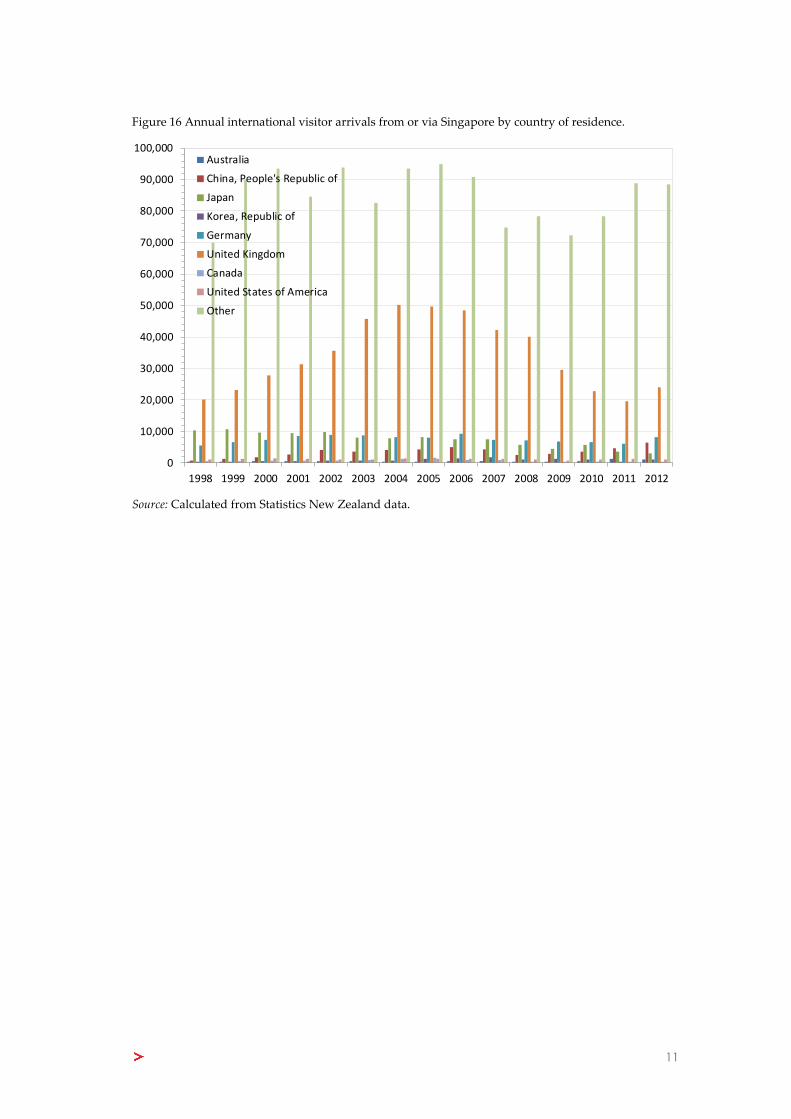
Across the four case studies, there are significant differences in the origins of
international visitors that used air services from these countries. Figure 13 to Figure 16
show the annual number of international visitors to New Zealand from different
countries of origin that arrived from or via Australia, China, the United States, and
Singapore respectively.
0
200,000
400,000
600,000
800,000
1,000,000
1,200,000
1,400,000
1,600,000
1,800,000
1998 1999 2000 2001 2002 2003 2004 2005 2006 2007 2008 2009 2010 2011 2012
Australia China USA Singapore Other
9
Figure 12 Proportion of short term international visitor arrivals by country of closest port.
Source: Calculated from Statistics New Zealand data.
Figure 13 Annual international visitor arrivals from or via Australia by country of residence.
Source: Calculated from Statistics New Zealand data.
0%
10%
20%
30%
40%
50%
60%
70%
19
98
19
99
20
00
20
01
20
02
20
03
20
04
20
05
20
06
20
07
20
08
20
09
20
10
20
11
20
12
Australia China USA Singapore Other
0
200,000
400,000
600,000
800,000
1,000,000
1,200,000
1998 1999 2000 2001 2002 2003 2004 2005 2006 2007 2008 2009 2010 2011 2012
Australia
China, People's Republic of
Japan
Korea, Republic of
Germany
United Kingdom
Canada
United States of America
Other

10
Figure 14 Annual international visitor arrivals from or via China by country of residence.
Source: Calculated from Statistics New Zealand data.
Figure 15 Annual international visitor arrivals from or via the United States by country of residence.
Source: Calculated from Statistics New Zealand data.
0
10,000
20,000
30,000
40,000
50,000
60,000
1998 1999 2000 2001 2002 2003 2004 2005 2006 2007 2008 2009 2010 2011 2012
Australia
China, People's Republic of
Japan
Korea, Republic of
Germany
United Kingdom
Canada
United States of America
Other
0
20,000
40,000
60,000
80,000
100,000
120,000
140,000
1998 1999 2000 2001 2002 2003 2004 2005 2006 2007 2008 2009 2010 2011 2012
Australia
China, People's Republic of
Japan
Korea, Republic of
Germany
United Kingdom
Canada
United States of America
Other
11
Figure 16 Annual international visitor arrivals from or via Singapore by country of residence.
Source: Calculated from Statistics New Zealand data.
0
10,000
20,000
30,000
40,000
50,000
60,000
70,000
80,000
90,000
100,000
1998 1999 2000 2001 2002 2003 2004 2005 2006 2007 2008 2009 2010 2011 2012
Australia
China, People's Republic of
Japan
Korea, Republic of
Germany
United Kingdom
Canada
United States of America
Other

12
3 Estimating the Effects of Liberalisation
In this section the effects on some interesting variables of the progressive liberalisation
of ASAs for each of the four case studies are investigated using econometric analysis.
We take a broad wellbeing (or total welfare) approach to the measurement of effects.
This includes effects on economic activity in New Zealand, for example due to changes
in inbound visitor numbers.
Our analysis also includes effects on New Zealand consumer welfare such as outbound
travel and changes in international airfares that are more aviation-specific than
aggregate economic activity measures such as GDP. Such outcomes reflect changes in
the wellbeing of New Zealanders and thus are relevant for development of international
air transport policy.
3.1 Theory
Before undertaking empirical analysis, it is important to establish a theoretical
connection between air services liberalisation and economic activity and welfare. In
general, liberalisation can be thought of as removing regulatory barriers to entry and
expansion on New Zealand international routes.
Historically, barriers to entry and expansion have been created by ASAs that limited the
ability of foreign carriers to operate New Zealand routes, for example by limiting access
to one nominated ‘flag’ carrier per country. Capacity restrictions and tariff approval
processes also limit the ability of airlines to compete on New Zealand routes. Similar
restrictions imposed by foreign countries have limited the ability of New Zealand
airlines to compete on routes to other countries. These barriers are quite apart from any
barriers created by the costs of operating any given route, or technological limitations.
Reduction of regulatory barriers to entry and expansion can be expected to stimulate
competition on New Zealand international air routes. Overall, we should observe entry
of new airlines and/or expansion of existing operators, and a move towards more equal
market shares of airlines serving New Zealand.
The Hirschman Herfindahl Index (HHI) is a commonly used measure of the diversity of
supply and intensity of competition in an industry. The HHI is calculated as the sum of
squared market shares, and reflects the number of suppliers as well as the distribution
of their market shares. Lower values of the HHI reflect a larger number of suppliers
and/or more evenly distributed market shares. For example, an industry with a single
supplier will have an HHI of 10,000. With two suppliers sharing the market equally, the
HHI will be 5,000. If one supplier had 90% market share and the other had 10%, the HHI
will be 8,200. If ten suppliers have equal market share, the HHI will be 1,000.
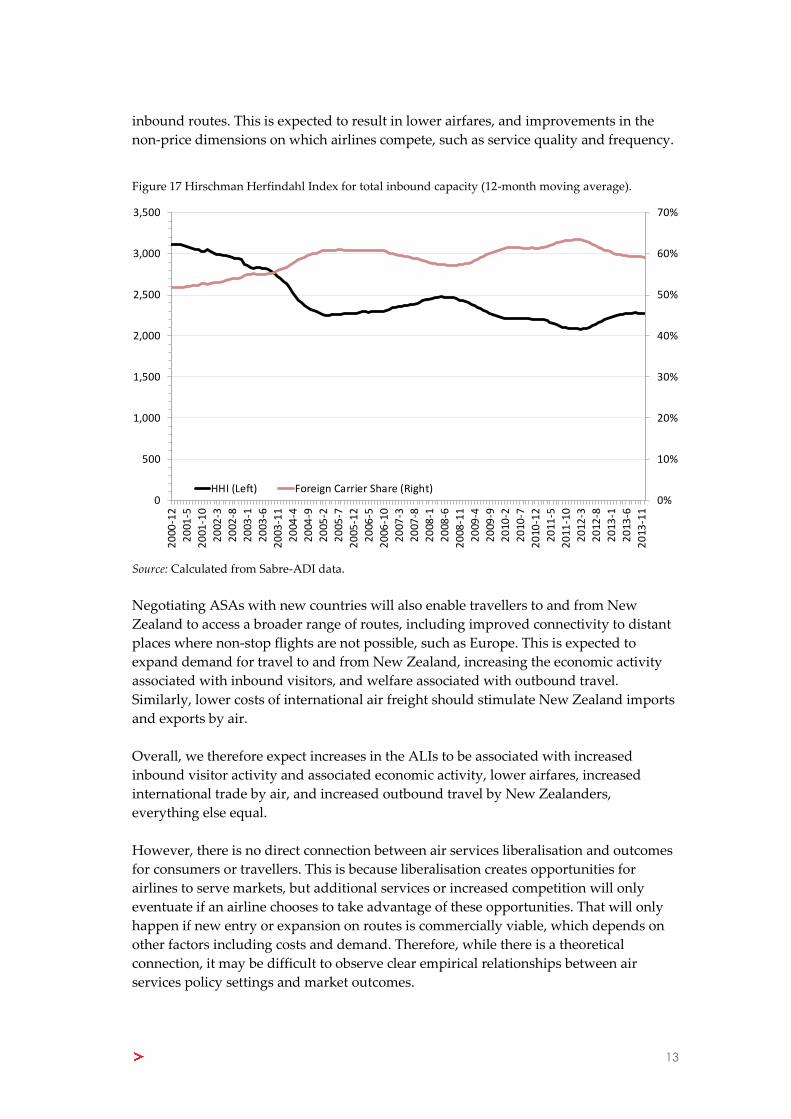
Figure 17 shows the HHI calculated on the basis of total inbound capacity to New
Zealand by airline. In general the HHI has been declining over time, while the share of
capacity supplied by foreign carriers has been increasing. This is consistent with the
entry of foreign carriers leading to an increase in overall competition on New Zealand
13
inbound routes. This is expected to result in lower airfares, and improvements in the
non-price dimensions on which airlines compete, such as service quality and frequency.
Figure 17 Hirschman Herfindahl Index for total inbound capacity (12-month moving average).
Source: Calculated from Sabre-ADI data.
Negotiating ASAs with new countries will also enable travellers to and from New
Zealand to access a broader range of routes, including improved connectivity to distant
places where non-stop flights are not possible, such as Europe. This is expected to
expand demand for travel to and from New Zealand, increasing the economic activity
associated with inbound visitors, and welfare associated with outbound travel.
Similarly, lower costs of international air freight should stimulate New Zealand imports
and exports by air.
Overall, we therefore expect increases in the ALIs to be associated with increased
inbound visitor activity and associated economic activity, lower airfares, increased
international trade by air, and increased outbound travel by New Zealanders,
everything else equal.
However, there is no direct connection between air services liberalisation and outcomes
for consumers or travellers. This is because liberalisation creates opportunities for
airlines to serve markets, but additional services or increased competition will only
eventuate if an airline chooses to take advantage of these opportunities. That will only
happen if new entry or expansion on routes is commercially viable, which depends on
other factors including costs and demand. Therefore, while there is a theoretical
connection, it may be difficult to observe clear empirical relationships between air
services policy settings and market outcomes.
0%
10%
20%
30%
40%
50%
60%
70%
0
500
1,000
1,500
2,000
2,500
3,000
3,500
20
00-1
2
20
01-5
20
01-1
0
20
02-3
20
02-8
20
03-1
20
03-6
20
03-1
1
20
04-4
20
04-9
20
05-2
20
05-7
20
05-1
2
20
06-5
20
06-1
0
20
07-3
20
07-8
20
08-1
20
08-6
20
08-1
1
20
09-4
20
09-9
20
10-2
20
10-7
20
10-1
2
20
11-5
20
11-1
0
20
12-3
20
12-8
20
13-1
20
13-6
20
13-1
1
HHI (Left) Foreign Carrier Share (Right)

14
3.2 Empirical Methodology
Our empirical analysis is based on testing the relationships between ALIs and certain
variables of interest, for each of the four case studies. The following variables were
selected to measure the effects of liberalisation, based on the theoretical relationships
described above, and data availability:
The number of short-term international visitor arrivals to New Zealand, in total
and from various countries of origin expected to be affected by liberalisation in
each of the four case studies.
Total short-term departures by New Zealand residents.
The real value of New Zealand exports and imports by air.
Total New Zealand real GDP.
Real prices for international outbound travel from New Zealand.
For international visitor arrivals, we model arrivals from various countries and regions
of origin separately, in order to understand the effects of liberalisation on different types
of visitor to New Zealand. However, for New Zealand resident departures we model
only total departures, rather than departures to specific destinations. This is because
liberalisation may have caused some substitution between destinations by outbound
New Zealand travellers. If individual destinations were modelled, substitution between
destinations may appear to be as a net gain, when in fact it is offset by a reduction in
travel to another destination.8
In each case, we estimate time series models relating the variable of interest to the
relevant ALIs from the case studies.9 A key issue in this analysis is controlling for other
factors that have changed at the same time and that are also expected to affect the
variables of interest. We handle this by including other relevant variables in each
regression model, where possible and appropriate. Thus the results for the ALI variable
can be interpreted as the relationship between the ALI and the variable of interest,
holding constant the other variables included in the regression model.
Specifically, for each variable of interest, , we estimated a regression model of the form:
where is a vector of the relevant ALIs, is a vector of other controlling variables,
is a random error, and , and are parameters to be estimated.
8 Such substitution would also reflect a welfare gain if outbound travellers are choosing to travel to a
more favoured destination. However the extent of substitution and associated welfare benefits are
difficult to measure, and hence we focus on aggregate outbound travel.
9 Not all of the four ALIs were determined to be relevant for every variable of interest; we discuss this
further below.

15
In addition to the above ‘structural’ time series models, we also tested the effects of
liberalisation against simple linear time trends for each variable of interest.10 These
models have the basic form:
where is the slope of the time trend. In some cases where clear breaks in the trend of
the variable of interest were apparent, we used a piecewise trend model, with
potentially different intercept and/or slope before and after the break.
When working with time-series data it is important to test for the presence of
autocorrelation in the estimated model and correct for it if necessary. Autocorrelation
refers to a situation where the estimated residuals of the model ( ) are correlated over
time. This occurs if random shocks that disturb the estimated regression relationship
take time to dissipate, and is a common feature of time series models. We tested for
autocorrelation in each estimated model using statistical tests including the Durbin-
Watson statistic and the estimated autocorrelation function of the residuals.
If autocorrelation is found to be present, it is necessary to correct for this in order to
produce valid estimates from the regression model. We have done this by modifying the
error term of the model to model the autocorrelation if present. This is known as an
autoregressive (AR) model, where the error is modelled as a function of one or more
of its own past values. For example, an AR(1) model takes the form:
where is a parameter to be estimated along with the other parameters of the model
and is a random error. In some cases it was necessary to include a second lag of .
This is referred to as an AR(2) model but is conceptually similar to the AR(1) model.
Following the inclusion of autoregressive parameters as appropriate, we applied
diagnostic tests to the estimated models to check the validity of the results. These
included testing the stationarity of the regression residuals,11 testing the joint
significance of the estimated coefficients with F-tests, and measures of goodness of fit
with the data.
10 In a small number of cases, only trend variables were used, as suitable controlling variables for the
structural model are not available.
11 Regression residuals are ‘stationary’ if their mean and variance are constant over time. This is
necessary to generate valid estimates from time series regression models, and was checked by
conducting Augmented Dickey Fuller tests on the regression residuals.

16
3.3 Data
The following annual time series were obtained for use as dependent variables in the
regression analysis:
International visitor arrivals to New Zealand: In total, and from various
countries and regions of origin, published by Statistics New Zealand.
Total international short-term departures by New Zealand residents: To all
destinations, published by Statistics New Zealand.
Total real value of New Zealand imports and exports by air: Between New
Zealand and all countries. Imports are valued on a cost plus insurance plus
freight (CIF) basis, while exports are valued on a free-on-board (FOB) basis,
published by Statistics New Zealand. These were converted to real values using
Statistics New Zealand GDP deflators for exports and imports.
Total New Zealand real GDP: In constant prices, published by Statistics New
Zealand.
New Zealand real international outbound travel price index: Calculated from
Statistics New Zealand’s nominal outbound travel price index, deflated by the
Consumer Price Index to estimate the real price of travel.
The following annual time series were used as control variables in the structural models:
Foreign real GDP: In the international visitor arrivals models, GDP of the
relevant country of origin, obtained from the OECD and national statistics
agencies where OECD data was unavailable.
Exchange rates: Relative to the New Zealand dollar, published by the PACIFIC
Exchange Rate Service.
Oil prices: Real benchmark crude oil prices in US dollars, from the US Energy
Information Administration.
New Zealand real GDP: Used as a control variable in the outbound travel
model and imports models, obtained from Statistics New Zealand.
Terms of trade: The ratio of New Zealand export prices to import prices,
published by Statistics New Zealand.
Jet fuel prices: Real prices, converted to New Zealand dollars at prevailing
exchange rates, calculated from data from the US Energy Information
Administration.
Not all of these variables were used as control variables in all regression models. In
some cases, control variables that were found to be statistically insignificant were
omitted from the models. The details of each model are reported in the Appendix.
17
3.4 Determining which ALIs are Relevant
As discussed in section 2.3 above, the pattern of country of origin of international visitor
arrivals to New Zealand is quite different for each of the four cases. The results in Figure
13 to Figure 16 were used to determine which of the four ALIs are likely to be relevant
for international visitor arrivals from each country of origin. For example, in addition to
Australian visitors, Australia is used as a transit point for a significant number of
visitors from China, the USA and the UK.
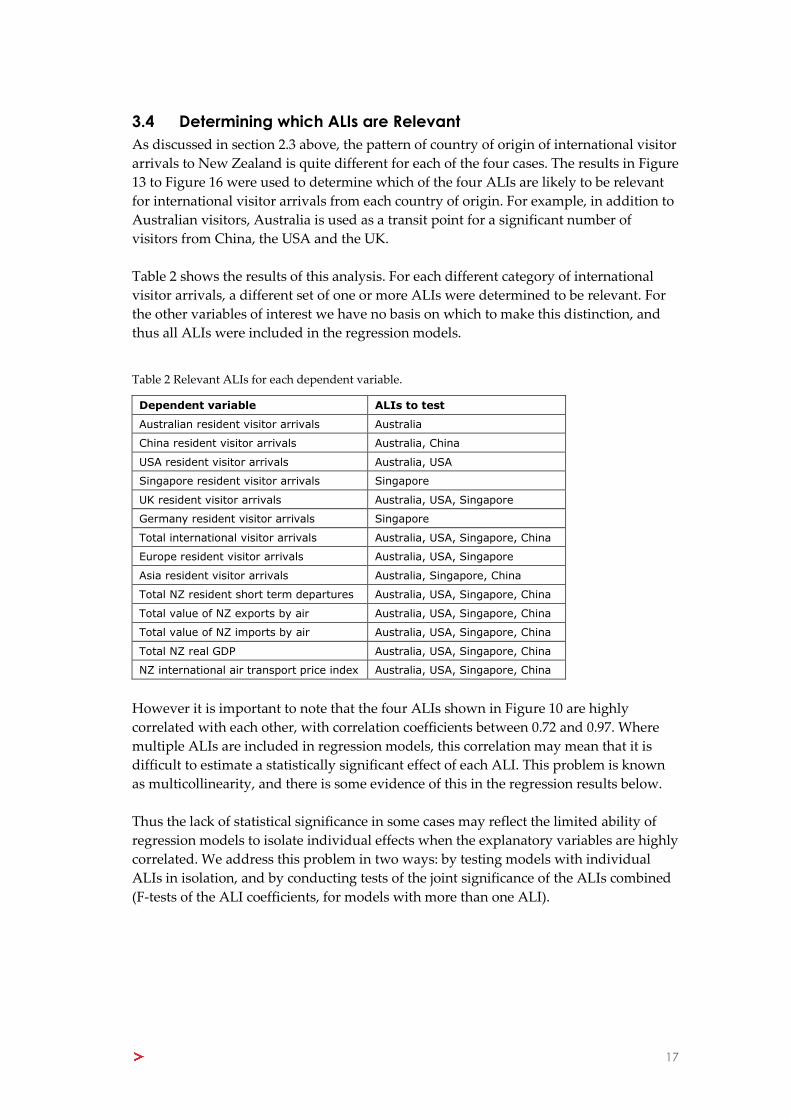
Table 2 shows the results of this analysis. For each different category of international
visitor arrivals, a different set of one or more ALIs were determined to be relevant. For
the other variables of interest we have no basis on which to make this distinction, and
thus all ALIs were included in the regression models.
Table 2 Relevant ALIs for each dependent variable.
Dependent variable ALIs to test
Australian resident visitor arrivals Australia
China resident visitor arrivals Australia, China
USA resident visitor arrivals Australia, USA
Singapore resident visitor arrivals Singapore
UK resident visitor arrivals Australia, USA, Singapore
Germany resident visitor arrivals Singapore
Total international visitor arrivals Australia, USA, Singapore, China
Europe resident visitor arrivals Australia, USA, Singapore
Asia resident visitor arrivals Australia, Singapore, China
Total NZ resident short term departures Australia, USA, Singapore, China
Total value of NZ exports by air Australia, USA, Singapore, China
Total value of NZ imports by air Australia, USA, Singapore, China
Total NZ real GDP Australia, USA, Singapore, China
NZ international air transport price index Australia, USA, Singapore, China
However it is important to note that the four ALIs shown in Figure 10 are highly
correlated with each other, with correlation coefficients between 0.72 and 0.97. Where
multiple ALIs are included in regression models, this correlation may mean that it is
difficult to estimate a statistically significant effect of each ALI. This problem is known
as multicollinearity, and there is some evidence of this in the regression results below.
Thus the lack of statistical significance in some cases may reflect the limited ability of
regression models to isolate individual effects when the explanatory variables are highly
correlated. We address this problem in two ways: by testing models with individual
ALIs in isolation, and by conducting tests of the joint significance of the ALIs combined
(F-tests of the ALI coefficients, for models with more than one ALI).
18
3.5 Regression Results
Table 3 summarises the results from the regression models, in terms of the statistical
significance of each of the ALI variables for each variable of interest. The full regression
results are presented in the Appendix.
The results in Table 3 reflect the results of statistical hypothesis testing on the estimated
coefficients of the regression models. In each case the hypothesis tested is that the
estimated coefficient is equal to zero, ie there is no relationship between the ALI given
by the column of Table 3 and the variable of interest given by the row of the table. A
finding of “weak” or “strong” reflects the degree of confidence that this hypothesis of
no relationship is false, ie that there may be a relationship between the ALI and the
variable of interest. In particular, the results in Table 3 reflect the following:
No evidence: No statistically significant relationship was found between the ALI
and the variable of interest.
Weak evidence: Some evidence was found of a relationship between the ALI
and the variable of interest, but there is a 5 - 10% possibility that the observed
relationship is by chance rather than real.
Strong evidence: Evidence of a relationship between the ALI and the variable of
interest was found, and the possibility that the relationship is by chance is less
than 5%.
Wrong sign: A statistically significant relationship was found, but the estimated
direction is the opposite to what was expected, eg increased liberalisation was
associated with a reduction in visitor arrivals. This likely arises from the
estimated model not fitting the data well.
n.a.: Variable was not tested in the model.

19
Table 3 Summary of results from the regression models.
Australia ALI US ALI China ALI Singapore ALI Joint ALIs Control variables
International visitor arrivals
Structural models
Australia No evidence n.a. n.a. n.a. n.a. Foreign GDP, exchange rate
US No evidence No evidence n.a. n.a. No evidence Foreign GDP, exchange rate
UK No evidence No evidence n.a. No evidence No evidence Foreign GDP, exchange rate
China Weak evidence n.a. No evidence Strong evidence Strong evidence Foreign GDP, exchange rate
Singapore n.a. n.a. n.a. No evidence n.a. Foreign GDP, exchange rate
Germany n.a. n.a. n.a. No evidence n.a. Foreign GDP, exchange rate
Trend models
Australia No evidence n.a. n.a. n.a. n.a. Linear time trend
US No evidence No evidence n.a. n.a. No evidence Linear time trend
UK No evidence Strong evidence n.a. No evidence No evidence Linear time trend with break
China No evidence n.a. No evidence Weak evidence Strong evidence Linear time trend
Singapore n.a. n.a. n.a. No evidence n.a. Linear time trend
Germany n.a. n.a. n.a. Wrong sign n.a. Linear time trend with break
Asia No evidence n.a. No evidence No evidence No evidence Linear time trend with break
Europe No evidence Weak evidence n.a. Wrong sign Weak evidence Linear time trend with break
All origins No evidence Strong evidence No evidence Strong evidence Strong evidence Linear time trend

20
Australia ALI US ALI China ALI Singapore ALI Joint ALIs Control variables
NZ resident short term departures
Structural models Strong evidence Wrong sign Strong evidence No evidence Strong evidence NZ GDP, fuel price, exchange rate
Trend models Weak evidence No evidence Strong evidence Strong evidence Strong evidence Linear time trend
Value of international trade by air
Structural models
Exports No evidence No evidence No evidence No evidence No evidence Foreign GDP, oil price, terms of trade
Imports No evidence No evidence No evidence Wrong sign No evidence NZ GDP, oil price, terms of trade
Trend models
Exports Strong evidence No evidence No evidence No evidence No evidence Linear time trend
Imports Weak evidence No evidence Weak evidence No evidence No evidence Linear time trend
NZ real GDP
Trend models No evidence Strong evidence No evidence No evidence No evidence Linear time trend
NZ real international outbound travel price index
Structural models No evidence No evidence Strong evidence No evidence Strong evidence NZ GDP, oil price
Trend models No evidence No evidence Strong evidence No evidence Strong evidence Linear time trend

21
3.6 Interpretation of Results
The regression analysis described above tested the relationships between the ALIs and
the variables of interest in different ways using different models. In our view, for the
purposes of policy evaluation and development, it is most appropriate to interpret the
overall patterns and features of the results as a whole, rather than focussing on
individual numerical results from the regressions.
In the following we give our views on the estimated effects of New Zealand’s
liberalisation of air services that appear to be relatively robust.
International visitor arrivals
The estimated effects of liberalisation on international visitor arrivals are mixed. In each
of the four case studies, there is no significant relationship between the ALI and the
relevant point-to-point market. For example, visitor arrivals of Singapore residents do
not appear to depend on the Singapore ALI.
Rather, effects show up more frequently for indirect travel. Singapore in particular
appears to be important for travel from a variety of origins, and the Singapore ALI is
positively related to arrivals from China and all origins in total. Similarly there is some
evidence of a relationship between the US ALI and arrivals from the UK and Europe.
These observations may reflect the changes that have taken place during the period of
analysis used for this study. Prior to the mid-1990s, New Zealand did have ASAs and
air services with a number of countries, but competition was generally limited to
national carriers and capacity was constrained. Liberalisation since the mid-1990s has
permitted greater services by fifth-freedom carriers, stimulating indirect travel. Given
New Zealand’s relative geographic isolation from many of its inbound tourism markets
and outbound travel destinations, stimulating indirect travel via air services
liberalisation appears to have been relatively effective.
Short-term departures by New Zealand residents
The evidence for a link between liberalisation and short-term departures by New
Zealand residents is relatively strong. Significant positive relationships were observed
for all of the ALIs except the United States. This suggests that greater competition and
better access to international destinations has stimulated outbound travel by New
Zealanders.
Between 1998 and 2012, annual outbound trips by New Zealanders almost doubled,
from 1.2 million to 2.2 million. The majority of this increase has come from greater
holiday and visiting friends and relatives travel, although outbound travel for all
purposes has increased during this timeframe. Leisure travel is generally more price
sensitive than business travel, leading to a potentially larger response of leisure travel to
increased competition on international routes.
As noted above, additional outbound travel by New Zealanders may not stimulate
economic activity in New Zealand (particularly outbound leisure travel), but the fact
that people have chosen to travel more reflects the fact that it is something they value.

22
Thus greater outbound travel can be assumed to represent welfare benefits to New
Zealanders, and is a positive effect of liberalisation.
New Zealand outbound travel price index
Real prices for international outbound travel from New Zealand have been falling
almost continuously since the mid-1980s, in spite of generally increasing aviation fuel
prices (Figure 8 above). This is very likely due to increased competition among airlines,
as well as technological improvements that have reduced per-unit operating costs.
There is evidence of a relationship between liberalisation of air services between New
Zealand and China, and falling real outbound travel prices. Services between New
Zealand and China are relatively recent, facilitated by new ASAs, while China has
rapidly become increasingly important for both New Zealand inbound and outbound
travel. This suggests that opening access to new markets for which there is substantial
travel demand is associated with overall downwards pressure on travel prices.
Imports and Exports
There is no clear evidence of a relationship between the ALIs and New Zealand’s
international trade, except for the Australian ALI, which appears to be positively related
to the value of both imports and exports. This is consistent with Australia being New
Zealand’s largest trading partner, and the low cost of air freight between New Zealand
and Australia, compared to elsewhere.
Overall, air freight is a relatively small fraction of New Zealand’s total international
trade, and very few dedicated air freight services operate to New Zealand. Instead most
freight is carried on passenger aircraft, and to the extent that liberalisation stimulates
competition in passenger services, it should also stimulate competition in air freight,
leading to lower freight prices and increased volumes of international trade. However
this is more likely to be a secondary benefit of liberalisation, relative to benefits from
competition in passenger services.
New Zealand real GDP
The regression models indicate generally no evidence of a relationship between
liberalisation and New Zealand’s real GDP. This may be due to the fact that aggregate
economic activity is affected by a large number of trends, of which air services
liberalisation is comparatively minor. There is some evidence of a relationship between
the US ALI and real GDP, although this result should be interpreted cautiously as the
GDP models only control for the trend in GDP, due to the complexity of developing a
model containing exogenous drivers of GDP.

23
3.7 Limitations of the Analysis
The econometric analysis above has limitations that are primarily driven by the
availability of data and the difficulty of isolating effects of general policy settings such
as air services liberalisation. The following limitations should be borne in mind when
interpreting the results:
As mentioned above, high correlation between the individual ALIs means that
models with multiple ALIs may not find a statistically significant effect when
one exists.
In the trend models, the trend variable itself may capture some of the effects of
liberalisation if growth is partially created by the increased capacity facilitated
by air services liberalisation.
The effects of air services liberalisation may occur with a considerable time lag,
as effects will only be observed after airlines choose to offer new services. The
timeframe for this study limits the opportunity to estimate lag effects.
As noted above, analysis of outbound travel by New Zealanders is limited to the
total number of short-term departures and welfare-enhancing substitutions
between destinations have not been analysed. The welfare effects of air services
liberalisation on New Zealanders due to increased opportunities for outbound
travel are therefore probably underestimated.
As noted above, the analysis of effects on GDP is limited by the number of other
factors that will have affected GDP over time. It is difficult to isolate the effects
of air services policy from the great number of other factors that affect aggregate
economic activity.
At the same time as liberalising air transport markets, New Zealand has been
liberalising its trade agreements with other countries. Increased international
trade due to trade liberalisation may also stimulate demand for air travel. The
regression models do not directly estimate or control for this interaction.

24
4 Analysis of Foreign Airline Capacity
As noted in the introduction, foreign airlines have provided much of the increase in
capacity on international routes to and from New Zealand since 2000. This section
reviews features and trends of the capacity provided by foreign airlines between 2000
and 2013, with the objective of determining whether there is any evidence of risk
associated with reliance on foreign carriers.
Two features of foreign capacity are analysed – volatility and route tenure. Volatility
refers to fluctuations of capacity around its average or long-term trend. Route tenure
refers to the length of time that a route is operated by an airline. We compare foreign
airline capacity against capacity provided by Air New Zealand in terms of volatility and
route tenure.
The analysis in this section is based on monthly flight schedule data obtained from
Sabre-ADI for the period from January 2000 to December 2013.12 All figures refer to
capacity on inbound international routes only, however outbound capacity will be very
similar. For routes with more than one segment (eg Dubai-Sydney-Auckland), capacity
has been calculated for the segment arriving in New Zealand only (eg Sydney-
Auckland).13 The analysis in this section thus refers to the total number of seats arriving
in New Zealand each month.
The analysis also combines capacities for Qantas (QF) and Jetstar (JQ and 3K), Air New
Zealand (NZ) and Freedom Air (SJ), and Virgin Australia (VA) and Pacific Blue (DJ).14
4.1 General Trends
Figure 18 demonstrates the significance of the change in international capacity to New
Zealand by showing the cumulative change in total inbound capacity relative to the
level in 2000. Air New Zealand’s total annual capacity has increased by around 450,000
seats, while annual capacity provided by foreign carriers has increased by around
1,500,000 seats. Much of this growth occurred between 2003 and 2005.
Figure 9 and Figure 18 also show that there appear to be medium-term cycles of
capacity around the long-term trend. For example following the expansion between
2003-05, capacity declined during 2006 and 2007. A similar pattern is observed following
other periods of capacity expansion.
12 Sabre-ADI data is only available back to 2000, hence the time period for this analysis is shorter than
in the previous section.
13 It is not possible to know how many seats on other legs (eg Dubai-Sydney) were available for New
Zealand-bound passengers, and in any case all such passengers would eventually have to be on a flight
arriving in New Zealand.
14 This is because although some airlines have more than one brand (eg Qantas and Jetstar), common
ownership means there is a strong incentive for coordination of capacities across these brands. In
addition, combining capacities in this way is necessary for comparing with other airlines that operate a
single brand but strongly differentiate services within that brand (eg Air New Zealand’s current Seat,
Seat+Bag, Works products).

25
Figure 18 Cumulative change in total New Zealand inbound capacity relative to 2000.
Source: Calculated from Sabre-ADI data.
Figure 19 shows entry and exit of foreign airlines on New Zealand routes between 2000
and 2013. There is a stable set that have served the market for the entire period (and
significantly longer in some cases), while some other airlines entered only briefly.
Figure 19 Entry and exit of foreign carriers on any New Zealand inbound route.
Source: Calculated from Sabre-ADI data.
-250,000
0
250,000
500,000
750,000
1,000,000
1,250,000
1,500,000
1,750,000
2,000,000
2001 2002 2003 2004 2005 2006 2007 2008 2009 2010 2011 2012 2013
Seat
s p
er
ann
um
Air NZ Foreign
20
00-1
20
00-7
20
01-1
20
01-7
20
02-1
20
02-7
20
03-1
20
03-7
20
04-1
20
04-7
20
05-1
20
05-7
20
06-1
20
06-7
20
07-1
20
07-7
20
08-1
20
08-7
20
09-1
20
09-7
20
10-1
20
10-7
20
11-1
20
11-7
20
12-1
20
12-7
20
13-1
20
13-7
QF + JQSQTG
MHKECXFJSBNFTNARLAEK
DJ + VABI
GABRPHCI
UACZ
WROZYED7HACA
26
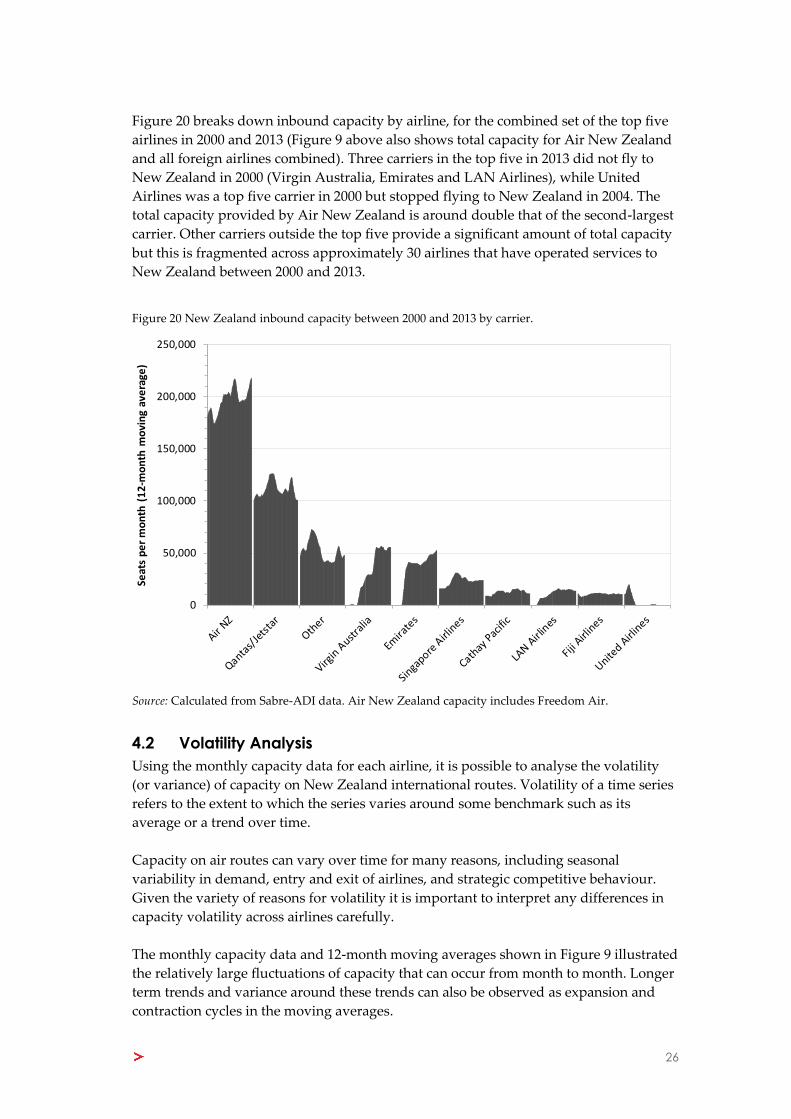
Figure 20 breaks down inbound capacity by airline, for the combined set of the top five
airlines in 2000 and 2013 (Figure 9 above also shows total capacity for Air New Zealand
and all foreign airlines combined). Three carriers in the top five in 2013 did not fly to
New Zealand in 2000 (Virgin Australia, Emirates and LAN Airlines), while United
Airlines was a top five carrier in 2000 but stopped flying to New Zealand in 2004. The
total capacity provided by Air New Zealand is around double that of the second-largest
carrier. Other carriers outside the top five provide a significant amount of total capacity
but this is fragmented across approximately 30 airlines that have operated services to
New Zealand between 2000 and 2013.
Figure 20 New Zealand inbound capacity between 2000 and 2013 by carrier.
Source: Calculated from Sabre-ADI data. Air New Zealand capacity includes Freedom Air.
4.2 Volatility Analysis
Using the monthly capacity data for each airline, it is possible to analyse the volatility
(or variance) of capacity on New Zealand international routes. Volatility of a time series
refers to the extent to which the series varies around some benchmark such as its
average or a trend over time.
Capacity on air routes can vary over time for many reasons, including seasonal
variability in demand, entry and exit of airlines, and strategic competitive behaviour.
Given the variety of reasons for volatility it is important to interpret any differences in
capacity volatility across airlines carefully.
The monthly capacity data and 12-month moving averages shown in Figure 9 illustrated
the relatively large fluctuations of capacity that can occur from month to month. Longer
term trends and variance around these trends can also be observed as expansion and
contraction cycles in the moving averages.
0
50,000
100,000
150,000
200,000
250,000
Seat
s p
er
mo
nth
(1
2-m
on
th m
ovi
ng
ave
rage
)

27
Much of the short-term fluctuations are due to seasonal changes in demand. Overall, we
estimate that 54% of the fluctuations in Air New Zealand’s monthly capacity around the
12-month moving average can be explained by seasonal factors. Similarly, 41% of the
fluctuations in total foreign carrier capacity around the 12-monthly moving average are
estimated to be seasonal.15
Figure 9 also showed that capacity provided by foreign airlines, and to a lesser extent
Air New Zealand, is trending upwards over time, while total capacity provided by
foreign airlines is greater than that provided by Air New Zealand. This presents two
problems for comparison of the variance of Air New Zealand’s capacity relative to the
total for foreign airlines:
1. A simple calculation of variance (or standard deviation) is based on an
assumption of variation around a constant mean level, but capacities are
generally trending upwards over time.
2. Time series with higher levels also naturally tend to have higher variance, and
this should be taken into account when comparing volatility across airlines.
To resolve these problems and facilitate meaningful comparisons, we have compared
capacity trends on the basis of normalised deviations from a given average or trend. In
particular our analysis is based on a sequence of normalised deviations calculated as:
Where is the normalised deviation at time , is the capacity observation and is
the benchmark against which deviations are being compared.
For example, if we were to benchmark against a constant average capacity then we
would calculate
Thus in this case reflects variations of capacity around its overall average level,
relative to the average.
Volatility of capacity can be analysed by looking at changes in over time and
calculation of the variance or standard deviation of . In the simple case where the
benchmark is the constant average capacity then the standard deviation of is the same
as the coefficient of variation of capacity, ie the standard deviation of capacity divided
by its average.
15 These percentages are the R-squared values obtained from regressing monthly deviations from the
12-month moving average on a set of monthly dummy variables.

28
As well as analysing capacity volatility relative to a constant average (which may be
problematic, for the reasons discussed above), we have undertaken three other
comparisons of capacity:
Monthly capacity relative to the 12-month moving average
Monthly capacity relative to a linear trend
The 12-month moving average relative to a linear trend
In each case we compare the capacity provided by Air New Zealand (including
Freedom Air during its operation) with the total capacity provided by foreign airlines.
4.2.1 Volatility relative to a constant mean
Figure 21 shows the deviation of monthly capacity provided by Air New Zealand and
all foreign carriers relative to a benchmark of a constant average for the period from
2000 to 2013. There is a clear pattern of negative deviations initially that turn positive
over time, reflecting the upwards trends in capacity noted above.
Relative to this benchmark, foreign airline capacity appears to be more volatile than Air
New Zealand’s, and the distribution of normalised deviations for foreign carriers is
more spread out, with a bimodal distribution centred around two different levels.
Figure 21 Analysis of monthly capacity deviation from a constant mean.
Monthly normalised deviation Distribution of normalised deviations
Source: Calculated from Sabre-ADI data.
4.2.2 Volatility relative to the 12-month moving average
Figure 22 shows the normalised deviation of monthly capacity relative to a benchmark
of a 12-month moving average. The moving average reflects medium-term trends but
eliminates short-term seasonal variation. The deviations in this figure thus reflect short-
term variance from the medium-term trend. Relative to this benchmark, the volatility of
foreign airline capacity appears to be similar to that of Air New Zealand. This suggests
that seasonal factors affect the airlines’ capacity choices in similar ways.
-0.4
-0.3
-0.2
-0.1
0.0
0.1
0.2
0.3
20
00
-12
00
0-9
20
01
-52
00
2-1
20
02
-9
20
03
-52
00
4-1
20
04
-92
00
5-5
20
06
-12
00
6-9
20
07
-5
20
08
-12
00
8-9
20
09
-52
01
0-1
20
10
-92
01
1-5
20
12
-1
20
12
-92
01
3-5
No
rmal
ised
Dev
iati
on
Air NZ Foreign0
5
10
15
20
25
30
35
40
45
50
55
-0.40to -0.33
-0.33to -0.26
-0.26to -0.19
-0.19to -0.12
-0.12to -0.05
-0.05to
0.02
0.02to
0.09
0.09to
0.16
0.16to
0.23
0.23to
0.30
Co
un
t
Normalised Deviation
Air NZ Foreign

29
Figure 22 Analysis of monthly capacity deviation from a 12-month moving average.
Monthly normalised deviation Distribution of normalised deviations
Source: Calculated from Sabre-ADI data.
4.2.3 Volatility relative to a linear trend
Figure 23 shows the normalised deviation of monthly capacity relative to a benchmark
of a linear trend. These trends are simple straight lines fitted to the monthly capacity
series for Air New Zealand and foreign airlines respectively. Such a trend reflects the
general increase in capacity over time, and deviations around this trend reflect a
combination of seasonal factors and medium-term cycles.
This analysis suggests some differences in the volatility of Air New Zealand’s capacity
and foreign capacity relative to the trend, with foreign capacity appearing to be
somewhat more volatile.
Figure 23 Analysis of monthly capacity deviation from a linear trend.
Monthly normalised deviation Distribution of normalised deviations
Source: Calculated from Sabre-ADI data.
4.2.4 Volatility of the 12-month moving average relative to a linear trend
As noted above, the 12-month moving averages reflect medium-term fluctuations in
capacity while smoothing out seasonal variation. The moving averages themselves are
trending upwards over time. Figure 24 shows the normalised deviation of the 12-month
moving averages from linear trends fitted to the moving averages. This reflects medium
term fluctuations in capacity around the overall trend, while smoothing out the seasonal
variations that featured in Figure 22 above.
-0.15
-0.10
-0.05
0.00
0.05
0.10
0.15
0.20
0.25
0.302
00
0-1
2
200
1-8
200
2-4
20
02
-12
200
3-8
200
4-4
20
04
-12
200
5-8
200
6-4
20
06
-12
200
7-8
200
8-4
20
08
-12
200
9-8
201
0-4
20
10
-12
201
1-8
201
2-4
20
12
-12
201
3-8
No
rmal
ise
d D
evi
atio
n
Air NZ Foreign
0
5
1015
20
25
30
35
40
45
50
55
-0.20to -0.15
-0.15to -0.10
-0.10to -0.05
-0.05to
0.00
0.00to
0.05
0.05to
0.10
0.10to
0.15
0.15to
0.20
0.20to
0.25
0.25to
0.30
Co
un
t
Normalised Deviation
Air NZ Foreign
-0.25
-0.20
-0.15
-0.10
-0.05
0.00
0.05
0.10
0.15
0.20
0.25
0.30
20
00
-12
00
0-9
20
01
-52
00
2-1
20
02
-92
00
3-5
20
04
-12
00
4-9
20
05
-52
00
6-1
20
06
-92
00
7-5
20
08
-12
00
8-9
20
09
-52
01
0-1
20
10
-92
01
1-5
20
12
-12
01
2-9
20
13
-5
No
rmal
ised
Dev
iati
on
Air NZ Foreign
05
10152025303540455055
-0.25to -0.19
-0.19to -0.13
-0.13to -0.07
-0.07to -0.01
-0.01to
0.05
0.05to
0.11
0.11to
0.17
0.17to
0.23
0.23to
0.29
0.29to
0.35
Co
un
t
Normalised Deviation
Air NZ Foreign

30
Figure 24 shows that the 12-month moving average of foreign airline capacity has
generally higher variance around its trend, compared to Air New Zealand. This analysis
also shows that in some periods, capacity of foreign carriers and Air New Zealand have
moved in the same direction, while in other periods they move in opposite directions.
This suggests that sometimes external forces (eg expansion or contraction of demand)
affect all airlines similarly, but other capacity fluctuations may be due to competitive or
strategic forces between airlines.
Overall the correlation coefficient between the Air New Zealand and total foreign
capacity is 0.39 for the deviations shown in the left side of Figure 24. This suggests that,
in terms of total capacity and in the medium term, there is substitution of capacity
between Air New Zealand and foreign carriers, and these cycles may be driven by
competition on New Zealand routes.
Figure 24 shows high positive deviations from the trend for foreign carriers between
2004 and 2007. During this period, Emirates and Pacific Blue (now Virgin Australia)
entered the New Zealand market, and Qantas/Jetstar and Singapore Airlines expanded
capacity on New Zealand routes. This period was preceded by rapid growth in
international visitors to New Zealand, averaging 7.8% per annum between 2000 and
2004, and thus the capacity expansions between 2004 and 2007 may have reflected an
expectation by airlines at the time that this growth would continue.
Figure 24 Analysis of deviations of 12-month moving average capacity from a linear trend.
Monthly normalised deviation Distribution of normalised deviations
Source: Calculated from Sabre-ADI data.
4.2.5 Volatility tests
The analysis above suggests greater volatility of foreign airline capacity compared to Air
New Zealand, with the possible exception of seasonal fluctuations represented by
variance around the 12-month moving average. Statistical significance of the difference
in volatility in each of the four cases analysed above can be tested using an F-test.
This test involves calculating the standard deviations of the normalised deviation of Air
New Zealand’s capacity and foreign capacity, taking the ratio of these standard
deviations, and comparing the result to what would be expected if the standard
deviations were equal. If the difference in standard deviations is large enough, we
conclude that they are unlikely to be the same.
-0.15
-0.10
-0.05
0.00
0.05
0.10
0.15
0.20
20
00
-12
200
1-8
200
2-4
20
02
-12
200
3-8
200
4-4
20
04
-12
200
5-8
200
6-4
20
06
-12
200
7-8
200
8-4
20
08
-12
200
9-8
201
0-4
20
10
-12
201
1-8
201
2-4
20
12
-12
201
3-8
No
rmal
ise
d D
evi
atio
n
Air NZ Foreign
05
101520253035404550556065
-0.15to -0.11
-0.11to -0.07
-0.07to -0.03
-0.03to
0.01
0.01to
0.05
0.05to
0.09
0.09to
0.13
0.13to
0.17
0.17to
0.21
0.21to
0.25
Co
un
t
Normalised Deviation
Air NZ Foreign

31
The results of such tests are shown in Table 4. For each benchmark, the F-test is testing
whether the volatility of Air New Zealand’s capacity around that benchmark is the same
as the volatility of foreign capacity around the benchmark. The p-value reflects the
probability that the volatilities are the same. A small p-value (less than say 0.05) is
interpreted as evidence that the volatilities are not the same.
Table 4 Statistical comparison of variances of the normalised deviations.
Benchmark Air NZ
std dev Foreign std dev
F-test p-value
Monthly capacity relative to constant mean
0.08 0.17 3.50 x 10⁻¹⁹
Monthly capacity relative to 12-month moving average
0.06 0.07 2.57 x 10⁻¹
Monthly capacity relative to linear trend
0.07 0.11 3.90 x 10⁻⁸
12-month moving average relative to linear trend
0.04 0.09 1.98 x 10⁻²⁰
The test results in Table 4 indicate strong evidence of differences in all cases except
where the 12-month moving average is used as the benchmark. As noted above, this
benchmark isolates seasonal variations and this test result suggests that volatility in Air
New Zealand’s capacity and foreign capacity is similar when this volatility is due to
seasonal factors. The other three tests give very strong evidence that volatility of Air
New Zealand’s capacity due to other factors aside from seasonal effects is lower than
volatility of foreign airline capacity.
4.2.6 Comparison across airlines
The analysis above focussed on comparing volatility of Air New Zealand’s capacity
with the total capacity provided by foreign airlines. Figure 25 extends this analysis to all
individual airlines in the capacity dataset, where the same four benchmarks as above
have been used to calculate the normalised deviations of capacity.
This shows that, among all airlines serving New Zealand, the volatility of Air New
Zealand’s capacity is towards the lower end of the range. However, there are some
individual foreign airlines with capacity volatility lower than or similar to that of Air
New Zealand. This suggests that Air New Zealand is not unique among the broader set
of airlines that serve New Zealand, and we should refrain from reaching conclusions
about the volatility of capacity of an individual airline solely based on whether it is
domestic or foreign owned.

32
Figure 25 Normalised deviations of capacity for all airlines.
Source: Calculated from Sabre-ADI data.
4.3 Tenure Analysis
As well as capacity volatility, the duration of time airlines serve the New Zealand
market and individual international routes is of interest. Figure 19 above showed the
entry and exit of airlines on all New Zealand routes combined. We have also calculated
the length of time that airlines served individual routes within our capacity dataset, ie
tenure by route.
In undertaking this calculation it is important to allow for the fact that some routes are
only operated on a seasonal basis. We assume that a route is ‘served’ by an airline in a
given month if:
The airline provided capacity on that route in that month and in the previous
two months (ie for three months continuously); or
The airline provided capacity on that route for three months continuously
during the previous 12 months.
For example, if an airline operated a route every year for six months of the year between
2005 and 2009 (inclusive), we would record it as continuously serving the route from
2005 to 2009, and would calculate a tenure for that airline on that route of five years.
This reflects the fact that some routes have sufficient demand for profitable operation
only during certain seasons.
Figure 26 shows the results of this analysis in terms of the distribution of route tenure
for foreign airlines and Air New Zealand. When interpreting this figure it is important
0.00 0.05 0.10 0.15 0.20 0.25 0.30 0.35 0.40 0.45 0.50 0.55 0.60 0.65
Normalised Deviation
Foreign airlines Total foreign capacity Air NZ
Monthly capacity relative to
constant mean
Monthly capacity relative to 12-month
moving average
Monthly capacity relative to
linear trend
12-month moving average relative to
linear trend

33
to remember that our capacity data covers the period from 2000 to 2013 only. Thus some
routes showing tenure of 14 years and some routes with short tenures have in fact been
operated for longer periods. Overall, we estimate average route tenure of 97 months for
Air New Zealand (median 87 months) and 70 months for foreign airlines (median 44
months). Figure 26 suggests that in aggregate, foreign airlines are more likely than Air
New Zealand to operate New Zealand routes for a short period only.
Figure 26 Distribution of tenure on international routes to New Zealand between 2000 and 2013.
Source: Calculated from Sabre-ADI data.
The above analysis compares Air New Zealand with foreign airlines as a group. Figure
27 shows average route tenure for each airline in the dataset, as well as the number of
unique New Zealand routes that each airline operated between 2000 and 2013. Several
foreign airlines have tenures similar to Air New Zealand.
However, the number of New Zealand international routes operated by each foreign
airline is substantially less than Air New Zealand. Those carriers with an average tenure
of 168 months (14 years), such as Cathay Pacific (CX) and Singapore Airlines (SQ), have
operated only one New Zealand route.
0
5
10
15
20
25
< 1
yea
r
1 -
2 y
ear
s
2 -
3 y
ear
s
3 -
4 y
ear
s
4 -
5 y
ear
s
5 -
6 y
ear
s
6 -
7 y
ear
s
7 -
8 y
ear
s
8 -
9 y
ear
s
9 -
10
ye
ars
10
- 1
1 ye
ars
11
- 1
2 ye
ars
12
- 1
3 ye
ars
13
- 1
4 ye
ars
14
ye
ars
Air NZ Foreign

34
Figure 27 Average route tenure and number of unique international routes operated by airlines serving
New Zealand between 2000 and 2013.
Source: Calculated from Sabre-ADI data.
4.4 Discussion
The preceding analysis suggests some significant differences in the characteristics of
capacity provided by Air New Zealand versus the capacity provided by foreign airlines
in total. Overall, Air New Zealand’s international capacity is less volatile and its tenure
on routes is longer than foreign airlines in aggregate.
However when examining individual airlines, there are several large foreign airlines
that appear similar to Air New Zealand in terms of capacity volatility and tenure. These
airlines serve significantly fewer routes than Air New Zealand, but on the routes they
do serve, their behaviour in terms of stability and commitment to the market appear
similar to Air New Zealand.
Therefore, if stability is a desirable characteristic, it is difficult to suggest favouring
domestic over foreign airlines. It appears that at least some foreign airlines have similar
behaviour towards the New Zealand market, in terms of the metrics considered here.
Furthermore, we are only able to compare foreign airlines against one domestic airline,
making it difficult to reach general conclusions about the appropriate policy towards
foreign carriers versus domestic.
In addition, it is not clear that capacity volatility and/or short tenure on routes are
necessarily a bad thing. There is uncertainty about the profitability of routes, and
markets work to discover new possible routes partially through a process of
experimentation. Thus when there is uncertainty about profitability, we would expect to
see a pattern of entry followed by quick exit, in some cases. This may be a sign of an
0
5
10
15
20
25
30
35
40
45
50
55
60
0
20
40
60
80
100
120
140
160
180
CX
NF
SB SQ LA
QF/
JQ AR
TN NZ
MH TG BR BI
GA EK
DJ/
VA FJ KE
PH CZ CI
UA
OZ
D7
WR
HA
CA YE
Nu
mb
er
of
Un
iqu
e R
ou
tes
Op
era
ted
Ave
rage
Te
nu
re (
mo
nth
s)
Average Tenure (left)
Number of Unique Routes (right)

35
efficient market discovering where value lies and responding to changes in costs,
demand and technology, rather than a problem that needs to be solved.
It follows that there may be risks associated with limiting the ability of foreign carriers
to experiment with New Zealand routes. This could hamper the process of discovering
new profitable routes and new travel markets, leading to reduced competition and
diminishing the benefits from liberalisation.
36
5 Concluding Remarks
The analysis in this report has examined the general effects of New Zealand’s
liberalisation of air services since the mid-1990s. In our view, the following general
conclusions are supported by the analysis:
The effects of air services liberalisation are broad and appear to be dispersed.
While it is difficult to separate these effects from other concurrent changes, there
appear to be empirical relationships of varying strengths between liberalisation
and international visitor arrivals, outbound travel by New Zealanders,
outbound travel prices, and imports and exports by air.
The effects of liberalisation on visitor arrivals to New Zealand are most apparent
in terms of indirect travel to New Zealand. Facilitating point-to-point travel
appears to be less important than stimulating competition on fifth- or seventh-
freedom routes, and removing restrictions on capacity.
This suggests that future priorities for negotiating or re-negotiating ASAs
should focus on cases where indirect travel is significant, or has the potential to
become significant. This is reflected in New Zealand’s current international air
transport policy, which emphasises connectivity.
Foreign airlines in aggregate have different characteristics compared to Air New
Zealand in terms of capacity and route tenure. However some individual
airlines appear to behave similarly, and capacity volatility and short route
tenure are not necessarily a bad thing. The risks of limiting innovation and route
discovery may outweigh risks associated with capacity volatility.

37
References
Ministry of Transport (2012). International air transport policy. Available at
http://www.transport.govt.nz/ourwork/air/Documents/International%20Air%20Transpo
rt%20Policy%20Review%20Discussion%20Document.pdf.
Piermartini, R. & L. Rousová (2008). Liberalisation of air transport services and
passenger traffic. WTO Staff Working Paper, ERSD-2008-06.
World Trade Organisation (WTO) (2006). Second review of the air transport annex:
Developments in the air transport sector (part two): Quantitative air services agreements
review (QUASAR), Volumes I and II Note by the Secretariat, document
S/C/W/270/Add.1

38
Appendix 1: Calculation of ALIs
The table below summarises the changes to New Zealand’s ASAs with the four case study countries used to calculate ALIs for the analysis in
section 0. The information in this table was provided by the Ministry of Transport.
After 1992
agreement
After 1996
SAM
agreement
After 2000
open skies
agreement
After 1988
amend.
After 1997
open skies
After 2000
MALIAT
After 1993
ASA
After 1998
Agreed
Minute
After 2000
Agreed
Minute
After 2004
MOU
After 2012
MOU
After 1989
MOU
After 1996
MOU
After 1997
ASA
After 2000
MALIAT
After 2001
MALIAT
Protocol
Fifth freedom 6 1 1 1 1 1 1 1 1 1 1 1 1 1 1 1 1
Seventh freedom 6 1
Cabotage 6 1 1 1
Predetermination 0
Other restrictive 2
Bermuda I 4
Other liberal 6 1 1 1 1 1 1 1
Free determination 8 1 1 1 1 1 1 1 1 1
Dual approval 0
Country of origin 3
Dual disapproval 6 1 1 1 1 1 1
Zone pricing 8
Free pricing 8 1 1 1 1 1 1 1 1 1 1
Substantial ownership & effective control 0 1 1 1 1 1 1 1 1 1 1
Community of interest 4
Principal place of business 8 1 1 1 1 1 1
Single designation 0 1 1 1
Multiple designation 4 1 1 1 1 1 1 1 1 1 1 1 1 1
Exchange of statistics 0
No exchange of statistics 1 1 1 1 1 1 1 1 1 1 1 1 1 1 1 1 1
Not allowed 0 1 1 1
Regular code-sharing allowed 2 1 1 1 1
Regular & third-country code-sharing allowed 3 1 1 1 1 1 1 1 1 1
23 35 44 29 30 38 19 21 21 26 28 23 38 38 38 50
Weight
AUSTRALIA USA CHINA SINGAPORE
TOTAL
Grant of rights
Capacity
Tariffs
Withholding
Designation
Statistics
Cooperative arrangements

39
Appendix 2: Regression Results The following tables show the regression model results. The natural logarithm of all variables except the time trends was used to estimate the
models. This is common practice in time series modelling where variables that trend upwards over time also tend to exhibit increasing variance.
Statistical significance is indicated by *** for significance at the 1% level, ** for the 5% level and * for the 10% level. Standard errors are given
underneath each estimated coefficient. In models where multiple ALIs were used, additional models were also estimated to test the significance of
each ALI individually.
International visitor arrivals models
Structural models
Australia US (1) US (2) US (3) UK (1) UK (2) UK (3) UK (4) China (1) China (2) China (3) China (4) Singapore Germany
Foreign GDP ***2.02 1.20 1.21 0.39 0.82 1.32 **1.75 ***2.06 ***1.51 ***2.00 ***1.60 ***1.58 0.42 **2.23
0.42 0.98 1.02 0.42 0.83 0.85 0.86 0.75 0.40 0.48 0.36 0.34 0.29 0.99
Exchange rate -0.39 -0.27 -0.30 -0.04 0.14 0.02 -0.09 -0.14 0.29 0.21 0.29 0.27 -0.37 -0.42
0.48 0.28 0.30 0.22 0.25 0.22 0.23 0.21 0.43 0.52 0.55 0.42 0.38 0.28
AU ALI -0.04 -0.14 -0.13 0.24 0.19 0.44 *0.97
0.43 0.65 0.39 0.38 0.19 0.47 0.53
US ALI 0.03 0.32 0.17 0.36
0.86 0.91 0.49 1.16
CN ALI 0.09 -0.16
1.09 1.22
SG ALI -0.12 0.05 *0.60 ***0.84 0.15 -0.08
0.26 0.17 0.37 0.33 0.33 0.33
SEP 11 dummy -0.07 -0.07 -0.03
0.16 0.16 0.15
Constant ***-14.65 -7.07 -7.20 4.62 -0.37 -7.18 -13.85 *-17.19 ***-18.86 ***-22.27 ***-19.77 ***-19.08 *4.64 *21.69
4.30 15.47 15.55 4.19 11.26 11.78 10.67 10.42 4.82 7.28 5.22 5.18 2.51 13.42
AR(1) 0.44 ***0.84 ***0.84 ***0.73 ***1.69 ***1.49 ***1.33 ***1.34 ***0.44 ***0.87 ***0.78 ***0.80 **0.60 ***0.77
0.37 0.22 0.22 0.21 0.21 0.39 0.46 0.51 0.20 0.17 0.22 0.19 0.29 0.19
AR(2) ***-0.76 -0.58 -0.41 -0.43
0.21 0.41 0.52 0.50
R-squared 0.99 0.92 0.92 0.85 0.97 0.97 0.98 0.97 0.98 0.97 0.97 0.98 0.80 0.85
Observations 21 21 21 25 21 21 25 24 18 18 18 18 22 24
ALI F-test p-val n.a. 0.95 n.a. n.a. 0.41 n.a. n.a. n.a. 0.01 n.a. n.a. n.a. n.a. n.a.

40
Trend models (individual countries)
Australia US (1) US (2) US (3) UK (1) UK (2) UK (3) UK (4) China (1) China (2) China (3) China (4) Singapore Germany
Time trend ***0.06 0.01 0.00 0.02 ***0.08 ***0.09 ***0.08 ***0.09 ***0.15 ***0.20 ***0.17 ***0.16 **0.03 ***0.19
0.01 0.02 0.01 0.01 0.01 0.01 0.00 0.01 0.03 0.03 0.37 0.03 0.02 0.01
Constant break ***4.28 ***4.47 ***4.17 ***4.38
***2.42
0.30 0.27 0.22 0.27
0.18
Trend break ***-0.15 ***-0.16 ***-0.15 ***-0.16
***-0.17
0.01 0.01 0.01 0.01
0.01
AU ALI 0.07 0.37 0.01 -0.04 0.00 0.46 0.89
0.16 1.19 0.14 0.19 0.09 0.71 0.87
US ALI -0.07 0.47 0.32 ***0.38
0.53 0.87 0.19 0.13
CN ALI 0.07 -0.22
0.86 0.91
SG ALI 0.01 0.02 0.65 *0.86 0.07 ***-0.27
0.17 0.08 0.57 0.45 0.29 0.09
Constant ***11.65 ***10.67 ***10.33 ***11.63 ***9.33 ***10.18 ***9.10 ***10.20 2.72 **6.30 3.29 ***3.42 ***9.17 ***8.81
0.36 3.21 2.85 0.48 0.57 0.22 0.39 0.19 2.74 2.58 2.34 1.26 0.81 0.34
AR(1) 0.51 ***0.87 ***0.77 ***0.88
***0.65 ***0.85 ***0.75 ***0.72 ***0.78
0.36 0.18 0.22 0.15
0.27 0.14 0.19 0.21 0.16
R-squared 0.99 0.86 0.85 0.85 0.99 0.99 0.99 0.99 0.98 0.97 0.98 0.99 0.86 0.96
Observations 21 21 25 21 21 21 25 24 20 20 21 24 22 24
ALI F-test p-val n.a. 0.95 n.a. n.a. 0.38 n.a. n.a. n.a. 0.03 n.a. n.a. n.a. n.a. n.a.

41
Trend models (origin regions)
Asia (1) Asia (2) Asia (3) Asia (4)
Europe (1)
Europe (2)
Europe (3)
Europe (4)
Total (1) Total (2) Total (3) Total (4) Total (5)
Time trend 0.13 0.15 0.17 ***0.15 ***0.07 ***0.08 ***0.09 ***0.08 **0.02 ***0.04 ***0.04 ***0.04 ***0.04
0.15 0.17 0.12 0.04 0.01 0.01 0.01 0.00 0.01 0.00 0.01 0.01 0.01
Constant break 2.08 2.40 2.75 ***2.51 ***2.92 ***3.11 ***3.35 ***3.03
2.65 3.01 1.97 0.79 0.28 0.27 0.26 0.28
Trend break -0.12 -0.15 -0.16 ***0.15 ***-0.11 ***-0.11 ***-0.12 ***-0.11
0.15 0.18 0.11 0.05 0.01 0.01 0.01 0.01
AU ALI 0.11 0.03 -0.12 -0.14 -0.19 *0.20
2.40 0.58 0.18 0.09 0.14 0.11
US ALI *0.37 -0.03 ***0.57 0.18
0.18 0.16 0.20 0.35
CN ALI -0.06 -0.09 0.38 0.16
0.56 0.54 0.26 0.17
SG ALI 0.02 0.06 -0.06 ***-0.22 ***0.35 0.10
1.95 0.40 0.16 0.08 0.09 0.21
Constant ***10.46 ***10.65 ***9.97 ***10.13 ***10.55 ***11.55 ***11.65 ***11.20 ***10.29
***12.99 ***12.71 ***12.98
2.81 3.24 1.51 1.21 0.51 0.22 0.18 0.51 0.78
0.57 1.15 0.40
AR(1) 0.41 0.45 0.44 0.44
*0.55 ***1.23 ***1.14 ***1.11 ***1.25
0.61 0.56 0.52 0.49
0.29 0.30 0.28 0.24 0.27
AR(2) **-0.61 **-0.57 -0.33 -0.26 *-0.45
0.30 0.25 0.24 0.24 0.26
R-squared 0.58 0.58 0.76 0.93 0.99 0.99 0.99 0.99 0.98 0.98 0.98 0.99 0.97
Observations 20 20 21 24 21 21 24 25 20 21 24 25 20
ALI F-test p-val 0.99 n.a. n.a. n.a. 0.06 n.a. n.a. n.a. 0.00 n.a. n.a. n.a. n.a.

42
NZ Resident Departure Models
Structural models
Departures (1)
Departures (2)
Departures (3)
Departures (4)
Departures (5)
Departures (6)
NZ GDP ***0.96 ***1.37 ***1.91 ***1.14 ***1.61 **0.73
0.18 0.35 0.20 0.22 0.27 0.29
Fuel price 0.05 0.04 -0.02 0.05 0.00 0.03
0.04 0.06 0.05 0.06 0.06 0.05
TWI **0.25 0.38 0.11 0.28 0.22 ***0.35
0.09 0.24 0.21 0.18 0.18 0.10
AU ALI ***0.50 0.18 **0.28
0.13 0.16 0.11
US ALI **-0.40 -0.12
0.15 0.23
CN ALI ***0.69 ***0.59 ***0.73
0.14 0.22 0.19
SG ALI -0.15 0.12
0.12 0.12
Constant -0.22 -4.16 ***8.02 -2.32 **-5.91 0.82
1.48 2.80 1.11 1.79 2.35 2.41
AR(1) 0.23 0.26 **0.58 *0.35 *0.52
0.25 0.23 0.27 0.22 0.27
R-squared 0.99 0.99 0.99 0.99 0.99 0.99
Observations 20 21 25 20 24 20
ALI F-test p-val 0.00 n.a. n.a. n.a. n.a. 0.00

43
Trend models
Departures (1)
Departures (2)
Departures (3)
Departures (4)
Departures (5)
Trend ***0.03 ***0.04 ***0.05 ***0.04 ***0.04
0.01 0.01 0.01 0.01 0.01
AU ALI 0.24 *0.28
0.21 0.17
US ALI 0.03 0.22
0.34 0.47
CN ALI ***0.63 ***0.66
0.19 0.24
SG ALI 0.00 **0.20
0.12 0.10
Constant ***10.52 ***12.05 ***12.26 ***11.16 ***12.33
0.96 0.49 1.48 0.61 0.27
AR(1) ***0.91 ***0.61 ***0.63 ***0.66 ***0.52
0.29 0.19 0.21 0.25 0.18
AR(2) **-0.52
0.26
R-squared 0.99 0.98 0.98 0.98 0.98
Observations 20 21 25 20 24
ALI F-test p-val 0.00 n.a. n.a. n.a. n.a.

44
Trade Models
Structural models
Exports (1)
Exports (2)
Exports (3)
Exports (4)
Exports (5)
Imports (1)
Imports (2)
Imports (3)
Imports (4)
Imports (5)
OECD GDP **2.22 **1.47 ***2.86 **1.54 ***2.61
0.88 0.69 0.27 0.76 0.36
NZ GDP ***1.36 ***1.41 ***1.82 ***0.88 ***2.35
0.40 0.29 0.49 0.23 0.34
Oil price -0.09 -0.08 ***-0.26 -0.06 **-0.24 -0.05 -0.10 -0.06 0.00 ***-0.29
0.12 0.13 0.09 0.12 0.10 0.08 0.07 0.16 0.08 0.07
Terms of trade 0.51 0.59 -0.58 0.45 -0.16 0.39 0.49 -0.12 0.41 -0.02
0.89 1.00 0.54 0.77 0.56 0.35 0.33 0.49 0.26 0.38
AU ALI 0.30 -0.04 0.48 -0.07
0.40 0.15 0.29 0.16
US ALI -0.06 -0.36 -0.37 -0.27
0.58 0.34 0.25 0.56
CN ALI -0.36 -0.10 0.24 0.27
0.26 0.61 0.29 0.45
SG ALI -0.43 -0.10 *-0.47 -0.23
0.33 0.12 0.23 0.17
Constant **-24.24 **-13.68 ***-27.88 -13.72 ***-27.23 -1.95 -3.40 -3.44 1.85 **-9.57
9.65 6.64 4.33 9.24 4.96 3.77 2.59 7.28 1.64 4.10
AR (1) 0.40 0.37 0.47 **0.60 **0.71 0.15
0.37 0.43 0.42 0.23 0.31 0.29
AR (2) ***-0.74
0.18
AR (4) ***-0.87 -0.76
0.19 0.56
R-squared 0.96 0.95 0.97 0.91 0.96 0.97 0.96 0.96 0.95 0.96
Observations 20 21 25 20 24 20 21 25 20 24
ALI F-test p-val 0.37 n.a. n.a. n.a. n.a. 0.22 n.a. n.a. n.a. n.a.

45
Trend models
Exports (1)
Exports (2)
Exports (3)
Exports (4)
Exports (5)
Imports (1)
Imports (2)
Imports (3)
Imports (4)
Imports (5)
Trend **0.03 ***0.02 ***0.05 ***0.04 ***0.05 **0.02 ***0.03 ***0.04 ***0.03 ***0.04
0.01 0.00 0.01 0.01 0.01 0.01 0.00 0.01 0.01 0.01
AU ALI 0.33 **0.31 *0.57 *0.25
0.40 0.11 0.30 0.14
US ALI -0.09 -0.11 -0.37 -0.13
0.34 0.89 0.26 0.52
CN ALI -0.15 -0.27 *0.53 0.25
0.35 0.35 0.27 0.32
SG ALI -0.04 -0.05 -0.26 -0.09
0.32 0.20 0.24 0.16
Constant ***14.77 ***13.98 ***14.92 ***15.69 ***14.82 ***14.00 ***14.41 ***15.51 ***14.52 ***15.39
1.28 0.34 2.99 0.98 0.61 0.97 0.41 1.71 0.90 0.52
AR (1) ***0.88 *0.53 ***0.86 *0.69 ***0.76 *0.44 ***0.79
0.13 0.30 0.16 0.41 0.18 0.25 0.19
AR (2) ***-0.69
0.23
R-squared 0.89 0.91 0.96 0.89 0.95 0.95 0.94 0.96 0.93 0.96
Observations 20 21 25 20 24 20 21 25 20 24
ALI F-test p-val 0.29 n.a. n.a. n.a. n.a. 0.12 n.a. n.a. n.a. n.a.

46
New Zealand Real GDP Models
Trend models
GDP (1) GDP (2) GDP (3) GDP (4) GDP (5)
Trend ***0.03 ***0.03 ***0.03 ***0.03 ***0.03
0.01 0.00 0.00 0.00 0.00
AU ALI -0.05 0.05
0.10 0.03
US ALI 0.26 **0.19
0.18 0.09
CN ALI -0.01 -0.01
0.15 0.10
SG ALI 0.04 -0.02
0.08 0.05
Constant ***10.10 ***10.77 ***10.32 ***10.88 ***10.98
0.65 0.10 0.30 0.26 0.15
AR(1) ***1.50 ***1.22 ***1.44 ***1.39 ***1.38
0.21 0.33 0.13 0.41 0.25
AR(2) ***-0.87 -0.52 ***-0.79 *-0.61 ***-0.67
0.22 0.37 0.16 0.35 0.25
R-squared 0.99 0.99 0.99 0.99 0.99
Observations 20 21 25 20 24
ALI F-test p-val 0.53 n.a. n.a. n.a. n.a.
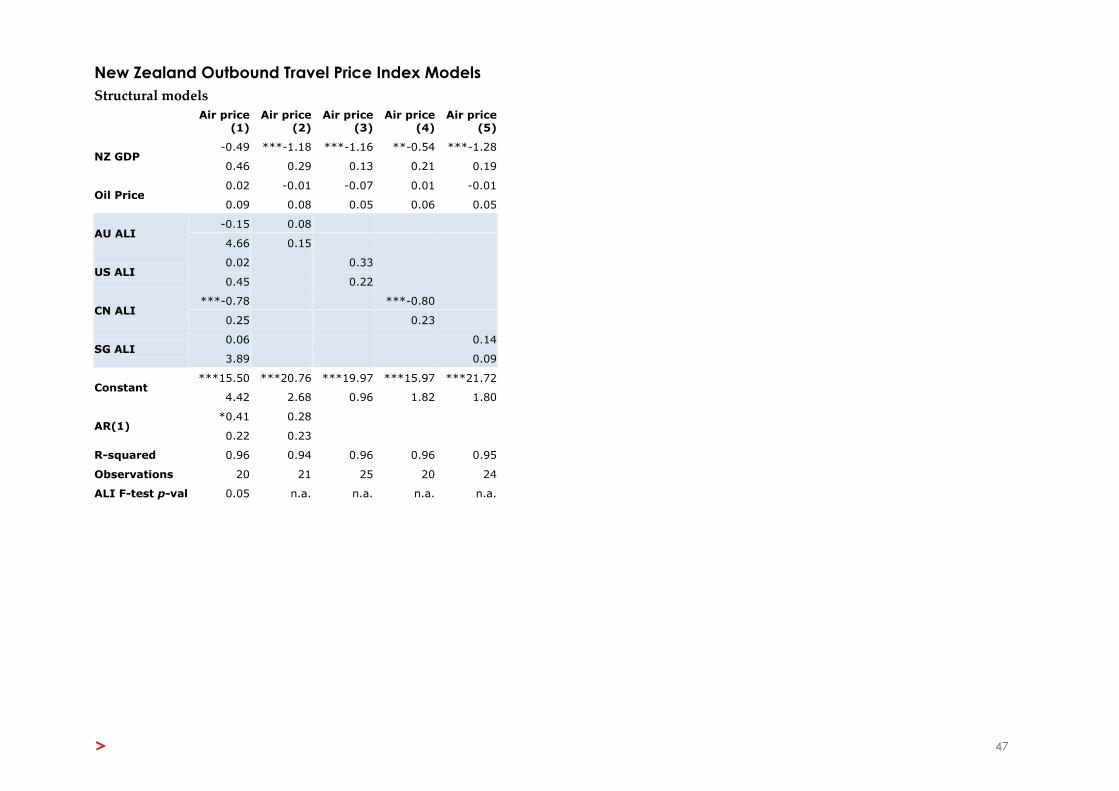
47
New Zealand Outbound Travel Price Index Models
Structural models
Air price (1)
Air price (2)
Air price (3)
Air price (4)
Air price (5)
NZ GDP -0.49 ***-1.18 ***-1.16 **-0.54 ***-1.28
0.46 0.29 0.13 0.21 0.19
Oil Price 0.02 -0.01 -0.07 0.01 -0.01
0.09 0.08 0.05 0.06 0.05
AU ALI -0.15 0.08
4.66 0.15
US ALI 0.02 0.33
0.45 0.22
CN ALI ***-0.78 ***-0.80
0.25 0.23
SG ALI 0.06 0.14
3.89 0.09
Constant ***15.50 ***20.76 ***19.97 ***15.97 ***21.72
4.42 2.68 0.96 1.82 1.80
AR(1) *0.41 0.28
0.22 0.23
R-squared 0.96 0.94 0.96 0.96 0.95
Observations 20 21 25 20 24
ALI F-test p-val 0.05 n.a. n.a. n.a. n.a.

48
Trend models
Air price (1)
Air price (2)
Air price (3)
Air price (4)
Air price (5)
Trend ***-0.02 ***-0.04 ***-0.03 ***-0.02 ***-0.03
0.01 0.00 0.00 0.00 0.00
AU ALI -0.17 0.03
0.20 0.07
US ALI 0.16 -0.08
0.17 0.27
CN ALI ***-0.62 ***-0.59
0.17 0.16
SG ALI 0.11 0.04
0.16 0.07
Constant ***9.28 ***7.92 ***8.20 ***9.56 ***7.85
0.60 0.20 0.86 0.42 0.18
AR(1) *0.41
0.24
R-squared 0.98 0.96 0.97 0.98 0.96
Observations 20 21 25 20 24
ALI F-test p-val 0.04 n.a. n.a. n.a. n.a.