Business Process Management of Telecommunication Companies ...

EXTENSION CENTER FOR COMMUNITY VITALITY
Economic Contribution of Telecommunication Companies Serving Greater Minnesota
A REPORT OF THE ECONOMIC IMPACT ANALYSIS PROGRAM UNIVERSITY OF MINNESOTA EXTENSION
Brigid Tuck, Bruce Schwartau, and Ryan Pesch


ECONOMIC CONTRIBUTION OF TELECOMMUNICATION COMPANIES SERVING GREATER MINNESOTA 1
Report Reviewers: Matt Kane, Program Leader, Extension Center for Community Vitality, University of Minnesota William Lazarus, Professor, Department of Applied Economics, University of Minnesota Hans Muessig, Program Director, Minnesota Intelligent Rural Communities program, University of Minnesota George Morse, Professor Emeritus, Department of Applied Economics, University of Minnesota David Nelson, Extension Educator Emeritus, Extension Center for Community Vitality, University of Minnesota Bruce Sorte, Community Economist, Extension Service/Department of Agriculture and Resource Economics, Oregon State University Partners/Sponsors: Center for Rural Policy and Development Minnesota Telecommunications Alliance
Economic Contribution of Telecommunication Companies Serving Greater Minnesota A REPORT OF THE ECONOMIC IMPACT ANALYSIS PROGRAM UNIVERSITY OF MINNESOTA EXTENSION February 2012 Brigid Tuck, Analyst/Writer, University of Minnesota Bruce Schwartau, Extension Educator, University of Minnesota Ryan Pesch, Extension Educator, University of Minnesota
© 2012 Regents of the University of Minnesota. All rights reserved. University of Minnesota Extension is an equal opportunity educator and employer. In accordance with the Americans with Disabilities Act, this material is available in alternative formats upon request. Direct requests to the Extension Store at 800-876-8636. Printed on recycled and recyclable paper with at least 10 percent postconsumer waste material.

ECONOMIC CONTRIBUTION OF TELECOMMUNICATION COMPANIES SERVING GREATER MINNESOTA 2
Table of Contents 1. HIGHLIGHTS 3 2. BACKGROUND OF STUDY 4 3. PROFILE OF THE STUDY AREA ECONOMY 5 4. ECONOMIC CONTRIBUTION 7 Direct Effect 7 Indirect and Induced Effect 8 Total Effect 8 Top Industries Effected 10 5. TAXES 12 6. NOTES ON THE ANALYSIS 13 7. CONCLUSIONS 14 8. APPENDIX 1: METHODOLOGY 15 9. APPENDIX 2: SURVEY 17

ECONOMIC CONTRIBUTION OF TELECOMMUNICATION COMPANIES SERVING GREATER MINNESOTA 3
“The Economic Contribution of Telecommunication Companies Serving Greater Minnesota”: Summary
The following is a summary of the results of a recent University of Minnesota
Extension study titled “The Economic Contribution of Telecommunication Companies
Serving Greater Minnesota.”
Total effects: The total economic contribution of the telecommunications industry
serving Greater Minnesota in 2011 was an estimated $1.3 billion. To create this
output, businesses employed an estimated 10,300 workers and paid $600 million
in labor income. These estimates include the output and employment of
telecommunication companies (direct effects), as well as a measure of increased
economic activity in industries supporting telecommunication companies (indirect
effects) and their employees (induced effects).
Direct effects: The industry itself directly made an estimated $870 million worth
of expenditures in 2011, including operations, wages and salaries, and capital
improvements. These expenditures included an estimated $370 million in
payments to labor. The telecommunications industry serving Greater Minnesota
employed an estimated 4,500 individuals.
Indirect effects: Telecommunication companies serving Greater Minnesota have
ties to their suppliers, many of whom are also located in Greater Minnesota.
Suppliers to the telecommunications industry directly employed an estimated 600
people in order to provide goods and services. These suppliers include cable
programming, accounting services, motion picture and video services, engineering
firms, printers and publishers, and advertisers.
Indirect and induced effects: Overall, the telecommunications industry had the
highest spin-off effects in construction, restaurant, health care, housing,
wholesale trade, and retail industries.
While taxes are not considered in the economic contribution study,
telecommunication companies paid an estimated $30 million in property, sales,
and income taxes in 2011.
There are 48 telecommunication holding companies serving customers in Greater
Minnesota. Sixteen responded to a confidential survey regarding their
employment and expenses.
This analysis focuses on telecommunication companies (specifically, local
exchange carriers) with customers in Greater Minnesota. See the full report for
further definition and clarification. Telecommunication services are primary
inputs for many businesses. This study does not attempt to measure the value of
these services to Greater Minnesota’s economy.

ECONOMIC CONTRIBUTION OF TELECOMMUNICATION COMPANIES SERVING GREATER MINNESOTA 4
Background of the Study
Residents of Greater Minnesota
receive telecommunications services -- voice,
FAX, and data including Internet -- from a
variety of providers. There are over 80
telecommunications providers in the state and
they vary in size and geographical service area
from small companies serving a single
community to companies serving a county,
multiple counties in a region, to multi-state,
national, or multi-national telecommunication
corporations.
Depending on where you live in Greater
Minnesota you might be served by a locally-
owned municipal telephone company, a private
for-profit company that serves a single
community or a larger region, a cooperative
company, or a large corporation. All of these
entities provide local telephone service, as well
as other services, and are defined as "local
exchange carriers" or LECs. Many LECs have
operated in and serviced their areas for
generations.
The telecommunications industry is undergoing
rapid change and evolution. As consumers
continue to improve and upgrade their personal
technology, telecommunication companies
must adapt, grow, and change. Additional
pressures arising from changes in legislation
and regulation are also challenging
telecommunication companies in Minnesota.
In light of these challenges, the Minnesota
Telecommunications Alliance (MTA) posed the
question “What is the economic contribution of
telecommunication companies serving Greater
Minnesota?” To answer this question, they
asked for assistance from the Center for Rural
Policy and Development (Center). Together,
MTA and the Center engaged University of
Minnesota Extension’s Economic Impact
Analysis program.
The Economic Impact Analysis program has two
deliverables: a written report summarizing the
study and a facilitated presentation of the
results. This report is the first deliverable of
the program.
To address the question at hand, this study
focuses on the economic contribution of
telecommunication companies with customers
in Greater Minnesota. When most people think
of telephone and telecommunications services,
they naturally include Internet, traditional long-
distance, and cellular services. This report is
focused on those local exchange carriers (LECs)
operating in Greater Minnesota whose
traditional telecommunications role has been,
and is to, provide local service. They may also
offer -- on their own or through resale
arrangements -- those other services we all
include as telecommunications services:
Internet, long-distance, and wireless services.
This report does not include wireless providers
such as T-Mobile and Sprint or national or
multi-national inter-exchange carriers (IXCs)
such as CenturyLink, Verizon, or AT&T (except
in those situations where a subsidiary provides
local exchange services as CenturyLink does in
many portions of the state.)

ECONOMIC CONTRIBUTION OF TELECOMMUNICATION COMPANIES SERVING GREATER MINNESOTA 5
Profile of the Study Area Economy
The study area for this analysis is Greater
Minnesota. Greater Minnesota is defined as the
80 counties not included in the seven-county
Twin Cities metropolitan area.1 The
telecommunications industry contributes to
Greater Minnesota’s $172 billion economy. In
2010, there were 1.3 million jobs located in
Greater Minnesota, paying $53 billion in labor
income. Chart 1 depicts total output by
industry category. The services and
manufacturing industries in Greater Minnesota
generated nearly two-thirds of output in the
region in 2010. In the database used for this
analysis, output is defined as the total value of
industry sales. Service sectors with high output
in the region include: professional services and
information, finance, insurance, and real estate.
1 The seven-county Twin Cities metropolitan area includes
Anoka, Carver, Dakota, Hennepin, Ramsey, Scott, and Washington counties.
Telecommunication companies are classified in
the information industry.
Employment by industry category is shown in
chart 2. The services industry has the largest
share of employees in Minnesota (44 percent).
Government and trade have the second and
third largest shares respectively. The health
and human services sector has the largest
single share of service employment.
While manufacturing creates 30 percent of
output, it only employs 10 percent of workers.
There are two possible reasons for this fact.
One, in the database, one job is one job
regardless of its status as part-time, full-time,
or seasonal. Since the service sector tends to
employ more part-time employees and the
Agriculture, Forestry and Fishing
7% Mining 2% Utilities
2%
Construction 5%
Manufacturing 28%
Wholesale Trade 4% Retail Trade
4%
Transportation and Wholesale
3%
Government 7%
Information, Finance, Insurance and Real Estate
12%
Professional Services 12%
Educational Services 8%
Health and Social Services 3%
Accomodation and Food Services
3%
Chart 1: Output (Sales) in Greater Minnesota 2010
Data from
IMPLAN (MIG)

ECONOMIC CONTRIBUTION OF TELECOMMUNICATION COMPANIES SERVING GREATER MINNESOTA 6
manufacturing sector more full-time,
manufacturing’s share of employment may
appear lower. Second, manufacturing tends to
have higher dollar-volume-productivity per
worker.
Agriculture, Forestry and Fishing
7% Mining 0% Utilities
1%
Construction 6%
Manufacturing 10%
Wholesale Trade 3%
Retail Trade 11%
Transportation and Wholesale
3% Government 15%
Information, Finance, Insurance and Real
Estate 7%
Professional Services 6%
Educational Services 2%
Health and Social Services
16%
Accomodation and Food Services
6%
Other Services 7%
Chart 2: Employment in Greater Minnesota 2010
Data from IMPLAN (MIG)
ECONOMIC CONTRIBUTION OF TELECOMMUNICATION COMPANIES SERVING GREATER MINNESOTA 7
Economic Contribution
Total economic contribution is equal to the
summation of direct, indirect, and induced
effects. In terms of the telecommunications
industry, direct effect is equal to expenditures
by telecommunication firms to operate. The
direct effect initiates additional economic
activity to occur, therefore setting off a ripple
in the local economy. These ripples fall into
two categories, indirect effects, created by
business-to-business transactions, and induced
effects, created by consumer-to-business
transactions. In an economic contribution
analysis, researchers quantify the direct effects.
An input-output model then measures the
indirect and induced effects. In this study,
researchers verified the ground-truth of the
data by collecting primary data on the direct
effect. The input-output model used was
IMPLAN (MIG, Inc).
DIRECT EFFECT
The direct effect of the telecommunications
industry is derived from spending by the
telecommunications industry itself.
Expenditures for the industry can be divided
into two main categories: operations and capital
improvements. Within operations,
telecommunication businesses make
expenditures for labor and for inputs (goods
and services).
In order to determine the direct contribution of
the industry, all MTA members were sent an
invitation to participate in an online survey.
The survey asked telecommunication
companies to report their operations and
capital improvement expenditures for the most
recently completed fiscal year. Respondents
also reported on the percentage of those
expenditures that were made within Minnesota.
A copy of the survey is in appendix 2.
There are 48 telecommunication holding
companies in Minnesota, representing roughly
80 operating companies. Holding companies
were more likely to respond to the survey. The
survey resulted in 16 completed, useable
responses, for a response rate of 30 percent.
This response rate is lower than ideal and
introduces the possibility of non-response
error. Non-response error presents a problem
when the respondents do not adequately
represent the entire population. To guard
against non-response error, the researchers
looked critically at the respondents.
Respondents covered a considerable amount of
territory in Minnesota, representing most of the
state. Respondents also varied in size, ranging
from companies with thousands of customers
to those with a few hundred. Survey
respondents provide services to 44 percent of
the counties covered in this study. Although
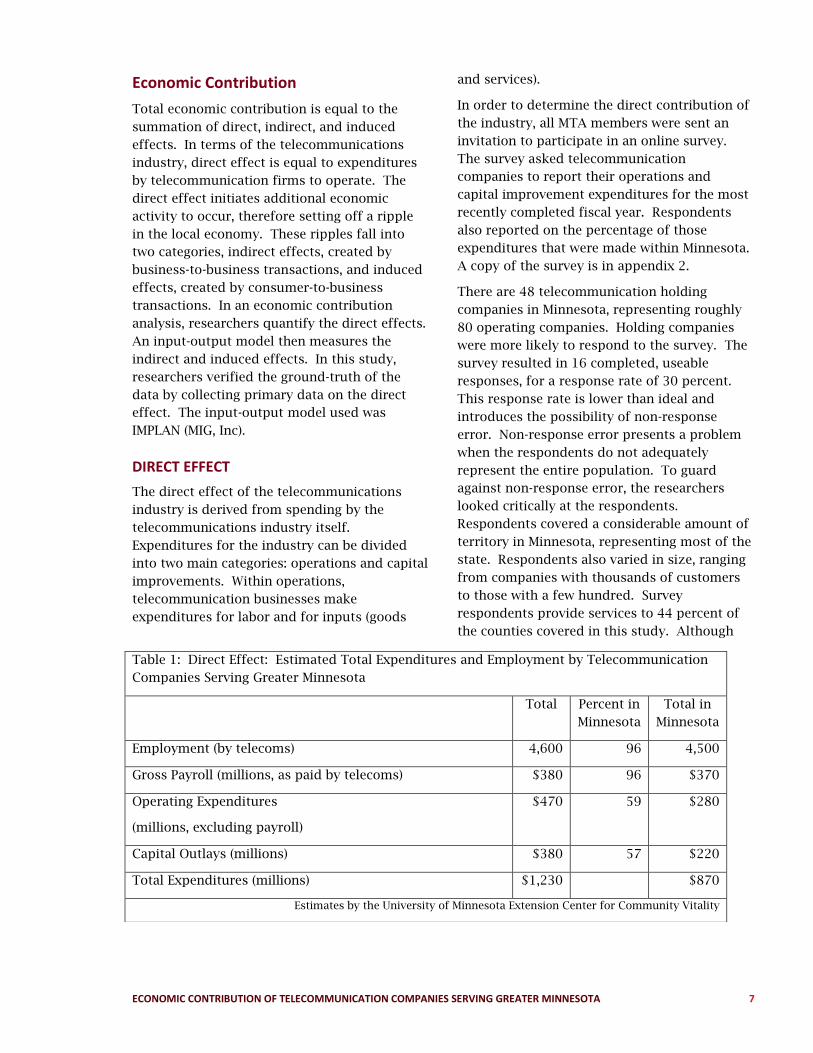
Table 1: Direct Effect: Estimated Total Expenditures and Employment by Telecommunication
Companies Serving Greater Minnesota
Total Percent in
Minnesota
Total in
Minnesota
Employment (by telecoms) 4,600 96 4,500
Gross Payroll (millions, as paid by telecoms) $380 96 $370
Operating Expenditures
(millions, excluding payroll)
$470 59 $280
Capital Outlays (millions) $380 57 $220
Total Expenditures (millions) $1,230 $870
Estimates by the University of Minnesota Extension Center for Community Vitality

ECONOMIC CONTRIBUTION OF TELECOMMUNICATION COMPANIES SERVING GREATER MINNESOTA 8
data does not exist to allow for direct
verification of consistency, researchers were
satisfied that the respondents do represent the
industry adequately enough to proceed with the
analysis; however, the possibility of non-
response error does exist and should be
considered in the interpretation of the results.
The survey results were analyzed and an
average per telecommunication firm was
calculated. Several outliers were identified in
the analysis. In a couple of cases, it was
determined the entire response was an outlier
due to the sheer size of the company. In those
cases, the responses were used to calculate the
total economic effect, but not the average per
firm. In other cases, individual responses were
found to be outliers. These were dropped from
the analysis and the calculation of averages.
On average, the businesses surveyed serviced
7,000 residential customers and 2,000 business
customers (excludes outliers as outlined above).
They employed, on average, 30 people and paid
$2.6 million in gross payroll. The vast majority
of their employees, 96 percent, are residents of
the state of Minnesota and 92 percent of their
employees live within the service area of the
telecom. On average, the telecommunication
companies surveyed spent $6.8 million on
operating expenses. Nearly 60 percent of those
expenditures were spent within Minnesota on
items that include fuel, leases, cable, electricity,
transportation, fiber, supplies, advertising, and
maintenance. On average, the
telecommunication companies spent $3.0
million on capital outlays, the majority of this
($2.6 million) on broadband expansion and
improvements.
Table 1 shows the estimated direct effect, as
entered into the model. The third column (total
in Minnesota) constitutes the direct effect. This
represents the estimated total amount of
spending by telecommunication companies in
Minnesota.
INDIRECT AND INDUCED EFFECT
Now that the estimated direct effects are
quantified, the data can be entered into an
input-output model. Input-output models trace
the flow of dollars throughout a local economy
and can capture the indirect and induced, or
ripple effects, of an economic activity.
Indirect effects are those associated with a
change in economic activity due to spending for
goods and services directly tied to the industry.
In this case, these are the changes in the local
economy occurring because telecommunication
companies need to purchase materials (fuel,
office supplies, and electricity, for example) and
related services (engineering, law, and
advertising, for example). These are business-
to-business effects.
Induced effects are those associated with a
change in economic activity due to spending by
the employees of businesses (labor) and by
households. Primarily, in this study, these are
economic changes related to spending by
telecommunication employees. It also includes
household spending related to indirect effects.
These are business-to-consumer effects.
TOTAL EFFECT
The estimated total economic contribution of
the telecommunications industry serving
Greater Minnesota, in 2011, was $1.3 billion, as
shown in table 2. To create this output,
businesses employed an estimated 10,300
workers and paid an estimated $600 million in
labor income.
Directly, the industry employed an estimated
6,300 employees. The majority of these
workers were employed by telecommunication
companies (4,500), however, the model
estimated that an additional 1,800 were
employed by companies contracted to perform
capital improvements. As a result of spending
by telecommunication companies and their
employees, an estimated additional 4,000 jobs
were supported in the state. Thus, the
telecommunications industry contributed an

ECONOMIC CONTRIBUTION OF TELECOMMUNICATION COMPANIES SERVING GREATER MINNESOTA 9
estimated total of 10,300 jobs to the economy
of Greater Minnesota.
The telecommunications industry paid an
estimated $450 million in labor income to its
employees. The majority of this income went
to workers who were employed directly by
telecommunication companies. Additional
wages were paid to those employed by
companies contracted to perform capital
improvements. As a result of spending by
telecommunication companies and their
employees, an estimated additional $150
million in labor income was supported in the
state. Thus, the telecommunications industry is
estimated to have contributed a total of $600
million in labor income to the economy of
Greater Minnesota.
Table 2: Total Estimated Economic Contribution of the Telecommunications Industry Serving Greater
Minnesota, 2011
Direct Indirect Induced Total
Output (millions) $870 $120 $320 $1,300
Employment* 6,300 880 3,100 10,300
Labor Income (millions) $450 $40 $110 $600
Estimates by the University of Minnesota Extension Center for Community Vitality
*Direct employment and direct labor income includes those employed by telecommunication companies and those
directly employed in the implementation of capital improvements (contracted by telecommunication firms).

ECONOMIC CONTRIBUTION OF TELECOMMUNICATION COMPANIES SERVING GREATER MINNESOTA 10
TOP INDUSTRIES EFFECTED
The total effect provides a broad overview of
how the telecommunications industry connects
with Greater Minnesota’s economy. Results
from the analysis can provide more detail on
how the telecommunications industry affects
other specific industries. In fact, the model can
show the top industries affected by the
telecommunications industry. This is useful
because it can demonstrate in further detail the
complex interactions between industries in the
economy. Further, it can highlight the role of
supporting industries.
Since telecommunication companies reported in
the survey that they spend an estimated 60
percent of their operating budget in Greater
Minnesota, looking at how this spending
impacts other industries is of interest.
Operating expenditures, as defined in this
report, include expenditures for goods and
Table 3: Top 20 Supplier Industries Affected by Telecommunications Operations Only, Sorted by
Estimated Employment
Industry Total Estimated Employment Effect
Telecommunications 4,500
Cable and other subscription programming 40
Accounting-tax preparation-bookkeeping 33
Motion picture and video 20
Maintenance and repair of nonresidential structures 20
Architectural-engineering-and related services 20
Employment services 20
Real estate establishments 20
Services to building and dwellings 20
Monetary authorities and depository credit institutions 20
Civic-social-professional organizations 20
Automotive repair and maintenance 10
Wholesale trade 10
Business support services 10
Advertising and related 10
Printing 10
Newspaper publishers 10
Radio and television broadcasting 10
Private hospitals 10
Commercial and industrial machinery and equipment 10
This table includes operating budget effects only; it does not include wages/salaries or capital improvements.
Estimates by the University of Minnesota Extension Center for Community Vitality
ECONOMIC CONTRIBUTION OF TELECOMMUNICATION COMPANIES SERVING GREATER MINNESOTA 11
services used in the production of the
telecommunication services: they do not
include expenditures for wages and salaries or
for capital improvements.
Table 3 details how the operations of
telecommunication companies affect suppliers.
Spending for supplies alone by the industry
generates an estimated 600 additional jobs in
Minnesota. In other words, suppliers to the
telecommunication industry in Greater
Minnesota employ 600 people in order to
provide goods and services to the industry.
Cable programming, accounting services,
motion picture and video services, engineering
firms, printers and publishers, and advertisers
located in Greater Minnesota all benefit
economically from the industry. These
industries constitute the main suppliers. 2
Many telecommunication companies provide
television services in their region, using the
same infrastructure as used for telephone and
internet service. Therefore, it is not surprising
to see cable programming and motion
picture/video services in the top operating
effects.
Table 3 focuses on spending for operations
only. Table 4 includes all spending by
telecommunication companies Therefore, this
table includes economic effects generated by
operating expenditures, capital improvements,
and wages and salaries. Total expenditures by
telecommunication firms support an estimated
4,000 jobs in Greater Minnesota. Table 4
details the top 15 industries in which these jobs
were created.
Due to the labor-intensity of the industry, a
major source of its impact derives from
spending by employees. Thus, table 4 reflects
high impacts to service industries including
restaurants, health care providers, and retail
establishments. Other industries affected
2 Of note, this does not account for industries that
benefit from the services of the telecommunications
industry.
reflect purchases made by the
telecommunication firms in their production
process and include construction, wholesale
trade, architecture and engineering, and
banking.
The IMPLAN model treats one job as one job. It
does not use full-time equivalents. Therefore,
one full-time job is equal to one part-time or
seasonal job. It is typical to see high
employment effects in industries that are
dominated by part-time employment, such as
retail and dining.

ECONOMIC CONTRIBUTION OF TELECOMMUNICATION COMPANIES SERVING GREATER MINNESOTA 12
Table 4 also includes the output effects tied to
the industries with the highest employment
effects. As the table demonstrates, high
employment effects do not always translate
into high output effects. This is due in part to
the treatment of employment in the model. It
is also partially attributable to the ratio of
output per worker.
TAXES
While taxes are not technically part of the
economic contribution analysis,
telecommunication companies in Minnesota do
contribute to the tax base of the state. Based
on average taxes paid for the 16 responding
telecommunication companies and the
responses of large corporations,
telecommunication companies serving Greater
Minnesota are estimated to have paid $30
million in property, sales, and income taxes in
2011.
Table 4: Top 15 Supplier Industries Affected by All Telecommunications Spending, Sorted by Estimated
Employment
Industry Total Estimated
Employment
Effect
Associated Output Effect
(millions)
Telecommunications 4,500 $640
Construction, new nonresidential 1,700 $210
Food services and drinking places 430 $21
Private hospitals 200 $30
Nursing and residential care 160 $9
Offices of physicians, dentists, and other health care 160 $24
Retail – food and beverage 150 $7
Wholesale trade 140 $22
Retail – general merchandise 140 $7
Civic-social-professional organizations 120 $5
Real estate establishments 100 $11
Architectural-engineering-and related services 90 $11
Retail – nonstores 90 $3
Monetary authorities and depository credit institutions 80 $21
Retail – motor vehicle 80 $5
This table includes all spending: operating budget, wages and salaries, and capital improvements.
Estimates by the University of Minnesota Extension Center for Community Vitality

ECONOMIC CONTRIBUTION OF TELECOMMUNICATION COMPANIES SERVING GREATER MINNESOTA 13
Notes on the Analysis
As mentioned previously, non-response error is
a concern in this study. Two checks for the
error were completed as part of the study.
First, the researchers and the Executive Director
of the Minnesota Telecommunications Alliance
thoroughly reviewed the respondents. The
respondents were found to represent a diverse
sub-set of the telecommunication industry in
Minnesota. Second, once the total expenditures
and employment figures were calculated, they
were checked against the default IMPLAN data.
Results of this study were found to be
consistent with IMPLAN estimates.
This study was completed using economic
contribution analysis methodology. Economic
contribution analysis quantifies the amount of
economic activity generated by a project or
industry. Economic contribution studies differ
slightly from the methodological viewpoint of
economic impact studies. Economic impact
studies require a “but for” test to be met. That
is, but for, the industry, what would the
economy look like? Clearly, this type of
analysis would not be feasible for the
telecommunication industry. It is difficult
enough to contemplate an economy without
telecommunications, and even more difficult to
try and model one.
The focus of this study is on Greater Minnesota.
Greater Minnesota is the study area.
Respondents to the survey serve customers
outside of the Twin Cities seven-county
metropolitan area. However, it does include all
expenditures by those companies that occur in
Minnesota, regardless of where and so the
impacts include those on the Twin Cities metro.
This study also assumes that respondents have
accurately estimated important measures used
to carry out this economic analysis, including
for example, expenditures for labor, operations,
and capital investments and the percentages of
those that were locally made. Errors in this
regard would affect the accuracy of the
analysis.
This study does not include telecommunication
companies that exclusively provide service to
customers living in the metropolitan area.
Telecommunication companies providing
service in both the metropolitan area and
Greater Minnesota are included in the analysis.
In addition, this study does not include the four
national cell phone carriers who provide
physical cellular networks. Local
telecommunication companies provide cell
service by purchasing network use from the
major carriers. The service provided by the
local telecommunication company is included
in this analysis, but the service provided by the
national cellular carrier is not.
Finally, this analysis focuses on backwards
linkages, or on the suppliers to the
telecommunication industry and its employees.
It does not measure the likely significant
benefits the industry provides to rural
Minnesotans. In an increasingly global
economy, access to telephone and internet
service is crucial. As the economy advances,
the speed of internet connectivity also becomes
essential to users. Many organizations in
Minnesota, including University of Minnesota
Extension, are working to improve internet
connectivity and usage in Greater Minnesota.
Telecommunication services are primary inputs
for many businesses. This study does not
attempt to measure the value of these services
to Greater Minnesota’s economy.

ECONOMIC CONTRIBUTION OF TELECOMMUNICATION COMPANIES SERVING GREATER MINNESOTA 14
Conclusions
The total estimated economic contribution of
the telecommunications industry serving
Greater Minnesota, in 2011, was $1.3 billion.
To create this output and meet indirect and
induced demand, businesses employed 10,300
workers and paid $600 million in labor income.
Residents of Greater Minnesota receive
telecommunication services from a broad range
of companies, known as local exchange carriers.
These companies are facing increasing
challenges and pressures. In order to address
some of these issues, the Minnesota
Telecommunications Alliance (MTA) posed the
question “What is the economic contribution of
telecommunication companies serving Greater
Minnesota?” MTA partnered with the Center
for Rural Policy and Development and
University of Minnesota Extension to determine
the answer.
In late 2011, Extension conducted a survey of
members of the MTA. These survey results
were in turn used to calculate the economic
contribution of the industry. Sixteen of the 48
holding companies (representing 80 operating
companies) responded to the survey. Their
average responses and the responses from
major corporations were used to determine the
total direct effect of the industry in Minnesota.
Directly, telecommunication companies serving
Greater Minnesota are estimated to have
employed 4,500 workers, paid $370 million in
payroll, spent $280 million on operations, and
expended $220 million in Minnesota on capital
outlays.
Telecommunication companies serving Greater
Minnesota have ties to their suppliers.
Suppliers to the telecommunication industry in
Greater Minnesota employ an estimated 600
people in order to provide goods and services
to the industry. These suppliers include: cable
programming services, accounting services,
motion picture and video services, engineering
firms, printers and publishers, and advertisers.
Due to the labor-intensity of the
telecommunications industry, a major source of
its impact derives from spending by employees.
Thus, high impact effects occur in service
industries including restaurants, health care
providers, and retail establishments. Other
industries affected reflect purchases made by
telecommunication firms in their production
process and include construction, wholesale
trade, architecture and engineering, and
banking.
Telecommunication services are primary inputs
for many businesses. This study does not
attempt to measure the value of these services
to Greater Minnesota’s economy. These
impacts are likely significant.

ECONOMIC CONTRIBUTION OF TELECOMMUNICATION COMPANIES SERVING GREATER MINNESOTA 15
Appendix 1: Methodology
Special models, called input-output models,
exist to conduct economic impact analysis.
There are several input-output models
available. IMPLAN (IMpact Analysis for
PLANning, Minnesota IMPLAN Group)3 is one
such model. Many economists use IMPLAN for
economic contribution analysis because it can
measure output and employment impacts, is
available on a county-by-county basis, and is
flexible for the user. IMPLAN has some
limitations and qualifications, but it is one of
the best tools available to economists for input-
output modeling. Understanding the IMPLAN
tool, its capabilities, and its limitations will help
ensure the best results from the model.
One of the most critical aspects of
understanding economic impact analysis is the
distinction between the “local” and “non-local”
economy. The local economy is identified as
part of the model-building process. Either the
group requesting the study or the analyst
defines the local area. Typically, the study area
(the local economy) is a county or a group of
counties that share economic linkages. In this
study, the study area is the entire State of
Minnesota with a focus on Greater Minnesota.
A few definitions are essential in order to
properly read the results of an IMPLAN
analysis. The terms and their definitions are
provided below.
Output
Output is measured in dollars and is equivalent
to total sales. The output measure can include
significant “double counting.” Think of corn,
for example. The value of the corn is counted
when it is sold to the mill, again when it is sold
to the dairy farmer, again as part of the price of
fluid milk, and yet again when it is sold as
cheese. The value of the corn is built into the
price of each of these items and then the sales
of each of these items are added up to get total
sales (or output).
3 IMPLAN Version 3.0 was used in this analysis. The trade flows
model with SAM multipliers was implemented.
Employment
Employment includes full- and part-time
workers and is measured in annual average
jobs, not full-time equivalents (FTE’s). IMPLAN
includes total wage and salaried employees, as
well as the self-employed, in employment
estimates. Because employment is measured in
jobs and not in dollar values, it tends to be a
very stable metric.
Labor Income
Labor income measures the value added to the
product by the labor component. So, in the
corn example when the corn is sold to the mill,
a certain percentage of the sale goes to the
farmer for his/her labor. Then when the mill
sells the corn as feed to dairy farmers, it
includes some markup for its labor costs in the
price. When dairy farmers sell the milk to the
cheese manufacturer, they include a value for
their labor. These individual value increments
for labor can be measured, which amounts to
labor income. Labor income does not include
double counting.
Direct Impact
Direct impact is equivalent to the initial activity
in the economy. In this study, it is spending by
telecommunication companies on operations,
wages and salaries, and capital improvements.
Indirect Impact
The indirect impact is the summation of
changes in the local economy that occur due to
spending for inputs (goods and services) by the
industry or industries directly impacted. For
instance, if employment in a manufacturing
plant increases by 100 jobs, this implies a
corresponding increase in output by the plant.
As the plant increases output, it must also
purchase more inputs, such as electricity, steel,
and equipment. As the plant increases
purchases of these items, its suppliers must
also increase production, and so forth. As
these ripples move through the economy, they
can be captured and measured. Ripples related
to the purchase of goods and services are
indirect impacts. In this study, indirect

ECONOMIC CONTRIBUTION OF TELECOMMUNICATION COMPANIES SERVING GREATER MINNESOTA 16
impacts are those associated with spending by
the telecommunication companies for operating
items (engineering, advertising, subscription
programming, as examples) and for capital
outlays (construction and engineering, for
example).
Induced Impact
The induced impact is the summation of
changes in the local economy that occur due to
spending by labor. For instance, if
employment in a manufacturing plant increases
by 100 jobs, the new employees will have more
money to spend to purchase housing, buy
groceries, and go out to dinner. As they spend
their new income, more activity occurs in the
local economy. Induced impacts also include
spending by labor generated by indirect
impacts. So, if the telecommunication business
purchases services from an engineering firm,
spending of the engineers’ wages would also
create induced impacts. Primarily, in this
study, the induced impacts are those economic
changes related to spending by
telecommunication employees and construction
workers hired to implement capital
improvements.
Total Impact
The total impact is the summation of the direct,
indirect, and induced impacts.
Input-Output, Supply and Demand, and Size of
Market
Care must be taken when using regional input-
output models to ensure they are being used in
the appropriate type of analysis. If input-
output models are used to examine the impact
or the contribution of an industry that is so
large that its expansion or contraction results
in such major shifts in supply and demand that
prices of inputs and labor change, input-output
can overstate the impacts or contributions.
While the telecommunications industry is a
major component of the Minnesota economy, it
is not likely that its existence has an impact on
national prices. Hence, the model should
estimate the contributions reliably.

ECONOMIC CONTRIBUTION OF TELECOMMUNICATION COMPANIES SERVING GREATER MINNESOTA 17
Appendix 2: Telecommunication Company Survey
Thank you for your willingness to participate in
this confidential survey. You are being asked to
complete this survey as part of a University of
Minnesota study to determine the economic
impact of Greater Minnesota's telecom industry.
Our goals from this survey are to:
1) Quantify total expenditures for labor,
operations, and capital investments by all of
Greater Minnesota's telecoms.
2) Determine which percentage of these
expenditures are local (defined here as within
50 miles of the telecom's service territory).
Local is based on the location of the direct
purchase. For example, if you buy a truck from
the local dealership, that is a local purchase,
even if the truck is made elsewhere.
3) Identify local businesses which are
significantly impacted by Greater Minnesota's
telecoms.
Your information will be kept confidential. Only
aggregated responses will be shared with the
public. University of Minnesota will destroy
your responses upon completion of the study.
You may opt to skip any question.
1. Which counties does your service territory
cover? (Please include all counties, even if your
territory only partially covers the county).
2. How many customers do you currently have?
Residential
Business
Other
3. Thinking of your most recently completed
fiscal year, what was your total employment?
Please include full-time, part-time, seasonal,
and administrative employees.
4. Again, thinking of your most recently
completed fiscal year, what was your total gross
payroll? Please include benefits.
5. According to your best guess, what percent
of your employees live...
In Minnesota?
Within 50 miles of your service territory?
6. If you need a place to comment on the last
three questions, please do so here.
7. Thinking of your most recently completed
fiscal year, what was your annual non-labor
operating expense? Do not include labor costs
or capital investment expenditures. Enter
numbers only (no dollar sign or commas
necessary).
8. Thinking of your most recently completed
fiscal year, what percent of your non-labor
operating purchases were from businesses......
(Consider where the purchase was made..if it
was made at a location within the area, it is a
local purchase regardless of where the
company is based or where the item purchased
originated)
In Minnesota?
Within 50 miles of your service territory?
9. Looking at your operating budget, what three
categories (or line items) compose the largest
share of your local expenditures (within 50
miles of your service territory)?
10. Please name any businesses/industries
within 50 miles of your service territory from
which you make major purchases.
11. If there are any comments you would like to
make regarding the last four questions, please
do so here.
12. Thinking of your most recently completed
fiscal year, what were your capital expenditure outlays for each of the
following?
Expanding/Enhancing Broadband
Connectivity and Services
Land

ECONOMIC CONTRIBUTION OF TELECOMMUNICATION COMPANIES SERVING GREATER MINNESOTA 18
Building/Remodeling/Fixtures, etc.
Machinery/Vehicles/Equipment, etc.
13. Again, thinking of your most recently
completed fiscal year, what percent of your
capital expenditures were from businesses....
(Consider where the purchase was made...if it
was made at a location within the area, it is a
local purchase regardless of where the
company is based or where the item purchased
originated)
In Minnesota?
Within 50 miles of your service territory?
14. Looking at your capital expenditure budget,
what three categories (or line items) compose
the largest share of your local expenditures
(within 50 miles of your service territory)?
15. Thinking of your average expenditures on
capital expenditures in the last ten years, is this
year's total expenditure: greater than, less than,
or about the same as the ten year average?
16. If there are any comments you would like to
make regarding the last four questions, please
do so here.
17. Thinking of your most recently completed
fiscal year, what were your expenditures for the
following taxes?
Property
Sales
Income
18. If there any comments you would like to
make regarding the last question, please do so
here.
19. Given our goal of trying to quantify your
local (within 50 miles of your service territory)
spending, are there any other expenses (from
your most recently completed fiscal year) that
we did not measure in the previous questions?
Please list and quantify.