ECONOMIC CONTRIBUTION OF CRUISE TOURISM TO THE … · ECONOMIC CONTRIBUTION OF CRUISE TOURISM TO...
194
ECONOMIC CONTRIBUTION OF CRUISE TOURISM TO THE DESTINATION ECONOMIES A Survey-based Analysis of the Impacts of Passenger, Crew and Cruise Line Spending VOLUME II DESTINATION REPORTS Prepared for Florida-Caribbean Cruise Association September 2012 BREA PO Box 955 Exton, PA 19341 Phone: (610) 524-5973 Fax: (610) 363-9273 Website: www.breanet.com BREA Business Research & Economic Advisors
Transcript of ECONOMIC CONTRIBUTION OF CRUISE TOURISM TO THE … · ECONOMIC CONTRIBUTION OF CRUISE TOURISM TO...

ECONOMIC CONTRIBUTION OF CRUISE TOURISM
TO THE DESTINATION ECONOMIES
A Survey-based Analysis of the Impacts of Passenger, Crew and Cruise Line Spending
VOLUME II DESTINATION REPORTS
Prepared for
Florida-Caribbean Cruise Association
September 2012
BREA PO Box 955 Exton, PA 19341
Phone: (610) 524-5973 Fax: (610) 363-9273 Website: www.breanet.com BREA
Business Research &
Economic Advisors
Florida-Caribbean Cruise Assn. Economic Impact of Cruise Tourism
Business Research and Economic Advisors Page 1
Table of Contents
DESTINATIONS OF THE CARIBBEAN ................................................................................................. 2
ANTIGUA AND BARBUDA ............................................................................................................................. 3
ARUBA ........................................................................................................................................................11
BAHAMAS ...................................................................................................................................................19
BARBADOS ..................................................................................................................................................28
BELIZE ........................................................................................................................................................38
BRITISH VIRGIN ISLANDS ............................................................................................................................47
CAYMAN ISLANDS ......................................................................................................................................55
COLOMBIA ..................................................................................................................................................64
COSTA RICA ................................................................................................................................................74
CURACAO ...................................................................................................................................................83
DOMINICA ...................................................................................................................................................92
DOMINICAN REPUBLIC ..............................................................................................................................101
GRENADA .................................................................................................................................................111
HONDURAS ...............................................................................................................................................120
NICARAGUA ..............................................................................................................................................129
PUERTO RICO ............................................................................................................................................138
ST. KITTS AND NEVIS................................................................................................................................148
ST. MAARTEN ...........................................................................................................................................157
ST. VINCENT AND THE GRENADINES .........................................................................................................166
TURKS AND CAICOS ..................................................................................................................................175
U.S. VIRGIN ISLANDS ...............................................................................................................................184

Florida-Caribbean Cruise Assn. Economic Impact of Cruise Tourism
Business Research and Economic Advisors Page 2
DESTINATIONS OF THE CARIBBEAN
(Including Central and South America)

Florida-Caribbean Cruise Assn. Economic Impact of Cruise Tourism
Business Research and Economic Advisors Page 3
Antigua and Barbuda
At the core of the analysis of the economic contribution of cruise tourism were a set of
passenger and crew surveys that were conducted onboard ships of the FCCA member cruise
lines.1 The surveys were undertaken during the six-month period beginning in December 2011
and ending in May 2012. The survey schedule was designed so that surveys were conducted by
FCCA member cruise lines that called at each destination and that the distribution of passenger
and crew surveys would reflect the distribution of passenger and crew arrivals by cruise line at
each destination. On any given cruise itinerary, passenger and crew surveys were placed in all
passenger cabins and crew quarters following a single destination call. The surveys were
completed by the passengers and crew in the privacy of their quarters and returned to a
designated office on the cruise ship. Thus, passengers and crew were only surveye d once during
a cruise itinerary and for a single destination. On a subsequent itinerary, passengers were
surveyed following a call at a different dest ination.
The passenger and crew surveys were designed to collect data for onshore spending and visit
satisfaction by both passengers and crew. While the crew survey was slightly shorter than the
passenger survey, both surveys were designed to collect the following information:
hours spent ashore;
expenditures by category, including shore tours, food & beverages, clothing, etc.;
visit satisfaction, including shore tour, friendliness of residents, prices, shopping,
etc.;
likelihood of returning for a land-based vacation; and
demographic characteristics, including country of residence, age group, income, etc.
Combining the expenditure data collected from the passenger and crew surveys with data on
expenditures by cruise lines for port fees and services, payments to local tour operators for
passenger shore excursions purchased onboard the cruise ships, and other p rovisions purchased
locally by the cruise lines, estimates of total cruise tourism expenditures were developed for
each participating destination.
Given the direct spending estimates, the economic contribution of these expenditures, as
measured by employment and wage income were then estimated for each destination. This
process began with the collection of economic data for each destination from a combination of
local, regional and international sources. Utilizing all of these data a set of economic impact
models were developed for each destination to estimate the direct and total employment and
wage impacts. A more detailed description of these models is provided in the Data and
Methods section of Volume I.
1 Surveys were conducted on the ships of the following cruise lines: Carnival Cruise Lines, Celebrity Cruises, Disney Cruise Line, Holland America Line, Norwegian Cruise Line, Princess Cruises, P&O Cruises and Royal Caribbean International.

Florida-Caribbean Cruise Assn. Economic Impact of Cruise Tourism
Business Research and Economic Advisors Page 4
Cruise Tourism Expenditures
Cruise tourism expenditures in destination ports are composed of a broad range of spending
including:
onshore expenditures by passengers which are concentrated in shore excursions and
retail purchases of clothing and jewelry and purchases of food and beverages;
onshore expenditures by crew which are concentrated in purchases of food and
beverages in restaurants and retail purchases of jewelry and clothing;
expenditures by cruise lines for port services, such as dockage fees and linesmen,
utilities, such as water and power and navigation services; and
purchases of supplies, such as food and other supplies, by the cruise lines from local
businesses.
Based on data collected from the ports of the participating destinations and the CTO, an
estimated 595,000 cruise passengers arrived aboard cruise ships during the 2011/2012 cruise
year.2 Of these, an estimated 524,051 passengers (88 percent) disembarked and visited
Antigua. Utilizing additional data provided by the visiting cruise lines, we have estimated that
232,000 crew were aboard the cruise ships and that 36 percent, or 83,791 crew, disembarked
and visited the island. These passenger and crew visits along with additional expenditures by
the cruise lines generated a total of $45.0 million ($US) in cruise tourism expenditures in
Antigua during the 2011/2012 cruise year. The contribution of expenditures by passengers, crew
and cruise lines to this total is discussed below.
Table 1 – Estimated Passenger Spending ($US) in Antigua, 2011/2012 Cruise Year3
Purchase Categories Average Spend
per Party Share of All
Onshore Visits
Weighted Average Spend
per Party
Shore Excursions $ 71.60 51.6% $ 36.91
Clothing $ 42.40 43.2% $ 18.31
F&B at Restaurants & Bars $ 22.80 43.0% $ 9.80
Local Crafts & Souvenirs $ 27.50 40.5% $ 11.15
Taxis/Ground Transportation $ 38.30 22.6% $ 8.64
Other Purchases $ 32.70 19.8% $ 6.49
Watches & Jewelry $ 290.70 13.7% $ 39.70
Retail Purchases of Liquor $ 26.10 8.0% $ 2.08
Perfumes & Cosmetics $ 50.80 5.3% $ 2.67
Entertainment/Night Clubs/Casinos $ 32.40 2.4% $ 0.77
Telephone & Internet $ 23.60 2.1% $ 0.50
Electronics $ 18.50 0.6% $ 0.11
Total Spend per Cruise Party $ 137.13
Average Size of a Cruise Party 2.1
Total Spend per Cruise Passenger $ 65.30
Cruise Passenger Visits 524,051
Total Cruise Passenger Expenditures $ 34,221,593
2 The 2011/2012 cruise year includes the twelve months beginning in May, 2011 and ending in April,
2012. 3 The average shore excursion expenditure is a weighted average of the onshore and travel agent/other purchases and the portion of the onboard purchases paid to local tour operators.
Florida-Caribbean Cruise Assn. Economic Impact of Cruise Tourism
Business Research and Economic Advisors Page 5
Per passenger spending estimates were derived from 1,756 surveys completed by passengers
that went ashore during the survey period. As shown in Table 1, each passenger cruise party
spent an average of $137.13. The average spend per cruise party is the sum of the weighted
spending in each of the twelve categories. For example, 43 percent of the survey respondents
reported spending an average of $22.80 at for food and beverages. Spread over the cruise
parties that visited Antigua, this represented an average of $9.80 per party. On a per passenger
basis, the average total expenditure was $65.30. This represents the sum of per party
expenditures, $137.13, divided by the average size of a cruise party in Antigua, 2.1 passengers.
Cruise passenger expenditures in Antigua were concentrated in four categories which accounted
for 77 percent of their onshore expenditures: watches and jewelry, shore excursions, clothing
and local crafts. Over 40 percent of the passengers that went ashore made purchases in the
following categories: shore excursions, clothing, food and beverages and local crafts.
Just over half of the passengers reported that their cruise party purchased a shore excursion.
The effective local price of the shore excursion was $71.60 per party but when the full price of
the purchase from cruise lines and travel agents is included passengers spent an average of just
over $118 per party for their tours.
For the entire 2011/2012 cruise year, the estimated 524,051 cruise passengers who visited
Antigua spent a total of $34.2 million ($US) in Antigua.
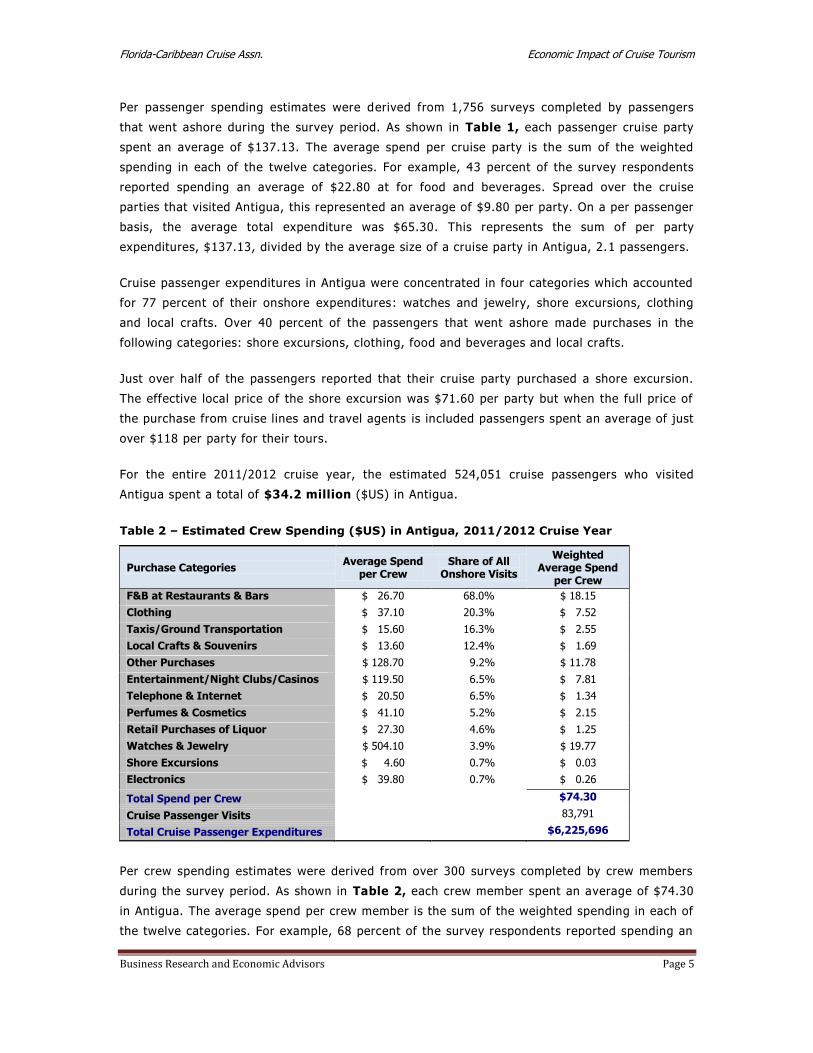
Table 2 – Estimated Crew Spending ($US) in Antigua, 2011/2012 Cruise Year
Purchase Categories Average Spend
per Crew Share of All
Onshore Visits
Weighted Average Spend
per Crew
F&B at Restaurants & Bars $ 26.70 68.0% $ 18.15
Clothing $ 37.10 20.3% $ 7.52
Taxis/Ground Transportation $ 15.60 16.3% $ 2.55
Local Crafts & Souvenirs $ 13.60 12.4% $ 1.69
Other Purchases $ 128.70 9.2% $ 11.78
Entertainment/Night Clubs/Casinos $ 119.50 6.5% $ 7.81
Telephone & Internet $ 20.50 6.5% $ 1.34
Perfumes & Cosmetics $ 41.10 5.2% $ 2.15
Retail Purchases of Liquor $ 27.30 4.6% $ 1.25
Watches & Jewelry $ 504.10 3.9% $ 19.77
Shore Excursions $ 4.60 0.7% $ 0.03
Electronics $ 39.80 0.7% $ 0.26
Total Spend per Crew $74.30
Cruise Passenger Visits 83,791
Total Cruise Passenger Expenditures $6,225,696
Per crew spending estimates were derived from over 300 surveys completed by crew members
during the survey period. As shown in Table 2, each crew member spent an average of $74.30
in Antigua. The average spend per crew member is the sum of the weighted spending in each of
the twelve categories. For example, 68 percent of the survey respondents reported spending an

Florida-Caribbean Cruise Assn. Economic Impact of Cruise Tourism
Business Research and Economic Advisors Page 6
average of $26.70 for food and beverages. Spread over all the crew members that reported that
they visited Antigua; this represents an average of $18.15 per crew member.
Expenditures by crew in Antigua were concentrated in three categories which accounted for 67
percent of their onshore expenditures: watches and jewelry, food and beverages and other
(unspecified) purchases. Combined, crew spent an average of $49.70 for goods in these three
categories. Purchases of food and beverages were the most popular expenditure item with 68%
percent of the crew reporting the purchase of food and beverages.
For the entire 2011/2012 cruise year, the estimated 83,791 crew who visited Antigua spent
an estimated total of $6.2 million ($US).
Cruise lines made payments to local businesses for a variety of goods and services. Net
payments to local vendors for shore excursions have been included with passenger
expenditures. However, cruise lines made other local expenditures, including payments for port
fees and taxes, navigation services, utilities and other supplies. Based upon data provided by
the FCCA member cruise lines, we estimated that all cruise lines spent $4.5 million ($US) in
Antigua during the 2011/2012 cruise year. Nearly all of these expenditures were payments for
port fees and taxes and navigation services.
Economic Contribution of Cruise Tourism Expenditures
As noted in the Data and Methods section of the full report, a set of economic impact models
were developed for each destination to produce estimates of the economic contribution of cruise
tourism. Data for these models were collected from a broad range of local, regional and
international sources. The impact models were designed to reflect the economic structure of
each destination, including the industrial composition of Gross Domestic Product (GDP), the
wage share of GDP by industry and average employee wages by industry.
Table 3 – Total Economic Contribution of Cruise Tourism in Antigua, 2011/2012 Cruise Year
Employment Wage Income ($US Millions)
Direct Economic Contribution 760 $ 6.9
Total Economic Contribution 1,246 $ 11.5
As shown in Table 3, the $45.0 million in total cruise tourism expenditures in Antigua
generated direct employment of 760 residents of Antigua paying $6.9 million in annual wages.
Adding the indirect contribution that results from the spending of those local businesses that
are the direct recipients of passenger, crew and cruise line expenditures, the direct cruise
tourism expenditures generated a total employment contribution of 1,246 jobs and $11.5 million
in wage income in Antigua during the 2011/2012 cruise year.
As shown in Figures 1 and 2, the total employment and wage impacts of cruise tourism are
concentrated in the commercial and transport sectors which account for about 97 percent of the

Florida-Caribbean Cruise Assn. Economic Impact of Cruise Tourism
Business Research and Economic Advisors Page 7
total impacts. This is not surprising since the direct impacts account for nearly 60 percent of the
total employment impacts and that virtually all of the cruise tourism expenditures are made with
businesses in these sectors. Because of the relatively higher wages in the transport sector
compared to the other sectors of the economy, the transport sector accounts for 16 percent of
the wage impacts but only 10 percent of the employment impacts. The remainder of the total
employment and wage impacts was generated by the indirect spending in the other sectors of
the economy.4
4 The industry sectors include the following activities:
Manufacturing & Construction: residential and nonresidential construction and all manufacturing Commercial Services: wholesale and retail trade, lodging and eating and drinking establishments Transportation & Utilities: tour operators, port services, telecommunications and water and power utilities Business & Financial Services: banking, insurance, legal, accounting, leasing and other business services Community Services & Government: education, health and social services and government agencies
Figure 1 – Total Employment Impacts by
Sector - Antigua
Manuf. & Construction
0%
Commercial Services
88%
Transport & Utilities
10%
Business & Financial Services
1%
Community Services &
Government1%
Figure 2 – Total Wage Impacts by Sector
Antigua
Manuf. & Construction
0%
Commercial Services
81%
Transport & Utilities
16%
Business & Financial Services
1%
Community Services &
Government2%
Comparison to 2009 Study
Total passenger and crew visits to Antigua declined by 4 percent from 633,500 visits during the 2008/2009
cruise year to 607,900 during the 2011/2012 cruise year. Total direct cruise tourism expenditures decreased
at a slightly higher rate, nearly 7 percent, over the three year period, falling from $48.3 million to $45.0
million. As indicated in Table 4, passenger expenditures declined by almost 11 percent while crew
expenditures rose by nearly 13 percent. Cruise line expenditures were unchanged
The decline in passenger expenditures, which account for 76 percent of total cruise tourism expenditures in
Antigua, was due to both a decline in visits and the average passenger expenditure. The change in average
passenger expenditures varied by category. Average spending increased for jewelry, entertainment and
other purchases, but declined for the remaining categories. The primary reason for the overall decline was a
decrease in the percentage of passengers purchasing goods in most categories.
The increase in crew expenditures was the result of the 13.7 percent increase in average crew expenditures.
This increase occurred in just about all categories of spending and was due both to an increase in the
average value of goods purchased and an increase in the percentage of crew making onshore purchases.

Florida-Caribbean Cruise Association Economic Impact of Cruise Tourism
Business Research and Economic Advisors Page 8
Table 4 – Comparison of Cruise Tourism Impacts, Current Study versus 2009 Study - Antigua
Current
Study 2009
Study Percent Change
Total Onshore Visits (Thousands) 607.9 633.5 -4.0%
Passengers 524.1 532.1 -1.5%
Crew 83.8 101.4 -17.4%
Total Direct Expenditures ($US Millions) $ 45.0 $ 48.3 -6.8%
Passengers $ 34.2 $ 38.3 -10.7%
Crew $ 6.2 $ 5.5 +12.7%
Cruise Lines $ 4.5 $ 4.5 ---
Average Per Passenger Expenditure $65.30 $72.06 -9.4% Average Per Crew Expenditure $74.30 $54.16 +37.2%
Total Employment Impact 1,246 1,315 -5.2%
Total Wage Impact ($US Millions) $ 11.5 $ 11.9 -3.4%
As a result of the 7 percent decrease in direct cruise tourism expenditures from the 2008/2009 cruise year,
the economic impacts fell as well. The total employment impact decreased by 5 percent over the three-year
period while the wage impact decreased by 3 percent. The smaller decline in wages is due to increased
labor productivity and average wages over the intervening period.
Passenger Surveys
A total of 1,756 passenger surveys were completed and returned for tabulation. Table 5 shows
the major attributes of passenger visits to Antigua as derived from the passenger surveys.
Table 5 - Major Attributes of Passenger Surveys - Antigua
Number Percent
Total Respondents 1,756
Number Making First Visit 1,177 67.0%
Number Ashore 1,702 96.9%
Number Making Onshore Purchases: 1,179 69.3%
Average Hours Ashore 3.8
Average Size of Expenditure Party (Persons) 2.1
Average Onshore Expenditure per Party $92.90
Purchased a Shore Excursion (Tour) 862 51.6%
Purchased Onshore Tour from:
Cruise Line 598 69.4%
Onshore from Tour Operator 185 21.5%
Travel Agent 79 9.2%
Average Cost of Shore Excursion per Party $118
Toured On Own/Did not Tour 840
Of the 1,756 cruise parties that completed the surveys 67% stated that this had
been their first visit to Antigua. This is down from 72% in the 2009 study.
Ninety-seven percent (97%) of the cruise parties that completed the surveys
disembarked their cruise ship to visit Antigua.
Florida-Caribbean Cruise Association Economic Impact of Cruise Tourism
Business Research and Economic Advisors Page 9
Of the cruise parties that went ashore, 69% made at least one purchase while
ashore. This is a sharp increase from 52% in the 2009 study. The typical cruise
party consisted of two passengers (Average: 2.1)) and spent an average of 3.8
hours ashore, down from 4.1 hours in the prior study.
The responding cruise parties reported spending an average of $92.90 while ashore
(excludes shore excursions), a decline of 18.5% from 2009.
Nearly 52% of the passengers that went ashore purchased a shore excursion , an
increase from 48% in 2009. Sixty-nine percent (69%) of passengers who purchased
a tour did so through their cruise line, 22% purchased their tour onshore and 9
percent purchased their tour through their travel agent.
The typical cruise party that purchased a shore excursion spent $118 for their tour,
an increase of 12% from $105 during the 2008/2009 cruise year.
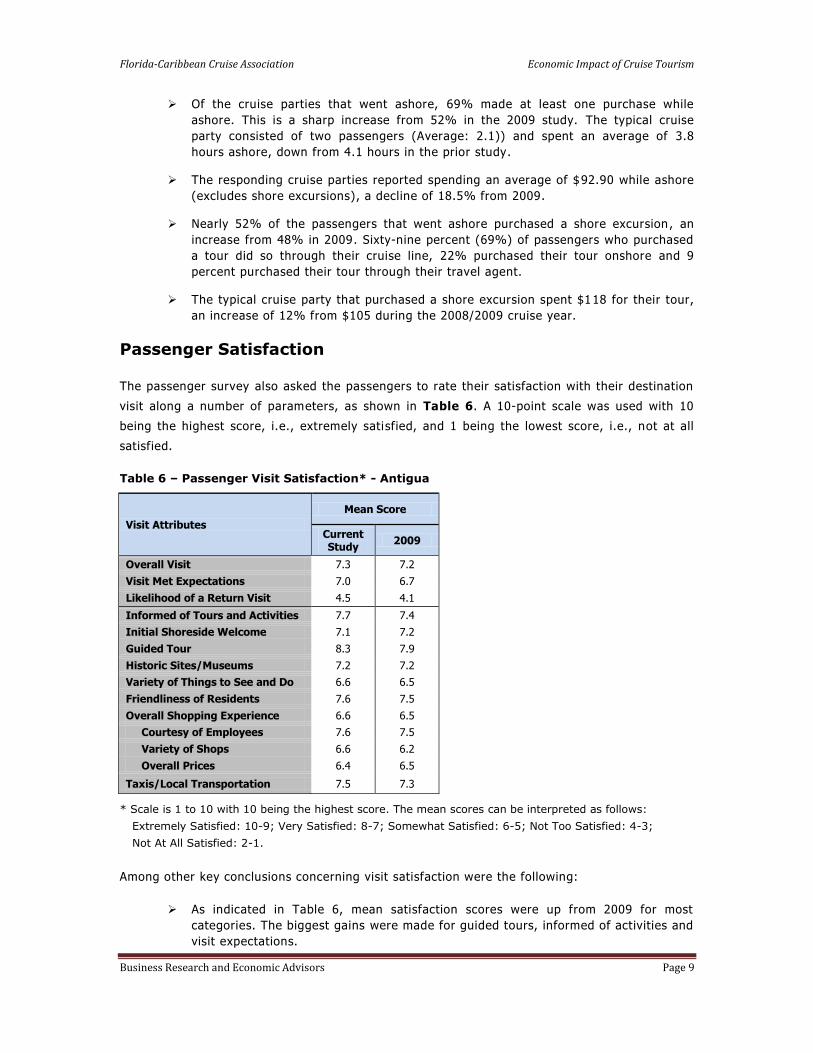
Passenger Satisfaction
The passenger survey also asked the passengers to rate their satisfaction with their destination
visit along a number of parameters, as shown in Table 6. A 10-point scale was used with 10
being the highest score, i.e., extremely satisfied, and 1 being the lowest score, i.e., not at all
satisfied.
Table 6 – Passenger Visit Satisfaction* - Antigua
Visit Attributes
Mean Score
Current Study
2009
Overall Visit 7.3 7.2
Visit Met Expectations 7.0 6.7
Likelihood of a Return Visit 4.5 4.1
Informed of Tours and Activities 7.7 7.4
Initial Shoreside Welcome 7.1 7.2
Guided Tour 8.3 7.9
Historic Sites/Museums 7.2 7.2
Variety of Things to See and Do 6.6 6.5
Friendliness of Residents 7.6 7.5
Overall Shopping Experience 6.6 6.5
Courtesy of Employees 7.6 7.5
Variety of Shops 6.6 6.2
Overall Prices 6.4 6.5
Taxis/Local Transportation 7.5 7.3
* Scale is 1 to 10 with 10 being the highest score. The mean scores can be interpreted as follows:
Extremely Satisfied: 10-9; Very Satisfied: 8-7; Somewhat Satisfied: 6-5; Not Too Satisfied: 4-3;
Not At All Satisfied: 2-1.
Among other key conclusions concerning visit satisfaction were the following:
As indicated in Table 6, mean satisfaction scores were up from 2009 for most
categories. The biggest gains were made for guided tours, informed of activities and
visit expectations.

Florida-Caribbean Cruise Association Economic Impact of Cruise Tourism
Business Research and Economic Advisors Page 10
Cruise passengers were very satisfied with their overall visit to Antigua with a mean
score of 7.3. However, the visit did not score as high in terms of meeting
expectations. The mean score for “Visit Met Expectations” was lower at 7.0.
Passengers felt very informed about tours and onshore activities in Antigua with a
mean score of 7.7.
“Guided Tours” (or Shore Excursions) received the highest score of all visit
attributes with a mean score of 8.3. Thus, cruise passengers were very satisfied
with their shore excursions.
Passenger interactions with residents and store employees were very positive with
“friendliness of residents” and “courtesy of employees” each having a mean score o f
7.6.
Categories with slightly lower scores but still above 7.0 (Very Satisfied) were: initial
shoreside welcome, historic sites and local transportation.
Categories with average scores between 5.0 and 7.0 (Somewhat Satisfied) were
given for variety of things to see and do and the overall shopping experience,
including the variety of shops and overall prices. Thus, while passengers thought
shop employees were very courteous, the overall score for their shopping
experience was brought down by lower perceptions on the variety of shops (6.6)
and overall prices (6.4).
Cruise passengers stated that they were not too likely to return to Antigua for a
land-based vacation with a mean score of 4.5 which was up from 4.1 in 2009.
Passenger Demographics
Residents of the United States and Canada accounted for 93 percent of the responding
passengers. The average age of the respondents was 57 years with 40 percent of the
respondents being 65 years of age or older. Antigua passengers had an average household
income of $104,000 with 40 percent having over $100,000 in household income.
Figure 3 – Passenger Age Cohorts Antigua
Under 153%
15 - 244%
25 - 4415%
45 - 6443%
Over 6435%
Figure 4 – Passenger Household Income Antigua
Under $50,00015%
$50,000 to $75,000
25%
$75,000 to $100,000
20%
$100,000 to $150,000
22%
$150,000 to $200,000
10%
$200,000 or more
8%

Florida-Caribbean Cruise Association Economic Impact of Cruise Tourism
Business Research and Economic Advisors Page 11
Aruba
At the core of the analysis of the economic contribution of cruise tourism were a set of
passenger and crew surveys that were conducted onboard ships of the FCCA member cruise
lines.5 The surveys were undertaken during the six-month period beginning in December 2011
and ending in May 2012. The survey schedule was designed so that surveys were conducted by
FCCA member cruise lines that called at each destination and that the distribution of passenger
and crew surveys would reflect the distribution of passenger and crew arrivals by cruise lin e at
each destination. On any given cruise itinerary, passenger and crew surveys were placed in all
passenger cabins and crew quarters following a single destination call. The surveys were
completed by the passengers and crew in the privacy of their quarte rs and returned to a
designated office on the cruise ship. Thus, passengers and crew were only surveyed once during
a cruise itinerary and for a single destination. On a subsequent itinerary, passengers were
surveyed following a call at a different dest ination.
The passenger and crew surveys were designed to collect data for onshore spending and visit
satisfaction by both passengers and crew. While the crew survey was slightly shorter than the
passenger survey, both surveys were designed to collect the fol lowing information:
hours spent ashore;
expenditures by category, including shore tours, food & beverages, clothing, etc.;
visit satisfaction, including shore tour, friendliness of residents, prices, shopping,
etc.;
likelihood of returning for a land-based vacation; and
demographic characteristics, including country of residence, age group, income, etc.
Combining the expenditure data collected from the passenger and crew surveys with data on
expenditures by cruise lines for port fees and services, payments to local tour operators for
passenger shore excursions purchased onboard the cruise ships, and other provisions purchased
locally by the cruise lines, estimates of total cruise tourism expenditures were developed for
each participating destination.
Given the direct spending estimates, the economic contribution of these expenditures, as
measured by employment and wage income were then estimated for each de stination. This
process began with the collection of economic data for each destination from a combinati on of
local, regional and international sources. Utilizing all of these data a set of economic impact
models were developed for each destination to estimate the direct and total employment and
wage impacts. A more detailed description of these models is provided in the Data and
Methods section of Volume I.
5 Surveys were conducted on the ships of the following cruise lines: Carnival Cruise Lines, Celebrity Cruises, Disney Cruise Line, Holland America Line, Norwegian Cruise Line, Princess Cruises, P&O Cruises and Royal Caribbean International.

Florida-Caribbean Cruise Association Economic Impact of Cruise Tourism
Business Research and Economic Advisors Page 12
Cruise Tourism Expenditures
Cruise tourism expenditures in destination ports are composed of a broad range of spending
including:
onshore expenditures by passengers which tend to be concentrated in shore excursions
and retail purchases of clothing, jewelry and local crafts and souvenirs;
onshore expenditures by crew which are generally concentrated in purchases of food
and beverages, local transportation and retail purchases of clothing and electronics ;
expenditures by cruise lines for port services, such as dockage fees and linesmen,
utilities, such as water and power and navigation services; and
purchases of supplies, such as food and other stores, by the cruise lines from local
businesses.
According to data provided by the Aruba Ports Authority, 590,159 cruise passengers arrived
aboard cruise ships during the 2011/2012 cruise year.6 Of these, an estimated 533,504
passengers (90 percent) disembarked and visited Aruba. The Aruba Ports Authority also
reported that 249,752 crew arrived on visiting cruise ships. Utilizing data provided by the
visiting cruise lines, we have estimated that 35 percent, or 86,877 crew, disembarked and
visited Aruba. These passenger and crew visits along with additional expenditure s by the cruise
lines generated a total of $63.7 million ($US) in cruise tourism expenditures in Aruba during
the 2011/2012 cruise year. The contribution of expenditures by passengers, crew and cruise
lines to this total is discussed below.
Table 7 – Estimated Passenger Spending ($US) in Aruba, 2011/2012 Cruise Year7
Purchase Categories Average Spend
per Party Share of All
Onshore Visits
Weighted Average Spend
per Party
Shore Excursions $ 69.10 50.2% $ 34.72
Clothing $ 46.50 46.6% $ 21.67
Local Crafts & Souvenirs $ 25.70 42.7% $ 10.98
F&B at Restaurants & Bars $ 26.10 39.9% $ 10.42
Watches & Jewelry $ 555.10 17.3% $ 96.15
Other Purchases $ 108.50 16.0% $ 17.40
Taxis/Ground Transportation $ 26.70 13.6% $ 3.64
Perfumes & Cosmetics $ 50.70 5.9% $ 2.97
Retail Purchases of Liquor $ 15.60 4.7% $ 0.74
Entertainment/Night Clubs/Casinos $ 55.00 2.7% $ 1.50
Telephone & Internet $ 9.40 1.9% $ 0.18
Electronics $ 20.80 0.2% $ 0.05
Total Spend per Cruise Party $200.42
Average Size of a Cruise Party 2.1
Total Spend per Cruise Passenger $95.44
Cruise Passenger Visits 533,504
Total Cruise Passenger Expenditures $50,917,861
6 The 2011/2012 cruise year includes the twelve months beginning in May, 2011 and ending in April, 2012. 7 The average shore excursion expenditure is a weighted average of the onshore and Internet purchases and the portion of the onboard purchases paid to local tour operators.
Florida-Caribbean Cruise Association Economic Impact of Cruise Tourism
Business Research and Economic Advisors Page 13
Per passenger spending estimates were derived from the 1,866 surveys completed by
passengers that went ashore during the survey period. As shown in Table 7, each passenger
cruise party spent an average of $200.42. The average spend per cruise party is the sum of the
weighted spending in each of the twelve categories. For example, 40 percent of the survey
respondents reported spending an average of $26.10 at local restaurants and/or bars. Spread
over the cruise parties that visited Aruba, this represents an average of $10.42 per party. On a
per passenger basis, the average total expenditure was $95.44. This represents the sum of per
party expenditures, $200.42, divided by the average size of a cruise party in Aruba, 2.1
passengers.
Cruise passenger expenditures in Aruba were concentrated in three categories which accounted
for 76 percent of their onshore expenditures: watches and jewelry, shore excursions and
clothing. Forty percent or more of the passengers that went ashore made purchases in the
following categories: shore excursions, clothing, local crafts and food and beverages.
Just over half of the passengers reported that their cruise party purchased a shore excursion.
The effective local price of the shore excursion was $69.10 per party but when the full price of
the purchase from cruise lines and travel agents is included passengers spent an average of
$115 per party for their tours.
For the entire 2011/2012 cruise year, the estimated 533,504 cruise passengers who visited
Aruba spent a total of $50.9 million ($US).
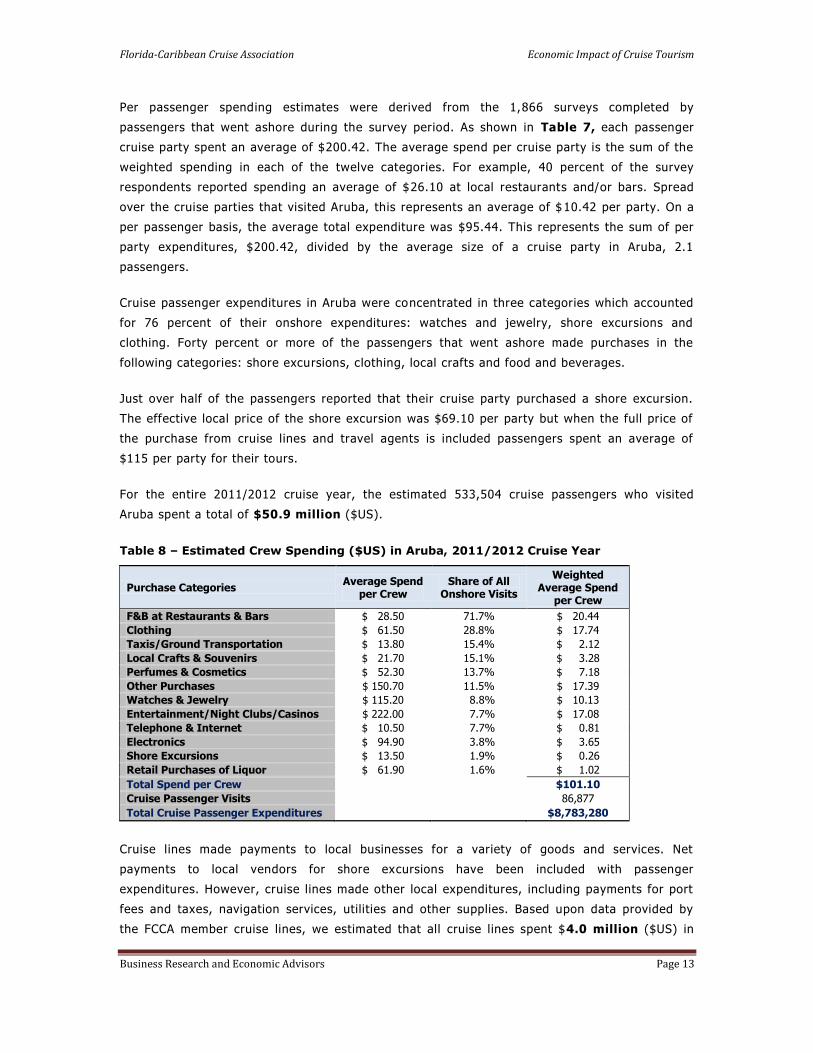
Table 8 – Estimated Crew Spending ($US) in Aruba, 2011/2012 Cruise Year
Purchase Categories Average Spend
per Crew Share of All
Onshore Visits
Weighted Average Spend
per Crew
F&B at Restaurants & Bars $ 28.50 71.7% $ 20.44
Clothing $ 61.50 28.8% $ 17.74
Taxis/Ground Transportation $ 13.80 15.4% $ 2.12
Local Crafts & Souvenirs $ 21.70 15.1% $ 3.28
Perfumes & Cosmetics $ 52.30 13.7% $ 7.18
Other Purchases $ 150.70 11.5% $ 17.39
Watches & Jewelry $ 115.20 8.8% $ 10.13
Entertainment/Night Clubs/Casinos $ 222.00 7.7% $ 17.08
Telephone & Internet $ 10.50 7.7% $ 0.81
Electronics $ 94.90 3.8% $ 3.65
Shore Excursions $ 13.50 1.9% $ 0.26
Retail Purchases of Liquor $ 61.90 1.6% $ 1.02
Total Spend per Crew $101.10
Cruise Passenger Visits 86,877
Total Cruise Passenger Expenditures $8,783,280
Cruise lines made payments to local businesses for a variety of goods and services. Net
payments to local vendors for shore excursions have been included with passenger
expenditures. However, cruise lines made other local expenditures, including payments for port
fees and taxes, navigation services, utilities and other supplies. Based upon data provided by
the FCCA member cruise lines, we estimated that all cruise lines spent $4.0 million ($US) in

Florida-Caribbean Cruise Association Economic Impact of Cruise Tourism
Business Research and Economic Advisors Page 14
Aruba during the 2011/2012 cruise year. Approximately 75 percent of these expenditures were
payments for port fees and navigation services while the remaining 25 percent consisted of
payments for ship supplies.
Economic Contribution of Cruise Tourism Expenditures
As noted in the Data and Methods section of the full report, a set of economic impact models
were developed for each destination to produce estimates of the economic contribution of cruise
tourism. Data for these models were collected from a broad range of local, regional and
international sources. The impact models were designed to reflect the economic structure of
each destination, including the industrial composition of Gross Domestic Product (GDP), the
wage share of GDP by industry and average employee wages by industry.
Table 9 – Total Economic Contribution of Cruise Tourism in Aruba, 2011/2012 Cruise Year
Employment Wage Income ($US Millions)
Direct Economic Contribution 824 $14.2
Total Economic Contribution 1,542 $25.9
As shown in Table 9, the $63.7 million in total cruise tourism expenditures generated direct
employment of 824 residents of Aruba paying $14.2 million in annual wages. Adding the indirect
contribution that results from the spending of those local businesses that are the direct
recipients of passenger, crew and cruise line expenditures, the direct cruise tourism
expenditures generated a total employment contribution of 1,542 jobs and $25.9 million in wage
income in Aruba during the 2011/2012 cruise year.
Figure 5 – Total Employment Impacts by
Sector - Aruba
Manuf. &
Construction0%
Commercial
Services86%
Transport &
Utilities12%
Business &
Financial Services
0%
Community
Services & Government
2%
Figure 6 – Total Wage Impacts by Sector
Aruba
Manuf. &
Construction1%
Commercial
Services77%
Transport &
Utilities20%
Business &
Financial Services
0%
Community
Services & Government
2%
As shown in Figures 5 and 6, the total employment and wage impacts of cruise tourism are
concentrated in the commercial and transport sectors which account for about 93 percent of the
employment and wage impacts.8 This is not surprising since the direct impacts account for more
8 The industry sectors include the following activities:
Manufacturing & Construction: residential and nonresidential construction and all manufacturing
Commercial Services: wholesale and retail trade, lodging and eating and drinking establishments

Florida-Caribbean Cruise Association Economic Impact of Cruise Tourism
Business Research and Economic Advisors Page 15
than half of the total employment impacts and that virtually all of the cruise tourism
expenditures are made with businesses in these two sectors. Because of the relatively higher
wages in the transport sector compared to the other sectors of the economy, the transport
sector accounts for 20 percent of the wage impacts but only 12 percent of the employment
impacts. The remainder of the total employment and wage impacts was generated by the
indirect spending in the other sectors of the economy.
Comparison to 2009 Study
Total passenger and crew visits to Aruba increased by nearly 7 percent from 581,000 visits during the
2008/2009 cruise year to 620,300 during the 2011/2012 cruise year. In addition, total direct cruise tourism
expenditures increased by 17.7 percent, over the three year period, growing from an estimated $54.1
million to $63.7 million. As indicated in Table 10, combined cruise tourism expenditures by passengers and
crew increased by more than 20 percent while spending by the cruise lines declined by 20 percent.
The 20 percent increase in passenger expenditures was the result of the 10 percent increase in passenger
visits and the 9 percent increase in the average expenditure per passenger. The increase in the average
expenditure by passengers was driven primarily by the increase in passenger expenditures for jewelry,
clothing and local crafts. In each of these categories the percentage of passengers purchasing these goods
increased as did the average expenditure by those making such purchases. For example during the
2008/2009 cruise year an estimated 15 percent of cruise passengers spent an average of $510 for their
jewelry purchases. During the 2011/2012 cruise year the percentage increased to 17 percent and the
average expenditure rose to $555. As a result the weighted average expenditure for jewelry increased from
$75 during the 2008/2009 cruise year to $96 in the 2011/2012 cruise year. Similar increases occurred in the
purchase of clothing and local crafts.
Table 10 – Comparison of Cruise Tourism Impacts, Current Study versus 2009 Study - Aruba
Current
Study 2009
Study Percent Change
Total Onshore Visits (Thousands) 620.3 581.0 +6.8%
Passengers 533.4 487.1 + 9.5%
Crew 86.9 93.9 - 7.5%
Total Direct Expenditures ($US Millions) $ 63.7 $ 54.1 +17.7%
Passengers $ 50.9 $ 42.6 + 19.5%
Crew $ 8.8 $ 6.5 + 35.4%
Cruise Lines $ 4.0 $ 5.0 - 20.0%
Average Per Passenger Expenditure $ 95.44 $87.41 + 9.2% Average Per Crew Expenditure $101.10 $69.34 +45.8%
Total Employment Impact 1,542 1,330 +15.9%
Total Wage Impact ($US Millions) $ 25.9 $ 21.9 +18.3%
Transportation & Utilities: tour operators, port services, telecommunications and water and power utilities
Business & Financial Services: banking, insurance, legal, accounting, leasing and other business services
Community Services & Government: education, health and social services and government agencies
Florida-Caribbean Cruise Association Economic Impact of Cruise Tourism
Business Research and Economic Advisors Page 16
In the case of crew expenditures most of the increase was driven by increased spending for clothing,
entertainment and other purchases. These three categories accounted for more than half of crew
expenditures. The percentage of crew making purchases in these categories increased from the 2008/2009
cruise year. As an example, the percentage of crew making onshore purchases of clothing increased from
15 percent in the 2009 study to 29 percent in the current study. As a result the weighted average
expenditure rose from $5.84 in the 2008/2009 cruise year to $17.74 in the 2011/2012 cruise year.
As a result of the 17 percent increase in direct cruise tourism expenditures from the 2008/2009 cruise year,
the economic impacts grew as well. The total employment impact rose by 16 percent over the three-year
period while the wage impact increased by 18 percent. The larger increase in wages is due to increased
labor productivity and average wages over the intervening period.
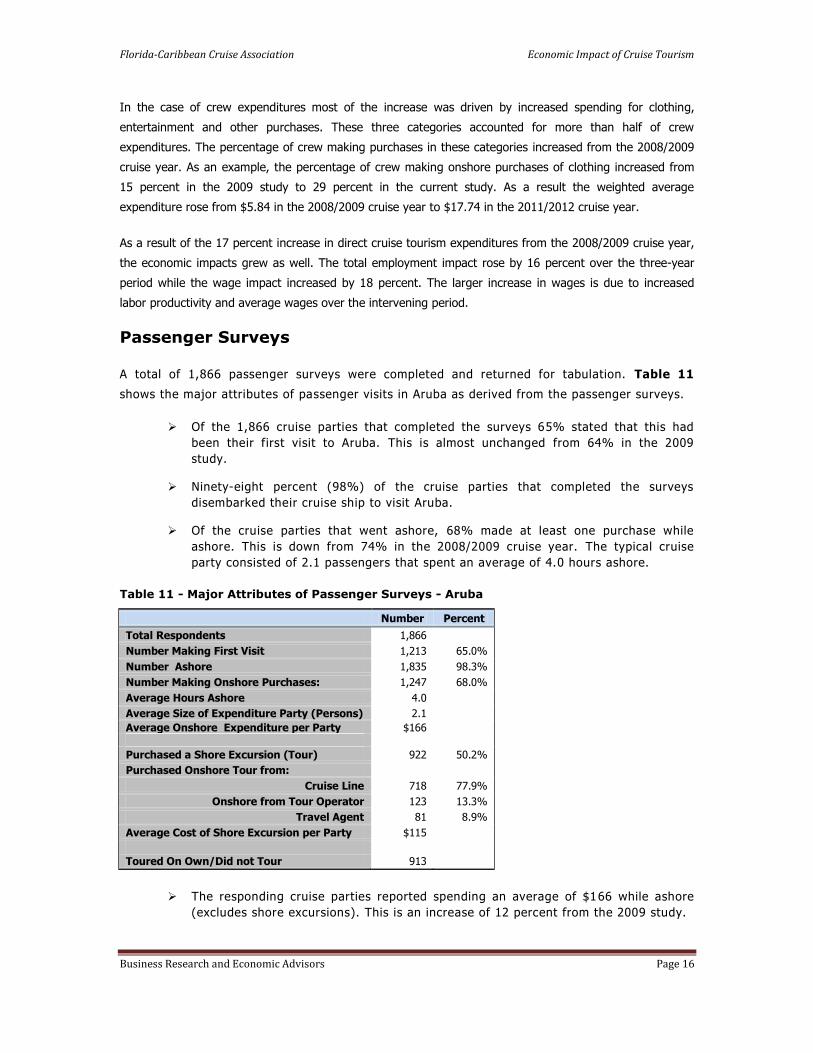
Passenger Surveys
A total of 1,866 passenger surveys were completed and returned for tabulation. Table 11
shows the major attributes of passenger visits in Aruba as derived from the passenger surveys.
Of the 1,866 cruise parties that completed the surveys 65% stated that this had
been their first visit to Aruba. This is almost unchanged from 64% in the 2009
study.
Ninety-eight percent (98%) of the cruise parties that completed the surveys
disembarked their cruise ship to visit Aruba.
Of the cruise parties that went ashore, 68% made at least one purchase while
ashore. This is down from 74% in the 2008/2009 cruise year. The typical cruise
party consisted of 2.1 passengers that spent an average of 4.0 hours ashore.
Table 11 - Major Attributes of Passenger Surveys - Aruba
Number Percent
Total Respondents 1,866
Number Making First Visit 1,213 65.0%
Number Ashore 1,835 98.3%
Number Making Onshore Purchases: 1,247 68.0%
Average Hours Ashore 4.0
Average Size of Expenditure Party (Persons) 2.1
Average Onshore Expenditure per Party $166
Purchased a Shore Excursion (Tour) 922 50.2%
Purchased Onshore Tour from:
Cruise Line 718 77.9%
Onshore from Tour Operator 123 13.3%
Travel Agent 81 8.9%
Average Cost of Shore Excursion per Party $115
Toured On Own/Did not Tour 913
The responding cruise parties reported spending an average of $166 while ashore
(excludes shore excursions). This is an increase of 12 percent from the 2009 study.

Florida-Caribbean Cruise Association Economic Impact of Cruise Tourism
Business Research and Economic Advisors Page 17
Fifty percent (50%) of the passengers that went ashore purchased a shore
excursion, a decline of from 55 percent in the 2009 study. Seventy-eight percent
(78%) of passengers who purchased a tour did so through their cruise line, 13%
purchased their tour onshore and nearly 9 percent purchased their tour through
their travel agent.
The typical cruise party that purchased a shore excursion spent $115 for their tour,
a 10 percent increase from the prior study.
Thus, while the percentage of passengers that reported making onshore purchases
and buying a shore excursion declined from the 2009 study, the average per party
expenditures increased.
Passenger Satisfaction
The passenger survey also asked the passengers to rate their satisfaction with their destination
visit along a number of parameters, as shown in Table 12. A 10-point scale was used with 10
being the highest score, i.e., extremely satisfied, and 1 being the lowest score, i.e., not at all
satisfied.
Table 12 – Passenger Visit Satisfaction* - Aruba
Visit Attributes
Mean Score
Current Study
2009 Study
Overall Visit 7.6 7.3
Visit Met Expectations 7.2 6.8
Likelihood of a Return Visit 4.5 4.1
Informed of Tours and Activities 8.0 7.9
Initial Shoreside Welcome 7.5 7.0
Guided Tour 8.4 8.0
Historic Sites/Museums 7.3 6.9
Variety of Things to See and Do 6.8 6.7
Friendliness of Residents 8.0 8.0
Overall Shopping Experience 7.0 6.8
Courtesy of Employees 8.0 7.8
Variety of Shops 6.9 6.9
Overall Prices 6.8 6.6
Taxis/Local Transportation 7.7 7.2
* Scale is 1 to 10 with 10 being the highest score. The mean scores can be interpreted as follows:
Extremely Satisfied: 10-9; Very Satisfied: 8-7; Somewhat Satisfied: 6-5; Not Too Satisfied: 4-3;
Not At All Satisfied: 2-1.
Among other key conclusions concerning visit satisfaction were the following:
As indicated in Table 12, mean satisfaction scores were up from 2009 for most
categories. The biggest gains were made for initial shoreside welcome, guided
tours, historic sites, local transportation and visit expectations.
Cruise passengers were very satisfied with their overall visit to Aruba with a mean
score of 7.6. Passengers also reported that their visit to Aruba exceeded their

Florida-Caribbean Cruise Association Economic Impact of Cruise Tourism
Business Research and Economic Advisors Page 18
expectations. The mean score for “Visit Met Expectations” was 7.2. Both of these
scores increased from the 2009 study. Passengers felt very informed about tours
and onshore activities in Aruba with a mean score of 8.0.
“Guided Tours” (or Shore Excursions) received the highest score of all visit
attributes with a mean score of 8.4. Thus, cruise passengers were very satisfied
with their shore excursions.
Passenger interactions with residents and store employees were very positive with
both “friendliness of residents” and “courtesy of employees” having a mean score of
8.0.
Categories with slightly lower scores but still above 7.0 (Very Satisfied) were: initial
shoreside welcome, historic sites and museums and local transportation.
Cruise passengers were very satisfied with the overall shopping experience,
including the variety of shops and overall prices. While passengers thought shop
employees were very courteous, the overall score for their shopping experience was
brought down by lower perceptions on the variety of shops (6.9) and overall prices
(6.8).
Cruise passengers stated that they were not too likely to return to Aruba for a land-
based vacation with a mean score of 4.5 which was up from 4.1 in 2009.
Passenger Demographics
Residents of the United States and the Canada accounted for 95 percent of the responding
passengers. The average age of the respondents was 60 years with nearly 50 percent of the
respondents being 65 years of age or older. Aruba passengers had an average household
income of $108,400 with 40 percent having over $100,000 in household income.
Figure 7 – Passenger Age
Aruba
Under 152%
15 - 243%
25 - 448%
45 - 6437%
Over 6450%
Figure 8 – Passenger Household Income
Aruba
Under $50,00015%
$50,000 to $75,000
26%
$75,000 to $100,000
18%
$100,000 to $150,000
18%
$150,000 to $200,000
12%
$200,000 or more11%

Florida-Caribbean Cruise Association Economic Impact of Cruise Tourism
Business Research and Economic Advisors Page 19
Bahamas
At the core of the analysis of the economic contribution of cruise tourism were a set of
passenger and crew surveys that were conducted onboard ships of the FCCA member cruise
lines.9 The surveys were undertaken during the six-month period beginning in December 2011
and ending in May 2012. The survey schedule was designed so that surveys were conducted by
FCCA member cruise lines that called at each destination and that the distribution of passenger
and crew surveys would reflect the distribution of passenger and crew arriva ls by cruise line at
each destination. On any given cruise itinerary, passenger and crew surveys were placed in all
passenger cabins and crew quarters following a single destination call. The surveys were
completed by the passengers and crew in the privacy of their quarters and returned to a
designated office on the cruise ship. Thus, passengers and crew were only surveyed once during
a cruise itinerary and for a single destination. On a subsequent itinerary, passengers were
surveyed following a call at a different destination.
The passenger and crew surveys were designed to collect data for onshore spending and visit
satisfaction by both passengers and crew. While the crew survey was slightly shorter than the
passenger survey, both surveys were designed to collect the following information:
hours spent ashore;
expenditures by category, including shore tours, food & beverages, clothing, etc.;
visit satisfaction, including shore tour, friendliness of residents, prices, shopping,
etc.;
likelihood of returning for a land-based vacation; and
demographic characteristics, including country of residence, age group, income, etc.
Combining the expenditure data collected from the passenger and crew surveys with data on
expenditures by cruise lines for port fees and services, payments to local tour operators for
passenger shore excursions purchased onboard the cruise ships, and other provisions purchased
locally by the cruise lines, estimates of total cruise tourism expenditures were developed for
each participating destination.
Given the direct spending estimates, the economic contribution of these expenditures, as
measured by employment and wage income were then estimated for each de stination. This
process began with the collection of economic data for each destination from a combination of
local, regional and international sources. Utilizing all of these data a set of economic impact
models were developed for each destination to estimate the direct and total employment and
wage impacts. A more detailed description of these models is provided in the Data and
Methods section of Volume I.
9 Surveys were conducted on the ships of the following cruise lines: Carnival Cruise Lines, Celebrity Cruises, Disney Cruise Line, Holland America Line, Norwegian Cruise Line, Princess Cruises, P&O Cruises and Royal Caribbean International.
Florida-Caribbean Cruise Association Economic Impact of Cruise Tourism
Business Research and Economic Advisors Page 20
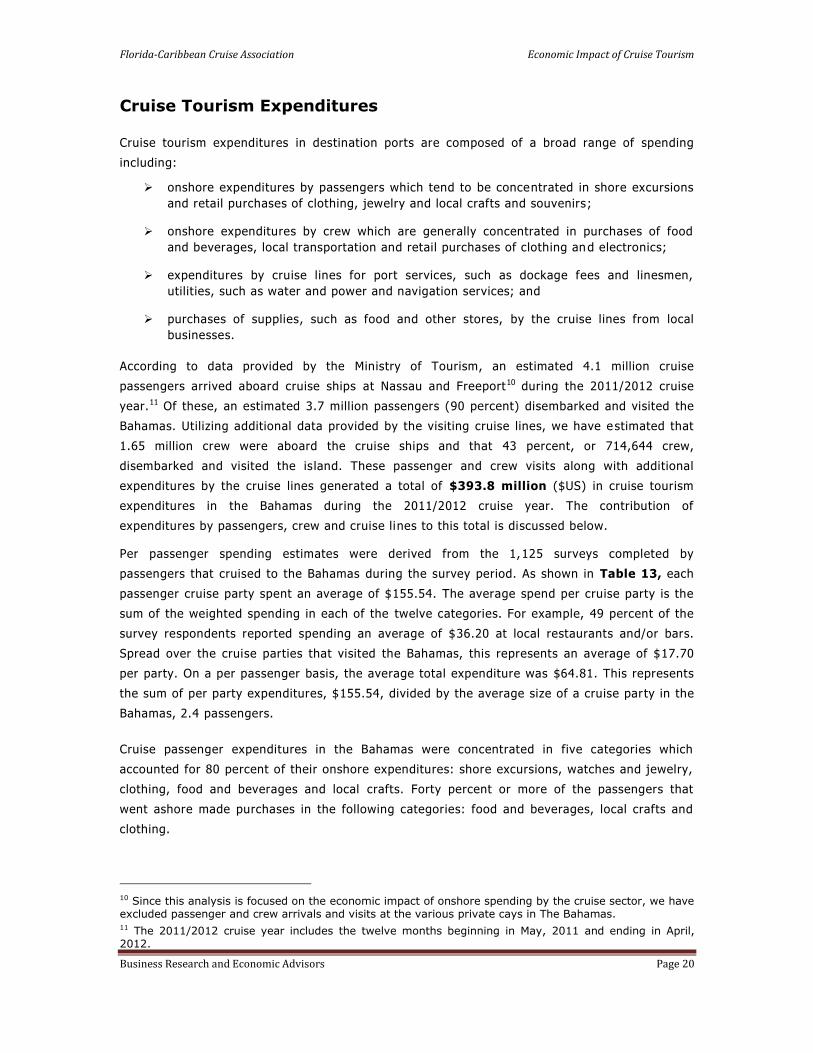
Cruise Tourism Expenditures
Cruise tourism expenditures in destination ports are composed of a broad range of spending
including:
onshore expenditures by passengers which tend to be concentrated in shore excursions
and retail purchases of clothing, jewelry and local crafts and souvenirs;
onshore expenditures by crew which are generally concentrated in purchases of food
and beverages, local transportation and retail purchases of clothing and electronics;
expenditures by cruise lines for port services, such as dockage fees and linesmen,
utilities, such as water and power and navigation services; and
purchases of supplies, such as food and other stores, by the cruise lines from local
businesses.
According to data provided by the Ministry of Tourism, an estimated 4.1 million cruise
passengers arrived aboard cruise ships at Nassau and Freeport10 during the 2011/2012 cruise
year.11 Of these, an estimated 3.7 million passengers (90 percent) disembarked and visited the
Bahamas. Utilizing additional data provided by the visiting cruise lines, we have e stimated that
1.65 million crew were aboard the cruise ships and that 43 percent, or 714,644 crew,
disembarked and visited the is land. These passenger and crew visits along with additional
expenditures by the cruise lines generated a total of $393.8 million ($US) in cruise tourism
expenditures in the Bahamas during the 2011/2012 cruise year. The contribution of
expenditures by passengers, crew and cruise lines to this total is discussed below.
Per passenger spending estimates were derived from the 1,125 surveys completed by
passengers that cruised to the Bahamas during the survey period. As shown in Table 13, each
passenger cruise party spent an average of $155.54. The average spend per cruise party is the
sum of the weighted spending in each of the twelve categories. For example, 49 percent of the
survey respondents reported spending an average of $36.20 at local restaurants and/or bars.
Spread over the cruise parties that visited the Bahamas, this represents an average of $17.70
per party. On a per passenger basis, the average total expenditure was $64.81. This represents
the sum of per party expenditures, $155.54, divided by the average size of a cruise party in the
Bahamas, 2.4 passengers.
Cruise passenger expenditures in the Bahamas were concentrated in five categories which
accounted for 80 percent of their onshore expenditures: shore excursions, watches and jewelry,
clothing, food and beverages and local crafts. Forty percent or more of the passengers that
went ashore made purchases in the following categories: food and beverages, local crafts and
clothing.
10 Since this analysis is focused on the economic impact of onshore spending by the cruise sector, we have excluded passenger and crew arrivals and visits at the various private cays in The Bahamas. 11 The 2011/2012 cruise year includes the twelve months beginning in May, 2011 and ending in April, 2012.

Florida-Caribbean Cruise Association Economic Impact of Cruise Tourism
Business Research and Economic Advisors Page 21
Thirty-six percent (36%) of the passengers reported that their cruise party purchased a shore
excursion. The effective local price of the shore excursion was $103.50 per party but when the
full price of the purchase from cruise lines and travel agents is included passengers spent an
average of $157 per party for their tours.
For the entire 2011/2012 cruise year, the estimated 3.7 million cruise passengers who visited
the Bahamas spent a total of $241.4 million ($US).
Table 13 – Estimated Passenger Spending ($US) in the Bahamas, 2011/2012 Cruise Year12
Purchase Categories Average Spend
per Party Share of All
Onshore Visits
Weighted Average Spend
per Party
F&B at Restaurants & Bars $ 36.20 48.9% $ 17.70
Local Crafts & Souvenirs $ 32.20 44.8% $ 14.44
Clothing $ 52.90 43.3% $ 22.90
Shore Excursions $ 103.50 36.3% $ 37.54
Taxis/Ground Transportation $ 32.00 31.0% $ 9.92
Watches & Jewelry $ 195.20 17.0% $ 33.26
Other Purchases $ 49.90 14.9% $ 7.45
Retail Purchases of Liquor $ 27.50 7.7% $ 2.11
Perfumes & Cosmetics $ 63.80 5.9% $ 3.74
Entertainment/Night Clubs/Casinos $ 90.70 5.0% $ 4.56
Telephone & Internet $ 83.20 2.2% $ 1.86
Electronics $ 14.30 0.4% $ 0.06
Total Spend per Cruise Party $155.54
Average Size of a Cruise Party 2.4
Total Spend per Cruise Passenger $64.81
Cruise Passenger Visits 3,725,646
Total Cruise Passenger Expenditures $241,456,139
Per crew spending estimates were derived from nearly 500 surveys completed by crew members
during the survey period. As shown in Table 14, each crew member spent an average of
$111.00 in the Bahamas. The average spend per crew member is the sum of the weighted
spending in each of the twelve categories. For example, 85 percent of the survey respondents
reported spending an average of $26.40 for food and beverages. Spread over the crew members
that reporting visiting the Bahamas, this represents an average of $22.40 per crew member. For
the entire 2011/2012 cruise year, the estimated 716,644 crew who visited the Bahamas spent
an estimated total of $79.3 million ($US). As indicated in Table 14, estimated crew
expenditures for food and beverages and entertainment accounted for 70 percent of their
expenditures in the Bahamas.
Expenditures by crew in the Bahamas were concentrated in three categories which accounted
for 80 percent of their onshore expenditures: entertainment, food and beverages and watches
and jewelry. Combined, crew spent an average of $87.80 for goods in these three categories.
12 The average shore excursion expenditure is a weighted average of the onshore and Internet purchases and the portion of the onboard purchases paid to local tour operators.

Florida-Caribbean Cruise Association Economic Impact of Cruise Tourism
Business Research and Economic Advisors Page 22
Purchases of food and beverages were the most popular expenditure item with 85% percent of
the crew reporting the purchase of food and beverages.
Table 14 – Estimated Crew Spending ($US) in the Bahamas, 2011/2012 Cruise Year
Purchase Categories Average Spend
per Crew Share of All
Onshore Visits
Weighted Average Spend
per Crew
F&B at Restaurants & Bars $ 26.40 84.8% $ 22.40
Entertainment/Night Clubs/Casinos $ 146.80 37.1% $ 54.50
Taxis/Ground Transportation $ 12.40 23.8% $ 2.96
Clothing $ 37.80 16.7% $ 6.32
Perfumes & Cosmetics $ 48.10 9.9% $ 4.77
Telephone & Internet $ 20.20 8.7% $ 1.75
Local Crafts & Souvenirs $ 23.00 7.7% $ 1.78
Other Purchases $ 11.40 7.4% $ 0.85
Retail Purchases of Liquor $ 34.10 4.3% $ 1.48
Shore Excursions $ 19.10 3.4% $ 0.65
Watches & Jewelry $ 352.10 3.1% $ 10.90
Electronics $ 121.80 2.2% $ 2.64
Total Spend per Crew $111.00
Cruise Passenger Visits 714,644
Total Cruise Passenger Expenditures $79,325,476
Cruise lines made payments to local businesses for a variety of goods and services. Net
payments to local vendors for shore excursions have been included with passenger
expenditures. However, cruise lines made other local expenditures, including payments for port
fees and taxes, navigation services, utilities and other supplies. Based upon data provided by
the FCCA member cruise lines, we estimated that all cruise lines spent $73.0 million ($US) in
the Bahamas during the 2011/2012 cruise year. Nearly all of these expenditures were payments
for port fees and taxes and navigation services.
Economic Contribution of Cruise Tourism Expenditures
As noted in the Data and Methods section of the full report, a set of economic impact models
were developed for each destination to produce estimates of the economic contribution of cruise
tourism. Data for these models were collected from a broad range of local, regional and
international sources. The impact models were designed to reflect the economic structure of
each destination, including the industrial composition of Gross Domestic Product (GDP), the
wage share of GDP by industry and average employee wages by industry.
Table 15 – Total Economic Contribution of Cruise Tourism in the Bahamas, 2011/2012
Cruise Year
Employment Wage Income ($US Millions)
Direct Economic Contribution 4,987 $ 85.6
Total Economic Contribution 8,668 $146.2

Florida-Caribbean Cruise Association Economic Impact of Cruise Tourism
Business Research and Economic Advisors Page 23
As shown in Table 15, the $393.8 million in total cruise tourism expenditures generated direct
employment of 4,987 residents of the Bahamas paying $85.6 million in annual wages. Adding
the indirect contribution that results from the spending of those local businesses that are the
direct recipients of passenger, crew and cruise line expenditures , the direct cruise tourism
expenditures generated a total employment contribution of 8,668 jobs and $146.2 million in
wage income in the Bahamas during the 2011/2012 cruise year.
Figure 9 – Total Employment Impacts by
Sector - Bahamas
Manuf. &
Construction1%
Commercial
Services73%
Transport &
Utilities24%
Business &
Financial Services
0%
Community
Services & Government
2%
Figure 10 – Total Wage Impacts by Sector
Bahamas
Manuf. &
Construction1%
Commercial
Services60%
Transport &
Utilities37%
Business &
Financial Services
0%
Community
Services & Government
2%
As shown in Figures 9 and 10, the total employment and wage impacts of cruise tourism are
concentrated in the commercial and transport sectors which account for about 97 percent of the
employment and wage impacts.13 This is not surprising since the direct impacts account for
nearly 60 percent of the total employment impacts and that virtually all of the cruise tourism
expenditures are made with businesses in these sectors. Because of the relatively higher wages
in the transport sector compared to the other sectors of the economy, the transport sector
accounts for 37 percent of the wage impacts but only 24 percent of the employment impacts.
The remainder of the total employment and wage impacts was generated by the indir ect
spending in the other sectors of the economy.
Comparison to 2009 Study
Total estimated passenger and crew visits increased by 87 percent from 2.4 million visits during the
2008/2009 cruise year to 4.4 million during the 2011/2012 cruise year. Total direct expenditures in the
Bahamas increased as well growing by 60 percent from $246 million in the 2008/2009 cruise year to $394
million in the 2011/2012 cruise year. In fact, the Bahamas ranked as the number one destination both in
terms of the level and growth in the spending and economic impacts among the 21 participating
13 The industry sectors include the following activities:
Manufacturing & Construction: residential and nonresidential construction and all manufacturing Commercial Services: wholesale and retail trade, lodging and eating and drinking establishments Transportation & Utilities: tour operators, port services, telecommunications and water and power utilities Business & Financial Services: banking, insurance, legal, accounting, leasing and other business services Community Services & Government: education, health and social services and government agencies

Florida-Caribbean Cruise Association Economic Impact of Cruise Tourism
Business Research and Economic Advisors Page 24
destinations. As indicated in Table 16, cruise tourism expenditures increased among all groups,
passengers, crew and cruise lines.
Table 16 – Comparison of Cruise Tourism Impacts, Current Study versus 2009 Study - Bahamas
Current
Study 2009
Study Percent Change
Total Onshore Visits (Thousands) 4,440.2 2,379.0 +86.6%
Passengers 3,725.6 2,019.4 + 84.4%
Crew 714.6 359.6 + 98.7%
Total Direct Expenditures ($US Millions) $ 393.8 $ 246.1 +60.0%
Passengers $ 241.5 $ 169.5 + 42.4%
Crew $ 79.3 $ 28.0 +183.2%
Cruise Lines $ 73.0 $ 48.5 + 50.5%
Average Per Passenger Expenditure $ 64.81 $83.93 -22.8% Average Per Crew Expenditure $111.00 $77.95 +42.4%
Total Employment Impact 8,668 6,219 +39.4%
Total Wage Impact ($US Millions) $ 146.2 $ 100.4 +45.6%
The growth in passenger and crew expenditures was net result of the 87 percent increase in onshore visits,
the 42 percent increase in average crew expenditures and the 23 percent decline in average passenger
expenditures. The 42 percent increase in passenger expenditures was the net result of the 84 percent
increase in passenger onshore visits and the 23 decline average passenger expenditures. Among the major
categories there was a general decline in the percentage of passengers that made onshore purchases, the
exception being food and beverages. While the average purchase for shore excursions and clothing rose, it
remained flat or declined for food and beverages, jewelry and local crafts. As noted above the net effect
was a decline in average passenger expenditures.
In the case of visiting crew, the sharp increase in per crew spending is primarily due to an impressive
increase in the percentage of crew reporting purchases in each category. As an example, in the 2009 study
65 percent of crew reported purchasing food and beverages and 14 percent entertainment. This increased
to 85 percent and 37 percent respectively in the current study. While the actual average expenditures fell
for these two categories, the sharp increase in the percentage of crew making purchases resulted in an
increase in the average expenditure across all crew visits.
As a result of the 60 percent increase in direct cruise tourism expenditures from the 2008/2009 cruise year,
the economic impacts increased as well. The total employment impact rose by 39 percent over the three-
year period while the wage impact increased by 46 percent. The higher growth in wages is due to increased
labor productivity and average wages over the intervening period.
Passenger Surveys
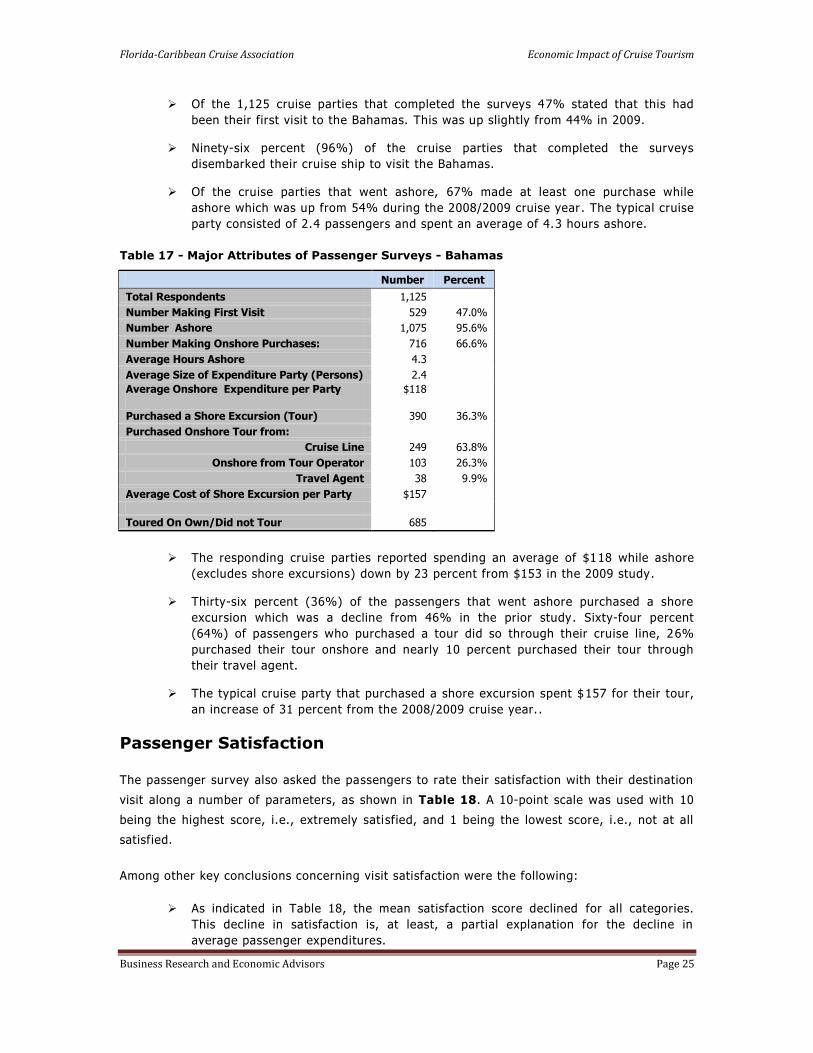
A total of 1,125 passenger surveys were completed and returned for tabulation. Table 17
shows the major attributes of passenger visits in the Bahamas as derived from the passenger
surveys.
Florida-Caribbean Cruise Association Economic Impact of Cruise Tourism
Business Research and Economic Advisors Page 25
Of the 1,125 cruise parties that completed the surveys 47% stated that this had
been their first visit to the Bahamas. This was up slightly from 44% in 2009.
Ninety-six percent (96%) of the cruise parties that completed the surveys
disembarked their cruise ship to visit the Bahamas.
Of the cruise parties that went ashore, 67% made at least one purchase while
ashore which was up from 54% during the 2008/2009 cruise year . The typical cruise
party consisted of 2.4 passengers and spent an average of 4.3 hours ashore.
Table 17 - Major Attributes of Passenger Surveys - Bahamas
Number Percent
Total Respondents 1,125
Number Making First Visit 529 47.0%
Number Ashore 1,075 95.6%
Number Making Onshore Purchases: 716 66.6%
Average Hours Ashore 4.3
Average Size of Expenditure Party (Persons) 2.4
Average Onshore Expenditure per Party $118
Purchased a Shore Excursion (Tour) 390 36.3%
Purchased Onshore Tour from:
Cruise Line 249 63.8%
Onshore from Tour Operator 103 26.3%
Travel Agent 38 9.9%
Average Cost of Shore Excursion per Party $157
Toured On Own/Did not Tour 685
The responding cruise parties reported spending an average of $118 while ashore
(excludes shore excursions) down by 23 percent from $153 in the 2009 study.
Thirty-six percent (36%) of the passengers that went ashore purchased a shore
excursion which was a decline from 46% in the prior study. Sixty-four percent
(64%) of passengers who purchased a tour did so through their cruise line, 26%
purchased their tour onshore and nearly 10 percent purchased their tour through
their travel agent.
The typical cruise party that purchased a shore excursion spent $157 for their tour,
an increase of 31 percent from the 2008/2009 cruise year. .
Passenger Satisfaction
The passenger survey also asked the passengers to rate their satisfaction with their destination
visit along a number of parameters, as shown in Table 18. A 10-point scale was used with 10
being the highest score, i.e., extremely satisfied, and 1 being the lowest score, i.e., not at all
satisfied.
Among other key conclusions concerning visit satisfaction were the following:
As indicated in Table 18, the mean satisfaction score declined for all categories.
This decline in satisfaction is, at least, a partial explanation for the decline in
average passenger expenditures.

Florida-Caribbean Cruise Association Economic Impact of Cruise Tourism
Business Research and Economic Advisors Page 26
Cruise passengers were very satisfied with their overall visit to the Bahamas with a
mean score of 7.5. However, the visit did not score as high in terms of meeting
expectations. The mean score for “Visit Met Expectations” was lower at 7.0.
Passengers felt very informed about tours and onshore activities in the Bahamas
with a mean score of 7.7.
“Guided Tours” (or Shore Excursions) received the highest score of all visit
attributes with a mean score of 7.9. Thus, cruise passengers were very satisfied
with their shore excursions.
Table 18 – Passenger Visit Satisfaction* - Bahamas
Visit Attributes
Mean Score
Current Study
2009 Study
Overall Visit 7.5 7.7
Visit Met Expectations 7.0 7.3
Likelihood of a Return Visit 5.4 5.6
Informed of Tours and Activities 7.7 7.8
Initial Shoreside Welcome 7.4 7.8
Guided Tour 7.9 8.1
Historic Sites/Museums 7.2 7.4
Variety of Things to See and Do 6.9 7.2
Friendliness of Residents 7.9 8.0
Overall Shopping Experience 7.0 7.3
Courtesy of Employees 7.9 8.1
Variety of Shops 7.0 7.2
Overall Prices 6.6 6.8
Taxis/Local Transportation 7.6 7.7
* Scale is 1 to 10 with 10 being the highest score. The mean scores can be interpreted as follows:
Extremely Satisfied: 10-9; Very Satisfied: 8-7; Somewhat Satisfied: 6-5; Not Too Satisfied: 4-3;
Not At All Satisfied: 2-1.
Passenger interactions with residents and store employees were positive with
“friendliness of residents” and “courtesy of employees” each having a mean score of
7.9.
Categories with slightly lower scores but still above 7.0 (Very Satisfied) were: initial
shoreside welcome, historic sites, and local transportation.
The overall shopping experience, including the variety of shops and ove rall prices,
received a mean score of 7.0 (Very Satisfied). Thus, while passengers thought shop
employees were very courteous, the overall score for their shopping experience was
brought down by lower perceptions on the variety of shops (7.0) and overall prices
(6.6).
Cruise passengers stated that they were somewhat likely to return to the Bahamas
for a land-based vacation with a mean score of 5.4.
Florida-Caribbean Cruise Association Economic Impact of Cruise Tourism
Business Research and Economic Advisors Page 27
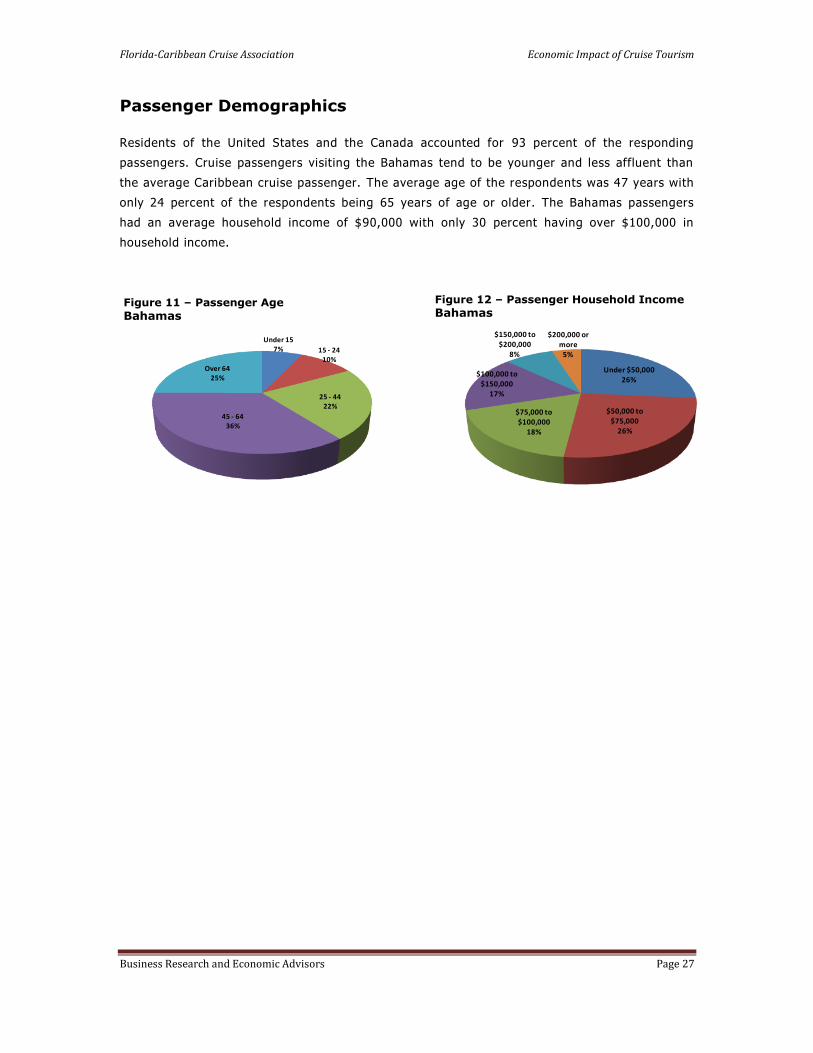
Passenger Demographics
Residents of the United States and the Canada accounted for 93 percent of the responding
passengers. Cruise passengers visiting the Bahamas tend to be younger and less affluent than
the average Caribbean cruise passenger. The average age of the respondents was 47 years with
only 24 percent of the respondents being 65 years of age or older. The Bahamas passengers
had an average household income of $90,000 with only 30 percent having over $100,000 in
household income.
Figure 11 – Passenger Age
Bahamas
Under 157% 15 - 24
10%
25 - 4422%
45 - 6436%
Over 6425%
Figure 12 – Passenger Household Income
Bahamas
Under $50,00026%
$50,000 to $75,000
26%
$75,000 to $100,000
18%
$100,000 to $150,000
17%
$150,000 to $200,000
8%
$200,000 or more
5%

Florida-Caribbean Cruise Association Economic Impact of Cruise Tourism
Business Research and Economic Advisors Page 28
Barbados
At the core of the analysis of the economic contribution of cruise tourism were a set of
passenger and crew surveys that were conducted onboard ships of the FCCA member cruise
lines.14 The surveys were undertaken during the six-month period beginning in December 2011
and ending in May 2012. The survey schedule was designed so that surveys were conducted by
FCCA member cruise lines that called at each destination and that the distribution of passenger
and crew surveys would reflect the distribution of passenger and crew arrivals by cruise line at
each destination. On any given cruise itinerary, passenger and crew surveys were placed in all
passenger cabins and crew quarters following a single destination call. The surveys were
completed by the passengers and crew in the privacy of their quarters and returned to a
designated office on the cruise ship. Thus, passengers and crew were only surveyed once during
a cruise itinerary and for a single destination. On a subsequent itinerary, passengers were
surveyed following a call at a different dest ination.
The passenger and crew surveys were designed to collect data for onshore spending and visit
satisfaction by both passengers and crew. While the crew survey was slightly shorter than the
passenger survey, both surveys were designed to collect the following information:
hours spent ashore;
expenditures by category, including shore tours, food & beverages, c lothing, etc.;
visit satisfaction, including shore tour, friendliness of residents, prices, shopping,
etc.;
likelihood of returning for a land-based vacation; and
demographic characteristics, including country of residence, age group, income, etc.
Combining the expenditure data collected from the passenger and crew surveys with data on
expenditures by cruise lines for port fees and services, payments to local tour operators for
passenger shore excursions purchased onboard the cruise ships, and other provisi ons purchased
locally by the cruise lines, estimates of total cruise tourism expenditures were developed for
each participating destination.
Given the direct spending estimates, the economic contribution of these expenditures, as
measured by employment and wage income were then estimated for each destination. This
process began with the collection of economic data for each destination from a combination of
local, regional and international sources. Utilizing all of these data a set of economic impact
models were developed for each destination to estimate the direct and total employment and
wage impacts. A more detailed description of these models is provided in the Data and
Methods section of Volume I.
14 Surveys were conducted on the ships of the following cruise lines: Carnival Cruise Lines, Celebrity Cruises, Disney Cruise Line, Holland America Line, Norwegian Cruise Line, Princess Cruises, P&O Cruises and Royal Caribbean International.

Florida-Caribbean Cruise Association Economic Impact of Cruise Tourism
Business Research and Economic Advisors Page 29
Cruise Tourism Expenditures
Cruise tourism expenditures in destination ports are composed of a broad range of spending
including:
onshore expenditures by passengers which tend to be concentrated in shore excursions
and retail purchases of clothing, jewelry and local crafts and souvenirs;
onshore expenditures by crew which are generally concentrated in purchases of food
and beverages, local transportation and retail purchases of clothing and electronics ;
expenditures by cruise lines for port services, such as dockage fees and linesmen,
utilities, such as water and power and navigation services; and
purchases of supplies, such as food and other stores, by the cruise lines from local
businesses.
According to data provided by the Barbados Port Inc., a total of 770,608 cruise passengers
arrived in Barbados during the 2011/2012 cruise year.15 These included 655,223 transit
passengers and 115,385 passengers embarking on their cruises in Barbados. Of the transit
passengers, an estimated 491,417 passengers (75 percent) disembarked and visited Barbados.
Utilizing additional data provided by the visiting cruise lines, we have estimated that 311,471
crew were aboard the cruise ships that sailed to and from Barbados and that 38 percent, or
120,024 crew, disembarked and visited the island. These passenger and crew vi sits along with
additional expenditures by the cruise lines generated a total of $53.7 million ($US) in cruise
tourism expenditures in Barbados during the 2011/2012 cruise year. The contribution of
expenditures by passengers, crew and cruise lines to this total is discussed below.
Passenger expenditures were estimated separately for transit and homeport passengers. Per
passenger spending estimates for transit passengers were derived from the 1,332 surveys
completed by passengers that went ashore during the survey period. As shown in Table 19,
each passenger cruise party spent an average of $128.77 in Barbados. The average spend per
cruise party is the sum of the weighted spending in each of the twelve categories. For example,
34 percent of the survey respondents reported spending an average of $19.10 at local
restaurants and/or bars. Spread over the cruise parties that visited Barbados, this represents an
average of $6.55 per party. On a per passenger basis, the average total expenditure was
$64.38. This represents the sum of per party expenditures, $128.77, divided by the average size
of a cruise party in Barbados, 2.0 passengers.
Transit cruise passenger expenditures in Barbados were concentrated in four categories which
accounted for 76 percent of their onshore expenditures: shore excursions, watches and jewelry,
clothing and local crafts. Nearly 40 percent or more of the passengers that went ashore made
purchases in the following categories: shore excursions, local crafts and clothing.
15 The 2011/2012 cruise year includes the twelve months beginning in May, 2011 and ending in April, 2012.
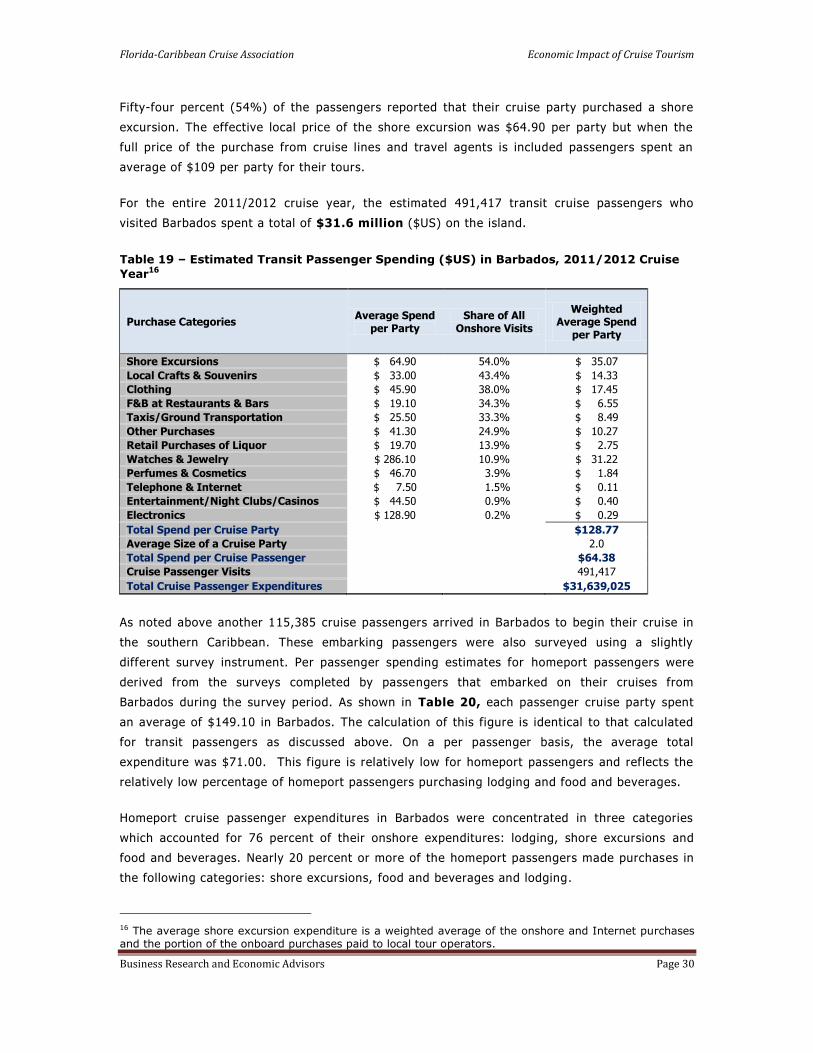
Florida-Caribbean Cruise Association Economic Impact of Cruise Tourism
Business Research and Economic Advisors Page 30
Fifty-four percent (54%) of the passengers reported that their cruise party purchased a shore
excursion. The effective local price of the shore excursion was $64.90 per party but when the
full price of the purchase from cruise lines and travel agents is included passengers spent an
average of $109 per party for their tours.
For the entire 2011/2012 cruise year, the estimated 491,417 transit cruise passengers who
visited Barbados spent a total of $31.6 million ($US) on the island.
Table 19 – Estimated Transit Passenger Spending ($US) in Barbados, 2011/2012 Cruise
Year16
Purchase Categories Average Spend
per Party Share of All
Onshore Visits
Weighted Average Spend
per Party
Shore Excursions $ 64.90 54.0% $ 35.07
Local Crafts & Souvenirs $ 33.00 43.4% $ 14.33
Clothing $ 45.90 38.0% $ 17.45
F&B at Restaurants & Bars $ 19.10 34.3% $ 6.55
Taxis/Ground Transportation $ 25.50 33.3% $ 8.49
Other Purchases $ 41.30 24.9% $ 10.27
Retail Purchases of Liquor $ 19.70 13.9% $ 2.75
Watches & Jewelry $ 286.10 10.9% $ 31.22
Perfumes & Cosmetics $ 46.70 3.9% $ 1.84
Telephone & Internet $ 7.50 1.5% $ 0.11
Entertainment/Night Clubs/Casinos $ 44.50 0.9% $ 0.40
Electronics $ 128.90 0.2% $ 0.29
Total Spend per Cruise Party $128.77
Average Size of a Cruise Party 2.0
Total Spend per Cruise Passenger $64.38
Cruise Passenger Visits 491,417
Total Cruise Passenger Expenditures $31,639,025
As noted above another 115,385 cruise passengers arrived in Barbados to begin their cruise in
the southern Caribbean. These embarking passengers were also surveyed using a slightly
different survey instrument. Per passenger spending estimates for homeport passengers were
derived from the surveys completed by passengers that embarked on their cruises from
Barbados during the survey period. As shown in Table 20, each passenger cruise party spent
an average of $149.10 in Barbados. The calculation of this figure is identical to that calculated
for transit passengers as discussed above. On a per passenger basis, the average total
expenditure was $71.00. This figure is relatively low for homeport passengers and reflects the
relatively low percentage of homeport passengers purchasing lodging and food and beverages.
Homeport cruise passenger expenditures in Barbados were concentrated in three categories
which accounted for 76 percent of their onshore expenditures: lodging, shore excursions and
food and beverages. Nearly 20 percent or more of the homeport passengers made purchases in
the following categories: shore excursions, food and beverages and lodging.
16 The average shore excursion expenditure is a weighted average of the onshore and Internet purchases and the portion of the onboard purchases paid to local tour operators.
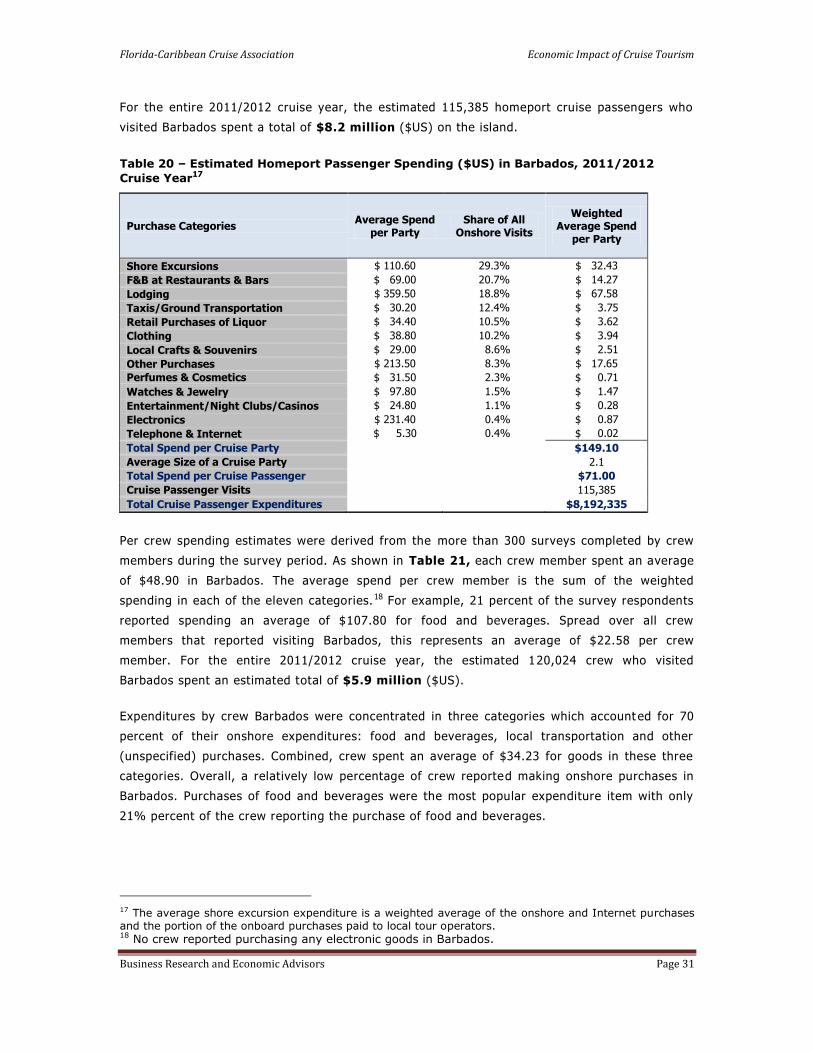
Florida-Caribbean Cruise Association Economic Impact of Cruise Tourism
Business Research and Economic Advisors Page 31
For the entire 2011/2012 cruise year, the estimated 115,385 homeport cruise passengers who
visited Barbados spent a total of $8.2 million ($US) on the island.
Table 20 – Estimated Homeport Passenger Spending ($US) in Barbados, 2011/2012
Cruise Year17
Purchase Categories Average Spend
per Party Share of All
Onshore Visits
Weighted Average Spend
per Party
Shore Excursions $ 110.60 29.3% $ 32.43
F&B at Restaurants & Bars $ 69.00 20.7% $ 14.27
Lodging $ 359.50 18.8% $ 67.58
Taxis/Ground Transportation $ 30.20 12.4% $ 3.75
Retail Purchases of Liquor $ 34.40 10.5% $ 3.62
Clothing $ 38.80 10.2% $ 3.94
Local Crafts & Souvenirs $ 29.00 8.6% $ 2.51
Other Purchases $ 213.50 8.3% $ 17.65
Perfumes & Cosmetics $ 31.50 2.3% $ 0.71
Watches & Jewelry $ 97.80 1.5% $ 1.47
Entertainment/Night Clubs/Casinos $ 24.80 1.1% $ 0.28
Electronics $ 231.40 0.4% $ 0.87
Telephone & Internet $ 5.30 0.4% $ 0.02
Total Spend per Cruise Party $149.10
Average Size of a Cruise Party 2.1
Total Spend per Cruise Passenger $71.00
Cruise Passenger Visits 115,385
Total Cruise Passenger Expenditures $8,192,335
Per crew spending estimates were derived from the more than 300 surveys completed by crew
members during the survey period. As shown in Table 21, each crew member spent an average
of $48.90 in Barbados. The average spend per crew member is the sum of the weighted
spending in each of the eleven categories. 18 For example, 21 percent of the survey respondents
reported spending an average of $107.80 for food and beverages. Spread over all crew
members that reported visiting Barbados, this represents an average of $22.58 per crew
member. For the entire 2011/2012 cruise year, the estimated 120,024 crew who visited
Barbados spent an estimated total of $5.9 million ($US).
Expenditures by crew Barbados were concentrated in three categories which account ed for 70
percent of their onshore expenditures: food and beverages, local transportation and other
(unspecified) purchases. Combined, crew spent an average of $34.23 for goods in these three
categories. Overall, a relatively low percentage of crew reported making onshore purchases in
Barbados. Purchases of food and beverages were the most popular expenditure item with only
21% percent of the crew reporting the purchase of food and beverages.
17 The average shore excursion expenditure is a weighted average of the onshore and Internet purchases and the portion of the onboard purchases paid to local tour operators. 18 No crew reported purchasing any electronic goods in Barbados.

Florida-Caribbean Cruise Association Economic Impact of Cruise Tourism
Business Research and Economic Advisors Page 32
Table 21 – Estimated Crew Spending ($US) in Barbados, 2011/2012 Cruise Year
Purchase Categories Average Spend
per Crew Share of All
Onshore Visits
Weighted Average Spend
per Crew
F&B at Restaurants & Bars $ 107.80 21.0% $ 22.58
Taxis/Ground Transportation $ 90.90 6.0% $ 5.48
Watches & Jewelry $ 88.20 1.9% $ 1.68
Clothing $ 56.30 4.4% $ 2.50
Entertainment/Night Clubs/Casinos $ 293.00 0.6% $ 1.86
Other Purchases $ 176.70 3.5% $ 6.17
Shore Excursions $ 28.40 1.3% $ 0.36
Perfumes & Cosmetics $ 83.70 2.2% $ 1.86
Local Crafts & Souvenirs $ 43.60 7.6% $ 3.32
Retail Purchases of Liquor $ 43.10 1.9% $ 0.82
Telephone & Internet $ 52.50 1.9% $ 1.00
Total Spend per Crew $48.90
Cruise Passenger Visits 120,024
Total Cruise Passenger Expenditures $5,869,175
Cruise lines made payments to local businesses for a variety of goods and services. Net
payments to local vendors for shore excursions have been included with passenger
expenditures. However, cruise lines made other local expenditures, including payments for port
fees and taxes, navigation services, utilities and other supplies. Based upon data provided by
the FCCA member cruise lines, we estimated that all cruise lines spent $8.0 million ($US) in
Barbados during the 2011/2012 cruise year. Approximately 90 percent of these expenditures
were payments for port fees and navigation services while the remaining 10 percent consisted
of payments for ship supplies.
Economic Contribution of Cruise Tourism Expenditures
As noted in the Data and Methods section of the full report, a set of economic impact models
were developed for each destination to produce estimates of the economic contribution of cruise
tourism. Data for these models were collected from a broad range of local, regional and
international sources. The impact models were designed to reflect the economic structure of
each destination, including the industrial composition of Gross Domestic Product (GDP), the
wage share of GDP by industry and average employee wages by industry.
Table 22 – Total Economic Contribution of Cruise Tourism in Barbados, 2011/2012 Cruise Year
Employment Wage Income ($US Millions)
Direct Economic Contribution 947 $10.3
Total Economic Contribution 1,794 $18.3
As shown in Table 22, the $53.7 million in total cruise tourism expenditures generated direct
employment of 947 residents of Barbados paying $10.3 million in annual wages. Adding the
indirect contribution that results from the spending of those local businesses that are the direct
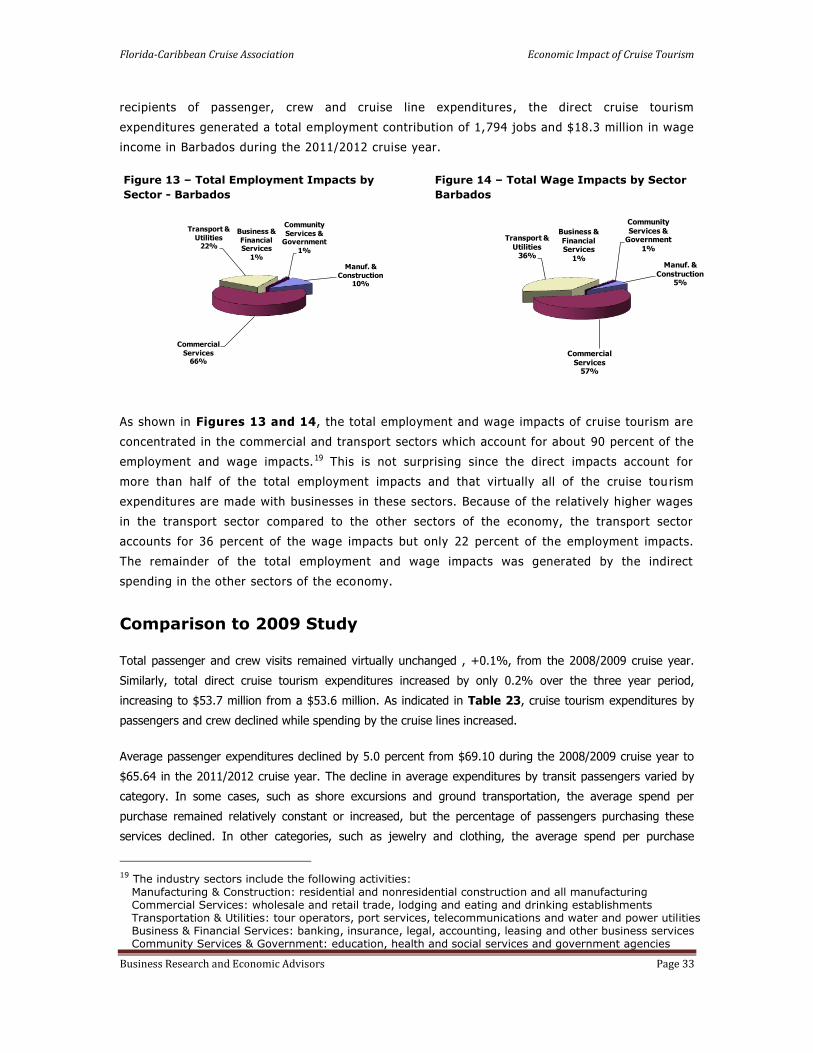
Florida-Caribbean Cruise Association Economic Impact of Cruise Tourism
Business Research and Economic Advisors Page 33
recipients of passenger, crew and cruise line expenditures , the direct cruise tourism
expenditures generated a total employment contribution of 1,794 jobs and $18.3 million in wage
income in Barbados during the 2011/2012 cruise year.
Figure 13 – Total Employment Impacts by
Sector - Barbados
Manuf. &
Construction10%
Commercial
Services66%
Transport &
Utilities22%
Business &
Financial Services
1%
Community
Services & Government
1%
Figure 14 – Total Wage Impacts by Sector
Barbados
Manuf. &
Construction5%
Commercial
Services57%
Transport &
Utilities36%
Business &
Financial Services
1%
Community
Services & Government
1%
As shown in Figures 13 and 14, the total employment and wage impacts of cruise tourism are
concentrated in the commercial and transport sectors which account for about 90 percent of the
employment and wage impacts.19 This is not surprising since the direct impacts account for
more than half of the total employment impacts and that virtually all of the cruise tou rism
expenditures are made with businesses in these sectors. Because of the relatively higher wages
in the transport sector compared to the other sectors of the economy, the transport sector
accounts for 36 percent of the wage impacts but only 22 percent of the employment impacts.
The remainder of the total employment and wage impacts was generated by the indirect
spending in the other sectors of the economy.
Comparison to 2009 Study
Total passenger and crew visits remained virtually unchanged , +0.1%, from the 2008/2009 cruise year.
Similarly, total direct cruise tourism expenditures increased by only 0.2% over the three year period,
increasing to $53.7 million from a $53.6 million. As indicated in Table 23, cruise tourism expenditures by
passengers and crew declined while spending by the cruise lines increased.
Average passenger expenditures declined by 5.0 percent from $69.10 during the 2008/2009 cruise year to
$65.64 in the 2011/2012 cruise year. The decline in average expenditures by transit passengers varied by
category. In some cases, such as shore excursions and ground transportation, the average spend per
purchase remained relatively constant or increased, but the percentage of passengers purchasing these
services declined. In other categories, such as jewelry and clothing, the average spend per purchase
19 The industry sectors include the following activities:
Manufacturing & Construction: residential and nonresidential construction and all manufacturing Commercial Services: wholesale and retail trade, lodging and eating and drinking establishments Transportation & Utilities: tour operators, port services, telecommunications and water and power utilities Business & Financial Services: banking, insurance, legal, accounting, leasing and other business services Community Services & Government: education, health and social services and government agencies
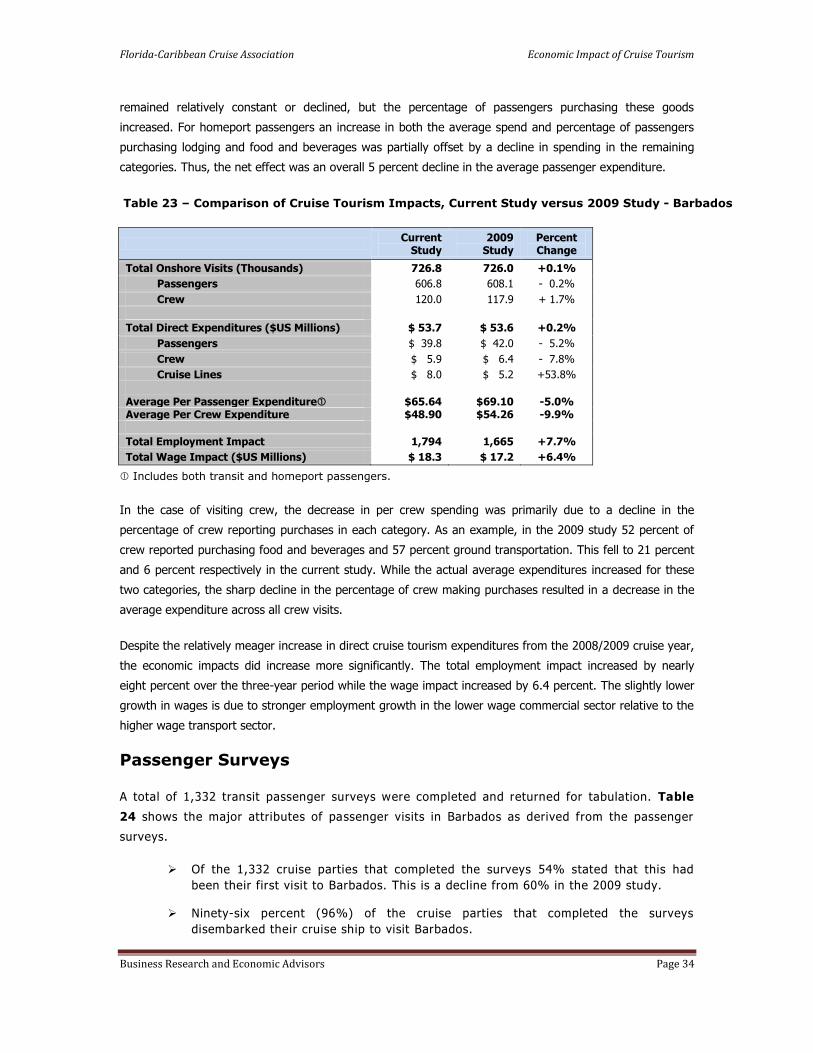
Florida-Caribbean Cruise Association Economic Impact of Cruise Tourism
Business Research and Economic Advisors Page 34
remained relatively constant or declined, but the percentage of passengers purchasing these goods
increased. For homeport passengers an increase in both the average spend and percentage of passengers
purchasing lodging and food and beverages was partially offset by a decline in spending in the remaining
categories. Thus, the net effect was an overall 5 percent decline in the average passenger expenditure.
Table 23 – Comparison of Cruise Tourism Impacts, Current Study versus 2009 Study - Barbados
Current
Study 2009
Study Percent Change
Total Onshore Visits (Thousands) 726.8 726.0 +0.1%
Passengers 606.8 608.1 - 0.2%
Crew 120.0 117.9 + 1.7%
Total Direct Expenditures ($US Millions) $ 53.7 $ 53.6 +0.2%
Passengers $ 39.8 $ 42.0 - 5.2%
Crew $ 5.9 $ 6.4 - 7.8%
Cruise Lines $ 8.0 $ 5.2 +53.8%
Average Per Passenger Expenditure $65.64 $69.10 -5.0% Average Per Crew Expenditure $48.90 $54.26 -9.9%
Total Employment Impact 1,794 1,665 +7.7%
Total Wage Impact ($US Millions) $ 18.3 $ 17.2 +6.4%
Includes both transit and homeport passengers.
In the case of visiting crew, the decrease in per crew spending was primarily due to a decline in the
percentage of crew reporting purchases in each category. As an example, in the 2009 study 52 percent of
crew reported purchasing food and beverages and 57 percent ground transportation. This fell to 21 percent
and 6 percent respectively in the current study. While the actual average expenditures increased for these
two categories, the sharp decline in the percentage of crew making purchases resulted in a decrease in the
average expenditure across all crew visits.
Despite the relatively meager increase in direct cruise tourism expenditures from the 2008/2009 cruise year,
the economic impacts did increase more significantly. The total employment impact increased by nearly
eight percent over the three-year period while the wage impact increased by 6.4 percent. The slightly lower
growth in wages is due to stronger employment growth in the lower wage commercial sector relative to the
higher wage transport sector.
Passenger Surveys
A total of 1,332 transit passenger surveys were completed and returned for tabulation. Table
24 shows the major attributes of passenger visits in Barbados as derived from the passenger
surveys.
Of the 1,332 cruise parties that completed the surveys 54% stated that this had
been their first visit to Barbados. This is a decline from 60% in the 2009 study.
Ninety-six percent (96%) of the cruise parties that completed the surveys
disembarked their cruise ship to visit Barbados.

Florida-Caribbean Cruise Association Economic Impact of Cruise Tourism
Business Research and Economic Advisors Page 35
Of the cruise parties that went ashore, 69% made at least one purchase while
ashore, a decline from 77% during the 2008/2009 cruise year . The typical cruise
party consisted of 2.0 passengers and spent an average of 4.2 hours ashore.
The responding cruise parties reported spending an average of $93.70 while ashore
(excludes shore excursions) which was a 5 percent decline from $99 during the
2008/2009 cruise year.
Table 24 - Major Attributes of Transit Passenger Surveys - Barbados
Number Percent
Total Respondents 1,332
Number Making First Visit 719 54.0%
Number Ashore 1,284 96.4%
Number Making Onshore Purchases: 889 69.2%
Average Hours Ashore 4.2
Average Size of Expenditure Party (Persons) 2.0
Average Onshore Expenditure per Party $93.70
Purchased a Shore Excursion (Tour) 694 54.0%
Purchased Onshore Tour from:
Cruise Line 545 78.6%
Onshore from Tour Operator 78 11.3%
Travel Agent 71 10.1%
Average Cost of Shore Excursion per Party $109.40
Toured On Own/Did not Tour 590
Fifty-four percent (54%) of the passengers that went ashore purchased a shore
excursion, down from 58% in the 2009 study. Seventy-nine percent (79%) of
passengers who purchased a tour did so through their cruise line, just over 11%
purchased their tour onshore and 10 percent purchased their tour through their
travel agent.
The typical cruise party that purchased a shore excursion spent $109.40 for their
tour, a two percent drop from the 2009 study.
Passenger Satisfaction
The passenger survey also asked the passengers to rate their satisfaction with their destination
visit along a number of parameters, as shown in Table 25. A 10-point scale was used with 10
being the highest score, i.e., extremely satisfied, and 1 being the lowest score, i.e., not at all
satisfied.
Among other key conclusions concerning visit satisfaction were the following:
Cruise passengers reported a significant increase in their visit satisfaction in the
current study relative to the 2009 study. The mean scores for all visit attributes
increased.
Cruise passengers were very satisfied with their overall visit to Barbados with a
mean score of 7.9. Cruise passengers also reported that their visit to Barbados
exceeded their expectations with a 7.5 mean score for “Visit Met Expectations” .
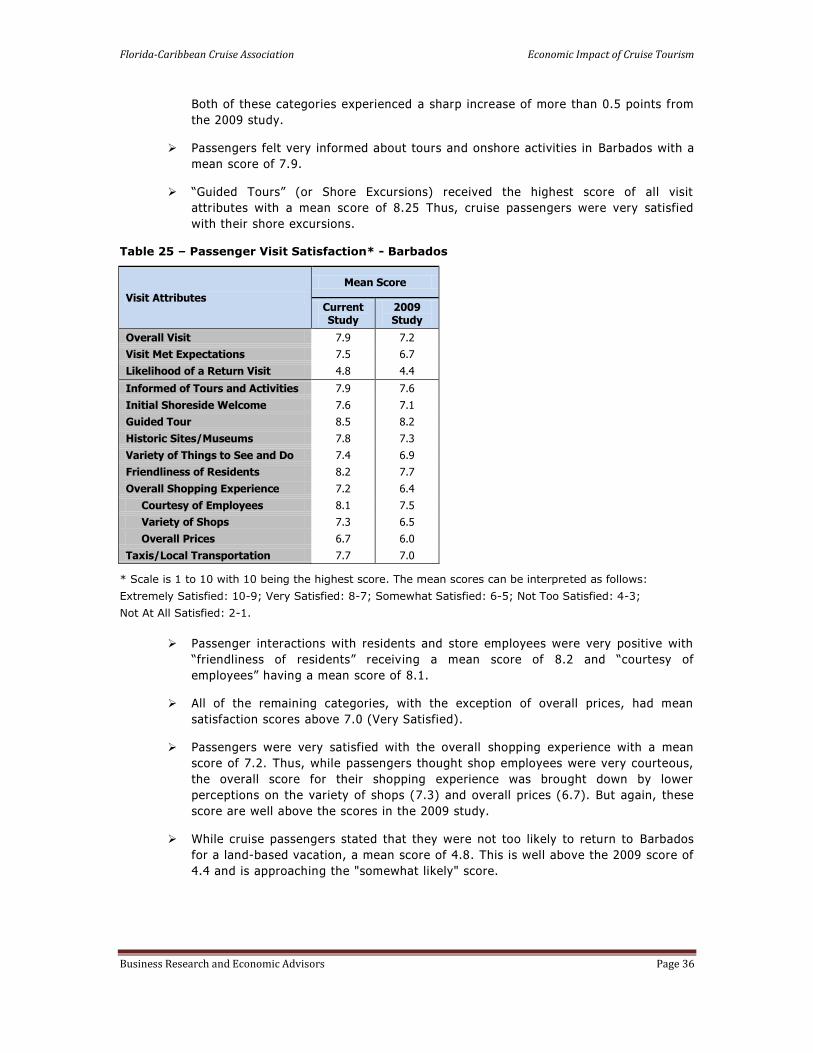
Florida-Caribbean Cruise Association Economic Impact of Cruise Tourism
Business Research and Economic Advisors Page 36
Both of these categories experienced a sharp increase of more than 0.5 points from
the 2009 study.
Passengers felt very informed about tours and onshore activities in Barbados with a
mean score of 7.9.
“Guided Tours” (or Shore Excursions) received the highest score of all visit
attributes with a mean score of 8.25 Thus, cruise passengers were very satisfied
with their shore excursions.
Table 25 – Passenger Visit Satisfaction* - Barbados
Visit Attributes
Mean Score
Current Study
2009 Study
Overall Visit 7.9 7.2
Visit Met Expectations 7.5 6.7
Likelihood of a Return Visit 4.8 4.4
Informed of Tours and Activities 7.9 7.6
Initial Shoreside Welcome 7.6 7.1
Guided Tour 8.5 8.2
Historic Sites/Museums 7.8 7.3
Variety of Things to See and Do 7.4 6.9
Friendliness of Residents 8.2 7.7
Overall Shopping Experience 7.2 6.4
Courtesy of Employees 8.1 7.5
Variety of Shops 7.3 6.5
Overall Prices 6.7 6.0
Taxis/Local Transportation 7.7 7.0
* Scale is 1 to 10 with 10 being the highest score. The mean scores can be interpreted as follows:
Extremely Satisfied: 10-9; Very Satisfied: 8-7; Somewhat Satisfied: 6-5; Not Too Satisfied: 4-3;
Not At All Satisfied: 2-1.
Passenger interactions with residents and store employees were very positive with
“friendliness of residents” receiv ing a mean score of 8.2 and “courtesy of
employees” having a mean score of 8.1.
All of the remaining categories, with the exception of overall prices, had mean
satisfaction scores above 7.0 (Very Satisfied).
Passengers were very satisfied with the overall shopping experience with a mean
score of 7.2. Thus, while passengers thought shop employees were very courteous,
the overall score for their shopping experience was brought down by lower
perceptions on the variety of shops (7.3) and overall prices (6.7). But again, these
score are well above the scores in the 2009 study.
While cruise passengers stated that they were not too likely to return to Barbados
for a land-based vacation, a mean score of 4.8. This is well above the 2009 score of
4.4 and is approaching the "somewhat likely" score.
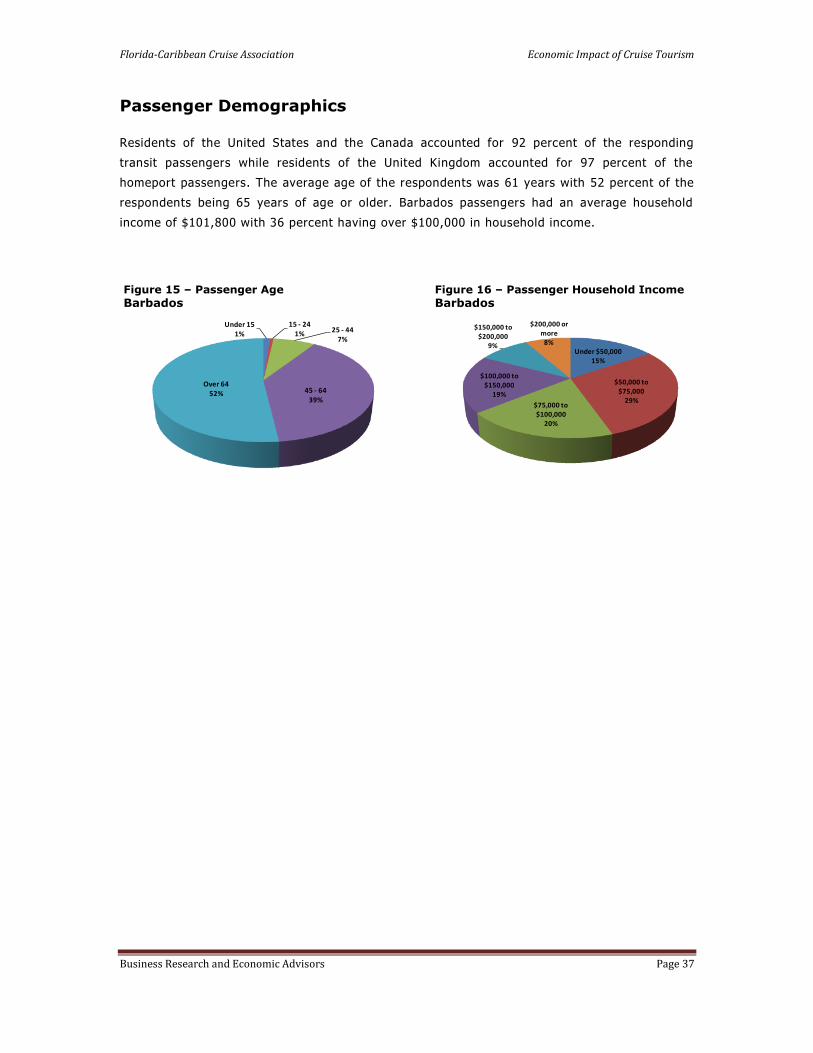
Florida-Caribbean Cruise Association Economic Impact of Cruise Tourism
Business Research and Economic Advisors Page 37
Passenger Demographics
Residents of the United States and the Canada accounted for 92 percent of the responding
transit passengers while residents of the United Kingdom accounted for 97 percent of the
homeport passengers. The average age of the respondents was 61 years with 52 percent of the
respondents being 65 years of age or older. Barbados passengers had an average household
income of $101,800 with 36 percent having over $100,000 in household income.
Figure 15 – Passenger Age
Barbados
Under 151%
15 - 241%
25 - 447%
45 - 6439%
Over 6452%
Figure 16 – Passenger Household Income
Barbados
Under $50,00015%
$50,000 to $75,000
29%$75,000 to $100,000
20%
$100,000 to $150,000
19%
$150,000 to $200,000
9%
$200,000 or more
8%

Florida-Caribbean Cruise Association Economic Impact of Cruise Tourism
Business Research and Economic Advisors Page 38
Belize
At the core of the analysis of the economic contribution of cruise tourism were a set of
passenger and crew surveys that were conducted onboard ships of the FCCA member cruise
lines.20 The surveys were undertaken during the six-month period beginning in December 2011
and ending in May 2012. The survey schedule was designed so that surveys were conducted by
FCCA member cruise lines that called at each destination and that the distribution of passenger
and crew surveys would reflect the distribution of passenger and crew arrivals by cruise line at
each destination. On any given cruise itinerary, passenger and crew surveys were placed i n all
passenger cabins and crew quarters following a single destination call. The surveys were
completed by the passengers and crew in the privacy of their quarters and returned to a
designated office on the cruise ship. Thus, passengers and crew were only surveyed once during
a cruise itinerary and for a single destination. On a subsequent itinerary, passengers were
surveyed following a call at a different dest ination.
The passenger and crew surveys were designed to collect data for onshore spending and v isit
satisfaction by both passengers and crew. While the crew survey was slightly shorter than the
passenger survey, both surveys were designed to collect the following information:
hours spent ashore;
expenditures by category, including shore tours, food & beverages, clothing, etc.;
visit satisfaction, including shore tour, friendliness of residents, prices, shopping,
etc.;
likelihood of returning for a land-based vacation; and
demographic characteristics, including country of residence, age group, income, etc.
Combining the expenditure data collected from the passenger and crew surveys with data on
expenditures by cruise lines for port fees and services, payments to local tour operators for
passenger shore excursions purchased onboard the cruise ships, and other provisions purchased
locally by the cruise lines, estimates of total cruise tourism expenditures were developed for
each participating destination.
Given the direct spending estimates, the economic contribution of these expenditures, as
measured by employment and wage income were then estimated for each destination. This
process began with the collection of economic data for each destination from a combination of
local, regional and international sources. Utilizing all of these data a set of economic impact
models were developed for each destination to estimate the direct and total employment and
wage impacts. A more detailed description of these models is provided in the Data and
Methods section of Volume I.
20 Surveys were conducted on the ships of the following cruise lines: Carnival Cruise Lines, Celebrity Cruises, Disney Cruise Line, Holland America Line, Norwegian Cruise Line, Princess Cruises, P&O Cruises and Royal Caribbean International.

Florida-Caribbean Cruise Association Economic Impact of Cruise Tourism
Business Research and Economic Advisors Page 39
Cruise Tourism Expenditures
Cruise tourism expenditures in destination ports are composed of a broad range of spending
including:
onshore expenditures by passengers which tend to be concentrated in shore excursions
and retail purchases of clothing, jewelry and local crafts and souvenirs;
onshore expenditures by crew which are generally concentrated in purchases of food
and beverages, local transportation and retail purchases of clothing and electronics ;
expenditures by cruise lines for port services, such as dockage fees and linesmen,
utilities, such as water and power and navigation services; and
purchases of supplies, such as food and other stores, by the cruise lines from local
businesses.
Based on data collected from the ports of the participating destinations and the CTO, 731,247
cruise passengers arrived aboard cruise ships during the 2011/2012 cruise year.21 Of these, an
estimated 608,398 passengers (83 percent) disembarked and visited Belize. Utilizing additional
data provided by the visiting cruise lines, we have est imated that 292,379 crew were aboard the
cruise ships and that 25 percent, or 73,636 crew, disembarked and visited Belize. These
passenger and crew visits along with additional expenditures by the cruise lines gene rated a
total of $61.0 million ($US) in cruise tourism expenditures in Belize during the 2011/2012
cruise year. The contribution of expenditures by passengers, crew and cruise lines to this total
is discussed below.
Table 26 – Estimated Passenger Spending ($US) in Belize, 2011/2012 Cruise Year22
Purchase Categories Average Spend
per Party Share of All
Onshore Visits
Weighted Average Spend
per Party
Shore Excursions $ 90.80 70.3% $ 63.80
Local Crafts & Souvenirs $ 30.30 52.9% $ 16.02
F&B at Restaurants & Bars $ 20.50 52.7% $ 10.81
Clothing $ 38.60 40.4% $ 15.60
Other Purchases $ 86.20 21.4% $ 18.43
Watches & Jewelry $ 340.70 10.3% $ 35.00
Retail Purchases of Liquor $ 41.00 7.3% $ 2.98
Taxis/Ground Transportation $ 39.00 4.8% $ 1.87
Perfumes & Cosmetics $ 29.60 2.3% $ 0.69
Telephone & Internet $ 105.00 1.8% $ 1.87
Entertainment/Night Clubs/Casinos $ 75.70 1.1% $ 0.83
Total Spend per Cruise Party $167.90
Average Size of a Cruise Party 2.3
Total Spend per Cruise Passenger $73.00
Cruise Passenger Visits 608,398
Total Cruise Passenger Expenditures $44,412,704
21 The 2011/2012 cruise year includes the twelve months beginning in May, 2011 and ending in April, 2012. 22 The average shore excursion expenditure is a weighted average of the onshore and Internet purchases and the portion of the onboard purchases paid to local tour operators.
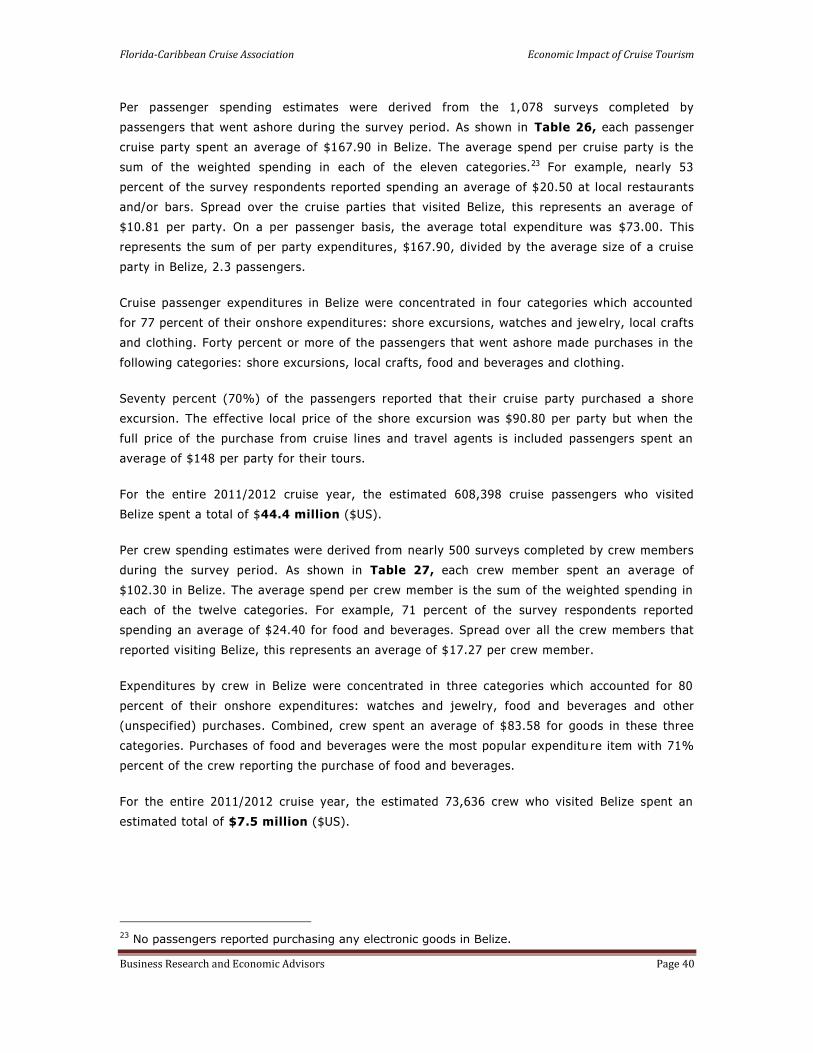
Florida-Caribbean Cruise Association Economic Impact of Cruise Tourism
Business Research and Economic Advisors Page 40
Per passenger spending estimates were derived from the 1,078 surveys completed by
passengers that went ashore during the survey period. As shown in Table 26, each passenger
cruise party spent an average of $167.90 in Belize. The average spend per cruise party is the
sum of the weighted spending in each of the eleven categories.23 For example, nearly 53
percent of the survey respondents reported spending an average of $20.50 at local restaurants
and/or bars. Spread over the cruise parties that visited Belize, this represents an average of
$10.81 per party. On a per passenger basis, the average total expenditure was $73.00. This
represents the sum of per party expenditures, $167.90, divided by the average size of a cruise
party in Belize, 2.3 passengers.
Cruise passenger expenditures in Belize were concentrated in four categories which accounted
for 77 percent of their onshore expenditures: shore excursions, watches and jew elry, local crafts
and clothing. Forty percent or more of the passengers that went ashore made purchases in the
following categories: shore excursions, local crafts, food and beverages and clothing.
Seventy percent (70%) of the passengers reported that the ir cruise party purchased a shore
excursion. The effective local price of the shore excursion was $90.80 per party but when the
full price of the purchase from cruise lines and travel agents is included passengers spent an
average of $148 per party for their tours.
For the entire 2011/2012 cruise year, the estimated 608,398 cruise passengers who visited
Belize spent a total of $44.4 million ($US).
Per crew spending estimates were derived from nearly 500 surveys completed by crew members
during the survey period. As shown in Table 27, each crew member spent an average of
$102.30 in Belize. The average spend per crew member is the sum of the weighted spending in
each of the twelve categories. For example, 71 percent of the survey respondents reported
spending an average of $24.40 for food and beverages. Spread over all the crew members that
reported visiting Belize, this represents an average of $17.27 per crew member.
Expenditures by crew in Belize were concentrated in three categories which accounted for 80
percent of their onshore expenditures: watches and jewelry, food and beverages and other
(unspecified) purchases. Combined, crew spent an average of $83.58 for goods in these three
categories. Purchases of food and beverages were the most popular expenditu re item with 71%
percent of the crew reporting the purchase of food and beverages.
For the entire 2011/2012 cruise year, the estimated 73,636 crew who visited Belize spent an
estimated total of $7.5 million ($US).
23 No passengers reported purchasing any electronic goods in Belize.

Florida-Caribbean Cruise Association Economic Impact of Cruise Tourism
Business Research and Economic Advisors Page 41
Table 27 – Estimated Crew Spending ($US) in Belize, 2011/2012 Cruise Year
Purchase Categories Average Spend
per Crew Share of All
Onshore Visits
Weighted Average Spend
per Crew
F&B at Restaurants & Bars $ 24.40 70.8% $ 17.27
Taxis/Ground Transportation $ 15.20 17.0% $ 2.58
Local Crafts & Souvenirs $ 18.10 15.8% $ 2.86
Clothing $ 45.90 15.2% $ 6.98
Other Purchases $ 187.80 11.1% $ 20.87
Watches & Jewelry $ 468.50 9.7% $ 45.44
Perfumes & Cosmetics $ 37.40 5.3% $ 1.97
Telephone & Internet $ 6.60 4.7% $ 0.31
Shore Excursions $ 33.70 4.1% $ 1.38
Retail Purchases of Liquor $ 36.30 2.9% $ 1.06
Entertainment/Night Clubs/Casinos $ 59.90 1.8% $ 1.05
Electronics $ 90.60 0.6% $ 0.53
Total Spend per Crew $102.30
Cruise Passenger Visits 73,636
Total Cruise Passenger Expenditures $7,532,966
Cruise lines made payments to local businesses for a variety of goods and services. Net
payments to local vendors for shore excursions have been included with passenger
expenditures. However, cruise lines made other local expenditures, including payments for port
fees and taxes, navigation services, utilities and other supplies. Based upon data provided by
the FCCA member cruise lines, we estimated that all cruise lines spent $9.1 million ($US) in
Belize during the 2011/2012 cruise year. Approximately 75 percent of these expenditures were
payments for port fees and navigation services while the remaining 25 percent consisted of
payments for ship supplies.
Economic Contribution of Cruise Tourism Expenditures
As noted in the Data and Methods section of the full report, a set of economic impact models
were developed for each destination to produce estimates of the economic contribution of cruise
tourism. Data for these models were collected from a broad range of local, regional and
international sources. The impact models were designed to reflect the economic structure of
each destination, including the industrial composition of Gross Domestic Product (GDP), t he
wage share of GDP by industry and average employee wages by industry.
Table 28 – Total Economic Contribution of Cruise Tourism in Belize, 2011/2012 Cruise Year
Employment Wage Income ($US Millions)
Direct Economic Contribution 1,192 $12.2
Total Economic Contribution 1,798 $18.4
As shown in Table 28, the $61 million in total cruise tourism expenditures generated direct
employment of 1,192 residents of Belize paying $12.2 million in annual wages. Adding the
indirect contribution that results from the spending of those local businesses that are the direct
recipients of passenger, crew and cruise line expenditures , the direct cruise tourism
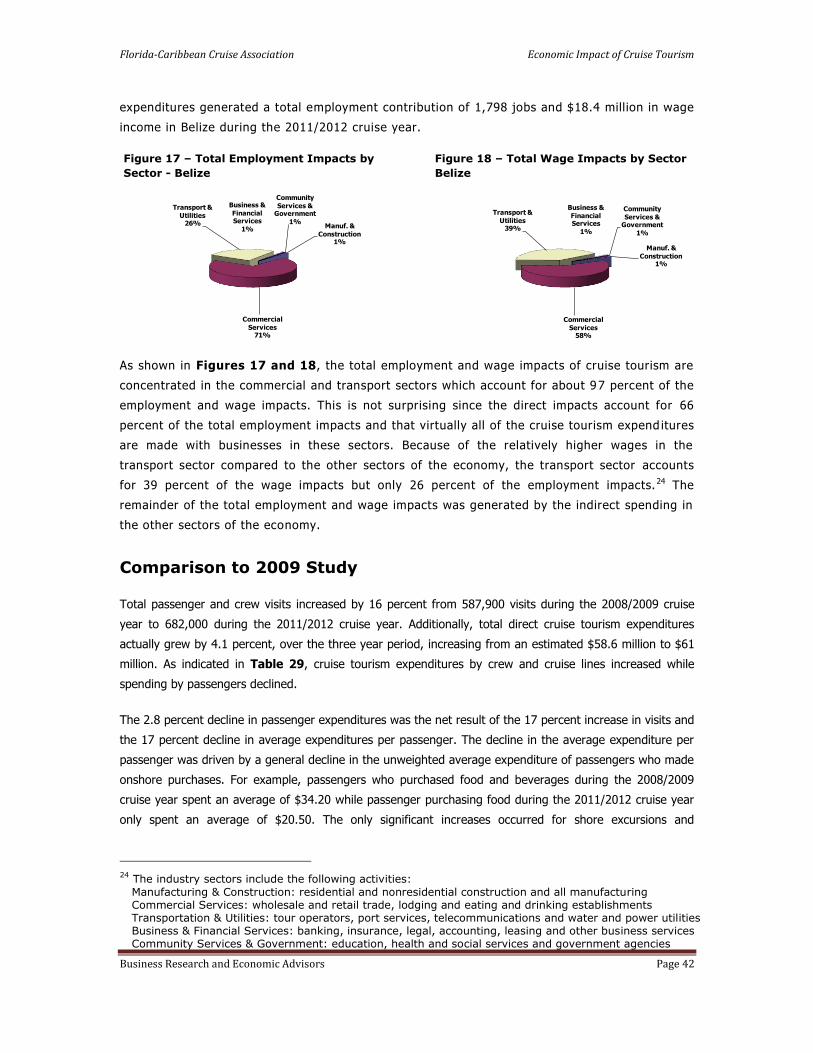
Florida-Caribbean Cruise Association Economic Impact of Cruise Tourism
Business Research and Economic Advisors Page 42
expenditures generated a total employment contribution of 1,798 jobs and $18.4 million in wage
income in Belize during the 2011/2012 cruise year.
Figure 17 – Total Employment Impacts by
Sector - Belize
Manuf. &
Construction1%
Commercial
Services71%
Transport &
Utilities26%
Business &
Financial Services
1%
Community
Services & Government
1%
Figure 18 – Total Wage Impacts by Sector
Belize
Manuf. &
Construction1%
Commercial
Services58%
Transport &
Utilities39%
Business &
Financial Services
1%
Community
Services & Government
1%
As shown in Figures 17 and 18, the total employment and wage impacts of cruise tourism are
concentrated in the commercial and transport sectors which account for about 97 percent of the
employment and wage impacts. This is not surprising since the direct impacts account for 66
percent of the total employment impacts and that virtually all of the cruise tourism expend itures
are made with businesses in these sectors. Because of the relatively higher wages in the
transport sector compared to the other sectors of the economy, the transport sector accounts
for 39 percent of the wage impacts but only 26 percent of the employment impacts. 24 The
remainder of the total employment and wage impacts was generated by the indirect spending in
the other sectors of the economy.
Comparison to 2009 Study
Total passenger and crew visits increased by 16 percent from 587,900 visits during the 2008/2009 cruise
year to 682,000 during the 2011/2012 cruise year. Additionally, total direct cruise tourism expenditures
actually grew by 4.1 percent, over the three year period, increasing from an estimated $58.6 million to $61
million. As indicated in Table 29, cruise tourism expenditures by crew and cruise lines increased while
spending by passengers declined.
The 2.8 percent decline in passenger expenditures was the net result of the 17 percent increase in visits and
the 17 percent decline in average expenditures per passenger. The decline in the average expenditure per
passenger was driven by a general decline in the unweighted average expenditure of passengers who made
onshore purchases. For example, passengers who purchased food and beverages during the 2008/2009
cruise year spent an average of $34.20 while passenger purchasing food during the 2011/2012 cruise year
only spent an average of $20.50. The only significant increases occurred for shore excursions and
24 The industry sectors include the following activities:
Manufacturing & Construction: residential and nonresidential construction and all manufacturing Commercial Services: wholesale and retail trade, lodging and eating and drinking establishments Transportation & Utilities: tour operators, port services, telecommunications and water and power utilities Business & Financial Services: banking, insurance, legal, accounting, leasing and other business services Community Services & Government: education, health and social services and government agencies

Florida-Caribbean Cruise Association Economic Impact of Cruise Tourism
Business Research and Economic Advisors Page 43
entertainment. At the same time the percentage of passengers making onshore purchases remained
relatively stable for most goods and services.
Table 29 – Comparison of Cruise Tourism Impacts, Current Study versus 2009 Study - Belize
Current
Study 2009
Study Percent Change
Total Onshore Visits (Thousands) 682.0 587.9 +16.0%
Passengers 608.4 519.4 +17.1%
Crew 73.6 68.5 + 7.4%
Total Direct Expenditures ($US Millions) $ 61.0 $ 58.6 +4.1%
Passengers $ 44.4 $ 45.7 - 2.8%
Crew $ 7.5 $ 4.5 +66.7%
Cruise Lines $ 9.1 $ 8.4 + 8.3%
Average Per Passenger Expenditure $ 73.00 $87.96 - 17.0% Average Per Crew Expenditure $102.30 $66.24 +54.4%
Total Employment Impact 1,798 1,781 +1.0%
Total Wage Impact ($US Millions) $ 18.4 $ 17.7 +4.0%
Includes both transit and homeport passengers.
The 67 percent increase in total crew expenditures was the result of the seven percent increase in crew
visits and the 54 percent increase in the average crew expenditure. The increase in the average crew
expenditure was primarily driven by an increase in crew purchases of jewelry and other (unspecified)
purchases. In both cases the average expenditure of those making such purchases approximately doubled
from the 2009 study. The change in the percentage of crew making onshore purchases varied by category,
but the changes, either positive or negative, were relatively small.
Given the increase in direct cruise tourism expenditures from the 2008/2009 cruise year, the economic
impacts also increased. The total employment impact rose by one percent over the three-year period while
the wage impact increased by four percent.
Passenger Surveys
A total of 1,078 passenger surveys were completed and returned for tabulation. Table 30
shows the major attributes of passenger visits in Belize as derived from the passenger surveys.
Of the 1,078 cruise parties that completed the surveys 75% stated that this had
been their first visit to Belize. This is down from 81% in the 2009 study.
Ninety-six percent (96%) of the cruise parties that completed the surveys
disembarked their cruise ship to visit Belize.
Of the cruise parties that went ashore, 70% made at least one purchase while
ashore. This is a decline from 77% during the 2008/2009 cruise year. The typical
cruise party consisted of 2.3 passengers that spent an average of 4.7 hours ashore.
The responding cruise parties reported spending an average of $104 while ashore
(excludes shore excursions), a decline of 22 percent from $134 during the
2008/2009 cruise year.

Florida-Caribbean Cruise Association Economic Impact of Cruise Tourism
Business Research and Economic Advisors Page 44
Table 30 - Major Attributes of Transit Passenger Surveys - Belize
Number Percent
Total Respondents 1,078
Number Making First Visit 808 75.0%
Number Ashore 1,033 95.8%
Number Making Onshore Purchases: 730 70.7%
Average Hours Ashore 4.7
Average Size of Expenditure Party (Persons) 2.3
Average Onshore Expenditure per Party $104.10
Purchased a Shore Excursion (Tour) 726 70.3%
Purchased Onshore Tour from:
Cruise Line 511 70.4%
Onshore from Tour Operator 110 15.1%
Travel Agent 105 14.4%
Average Cost of Shore Excursion per Party $148.30
Toured On Own/Did not Tour 307
Seventy percent (70%) of the passengers that went ashore purchased a shore
excursion. Seventy percent (70%) of passengers who purchased a tour did so
through their cruise line, 15% purchased their tour onshore and nearly 15 percent
purchased their tour through their travel agent.
The typical cruise party that purchased a shore excursion spent $148 for their tour,
an increase of 5 percent from the 2008/2009 cruise year .
Passenger Satisfaction
The passenger survey also asked the passengers to rate their satisfaction with their destination
visit along a number of parameters, as shown in Table 31. A 10-point scale was used with 10
being the highest score, i.e., extremely satisfied, and 1 being the lowest score, i.e., not at all
satisfied.
Among other key conclusions concerning visit satisfaction were the following:
Overall, satisfaction scores increased for every category from the 2009 study.
Cruise passengers were very satisfied with their overall visit to Belize with a mean
score of 7.4. While the visit did not score as high in terms of meeting expectations
with a mean score for “Visit Met Expectations” of 7.0, this was a significant increase
from the 2009 study.
Passengers felt very informed about tours and onshore activities in Belize with a
mean score of 7.8.
“Guided Tours” (or Shore Excursions) received the highest score of all visit
attributes with a mean score of 8.9. Thus, cruise passengers were extremely
satisfied with their shore excursions.
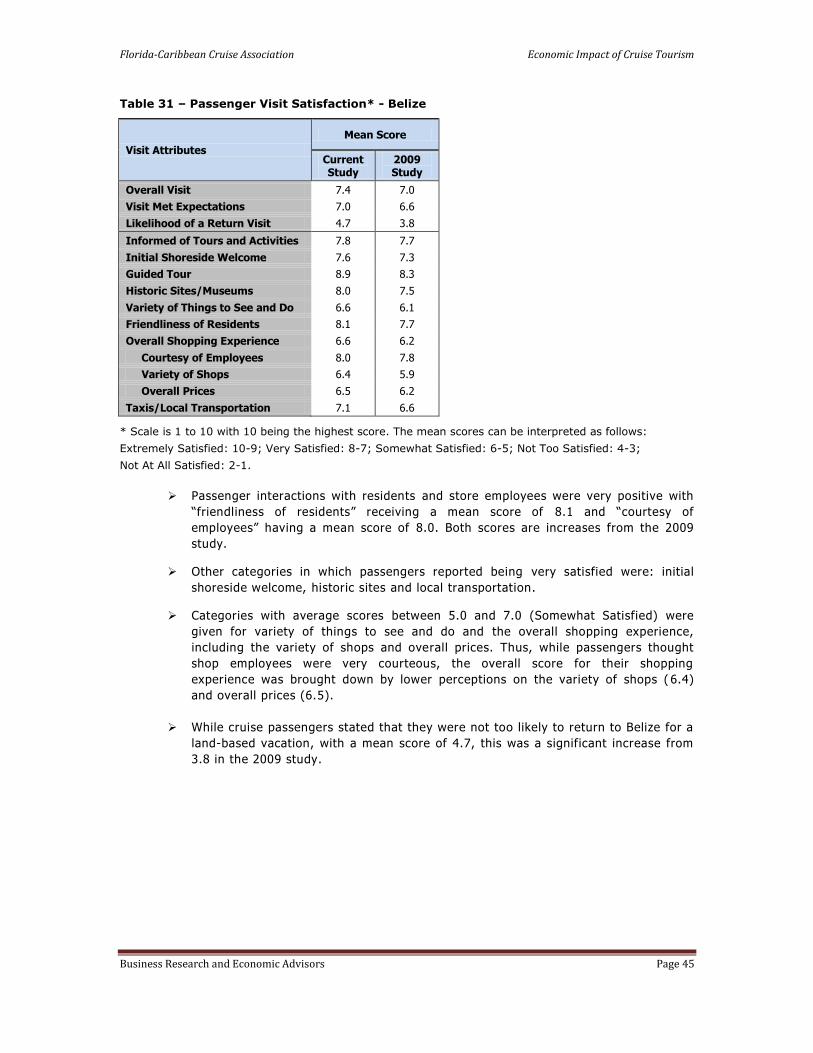
Florida-Caribbean Cruise Association Economic Impact of Cruise Tourism
Business Research and Economic Advisors Page 45
Table 31 – Passenger Visit Satisfaction* - Belize
Visit Attributes
Mean Score
Current Study
2009 Study
Overall Visit 7.4 7.0
Visit Met Expectations 7.0 6.6
Likelihood of a Return Visit 4.7 3.8
Informed of Tours and Activities 7.8 7.7
Initial Shoreside Welcome 7.6 7.3
Guided Tour 8.9 8.3
Historic Sites/Museums 8.0 7.5
Variety of Things to See and Do 6.6 6.1
Friendliness of Residents 8.1 7.7
Overall Shopping Experience 6.6 6.2
Courtesy of Employees 8.0 7.8
Variety of Shops 6.4 5.9
Overall Prices 6.5 6.2
Taxis/Local Transportation 7.1 6.6
* Scale is 1 to 10 with 10 being the highest score. The mean scores can be interpreted as follows:
Extremely Satisfied: 10-9; Very Satisfied: 8-7; Somewhat Satisfied: 6-5; Not Too Satisfied: 4-3;
Not At All Satisfied: 2-1.
Passenger interactions with residents and store employees were very positive with
“friendliness of residents” receiving a mean score of 8.1 and “courtesy of
employees” having a mean score of 8.0. Both scores are increases from the 2009
study.
Other categories in which passengers reported being very satisfied were: initial
shoreside welcome, historic sites and local transportation.
Categories with average scores between 5.0 and 7.0 (Somewhat Satisfied) were
given for variety of things to see and do and the overall shopping experience,
including the variety of shops and overall prices. Thus, while passengers thought
shop employees were very courteous, the overall score for their shopping
experience was brought down by lower perceptions on the variety of shops ( 6.4)
and overall prices (6.5).
While cruise passengers stated that they were not too likely to return to Belize for a
land-based vacation, with a mean score of 4.7, this was a significant increase from
3.8 in the 2009 study.
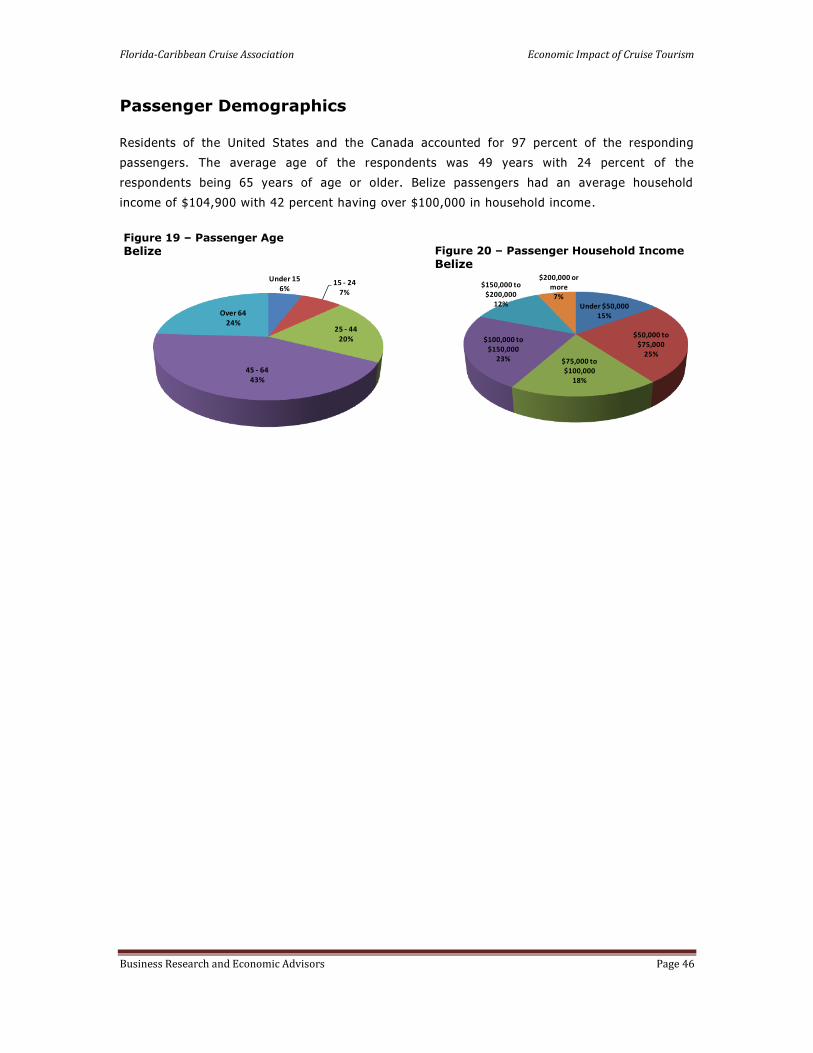
Florida-Caribbean Cruise Association Economic Impact of Cruise Tourism
Business Research and Economic Advisors Page 46
Passenger Demographics
Residents of the United States and the Canada accounted for 97 percent of the responding
passengers. The average age of the respondents was 49 years with 24 percent of the
respondents being 65 years of age or older. Belize passengers had an average household
income of $104,900 with 42 percent having over $100,000 in household income.
Figure 19 – Passenger Age
Belize
Under 156%
15 - 247%
25 - 4420%
45 - 6443%
Over 6424%
Figure 20 – Passenger Household Income
Belize
Under $50,00015%
$50,000 to $75,000
25%$75,000 to $100,000
18%
$100,000 to $150,000
23%
$150,000 to $200,000
12%
$200,000 or more
7%
Florida-Caribbean Cruise Association Economic Impact of Cruise Tourism
Business Research and Economic Advisors Page 47
British Virgin Islands
At the core of the analysis of the economic contribution of cruise tourism were a set of
passenger and crew surveys that were conducted onboard ships of the FCCA member cruise
lines.25 The surveys were undertaken during the six-month period beginning in December 2011
and ending in May 2012. The survey schedule was designed so that surveys were conducted by
FCCA member cruise lines that called at each destination and that the distribution of passenger
and crew surveys would reflect the distribution of passenger and crew arrivals by cruise line at
each destination. On any given cruise itinerary, passenger and crew surveys were placed in all
passenger cabins and crew quarters following a single destination call. The surveys were
completed by the passengers and crew in the privacy of their quarters and return ed to a
designated office on the cruise ship. Thus, passengers and crew were only surveyed once during
a cruise itinerary and for a single destination. On a subsequent itinerary, passengers were
surveyed following a call at a different dest ination.
The passenger and crew surveys were designed to collect data for onshore spending and visit
satisfaction by both passengers and crew. While the crew survey was slightly shorter than the
passenger survey, both surveys were designed to collect the following information:
hours spent ashore;
expenditures by category, including shore tours, food & beverages, clothing, etc.;
visit satisfaction, including shore tour, friendliness of residents, prices, shopping,
etc.;
likelihood of returning for a land-based vacation; and
demographic characteristics, including country of residence, age group, income, etc.
Combining the expenditure data collected from the passenger and crew surveys with data on
expenditures by cruise lines for port fees and services, payments to local tour operators for
passenger shore excursions purchased onboard the cruise ships, and other provisions purchased
locally by the cruise lines, estimates of total cruise tourism expenditures were developed for
each participating destination.
Given the direct spending estimates, the economic contribution of these expenditures, as
measured by employment and wage income were then estimated for each de stination. This
process began with the collection of economic data for each destination from a combination of
local, regional and international sources. Utilizing all of these data a set of economic impact
models were developed for each destination to estimate the direct and total employment and
wage impacts. A more detailed description of these models is provided in the Data and
Methods section of Volume I.
25 Surveys were conducted on the ships of the following cruise lines: Carnival Cruise Lines, Celebrity Cruises, Disney Cruise Line, Holland America Line, Norwegian Cruise Line, Princess Cruises, P&O Cruises and Royal Caribbean International.

Florida-Caribbean Cruise Association Economic Impact of Cruise Tourism
Business Research and Economic Advisors Page 48
Cruise Tourism Expenditures
Cruise tourism expenditures in destination ports are composed of a broad range of spending
including:
onshore expenditures by passengers which tend to be concentrated in shore excursions
and retail purchases of clothing, jewelry and local crafts and souvenirs;
onshore expenditures by crew which are generally concentrated in purchases of food
and beverages, local transportation and retail purchases of clothing and electronics ;
expenditures by cruise lines for port services, such as dockage fees and linesmen,
utilities, such as water and power and navigation services; and
purchases of supplies, such as food and other stores, by the cruise lines from local
businesses.
According to data obtained from the Government of the British Virgin Islands, 407,603 cruise
passengers arrived aboard cruise ships during the 2011/2012 cruise year.26 Of these, an
estimated 361,136 passengers (89 percent) disembarked and visited the British Virgin Islands.
Utilizing additional data provided by the visiting cruise lines, we have estimated that 177,662
crew were aboard the cruise ships and that 37 percent, or 65,872 crew, disembarked and visited
the British Virgin Islands. These passenger and crew visits along with additional expenditures by
the cruise lines generated a total of $30.3 million ($US) in cruise tourism expenditures in the
British Virgin Islands during the 2011/2012 cruise year. The contribution of expenditures by
passengers, crew and cruise lines to this total is discussed below.
Table 32 – Estimated Passenger Spending ($US) in the British Virgin Islands,
2011/2012 Cruise Year27
Purchase Categories Average Spend
per Party Share of All
Onshore Visits
Weighted Average Spend
per Party
Shore Excursions $ 89.00 60.8% $ 54.13
F&B at Restaurants & Bars $ 29.50 47.7% $ 14.06
Local Crafts & Souvenirs $ 33.10 42.0% $ 13.91
Clothing $ 39.40 40.6% $ 16.00
Taxis/Ground Transportation $ 47.90 21.6% $ 10.34
Other Purchases $ 76.90 14.1% $ 10.83
Watches & Jewelry $ 241.60 11.0% $ 26.66
Retail Purchases of Liquor $ 23.80 5.6% $ 1.34
Perfumes & Cosmetics $ 96.30 2.3% $ 2.26
Entertainment/Night Clubs/Casinos $ 87.30 0.9% $ 0.82
Telephone & Internet $ 51.10 0.7% $ 0.36
Electronics $ 8.50 0.2% $ 0.02
Total Spend per Cruise Party $150.73
Average Size of a Cruise Party 2.3
Total Spend per Cruise Passenger $65.54
Cruise Passenger Visits 361,136
Total Cruise Passenger Expenditures $23,667,607
26 The 2011/2012 cruise year includes the twelve months beginning in May, 2011 and ending in April, 2012. 27 The average shore excursion expenditure is a weighted average of the onshore and Internet purchases and the portion of the onboard purchases paid to local tour operators.

Florida-Caribbean Cruise Association Economic Impact of Cruise Tourism
Business Research and Economic Advisors Page 49
Per passenger spending estimates were derived from nearly 700 surveys completed by
passengers that went ashore during the survey period. As shown in Table 32, each passenger
cruise party spent an average of $150.73 in the British Virgin Islands. The average spend per
cruise party is the sum of the weighted spending in each of the twelve categories. For example,
48 percent of the survey respondents reported spending an average of $29.50 at local
restaurants and/or bars. Spread over the cruise parties that visited the British Virgin Islands,
this represents an average of $14.06 per party. On a per passenger basis, the average total
expenditure was $65.54. This represents the sum of per party expenditures, $150.73, divided by
the average size of a cruise party in the British Virgin Islands, 2.3 passengers.
Cruise passenger expenditures in the British Virgin Islands were concentrated in four categories
which accounted for nearly 75 percent of their onshore expenditures: shore excursions, watches
and jewelry, clothing and food and beverages. Forty percent or more of the passengers that
went ashore made purchases in the following categories: shore excursions, food and beverages,
local crafts and clothing.
Sixty-one percent (61%) of the passengers reported that their cruise party purchased a shore
excursion. The effective local price of the shore excursion was $89.00 per party but when the
full price of the purchase from cruise lines and travel agents is included passengers spent an
average of $124 per party for their tours.
For the entire 2011/2012 cruise year, the estimated 361,136 cruise passengers who visited the
British Virgin Islands spent a total of $23.7 million ($US).
Per crew spending estimates were derived from the nearly 400 surveys completed by crew
members during the survey period. As shown in Table 33, each crew member spent an average
of $47.00 in the British Virgin Islands. The average spend per crew member is the sum of the
weighted spending in each of the twelve categories. For example, 69 percent of the survey
respondents reported spending an average of $25.80 for food and beverages. Spread over all
the crew members that reported visiting the British Virgin Islands, this represents an average of
$17.93 per crew member.
Expenditures by crew in the British Virgin Islands were concentrated in two categories which
accounted for 60 percent of their onshore expenditures: food and beverages and other
(unspecified) purchases. Combined, crew spent an average of $28.31 for good s in these two
categories. Purchases of food and beverages were the most popular expenditure item with 69%
percent of the crew reporting the purchase of food and beverages.
For the entire 2011/2012 cruise year, the estimated 65,872 crew who visited the Bri tish Virgin
Islands spent an estimated total of $3.1 million ($US).
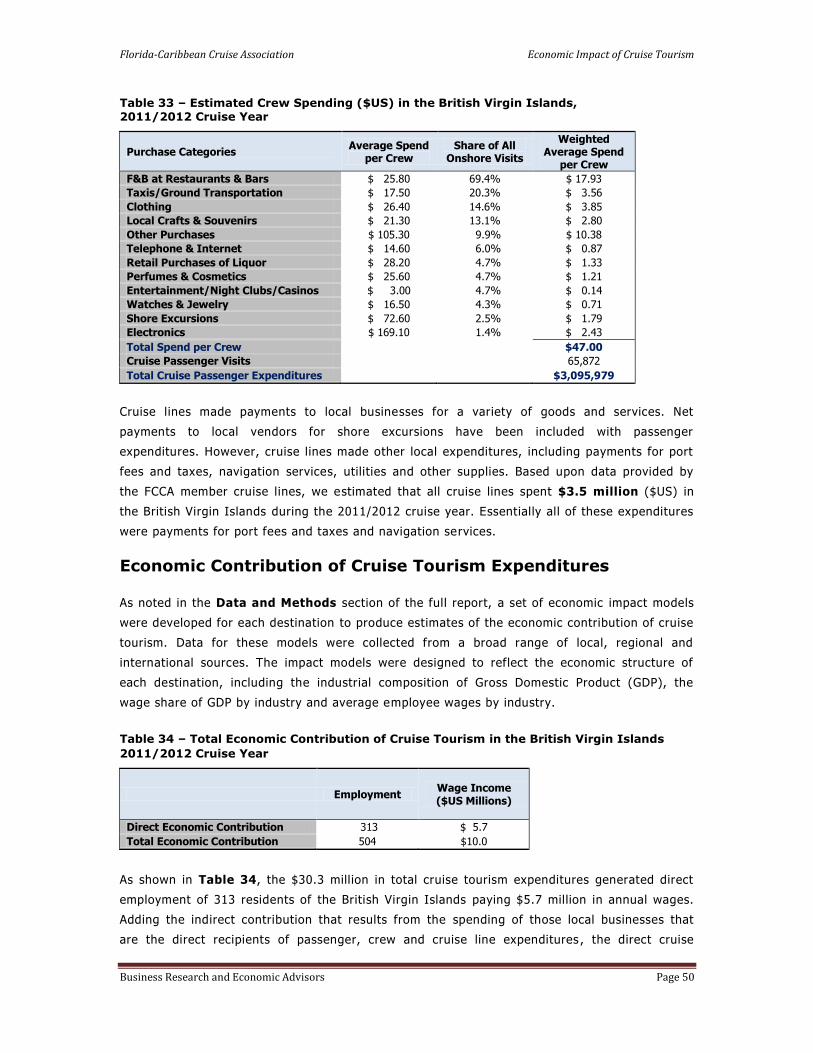
Florida-Caribbean Cruise Association Economic Impact of Cruise Tourism
Business Research and Economic Advisors Page 50
Table 33 – Estimated Crew Spending ($US) in the British Virgin Islands, 2011/2012 Cruise Year
Purchase Categories Average Spend
per Crew Share of All
Onshore Visits
Weighted Average Spend
per Crew
F&B at Restaurants & Bars $ 25.80 69.4% $ 17.93
Taxis/Ground Transportation $ 17.50 20.3% $ 3.56
Clothing $ 26.40 14.6% $ 3.85
Local Crafts & Souvenirs $ 21.30 13.1% $ 2.80
Other Purchases $ 105.30 9.9% $ 10.38
Telephone & Internet $ 14.60 6.0% $ 0.87
Retail Purchases of Liquor $ 28.20 4.7% $ 1.33
Perfumes & Cosmetics $ 25.60 4.7% $ 1.21
Entertainment/Night Clubs/Casinos $ 3.00 4.7% $ 0.14
Watches & Jewelry $ 16.50 4.3% $ 0.71
Shore Excursions $ 72.60 2.5% $ 1.79
Electronics $ 169.10 1.4% $ 2.43
Total Spend per Crew $47.00
Cruise Passenger Visits 65,872
Total Cruise Passenger Expenditures $3,095,979
Cruise lines made payments to local businesses for a variety of goods and services. Net
payments to local vendors for shore excursions have been included with passenger
expenditures. However, cruise lines made other local expenditures, including payments for port
fees and taxes, navigation services, utilities and other supplies. Based upon data provided by
the FCCA member cruise lines, we estimated that all cruise lines spent $3.5 million ($US) in
the British Virgin Islands during the 2011/2012 cruise year. Essentially all of these expenditures
were payments for port fees and taxes and navigation services.
Economic Contribution of Cruise Tourism Expenditures
As noted in the Data and Methods section of the full report, a set of economic impact models
were developed for each destination to produce estimates of the economic contribution of cruise
tourism. Data for these models were collected from a broad range of local, regional and
international sources. The impact models were designed to reflect the economic structure of
each destination, including the industrial composition of Gross Domestic Product (GDP), the
wage share of GDP by industry and average employee wages by industry.
Table 34 – Total Economic Contribution of Cruise Tourism in the British Virgin Islands
2011/2012 Cruise Year
Employment Wage Income ($US Millions)
Direct Economic Contribution 313 $ 5.7
Total Economic Contribution 504 $10.0
As shown in Table 34, the $30.3 million in total cruise tourism expenditures generated direct
employment of 313 residents of the British Virgin Islands paying $5.7 million in annual wages.
Adding the indirect contribution that results from the spending of those local businesses that
are the direct recipients of passenger, crew and cruise line expenditures , the direct cruise

Florida-Caribbean Cruise Association Economic Impact of Cruise Tourism
Business Research and Economic Advisors Page 51
tourism expenditures generated a total employment contribution of 504 jobs and $10 million in
wage income in the British Virgin Islands during the 2011/2012 cruise year.
Figure 21 – Total Employment Impacts by
Sector - British Virgin Islands
Manuf. &
Construction2%
Commercial
Services55%
Transport &
Utilities35%
Business &
Financial Services
1%
Community
Services & Government
7%
Figure 22 – Total Wage Impacts by Sector
British Virgin Islands
Manuf. &
Construction2%
Commercial
Services48%
Transport &
Utilities37%
Business &
Financial Services
2%
Community
Services & Government
11%
As shown in Figures 21 and 22, the total employment and wage impacts of cruise tourism are
concentrated in the commercial and transport sectors which account for more than 90 percent
of the employment and wage impacts.28 This is not surprising since the direct impacts account
for about 60 percent of the total employment impacts and that virtually all of the cruise tourism
expenditures are made with businesses in these sectors.
Passenger Surveys
A total of 698 passenger surveys were completed and returned for tabulation. Table 36 shows
the major attributes of passenger visits in the British Virgin Islands as derived from the
passenger surveys.
Of the 698 cruise parties that completed the surveys 60% stated that this had been
their first visit to the British Virgin Islands.
Ninety-six percent (96%) of the cruise parties that completed the surveys
disembarked their cruise ship to visit the British Virgin Islands.
Of the cruise parties that went ashore, 64% made at least one purchase while
ashore. The typical cruise party consisted of 2.3 passengers that spent an average
of 4.1 hours ashore.
The responding cruise parties reported spending an average of $96.60 while ashore
(excludes shore excursions).
Sixty-one percent (61%) of the passengers that went ashore purchased a shore
excursion. Sixty-six percent (66%) of passengers who purchased a tour did so
28 The industry sectors include the following activities:
Manufacturing & Construction: residential and nonresidential construction and all manufacturing Commercial Services: wholesale and retail trade, lodging and eating and drinking establishments Transportation & Utilities: tour operators, port services, telecommunications and water and power utilities Business & Financial Services: banking, insurance, legal, accounting, leasing and other business services Community Services & Government: education, health and social services and government agencies

Florida-Caribbean Cruise Association Economic Impact of Cruise Tourism
Business Research and Economic Advisors Page 52
through their cruise line, 25% purchased their tour onshore and 9 percent
purchased their tour through their travel agent.
The typical cruise party that purchased a shore excursion spent $124 for their tour.
Table 35 - Major Attributes of Transit Passenger Surveys - British Virgin Islands
Number Percent
Total Respondents 698
Number Making First Visit 419 60.0%
Number Ashore 671 96.1%
Number Making Onshore Purchases: 426 63.5%
Average Hours Ashore 4.1
Average Size of Expenditure Party (Persons) 2.3
Average Onshore Expenditure per Party $96.60
Purchased a Shore Excursion (Tour) 408 60.8%
Purchased Onshore Tour from:
Cruise Line 270 66.2%
Onshore from Tour Operator 102 24.9%
Travel Agent 36 8.9%
Average Cost of Shore Excursion per Party $124
Toured On Own/Did not Tour 263
Passenger Satisfaction
The passenger survey also asked the passengers to rate their satisfaction with their destination
visit along a number of parameters, as shown in Table 37. A 10-point scale was used with 10
being the highest score, i.e., extremely satisfied, and 1 being the lowest score, i.e., not at all
satisfied.
Among other key conclusions concerning visit satisfaction were the following:
Cruise passengers were very satisfied with their overall visit to the British Virgin
Islands with a mean score of 7.4. Passengers also reported that their visit exceeded
their expectations. The mean score for “Visit Met Expectations” was 7.1.
Passengers felt very informed about tours and onshore activities in the British Virgin
Islands with a mean score of 7.4.
“Guided Tours” (or Shore Excursions) received the highest score of all visit
attributes with a mean score of 7.9. Thus, cruise passengers were very satisfied
with their shore excursions.
Passenger interactions with residents and store employees were very positive with
“friendliness of residents” and “courtesy of employees” each having a mean score of
7.8.
Categories with slightly lower scores but still above 7.0 (Very Satisfied) were: initial
shoreside welcome and local transportation.

Florida-Caribbean Cruise Association Economic Impact of Cruise Tourism
Business Research and Economic Advisors Page 53
Categories with average scores between 5.0 and 7.0 (Somewhat Satisfied) were
given for historic sites, variety of things to see and do and overall shopping
experience.
Passengers were only somewhat satisfied with their shopping experience which
received a mean score of 6.6. It was already noted that passengers were very
satisfied with shop employees but they were less satisfied the variety of shops (6.0)
and overall prices (6.3).
Cruise passengers stated that they were somewhat likely to return to the British
Virgin Islands for a land-based vacation.
Table 36 – Passenger Visit Satisfaction* - British Virgin Islands
Visit Attributes Mean Score
Overall Visit 7.4
Visit Met Expectations 7.1
Likelihood of a Return Visit 5.4
Informed of Tours and Activities 7.4
Initial Shoreside Welcome 7.3
Guided Tour 7.9
Historic Sites/Museums 6.6
Variety of Things to See and Do 6.3
Friendliness of Residents 7.8
Overall Shopping Experience 6.6
Courtesy of Employees 7.8
Variety of Shops 6.0
Overall Prices 6.3
Taxis/Local Transportation 7.3
* Scale is 1 to 10 with 10 being the highest score. The mean scores can be interpreted as follows:
Extremely Satisfied: 10-9; Very Satisfied: 8-7; Somewhat Satisfied: 6-5; Not Too Satisfied: 4-3;
Not At All Satisfied: 2-1.

Florida-Caribbean Cruise Association Economic Impact of Cruise Tourism
Business Research and Economic Advisors Page 54
Passenger Demographics
Residents of the United States and the Canada accounted for 90 percent of the responding
passengers. The average age of the respondents was 52 years with 31 percent of the
respondents being 65 years of age or older. The passengers that visited the British Virgin
Islands had an average household income of $109,400 with 40 percent having over $100,000 in
household income.
Figure 23 – Passenger Age
British Virgin Islands
Under 156%
15 - 247%
25 - 4415%
45 - 6441%
Over 6431%
Figure 24 – Passenger Household Income
British Virgin Islands
Under $50,00016%
$50,000 to $75,000
24%$75,000 to $100,000
20%
$100,000 to $150,000
17%
$150,000 to $200,000
11%
$200,000 or more12%
Florida-Caribbean Cruise Association Economic Impact of Cruise Tourism
Business Research and Economic Advisors Page 55
Cayman Islands
At the core of the analysis of the economic contribution of cruise tourism were a set of
passenger and crew surveys that were conducted onboard ships of the FCCA member cruise
lines.29 The surveys were undertaken during the six-month period beginning in December 2011
and ending in May 2012. The survey schedule was designed so that surveys were conducted by
FCCA member cruise lines that called at each destination and that the distribution of passenger
and crew surveys would reflect the distribution of passenger and crew arrivals by cruise line at
each destination. On any given cruise itinerary, passenger and crew surveys were placed in all
passenger cabins and crew quarters following a single destination call. The surveys were
completed by the passengers and crew in the privacy of their quarters and returned to a
designated office on the cruise ship. Thus, passengers and crew were only surveyed once during
a cruise itinerary and for a single destination. On a subsequent itinerary, passengers were
surveyed following a call at a different dest ination.
The passenger and crew surveys were designed to collect data for onshore spending and visit
satisfaction by both passengers and crew. While the crew survey was slightly shorter than the
passenger survey, both surveys were designed to collect the following information:
hours spent ashore;
expenditures by category, including shore tours, food & beverages, clothing, etc .;
visit satisfaction, including shore tour, friendliness of residents, prices, shopping,
etc.;
likelihood of returning for a land-based vacation; and
demographic characteristics, including country of residence, age group, income, etc.
Combining the expenditure data collected from the passenger and crew surveys with data on
expenditures by cruise lines for port fees and services, payments to local tour operators for
passenger shore excursions purchased onboard the cruise ships, and other provisions purchase d
locally by the cruise lines, estimates of total cruise tourism expenditures were developed for
each participating destination.
Given the direct spending estimates, the economic contribution of these expenditures, as
measured by employment and wage income were then estimated for each destination. This
process began with the collection of economic data for each destination from a combination of
local, regional and international sources. Utilizing all of these data a set of economic impact
models were developed for each destination to estimate the direct and total employment and
wage impacts. A more detailed description of these models is provided in the Data and
Methods section of Volume I.
29 Surveys were conducted on the ships of the following cruise lines: Carnival Cruise Lines, Celebrity Cruises, Disney Cruise Line, Holland America Line, Norwegian Cruise Line, Princess Cruises, P&O Cruises and Royal Caribbean International.

Florida-Caribbean Cruise Association Economic Impact of Cruise Tourism
Business Research and Economic Advisors Page 56
Cruise Tourism Expenditures
Cruise tourism expenditures in destination ports are composed of a broad range of spending
including:
onshore expenditures by passengers which tend to be concentrated in shore excursions
and retail purchases of clothing, jewelry and local crafts and souvenirs;
onshore expenditures by crew which are generally concentrated in purchases of food
and beverages, local transportation and retail purchases of clothing and electronics ;
expenditures by cruise lines for port services, such as dockage fees and linesmen,
utilities, such as water and power and navigation services; and
purchases of supplies, such as food and other stores, by the cruise lines from local
businesses.
According to data provided by the Department of Tourism, 1.44 million cruise passengers
arrived aboard cruise ships during the 2011/2012 cruise year.30 Of these, an estimated 1.30
million passengers (90 percent) disembarked and visited the Cayman Islands. Utilizing additional
data provided by the visiting cruise lines, we have estimated that 530,004 crew were aboard the
cruise ships and that 37 percent, or 196,141 crew, disembarked and visited the island. These
passenger and crew visits along with additional expenditures by the cruise lines generated a
total of $157.7 million ($US) in cruise tourism expenditures in the Cayman Islands during the
2011/2012 cruise year. The contribution of expenditures by passengers, crew and cruise lines to
this total is discussed below.
Table 37 – Estimated Passenger Spending ($US) in the Cayman Islands, 2011/2012 Cruise Year31
Purchase Categories Average Spend
per Party Share of All
Onshore Visits
Weighted Average Spend
per Party
F&B at Restaurants & Bars $ 35.40 56.3% $ 19.93
Shore Excursions $ 75.50 55.9% $ 42.24
Clothing $ 65.40 45.8% $ 29.97
Local Crafts & Souvenirs $ 31.50 45.2% $ 14.24
Other Purchases $ 84.70 20.4% $ 17.28
Watches & Jewelry $ 399.90 17.8% $ 71.16
Taxis/Ground Transportation $ 28.70 16.7% $ 4.79
Retail Purchases of Liquor $ 40.10 11.4% $ 4.58
Perfumes & Cosmetics $ 57.90 2.8% $ 1.64
Telephone & Internet $ 13.80 1.8% $ 0.25
Entertainment/Night Clubs/Casinos $ 31.80 0.5% $ 0.15
Electronics $ 6.40 0.2% $ 0.01
Total Spend per Cruise Party $206.24
Average Size of a Cruise Party 2.2
Total Spend per Cruise Passenger $93.75
Cruise Passenger Visits 1,295,960
Total Cruise Passenger Expenditures $121,489,791
30 The 2011/2012 cruise year includes the twelve months beginning in May, 2011 and ending in April, 2012. 31 The average shore excursion expenditure is a weighted average of the onshore and Internet purchases and the portion of the onboard purchases paid to local tour operators.

Florida-Caribbean Cruise Association Economic Impact of Cruise Tourism
Business Research and Economic Advisors Page 57
Per passenger spending estimates were derived from the 1,662 surveys completed by
passengers that went ashore during the survey period. As shown in Table 37, each passenger
cruise party spent an average of $206.24 in the Cayman Islands. The average spend per cruise
party is the sum of the weighted spending in each of the twelve categories. For example, 56
percent of the survey respondents reported spending an average of $35.40 at local restaurants
and/or bars. Spread over the cruise parties that visited the Cayman Islands, this represents an
average of $19.93 per party. On a per passenger basis, the average total expenditure was
$93.75. This represents the sum of per party expenditures, $206.24, divided by the average size
of a cruise party in the Cayman Islands, 2.2 passengers.
Cruise passenger expenditures in the Cayman Islands were concentrated in four categories
which accounted for nearly 80 percent of their onshore expenditures: watches and jewelry,
shore excursions, clothing and food and beverages. Forty percent or more of the passengers
that went ashore made purchases in the following categories: food and beverages, shore
excursions, clothing and local crafts.
Fifty-six percent (56%) of the passengers reported that their cruise party purchased a shore
excursion. The effective local price of the shore excursion was $75.50 per party but when the
full price of the purchase from cruise lines and travel agents is included passengers spent an
average of $124 per party for their tours.
For the entire 2011/2012 cruise year, the estimated 1.3 million cruise passengers who visited
the Cayman Islands spent a total of $121.5 million ($US) on the island.
Per crew spending estimates were derived from the more than 300 surveys completed by crew
members during the survey period. As shown in Table 38, each crew member spent an average
of $57.50 in the Cayman Islands. The average spend per crew member is the sum of the
weighted spending in each of the twelve categories. For example, 65 percent of the survey
respondents reported spending an average of $32.40 for food and beverages. Spread over all
the crew members that reported visiting the Cayman Islands, this represents an average of
$20.95 per crew member.
Expenditures by crew in the Cayman Islands were concentrated in three categories which
accounted for 68 percent of their onshore expenditures: food and beverages, watches and
jewelry and other (unspecified) purchases. Combined, crew spent an average of $39.11 for
goods in these three categories. Purchases of food and beverages were the most popular
expenditure item with 65% percent of the crew reporting the purchase of food and beverages.
For the entire 2011/2012 cruise year, the estimated 196,141 crew who visited the Cayman
Islands spent an estimated total of $11.3 million ($US).
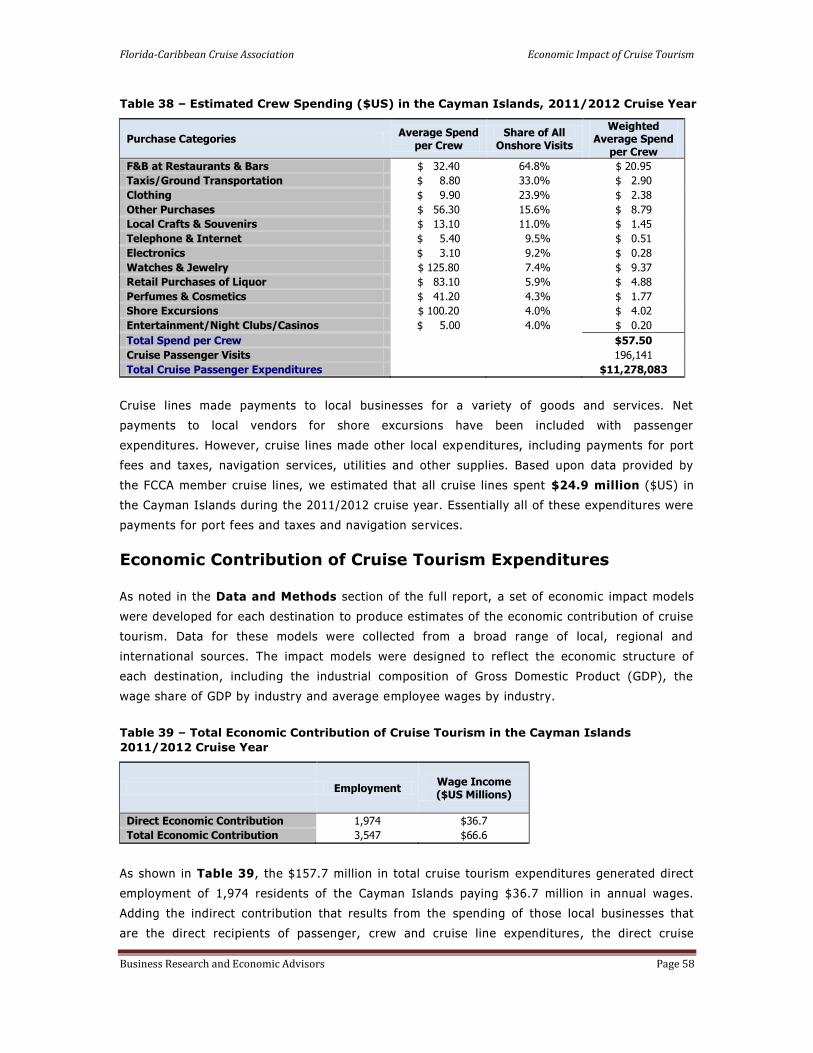
Florida-Caribbean Cruise Association Economic Impact of Cruise Tourism
Business Research and Economic Advisors Page 58
Table 38 – Estimated Crew Spending ($US) in the Cayman Islands, 2011/2012 Cruise Year
Purchase Categories Average Spend
per Crew Share of All
Onshore Visits
Weighted Average Spend
per Crew
F&B at Restaurants & Bars $ 32.40 64.8% $ 20.95
Taxis/Ground Transportation $ 8.80 33.0% $ 2.90
Clothing $ 9.90 23.9% $ 2.38
Other Purchases $ 56.30 15.6% $ 8.79
Local Crafts & Souvenirs $ 13.10 11.0% $ 1.45
Telephone & Internet $ 5.40 9.5% $ 0.51
Electronics $ 3.10 9.2% $ 0.28
Watches & Jewelry $ 125.80 7.4% $ 9.37
Retail Purchases of Liquor $ 83.10 5.9% $ 4.88
Perfumes & Cosmetics $ 41.20 4.3% $ 1.77
Shore Excursions $ 100.20 4.0% $ 4.02
Entertainment/Night Clubs/Casinos $ 5.00 4.0% $ 0.20
Total Spend per Crew $57.50
Cruise Passenger Visits 196,141
Total Cruise Passenger Expenditures $11,278,083
Cruise lines made payments to local businesses for a variety of goods and services. Net
payments to local vendors for shore excursions have been included with passenger
expenditures. However, cruise lines made other local expenditures, including payments for port
fees and taxes, navigation services, utilities and other supplies. Based upon data provided by
the FCCA member cruise lines, we estimated that all cruise lines spent $24.9 million ($US) in
the Cayman Islands during the 2011/2012 cruise year. Essentially all of these expenditures were
payments for port fees and taxes and navigation services.
Economic Contribution of Cruise Tourism Expenditures
As noted in the Data and Methods section of the full report, a set of economic impact models
were developed for each destination to produce estimates of the economic contribution of cruise
tourism. Data for these models were collected from a broad range of local, regional and
international sources. The impact models were designed to reflect the economic structure of
each destination, including the industrial composition of Gross Domestic Product (GDP), the
wage share of GDP by industry and average employee wages by industry.
Table 39 – Total Economic Contribution of Cruise Tourism in the Cayman Islands
2011/2012 Cruise Year
Employment Wage Income ($US Millions)
Direct Economic Contribution 1,974 $36.7
Total Economic Contribution 3,547 $66.6
As shown in Table 39, the $157.7 million in total cruise tourism expenditures generated direct
employment of 1,974 residents of the Cayman Islands paying $36.7 million in annual wages.
Adding the indirect contribution that results from the spending of those local businesses that
are the direct recipients of passenger, crew and cruise line expenditures, the direct cruise

Florida-Caribbean Cruise Association Economic Impact of Cruise Tourism
Business Research and Economic Advisors Page 59
tourism expenditures generated a total employment contribution of 3,547 jobs and $66.6 million
in wage income in the Cayman Islands during the 2011/2012 cruise year.
As shown in Figures 25 and 26, the total employment and wage impacts of cruise tourism are
concentrated in the commercial and transport sectors which account for about 96 percent of the
employment and wage impacts.32 This is not surprising since the direct impacts account for 55
percent of the total employment impacts and that virtually all of the cruise tourism expend itures
are made with businesses in these sectors. Because of the relatively higher wages in the
transport sector compared to the other sectors of the economy, the transport secto r accounts
for 31 percent of the wage impacts but only 19 percent of the employment impacts. The
remainder of the total employment and wage impacts was generated by the indirect spending in
the other sectors of the economy.
32 The industry sectors include the following activities:
Manufacturing & Construction: residential and nonresidential construction and all manufacturing Commercial Services: wholesale and retail trade, lodging and eating and drinking establishments Transportation & Utilities: tour operators, port services, telecommunications and water and power utilities Business & Financial Services: banking, insurance, legal, accounting, leasing and other business services Community Services & Government: education, health and social services and government agencies
Figure 25 – Total Employment Impacts by
Sector - Cayman Islands
Manuf. &
Construction1%
Commercial
Services78%
Transport &
Utilities19%
Business &
Financial Services
1%
Community
Services & Government
1%
Figure 26 – Total Wage Impacts by Sector
Cayman Islands
Manuf. &
Construction1%
Commercial
Services67%
Transport &
Utilities31%
Business &
Financial Services
1%
Community
Services & Government
0%

Florida-Caribbean Cruise Association Economic Impact of Cruise Tourism
Business Research and Economic Advisors Page 60
Comparison to 2009 Study
Total passenger and crew visits declined by less than one percent from 1.51 million visits during the
2008/2009 cruise year to 1.49 million during the 2011/2012 cruise year. However, total direct cruise tourism
expenditures declined more sharply, nearly 10 percent, over the three year period, falling from an estimated
$174.4 million to $157.7 million. As indicated in Table 40, cruise tourism expenditures declined in all three
categories, passengers, crew and cruise lines.
The nearly 4 percent decline in passenger expenditures was the result of the nearly one percent decline in
passenger visits and the almost 4 percent decline in average passenger spending. The decline in average
passenger expenditures was primarily the result of a decline in the percentage of passengers making
onshore purchases in some of the major categories, such as shore excursions, jewelry and other purchases.
This was partially offset by increases in food and beverages and clothing. At the same time passengers who
made onshore purchases increased their spending for clothing and shore excursions but reduced it for food
and beverages and jewelry.
Table 40 – Comparison of Cruise Tourism Impacts, Current Study versus 2009 Study
Cayman Islands
Current Study
2009 Study
Percent Change
Total Onshore Visits (Thousands) 1,492.1 1,505.7 -0.9%
Passengers 1,296.0 1,305.7 -0.7%
Crew 196.1 200.0 -2.0%
Total Direct Expenditures ($US Millions) $ 157.7 $ 174.4 -9.6%
Passengers $ 121.5 $ 126.4 -3.9%
Crew $ 11.3 $ 21.8 -48.2%
Cruise Lines $ 24.9 $ 26.1 -4.6%
Average Per Passenger Expenditure $93.75 $ 96.78 -3.1% Average Per Crew Expenditure $57.50 $108.81 -47.2%
Total Employment Impact 3,547 3,731 -4.9%
Total Wage Impact ($US Millions) $ 66.6 $ 69.5 -4.2%
The 48 percent decline in total crew expenditures was driven by the 47 percent decrease in the average
crew expenditure. The decline from $109 to $57.50 brought the average crew expenditure back to the level
during the 2005/2006 cruise year. The decrease in the average crew expenditure was the result of both a
general decrease in the average value of a purchase made by a crew member and by a sharp decline in the
percentage of crew making purchases once ashore. For example, in the 2009 study 74 percent of crew
reported purchasing food and beverages onshore while in the current study this fell to 65 percent. At the
same time the average value of food purchases by those crew making such a purchase fell slightly from
$33.30 to $32.40
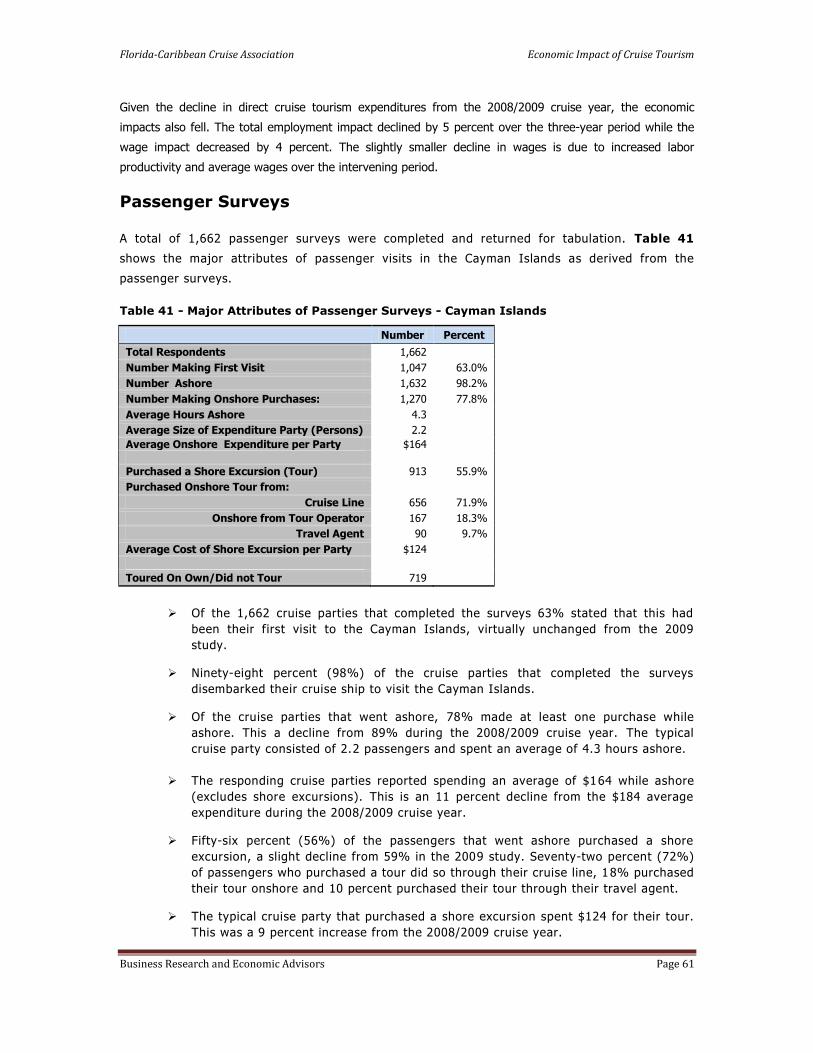
Florida-Caribbean Cruise Association Economic Impact of Cruise Tourism
Business Research and Economic Advisors Page 61
Given the decline in direct cruise tourism expenditures from the 2008/2009 cruise year, the economic
impacts also fell. The total employment impact declined by 5 percent over the three-year period while the
wage impact decreased by 4 percent. The slightly smaller decline in wages is due to increased labor
productivity and average wages over the intervening period.
Passenger Surveys
A total of 1,662 passenger surveys were completed and returned for tabulation. Table 41
shows the major attributes of passenger visits in the Cayman Islands as derived from the
passenger surveys.
Table 41 - Major Attributes of Passenger Surveys - Cayman Islands
Number Percent
Total Respondents 1,662
Number Making First Visit 1,047 63.0%
Number Ashore 1,632 98.2%
Number Making Onshore Purchases: 1,270 77.8%
Average Hours Ashore 4.3
Average Size of Expenditure Party (Persons) 2.2
Average Onshore Expenditure per Party $164
Purchased a Shore Excursion (Tour) 913 55.9%
Purchased Onshore Tour from:
Cruise Line 656 71.9%
Onshore from Tour Operator 167 18.3%
Travel Agent 90 9.7%
Average Cost of Shore Excursion per Party $124
Toured On Own/Did not Tour 719
Of the 1,662 cruise parties that completed the surveys 63% stated that this had
been their first visit to the Cayman Islands, virtually unchanged from the 2009
study.
Ninety-eight percent (98%) of the cruise parties that completed the surveys
disembarked their cruise ship to visit the Cayman Islands.
Of the cruise parties that went ashore, 78% made at least one purchase while
ashore. This a decline from 89% during the 2008/2009 cruise year. The typical
cruise party consisted of 2.2 passengers and spent an average of 4.3 hours ashore.
The responding cruise parties reported spending an average of $164 while ashore
(excludes shore excursions). This is an 11 percent decline from the $184 average
expenditure during the 2008/2009 cruise year.
Fifty-six percent (56%) of the passengers that went ashore purchased a shore
excursion, a slight decline from 59% in the 2009 study. Seventy-two percent (72%)
of passengers who purchased a tour did so through their cruise line, 18% purchased
their tour onshore and 10 percent purchased their tour through their travel agent.
The typical cruise party that purchased a shore excursion spent $124 for their tour.
This was a 9 percent increase from the 2008/2009 cruise year.

Florida-Caribbean Cruise Association Economic Impact of Cruise Tourism
Business Research and Economic Advisors Page 62
Passenger Satisfaction
The passenger survey also asked the passengers to rate their satisfaction with their destination
visit along a number of parameters, as shown in Table 42. A 10-point scale was used with 10
being the highest score, i.e., extremely satisfied, and 1 being the lowest score, i.e., not at all
satisfied.
Table 42 – Passenger Visit Satisfaction* - Cayman Islands
Visit Attributes
Mean Score
Current Study
2009 Study
Overall Visit 7.9 7.4
Visit Met Expectations 7.6 6.9
Likelihood of a Return Visit 5.5 4.7
Informed of Tours and Activities 8.0 7.9
Initial Shoreside Welcome 7.5 7.2
Guided Tour 8.5 7.6
Historic Sites/Museums 7.3 6.5
Variety of Things to See and Do 7.3 6.7
Friendliness of Residents 8.2 7.9
Overall Shopping Experience 7.3 7.1
Courtesy of Employees 8.1 7.9
Variety of Shops 7.3 7.0
Overall Prices 6.2 6.1
Taxis/Local Transportation 7.6 7.2
* Scale is 1 to 10 with 10 being the highest score. The mean scores can be interpreted as follows:
Extremely Satisfied: 10-9; Very Satisfied: 8-7; Somewhat Satisfied: 6-5; Not Too Satisfied: 4-3;
Not At All Satisfied: 2-1.
Among other key conclusions concerning visit satisfaction were the following:
Cruise passengers were very satisfied with their overall visit to the Cayman Islands
with a mean score of 7.9. While the visit did not score as high in terms of meeting
expectations with mean score for “Visit Met Expectations” at 7.6, this is up
significantly from 6.9 in the 2009 study.
Passengers felt very informed about tours and onshore activities in the Cayman
Islands with a mean score of 8.0.
“Guided Tours” (or Shore Excursions) received the highest score with an average
score of 8.5. This was also up sharply from the 2009 study.
Passenger interactions with residents and store employees were very positive with
“friendliness of residents” receiving a mean score of 8.2 and “courtesy of
employees” receiving a mean score of 8.1.
Categories with slightly lower scores but still above 7.0 (Very Satisfied) were: initial
shoreside welcome, historic sites and museums, overall shopping experience,
variety of shops and local transportation.

Florida-Caribbean Cruise Association Economic Impact of Cruise Tourism
Business Research and Economic Advisors Page 63
The overall shopping experience received a mean score of 7.3 (Very Satisfied).
However, passengers were only somewhat satisfied with over all prices which has a
mean score of 6.2.
Cruise passengers stated that they were somewhat likely to return to the Cayman
Islands for a land-based vacation. Again, this was a significant increase from 2009.
Passenger Demographics
Residents of the United States and the Canada accounted for 95 percent of the responding
passengers. The average age of the respondents was 52 years with 26 percent of the
respondents being 65 years of age or older. The Cayman Islands passengers had an average
household income of $92,700 with 32 percent having over $100,000 in household income.
Figure 27 – Passenger Age
Cayman Islands
Under 153%
15 - 245%
25 - 4421%
45 - 6445%
Over 6426%
Figure 28 – Passenger Household Income
Cayman Islands
Under $50,00020%
$50,000 to $75,000
28%$75,000 to $100,000
20%
$100,000 to $150,000
19%
$150,000 to $200,000
8%
$200,000 or more
5%

Florida-Caribbean Cruise Assn. Economic Impact of Cruise Tourism
Business Research and Economic Advisors Page 64
Colombia
At the core of the analysis of the economic contribution of cruise tourism were a set of
passenger and crew surveys that were conducted onboard ships of the FCCA member cruise
lines.33 The surveys were undertaken during the six-month period beginning in December 2011
and ending in May 2012. The survey schedule was designed so that surveys were conducted by
FCCA member cruise lines that called at each destination and that the distribution of passenger
and crew surveys would reflect the distribution of passenger and crew arrivals by cruise line at
each destination. On any given cruise itinerary, passenger and crew surveys were placed in all
passenger cabins and crew quarters following a single destination call. The surveys were
completed by the passengers and crew in the privacy of their quarters and returned to a
designated office on the cruise ship. Thus, passengers and crew were only surveyed once during
a cruise itinerary and for a single destination. On a subsequent itinerary, passengers were
surveyed following a call at a different dest ination.
The passenger and crew surveys were designed to collect data for onshore spending and visit
satisfaction by both passengers and crew. While the crew survey was slightly shorter than the
passenger survey, both surveys were designed to collect the following information:
hours spent ashore;
expenditures by category, including shore tours, food & beverages, clothing, etc.;
visit satisfaction, including shore tour, friendliness of residents, prices, shopping,
etc.;
likelihood of returning for a land-based vacation; and
demographic characteristics, including country of residence, age group, income, etc.
Combining the expenditure data collected from the passenger and crew surveys with data on
expenditures by cruise lines for port fees and services, payments to local tour operators for
passenger shore excursions purchased onboard the cruise ships, and other provisions purc hased
locally by the cruise lines, estimates of total cruise tourism expenditures were developed for
each participating destination.
Given the direct spending estimates, the economic contribution of these expenditures, as
measured by employment and wage income were then estimated for each destination. This
process began with the collection of economic data for each destination from a combination of
local, regional and international sources. Utilizing all of these data a set of economic impact
models were developed for each destination to estimate the direct and total employment and
wage impacts. A more detailed description of these models is provided in the Data and
Methods section of Volume I.
33 Surveys were conducted on the ships of the following cruise lines: Carnival Cruise Lines, Celebrity Cruises, Disney Cruise Line, Holland America Line, Norwegian Cruise Line, Princess Cruises, P&O Cruises and Royal Caribbean International.

Florida-Caribbean Cruise Assn. Economic Impact of Cruise Tourism
Business Research and Economic Advisors Page 65
Cruise Tourism Expenditures
Cruise tourism expenditures in destination ports are composed of a broad range of spending
including:
onshore expenditures by passengers which tend to be concentrated in shore excursions
and retail purchases of clothing, jewelry and local crafts and souvenirs;
onshore expenditures by crew which are generally concentrated in purchases of food
and beverages, local transportation and retail purchases of clothing and electronics ;
expenditures by cruise lines for port services, such as dockage fees and linesmen,
utilities, such as water and power and navigation services; and
purchases of supplies, such as food and other stores, by the cruise lines from local
businesses.
According to data provided by the Colombian cruise ports, 293,449 cruise passengers arrived
aboard cruise ships during the 2011/2012 cruise year.34 These included 286,113 transit
passengers and 7,336 passengers embarking on their cruises in Colombia. Of the transit
passengers, an estimated 253,496 passengers (89 percent) disembarked and visited Colombia.
Utilizing additional data provided by the visiting cruise lines, we have estimated that 114,685
crew were aboard the cruise ships and that 32 percent, or 36,196 crew, disembarked and visited
Colombia. These passenger and crew visits along with additional expenditures by the cruise
lines generated a total of $33.4 million ($US) in cruise tourism expenditures in Colombia during
the 2011/2012 cruise year. The contribution of expenditures by passengers, crew and cruise
lines to this total is discussed below.
Passenger expenditures were estimated separately for transit and homeport passengers. Per
passenger spending estimates for transit passengers were derived from the 1,800 surveys
completed by passengers that went ashore during the survey period. As shown in Table 43,
each passenger cruise party spent an average of $195.54 in Colombia. The average spend per
cruise party is the sum of the weighted spending in each of the twelve categories. For example,
25 percent of the survey respondents reported spending an average of $11.60 at local
restaurants and/or bars. Spread over the cruise parties that visited Colombia, this represents an
average of $2.91 per party. On a per passenger basis, the average total expenditure was
$97.77. This represents the sum of per party expenditures, $195.54, divided by the average size
of a cruise party in Colombia, 2.0 passengers.
Transit cruise passenger expenditures in Colombia were concentrated in four categories which
accounted for 90 percent of their onshore expenditures: watches and jewelry, shore excursions ,
local crafts and clothing. Nearly 40 percent or more of the passengers that went ashore made
purchases in the following categories: shore excursions, local crafts and clothing.
Seventy-six percent (76%) of the passengers reported that their cruise party purchased a shore
excursion. The effective local price of the shore excursion was $76.60 per party but when the
34 The 2011/2012 cruise year includes the twelve months beginning in May, 2011 and ending in April,
2012.
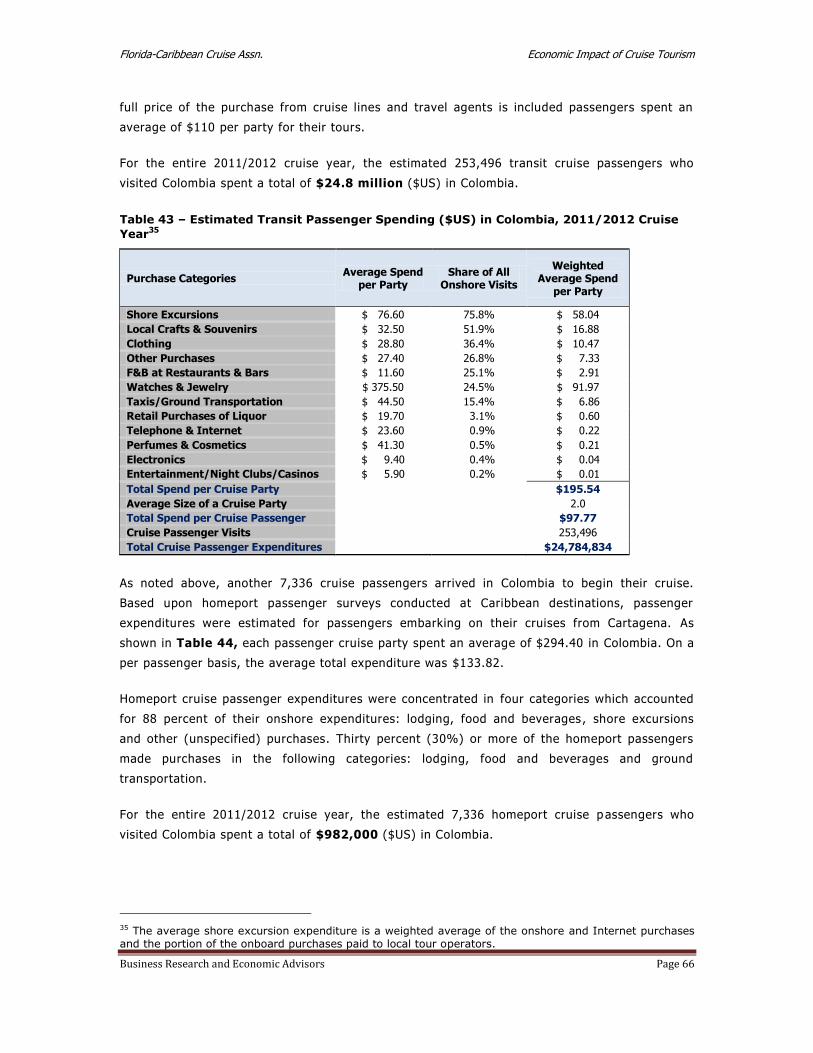
Florida-Caribbean Cruise Assn. Economic Impact of Cruise Tourism
Business Research and Economic Advisors Page 66
full price of the purchase from cruise lines and travel agents is included passengers spent an
average of $110 per party for their tours.
For the entire 2011/2012 cruise year, the estimated 253,496 transit cruise passengers who
visited Colombia spent a total of $24.8 million ($US) in Colombia.
Table 43 – Estimated Transit Passenger Spending ($US) in Colombia, 2011/2012 Cruise
Year35
Purchase Categories Average Spend
per Party Share of All
Onshore Visits
Weighted Average Spend
per Party
Shore Excursions $ 76.60 75.8% $ 58.04
Local Crafts & Souvenirs $ 32.50 51.9% $ 16.88
Clothing $ 28.80 36.4% $ 10.47
Other Purchases $ 27.40 26.8% $ 7.33
F&B at Restaurants & Bars $ 11.60 25.1% $ 2.91
Watches & Jewelry $ 375.50 24.5% $ 91.97
Taxis/Ground Transportation $ 44.50 15.4% $ 6.86
Retail Purchases of Liquor $ 19.70 3.1% $ 0.60
Telephone & Internet $ 23.60 0.9% $ 0.22
Perfumes & Cosmetics $ 41.30 0.5% $ 0.21
Electronics $ 9.40 0.4% $ 0.04
Entertainment/Night Clubs/Casinos $ 5.90 0.2% $ 0.01
Total Spend per Cruise Party $195.54
Average Size of a Cruise Party 2.0
Total Spend per Cruise Passenger $97.77
Cruise Passenger Visits 253,496
Total Cruise Passenger Expenditures $24,784,834
As noted above, another 7,336 cruise passengers arrived in Colombia to begin their cruise.
Based upon homeport passenger surveys conducted at Caribbean destinations, passenger
expenditures were estimated for passengers embarking on their cruises from Cartagena. As
shown in Table 44, each passenger cruise party spent an average of $294.40 in Colombia. On a
per passenger basis, the average total expenditure was $133.82.
Homeport cruise passenger expenditures were concentrated in four categories which accounted
for 88 percent of their onshore expenditures: lodging, food and beverages , shore excursions
and other (unspecified) purchases. Thirty percent (30%) or more of the homeport passengers
made purchases in the following categories: lodging, food and beverages and ground
transportation.
For the entire 2011/2012 cruise year, the estimated 7,336 homeport cruise passengers who
visited Colombia spent a total of $982,000 ($US) in Colombia.
35 The average shore excursion expenditure is a weighted average of the onshore and Internet purchases and the portion of the onboard purchases paid to local tour operators.
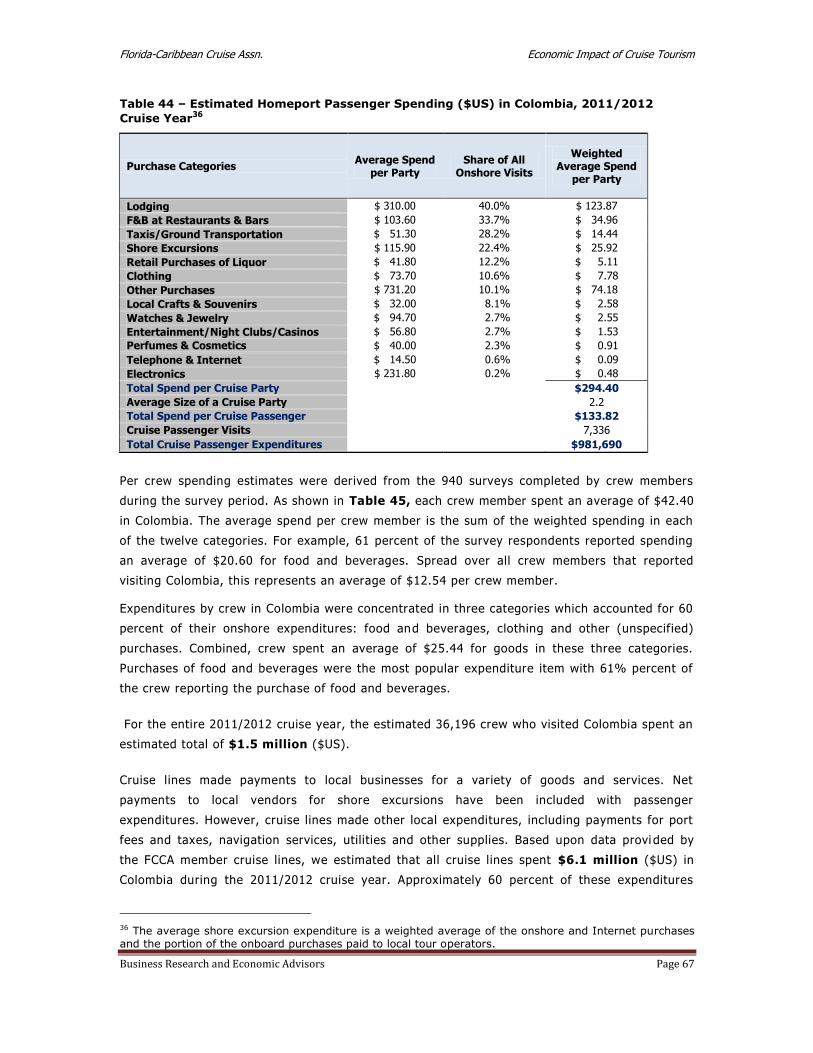
Florida-Caribbean Cruise Assn. Economic Impact of Cruise Tourism
Business Research and Economic Advisors Page 67
Table 44 – Estimated Homeport Passenger Spending ($US) in Colombia, 2011/2012
Cruise Year36
Purchase Categories Average Spend
per Party Share of All
Onshore Visits
Weighted Average Spend
per Party
Lodging $ 310.00 40.0% $ 123.87
F&B at Restaurants & Bars $ 103.60 33.7% $ 34.96
Taxis/Ground Transportation $ 51.30 28.2% $ 14.44
Shore Excursions $ 115.90 22.4% $ 25.92
Retail Purchases of Liquor $ 41.80 12.2% $ 5.11
Clothing $ 73.70 10.6% $ 7.78
Other Purchases $ 731.20 10.1% $ 74.18
Local Crafts & Souvenirs $ 32.00 8.1% $ 2.58
Watches & Jewelry $ 94.70 2.7% $ 2.55
Entertainment/Night Clubs/Casinos $ 56.80 2.7% $ 1.53
Perfumes & Cosmetics $ 40.00 2.3% $ 0.91
Telephone & Internet $ 14.50 0.6% $ 0.09
Electronics $ 231.80 0.2% $ 0.48
Total Spend per Cruise Party $294.40
Average Size of a Cruise Party 2.2
Total Spend per Cruise Passenger $133.82
Cruise Passenger Visits 7,336
Total Cruise Passenger Expenditures $981,690
Per crew spending estimates were derived from the 940 surveys completed by crew members
during the survey period. As shown in Table 45, each crew member spent an average of $42.40
in Colombia. The average spend per crew member is the sum of the weighted spending in each
of the twelve categories. For example, 61 percent of the survey respondents reported spending
an average of $20.60 for food and beverages. Spread over all crew members that reported
visiting Colombia, this represents an average of $12.54 per crew member.
Expenditures by crew in Colombia were concentrated in three categories which accounted for 60
percent of their onshore expenditures: food and beverages, clothing and other (unspecified)
purchases. Combined, crew spent an average of $25.44 for goods in these three categories.
Purchases of food and beverages were the most popular expenditure item with 61% percent of
the crew reporting the purchase of food and beverages.
For the entire 2011/2012 cruise year, the estimated 36,196 crew who visited Colombia spent an
estimated total of $1.5 million ($US).
Cruise lines made payments to local businesses for a variety of goods and services. Net
payments to local vendors for shore excursions have been included with passenger
expenditures. However, cruise lines made other local expenditures, including payments for port
fees and taxes, navigation services, utilities and other supplies. Based upon data provi ded by
the FCCA member cruise lines, we estimated that all cruise lines spent $6.1 million ($US) in
Colombia during the 2011/2012 cruise year. Approximately 60 percent of these expenditures
36 The average shore excursion expenditure is a weighted average of the onshore and Internet purchases and the portion of the onboard purchases paid to local tour operators.

Florida-Caribbean Cruise Assn. Economic Impact of Cruise Tourism
Business Research and Economic Advisors Page 68
were payments for port fees and navigation services while the remaining 40 percent consisted
of payments for ship supplies.
Table 45 – Estimated Crew Spending ($US) in Colombia, 2011/2012 Cruise Year
Purchase Categories Average Spend
per Crew Share of All
Onshore Visits
Weighted Average Spend
per Crew
F&B at Restaurants & Bars $ 20.60 60.9% $ 12.54
Taxis/Ground Transportation $ 12.70 30.7% $ 3.90
Local Crafts & Souvenirs $ 17.10 18.8% $ 3.22
Clothing $ 37.70 18.3% $ 6.88
Telephone & Internet $ 7.00 15.1% $ 1.06
Shore Excursions $ 10.40 12.8% $ 1.33
Other Purchases $ 59.30 10.1% $ 6.02
Entertainment/Night Clubs/Casinos $ 55.10 7.2% $ 3.99
Watches & Jewelry $ 38.30 5.5% $ 2.11
Perfumes & Cosmetics $ 13.40 4.9% $ 0.66
Retail Purchases of Liquor $ 21.30 3.2% $ 0.68
Electronics $ 3.50 0.3% $ 0.01
Total Spend per Crew $42.40
Cruise Passenger Visits 36,196
Total Cruise Passenger Expenditures $1,534,687
Economic Contribution of Cruise Tourism Expenditures
As noted in the Data and Methods section of the full report, a set of economic impact models
were developed for each destination to produce estimates of the economic contribution of cruise
tourism. Data for these models were collected from a broad range of local, regional and
international sources. The impact models were designed to reflect the economic structure of
each destination, including the industrial composition of Gross Domestic Product (GDP), the
wage share of GDP by industry and average employee wages by industry.
Table 46 – Total Economic Contribution of Cruise Tourism in Colombia, 2011/2012 Cruise
Year
Employment Wage Income ($US Millions)
Direct Economic Contribution 518 $3.2
Total Economic Contribution 819 $4.9
As shown in Table 46, the $33.4 million in total cruise tourism expenditures in Colombia
generated direct employment of 518 residents of Colombia paying $3.2 million in annual wages.
Adding the indirect contribution that results from the spending of those local businesses that
are the direct recipients of passenger, crew and cruise line expenditures, the direct cruise
tourism expenditures generated a total employment contribution of 819 jobs and $4.9 million in
wage income in Colombia during the 2011/2012 cruise year.
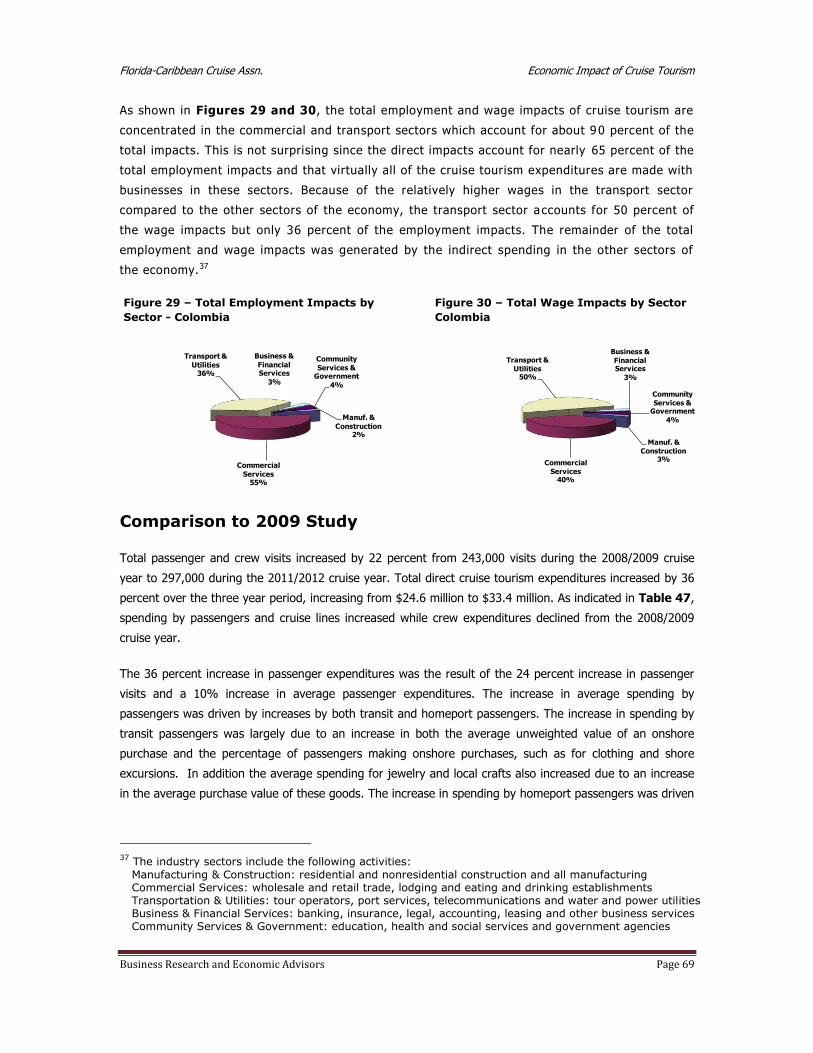
Florida-Caribbean Cruise Assn. Economic Impact of Cruise Tourism
Business Research and Economic Advisors Page 69
As shown in Figures 29 and 30, the total employment and wage impacts of cruise tourism are
concentrated in the commercial and transport sectors which account for about 90 percent of the
total impacts. This is not surprising since the direct impacts account for nearly 65 percent of the
total employment impacts and that virtually all of the cruise tourism expenditures are made with
businesses in these sectors. Because of the relatively higher wages in the transport sector
compared to the other sectors of the economy, the transport sector accounts for 50 percent of
the wage impacts but only 36 percent of the employment impacts. The remainder of the total
employment and wage impacts was generated by the indirect spending in the other sectors of
the economy.37
37 The industry sectors include the following activities:
Manufacturing & Construction: residential and nonresidential construction and all manufacturing Commercial Services: wholesale and retail trade, lodging and eating and drinking establishments Transportation & Utilities: tour operators, port services, telecommunications and water and power utilities Business & Financial Services: banking, insurance, legal, accounting, leasing and other business services Community Services & Government: education, health and social services and government agencies
Figure 29 – Total Employment Impacts by
Sector - Colombia
Manuf. &
Construction2%
Commercial
Services55%
Transport &
Utilities36%
Business &
Financial Services
3%
Community
Services & Government
4%
Figure 30 – Total Wage Impacts by Sector
Colombia
Manuf. &
Construction3%
Commercial
Services40%
Transport &
Utilities50%
Business &
Financial Services
3%
Community
Services & Government
4%
Comparison to 2009 Study
Total passenger and crew visits increased by 22 percent from 243,000 visits during the 2008/2009 cruise
year to 297,000 during the 2011/2012 cruise year. Total direct cruise tourism expenditures increased by 36
percent over the three year period, increasing from $24.6 million to $33.4 million. As indicated in Table 47,
spending by passengers and cruise lines increased while crew expenditures declined from the 2008/2009
cruise year.
The 36 percent increase in passenger expenditures was the result of the 24 percent increase in passenger
visits and a 10% increase in average passenger expenditures. The increase in average spending by
passengers was driven by increases by both transit and homeport passengers. The increase in spending by
transit passengers was largely due to an increase in both the average unweighted value of an onshore
purchase and the percentage of passengers making onshore purchases, such as for clothing and shore
excursions. In addition the average spending for jewelry and local crafts also increased due to an increase
in the average purchase value of these goods. The increase in spending by homeport passengers was driven
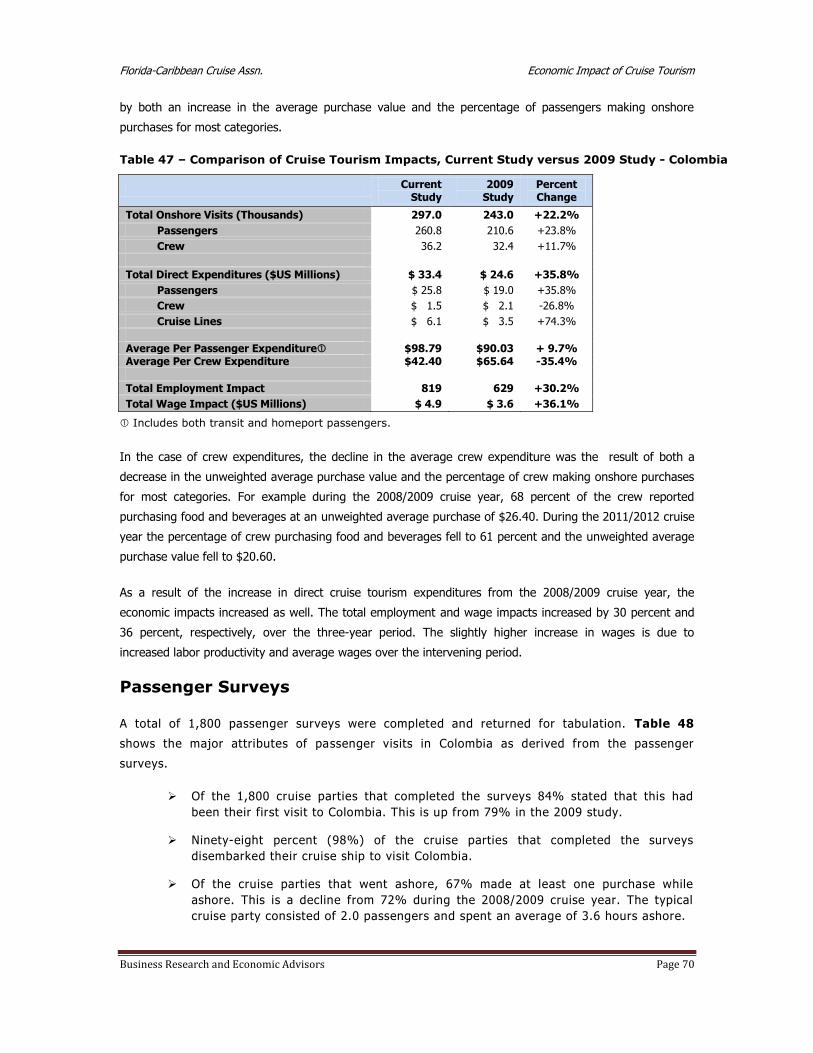
Florida-Caribbean Cruise Assn. Economic Impact of Cruise Tourism
Business Research and Economic Advisors Page 70
by both an increase in the average purchase value and the percentage of passengers making onshore
purchases for most categories.
Table 47 – Comparison of Cruise Tourism Impacts, Current Study versus 2009 Study - Colombia
Current
Study 2009
Study Percent Change
Total Onshore Visits (Thousands) 297.0 243.0 +22.2%
Passengers 260.8 210.6 +23.8%
Crew 36.2 32.4 +11.7%
Total Direct Expenditures ($US Millions) $ 33.4 $ 24.6 +35.8%
Passengers $ 25.8 $ 19.0 +35.8%
Crew $ 1.5 $ 2.1 -26.8%
Cruise Lines $ 6.1 $ 3.5 +74.3%
Average Per Passenger Expenditure $98.79 $90.03 + 9.7% Average Per Crew Expenditure $42.40 $65.64 -35.4%
Total Employment Impact 819 629 +30.2%
Total Wage Impact ($US Millions) $ 4.9 $ 3.6 +36.1%
Includes both transit and homeport passengers.
In the case of crew expenditures, the decline in the average crew expenditure was the result of both a
decrease in the unweighted average purchase value and the percentage of crew making onshore purchases
for most categories. For example during the 2008/2009 cruise year, 68 percent of the crew reported
purchasing food and beverages at an unweighted average purchase of $26.40. During the 2011/2012 cruise
year the percentage of crew purchasing food and beverages fell to 61 percent and the unweighted average
purchase value fell to $20.60.
As a result of the increase in direct cruise tourism expenditures from the 2008/2009 cruise year, the
economic impacts increased as well. The total employment and wage impacts increased by 30 percent and
36 percent, respectively, over the three-year period. The slightly higher increase in wages is due to
increased labor productivity and average wages over the intervening period.
Passenger Surveys
A total of 1,800 passenger surveys were completed and returned for tabulation. Table 48
shows the major attributes of passenger visits in Colombia as derived from the passenger
surveys.
Of the 1,800 cruise parties that completed the surveys 84% stated that this had
been their first visit to Colombia. This is up from 79% in the 2009 study.
Ninety-eight percent (98%) of the cruise parties that completed the surveys
disembarked their cruise ship to visit Colombia.
Of the cruise parties that went ashore, 67% made at least one purchase while
ashore. This is a decline from 72% during the 2008/2009 cruise year. The typical
cruise party consisted of 2.0 passengers and spent an average of 3.6 hours ashore.
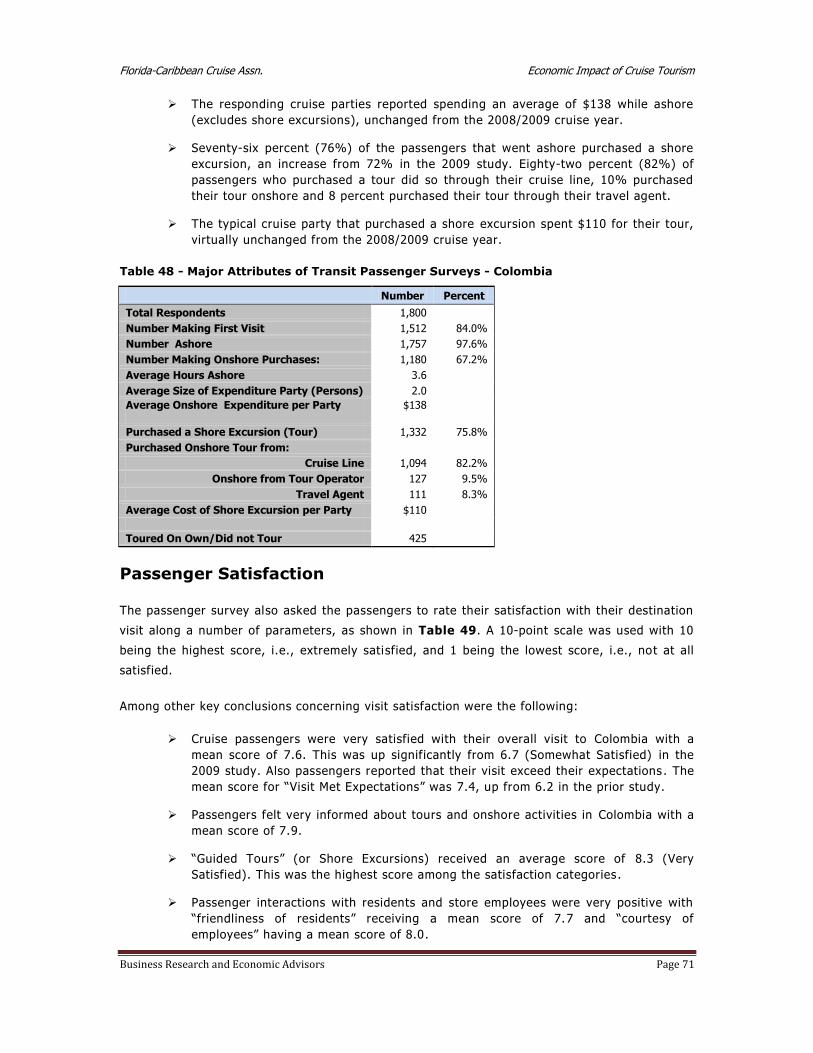
Florida-Caribbean Cruise Assn. Economic Impact of Cruise Tourism
Business Research and Economic Advisors Page 71
The responding cruise parties reported spending an average of $138 while ashore
(excludes shore excursions), unchanged from the 2008/2009 cruise year.
Seventy-six percent (76%) of the passengers that went ashore purchased a shore
excursion, an increase from 72% in the 2009 study. Eighty-two percent (82%) of
passengers who purchased a tour did so through their cruise line, 10% purchased
their tour onshore and 8 percent purchased their tour through their travel agent.
The typical cruise party that purchased a shore excursion spent $110 for their tour,
virtually unchanged from the 2008/2009 cruise year.
Table 48 - Major Attributes of Transit Passenger Surveys - Colombia
Number Percent
Total Respondents 1,800
Number Making First Visit 1,512 84.0%
Number Ashore 1,757 97.6%
Number Making Onshore Purchases: 1,180 67.2%
Average Hours Ashore 3.6
Average Size of Expenditure Party (Persons) 2.0
Average Onshore Expenditure per Party $138
Purchased a Shore Excursion (Tour) 1,332 75.8%
Purchased Onshore Tour from:
Cruise Line 1,094 82.2%
Onshore from Tour Operator 127 9.5%
Travel Agent 111 8.3%
Average Cost of Shore Excursion per Party $110
Toured On Own/Did not Tour 425
Passenger Satisfaction
The passenger survey also asked the passengers to rate their satisfaction with their destination
visit along a number of parameters, as shown in Table 49. A 10-point scale was used with 10
being the highest score, i.e., extremely satisfied, and 1 being the lowest score, i.e., not at all
satisfied.
Among other key conclusions concerning visit satisfaction were the following:
Cruise passengers were very satisfied with their overall visit to Colombia with a
mean score of 7.6. This was up significantly from 6.7 (Somewhat Satisfied) in the
2009 study. Also passengers reported that their visit exceed their expectations . The
mean score for “Visit Met Expectations” was 7.4, up from 6.2 in the prior study.
Passengers felt very informed about tours and onshore activities in Colombia with a
mean score of 7.9.
“Guided Tours” (or Shore Excursions) received an average score of 8.3 (Very
Satisfied). This was the highest score among the satisfaction categories .
Passenger interactions with residents and store employees were very positive with
“friendliness of residents” receiving a mean score of 7.7 and “courtesy of
employees” having a mean score of 8.0 .
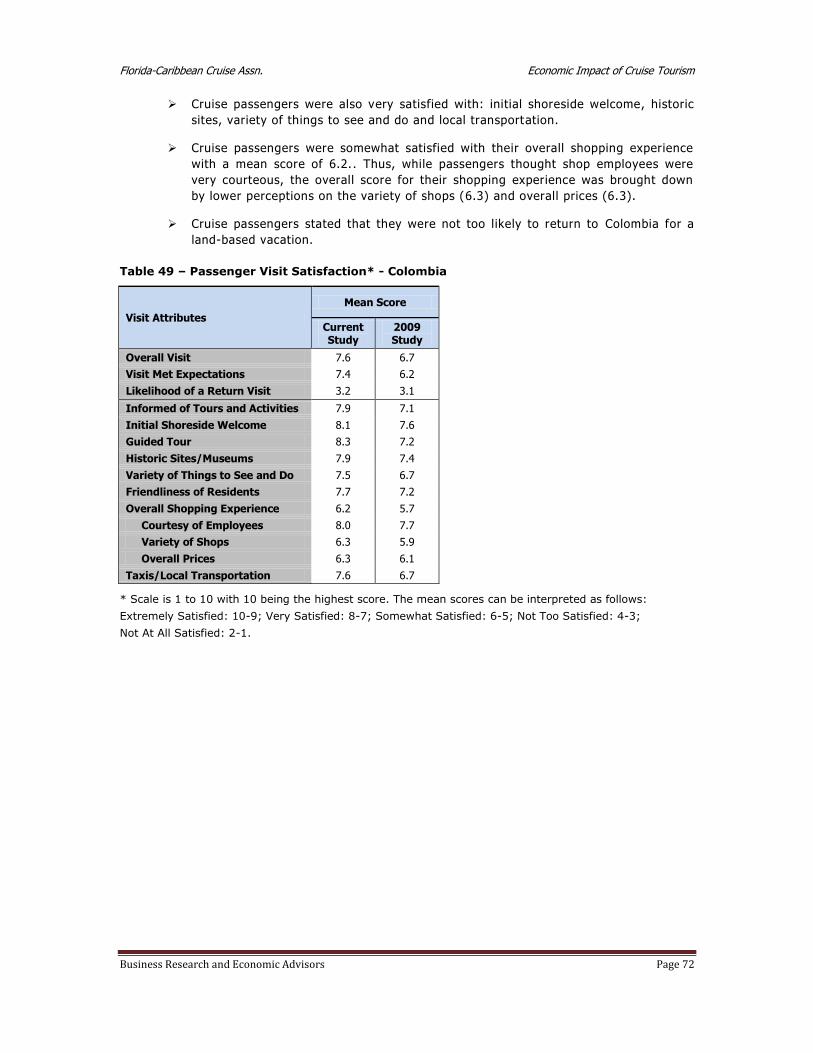
Florida-Caribbean Cruise Assn. Economic Impact of Cruise Tourism
Business Research and Economic Advisors Page 72
Cruise passengers were also very satisfied with: initial shoreside welcome, historic
sites, variety of things to see and do and local transportation.
Cruise passengers were somewhat satisfied with their overall shopping experience
with a mean score of 6.2.. Thus, while passengers thought shop employees were
very courteous, the overall score for their shopping experience was brought down
by lower perceptions on the variety of shops (6.3) and overall prices (6.3).
Cruise passengers stated that they were not too likely to return to Colombia for a
land-based vacation.
Table 49 – Passenger Visit Satisfaction* - Colombia
Visit Attributes
Mean Score
Current Study
2009 Study
Overall Visit 7.6 6.7
Visit Met Expectations 7.4 6.2
Likelihood of a Return Visit 3.2 3.1
Informed of Tours and Activities 7.9 7.1
Initial Shoreside Welcome 8.1 7.6
Guided Tour 8.3 7.2
Historic Sites/Museums 7.9 7.4
Variety of Things to See and Do 7.5 6.7
Friendliness of Residents 7.7 7.2
Overall Shopping Experience 6.2 5.7
Courtesy of Employees 8.0 7.7
Variety of Shops 6.3 5.9
Overall Prices 6.3 6.1
Taxis/Local Transportation 7.6 6.7
* Scale is 1 to 10 with 10 being the highest score. The mean scores can be interpreted as follows:
Extremely Satisfied: 10-9; Very Satisfied: 8-7; Somewhat Satisfied: 6-5; Not Too Satisfied: 4-3;
Not At All Satisfied: 2-1.

Florida-Caribbean Cruise Assn. Economic Impact of Cruise Tourism
Business Research and Economic Advisors Page 73
Passenger Demographics
Residents of the United States and the Canada accounted for 92 percent of the responding
passengers. The average age of the respondents was 64 years with 61 percent of the
respondents being 65 years of age or older. Colombia passengers had an average household
income of $105,400 with 41 percent having over $100,000 in household income.
Figure 31 – Passenger Age Colombia
Under 151%
15 - 241%
25 - 443%
45 - 6433%
Over 6462%
Figure 32 – Passenger Household Income Colombia
Under $50,00016%
$50,000 to $75,000
25%$75,000 to $100,000
18%
$100,000 to $150,000
23%
$150,000 to $200,000
10%
$200,000 or more
8%

Florida-Caribbean Cruise Assn. Economic Impact of Cruise Tourism
Business Research and Economic Advisors Page 74
Costa Rica
At the core of the analysis of the economic contribution of cruise tourism were a set of
passenger and crew surveys that were conducted onboard ships of the FCCA member cruise
lines.38 The surveys were undertaken during the six-month period beginning in December 2011
and ending in May 2012. The survey schedule was designed so that surveys were conducted by
FCCA member cruise lines that called at each destination and that the distribution of passenger
and crew surveys would reflect the distribution of passenger and crew arrivals by cruise line at
each destination. On any given cruise itinerary, passenger and crew surveys were placed in all
passenger cabins and crew quarters following a single destination call. The surveys were
completed by the passengers and crew in the privacy of their quarters and returned to a
designated office on the cruise ship. Thus, passengers and crew were only surveyed once during
a cruise itinerary and for a single destination. On a subsequent itinerary, passengers were
surveyed following a call at a different destination.
The passenger and crew surveys were designed to collect data for onshore spending and visit
satisfaction by both passengers and crew. While the crew survey was slightly shorter than the
passenger survey, both surveys were designed to col lect the following information:
hours spent ashore;
expenditures by category, including shore tours, food & beverages, clothing, etc.;
visit satisfaction, including shore tour, friendliness of residents, prices, shopping,
etc.;
likelihood of returning for a land-based vacation; and
demographic characteristics, including country of residence, age group, income, etc.
Combining the expenditure data collected from the passenger and crew surveys with data on
expenditures by cruise lines for port fees and services, payments to local tour operators for
passenger shore excursions purchased onboard the cruise ships, and other provisions purchased
locally by the cruise lines, estimates of total cruise tourism expenditures were developed for
each participating destination.
Given the direct spending estimates, the economic contribution of these expenditures, as
measured by employment and wage income were then estimated for each de stination. This
process began with the collection of economic data for each destination from a combination of
local, regional and international sources. Utilizing all of these data a set of economic impact
models were developed for each destination to estimate the direct and total employment and
wage impacts. A more detailed description of these models is provided in the Data and
Methods section of Volume I.
38 Surveys were conducted on the ships of the following cruise lines: Carnival Cruise Lines, Celebrity Cruises, Disney Cruise Line, Holland America Line, Norwegian Cruise Line, Princess Cruises, P&O Cruises and Royal Caribbean International.
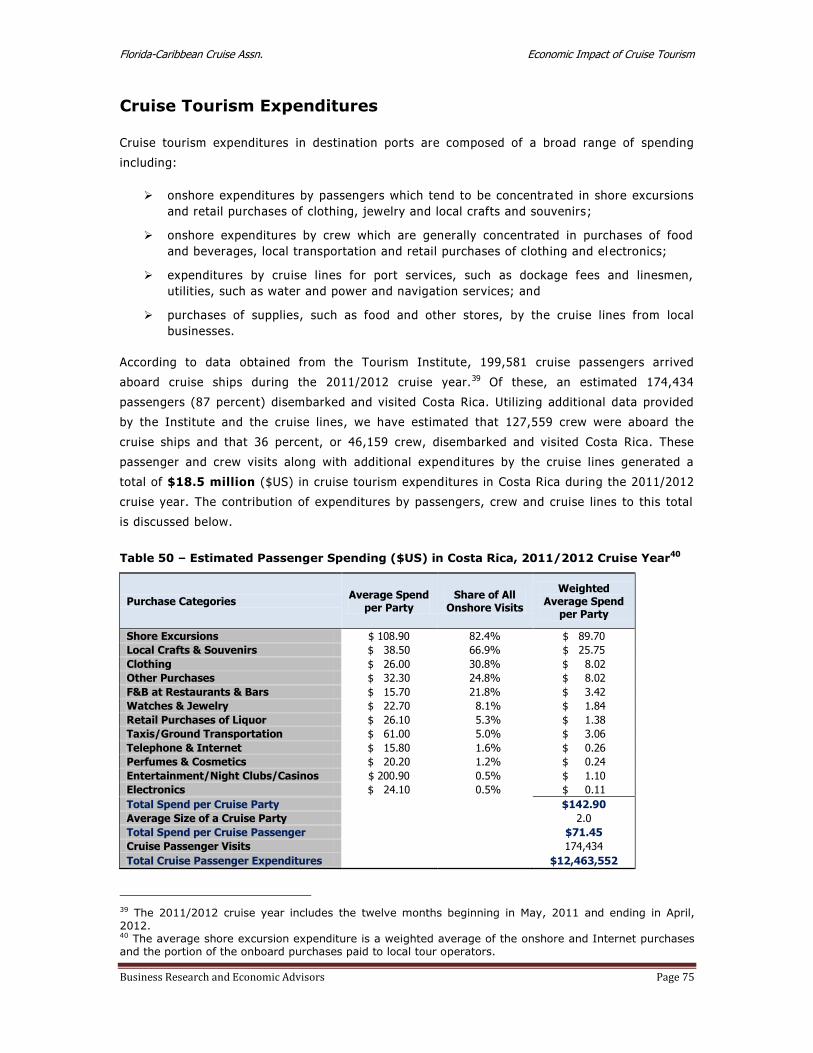
Florida-Caribbean Cruise Assn. Economic Impact of Cruise Tourism
Business Research and Economic Advisors Page 75
Cruise Tourism Expenditures
Cruise tourism expenditures in destination ports are composed of a broad range of spending
including:
onshore expenditures by passengers which tend to be concentra ted in shore excursions
and retail purchases of clothing, jewelry and local crafts and souvenirs;
onshore expenditures by crew which are generally concentrated in purchases of food
and beverages, local transportation and retail purchases of clothing and el ectronics;
expenditures by cruise lines for port services, such as dockage fees and linesmen,
utilities, such as water and power and navigation services; and
purchases of supplies, such as food and other stores, by the cruise lines from local
businesses.
According to data obtained from the Tourism Institute, 199,581 cruise passengers arrived
aboard cruise ships during the 2011/2012 cruise year.39 Of these, an estimated 174,434
passengers (87 percent) disembarked and visited Costa Rica. Utilizing additional data provided
by the Institute and the cruise lines, we have estimated that 127,559 crew were aboard the
cruise ships and that 36 percent, or 46,159 crew, disembarked and visited Costa Rica. These
passenger and crew visits along with additional expend itures by the cruise lines generated a
total of $18.5 million ($US) in cruise tourism expenditures in Costa Rica during the 2011/2012
cruise year. The contribution of expenditures by passengers, crew and cruise lines to this total
is discussed below.
Table 50 – Estimated Passenger Spending ($US) in Costa Rica, 2011/2012 Cruise Year40
Purchase Categories Average Spend
per Party Share of All
Onshore Visits
Weighted Average Spend
per Party
Shore Excursions $ 108.90 82.4% $ 89.70
Local Crafts & Souvenirs $ 38.50 66.9% $ 25.75
Clothing $ 26.00 30.8% $ 8.02
Other Purchases $ 32.30 24.8% $ 8.02
F&B at Restaurants & Bars $ 15.70 21.8% $ 3.42
Watches & Jewelry $ 22.70 8.1% $ 1.84
Retail Purchases of Liquor $ 26.10 5.3% $ 1.38
Taxis/Ground Transportation $ 61.00 5.0% $ 3.06
Telephone & Internet $ 15.80 1.6% $ 0.26
Perfumes & Cosmetics $ 20.20 1.2% $ 0.24
Entertainment/Night Clubs/Casinos $ 200.90 0.5% $ 1.10
Electronics $ 24.10 0.5% $ 0.11
Total Spend per Cruise Party $142.90
Average Size of a Cruise Party 2.0
Total Spend per Cruise Passenger $71.45
Cruise Passenger Visits 174,434
Total Cruise Passenger Expenditures $12,463,552
39 The 2011/2012 cruise year includes the twelve months beginning in May, 2011 and ending in April, 2012. 40 The average shore excursion expenditure is a weighted average of the onshore and Internet purchases and the portion of the onboard purchases paid to local tour operators.

Florida-Caribbean Cruise Assn. Economic Impact of Cruise Tourism
Business Research and Economic Advisors Page 76
Per passenger spending estimates were derived from the 1,548 surveys completed by
passengers that went ashore during the survey period. As shown in Table 50, each passenger
cruise party spent an average of $142.90 in Costa Rica. The average spend per cruise party is
the sum of the weighted spending in each of the twelve categories. For example, 22 percent of
the survey respondents reported spending an average of $15.70 at local restaurants and/or
bars. Spread over the cruise parties that visited Costa Rica, this represents an average of $3.42
per party. On a per passenger basis, the average total expenditure was $71.45. This represents
the sum of per party expenditures, $142.90, divided by the average size of a cruise party in
Costa Rica, 2.0 passengers.
Cruise passenger expenditures in the Costa Rica were concentrated in three categories which
accounted for 86 percent of their onshore expenditures: shore excursions, local crafts and
clothing. Thirty percent or more of the passengers that went ashore made purchases in the
same three categories.
Eighty-two percent (82%) of the passengers reported that their cruise party purchased a shore
excursion. The effective local price of the shore excursion was $109 per party but when the full
price of the purchase from cruise lines and travel agents is included passengers spent an
average of $179 per party for their tours.
For the entire 2011/2012 cruise year, the estimated 174,434 cruise passengers who visited
Costa Rica spent a total of $12.5 million ($US).
Per crew spending estimates were derived from the surveys completed by crew members during
the survey period. As shown in Table 51, each crew member spent an average of $44.40 in
Costa Rica. The average spend per crew member is the sum of the weighted spending in each of
the eleven categories.41 For example, 70 percent of the survey respondents reported spending
an average of $23.80 for food and beverages. Spread over all the crew members that reported
visiting Costa Rica, this represents an average of $16.71 per crew member.
Expenditures by crew in Costa Rica were concentrated in three categories which accounted for
77 percent of their onshore expenditures: food and beverages, local crafts and other
(unspecified) purchases. Combined, crew spent an average of $34.19 for goods in these three
categories. Purchases of food and beverages were the most popular expenditure item with 70%
percent of the crew reporting the purchase of food and beverages.
For the entire 2011/2012 cruise year, the estimated 46,159 crew who visited Costa Rica spent
an estimated total of $2.0 million ($US).
41 No crew member reported purchasing watches or jewelry in Costa Rica.

Florida-Caribbean Cruise Assn. Economic Impact of Cruise Tourism
Business Research and Economic Advisors Page 77
Table 51 – Estimated Crew Spending ($US) in Costa Rica, 2011/2012 Cruise Year
Purchase Categories Average Spend
per Crew Share of All
Onshore Visits
Weighted Average Spend
per Crew
F&B at Restaurants & Bars $ 23.80 70.1% $ 16.71
Taxis/Ground Transportation $ 16.40 22.4% $ 3.67
Local Crafts & Souvenirs $ 53.70 17.0% $ 9.13
Clothing $ 14.80 14.6% $ 2.16
Telephone & Internet $ 4.10 11.4% $ 0.47
Other Purchases $ 84.30 9.9% $ 8.35
Shore Excursions $ 5.40 7.8% $ 0.42
Perfumes & Cosmetics $ 7.00 4.7% $ 0.33
Retail Purchases of Liquor $ 11.60 4.4% $ 0.51
Entertainment/Night Clubs/Casinos $ 36.90 3.9% $ 1.43
Electronics $ 188.90 0.6% $ 1.22
Total Spend per Crew $44.40
Cruise Passenger Visits 46,159
Total Cruise Passenger Expenditures $2,049,462
Cruise lines made payments to local businesses for a variety of goods and services. Net
payments to local vendors for shore excursions have been included with passenger
expenditures. However, cruise lines made other local expenditures, including payments for port
fees and taxes, navigation services, utilities and other supplies. Based upon data provided by
the FCCA member cruise l ines, we estimated that all cruise lines spent $4.0 million ($US) in
Costa Rica during the 2011/2012 cruise year. Approximately 40 percent of these payments went
for port fees, taxes and navigation services with the remaining 60 percent going toward the
purchase of ship’s stores.
Economic Contribution of Cruise Tourism Expenditures
As noted in the Data and Methods section of the full report, a set of economic impact models
were developed for each destination to produce estimates of the economic contribution of cruise
tourism. Data for these models were collected from a broad range of local, regional and
international sources. The impact models were designed to reflect the economic structure of
each destination, including the industrial composition of Gross Domestic Product (GDP), the
wage share of GDP by industry and average employee wages by industry.
Table 52 – Total Economic Contribution of Cruise Tourism in Costa Rica
2011/2012 Cruise Year
Employment Wage Income ($US Millions)
Direct Economic Contribution 381 $ 2.1
Total Economic Contribution 537 $ 3.0
As shown in Table 52, the $18.58 million in total cruise tourism expenditures generated direct
employment of 381 residents of Costa Rica paying $2.1 million in annual wages. Adding the
indirect contribution that results from the spending of those local businesses that are the direct
recipients of passenger, crew and cruise line expenditures , the direct cruise tourism
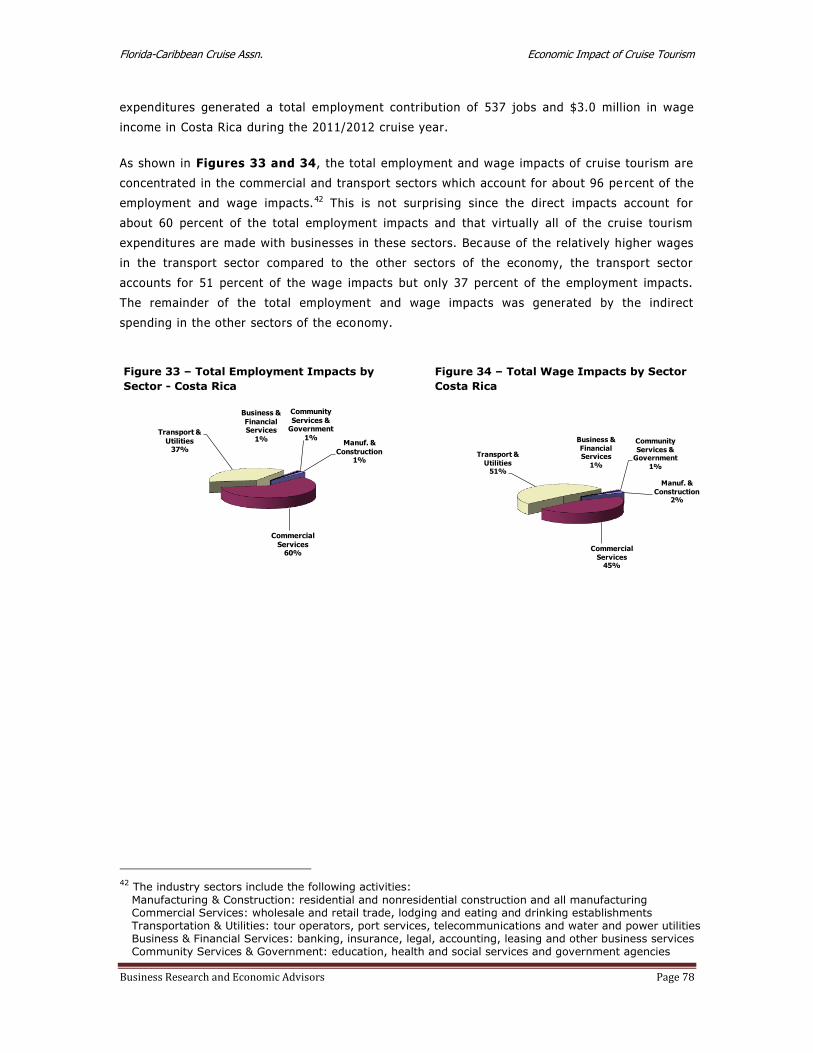
Florida-Caribbean Cruise Assn. Economic Impact of Cruise Tourism
Business Research and Economic Advisors Page 78
expenditures generated a total employment contribution of 537 jobs and $3.0 million in wage
income in Costa Rica during the 2011/2012 cruise year.
As shown in Figures 33 and 34, the total employment and wage impacts of cruise tourism are
concentrated in the commercial and transport sectors which account for about 96 pe rcent of the
employment and wage impacts.42 This is not surprising since the direct impacts account for
about 60 percent of the total employment impacts and that virtually all of the cruise tourism
expenditures are made with businesses in these sectors. Because of the relatively higher wages
in the transport sector compared to the other sectors of the economy, the transport sector
accounts for 51 percent of the wage impacts but only 37 percent of the employment impacts.
The remainder of the total employment and wage impacts was generated by the indirect
spending in the other sectors of the economy.
42 The industry sectors include the following activities:
Manufacturing & Construction: residential and nonresidential construction and all manufacturing Commercial Services: wholesale and retail trade, lodging and eating and drinking establishments Transportation & Utilities: tour operators, port services, telecommunications and water and power utilities Business & Financial Services: banking, insurance, legal, accounting, leasing and other business services Community Services & Government: education, health and social services and government agencies
Figure 33 – Total Employment Impacts by
Sector - Costa Rica
Manuf. &
Construction1%
Commercial
Services60%
Transport &
Utilities37%
Business &
Financial Services
1%
Community
Services & Government
1%
Figure 34 – Total Wage Impacts by Sector
Costa Rica
Manuf. &
Construction2%
Commercial
Services45%
Transport &
Utilities51%
Business &
Financial Services
1%
Community
Services & Government
1%

Florida-Caribbean Cruise Assn. Economic Impact of Cruise Tourism
Business Research and Economic Advisors Page 79
Comparison to 2009 Study
Total passenger and crew visits declined by 30 percent from 314,000 visits during the 2008/2009 cruise
year to 220,600 during the 2011/2012 cruise year. Total direct cruise tourism expenditures declined at a
similar rate, decreasing from $26.3 million to $18.5 million. As indicated in Table 53, all three components
of cruise tourism expenditures, passengers, crew and cruise lines, experienced a decline in spending.
Table 53 – Comparison of Cruise Tourism Impacts, Current Study versus 2009 Study - Costa Rica
Current
Study 2009
Study Percent Change
Total Onshore Visits (Thousands) 220.6 314.0 -29.7%
Passengers 174.4 266.9 -34.7%
Crew 46.2 47.1 - 1.9%
Total Direct Expenditures ($US Millions) $ 18.5 $ 26.3 -29.6%
Passengers $ 12.5 $ 18.0 -30.6%
Crew $ 2.0 $ 2.4 -16.7%
Cruise Lines $ 4.0 $ 5.9 -32.2%
Average Per Passenger Expenditure $71.45 $ 67.28 +6.2% Average Per Crew Expenditure $44.40 $ 51.97 -14.6%
Total Employment Impact 537 719 -25.3%
Total Wage Impact ($US Millions) $ 3.0 $ 3.9 -23.1%
The 31 percent decline in passenger expenditures was the net result of the 35 percent decrease in
passenger visits and the 6 percent increase in the average expenditure per passenger. The increase in the
average expenditure per passenger was generally the result in both an increase in the purchase value of the
goods and services bought in Costa Rica and an increase in the percentage of passengers making onshore
purchases. For example, during the 2008/2009 cruise year 80 percent of passengers reported purchasing a
shore excursion with an average expenditure of $90. During the 2011/2012 cruise 82 percent of passengers
reported purchasing a shore excursion at an average price of $109.
The 17 percent decline in crew expenditures was the result of the 2 percent decline in crew visits and the 14
percent decline in the average crew expenditure. In general, crew spent more when they made a purchase
but a significantly lower percentage of crew made onshore purchases during the 2011/2012 cruise year.
As a result of the 30 percent decline in direct cruise tourism expenditures, the total employment impact
declined by 25 percent over the three-year period while the wage impact decreased by 23 percent.
Passenger Surveys
A total of 1,548 passenger surveys were completed and returned for tabulation. Table 54
shows the major attributes of passenger visits in Costa Rica as derived from the passenger
surveys.

Florida-Caribbean Cruise Assn. Economic Impact of Cruise Tourism
Business Research and Economic Advisors Page 80
Table 54 - Major Attributes of Transit Passenger Surveys - Costa Rica
Number Percent
Total Respondents 1,548
Number Making First Visit 1,223 79.0%
Number Ashore 1,528 98.7%
Number Making Onshore Purchases: 1,096 71.7%
Average Hours Ashore 5.6
Average Size of Expenditure Party (Persons) 2.0
Average Onshore Expenditure per Party $53.20
Purchased a Shore Excursion (Tour) 1,259 82.4%
Purchased Onshore Tour from:
Cruise Line 1,021 81.1%
Onshore from Tour Operator 117 9.3%
Travel Agent 121 9.6%
Average Cost of Shore Excursion per Party $179
Toured On Own/Did not Tour 269
Of the 1,548 cruise parties that completed the surveys 79% stated that this had
been their first visit to Costa Rica. This is an increase from75% in the2009 study.
Ninety-nine percent (99%) of the cruise parties that completed the surveys
disembarked their cruise ship to visit Costa Rica.
Of the cruise parties that went ashore, 72% made at least one purchase while
ashore. This was a decline from 76% in the 2008/2009 cruise year. The typical
cruise party consisted of 2.0 passengers and spent an average of 5.6 hours ashore.
The responding cruise parties reported spending an average of $53.20 while ashore
(excludes shore excursions), a decline of 14 percent from the 2008/2009 cruise
year.
Eighty-two percent (82%) of the passengers that went ashore purchased a shore
excursion, a slight increase from 80% in the 2009 study. Eighty-one percent (81%)
of passengers who purchased a tour did so through their cruise line, 9% purchased
their tour onshore and nearly 10 percent purchased their tour through their travel
agent.
The typical cruise party that purchased a shore excursion spent $179 for their tour.
This was a 19 percent increase from $150 during the 2008/2009 cruise year.
Passenger Satisfaction
The passenger survey also asked the passengers to rate their satisfaction with their destination
visit along a number of parameters, as shown in Table 55. A 10-point scale was used with 10
being the highest score, i.e., extremely satisfied, and 1 being the lowest score, i.e., not at all
satisfied.
Among other key conclusions concerning visit satisfaction were the following:
Passenger satisfaction scores in the current study showed sign ificant increases in all
categories from the 2009 study.

Florida-Caribbean Cruise Assn. Economic Impact of Cruise Tourism
Business Research and Economic Advisors Page 81
Table 55 – Passenger Visit Satisfaction* - Costa Rica
Visit Attributes
Mean Score
Current Study
2009 Study
Overall Visit 8.4 7.6
Visit Met Expectations 7.9 7.0
Likelihood of a Return Visit 4.6 4.4
Informed of Tours and Activities 8.3 7.8
Initial Shoreside Welcome 8.2 7.4
Guided Tour 9.1 8.4
Historic Sites/Museums 7.6 6.6
Variety of Things to See and Do 7.7 6.9
Friendliness of Residents 8.7 8.2
Overall Shopping Experience 7.4 6.4
Courtesy of Employees 8.7 8.2
Variety of Shops 6.8 5.9
Overall Prices 7.4 6.9
Taxis/Local Transportation 8.1 7.0
* Scale is 1 to 10 with 10 being the highest score. The mean scores can be interpreted as follows:
Extremely Satisfied: 10-9; Very Satisfied: 8-7; Somewhat Satisfied: 6-5; Not Too Satisfied: 4-3;
Not At All Satisfied: 2-1.
Cruise passengers were very satisfied with their overall visit to Costa Rica with a
mean score of 8.4. The survey respondents also reported that their visit exceeded
their expectations. The mean score for “Visit Met Expectations” was 7.9.
Passengers felt very informed about tours and onshore activities in Costa Rica with
a mean score of 8.3.
“Guided Tours” (or Shore Excursions) received the highest score of all visit
attributes with a mean score of 9.1. Thus, cruise passengers were extremely
satisfied with their shore excursions.
Passenger interactions with residents and store employees were very positive with
“friendliness of residents” and “courtesy of employees” each receiving a mean score
of 8.7.
Cruise passengers were also very satisfied with: initial shoreside welcome, historic
sites, variety of things to see and do and local transportation ..
Cruise passengers were also very satisfied with their overall shopping experience
with a mean score of 7.4. While passengers thought shop employees were very
courteous, the overall score for their shopping experience was brought down by
lower perceptions on the variety of shops (6.8) and overall prices (7.4).
Cruise passengers stated that they were not too likely to return to Costa Rica for a
land-based vacation.

Florida-Caribbean Cruise Assn. Economic Impact of Cruise Tourism
Business Research and Economic Advisors Page 82
Passenger Demographics
Residents of the United States and the Canada accounted for 93 percent of the responding
passengers. The average age of the respondents was 63 years with 58 percent of the
respondents being 65 years of age or older. Costa Rica passengers had an average household
income of $95,500 with 33 percent having over $100,000 in household income.
Figure 35 – Passenger Age
Costa Rica
Under 151%
15 - 241%
25 - 445%
45 - 6435%Over 64
58%
Figure 36 – Passenger Household Income
Costa Rica
Under $50,00018%
$50,000 to $75,000
30%$75,000 to $100,000
20%
$100,000 to $150,000
19%
$150,000 to $200,000
8%
$200,000 or more
5%
Florida-Caribbean Cruise Assn. Economic Impact of Cruise Tourism
Business Research and Economic Advisors Page 83
Curacao
At the core of the analysis of the economic contribution of cruise tourism were a set of
passenger and crew surveys that were conducted onboard ships of the FCCA member cruise
lines.43 The surveys were undertaken during the six-month period beginning in December 2011
and ending in May 2012. The survey schedule was designed so that surveys were conducted by
FCCA member cruise lines that called at each destination and that the distribution of passenger
and crew surveys would reflect the distribution of passenger and crew arrivals by cruise line at
each destination. On any given cruise itinerary, passenger and crew surveys were placed in all
passenger cabins and crew quarters following a single destination call. The surveys were
completed by the passengers and crew in the privacy of their quarters and returned to a
designated office on the cruise ship. Thus, passengers and crew were only surve yed once during
a cruise itinerary and for a single destination. On a subsequent itinerary, passengers were
surveyed following a call at a different dest ination.
The passenger and crew surveys were designed to collect data for onshore spending and visit
satisfaction by both passengers and crew. While the crew survey was slightly shorter than the
passenger survey, both surveys were designed to collect the following information:
hours spent ashore;
expenditures by category, including shore tours, food & beverages, clothing, etc.;
visit satisfaction, including shore tour, friendliness of residents, prices, shopping,
etc.;
likelihood of returning for a land-based vacation; and
demographic characteristics, including country of residence, age group, income, etc.
Combining the expenditure data collected from the passenger and crew surveys with data on
expenditures by cruise lines for port fees and services, payments to local tour operators for
passenger shore excursions purchased onboard the cruise ships, and other provisions purchased
locally by the cruise lines, estimates of total cruise tourism expenditures were developed for
each participating destination.
Given the direct spending estimates, the economic contribution of these expenditures, as
measured by employment and wage income were then estimated for each destination. This
process began with the collection of economic data for each destination from a combination of
local, regional and international sources. Utilizing all of these data a set of economic impact
models were developed for each destination to estimate the direct and total employment and
wage impacts. A more detailed description of these models is provided in the Data and
Methods section of Volume I.
43 Surveys were conducted on the ships of the following cruise lines: Carnival Cruise Lines, Celebrity Cruises, Disney Cruise Line, Holland America Line, Norwegian Cruise Line, Princess Cruises, P&O Cruises and Royal Caribbean International.

Florida-Caribbean Cruise Assn. Economic Impact of Cruise Tourism
Business Research and Economic Advisors Page 84
Cruise Tourism Expenditures
Cruise tourism expenditures in destination ports are composed of a broad range of spending
including:
onshore expenditures by passengers which tend to be concentrated in shore excursions
and retail purchases of clothing, jewelry and local crafts and souvenirs;
onshore expenditures by crew which are generally concentrated in purchases of food
and beverages, local transportation and retail purchases of clothing and electronics ;
expenditures by cruise lines for port services, such as dockage fees and linesmen,
utilities, such as water and power and navigation services; and
purchases of supplies, such as food and other stores, by the cruise lines from local
businesses.
based upon data collected from the destinations at the CTO, 443,443 cruise passengers arrived
aboard cruise ships during the 2011/2012 cruise year.44 Of these, an estimated 407,524
passengers (92 percent) disembarked and visited Curacao. Utilizing additional data provided by
the visiting cruise lines, we have estimated that 177,345 crew were aboard the cruise ships and
that 38 percent, or 68,225 crew, disembarked and visited Curacao. These passenger and crew
visits along with additional expenditures by the cruise lines generated a total of $39.4 million
($US) in cruise tourism expenditures in Curacao during the 2011/2012 cruise year. The
contribution of expenditures by passengers, crew and cruise lines to this total is discussed
below.
Table 56 – Estimated Passenger Spending ($US) in Curacao, 2011/2012 Cruise Year45
Purchase Categories Average Spend
per Party Share of All
Onshore Visits
Weighted Average Spend
per Party
Shore Excursions $ 68.40 49.9% $ 34.10
F&B at Restaurants & Bars $ 22.10 46.9% $ 10.37
Local Crafts & Souvenirs $ 26.80 42.8% $ 11.47
Clothing $ 47.30 37.6% $ 17.78
Other Purchases $ 63.50 18.4% $ 11.71
Watches & Jewelry $ 269.40 16.3% $ 43.85
Retail Purchases of Liquor $ 25.70 13.6% $ 3.49
Taxis/Ground Transportation $ 40.80 11.7% $ 4.77
Perfumes & Cosmetics $ 44.50 4.9% $ 2.16
Entertainment/Night Clubs/Casinos $ 48.70 2.6% $ 1.27
Telephone & Internet $ 8.60 2.0% $ 0.17
Electronics $ 228.50 1.0% $ 2.26
Total Spend per Cruise Party $143.40
Average Size of a Cruise Party 2.0
Total Spend per Cruise Passenger $71.70
Cruise Passenger Visits 407,524
Total Cruise Passenger Expenditures $29,218,761
44 The 2011/2012 cruise year includes the twelve months beginning in May, 2011 and ending in April, 2012. 45 The average shore excursion expenditure is a weighted average of the onshore and Internet purchases and the portion of the onboard purchases paid to local tour operators.

Florida-Caribbean Cruise Assn. Economic Impact of Cruise Tourism
Business Research and Economic Advisors Page 85
Per passenger spending estimates were derived from the 1,698 surveys completed by
passengers that went ashore during the survey period. As shown in Table 56, each passenger
cruise party spent an average of $143.40 in Curacao. The average spend per cruise party is the
sum of the weighted spending in each of the twelve categories. For example, 47 percent of the
survey respondents reported spending an average of $22.10 at local restaurants and/or bars.
Spread over the cruise parties that visited Curacao, this represents an average of $10.37 per
party. On a per passenger basis, the average total expenditure was $71.70. This represents the
sum of per party expenditures, $143.40, divided by the average size of a cruise party in
Curacao, 2.0 passengers.
Cruise passenger expenditures in the Curacao were concentrated in three categories which
accounted for 75 percent of their onshore expenditures: watches and jewel ry, shore excursions,
clothing and local crafts. Forty percent or more of the passengers that went ashore made
purchases of shore excursions, food and beverages and local crafts.
Nearly 50 percent of the passengers reported that their cruise party purchased a shore
excursion. The effective local price of the shore excursion was $68.40 per party but when the
full price of the purchase from cruise lines and travel agents is included passengers spent an
average of $96.20 per party for their tours.
For the entire 2011/2012 cruise year, the estimated 407,524 cruise passengers who visited
Curacao spent a total of $29.2 million ($US).
Table 57 – Estimated Crew Spending ($US) in Curacao, 2011/2012 Cruise Year
Purchase Categories Average Spend
per Crew Share of All
Onshore Visits
Weighted Average Spend
per Crew
F&B at Restaurants & Bars $ 28.50 65.6% $ 18.68
Clothing $ 45.10 27.0% $ 12.19
Perfumes & Cosmetics $ 39.50 18.9% $ 7.46
Taxis/Ground Transportation $ 32.10 14.1% $ 4.52
Local Crafts & Souvenirs $ 14.90 13.3% $ 1.99
Entertainment/Night Clubs/Casinos $ 65.70 10.7% $ 7.06
Other Purchases $ 106.10 8.9% $ 9.43
Retail Purchases of Liquor $ 21.20 8.5% $ 1.81
Watches & Jewelry $ 95.50 4.1% $ 3.89
Electronics $ 144.90 3.3% $ 4.83
Shore Excursions $ 10.50 3.3% $ 0.35
Retail Purchases of Liquor $ 26.60 2.2% $ 0.59
Total Spend per Crew $72.80
Cruise Passenger Visits 68,225
Total Cruise Passenger Expenditures $4,966,811
Per crew spending estimates were derived from the nearly 600 surveys completed by crew
members during the survey period. As shown in Table 57, each crew member spent an average
of $72.80 in Curacao. The average spend per crew member is the sum of the weighted s pending
in each of the twelve categories. For example, 66 percent of the survey respondents reported
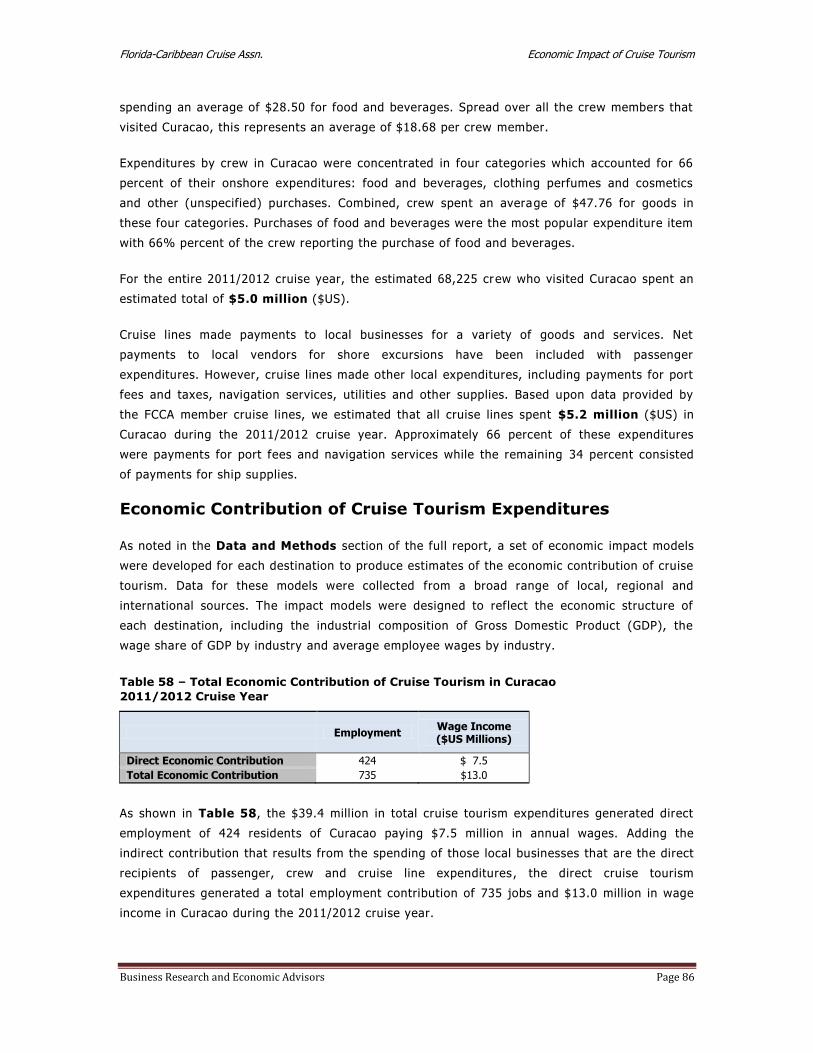
Florida-Caribbean Cruise Assn. Economic Impact of Cruise Tourism
Business Research and Economic Advisors Page 86
spending an average of $28.50 for food and beverages. Spread over all the crew members that
visited Curacao, this represents an average of $18.68 per crew member.
Expenditures by crew in Curacao were concentrated in four categories which accounted for 66
percent of their onshore expenditures: food and beverages, clothing perfumes and cosmetics
and other (unspecified) purchases. Combined, crew spent an average of $47.76 for goods in
these four categories. Purchases of food and beverages were the most popular expenditure item
with 66% percent of the crew reporting the purchase of food and beverages.
For the entire 2011/2012 cruise year, the estimated 68,225 crew who visited Curacao spent an
estimated total of $5.0 million ($US).
Cruise lines made payments to local businesses for a variety of goods and services. Net
payments to local vendors for shore excursions have been included with passenger
expenditures. However, cruise lines made other local expenditures, including payments for port
fees and taxes, navigation services, utilities and other supplies. Based upon data provided by
the FCCA member cruise lines, we estimated that all cruise lines spent $5.2 million ($US) in
Curacao during the 2011/2012 cruise year. Approximately 66 percent of these expenditures
were payments for port fees and navigation services while the remaining 34 percent consisted
of payments for ship supplies.
Economic Contribution of Cruise Tourism Expenditures
As noted in the Data and Methods section of the full report, a set of economic impact models
were developed for each destination to produce estimates of the economic contribution of cruise
tourism. Data for these models were collected from a broad range of local, regional and
international sources. The impact models were designed to reflect the economic structure of
each destination, including the industrial composition of Gross Domestic Product (GDP), the
wage share of GDP by industry and average employee wages by industry.
Table 58 – Total Economic Contribution of Cruise Tourism in Curacao
2011/2012 Cruise Year
Employment Wage Income ($US Millions)
Direct Economic Contribution 424 $ 7.5
Total Economic Contribution 735 $13.0
As shown in Table 58, the $39.4 million in total cruise tourism expenditures generated direct
employment of 424 residents of Curacao paying $7.5 million in annual wages. Adding the
indirect contribution that results from the spending of those local businesses that are the direct
recipients of passenger, crew and cruise line expenditures , the direct cruise tourism
expenditures generated a total employment contribution of 735 jobs and $13.0 million in wage
income in Curacao during the 2011/2012 cruise year.

Florida-Caribbean Cruise Assn. Economic Impact of Cruise Tourism
Business Research and Economic Advisors Page 87
As shown in Figures 37 and 38, the total employment and wage impacts of cruise tourism are
concentrated in the commercial and transport sectors which account for about 98 percent of the
employment and wage impacts.46 This is not surprising since the direct impacts account for
about 60 percent of the total employment impacts and that virtually all of the cruise tourism
expenditures are made with businesses in these sectors. Because of the relatively higher wages
in the transport sector compared to the other sectors of the economy, the transport sector
accounts for 27 percent of the wage impacts but only 17 percent of the employment impacts.
The remainder of the total employment and wage impacts was generated by the indirect
spending in the other sectors of the economy.
46 The industry sectors include the following activities:
Manufacturing & Construction: residential and nonresidential construction and all manufacturing Commercial Services: wholesale and retail trade, lodging and eating and drinking establishments Transportation & Utilities: tour operators, port services, telecommunications and water and power utilities Business & Financial Services: banking, insurance, legal, accounting, leasing and other business services Community Services & Government: education, health and social services and government agencies
Figure 37 – Total Employment Impacts by
Sector - Curacao
Manuf. &
Construction1%
Commercial
Services82%
Transport &
Utilities17%
Community
Services & Government
0%
Figure 38 – Total Wage Impacts by Sector
Curacao
Manuf. &
Construction1%
Commercial
Services71%
Transport &
Utilities27%
Community
Services & Government
1%

Florida-Caribbean Cruise Assn. Economic Impact of Cruise Tourism
Business Research and Economic Advisors Page 88
Comparison to 2009 Study
Total passenger and crew visits increased by 18 percent from 402,900 visits during the 2008/2009 cruise
year to 475,700 during the 2011/2012 cruise year. However, total direct cruise tourism expenditures only
increased by 0.3% over the three year period, increasing from $39.3 million to $39.4 million. As indicated in
Table 59, expenditures by passengers and cruise lines increased while crew expenditures declined.
Table 59 – Comparison of Cruise Tourism Impacts, Current Study versus 2009 Study - Curacao
Current
Study 2009
Study Percent Change
Total Onshore Visits (Thousands) 475.7 402.9 +18.1%
Passengers 407.5 344.4 +18.3%
Crew 68.2 58.5 +16.6%
Total Direct Expenditures ($US Millions) $ 39.4 $ 39.3 +0.3%
Passengers $ 29.2 $ 28.0 +4.3%
Crew $ 5.0 $ 6.8 -26.4%
Cruise Lines $ 5.2 $ 4.5 +15.6%
Average Per Passenger Expenditure $71.70 $ 81.21 -11.7% Average Per Crew Expenditure $72.80 $116.88 -37.7%
Total Employment Impact 735 748 -1.7%
Total Wage Impact ($US Millions) $ 13.0 $ 13.0 ---
The 4 percent increase in passenger expenditures was the net result of the 18 percent increase in
passenger visits and the 12 percent decrease in the average expenditure per passenger. The decline in the
average expenditure per passenger was primarily driven by the decline in average spending for jewelry and
clothing. In the case of jewelry those passengers that purchased jewelry spent less than passengers during
the 2008/2009 cruise year. The decline in clothing expenditures was the result of a smaller percentage of
passengers making clothing purchases.
The 26 percent decline in crew expenditures was the net result of the 17 percent increase in crew visits and
the 27 percent decline in average crew expenditures. The decline in average crew expenditure was
concentrated in jewelry, food and beverages and entertainment. In the case of food and beverages, crew
tended to spend less than in the 2008/2009 cruise year when they purchased these commodities,
unweighted purchases. For jewelry and entertainment a smaller percentage of crew made purchases in
these categories.
The slight decline in the employment impacts was largely the result of increased productivity which offset
the small gain in direct expenditures.
Passenger Surveys
A total of 1,698 passenger surveys were completed and returned for tabulation. Table 60
shows the major attributes of passenger visits in Curacao as derived from the passenger
surveys.

Florida-Caribbean Cruise Assn. Economic Impact of Cruise Tourism
Business Research and Economic Advisors Page 89
Of the 1,698 cruise parties that completed the surveys 65% stated that this had
been their first visit to Curacao. This is down from 72% in the 2009 study.
Ninety-eight percent (98%) of the cruise parties that completed the surveys
disembarked their cruise ship to visit Curacao.
Of the cruise parties that went ashore, 66% made at least one purchase while
ashore. this was a decline from 79% during the 2008/2009 cruise year. The typical
cruise party consisted of 2.0 passengers that spent an average of 4.1 hours ashore.
Table 60 - Major Attributes of Passenger Surveys - Curacao
Number Percent
Total Respondents 1,698
Number Making First Visit 1,104 65.0%
Number Ashore 1,671 98.4%
Number Making Onshore Purchases: 1,112 66.5%
Average Hours Ashore 4.1
Average Size of Expenditure Party (Persons) 2.0
Average Onshore Expenditure per Party $109
Purchased a Shore Excursion (Tour) 833 49.9%
Purchased Onshore Tour from:
Cruise Line 609 73.1%
Onshore from Tour Operator 157 18.8%
Travel Agent 67 8.1%
Average Cost of Shore Excursion per Party $96.20
Toured On Own/Did not Tour 838
The responding cruise parties reported spending an average of $109 while ashore
(excludes shore excursions), a 16 percent decline from $130 during the 2008/2009
cruise year.
Fifty-six percent (50%) of the passengers that went ashore purchased a shore
excursion. This was down from 56% in the 2009 study. Seventy-three percent
(73%) of passengers who purchased a tour did so through their cruise line, 19%
purchased their tour onshore and 8 percent purchased their tour through their
travel agent.
The typical cruise party that purchased a shore excursion spent $96.20 for their
tour. This was a 5 percent decline from $101 during the 2008/2009 cruise year.
Passenger Satisfaction
The passenger survey also asked the passengers to rate their satisfaction with their destination
visit along a number of parameters, as shown in Table 61. A 10-point scale was used with 10
being the highest score, i.e., extremely satisfied, and 1 being the lowest score, i.e., not at all
satisfied.

Florida-Caribbean Cruise Assn. Economic Impact of Cruise Tourism
Business Research and Economic Advisors Page 90
Table 61 – Passenger Visit Satisfaction* - Curacao
Visit Attributes
Mean Score
Current Study
2009 Study
Overall Visit 7.7 7.7
Visit Met Expectations 7.3 7.4
Likelihood of a Return Visit 4.2 4.0
Informed of Tours and Activities 7.9 7.9
Initial Shoreside Welcome 7.7 7.5
Guided Tour 8.1 8.0
Historic Sites/Museums 7.6 7.3
Variety of Things to See and Do 7.7 7.0
Friendliness of Residents 8.0 7.9
Overall Shopping Experience 7.1 7.1
Courtesy of Employees 8.0 7.9
Variety of Shops 7.2 7.2
Overall Prices 6.8 6.8
Taxis/Local Transportation 7.0 7.1
* Scale is 1 to 10 with 10 being the highest score. The mean scores can be interpreted as follows:
Extremely Satisfied: 10-9; Very Satisfied: 8-7; Somewhat Satisfied: 6-5; Not Too Satisfied: 4-3;
Not At All Satisfied: 2-1.
Among other key conclusions concerning visit satisfaction were the following:
Overall, the satisfaction scores for Curacao were about the same as in the 2009
study.
Cruise passengers were very satisfied with their overall visit to Curacao with a mean
score of 7.7. However, the visit did not score as high in terms of meeting
expectations. The mean score for “Visit Met Expectations” was lower at 7.3.
Passengers felt very informed about tours and onshore activities in Curacao with a
mean score of 7.9.
“Guided Tours” (or Shore Excursions) received the highest score of all visit
attributes with a mean score of 8.1. Thus, cruise passengers were very satisfied
with their shore excursions.
Passenger interactions with residents and store employees were very positive with
“friendliness of residents” and “courtesy of employees” each receiving a mean score
of 8.0.
Categories with slightly lower scores but still above 7.0 (Very Satisfied) were: initial
shoreside welcome, historic sites, variety of things to see and do and local
transportation.
Passengers were also very satisfied with their shopping experience which received a
mean score of 7.1. It was already noted that passengers were very satisfied with
shop employees but they were also very satisfied the variety of shops (7.2) but only
somewhat satisfied with overall prices (6.8).

Florida-Caribbean Cruise Assn. Economic Impact of Cruise Tourism
Business Research and Economic Advisors Page 91
Cruise passengers stated that they were not too likely to return to Curacao for a
land-based vacation.
Passenger Demographics
Residents of the United States and the Canada accounted for 87 percent of the responding
passengers. The average age of the respondents was 60 years with 52 percent of the
respondents being 65 years of age or older. Curacao passengers had an average household
income of $100,000 with 36 percent having over $100,000 in household income.
Figure 39 – Passenger Age
Curacao
Under 152%
15 - 242%
25 - 449%
45 - 6435%
Over 6452%
Figure 40 – Passenger Household Income
Curacao
Under $50,00018%
$50,000 to $75,000
25%$75,000 to $100,000
20%
$100,000 to $150,000
20%
$150,000 to $200,000
10%
$200,000 or more
7%

Florida-Caribbean Cruise Assn. Economic Impact of Cruise Tourism
Business Research and Economic Advisors Page 92
Dominica
At the core of the analysis of the economic contribution of cruise tourism were a set of
passenger and crew surveys that were conducted onboard ships of the FCCA member cruise
lines.47 The surveys were undertaken during the six-month period beginning in December 2011
and ending in May 2012. The survey schedule was designed so that surveys were conducted by
FCCA member cruise lines that called at each destination and that the distribution of passenger
and crew surveys would reflect the distribution of passenger and crew arrivals by cruise line at
each destination. On any given cruise itinerary, passenger and crew surveys were placed in all
passenger cabins and crew quarters following a single destination call. The surveys were
completed by the passengers and crew in the privacy of their quarters and returned to a
designated office on the cruise ship. Thus, passengers and crew were only surveyed once during
a cruise itinerary and for a single destination. On a subsequent itinerary, passengers were
surveyed following a call at a different dest ination.
The passenger and crew surveys were designed to collect data for onshore spending and visit
satisfaction by both passengers and crew. While the crew survey was slightly shorter than the
passenger survey, both surveys were designed to collect the following information:
hours spent ashore;
expenditures by category, including shore tours, food & beverages, clothing, etc.;
visit satisfaction, including shore tour, friendliness of residents, prices, shopping,
etc.;
likelihood of returning for a land-based vacation; and
demographic characteristics, including country of residence, age group, income, etc.
Combining the expenditure data collected from the passenger and crew surveys with data on
expenditures by cruise lines for port fees and services, payments to local tour operators for
passenger shore excursions purchased onboard the cruise ships, and other provisions purchased
locally by the cruise lines, estimates of total cruise tourism expenditures were developed for
each participating destination.
Given the direct spending estimates, the economic contribution of these expenditures, as
measured by employment and wage income were then estimated for each de stination. This
process began with the collection of economic data for each destination from a combination of
local, regional and international sources. Utilizing all of these data a set of economic impact
models were developed for each destination to estimate the direct and total employment and
wage impacts. A more detailed description of these models is provided in the Data and
Methods section of Volume I.
47 Surveys were conducted on the ships of the following cruise lines: Carnival Cruise Lines, Celebrity Cruises, Disney Cruise Line, Holland America Line, Norwegian Cruise Line, Princess Cruises, P&O Cruises and Royal Caribbean International.
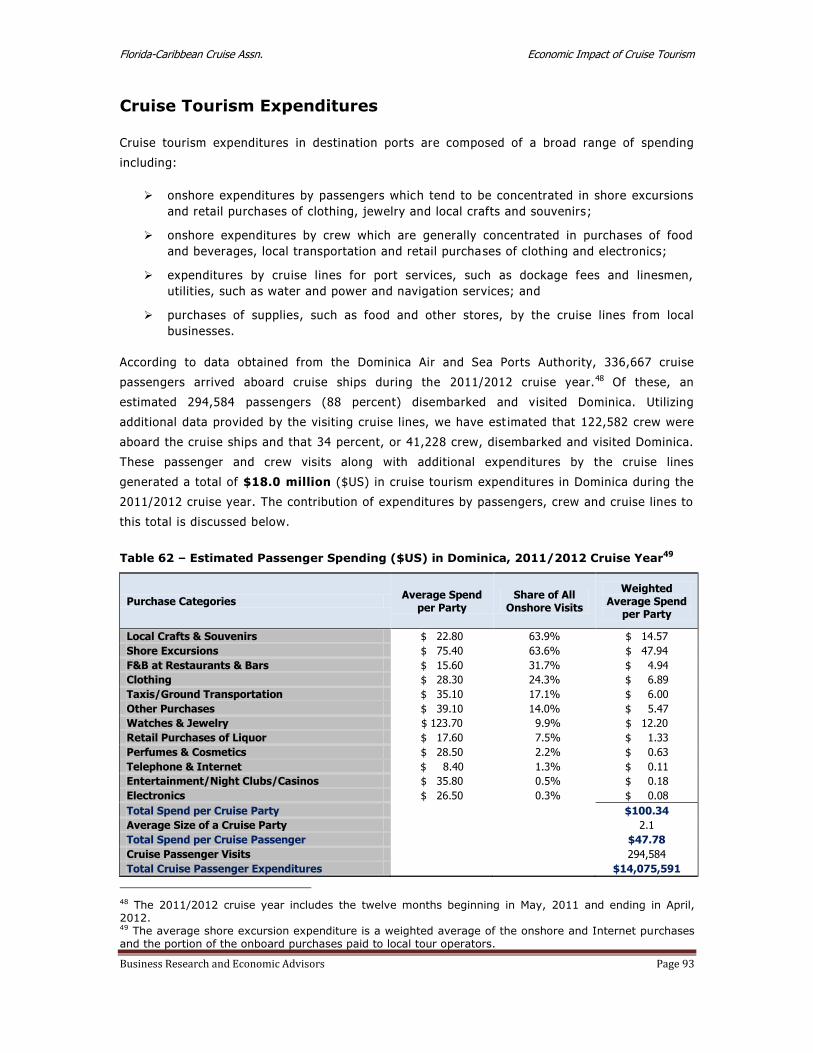
Florida-Caribbean Cruise Assn. Economic Impact of Cruise Tourism
Business Research and Economic Advisors Page 93
Cruise Tourism Expenditures
Cruise tourism expenditures in destination ports are composed of a broad range of spending
including:
onshore expenditures by passengers which tend to be concentrated in shore excursions
and retail purchases of clothing, jewelry and local crafts and souvenirs;
onshore expenditures by crew which are generally concentrated in purchases of food
and beverages, local transportation and retail purchases of clothing and electronics;
expenditures by cruise lines for port services, such as dockage fees and linesmen,
utilities, such as water and power and navigation services; and
purchases of supplies, such as food and other stores, by the cruise lines from local
businesses.
According to data obtained from the Dominica Air and Sea Ports Authority, 336,667 cruise
passengers arrived aboard cruise ships during the 2011/2012 cruise year.48 Of these, an
estimated 294,584 passengers (88 percent) disembarked and visited Dominica. Utilizing
additional data provided by the visiting cruise lines, we have est imated that 122,582 crew were
aboard the cruise ships and that 34 percent, or 41,228 crew, disembarked and visited Dominica.
These passenger and crew visits along with additional expenditures by the cruise lines
generated a total of $18.0 million ($US) in cruise tourism expenditures in Dominica during the
2011/2012 cruise year. The contribution of expenditures by passengers, crew and cruise lines to
this total is discussed below.
Table 62 – Estimated Passenger Spending ($US) in Dominica, 2011/2012 Cruise Year49
Purchase Categories Average Spend
per Party Share of All
Onshore Visits
Weighted Average Spend
per Party
Local Crafts & Souvenirs $ 22.80 63.9% $ 14.57
Shore Excursions $ 75.40 63.6% $ 47.94
F&B at Restaurants & Bars $ 15.60 31.7% $ 4.94
Clothing $ 28.30 24.3% $ 6.89
Taxis/Ground Transportation $ 35.10 17.1% $ 6.00
Other Purchases $ 39.10 14.0% $ 5.47
Watches & Jewelry $ 123.70 9.9% $ 12.20
Retail Purchases of Liquor $ 17.60 7.5% $ 1.33
Perfumes & Cosmetics $ 28.50 2.2% $ 0.63
Telephone & Internet $ 8.40 1.3% $ 0.11
Entertainment/Night Clubs/Casinos $ 35.80 0.5% $ 0.18
Electronics $ 26.50 0.3% $ 0.08
Total Spend per Cruise Party $100.34
Average Size of a Cruise Party 2.1
Total Spend per Cruise Passenger $47.78
Cruise Passenger Visits 294,584
Total Cruise Passenger Expenditures $14,075,591
48 The 2011/2012 cruise year includes the twelve months beginning in May, 2011 and ending in April, 2012. 49 The average shore excursion expenditure is a weighted average of the onshore and Internet purchases and the portion of the onboard purchases paid to local tour operators.
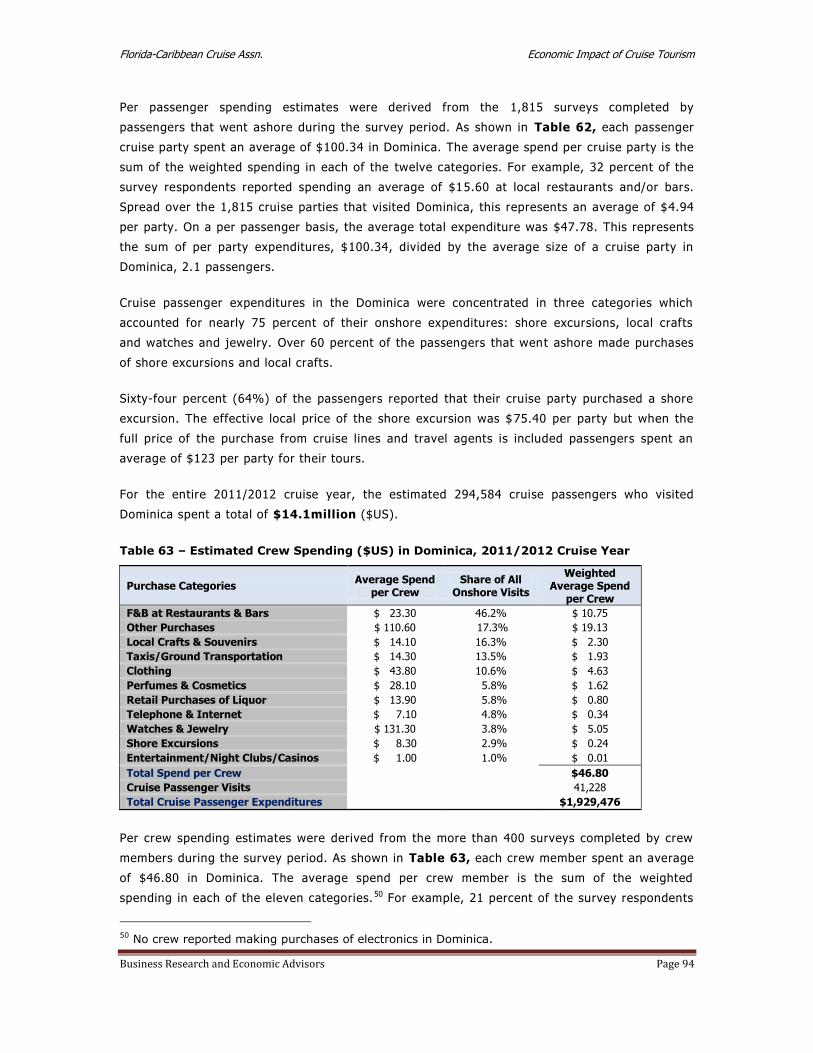
Florida-Caribbean Cruise Assn. Economic Impact of Cruise Tourism
Business Research and Economic Advisors Page 94
Per passenger spending estimates were derived from the 1,815 surveys completed by
passengers that went ashore during the survey period. As shown in Table 62, each passenger
cruise party spent an average of $100.34 in Dominica. The average spend per cruise party is the
sum of the weighted spending in each of the twelve categories. For example, 32 percent of the
survey respondents reported spending an average of $15.60 at local restaurants and/or bars.
Spread over the 1,815 cruise parties that visited Dominica, this represents an average of $4.94
per party. On a per passenger basis, the average total expenditure was $47.78. This represents
the sum of per party expenditures, $100.34, divided by the average size of a cruise party in
Dominica, 2.1 passengers.
Cruise passenger expenditures in the Dominica were concentrated in three categories which
accounted for nearly 75 percent of their onshore expenditures: shore excursions, local crafts
and watches and jewelry. Over 60 percent of the passengers that went ashore made purchases
of shore excursions and local crafts.
Sixty-four percent (64%) of the passengers reported that their cruise party purchased a shore
excursion. The effective local price of the shore excursion was $75.40 per party but when the
full price of the purchase from cruise lines and travel agents is included passengers spent an
average of $123 per party for their tours.
For the entire 2011/2012 cruise year, the estimated 294,584 cruise passengers who visited
Dominica spent a total of $14.1million ($US).
Table 63 – Estimated Crew Spending ($US) in Dominica, 2011/2012 Cruise Year
Purchase Categories Average Spend
per Crew Share of All
Onshore Visits
Weighted Average Spend
per Crew
F&B at Restaurants & Bars $ 23.30 46.2% $ 10.75
Other Purchases $ 110.60 17.3% $ 19.13
Local Crafts & Souvenirs $ 14.10 16.3% $ 2.30
Taxis/Ground Transportation $ 14.30 13.5% $ 1.93
Clothing $ 43.80 10.6% $ 4.63
Perfumes & Cosmetics $ 28.10 5.8% $ 1.62
Retail Purchases of Liquor $ 13.90 5.8% $ 0.80
Telephone & Internet $ 7.10 4.8% $ 0.34
Watches & Jewelry $ 131.30 3.8% $ 5.05
Shore Excursions $ 8.30 2.9% $ 0.24
Entertainment/Night Clubs/Casinos $ 1.00 1.0% $ 0.01
Total Spend per Crew $46.80
Cruise Passenger Visits 41,228
Total Cruise Passenger Expenditures $1,929,476
Per crew spending estimates were derived from the more than 400 surveys completed by crew
members during the survey period. As shown in Table 63, each crew member spent an average
of $46.80 in Dominica. The average spend per crew member is the sum of the weighted
spending in each of the eleven categories. 50 For example, 21 percent of the survey respondents
50 No crew reported making purchases of electronics in Dominica.

Florida-Caribbean Cruise Assn. Economic Impact of Cruise Tourism
Business Research and Economic Advisors Page 95
reported spending an average of $51.30 for food and beverages. Spread over all the crew
members that reported visiting Dominica, this represents an average of $10.75 per crew
member.
Expenditures by crew in Dominica were concentrated in two categories which accounted for 64
percent of their onshore expenditures: food and beverages and other (unspecified) purchases.
Combined, crew spent an average of $29.88 for goods in these two categories. Purchases of
food and beverages were the most popular expenditure item with 46% percent of the crew
reporting the purchase of food and beverages.
For the entire 2011/2012 cruise year, the estimated 41,228 crew who visited Dominica spent an
estimated total of $1.9 million ($US).
Cruise lines made payments to local businesses for a variety of goods and services. Net
payments to local vendors for shore excursions have been included with passenger
expenditures. However, cruise lines made other local expenditures, including payments for port
fees and taxes, navigation services, utilities and other supplies. Based upon data provided by
the FCCA member cruise lines, we estimated that all cruise lines spent $2.0 million ($US) in
Dominica during the 2011/2012 cruise year. Essentially all of these expenditures were payments
for port fees and taxes and navigation services.
Economic Contribution of Cruise Tourism Expenditures
As noted in the Data and Methods section of the full report, a set of economic impact models
were developed for each destination to produce estimates of the economic contribution of cruise
tourism. Data for these models were collected from a broad range of local, regional and
international sources. The impact models were designed to reflect the economic structure of
each destination, including the industrial composition of Gross Domestic Product (GDP), the
wage share of GDP by industry and average employee wages by industry.
Table 64 – Total Economic Contribution of Cruise Tourism in Dominica
2011/2012 Cruise Year
Employment Wage Income ($US Millions)
Direct Economic Contribution 308 $2.4
Total Economic Contribution 484 $3.7
As shown in Table 64, the $18 million in total cruise tourism expenditures generated direct
employment of 308 residents of Dominica paying $2.4 million in annual wages. Adding the
indirect contribution that results from the spending of those local businesses that are the direct
recipients of passenger, crew and cruise line expenditures , the direct cruise tourism
expenditures generated a total employment contribution of 484 jobs and $3.7 million in wage
income in Dominica during the 2011/2012 cruise year.
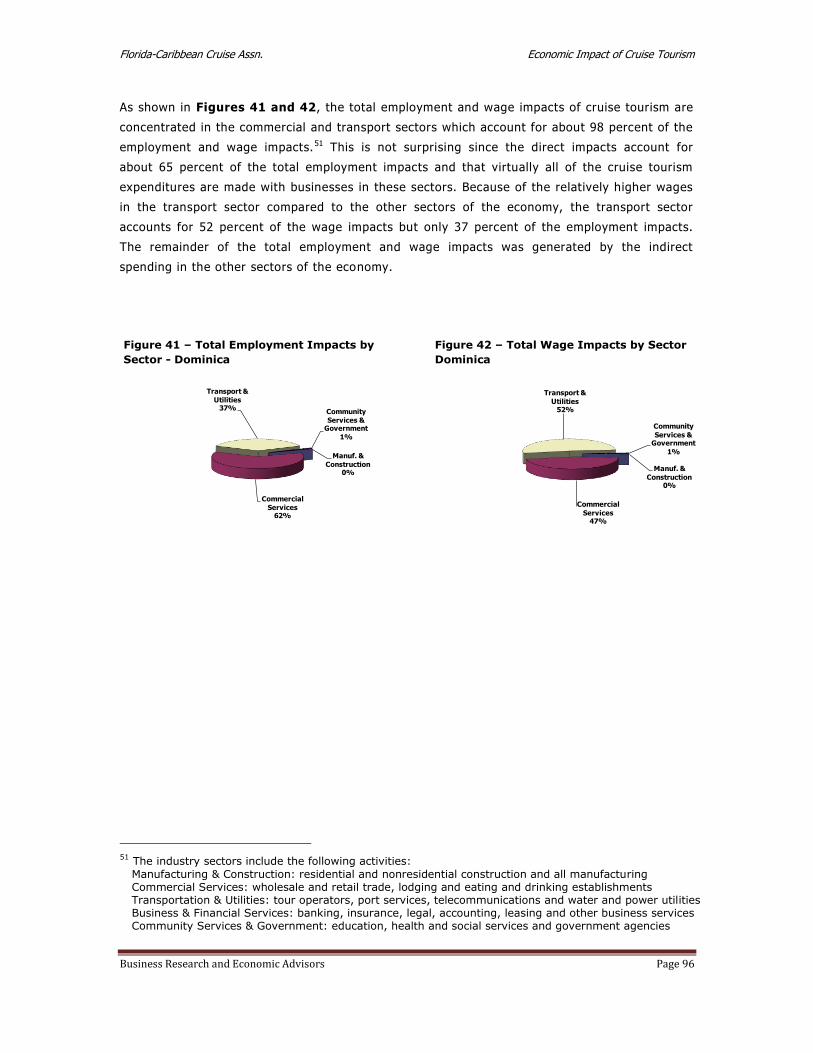
Florida-Caribbean Cruise Assn. Economic Impact of Cruise Tourism
Business Research and Economic Advisors Page 96
As shown in Figures 41 and 42, the total employment and wage impacts of cruise tourism are
concentrated in the commercial and transport sectors which account for about 98 percent of the
employment and wage impacts.51 This is not surprising since the direct impacts account for
about 65 percent of the total employment impacts and that virtually all of the cruise tourism
expenditures are made with businesses in these sectors. Because of the relatively higher wages
in the transport sector compared to the other sectors of the economy, the transport sector
accounts for 52 percent of the wage impacts but only 37 percent of the employment impacts.
The remainder of the total employment and wage impacts was generated by the indirect
spending in the other sectors of the economy.
51 The industry sectors include the following activities:
Manufacturing & Construction: residential and nonresidential construction and all manufacturing Commercial Services: wholesale and retail trade, lodging and eating and drinking establishments Transportation & Utilities: tour operators, port services, telecommunications and water and power utilities Business & Financial Services: banking, insurance, legal, accounting, leasing and other business services Community Services & Government: education, health and social services and government agencies
Figure 41 – Total Employment Impacts by
Sector - Dominica
Manuf. &
Construction0%
Commercial
Services62%
Transport &
Utilities37%
Community
Services & Government
1%
Figure 42 – Total Wage Impacts by Sector
Dominica
Manuf. &
Construction0%
Commercial
Services47%
Transport &
Utilities52%
Community
Services & Government
1%

Florida-Caribbean Cruise Assn. Economic Impact of Cruise Tourism
Business Research and Economic Advisors Page 97
Comparison to 2009 Study
Total passenger and crew visits increased by 25 percent from 269,100 visits during the 2008/2009 cruise
year to 335,800 during the 2011/2012 cruise year. Similarly, total direct cruise tourism expenditures
increased by 27 percent over the three year period, increasing from $14.2 million to $18.0 million. As
indicated in Table 65, passenger and cruise line expenditures increased while total spending by crew
declined.
Table 65 – Comparison of Cruise Tourism Impacts, Current Study versus 2009 Study - Dominica
Current
Study 2009
Study Percent Change
Total Onshore Visits (Thousands) 335.8 269.1 +24.8%
Passengers 294.6 231.8 +27.1%
Crew 41.2 37.3 +10.5%
Total Direct Expenditures ($US Millions) $ 18.0 $ 14.2 +26.8%
Passengers $ 14.1 $ 10.6 +33.0%
Crew $ 1.9 $ 2.1 -9.5%
Cruise Lines $ 2.0 $ 1.5 +33.3%
Average Per Passenger Expenditure $ 47.78 $ 45.87 +4.2% Average Per Crew Expenditure $ 46.80 $ 56.41 -17.0%
Total Employment Impact 484 405 +19.5%
Total Wage Impact ($US Millions) $ 3.7 $ 3.0 +23.3%
The 33 percent increase in passenger expenditures was the result of the 27 percent increase in passenger
visits and the 4 percent increase in the average expenditure per passenger. The increase in the average
expenditure per passenger was primarily the result of increased spending for food and beverages, jewelry
and local crafts. In all three categories more passengers reported making purchases in these categories and
that they spent more than during the 2008/2009 cruise year. For example, during the 2008/2009 cruise year
58 percent of passengers reported spending an average of $19.60 for local crafts. During the 2011/2012
cruise year the percentage of passengers purchasing local crafts increased to 64 percent and their average
purchase value had also increased to $22.80.
The 10 percent decline in crew expenditures was the net result of the 10 percent increase in crew visits and
the 17 percent decline in the average crew expenditure. The decline in average crew expenditures was the
net result of a general increase in the average purchase value in most categories but a decline in the
percentage of crew making onshore purchases.
As a result of the 27 percent increase in total expenditures, the total employment impacts increased by
nearly 20 percent while the wage income impact increased by 23 percent. The higher increase in wages is
due to increased labor productivity and average wages over the intervening period.

Florida-Caribbean Cruise Assn. Economic Impact of Cruise Tourism
Business Research and Economic Advisors Page 98
Passenger Surveys
A total of 1,815 passenger surveys were completed and returned for tabulation. Table 66
shows the major attributes of passenger visits in Dominica as derived from the passenger
surveys.
Of the 1,815 cruise parties that completed the surveys 74% stated that this had
been their first visit to Dominica, about the same as in the 2009 study.
Ninety-seven percent (97%) of the cruise parties that completed the surveys
disembarked their cruise ship to visit Dominica.
Of the cruise parties that went ashore, 57% made at least one purchase while
ashore. This is down from 66% during the 2008/2009 cruise year. The typical cruise
party consisted of 2.1 passengers that spent an average of 3.8 hours ashore.
Table 66 - Major Attributes of Passenger Surveys - Dominica
Number Percent
Total Respondents 1,815
Number Making First Visit 1,343 74.0%
Number Ashore 1,756 96.7%
Number Making Onshore Purchases: 994 56.6%
Average Hours Ashore 3.8
Average Size of Expenditure Party (Persons) 2.1
Average Onshore Expenditure per Party $52.40
Purchased a Shore Excursion (Tour) 1,116 63.6%
Purchased Onshore Tour from:
Cruise Line 826 74.0%
Onshore from Tour Operator 162 14.5%
Travel Agent 128 11.5%
Average Cost of Shore Excursion per Party $123
Toured On Own/Did not Tour 640
The responding cruise parties reported spending an average of $52.40 while ashore
(excludes shore excursions), an 11 percent increase from the 2009 study.
Sixty-four percent (64%) of the passengers that went ashore purchased a shore
excursion. This is down slightly from 67% in the 2009 study. Seventy-four percent
(74%) of passengers who purchased a tour did so through their cruise line, 14%
purchased their tour onshore and 12 percent purchased their tour through their
travel agent.
The typical cruise party that purchased a shore excursion spent $123 for their tour.
This was a 15 percent increase from $107 during the 2008/2009 cruise year.
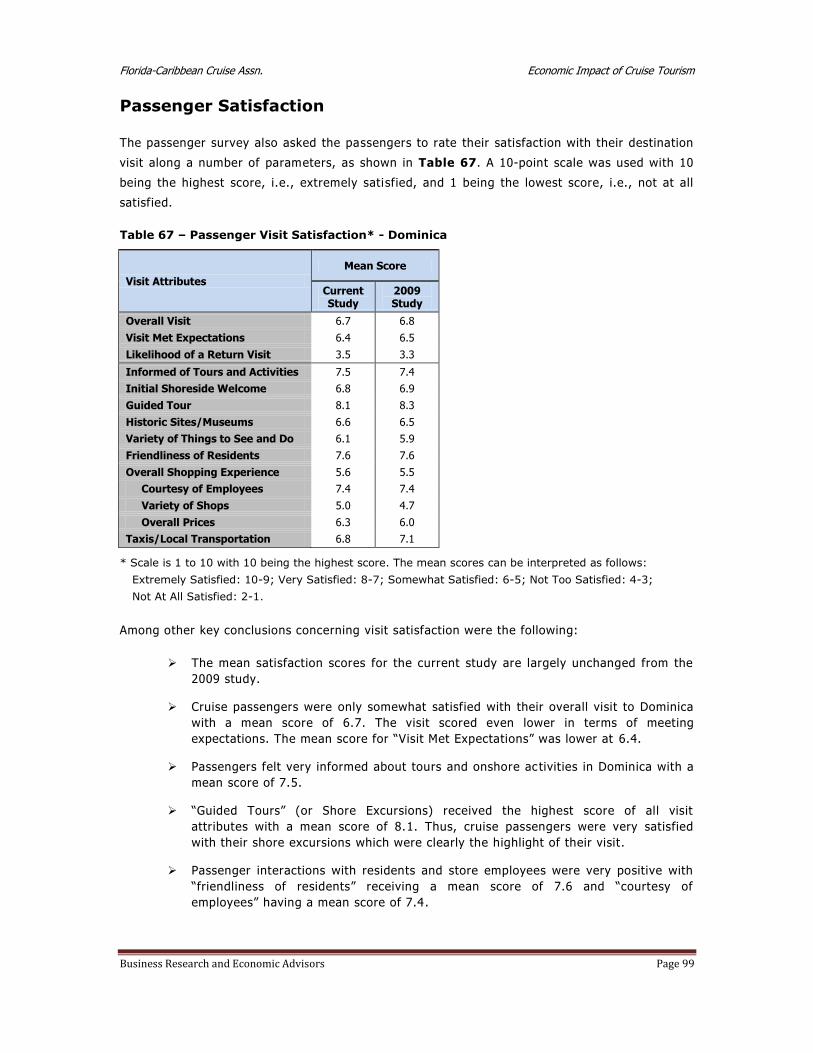
Florida-Caribbean Cruise Assn. Economic Impact of Cruise Tourism
Business Research and Economic Advisors Page 99
Passenger Satisfaction
The passenger survey also asked the passengers to rate their satisfaction with their destination
visit along a number of parameters, as shown in Table 67. A 10-point scale was used with 10
being the highest score, i.e., extremely satisfied, and 1 being the lowest score, i.e., not at all
satisfied.
Table 67 – Passenger Visit Satisfaction* - Dominica
Visit Attributes
Mean Score
Current Study
2009 Study
Overall Visit 6.7 6.8
Visit Met Expectations 6.4 6.5
Likelihood of a Return Visit 3.5 3.3
Informed of Tours and Activities 7.5 7.4
Initial Shoreside Welcome 6.8 6.9
Guided Tour 8.1 8.3
Historic Sites/Museums 6.6 6.5
Variety of Things to See and Do 6.1 5.9
Friendliness of Residents 7.6 7.6
Overall Shopping Experience 5.6 5.5
Courtesy of Employees 7.4 7.4
Variety of Shops 5.0 4.7
Overall Prices 6.3 6.0
Taxis/Local Transportation 6.8 7.1
* Scale is 1 to 10 with 10 being the highest score. The mean scores can be interpreted as follows:
Extremely Satisfied: 10-9; Very Satisfied: 8-7; Somewhat Satisfied: 6-5; Not Too Satisfied: 4-3;
Not At All Satisfied: 2-1.
Among other key conclusions concerning visit satisfaction were the following:
The mean satisfaction scores for the current study are largely unchanged from the
2009 study.
Cruise passengers were only somewhat satisfied with their overall visit to Dominica
with a mean score of 6.7. The visit scored even lower in terms of meeting
expectations. The mean score for “Visit Met Expectations” was lower at 6.4.
Passengers felt very informed about tours and onshore ac tivities in Dominica with a
mean score of 7.5.
“Guided Tours” (or Shore Excursions) received the highest score of all visit
attributes with a mean score of 8.1. Thus, cruise passengers were very satisfied
with their shore excursions which were clearly the highlight of their visit.
Passenger interactions with residents and store employees were very positive with
“friendliness of residents” receiving a mean score of 7.6 and “courtesy of
employees” having a mean score of 7.4 .

Florida-Caribbean Cruise Assn. Economic Impact of Cruise Tourism
Business Research and Economic Advisors Page 100
Categories with average scores between 5.0 and 7.0 (Somewhat Satisfied) were
given for initial shoreside welcome, historic sites, variety of things to see and do,
the overall shopping experience, including the variety of shops and ove rall prices,
and local transportation. Thus, while passengers thought shop employees were very
courteous, the overall score for their shopping experience was brought down by
lower perceptions on the variety of shops (5.0) and overall prices (6.3).
Cruise passengers stated that they were not too likely to return to Dominica for a
land-based vacation.
Passenger Demographics
Residents of the United States and the Canada accounted for 91 percent of the responding
passengers. The average age of the respondents was 58 years with 46 percent of the
respondents being 65 years of age or older. Dominica passengers had an average household
income of $114,900 with 46 percent having over $100,000 in household income.
Figure 43 – Passenger Age
Dominica
Under 153%
15 - 243%
25 - 4410%
45 - 6437%
Over 6447%
Figure 44 – Passenger Household Income
Dominica
Under $50,00012%
$50,000 to $75,000
23%
$75,000 to $100,000
18%
$100,000 to $150,000
22%
$150,000 to $200,000
13%
$200,000 or more12%

Florida-Caribbean Cruise Assn. Economic Impact of Cruise Tourism
Business Research and Economic Advisors Page 101
Dominican Republic
At the core of the analysis of the economic contribution of cruise tourism were a set of
passenger and crew surveys that were conducted onboard ships of the FCCA member cruise
lines.52 The surveys were undertaken during the six-month period beginning in December 2011
and ending in May 2012. The survey schedule was designed so that surveys were conducted by
FCCA member cruise lines that called at each destination and that the distribution of passenger
and crew surveys would reflect the distribution of passenger and crew arrivals by cruise line at
each destination. On any given cruise itinerary, passenger and crew surveys were placed in all
passenger cabins and crew quarters following a single destination call. The surveys were
completed by the passengers and crew in the privacy of their quarters and returned to a
designated office on the cruise ship. Thus, passengers and crew were only surveyed once during
a cruise itinerary and for a single destination. On a subsequent itinerary, passengers were
surveyed following a call at a different dest ination.
The passenger and crew surveys were designed to collect data for onshore spending and visit
satisfaction by both passengers and crew. While the crew survey was slightly shorter than the
passenger survey, both surveys were designed to collect the following information:
hours spent ashore;
expenditures by category, including shore tours, food & beverages, clothing, etc.;
visit satisfaction, including shore tour, fr iendliness of residents, prices, shopping,
etc.;
likelihood of returning for a land-based vacation; and
demographic characteristics, including country of residence, age group, income, etc.
Combining the expenditure data collected from the passenger and crew surveys with data on
expenditures by cruise lines for port fees and services, payments to local tour operators for
passenger shore excursions purchased onboard the cruise ships, and other provisions purchased
locally by the cruise lines, estimates of total cruise tourism expenditures were developed for
each participating destination.
Given the direct spending estimates, the economic contribution of these expenditures, as
measured by employment and wage income were then estimated for each de stination. This
process began with the collection of economic data for each destination from a combination of
local, regional and international sources. Utilizing all of these data a set of economic impact
models were developed for each destination to estimate the direct and total employment and
wage impacts. A more detailed description of these models is provided in the Data and
Methods section of Volume I.
52 Surveys were conducted on the ships of the following cruise lines: Carnival Cruise Lines, Celebrity Cruises, Disney Cruise Line, Holland America Line, Norwegian Cruise Line, Princess Cruises, P&O Cruises and Royal Caribbean International.
Florida-Caribbean Cruise Assn. Economic Impact of Cruise Tourism
Business Research and Economic Advisors Page 102
Cruise Tourism Expenditures
Cruise tourism expenditures in destination ports are composed of a broad range of spending
including:
onshore expenditures by passengers which tend to be concentrated in shore excursions
and retail purchases of clothing, jewelry and local crafts and souvenirs;
onshore expenditures by crew which are generally concentrated in purchases of food
and beverages, local transportation and retail purchases of clothing and electronics ;
expenditures by cruise lines for port services, such as dockage fees and linesmen,
utilities, such as water and power and navigation services; and
purchases of supplies, such as food and other stores, by the cruise lines from local
businesses.
According to data provided by the cruise ports in the Dominican Republic , a total of 269,997
cruise passengers arrived in the Dominican Republic during the 2011/2012 cruise year.53 These
included 213,225 transit passengers and 56,772 passengers embarking on their cruises in the
Dominican Republic. Of the transit passengers, an estimated 181,241 passengers (85 percent)
disembarked and visited the Dominican Republic. Utilizing additional data provided by the ports
and visiting cruise lines, we have estimated that 101,794 crew were aboard the cruise ships that
sailed to and from the Dominican Republic and that 25 percent, or 25,449 crew, disembarked
and visited the island. These passenger and crew visits along with additional expenditures by
the cruise lines generated a total of $21.4 million ($US) in cruise tourism expenditures in the
Dominican Republic during the 2011/2012 cruise year. The contribution of expenditures by
passengers, crew and cruise lines to this total is discussed below.
Passenger expenditures were estimated separately for transit and homeport passengers. Per
passenger spending estimates for transit passengers were derived from the nearly 400 surveys
completed by passengers that went ashore during the survey period. As shown in Table 68,
each passenger cruise party spent an average of $103.56 in the Dominican Republic. The
average spend per cruise party is the sum of the weighted spending in each of the ten
categories.54 For example, 30 percent of the survey respondents reported spending an average
of $16.50 at local restaurants and/or bars. Spread over the cruise parties that visited the
Dominican Republic, this represents an average of $4.93 per party. On a per passenger basis,
the average total expenditure was $49.31. This represents the sum of per party expenditures,
$103.56, divided by the average size of a cruise party in the Dominican Republic, 2.1
passengers. For the entire 2011/2012 cruise year, the estimated 181,241 transit cruise
passengers who visited the Dominican Republic spent a total of $8.9 million ($US) in the
country.
53 The 2011/2012 cruise year includes the twelve months beginning in May, 2011 and ending in April, 2012. 54 No purchases of entertainment or electronics were reported by passengers while in the Dominican
Republic.
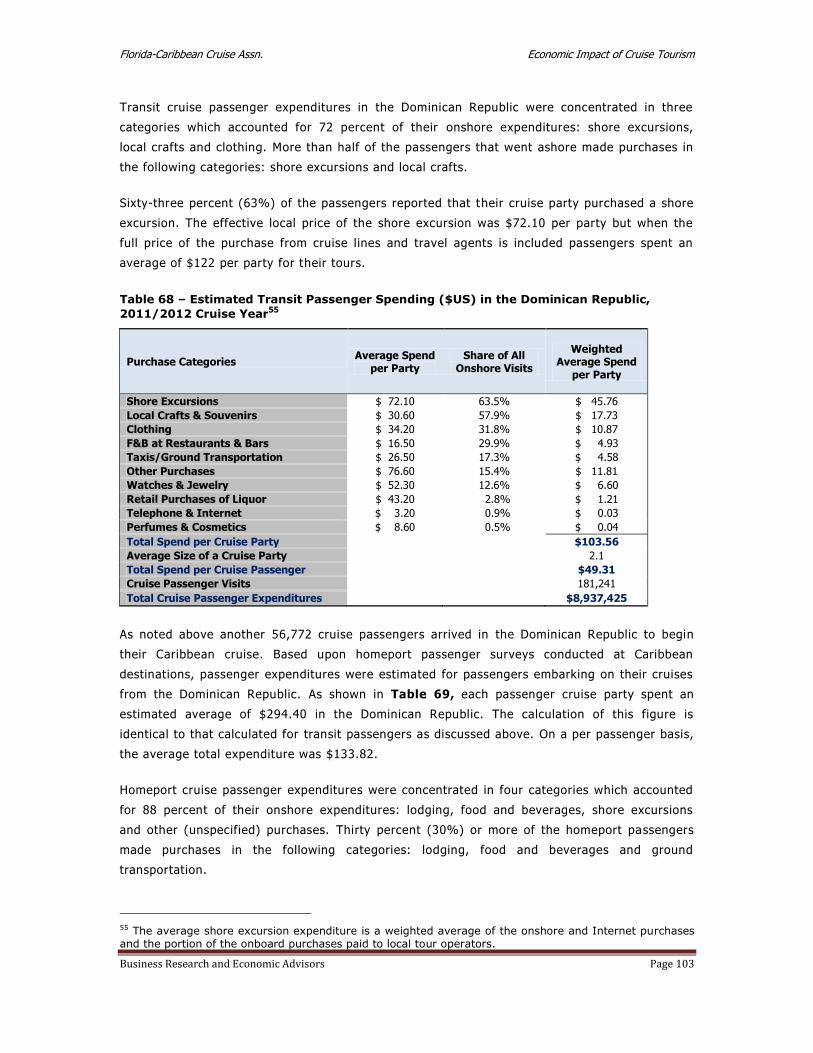
Florida-Caribbean Cruise Assn. Economic Impact of Cruise Tourism
Business Research and Economic Advisors Page 103
Transit cruise passenger expenditures in the Dominican Republic were concentrated in three
categories which accounted for 72 percent of their onshore expenditures: shore excursions,
local crafts and clothing. More than half of the passengers that went ashore made purchases in
the following categories: shore excursions and local crafts.
Sixty-three percent (63%) of the passengers reported that their cruise party purchased a shore
excursion. The effective local price of the shore excursion was $72.10 per party but when the
full price of the purchase from cruise lines and travel agents is included passengers spent an
average of $122 per party for their tours.
Table 68 – Estimated Transit Passenger Spending ($US) in the Dominican Republic,
2011/2012 Cruise Year55
Purchase Categories Average Spend
per Party Share of All
Onshore Visits
Weighted Average Spend
per Party
Shore Excursions $ 72.10 63.5% $ 45.76
Local Crafts & Souvenirs $ 30.60 57.9% $ 17.73
Clothing $ 34.20 31.8% $ 10.87
F&B at Restaurants & Bars $ 16.50 29.9% $ 4.93
Taxis/Ground Transportation $ 26.50 17.3% $ 4.58
Other Purchases $ 76.60 15.4% $ 11.81
Watches & Jewelry $ 52.30 12.6% $ 6.60
Retail Purchases of Liquor $ 43.20 2.8% $ 1.21
Telephone & Internet $ 3.20 0.9% $ 0.03
Perfumes & Cosmetics $ 8.60 0.5% $ 0.04
Total Spend per Cruise Party $103.56
Average Size of a Cruise Party 2.1
Total Spend per Cruise Passenger $49.31
Cruise Passenger Visits 181,241
Total Cruise Passenger Expenditures $8,937,425
As noted above another 56,772 cruise passengers arrived in the Dominican Republic to begin
their Caribbean cruise. Based upon homeport passenger surveys conducted at Caribbean
destinations, passenger expenditures were estimated for passengers embarking on their cruises
from the Dominican Republic. As shown in Table 69, each passenger cruise party spent an
estimated average of $294.40 in the Dominican Republic. The calculation of this figure is
identical to that calculated for transit passengers as discussed above. On a per passenger basis,
the average total expenditure was $133.82.
Homeport cruise passenger expenditures were concentrated in four categories which accounted
for 88 percent of their onshore expenditures: lodging, food and beverages, shore excursions
and other (unspecified) purchases. Thirty percent (30%) or more of the homeport passengers
made purchases in the following categories: lodging, food and beverages and ground
transportation.
55 The average shore excursion expenditure is a weighted average of the onshore and Internet purchases and the portion of the onboard purchases paid to local tour operators.

Florida-Caribbean Cruise Assn. Economic Impact of Cruise Tourism
Business Research and Economic Advisors Page 104
For the entire 2011/2012 cruise year, the estimated 56,772 homeport cruise passengers who
visited the Dominican Republic spent a total of $7.6 million ($US) on the island.
Table 69 – Estimated Homeport Passenger Spending ($US) in the Dominican Republic,
2011/2012 Cruise Year56
Purchase Categories Average Spend
per Party Share of All
Onshore Visits
Weighted Average Spend
per Party
Lodging $ 310.00 40.0% $ 123.87
F&B at Restaurants & Bars $ 103.60 33.7% $ 34.96
Taxis/Ground Transportation $ 51.30 28.2% $ 14.44
Shore Excursions $ 115.90 22.4% $ 25.92
Retail Purchases of Liquor $ 41.80 12.2% $ 5.11
Clothing $ 73.70 10.6% $ 7.78
Other Purchases $ 731.20 10.1% $ 74.18
Local Crafts & Souvenirs $ 32.00 8.1% $ 2.58
Watches & Jewelry $ 94.70 2.7% $ 2.55
Entertainment/Night Clubs/Casinos $ 56.80 2.7% $ 1.53
Perfumes & Cosmetics $ 40.00 2.3% $ 0.91
Telephone & Internet $ 14.50 0.6% $ 0.09
Electronics $ 231.80 0.2% $ 0.48
Total Spend per Cruise Party $294.40
Average Size of a Cruise Party 2.2
Total Spend per Cruise Passenger $133.82
Cruise Passenger Visits 56,772
Total Cruise Passenger Expenditures $7,597,126
Per crew spending estimates were derived from surveys completed by crew members during the
survey period. As shown in Table 70, each crew member spent an average of $40.00 in the
Dominican Republic. The average spend per crew member is the sum of the weighted spending
in each of the ten categories.57 For example, just over 50 percent of the survey respondents
reported spending an average of $38.60 for food and beverages. Spread over all crew members
that reported visiting the Dominican Republic, this represents an average of $19.50 per crew
member.
Expenditures by crew in the Dominican Republic were concentrated in two categories which
accounted for nearly 60 percent of their onshore expenditures: food and beverages and ground
transportations. Combined, crew spent an average of $23.55 for goods in these two categories.
Purchases of food and beverages were the most popular expenditure item with 51% percent of
the crew reporting the purchase of food and beverages.
For the entire 2011/2012 cruise year, the estimated 25,449 crew who visited the Dominican
Republic spent an estimated total of $1.0 million ($US).
56 The average shore excursion expenditure is a weighted average of the onshore and Internet purchases and the portion of the onboard purchases paid to local tour operators. 57 No purchases of electronics or entertainment in the Dominican Republic were reported by the
crew.
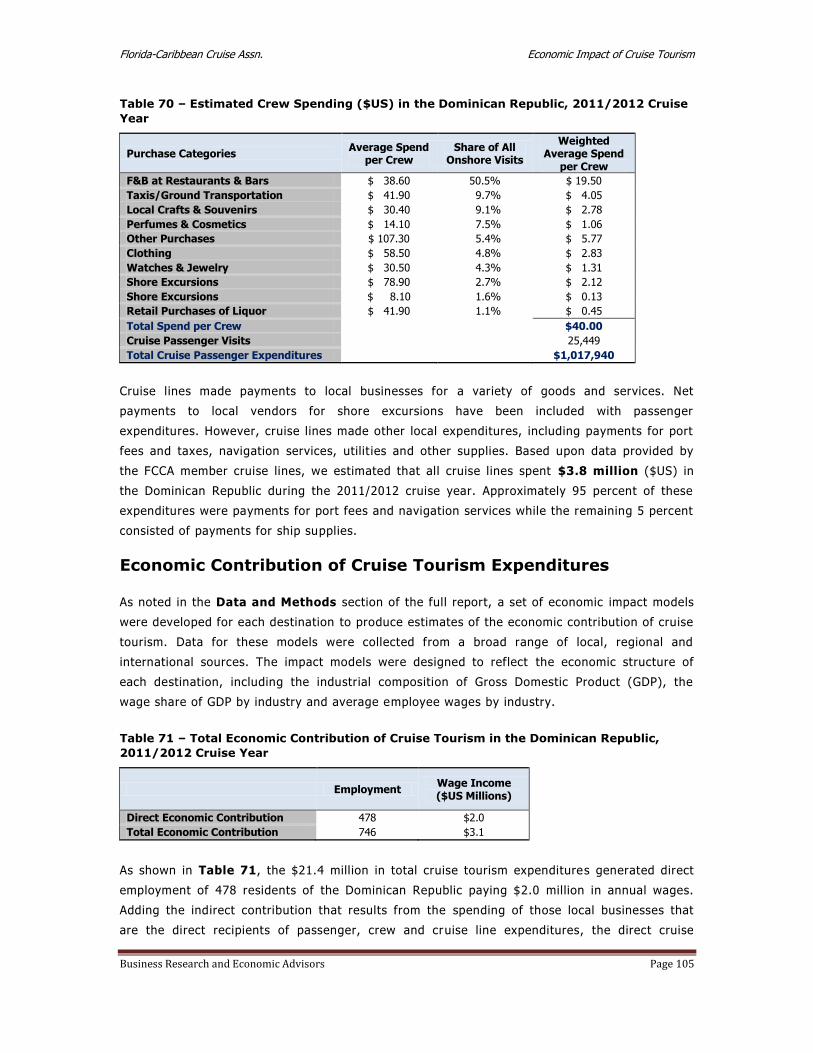
Florida-Caribbean Cruise Assn. Economic Impact of Cruise Tourism
Business Research and Economic Advisors Page 105
Table 70 – Estimated Crew Spending ($US) in the Dominican Republic, 2011/2012 Cruise
Year
Purchase Categories Average Spend
per Crew Share of All
Onshore Visits
Weighted Average Spend
per Crew
F&B at Restaurants & Bars $ 38.60 50.5% $ 19.50
Taxis/Ground Transportation $ 41.90 9.7% $ 4.05
Local Crafts & Souvenirs $ 30.40 9.1% $ 2.78
Perfumes & Cosmetics $ 14.10 7.5% $ 1.06
Other Purchases $ 107.30 5.4% $ 5.77
Clothing $ 58.50 4.8% $ 2.83
Watches & Jewelry $ 30.50 4.3% $ 1.31
Shore Excursions $ 78.90 2.7% $ 2.12
Shore Excursions $ 8.10 1.6% $ 0.13
Retail Purchases of Liquor $ 41.90 1.1% $ 0.45
Total Spend per Crew $40.00
Cruise Passenger Visits 25,449
Total Cruise Passenger Expenditures $1,017,940
Cruise lines made payments to local businesses for a variety of goods and services. Net
payments to local vendors for shore excursions have been included with passenger
expenditures. However, cruise lines made other local expenditures, including payments for port
fees and taxes, navigation services, utilit ies and other supplies. Based upon data provided by
the FCCA member cruise lines, we estimated that all cruise lines spent $3.8 million ($US) in
the Dominican Republic during the 2011/2012 cruise year. Approximately 95 percent of these
expenditures were payments for port fees and navigation services while the remaining 5 percent
consisted of payments for ship supplies.
Economic Contribution of Cruise Tourism Expenditures
As noted in the Data and Methods section of the full report, a set of economic impact models
were developed for each destination to produce estimates of the economic contribution of cruise
tourism. Data for these models were collected from a broad range of local, regional and
international sources. The impact models were designed to reflect the economic structure of
each destination, including the industrial composition of Gross Domestic Product (GDP), the
wage share of GDP by industry and average employee wages by industry.
Table 71 – Total Economic Contribution of Cruise Tourism in the Dominican Republic,
2011/2012 Cruise Year
Employment Wage Income ($US Millions)
Direct Economic Contribution 478 $2.0
Total Economic Contribution 746 $3.1
As shown in Table 71, the $21.4 million in total cruise tourism expenditures generated direct
employment of 478 residents of the Dominican Republic paying $2.0 million in annual wages.
Adding the indirect contribution that results from the spending of those local businesses that
are the direct recipients of passenger, crew and cruise line expenditures, the direct cruise

Florida-Caribbean Cruise Assn. Economic Impact of Cruise Tourism
Business Research and Economic Advisors Page 106
tourism expenditures generated a total employment contribution of 746 jobs and $3.1 million in
wage income in the Dominican Republic during the 2011/2012 cruise year.
Figure 45 – Total Employment Impacts by
Sector - Dominican Republic
Manuf. &
Construction2%
Commercial
Services58%
Transport &
Utilities34%
Business &
Financial Services
2% Community
Services & Government
4%
Figure 46 – Total Wage Impacts by Sector
Dominican Republic
Manuf. &
Construction1%
Commercial
Services43%
Transport &
Utilities49%
Business &
Financial Services
3%
Community
Services & Government
4%
As shown in Figures 45 and 46, the total employment and wage impacts of cruise tourism are
concentrated in the commercial and transport sectors which account for more than 90 percent
of the employment and wage impacts.58 This is not surprising since the direct impacts account
for 65 percent of the total employment impacts and that virtually all of the cruise tourism
expenditures are made with businesses in these sectors. Because of the relatively higher wages
in the transport sector compared to the other sectors of the economy, the transport sector
accounts for 49 percent of the wage impacts but only 34 percent of the employment impacts.
The remainder of the total employment and wage impacts was generated by the indirect
spending in the other sectors of the economy.
Comparison to 2009 Study
Total passenger and crew visits declined by 44 percent from 470,800 visits during the 2008/2009 cruise
year to 263,400 during the 2011/2012 cruise year. Total direct cruise tourism expenditures declined by a
much smaller 9 percent over the three year period, declining from $23.5 million to $21.4 million. As
indicated in Table 72, spending by the cruise lines increased while passenger and crew expenditures
declined from the 2008/2009 cruise year..
The 8 percent decrease in passenger expenditures was the result of the 42 percent decrease in passenger
visits and the more than doubling in average passenger expenditures. The increase in average spending by
passengers was driven by increased spending by transit passengers for shore excursions, jewelry and local
crafts. A higher percentage of passengers purchased these goods in the 2011/2012 cruise year and they
spent more on these goods and services. Similarly homeport passengers spent more for lodging and food
and beverages which was enhanced by a greater percentage making such purchases.
58 The industry sectors include the following activities:
Manufacturing & Construction: residential and nonresidential construction and all manufacturing Commercial Services: wholesale and retail trade, lodging and eating and drinking establishments Transportation & Utilities: tour operators, port services, telecommunications and water and power utilities Business & Financial Services: banking, insurance, legal, accounting, leasing and other business services Community Services & Government: education, health and social services and government agencies

Florida-Caribbean Cruise Assn. Economic Impact of Cruise Tourism
Business Research and Economic Advisors Page 107
Table 72 – Comparison of Cruise Tourism Impacts, Current Study versus 2009 Study -
Dominican Republic
Current
Study 2009
Study Percent Change
Total Onshore Visits (Thousands) 263.4 470.8 -44.1%
Passengers 238.0 411.4 -42.1%
Crew 25.4 59.4 -57.2%
Total Direct Expenditures ($US Millions) $ 21.4 $ 23.5 -8.9%
Passengers $ 16.5 $ 17.9 -7.8%
Crew $ 1.0 $ 2.8 -64.3%
Cruise Lines $ 3.8 $ 2.8 +35.7%
Average Per Passenger Expenditure $98.79 $43.42 +127% Average Per Crew Expenditure $40.00 $47.59 -15.9%
Total Employment Impact 746 788 -5.3%
Total Wage Impact ($US Millions) $ 3.0 $ 3.1 -3.2%
Includes both transit and homeport passengers.
In the case of crew expenditures, the 64 percent decline in crew expenditure was the result of both a
decline in visits and average crew expenditures. The decline in average crew expenditures was primarily the
result a decline in the percentage of crew making onshore purchases. For example, during the 2008/2009
cruise year 14 percent of the crew reported spending an average of $35.60 for clothing. In the 2011/2012,
only 5 percent of the crew reported spending an average of $58.50 for clothing. As a result the weighted
average expenditure for clothing fell from $5.03 in the 2008/2009 cruise year to $2.83 in the 2011/2012
cruise year.
As a result of the 9 percent decrease in direct cruise tourism expenditures from the 2008/2009 cruise year,
the economic impacts declined as well. The total employment and wage impacts increased by 5 percent and
3 percent, respectively, over the three-year period. The slightly smaller decline in wages is due to increased
labor productivity and average wages over the intervening period.
Passenger Surveys
A total of 368 transit passenger surveys were completed and returned for tabulation. Table 73
shows the major attributes of passenger visits in the Dominican Republic as derived from the
passenger surveys.
Of the 368 cruise parties that completed the surveys 78% stated that this had been
their first visit to the Dominican Republic. This is essentially unchanged from the
2009 study.
Ninety-six percent (96%) of the cruise parties that completed the surveys
disembarked their cruise ship to visit the Dominican Republic.
Of the cruise parties that went ashore, 61% made at least one purchase while
ashore. This is a decline from 71% during the 2008/2009 cruise year. The typical
cruise party consisted of 2.1 passengers that spent an average of 3.8 hours ashore.
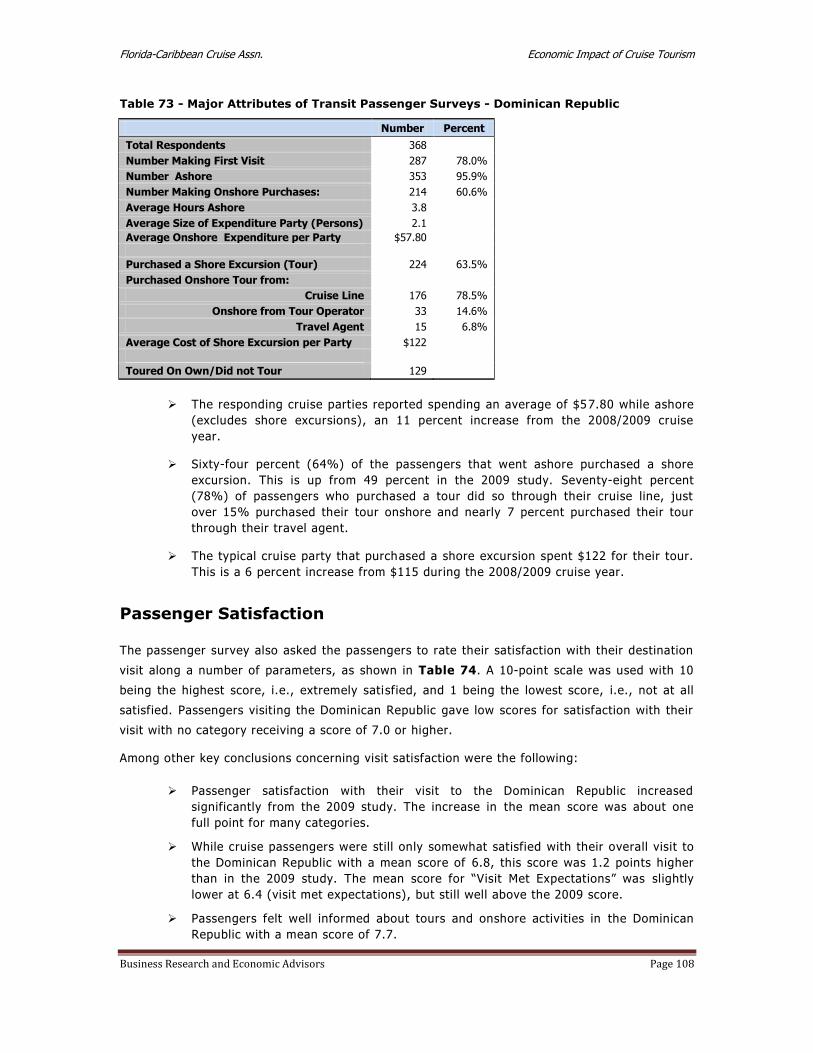
Florida-Caribbean Cruise Assn. Economic Impact of Cruise Tourism
Business Research and Economic Advisors Page 108
Table 73 - Major Attributes of Transit Passenger Surveys - Dominican Republic
Number Percent
Total Respondents 368
Number Making First Visit 287 78.0%
Number Ashore 353 95.9%
Number Making Onshore Purchases: 214 60.6%
Average Hours Ashore 3.8
Average Size of Expenditure Party (Persons) 2.1
Average Onshore Expenditure per Party $57.80
Purchased a Shore Excursion (Tour) 224 63.5%
Purchased Onshore Tour from:
Cruise Line 176 78.5%
Onshore from Tour Operator 33 14.6%
Travel Agent 15 6.8%
Average Cost of Shore Excursion per Party $122
Toured On Own/Did not Tour 129
The responding cruise parties reported spending an average of $57.80 while ashore
(excludes shore excursions), an 11 percent increase from the 2008/2009 cruise
year.
Sixty-four percent (64%) of the passengers that went ashore purchased a shore
excursion. This is up from 49 percent in the 2009 study. Seventy-eight percent
(78%) of passengers who purchased a tour did so through their cruise line, just
over 15% purchased their tour onshore and nearly 7 percent purchased their tour
through their travel agent.
The typical cruise party that purchased a shore excursion spent $122 for their tour.
This is a 6 percent increase from $115 during the 2008/2009 cruise year.
Passenger Satisfaction
The passenger survey also asked the passengers to rate their satisfaction with their destination
visit along a number of parameters, as shown in Table 74. A 10-point scale was used with 10
being the highest score, i.e., extremely satisfied, and 1 being the lowest score, i.e., not at all
satisfied. Passengers visiting the Dominican Republic gave low scores for satisfaction with their
visit with no category receiving a score of 7.0 or higher.
Among other key conclusions concerning visit satisfaction were the following:
Passenger satisfaction with their visit to the Dominican Republic increased
significantly from the 2009 study. The increase in the mean score was about one
full point for many categories.
While cruise passengers were still only somewhat satisfied with their overall visit to
the Dominican Republic with a mean score of 6.8, this score was 1.2 points higher
than in the 2009 study. The mean score for “Visit Met Expectations” was slightly
lower at 6.4 (visit met expectations), but still well above the 2009 score.
Passengers felt well informed about tours and onshore activities in the Dominican
Republic with a mean score of 7.7.
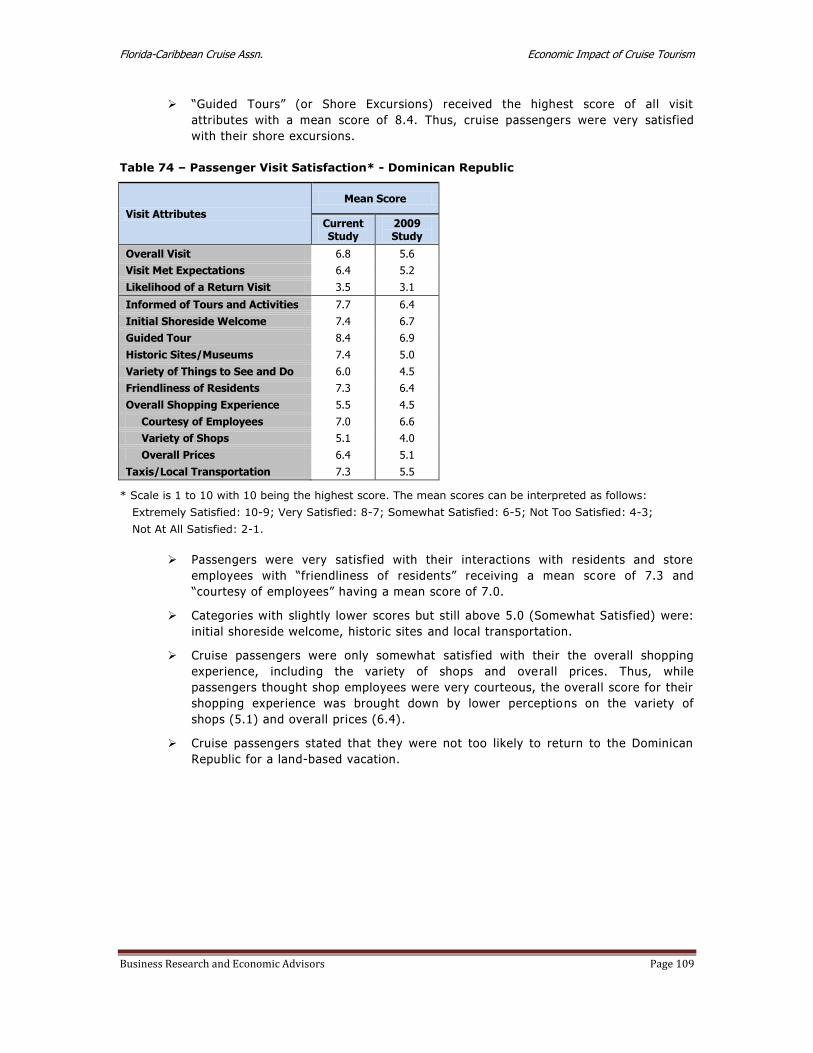
Florida-Caribbean Cruise Assn. Economic Impact of Cruise Tourism
Business Research and Economic Advisors Page 109
“Guided Tours” (or Shore Excursions) received the highest score of all visit
attributes with a mean score of 8.4. Thus, cruise passengers were very satisfied
with their shore excursions.
Table 74 – Passenger Visit Satisfaction* - Dominican Republic
Visit Attributes
Mean Score
Current Study
2009 Study
Overall Visit 6.8 5.6
Visit Met Expectations 6.4 5.2
Likelihood of a Return Visit 3.5 3.1
Informed of Tours and Activities 7.7 6.4
Initial Shoreside Welcome 7.4 6.7
Guided Tour 8.4 6.9
Historic Sites/Museums 7.4 5.0
Variety of Things to See and Do 6.0 4.5
Friendliness of Residents 7.3 6.4
Overall Shopping Experience 5.5 4.5
Courtesy of Employees 7.0 6.6
Variety of Shops 5.1 4.0
Overall Prices 6.4 5.1
Taxis/Local Transportation 7.3 5.5
* Scale is 1 to 10 with 10 being the highest score. The mean scores can be interpreted as follows:
Extremely Satisfied: 10-9; Very Satisfied: 8-7; Somewhat Satisfied: 6-5; Not Too Satisfied: 4-3;
Not At All Satisfied: 2-1.
Passengers were very satisfied with their interactions with residents and store
employees with “friendliness of residents” receiving a mean score of 7.3 and
“courtesy of employees” having a mean score of 7.0.
Categories with slightly lower scores but still above 5.0 (Somewhat Satisfied) were:
initial shoreside welcome, historic sites and local transportation.
Cruise passengers were only somewhat satisfied with their the overall shopping
experience, including the variety of shops and overall prices. Thus, while
passengers thought shop employees were very courteous, the overall score for their
shopping experience was brought down by lower perceptions on the variety of
shops (5.1) and overall prices (6.4).
Cruise passengers stated that they were not too likely to return to the Dominican
Republic for a land-based vacation.
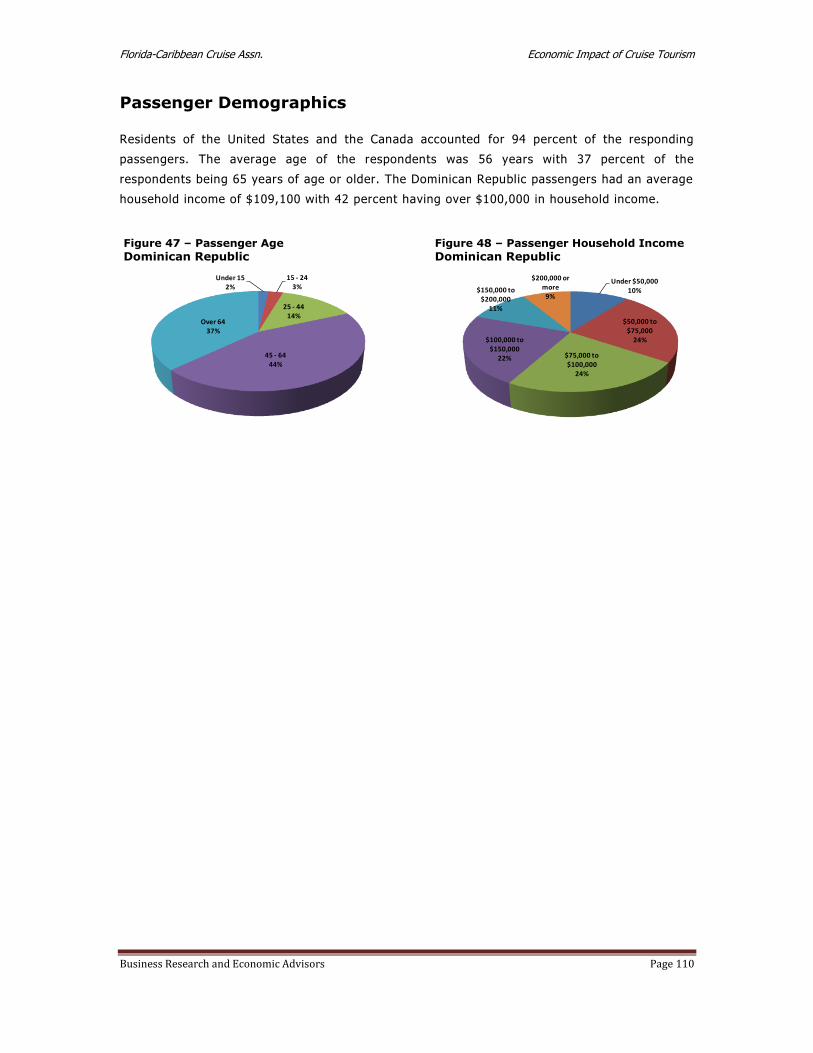
Florida-Caribbean Cruise Assn. Economic Impact of Cruise Tourism
Business Research and Economic Advisors Page 110
Passenger Demographics
Residents of the United States and the Canada accounted for 94 percent of the responding
passengers. The average age of the respondents was 56 years with 37 percent of the
respondents being 65 years of age or older. The Dominican Republic passengers had an average
household income of $109,100 with 42 percent having over $100,000 in household income.
Figure 47 – Passenger Age
Dominican Republic
Under 152%
15 - 243%
25 - 4414%
45 - 6444%
Over 6437%
Figure 48 – Passenger Household Income
Dominican Republic
Under $50,00010%
$50,000 to $75,000
24%
$75,000 to $100,000
24%
$100,000 to $150,000
22%
$150,000 to $200,000
11%
$200,000 or more
9%

Florida-Caribbean Cruise Assn. Economic Impact of Cruise Tourism
Business Research and Economic Advisors Page 111
Grenada
At the core of the analysis of the economic contribution of cruise tourism were a set of
passenger and crew surveys that were conducted onboard ships of the FCCA member cruise
lines.59 The surveys were undertaken during the six-month period beginning in December 2011
and ending in May 2012. The survey schedule was designed so that surveys were conducted by
FCCA member cruise lines that called at each destination and that the distribution of passenger
and crew surveys would reflect the distribution of passenger and crew arrivals by cruise line at
each destination. On any given cruise itinerary, passenger and crew surveys were placed in all
passenger cabins and crew quarters following a single destination call. The surveys were
completed by the passengers and crew in the privacy of their quarters and re turned to a
designated office on the cruise ship. Thus, passengers and crew were only surveyed once during
a cruise itinerary and for a single destination. On a subsequent itinerary, passengers were
surveyed following a call at a different dest ination.
The passenger and crew surveys were designed to collect data for onshore spending and visit
satisfaction by both passengers and crew. While the crew survey was slightly shorter than the
passenger survey, both surveys were designed to collect the following in formation:
hours spent ashore;
expenditures by category, including shore tours, food & beverages, clothing, etc.;
visit satisfaction, including shore tour, friendliness of residents, prices, shopping,
etc.;
likelihood of returning for a land-based vacation; and
demographic characteristics, including country of residence, age group, income, etc.
Combining the expenditure data collected from the passenger and crew surveys with data on
expenditures by cruise lines for port fees and services, payments to local tour operators for
passenger shore excursions purchased onboard the cruise ships, and other provisions purchased
locally by the cruise lines, estimates of total cruise tourism expenditures were developed for
each participating destination.
Given the direct spending estimates, the economic contribution of these expenditures, as
measured by employment and wage income were then estimated for each de stination. This
process began with the collection of economic data for each destination from a combination of
local, regional and international sources. Utilizing all of these data a set of economic impact
models were developed for each destination to estimate the direct and total employment and
wage impacts. A more detailed description of these models is provided in the Data and
Methods section of Volume I.
59 Surveys were conducted on the ships of the following cruise lines: Carnival Cruise Lines, Celebrity Cruises, Disney Cruise Line, Holland America Line, Norwegian Cruise Line, Princess Cruises, P&O Cruises and Royal Caribbean International.
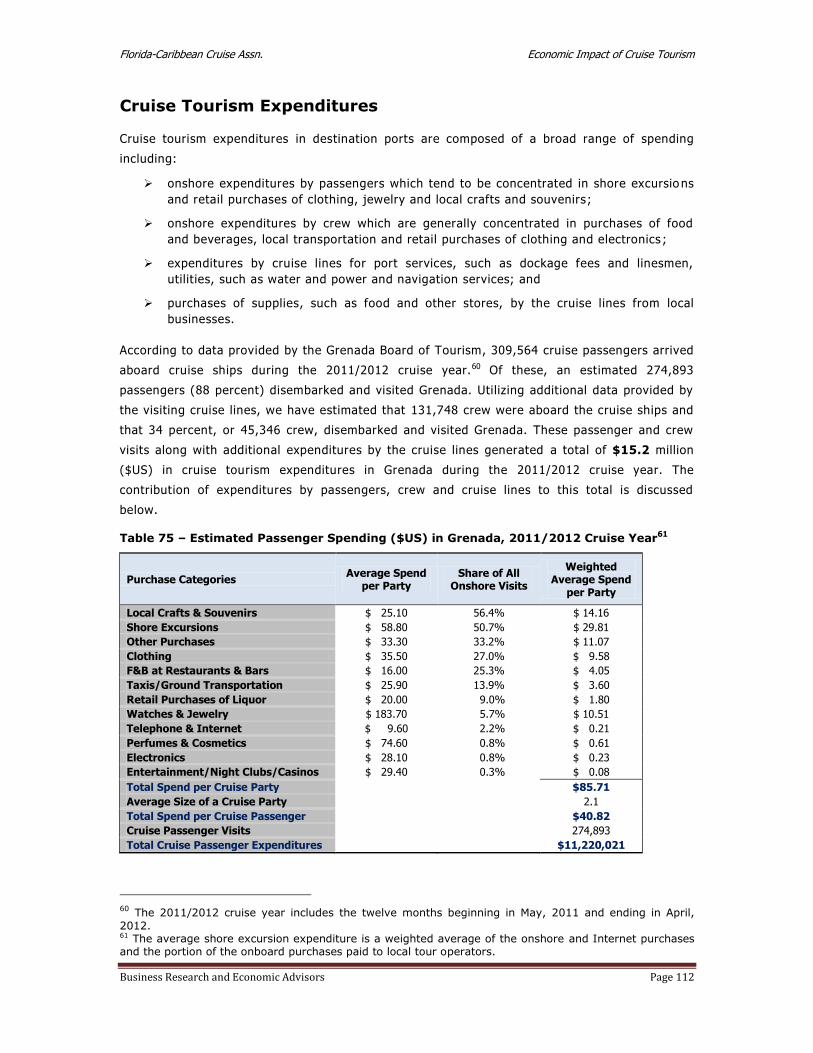
Florida-Caribbean Cruise Assn. Economic Impact of Cruise Tourism
Business Research and Economic Advisors Page 112
Cruise Tourism Expenditures
Cruise tourism expenditures in destination ports are composed of a broad range of spending
including:
onshore expenditures by passengers which tend to be concentrated in shore excursio ns
and retail purchases of clothing, jewelry and local crafts and souvenirs;
onshore expenditures by crew which are generally concentrated in purchases of food
and beverages, local transportation and retail purchases of clothing and electronics ;
expenditures by cruise lines for port services, such as dockage fees and linesmen,
utilities, such as water and power and navigation services; and
purchases of supplies, such as food and other stores, by the cruise lines from local
businesses.
According to data provided by the Grenada Board of Tourism, 309,564 cruise passengers arrived
aboard cruise ships during the 2011/2012 cruise year.60 Of these, an estimated 274,893
passengers (88 percent) disembarked and visited Grenada. Utilizing additional data provided by
the visiting cruise lines, we have estimated that 131,748 crew were aboard the cruise ships and
that 34 percent, or 45,346 crew, disembarked and visited Grenada. These passenger and crew
visits along with additional expenditures by the cruise lines generated a total of $15.2 million
($US) in cruise tourism expenditures in Grenada during the 2011/2012 cruise year. The
contribution of expenditures by passengers, crew and cruise lines to this total is discussed
below.
Table 75 – Estimated Passenger Spending ($US) in Grenada, 2011/2012 Cruise Year61
Purchase Categories Average Spend
per Party Share of All
Onshore Visits
Weighted Average Spend
per Party
Local Crafts & Souvenirs $ 25.10 56.4% $ 14.16
Shore Excursions $ 58.80 50.7% $ 29.81
Other Purchases $ 33.30 33.2% $ 11.07
Clothing $ 35.50 27.0% $ 9.58
F&B at Restaurants & Bars $ 16.00 25.3% $ 4.05
Taxis/Ground Transportation $ 25.90 13.9% $ 3.60
Retail Purchases of Liquor $ 20.00 9.0% $ 1.80
Watches & Jewelry $ 183.70 5.7% $ 10.51
Telephone & Internet $ 9.60 2.2% $ 0.21
Perfumes & Cosmetics $ 74.60 0.8% $ 0.61
Electronics $ 28.10 0.8% $ 0.23
Entertainment/Night Clubs/Casinos $ 29.40 0.3% $ 0.08
Total Spend per Cruise Party $85.71
Average Size of a Cruise Party 2.1
Total Spend per Cruise Passenger $40.82
Cruise Passenger Visits 274,893
Total Cruise Passenger Expenditures $11,220,021
60 The 2011/2012 cruise year includes the twelve months beginning in May, 2011 and ending in April,
2012. 61 The average shore excursion expenditure is a weighted average of the onshore and Internet purchases and the portion of the onboard purchases paid to local tour operators.

Florida-Caribbean Cruise Assn. Economic Impact of Cruise Tourism
Business Research and Economic Advisors Page 113
Per passenger spending estimates were derived from the more than 500 surveys completed by
passengers that went ashore during the survey period. As shown in Table 75, each passenger
cruise party spent an average of $85.71 in Grenada. The average spend per cruise party is the
sum of the weighted spending in each of the twelve categories. For example, 25 percent of the
survey respondents reported spending an average of $16.00 for food and beverages. Spread
over the cruise parties that visited Grenada, this represents an average of $4.05 per party. On a
per passenger basis, the average total expenditure was $40.82. This represents the sum of per
party expenditures, $85.71, divided by the average size of a cruise party in Grenada, 2.1
passengers.
Cruise passenger expenditures in Grenada were concentrated in three categories which
accounted for nearly 65 percent of their onshore expenditures: shore excursions, local crafts
and watches and jewelry. Over 50 percent of the passengers that went ashore made purchases
of shore excursions and local crafts.
Fifty-one percent (51%) of the passengers reported that their cruise party purchased a shore
excursion. The effective local price of the shore excursion was $58.80 per party but when the
full price of the purchase from cruise lines and travel agents is included passengers spent an
average of $94.20 per party for their tours.
For the entire 2011/2012 cruise year, the estimated 274,893 cruise passengers who visited
Grenada spent a total of $11.2 million ($US) in Grenada.
Table 76 – Estimated Crew Spending ($US) in Grenada, 2011/2012 Cruise Year
Purchase Categories Average Spend
per Crew Share of All
Onshore Visits
Weighted Average Spend
per Crew
F&B at Restaurants & Bars $ 23.10 57.7% $ 13.33
Other Purchases $ 36.50 15.4% $ 5.61
Taxis/Ground Transportation $ 31.20 15.4% $ 4.80
Local Crafts & Souvenirs $ 13.00 15.4% $ 2.00
Clothing $ 67.70 11.5% $ 7.81
Watches & Jewelry $ 125.10 7.7% $ 9.62
Shore Excursions $ 20.00 3.8% $ 0.77
Perfumes & Cosmetics $ 9.90 3.8% $ 0.38
Telephone & Internet $ 9.90 3.8% $ 0.38
Total Spend per Crew $44.70
Cruise Passenger Visits 45,346
Total Cruise Passenger Expenditures $2,026,964
Per crew spending estimates were derived from the surveys completed by crew members during
the survey period. As shown in Table 76, each crew member spent an average of $40.30 in
Grenada. The average spend per crew member is the sum of the weighted spending in each of
the nine categories.62 For example, 21 percent of the survey respondents reported spending an
62 There were no reported expenditures for liquor, electronics or entertainment by crew visiting Grenada.

Florida-Caribbean Cruise Assn. Economic Impact of Cruise Tourism
Business Research and Economic Advisors Page 114
average of $63.60 for food and beverages. Spread over all the crew members that visited
Grenada, this represents an average of $13.33 per crew member.
Expenditures by crew in Grenada were concentrated in three categories which accounted for
nearly 70 percent of their onshore expenditures: food and beverages, watches and jewelry and
clothing. Combined, crew spent an average of $30.76 for goods in these three categories.
Purchases of food and beverages were the most popular expenditure item with 58% percent of
the crew reporting the purchase of food and beverages.
For the entire 2011/2012 cruise year, the estimated 45,346 crew who visited Grenada spent an
estimated total of $2.0 million ($US).
Cruise lines made payments to local businesses for a variety of goods and services. Net
payments to local vendors for shore excursions have been included with passenger
expenditures. However, cruise lines made other local expenditures, including payments for port
fees and taxes, navigation services, utilities and other supplies. Based upon data provided by
the FCCA member cruise lines, we estimated that all cruise lines spent $1.9 million ($US) in
Grenada during the 2011/2012 cruise year. All of these expenditures were payments for port
fees and taxes and navigation services.
Economic Contribution of Cruise Tourism Expenditures
As noted in the Data and Methods section of the full report, a set of economic impact models
were developed for each destination to produce estimates of the economic contribution of cruise
tourism. Data for these models were collected from a broad range of local, regional and
international sources. The impact models were designed to reflect the economic structure of
each destination, including the industrial composition of Gross Domestic Product (GDP), the
wage share of GDP by industry and average employee wages by industry.
Table 77 – Total Economic Contribution of Cruise Tourism in Grenada, 2011/2012 Cruise Year
Employment Wage Income ($US Millions)
Direct Economic Contribution 270 $1.9
Total Economic Contribution 434 $2.9
As shown in Table 77, the $15.2 million in total cruise tourism expenditures in Grenada
generated direct employment of 270 residents of Grenada paying $1.9 million in annual wages.
Adding the indirect contribution that results from the spending of those local businesses that
are the direct recipients of passenger, crew and cruise line expenditures, the direct cruise
tourism expenditures generated a total employment contribution of 434 jobs and $2.9 million in
wage income in Grenada during the 2011/2012 cruise year.
As shown in Figures 49 and 50, the total employment and wage impacts of cruise tourism are
concentrated in the commercial and transport sectors which account for about 98 percent of the
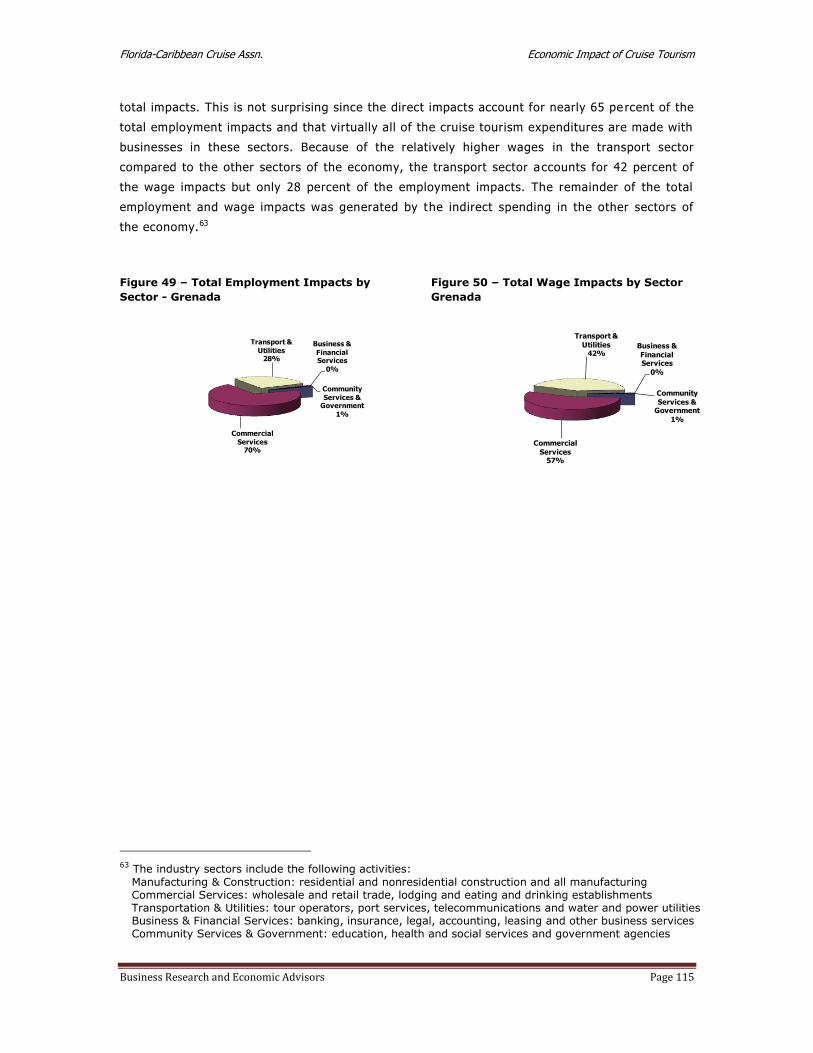
Florida-Caribbean Cruise Assn. Economic Impact of Cruise Tourism
Business Research and Economic Advisors Page 115
total impacts. This is not surprising since the direct impacts account for nearly 65 pe rcent of the
total employment impacts and that virtually all of the cruise tourism expenditures are made with
businesses in these sectors. Because of the relatively higher wages in the transport sector
compared to the other sectors of the economy, the transport sector accounts for 42 percent of
the wage impacts but only 28 percent of the employment impacts. The remainder of the total
employment and wage impacts was generated by the indirect spending in the other sectors of
the economy.63
63 The industry sectors include the following activities:
Manufacturing & Construction: residential and nonresidential construction and all manufacturing Commercial Services: wholesale and retail trade, lodging and eating and drinking establishments Transportation & Utilities: tour operators, port services, telecommunications and water and power utilities Business & Financial Services: banking, insurance, legal, accounting, leasing and other business services Community Services & Government: education, health and social services and government agencies
Figure 49 – Total Employment Impacts by
Sector - Grenada
Commercial
Services70%
Transport &
Utilities28%
Business &
Financial Services
0%
Community
Services & Government
1%
Figure 50 – Total Wage Impacts by Sector
Grenada
Commercial
Services57%
Transport &
Utilities42%
Business &
Financial Services
0%
Community
Services & Government
1%

Florida-Caribbean Cruise Assn. Economic Impact of Cruise Tourism
Business Research and Economic Advisors Page 116
Comparison to 2009 Study
Total passenger and crew visits remained virtually unchanged from the 2008/2009 cruise year at 320,200
during the 2011/2012 cruise year. However, total direct cruise tourism expenditures declined by 30 percent
over the three year period, falling from $21.7 million to $15.2 million. As indicated in Table 78,
expenditures by cruise lines and passengers declined while crew spending increased. In fact, the 70 percent
drop in cruise line expenditures accounted for 70 percent of the drop in total cruise tourism expenditures.
Table 78 – Comparison of Cruise Tourism Impacts, Current Study versus 2009 Study - Grenada
Current
Study 2009
Study Percent Change
Total Onshore Visits (Thousands) 320.2 319.0 +0.4%
Passengers 274.9 272.7 +0.8%
Crew 45.3 46.3 -2.2%
Total Direct Expenditures ($US Millions) $ 15.2 $ 21.7 -30.0%
Passengers $ 11.2 $ 13.4 -16.4%
Crew $ 2.0 $ 1.9 +5.3%
Cruise Lines $ 1.9 $ 6.4 -70.3%
Average Per Passenger Expenditure $40.82 $49.01 -16.7% Average Per Crew Expenditure $44.70 $40.30 +10.9%
Total Employment Impact 434 581 -25.3%
Total Wage Impact ($US Millions) $ 2.9 $ 3.9 -25.6%
The 16 percent decrease in passenger expenditures was the net result of a the nearly one percent increase
in passenger visits which was more than offset by the 17 percent decline in average passenger
expenditures. The decline in average passenger expenditures was primarily due to a smaller percentage of
passengers making onshore purchases. For example, during the 2008/2009 cruise year 56 percent of
passengers reported spending an average of nearly $59 on shore excursions. During the 2011/2012 cruise
year the average purchase value of a shore excursion was virtually unchanged but the percentage of
passenger purchasing a tour fell to 51 percent. Similar changes occurred for the purchase of food and
beverages, local crafts and clothing.
The increase in crew expenditures was largely due to the increase in the average crew expenditure. The
increase in the average expenditure for crew was the net result of an increase in the average value of a
purchase which was partially offset by a decline in the percentage of crew making onshore purchases. For
example, 62 percent of the crew reported spending about $20 for food and beverages during the 2008/2009
cruise year. During the 2011/2012, 58 percent of the crew reported purchasing food at an average value of
approximately $23. As a result the weighted average expenditure for food and beverages rose from $12.08
during the 2008/2009 cruise year to $13.33 in the 2011/2012 cruise year.
As a result of the 30 decline in direct cruise tourism expenditures from the 2008/2009 cruise year, the
economic impacts fell as well. The total employment and wage impacts decreased by about 25 percent
during the three-year period.

Florida-Caribbean Cruise Assn. Economic Impact of Cruise Tourism
Business Research and Economic Advisors Page 117
Passenger Surveys
A total of 511 passenger surveys were completed and returned for tabulation. Table 79 shows
the major attributes of passenger visits in Grenada as derived from the passenger surveys.
Of the 511 cruise parties that completed the surveys 65% stated that this had been
their first visit to Grenada. This is down from 77% in the 2009 study.
Ninety-six percent (96%) of the cruise parties that completed the surveys
disembarked their cruise ship to visit Grenada.
Table 79 - Major Attributes of Passenger Surveys - Grenada
Number Percent
Total Respondents 511
Number Making First Visit 332 65.0%
Number Ashore 491 96.1%
Number Making Onshore Purchases: 367 74.7%
Average Hours Ashore 3.7
Average Size of Expenditure Party (Persons) 2.1
Average Onshore Expenditure per Party $55.90
Purchased a Shore Excursion (Tour) 249 50.7%
Purchased Onshore Tour from:
Cruise Line 168 67.4%
Onshore from Tour Operator 58 23.1%
Travel Agent 23 9.5%
Average Cost of Shore Excursion per Party $94.20
Toured On Own/Did not Tour 242
Of the cruise parties that went ashore, 75% made at least one purchase while
ashore. This is a decline from 85% during the 2008/2009 cruise year. The typical
cruise party consisted of 2.1 passengers and spent an average of 3.7 hours ashore.
The responding cruise parties reported spending an average of $55.90 while ashore
(excludes shore excursions), a 20 percent decline from the 2008/2009 cruise year.
Fifty-one percent (51%) of the passengers that went ashore purchased a shore
excursion. This down from 56% in the 2009 study. Sixty-seven percent (67%) of
passengers who purchased a tour did so through their cruise line, 23% purchased
their tour onshore and 10 percent purchased their tour through their travel agent.
The typical cruise party that purchased a shore excursion spent $94.20 for their
tour, an increase of 7 percent from $88 during the 2008/2009 cruise year.
Passenger Satisfaction
The passenger survey also asked the passengers to rate their satisfaction with their destination
visit along a number of parameters, as shown in Table 80. A 10-point scale was used with 10
being the highest score, i.e., extremely satisfied, and 1 being the lowest score, i.e., not at all
satisfied.

Florida-Caribbean Cruise Assn. Economic Impact of Cruise Tourism
Business Research and Economic Advisors Page 118
Table 80 – Passenger Visit Satisfaction* - Grenada
Visit Attributes
Mean Score
Current Study
2009 Study
Overall Visit 7.1 7.1
Visit Met Expectations 6.9 6.7
Likelihood of a Return Visit 3.7 3.8
Informed of Tours and Activities 7.7 7.4
Initial Shoreside Welcome 7.6 7.4
Guided Tour 8.3 7.9
Historic Sites/Museums 7.3 6.8
Variety of Things to See and Do 6.7 6.4
Friendliness of Residents 7.8 7.6
Overall Shopping Experience 6.7 6.5
Courtesy of Employees 7.9 7.6
Variety of Shops 6.4 6.4
Overall Prices 6.5 6.2
Taxis/Local Transportation 7.2 7.1
* Scale is 1 to 10 with 10 being the highest score. The mean scores can be interpreted as follows:
Extremely Satisfied: 10-9; Very Satisfied: 8-7; Somewhat Satisfied: 6-5; Not Too Satisfied: 4-3;
Not At All Satisfied: 2-1.
Among other key conclusions concerning visit satisfaction were the following:
Cruise passengers were very satisfied with their overall visit to Grenada with a
mean score of 7.1. However, the visit did not score as high in terms of meeting
expectations. The mean score for “Visit Met Expectations” was slightly lower at 6.9.
While the satisfaction score for the overall visit was unchanged, the scores for most
of the individual aspects of passenger visits increased slightly.
Passengers felt very informed about tours and onshore activities in Grenada with a
mean score of 7.7.
“Guided Tours” (or Shore Excursions) received the highest score of all visit
attributes with a mean score of 8.3. Thus, cruise passengers were very satisfied
with their shore excursions.
Passenger interactions with residents and store employees were very positive with
“friendliness of residents” receiving a mean score of 7.8 and “courtesy of
employees” receiving a mean score of 7.9.
Categories with slightly lower scores but still above 7.0 (Very Satisfied) were: initial
shoreside welcome, historic sites and local transportation.
Categories with average scores between 5.0 and 7.0 (Somewhat Satisfied) were
given for the variety of things to see and do and the overall shopping experience,
including the variety of shops and overall prices. Thus, while passengers thought
shop employees were very courteous, the overall score for their shopping
experience was brought down by lower perceptions on the variety of shops (6.4)
and overall prices (6.5).
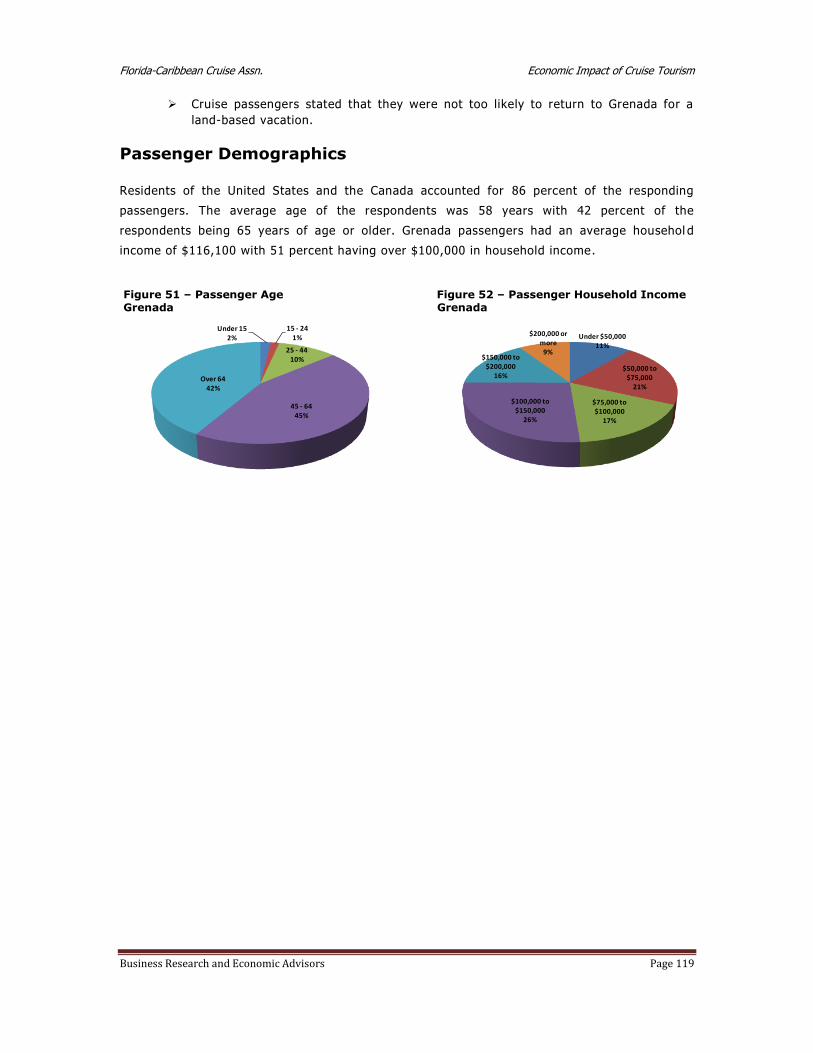
Florida-Caribbean Cruise Assn. Economic Impact of Cruise Tourism
Business Research and Economic Advisors Page 119
Cruise passengers stated that they were not too likely to return to Grenada for a
land-based vacation.
Passenger Demographics
Residents of the United States and the Canada accounted for 86 percent of the responding
passengers. The average age of the respondents was 58 years with 42 percent of the
respondents being 65 years of age or older. Grenada passengers had an average househol d
income of $116,100 with 51 percent having over $100,000 in household income.
Figure 51 – Passenger Age Grenada
Under 152%
15 - 241%
25 - 4410%
45 - 6445%
Over 6442%
Figure 52 – Passenger Household Income Grenada
Under $50,00011%
$50,000 to $75,000
21%
$75,000 to $100,000
17%
$100,000 to $150,000
26%
$150,000 to $200,000
16%
$200,000 or more
9%

Florida-Caribbean Cruise Assn. Economic Impact of Cruise Tourism
Business Research and Economic Advisors Page 120
Honduras
At the core of the analysis of the economic contribution of cruise tourism were a set of
passenger and crew surveys that were conducted onboard ships of the FCCA member cruise
lines.64 The surveys were undertaken during the six-month period beginning in December 2011
and ending in May 2012. The survey schedule was designed so that surveys were conducted by
FCCA member cruise lines that called at each destination and that the distribution of passenger
and crew surveys would reflect the distribution of passenger and crew arrivals by c ruise line at
each destination. On any given cruise itinerary, passenger and crew surveys were placed in all
passenger cabins and crew quarters following a single destination call. The surveys were
completed by the passengers and crew in the privacy of the ir quarters and returned to a
designated office on the cruise ship. Thus, passengers and crew were only surveyed once during
a cruise itinerary and for a single destination. On a subsequent itinerary, passengers were
surveyed following a call at a different destination.
The passenger and crew surveys were designed to collect data for onshore spending and visit
satisfaction by both passengers and crew. While the crew survey was slightly shorter than the
passenger survey, both surveys were designed to collect the following information:
hours spent ashore;
expenditures by category, including shore tours, food & beverages, clothing, etc.;
visit satisfaction, including shore tour, friendliness of residents, prices, shopping,
etc.;
likelihood of returning for a land-based vacation; and
demographic characteristics, including country of residence, age group, income, etc.
Combining the expenditure data collected from the passenger and crew surveys with data on
expenditures by cruise lines for port fees and services, payments to local tour operators for
passenger shore excursions purchased onboard the cruise ships, and other provisions purchased
locally by the cruise lines, estimates of total cruise tourism expenditures were developed for
each participating destination.
Given the direct spending estimates, the economic contribution of these expenditures, as
measured by employment and wage income were then estimated for each de stination. This
process began with the collection of economic data for each destination from a combination of
local, regional and international sources. Utilizing all of these data a set of economic impact
models were developed for each destination to estimate the direct and total employment and
wage impacts. A more detailed description of these models is provided in the Data and
Methods section of Volume I.
64 Surveys were conducted on the ships of the following cruise lines: Carnival Cruise Lines, Celebrity Cruises, Disney Cruise Line, Holland America Line, Norwegian Cruise Line, Princess Cruises, P&O Cruises and Royal Caribbean International.

Florida-Caribbean Cruise Assn. Economic Impact of Cruise Tourism
Business Research and Economic Advisors Page 121
Cruise Tourism Expenditures
Cruise tourism expenditures in destination ports are composed of a broad range of spending
including:
onshore expenditures by passengers which tend to be concentrated in shore excursions
and retail purchases of clothing, jewelry and local crafts and souvenirs;
onshore expenditures by crew which are generally concentrated in purchases of food
and beverages, local transportation and retail purchases of clothing and elect ronics;
expenditures by cruise lines for port services, such as dockage fees and linesmen,
utilities, such as water and power and navigation services; and
purchases of supplies, such as food and other stores, by the cruise lines from local
businesses.
According to data obtained from the Port of Roatan, 311,740 cruise passengers arrived aboard
cruise ships during the 2011/2012 cruise year.65 Of these, an estimated 264,979 passengers (85
percent) disembarked and visited Honduras. Uti lizing additional data provided by the port and
visiting cruise lines, we have estimated that 128,042 crew were aboard the cruise ships and that
25 percent, or 32,009 crew, disembarked and visited Honduras. These passenger and crew visits
along with additional expenditures by the cruise lines generated a total of $20.4 million ($US)
in cruise tourism expenditures in Honduras during the 2011/2012 cruise year. The contribution
of expenditures by passengers, crew and cruise lines to this total is discussed below.
Table 81 – Estimated Passenger Spending ($US) in Honduras, 2011/2012 Cruise Year66
Purchase Categories Average Spend
per Party Share of All
Onshore Visits
Weighted Average Spend
per Party
Shore Excursions $ 84.90 63.9% $ 54.19
Local Crafts & Souvenirs $ 37.80 57.4% $ 21.69
F&B at Restaurants & Bars $ 28.10 54.1% $ 15.20
Clothing $ 34.30 38.7% $ 13.27
Other Purchases $ 52.50 20.1% $ 10.54
Watches & Jewelry $ 146.60 15.9% $ 23.26
Taxis/Ground Transportation $ 47.50 14.6% $ 6.96
Retail Purchases of Liquor $ 32.30 6.7% $ 2.15
Perfumes & Cosmetics $ 56.20 2.7% $ 1.53
Entertainment/Night Clubs/Casinos $ 53.30 0.8% $ 0.45
Telephone & Internet $ 10.70 0.8% $ 0.08
Electronics $ 37.30 0.2% $ 0.07
Total Spend per Cruise Party $149.39
Average Size of a Cruise Party 2.4
Total Spend per Cruise Passenger $62.24
Cruise Passenger Visits 264,979
Total Cruise Passenger Expenditures $16,493,512
65 The 2011/2012 cruise year includes the twelve months beginning in May, 2011 and ending in April, 2012. 66 The average shore excursion expenditure is a weighted average of the onshore and Internet purchases and the portion of the onboard purchases paid to local tour operators.
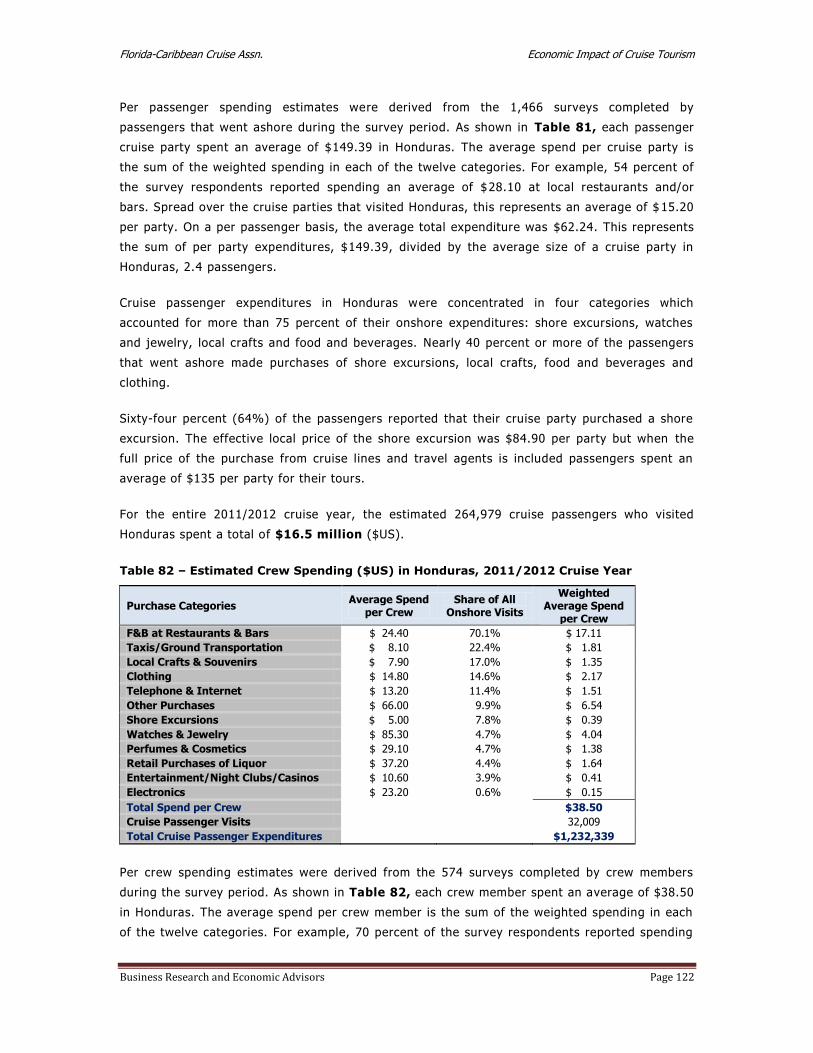
Florida-Caribbean Cruise Assn. Economic Impact of Cruise Tourism
Business Research and Economic Advisors Page 122
Per passenger spending estimates were derived from the 1,466 surveys completed by
passengers that went ashore during the survey period. As shown in Table 81, each passenger
cruise party spent an average of $149.39 in Honduras. The average spend per cruise party is
the sum of the weighted spending in each of the twelve categories. For example, 54 percent of
the survey respondents reported spending an average of $28.10 at local restaurants and/or
bars. Spread over the cruise parties that visited Honduras, this represents an average of $ 15.20
per party. On a per passenger basis, the average total expenditure was $62.24. This represents
the sum of per party expenditures, $149.39, divided by the average size of a cruise party in
Honduras, 2.4 passengers.
Cruise passenger expenditures in Honduras were concentrated in four categories which
accounted for more than 75 percent of their onshore expenditures: shore excursions, watches
and jewelry, local crafts and food and beverages. Nearly 40 percent or more of the passengers
that went ashore made purchases of shore excursions, local crafts, food and beverages and
clothing.
Sixty-four percent (64%) of the passengers reported that their cruise party purchased a shore
excursion. The effective local price of the shore excursion was $84.90 per party but when the
full price of the purchase from cruise lines and travel agents is included passengers spent an
average of $135 per party for their tours.
For the entire 2011/2012 cruise year, the estimated 264,979 cruise passengers who visited
Honduras spent a total of $16.5 million ($US).
Table 82 – Estimated Crew Spending ($US) in Honduras, 2011/2012 Cruise Year
Purchase Categories Average Spend
per Crew Share of All
Onshore Visits
Weighted Average Spend
per Crew
F&B at Restaurants & Bars $ 24.40 70.1% $ 17.11
Taxis/Ground Transportation $ 8.10 22.4% $ 1.81
Local Crafts & Souvenirs $ 7.90 17.0% $ 1.35
Clothing $ 14.80 14.6% $ 2.17
Telephone & Internet $ 13.20 11.4% $ 1.51
Other Purchases $ 66.00 9.9% $ 6.54
Shore Excursions $ 5.00 7.8% $ 0.39
Watches & Jewelry $ 85.30 4.7% $ 4.04
Perfumes & Cosmetics $ 29.10 4.7% $ 1.38
Retail Purchases of Liquor $ 37.20 4.4% $ 1.64
Entertainment/Night Clubs/Casinos $ 10.60 3.9% $ 0.41
Electronics $ 23.20 0.6% $ 0.15
Total Spend per Crew $38.50
Cruise Passenger Visits 32,009
Total Cruise Passenger Expenditures $1,232,339
Per crew spending estimates were derived from the 574 surveys completed by crew members
during the survey period. As shown in Table 82, each crew member spent an average of $38.50
in Honduras. The average spend per crew member is the sum of the weighted spending in each
of the twelve categories. For example, 70 percent of the survey respondents reported spending
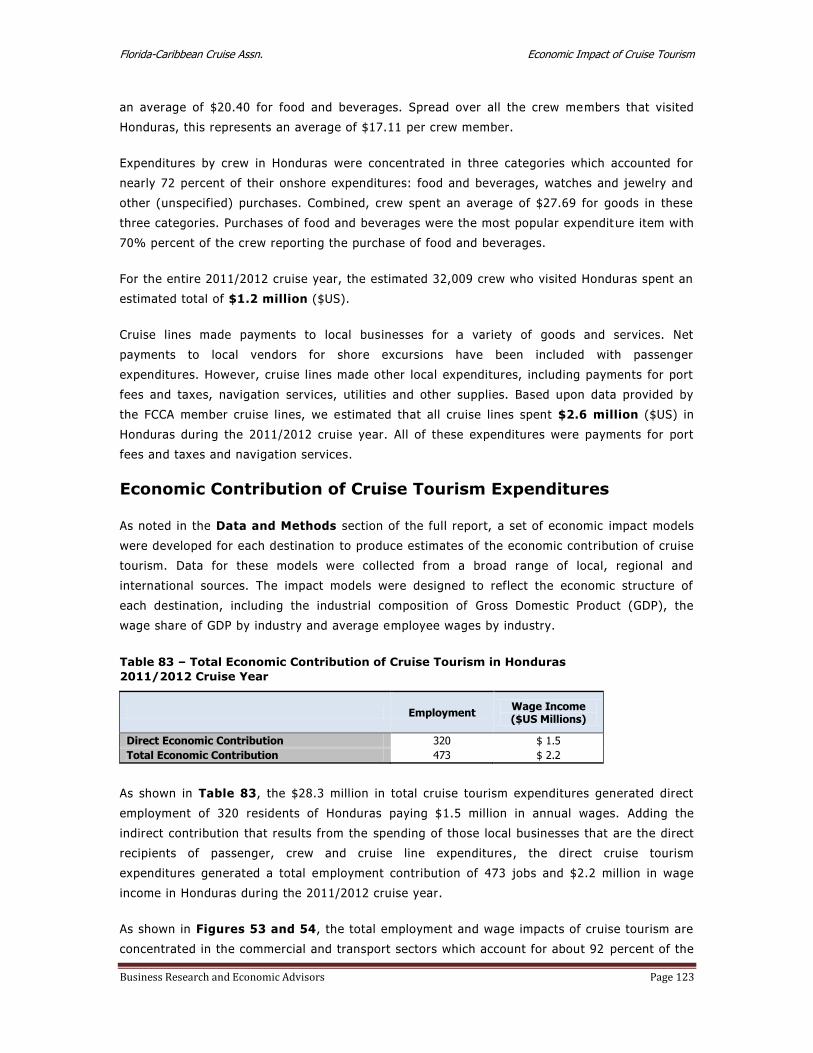
Florida-Caribbean Cruise Assn. Economic Impact of Cruise Tourism
Business Research and Economic Advisors Page 123
an average of $20.40 for food and beverages. Spread over all the crew members that visited
Honduras, this represents an average of $17.11 per crew member.
Expenditures by crew in Honduras were concentrated in three categories which accounted for
nearly 72 percent of their onshore expenditures: food and beverages, watches and jewelry and
other (unspecified) purchases. Combined, crew spent an average of $27.69 for goods in these
three categories. Purchases of food and beverages were the most popular expendit ure item with
70% percent of the crew reporting the purchase of food and beverages.
For the entire 2011/2012 cruise year, the estimated 32,009 crew who visited Honduras spent an
estimated total of $1.2 million ($US).
Cruise lines made payments to local businesses for a variety of goods and services. Net
payments to local vendors for shore excursions have been included with passenger
expenditures. However, cruise lines made other local expenditures, including payments for port
fees and taxes, navigation services, utilities and other supplies. Based upon data provided by
the FCCA member cruise lines, we estimated that all cruise lines spent $2.6 million ($US) in
Honduras during the 2011/2012 cruise year. All of these expenditures were payments for port
fees and taxes and navigation services.
Economic Contribution of Cruise Tourism Expenditures
As noted in the Data and Methods section of the full report, a set of economic impact models
were developed for each destination to produce estimates of the economic contribution of cruise
tourism. Data for these models were collected from a broad range of local, regional and
international sources. The impact models were designed to reflect the economic structure of
each destination, including the industrial composition of Gross Domestic Product (GDP), the
wage share of GDP by industry and average employee wages by industry.
Table 83 – Total Economic Contribution of Cruise Tourism in Honduras
2011/2012 Cruise Year
Employment Wage Income ($US Millions)
Direct Economic Contribution 320 $ 1.5
Total Economic Contribution 473 $ 2.2
As shown in Table 83, the $28.3 million in total cruise tourism expenditures generated direct
employment of 320 residents of Honduras paying $1.5 million in annual wages. Adding the
indirect contribution that results from the spending of those local businesses that are the direct
recipients of passenger, crew and cruise line expenditures , the direct cruise tourism
expenditures generated a total employment contribution of 473 jobs and $2.2 million in wage
income in Honduras during the 2011/2012 cruise year.
As shown in Figures 53 and 54, the total employment and wage impacts of cruise tourism are
concentrated in the commercial and transport sectors which account for about 92 percent of the

Florida-Caribbean Cruise Assn. Economic Impact of Cruise Tourism
Business Research and Economic Advisors Page 124
employment and wage impacts.67 This is not surprising since the direct impacts account for
about 67 percent of the total employment impacts and that virtually all of the cruise tourism
expenditures are made with businesses in these sectors. Because of the relatively higher wages
in the transport sector compared to the other sectors of the economy, the transport sector
accounts for 56 percent of the wage impacts but only 41 percent of the employment impacts.
The remainder of the total employment and wage impacts was generated by the indirect
spending in the other sectors of the economy.
67 The industry sectors include the following activities:
Manufacturing & Construction: residential and nonresidential construction and all manufacturing Commercial Services: wholesale and retail trade, lodging and eating and drinking establishments Transportation & Utilities: tour operators, port services, telecommunications and water and power utilities Business & Financial Services: banking, insurance, legal, accounting, leasing and other business services Community Services & Government: education, health and social services and government agencies
Figure 53 – Total Employment Impacts by
Sector - Honduras
Manuf. &
Construction1%
Commercial
Services51%
Transport &
Utilities41%
Business &
Financial Services
3%Community
Services & Government
4%
Figure 54 – Total Wage Impacts by Sector
Honduras
Manuf. &
Construction1%
Commercial
Services36%
Transport &
Utilities56%
Business &
Financial Services
3%
Community
Services & Government
4%

Florida-Caribbean Cruise Assn. Economic Impact of Cruise Tourism
Business Research and Economic Advisors Page 125
Comparison to 2009 Study
Total passenger and crew declined by 19 percent from 366,100 during the 2008/2009 cruise year to
297,000 during the 2011/2012 cruise year. Total direct cruise tourism expenditures declined by 28 percent
over the three year period, falling from $28.3 million to $20.4 million. As indicated in Table 84,
expenditures by cruise lines, passengers and crew declined.
Table 84 – Comparison of Cruise Tourism Impacts, Current Study versus 2009 Study - Honduras
Current
Study 2009
Study Percent Change
Total Onshore Visits (Thousands) 297.0 366.1 -18.9%
Passengers 265.0 329.3 -19.5%
Crew 32.0 36.8 -13.0%
Total Direct Expenditures ($US Millions) $ 20.4 $ 28.3 -27.9%
Passengers $ 16.5 $ 23.2 -28.9%
Crew $ 1.2 $ 2.2 -45.5%
Cruise Lines $ 2.6 $ 2.9 -10.3%
Average Per Passenger Expenditure $62.24 $70.39 -11.6% Average Per Crew Expenditure $38.50 $58.66 -34.4%
Total Employment Impact 473 632 -25.2%
Total Wage Impact ($US Millions) $ 2.2 $ 2.9 -24.1%
The 29 percent decrease in passenger expenditures was the result of a the 20 percent decrease in
passenger visits and the 12 percent decline in average passenger expenditures. The decline in the average
passenger expenditures was primarily due to a drop in average spending for jewelry and local crafts which
was only partially offset by increases in spending for shore excursions and food and beverages.
The decrease in crew expenditures was largely due to a decrease in the value of individual purchases by
crew while shore. This was enhanced in many categories by a decline in the percentage of crew making an
onshore purchase. For example, 80 percent of the crew reported spending about $31 for food and
beverages during the 2008/2009 cruise year. During the 2011/2012, only 64 percent of the crew reported
purchasing food and beverages at an average value of approximately $24. Similar changes occurred for the
purchase of local crafts and clothing.
As a result of the 28 percent decline in direct cruise tourism expenditures from the 2008/2009 cruise year,
the economic impacts fell as well. The total employment and wage impacts decreased by about 25 percent
during the three-year period.

Florida-Caribbean Cruise Assn. Economic Impact of Cruise Tourism
Business Research and Economic Advisors Page 126
Passenger Surveys
A total of 1,466 passenger surveys were completed and returned for tabulation. Table 85
shows the major attributes of passenger visits in Honduras as derived from the passenger
surveys.
Table 85 - Major Attributes of Transit Passenger Surveys - Honduras
Number Percent
Total Respondents 1,466
Number Making First Visit 1,202 82.0%
Number Ashore 1,444 98.5%
Number Making Onshore Purchases: 1,065 73.8%
Average Hours Ashore 4.5
Average Size of Expenditure Party (Persons) 2.4
Average Onshore Expenditure per Party $95.20
Purchased a Shore Excursion (Tour) 922 63.9%
Purchased Onshore Tour from:
Cruise Line 632 68.5%
Onshore from Tour Operator 157 17.0%
Travel Agent 133 14.6%
Average Cost of Shore Excursion per Party $135
Toured On Own/Did not Tour 522
Of the 1,4669 cruise parties that completed the surveys 82% stated that this had
been their first visit to Honduras. This is down from 87% in the 2009 study.
Ninety-eight percent (98%) of the cruise parties that completed the surveys
disembarked their cruise ship to visit Honduras.
Of the cruise parties that went ashore, 74% made at least one purchase while
ashore. This is a decline from 79% during the 2008/2009 cruise year. The typical
cruise party consisted of 2.4 passengers and spent an average of 4.5 hours ashore.
The responding cruise parties reported spending an average of $95.20 while ashore
(excludes shore excursions), a 17 percent decline from $115 during the 2008/2009
cruise year.
Sixty-four percent (64%) of the passengers that went ashore purchased a shore
excursion. This is down slightly from 67% in the 2009 study. Sixty-nine percent
(69%) of passengers who purchased a tour did so through their cruise line, 17%
purchased their tour onshore and 14 percent purchased their tour through their
travel agent.
The typical cruise party that purchased a shore excursion spent $135 for their tour.
This is a 17 percent increase from the 2008/2009 cruise year.
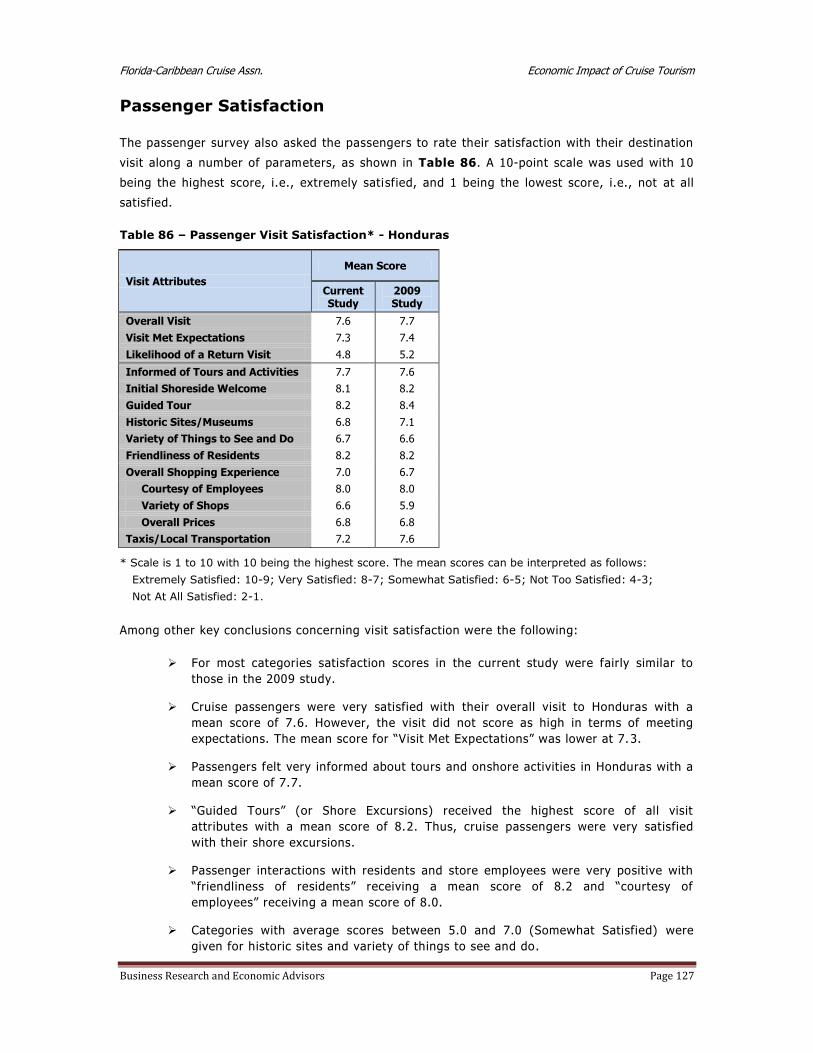
Florida-Caribbean Cruise Assn. Economic Impact of Cruise Tourism
Business Research and Economic Advisors Page 127
Passenger Satisfaction
The passenger survey also asked the passengers to rate their satisfaction with their destination
visit along a number of parameters, as shown in Table 86. A 10-point scale was used with 10
being the highest score, i.e., extremely satisfied, and 1 being the lowest score, i.e., not at all
satisfied.
Table 86 – Passenger Visit Satisfaction* - Honduras
Visit Attributes
Mean Score
Current Study
2009 Study
Overall Visit 7.6 7.7
Visit Met Expectations 7.3 7.4
Likelihood of a Return Visit 4.8 5.2
Informed of Tours and Activities 7.7 7.6
Initial Shoreside Welcome 8.1 8.2
Guided Tour 8.2 8.4
Historic Sites/Museums 6.8 7.1
Variety of Things to See and Do 6.7 6.6
Friendliness of Residents 8.2 8.2
Overall Shopping Experience 7.0 6.7
Courtesy of Employees 8.0 8.0
Variety of Shops 6.6 5.9
Overall Prices 6.8 6.8
Taxis/Local Transportation 7.2 7.6
* Scale is 1 to 10 with 10 being the highest score. The mean scores can be interpreted as follows:
Extremely Satisfied: 10-9; Very Satisfied: 8-7; Somewhat Satisfied: 6-5; Not Too Satisfied: 4-3;
Not At All Satisfied: 2-1.
Among other key conclusions concerning visit satisfaction were the following:
For most categories satisfaction scores in the current study were fairly similar to
those in the 2009 study.
Cruise passengers were very satisfied with their overall visit to Honduras with a
mean score of 7.6. However, the visit did not score as high in terms of meeting
expectations. The mean score for “Visit Met Expectations” was lower at 7.3.
Passengers felt very informed about tours and onshore activities in Honduras with a
mean score of 7.7.
“Guided Tours” (or Shore Excursions) received the highest score of all visit
attributes with a mean score of 8.2. Thus, cruise passengers were very satisfied
with their shore excursions.
Passenger interactions with residents and store employees were very positive with
“friendliness of residents” receiving a mean score of 8.2 and “courtesy of
employees” receiving a mean score of 8.0.
Categories with average scores between 5.0 and 7.0 (Somewhat Satisfied) were
given for historic sites and variety of things to see and do.

Florida-Caribbean Cruise Assn. Economic Impact of Cruise Tourism
Business Research and Economic Advisors Page 128
Passengers were very satisfied with their overall shopping experience, including the
variety of shops and overall prices. While passengers thought shop employees were
very courteous, the overall score for their shopping experience was brought down
by lower perceptions on the variety of shops (6.6) and overall prices (6.8).
Cruise passengers stated that they were not too likely to return to Honduras for a
land-based vacation.
Passenger Demographics
Residents of the United States and the Canada accounted for 97 percent of the responding
passengers. The average age of the respondents was 50 years with 25 percent of the
respondents being 65 years of age or older. Honduras passengers had an average household
income of $114,600 with 46 percent having over $100,000 in household income.
Figure 55 – Passenger Age
Honduras
Under 156%
15 - 246%
25 - 4418%
45 - 6444%
Over 6426%
Figure 56 – Passenger Household Income
Honduras
Under $50,00012%
$50,000 to $75,000
24%
$75,000 to $100,000
19%
$100,000 to $150,000
21%
$150,000 to $200,000
12%
$200,000 or more12%

Florida-Caribbean Cruise Assn. Economic Impact of Cruise Tourism
Business Research and Economic Advisors Page 129
Nicaragua
At the core of the analysis of the economic contribution of cruise tourism were a set of
passenger and crew surveys that were conducted onboard ships of the FCCA member cruise
lines.68 The surveys were undertaken during the six-month period beginning in December 2011
and ending in May 2012. The survey schedule was designed so that surveys were conducted by
FCCA member cruise lines that called at each destination and that the distribution of passenger
and crew surveys would reflect the distribution of passenger and crew arrivals by cruise line at
each destination. On any given cruise itinerary, passenger and crew surveys were placed in all
passenger cabins and crew quarters following a single destination call. The surveys were
completed by the passengers and crew in the privacy of their quarters and returned to a
designated office on the cruise ship. Thus, passengers and crew were only surveyed once during
a cruise itinerary and for a single destination. On a subsequent itinerary, passengers were
surveyed following a call at a different dest ination.
The passenger and crew surveys were designed to collect data for onshore spending and visit
satisfaction by both passengers and crew. While the crew survey was slightly shorter than the
passenger survey, both surveys were designed to collect the following information:
hours spent ashore;
expenditures by category, including shore tours, food & beverages, clothing, etc.;
visit satisfaction, including shore tour, friendliness of residents, prices, shopping,
etc.;
likelihood of returning for a land-based vacation; and
demographic characteristics, including country of residence, age group, income, etc.
Combining the expenditure data collected from the passenger and crew surveys with data on
expenditures by cruise lines for port fees and services, payments to local tour operators for
passenger shore excursions purchased onboard the cruise ships, and other provisions purchased
locally by the cruise lines, estimates of total cruise tourism expendi tures were developed for
each participating destination.
Given the direct spending estimates, the economic contribution of these expenditures, as
measured by employment and wage income were then estimated for each de stination. This
process began with the collection of economic data for each destination from a combination of
local, regional and international sources. Utilizing all of these data a set of economic impact
models were developed for each destination to estimate the direct and total employment and
wage impacts. A more detailed description of these models is provided in the Data and
Methods section of Volume I.
68 Surveys were conducted on the ships of the following cruise lines: Carnival Cruise Lines, Celebrity Cruises, Disney Cruise Line, Holland America Line, Norwegian Cruise Line, Princess Cruises, P&O Cruises and Royal Caribbean International.

Florida-Caribbean Cruise Assn. Economic Impact of Cruise Tourism
Business Research and Economic Advisors Page 130
Cruise Tourism Expenditures
Cruise tourism expenditures in destination ports are composed of a broad range of spending
including:
onshore expenditures by passengers which tend to be concentrated in shore excursions
and retail purchases of clothing, jewelry and local crafts and souvenirs;
onshore expenditures by crew which are generally concentrated in purchases of food
and beverages, local transportation and retail purchases of clothing and electronics;
expenditures by cruise lines for port services, such as dockage fees and linesmen,
utilities, such as water and power and navigation services; and
purchases of supplies, such as food and other stores, by the cruise lines from local
businesses.
According to data obtained from the Nicaragua Institute of Tourism, 34,793 cruise passengers
arrived aboard cruise ships during the 2011/2012 cruise year.69 Of these, an estimated 31,314
passengers (90 percent) disembarked and visited Nicaragua. Uti lizing additional data provided
by the Institute and visiting cruise lines, we have estimated that 17,075 crew were aboard the
cruise ships and that 32 percent, or 5,549 crew, disembarked and visited Nicaragua. These
passenger and crew visits along with additional expend itures by the cruise lines generated a
total of $2.0 million ($US) in cruise tourism expenditures in Nicaragua during the 2011/2012
cruise year. The contribution of expenditures by passengers, crew and cruise lines to this total
is discussed below.
Table 87 – Estimated Passenger Spending ($US) in Nicaragua, 2011/2012 Cruise Year70
Purchase Categories Average Spend
per Party Share of All
Onshore Visits
Weighted Average Spend
per Party
Shore Excursions $ 95.50 64.8% $ 61.87
Local Crafts & Souvenirs $ 20.70 64.5% $ 13.35
F&B at Restaurants & Bars $ 9.00 43.0% $ 3.87
Clothing $ 19.60 24.5% $ 4.80
Other Purchases $ 18.50 19.1% $ 3.53
Taxis/Ground Transportation $ 21.50 8.7% $ 1.86
Watches & Jewelry $ 20.10 6.3% $ 1.26
Retail Purchases of Liquor $ 15.00 4.3% $ 0.65
Telephone & Internet $ 1.80 3.3% $ 0.06
Electronics $ 2.20 0.4% $ 0.01
Entertainment/Night Clubs/Casinos $ 3.40 0.3% $ 0.01
Total Spend per Cruise Party $91.27
Average Size of a Cruise Party 2.0
Total Spend per Cruise Passenger $45.64
Cruise Passenger Visits 31,314
Total Cruise Passenger Expenditures $1,429,029
69 The 2011/2012 cruise year includes the twelve months beginning in May, 2011 and ending in April, 2012. 70 The average shore excursion expenditure is a weighted average of the onshore and Internet purchases and the portion of the onboard purchases paid to local tour operators.
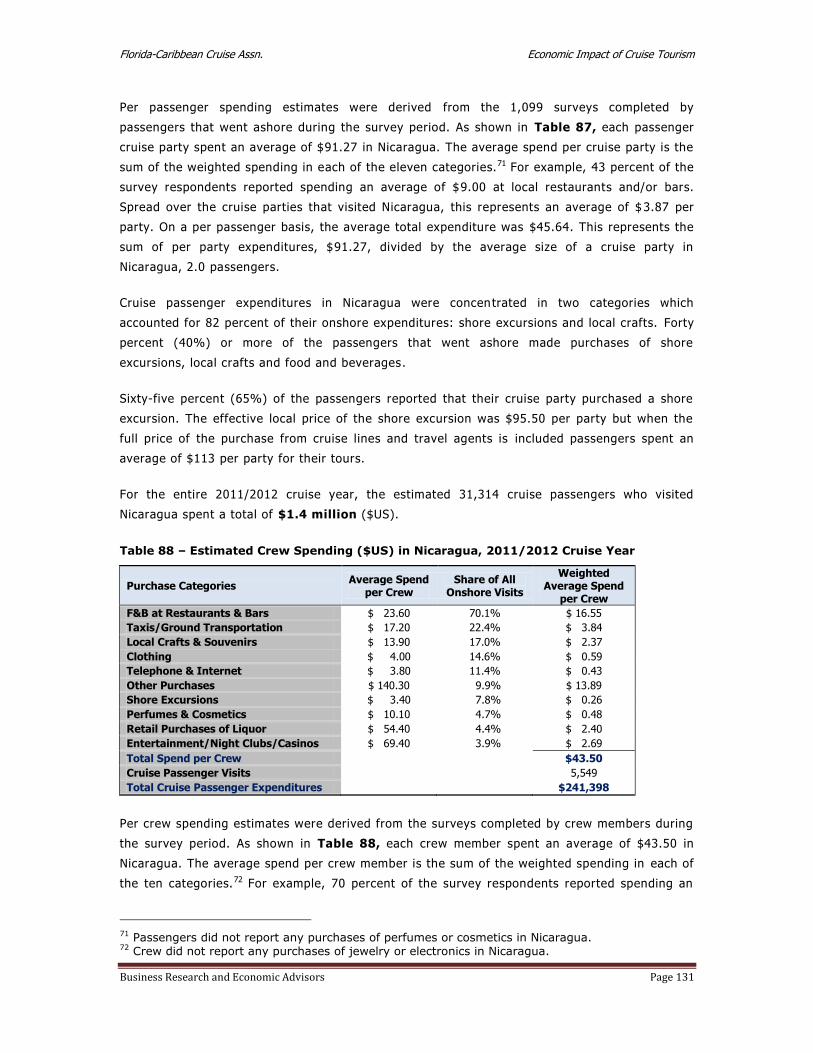
Florida-Caribbean Cruise Assn. Economic Impact of Cruise Tourism
Business Research and Economic Advisors Page 131
Per passenger spending estimates were derived from the 1,099 surveys completed by
passengers that went ashore during the survey period. As shown in Table 87, each passenger
cruise party spent an average of $91.27 in Nicaragua. The average spend per cruise party is the
sum of the weighted spending in each of the eleven categories.71 For example, 43 percent of the
survey respondents reported spending an average of $9.00 at local restaurants and/or bars.
Spread over the cruise parties that visited Nicaragua, this represents an average of $ 3.87 per
party. On a per passenger basis, the average total expenditure was $45.64. This represents the
sum of per party expenditures, $91.27, divided by the average size of a cruise party in
Nicaragua, 2.0 passengers.
Cruise passenger expenditures in Nicaragua were concentrated in two categories which
accounted for 82 percent of their onshore expenditures: shore excursions and local crafts. Forty
percent (40%) or more of the passengers that went ashore made purchases of shore
excursions, local crafts and food and beverages.
Sixty-five percent (65%) of the passengers reported that their cruise party purchased a shore
excursion. The effective local price of the shore excursion was $95.50 per party but when the
full price of the purchase from cruise lines and travel agents is included passengers spent an
average of $113 per party for their tours.
For the entire 2011/2012 cruise year, the estimated 31,314 cruise passengers who visited
Nicaragua spent a total of $1.4 million ($US).
Table 88 – Estimated Crew Spending ($US) in Nicaragua, 2011/2012 Cruise Year
Purchase Categories Average Spend
per Crew Share of All
Onshore Visits
Weighted Average Spend
per Crew
F&B at Restaurants & Bars $ 23.60 70.1% $ 16.55
Taxis/Ground Transportation $ 17.20 22.4% $ 3.84
Local Crafts & Souvenirs $ 13.90 17.0% $ 2.37
Clothing $ 4.00 14.6% $ 0.59
Telephone & Internet $ 3.80 11.4% $ 0.43
Other Purchases $ 140.30 9.9% $ 13.89
Shore Excursions $ 3.40 7.8% $ 0.26
Perfumes & Cosmetics $ 10.10 4.7% $ 0.48
Retail Purchases of Liquor $ 54.40 4.4% $ 2.40
Entertainment/Night Clubs/Casinos $ 69.40 3.9% $ 2.69
Total Spend per Crew $43.50
Cruise Passenger Visits 5,549
Total Cruise Passenger Expenditures $241,398
Per crew spending estimates were derived from the surveys completed by crew members during
the survey period. As shown in Table 88, each crew member spent an average of $43.50 in
Nicaragua. The average spend per crew member is the sum of the weighted spending in each of
the ten categories.72 For example, 70 percent of the survey respondents reported spending an
71 Passengers did not report any purchases of perfumes or cosmetics in Nicaragua. 72 Crew did not report any purchases of jewelry or electronics in Nicaragua.

Florida-Caribbean Cruise Assn. Economic Impact of Cruise Tourism
Business Research and Economic Advisors Page 132
average of $23.60 for food and beverages. Spread over all the crew members that visited
Nicaragua, this represents an average of $16.55 per crew member.
For the entire 2011/2012 cruise year, the estimated 5,549 crew who visited Nicaragua spent an
estimated total of $0.2 million ($US).
Cruise lines made payments to local businesses for a variety of goods and services. Net
payments to local vendors for shore excursions have been included with passenger
expenditures. However, cruise lines made other local expenditures, including payments for port
fees and taxes, navigation services, utilities and other supplies. Based upon data provided by
the FCCA member cruise lines, we estimated that all cruise lines spent $0.3 million ($US) in
Nicaragua during the 2011/2012 cruise year. All of these expenditures were payments for port
fees and taxes and navigation services.
Economic Contribution of Cruise Tourism Expenditures
As noted in the Data and Methods section of the full report, a set of economic impact models
were developed for each destination to produce estimates of the economic contribution of cruise
tourism. Data for these models were collected from a broad range o f local, regional and
international sources. The impact models were designed to reflect the economic structure of
each destination, including the industrial composition of Gross Domestic Product (GDP), the
wage share of GDP by industry and average employee wages by industry.
Table 89 – Total Economic Contribution of Cruise Tourism in Nicaragua
2011/2012 Cruise Year
Employment Wage Income ($US Millions)
Direct Economic Contribution 77 $ 0.2
Total Economic Contribution 111 $ 0.3
As shown in Table 89, the $2.0 million in total cruise tourism expenditures generated direct
employment of 77 residents of Nicaragua paying $200,000 in annual wages. Adding the indirect
contribution that results from the spending of those local businesses that are the direct
recipients of passenger, crew and cruise line expenditures , the direct cruise tourism
expenditures generated a total employment contribution of 111 jobs and $300,000 in wage
income in Nicaragua during the 2011/2012 cruise year.
As shown in Figures 57 and 58, the total employment and wage impacts of cruise tourism are
concentrated in the commercial and transport sectors which account for about 94 percent of the
employment and wage impacts.73 This is not surprising since the direct impacts account for
73 The industry sectors include the following activities:
Manufacturing & Construction: residential and nonresidential construction and all manufacturing Commercial Services: wholesale and retail trade, lodging and eating and drinking establishments Transportation & Utilities: tour operators, port services, telecommunications and water and power utilities Business & Financial Services: banking, insurance, legal, accounting, leasing and other business services
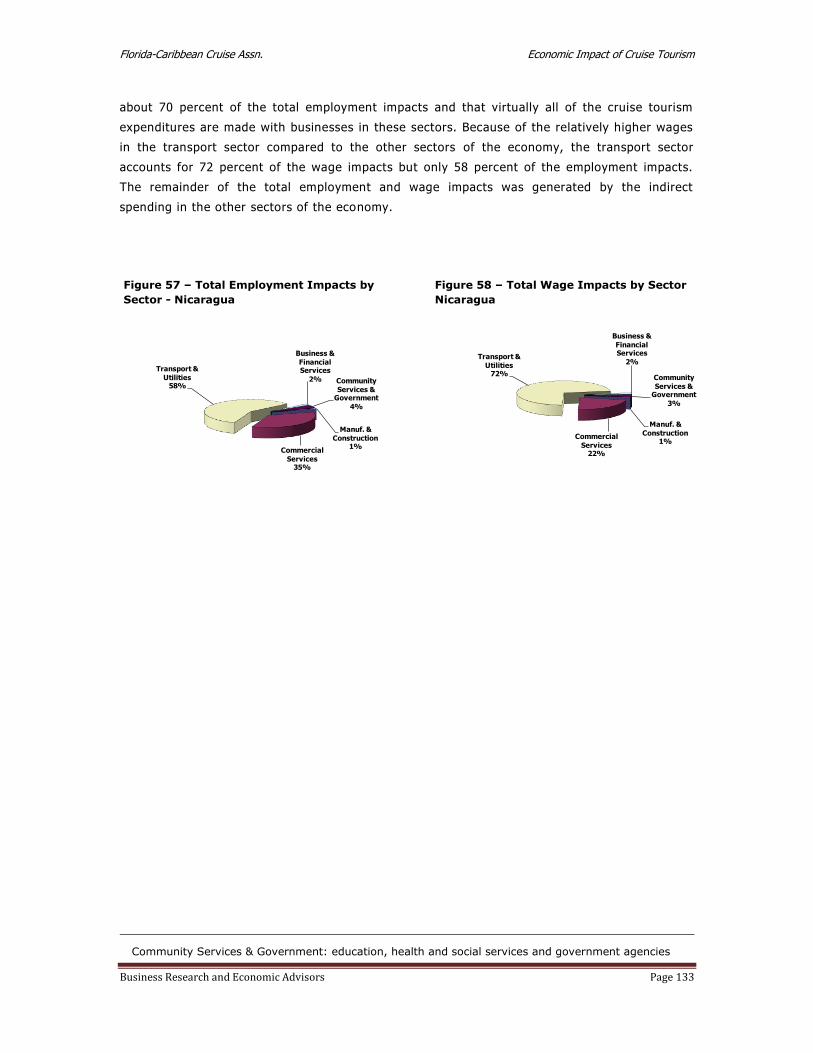
Florida-Caribbean Cruise Assn. Economic Impact of Cruise Tourism
Business Research and Economic Advisors Page 133
about 70 percent of the total employment impacts and that virtually all of the cruise tourism
expenditures are made with businesses in these sectors. Because of the relatively higher wages
in the transport sector compared to the other sectors of the economy, the transport sector
accounts for 72 percent of the wage impacts but only 58 percent of the employment impacts.
The remainder of the total employment and wage impacts was generated by the indirect
spending in the other sectors of the economy.
Community Services & Government: education, health and social services and government agencies
Figure 57 – Total Employment Impacts by
Sector - Nicaragua
Manuf. &
Construction1%
Commercial
Services35%
Transport &
Utilities58%
Business &
Financial Services
2% Community
Services & Government
4%
Figure 58 – Total Wage Impacts by Sector
Nicaragua
Manuf. &
Construction1%
Commercial
Services22%
Transport &
Utilities72%
Business &
Financial Services
2%
Community
Services & Government
3%
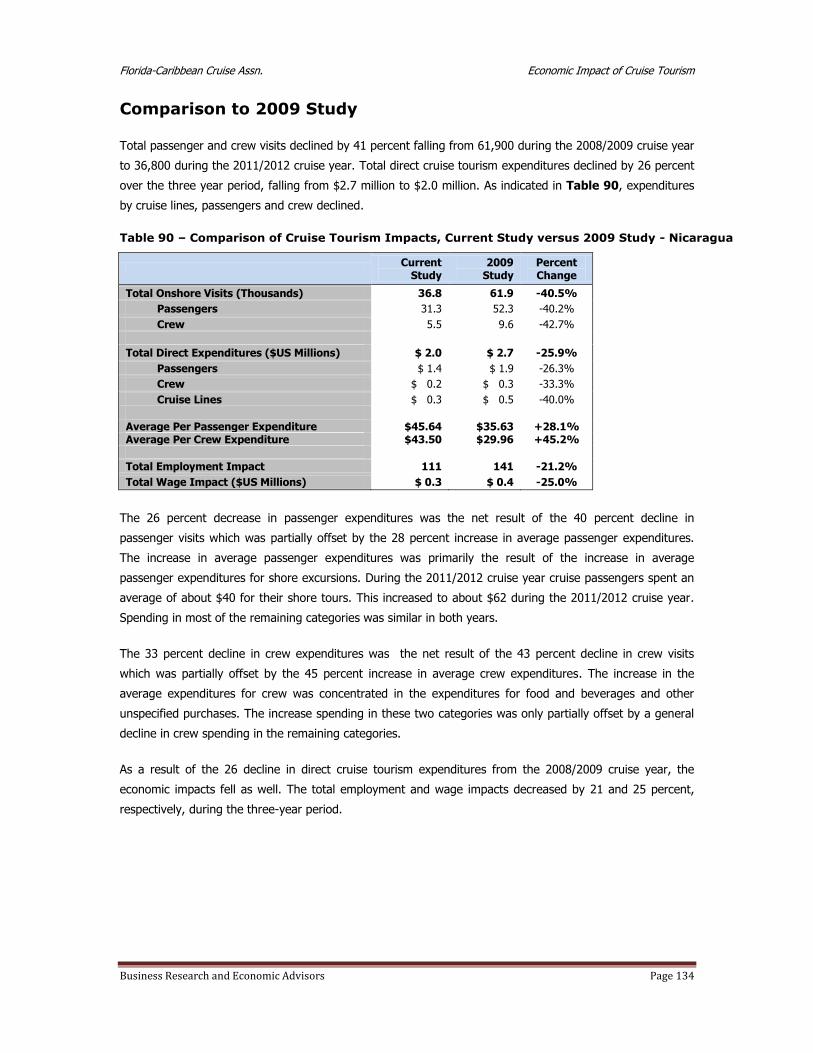
Florida-Caribbean Cruise Assn. Economic Impact of Cruise Tourism
Business Research and Economic Advisors Page 134
Comparison to 2009 Study
Total passenger and crew visits declined by 41 percent falling from 61,900 during the 2008/2009 cruise year
to 36,800 during the 2011/2012 cruise year. Total direct cruise tourism expenditures declined by 26 percent
over the three year period, falling from $2.7 million to $2.0 million. As indicated in Table 90, expenditures
by cruise lines, passengers and crew declined.
Table 90 – Comparison of Cruise Tourism Impacts, Current Study versus 2009 Study - Nicaragua
Current
Study 2009
Study Percent Change
Total Onshore Visits (Thousands) 36.8 61.9 -40.5%
Passengers 31.3 52.3 -40.2%
Crew 5.5 9.6 -42.7%
Total Direct Expenditures ($US Millions) $ 2.0 $ 2.7 -25.9%
Passengers $ 1.4 $ 1.9 -26.3%
Crew $ 0.2 $ 0.3 -33.3%
Cruise Lines $ 0.3 $ 0.5 -40.0%
Average Per Passenger Expenditure $45.64 $35.63 +28.1% Average Per Crew Expenditure $43.50 $29.96 +45.2%
Total Employment Impact 111 141 -21.2%
Total Wage Impact ($US Millions) $ 0.3 $ 0.4 -25.0%
The 26 percent decrease in passenger expenditures was the net result of the 40 percent decline in
passenger visits which was partially offset by the 28 percent increase in average passenger expenditures.
The increase in average passenger expenditures was primarily the result of the increase in average
passenger expenditures for shore excursions. During the 2011/2012 cruise year cruise passengers spent an
average of about $40 for their shore tours. This increased to about $62 during the 2011/2012 cruise year.
Spending in most of the remaining categories was similar in both years.
The 33 percent decline in crew expenditures was the net result of the 43 percent decline in crew visits
which was partially offset by the 45 percent increase in average crew expenditures. The increase in the
average expenditures for crew was concentrated in the expenditures for food and beverages and other
unspecified purchases. The increase spending in these two categories was only partially offset by a general
decline in crew spending in the remaining categories.
As a result of the 26 decline in direct cruise tourism expenditures from the 2008/2009 cruise year, the
economic impacts fell as well. The total employment and wage impacts decreased by 21 and 25 percent,
respectively, during the three-year period.

Florida-Caribbean Cruise Assn. Economic Impact of Cruise Tourism
Business Research and Economic Advisors Page 135
Passenger Surveys
A total of 1,099 passenger surveys were completed and returned for tabulation. Table 91
shows the major attributes of passenger visits in Nicaragua as derived from the passenger
surveys.
Table 91 - Major Attributes of Transit Passenger Surveys - Nicaragua
Number Percent
Total Respondents 1,099
Number Making First Visit 1,000 91.0%
Number Ashore 1,009 91.8%
Number Making Onshore Purchases: 670 66.4%
Average Hours Ashore 4.3
Average Size of Expenditure Party (Persons) 2.0
Average Onshore Expenditure per Party $29.40
Purchased a Shore Excursion (Tour) 654 64.8%
Purchased Onshore Tour from:
Cruise Line 586 89.6%
Onshore from Tour Operator 25 3.8%
Travel Agent 43 6.6%
Average Cost of Shore Excursion per Party $113
Toured On Own/Did not Tour 355
Of the 1,099 cruise parties that completed the surveys 91% stated that this had
been their first visit to Nicaragua. This is down from 96% in the 2009 study.
Ninety-two percent (92%) of the cruise parties that completed the surveys
disembarked their cruise ship to visit Nicaragua.
Of the cruise parties that went ashore, 66% made at least one purchase while
ashore. This is a small decline from 69% during the 2008/2009 cruise year. The
typical cruise party consisted of 2.0 passengers that spent an average of 4.3 hours
ashore.
The responding cruise parties reported spending an average of $29.40 while ashore
(excludes shore excursions) which essentially unchanged from the 2008/2009 cruise
year.
Sixty-five percent (65%) of the passengers that went ashore purchased a shore
excursion. This is up from 59% in the 2009 study. Ninety percent (90%) of
passengers who purchased a tour did so through their cruise line, 4% purchased
their tour onshore and 6 percent purchased their tour through their travel agent.
The typical cruise party that purchased a shore excursion spent $113 for their tour.
This is a 4 percent decline from $118 during the 2008/2009 cruise year.

Florida-Caribbean Cruise Assn. Economic Impact of Cruise Tourism
Business Research and Economic Advisors Page 136
Passenger Satisfaction
The passenger survey also asked the passengers to rate their satisfaction with their destination
visit along a number of parameters, as shown in Table 92. A 10-point scale was used with 10
being the highest score, i.e., extremely satisfied, and 1 being the lowest score, i.e., not at all
satisfied.
Table 92 – Passenger Visit Satisfaction* - Nicaragua
Visit Attributes
Mean Score
Current Study
2009 Study
Overall Visit 6.6 6.5
Visit Met Expectations 6.3 6.2
Likelihood of a Return Visit 2.6 2.7
Informed of Tours and Activities 7.6 7.1
Initial Shoreside Welcome 7.3 7.3
Guided Tour 8.2 7.2
Historic Sites/Museums 6.8 6.2
Variety of Things to See and Do 5.7 5.1
Friendliness of Residents 7.3 7.5
Overall Shopping Experience 5.8 5.6
Courtesy of Employees 7.6 7.7
Variety of Shops 5.4 4.8
Overall Prices 6.8 6.7
Taxis/Local Transportation 6.3 6.8
* Scale is 1 to 10 with 10 being the highest score. The mean scores can be interpreted as follows:
Extremely Satisfied: 10-9; Very Satisfied: 8-7; Somewhat Satisfied: 6-5; Not Too Satisfied: 4-3;
Not At All Satisfied: 2-1.
Among other key conclusions concerning visit satisfaction were the following:
Cruise passengers were only somewhat satisfied with their overall visit to Nicaragua
with a mean score of 6.6. Nor did the visit score as high in terms of meeting
expectations. The mean score for “Visit Met Expectations” was lower at 6.3.
While the satisfaction score for the overall visit was unchanged, the scores for most
of the individual aspects of passenger visits increased slightly.
Passengers felt very informed about tours and onshore activities in Nicaragua with a
mean score of 7.6.
Cruise passengers were very satisfied with their shore excursions. “Guided Tours”
(or Shore Excursions) received a mean score of 8.2.
Passengers were very satisfied with their interactions with residents and store
employees with “friendliness of residents” receiving a mean score of 7.3 and
“courtesy of employees” having a mean score of 7.6.
Cruise passengers were also very satisfied with their initial shoreside welcome
which received a mean score of 7.3.

Florida-Caribbean Cruise Assn. Economic Impact of Cruise Tourism
Business Research and Economic Advisors Page 137
Categories with average scores between 5.0 and 7.0 (Somewhat Satisfied) were
given for historic sites, variety of things to see and do, local transpor tation and the
overall shopping experience, including the variety of shops and overall prices. Thus,
while passengers thought shop employees were very courteous, the overall score for
their shopping experience was considered to be only somewhat satisfactory due to
even lower scores for the variety of shops (5.4) and overall prices (6.8).
Cruise passengers stated that they were not at all likely to return to Nicaragua for a
land-based vacation.
Passenger Demographics
Residents of the United States and the Canada accounted for 88 percent of the responding
passengers. The average age of the respondents was 66 years with 67 percent of the
respondents being 65 years of age or older. Nicaragua passengers had an average household
income of $96,700 with 32 percent having over $100,000 in household income.
Figure 59 – Passenger Age
Nicaragua
Under 151%
15 - 240%
25 - 442%
45 - 6430%
Over 6467%
Figure 60 – Passenger Household Income
Nicaragua
Under $50,00019%
$50,000 to $75,000
30%$75,000 to $100,000
19%
$100,000 to $150,000
17%
$150,000 to $200,000
7%
$200,000 or more
8%

Florida-Caribbean Cruise Assn. Economic Impact of Cruise Tourism
Business Research and Economic Advisors Page 138
Puerto Rico
At the core of the analysis of the economic contribution of cruise tourism were a set of
passenger and crew surveys that were conducted onboard ships of the FCCA member cruise
lines.74 The surveys were undertaken during the six-month period beginning in December 2011
and ending in May 2012. The survey schedule was designed so that surveys were conducted by
FCCA member cruise lines that called at each destination and that the distribution of passenger
and crew surveys would reflect the distribution of passenger and crew arrivals by cruise line at
each destination. On any given cruise itinerary, passenger and crew surveys were placed in all
passenger cabins and crew quarters following a single destination call. The surveys were
completed by the passengers and crew in the privacy of their quarters and returned to a
designated office on the cruise ship. Thus, passengers and crew were only surveyed once during
a cruise itinerary and for a single destination. On a subsequent itinerary, passengers were
surveyed following a call at a different dest ination.
The passenger and crew surveys were designed to collect data for onshore spending and visit
satisfaction by both passengers and crew. While the crew survey was slightly shorter than the
passenger survey, both surveys were designed to collect the following information:
hours spent ashore;
expenditures by category, including shore tours, food & beverages, clothing, etc.;
visit satisfaction, including shore tour, friendliness of residents, prices, shopping,
etc.;
likelihood of returning for a land-based vacation; and
demographic characteristics, including country of residence, age group, income, etc.
Combining the expenditure data collected from the passenger and crew surveys with data on
expenditures by cruise lines for port fees and services, payments to local tour operators for
passenger shore excursions purchased onboard the cruise ships, and other provisions purchased
locally by the cruise lines, estimates of total cruise tourism expenditures were developed for
each participating destination.
Given the direct spending estimates, the economic contribution of these expenditures, as
measured by employment and wage income were then estimated for each de stination. This
process began with the collection of economic data for each destination from a combination of
local, regional and international sources. Utilizing all of these data a set of economic impact
models were developed for each destination to estimate the direct and total employment and
wage impacts. A more detailed description of these models is provided in the Data and
Methods section of Volume I.
74 Surveys were conducted on the ships of the following cruise lines: Carnival Cruise Lines, Celebrity Cruises, Disney Cruise Line, Holland America Line, Norwegian Cruise Line, Princess Cruises, P&O Cruises and Royal Caribbean International.
Florida-Caribbean Cruise Assn. Economic Impact of Cruise Tourism
Business Research and Economic Advisors Page 139
Cruise Tourism Expenditures
Cruise tourism expenditures in destination ports are composed of a broad range of spending
including:
onshore expenditures by passengers which tend to be concentrated in shore excursions
and retail purchases of clothing, jewelry and local crafts and souvenirs;
onshore expenditures by crew which are generally concentrated in purchases of food
and beverages, local transportation and retail purchases of clothing and electronics ;
expenditures by cruise l ines for port services, such as dockage fees and linesmen,
utilities, such as water and power and navigation services; and
purchases of supplies, such as food and other stores, by the cruise lines from local
businesses.
According to data provided by the Puerto Rico Tourism Company, a total of 1.17 million cruise
passengers arrived in Puerto Rico during the 2011/2012 cruise year.75 These included 685,628
transit passengers and 491,109 passengers embarking on their cruises in Puerto Rico. Of the
transit passengers, an estimated 621,179 passengers (91 percent) disembarked and visited
Puerto Rico. Utilizing additional data provided by the visiting cruise lines, we have estimated
that 473,694 crew were aboard the cruise ships that sailed to and from Puerto Rico and that 39
percent, or 185,306 crew, disembarked and visited the island. These passenger and crew vi sits
along with additional expenditures by the cruise lines generated a total of $186.6 million
($US) in cruise tourism expenditures in Puerto Rico during the 2011/2012 cruise year. The
contribution of expenditures by passengers, crew and cruise lines to this total is discussed
below.
Passenger expenditures were estimated separately for transit and homeport passengers. Per
passenger spending estimates for transit passengers were derived from the 1,587 surveys
completed by passengers that went ashore during the survey period. As shown in Table 93,
each passenger cruise party spent an average of $162.13 in Puerto Rico. The average spend per
cruise party is the sum of the weighted spending in each of the twelve categories. For example,
50 percent of the survey respondents reported spending an average of $32.00 at local
restaurants and/or bars. Spread over the cruise parties that visited Puerto Rico, this represents
an average of $16.00 per party. On a per passenger basis, the average total expenditure was
$70.49. This represents the sum of per party expenditures, $162.13, divided by the average size
of a cruise party in Puerto Rico, 2.3 passengers.
Transit cruise passenger expenditures in Puerto Rico were concentrated in four categories which
accounted for 73 percent of their onshore expenditures: watches and jewelry, shore excursions,
clothing and food and beverages. Forty percent (40%) or more of the passengers that went
ashore made purchases in the following categories: food and beverages, shore excursions, local
crafts and clothing.
75 The 2011/2012 cruise year includes the twelve months beginning in May, 2011 and ending in April, 2012.

Florida-Caribbean Cruise Assn. Economic Impact of Cruise Tourism
Business Research and Economic Advisors Page 140
Forty-nine percent (49%) of the passengers reported that their cruise party purchased a shore
excursion. The effective local price of the shore excursion was $58.00 per party but when the
full price of the purchase from cruise lines and travel agents is included passengers spent an
average of $87.10 per party for their tours.
For the entire 2011/2012 cruise year, the estimated 621,179 transit cruise passengers who
visited Puerto Rico spent a total of $43.8 million ($US) on the island.
Table 93 – Estimated Transit Passenger Spending ($US) in Puerto Rico, 2011/2012 Cruise
Year76
Purchase Categories Average Spend
per Party Share of All
Onshore Visits
Weighted Average Spend
per Party
F&B at Restaurants & Bars $ 32.00 50.0% $ 16.00
Shore Excursions $ 58.00 48.9% $ 28.33
Local Crafts & Souvenirs $ 30.00 43.2% $ 12.97
Clothing $ 56.10 40.7% $ 22.84
Other Purchases $ 75.00 24.4% $ 18.30
Watches & Jewelry $ 302.60 16.9% $ 51.10
Taxis/Ground Transportation $ 69.10 9.5% $ 6.55
Retail Purchases of Liquor $ 32.80 9.3% $ 3.05
Perfumes & Cosmetics $ 43.70 3.8% $ 1.64
Entertainment/Night Clubs/Casinos $ 44.70 2.4% $ 1.09
Telephone & Internet $ 9.00 1.8% $ 0.16
Electronics $ 26.70 0.4% $ 0.10
Total Spend per Cruise Party $162.13
Average Size of a Cruise Party 2.3
Total Spend per Cruise Passenger $70.49
Cruise Passenger Visits 621,179
Total Cruise Passenger Expenditures $43,789,051
As noted above another 491,109 cruise passengers arrived in Puerto Rico to begin their cruise in
the Caribbean. These embarking passengers were also surveyed using a slightly different survey
instrument. Per passenger spending estimates for homeport passengers were derived from the
surveys completed by passengers that embarked on their cruises from Puerto Rico during the
survey period. The survey data showed that approximately 45 percent of the cruise parties
stayed in Puerto Rico for at least one night prior to or after their cruise. This stay averaged
about 1.9 nights.
As shown in Table 94, each passenger cruise party spent an average of $410.20 in Puerto Rico
during their pre- and/or post cruise stay. The calculation of this figure is identical to that
calculated for transit passengers as discussed above. On a per passenger basis, the average
total expenditure was $178.35. Thus, the typical cruise passenger who stayed one or more
nights in Puerto Rico spent an average of $93.87 per day ($178.35 ÷ 1.9 nights)
76 The average shore excursion expenditure is a weighted average of the onshore and Internet purchases and the portion of the onboard purchases paid to local tour operators.

Florida-Caribbean Cruise Assn. Economic Impact of Cruise Tourism
Business Research and Economic Advisors Page 141
Homeport cruise passenger expenditures in Puerto Rico were concentrated in three categories
which accounted for 68 percent of their onshore expenditures: lodging, food and beverages and
ground transportation. Nearly half or more of the homeport passengers made purchases in the
same three categories.
For the entire 2011/2012 cruise year, the estimated 491,109 homeport cruise passengers who
visited Puerto Rico spent a total of $87.6 million ($US) on the island.
Table 94 – Estimated Homeport Passenger Spending ($US) in Puerto Rico, 2011/2012
Cruise Year77
Purchase Categories Average Spend
per Party Share of All
Onshore Visits
Weighted Average Spend
per Party
F&B at Restaurants & Bars $ 120.90 49.8% $ 60.17
Taxis/Ground Transportation $ 58.10 47.5% $ 27.58
Lodging $ 429.80 45.0% $ 193.41
Other Purchases $ 668.90 12.4% $ 83.23
Retail Purchases of Liquor $ 48.50 14.3% $ 6.93
Shore Excursions $ 129.80 12.2% $ 15.87
Clothing $ 113.00 11.1% $ 12.50
Local Crafts & Souvenirs $ 36.20 7.4% $ 2.67
Entertainment/Night Clubs/Casinos $ 66.40 4.6% $ 3.06
Watches & Jewelry $ 83.20 4.1% $ 3.45
Perfumes & Cosmetics $ 49.90 2.3% $ 1.15
Telephone & Internet $ 19.50 0.9% $ 0.18
Total Spend per Cruise Party $410.20
Average Size of a Cruise Party 2.3
Total Spend per Cruise Passenger $178.35
Cruise Passenger Visits 491,109
Total Cruise Passenger Expenditures $87,588,223
Per crew spending estimates were derived from the surveys completed by crew members during
the survey period. As shown in Table 95, each crew member spent an average of $122.20 in
Puerto Rico. The average spend per crew member is the sum of the weighted spending in each
of the twelve categories. For example, 65 percent of the survey respondents reported spending
an average of $22.40 for food and beverages. Spread over all crew members that visited Puerto
Rico, this represents an average of $14.50 per crew member.
Expenditures by crew in Puerto Rico were concentrated in three categories which accounted for
nearly 80 percent of their onshore expenditures: clothing, food and beverages and other
(unspecified) purchases. Combined, crew spent an average of $97.44 for goods in these three
categories. Purchases of food and beverages were the most popular expenditure item with 65%
percent of the crew reporting the purchase of food and beverages.
For the entire 2011/2012 cruise year, the estimated 185,306 crew who visited Puerto Rico spent
an estimated total of $22.6 million ($US).
77 The average shore excursion expenditure is a weighted average of the onshore and Internet purchases and the portion of the onboard purchases paid to local tour operators.
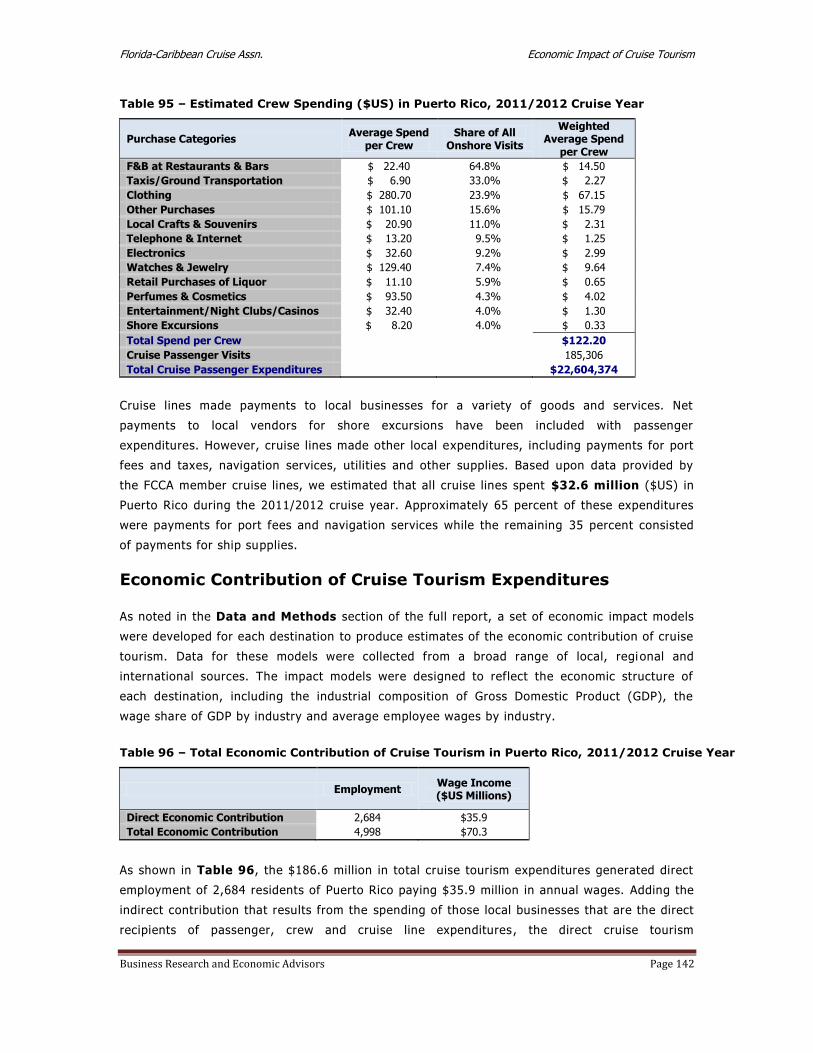
Florida-Caribbean Cruise Assn. Economic Impact of Cruise Tourism
Business Research and Economic Advisors Page 142
Table 95 – Estimated Crew Spending ($US) in Puerto Rico, 2011/2012 Cruise Year
Purchase Categories Average Spend
per Crew Share of All
Onshore Visits
Weighted Average Spend
per Crew
F&B at Restaurants & Bars $ 22.40 64.8% $ 14.50
Taxis/Ground Transportation $ 6.90 33.0% $ 2.27
Clothing $ 280.70 23.9% $ 67.15
Other Purchases $ 101.10 15.6% $ 15.79
Local Crafts & Souvenirs $ 20.90 11.0% $ 2.31
Telephone & Internet $ 13.20 9.5% $ 1.25
Electronics $ 32.60 9.2% $ 2.99
Watches & Jewelry $ 129.40 7.4% $ 9.64
Retail Purchases of Liquor $ 11.10 5.9% $ 0.65
Perfumes & Cosmetics $ 93.50 4.3% $ 4.02
Entertainment/Night Clubs/Casinos $ 32.40 4.0% $ 1.30
Shore Excursions $ 8.20 4.0% $ 0.33
Total Spend per Crew $122.20
Cruise Passenger Visits 185,306
Total Cruise Passenger Expenditures $22,604,374
Cruise lines made payments to local businesses for a variety of goods and services. Net
payments to local vendors for shore excursions have been included with passenger
expenditures. However, cruise lines made other local expenditures, including payments for port
fees and taxes, navigation services, utilities and other supplies. Based upon data provided by
the FCCA member cruise lines, we estimated that all cruise lines spent $32.6 million ($US) in
Puerto Rico during the 2011/2012 cruise year. Approximately 65 percent of these expenditures
were payments for port fees and navigation services while the remaining 35 percent consisted
of payments for ship supplies.
Economic Contribution of Cruise Tourism Expenditures
As noted in the Data and Methods section of the full report, a set of economic impact models
were developed for each destination to produce estimates of the economic contribution of cruise
tourism. Data for these models were collected from a broad range of local, regional and
international sources. The impact models were designed to reflect the economic structure of
each destination, including the industrial composition of Gross Domestic Product (GDP), the
wage share of GDP by industry and average employee wages by industry.
Table 96 – Total Economic Contribution of Cruise Tourism in Puerto Rico, 2011/2012 Cruise Year
Employment Wage Income ($US Millions)
Direct Economic Contribution 2,684 $35.9
Total Economic Contribution 4,998 $70.3
As shown in Table 96, the $186.6 million in total cruise tourism expenditures generated direct
employment of 2,684 residents of Puerto Rico paying $35.9 million in annual wages. Adding the
indirect contribution that results from the spending of those local businesses that are the direct
recipients of passenger, crew and cruise line expenditures , the direct cruise tourism

Florida-Caribbean Cruise Assn. Economic Impact of Cruise Tourism
Business Research and Economic Advisors Page 143
expenditures generated a total employment contribution of 4,998 jobs and $70.3 million in wage
income in Puerto Rico during the 2011/2012 cruise year.
Figure 61 – Total Employment Impacts by
Sector - Puerto Rico
Manuf. &
Construction2%
Commercial
Services80%
Transport &
Utilities5%
Business &
Financial Services
2%
Community
Services & Government
11%
Figure 62 – Total Wage Impacts by Sector
Puerto Rico
Manuf. &
Construction2%
Commercial
Services72%
Transport &
Utilities9%
Business &
Financial Services
3%
Community
Services & Government
14%
As shown in Figures 61 and 62, the total employment and wage impacts of cruise tourism are
concentrated in the commercial and transport sectors which account for more than 80 percent
of the employment and wage impacts.78 This is not surprising since the direct impacts account
for more than half of the total employment impacts and that virtually all of the cruise tourism
expenditures are made with businesses in these sectors. Because of the relatively lower wages
in the commercial sector compared to the other sectors of the economy, the commercial sector
accounts for 80 percent of the employment impacts but only 72 percent of the wage impacts.
The remainder of the total employment and wage impacts was generated by the indirect
spending in the other sectors of the economy.
Comparison to 2009 Study
Total passenger and crew visits declined by 7 percent, falling from 1.39 million during the 2008/2009 cruise
year to 1.3 million during the 2011/2012 cruise year. However, total direct cruise tourism expenditures
actually increased by 2.4 percent over the three year period, increasing from an estimated $182.3 million
during the 2008/2009 cruise year to $186.6 million during the 2011/2012 cruise year. As indicated in Table
97, cruise tourism expenditures by passengers increased while spending by the cruise lines and their crew
decreased.79
The 11 percent increase in passenger expenditures is the net result of a the 6 percent decline in passenger
visits which was offset by the 18 percent increase in average passenger expenditures. The increase in
average passenger spending resulted from an increase in the average spending by both transit and
78 The industry sectors include the following activities:
Manufacturing & Construction: residential and nonresidential construction and all manufacturing Commercial Services: wholesale and retail trade, lodging and eating and drinking establishments Transportation & Utilities: tour operators, port services, telecommunications and water and power utilities Business & Financial Services: banking, insurance, legal, accounting, leasing and other business services Community Services & Government: education, health and social services and government agencies
79 These figures do not include spending for fuel.
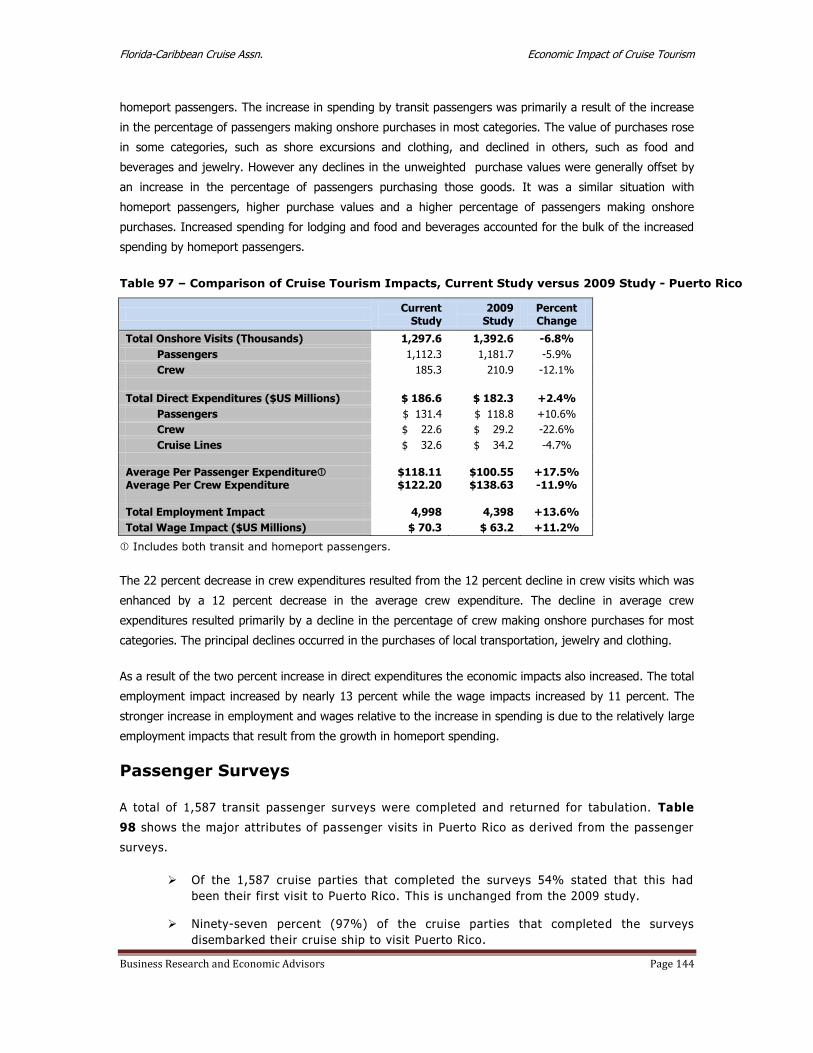
Florida-Caribbean Cruise Assn. Economic Impact of Cruise Tourism
Business Research and Economic Advisors Page 144
homeport passengers. The increase in spending by transit passengers was primarily a result of the increase
in the percentage of passengers making onshore purchases in most categories. The value of purchases rose
in some categories, such as shore excursions and clothing, and declined in others, such as food and
beverages and jewelry. However any declines in the unweighted purchase values were generally offset by
an increase in the percentage of passengers purchasing those goods. It was a similar situation with
homeport passengers, higher purchase values and a higher percentage of passengers making onshore
purchases. Increased spending for lodging and food and beverages accounted for the bulk of the increased
spending by homeport passengers.
Table 97 – Comparison of Cruise Tourism Impacts, Current Study versus 2009 Study - Puerto Rico
Current
Study 2009
Study Percent Change
Total Onshore Visits (Thousands) 1,297.6 1,392.6 -6.8%
Passengers 1,112.3 1,181.7 -5.9%
Crew 185.3 210.9 -12.1%
Total Direct Expenditures ($US Millions) $ 186.6 $ 182.3 +2.4%
Passengers $ 131.4 $ 118.8 +10.6%
Crew $ 22.6 $ 29.2 -22.6%
Cruise Lines $ 32.6 $ 34.2 -4.7%
Average Per Passenger Expenditure $118.11 $100.55 +17.5% Average Per Crew Expenditure $122.20 $138.63 -11.9%
Total Employment Impact 4,998 4,398 +13.6%
Total Wage Impact ($US Millions) $ 70.3 $ 63.2 +11.2%
Includes both transit and homeport passengers.
The 22 percent decrease in crew expenditures resulted from the 12 percent decline in crew visits which was
enhanced by a 12 percent decrease in the average crew expenditure. The decline in average crew
expenditures resulted primarily by a decline in the percentage of crew making onshore purchases for most
categories. The principal declines occurred in the purchases of local transportation, jewelry and clothing.
As a result of the two percent increase in direct expenditures the economic impacts also increased. The total
employment impact increased by nearly 13 percent while the wage impacts increased by 11 percent. The
stronger increase in employment and wages relative to the increase in spending is due to the relatively large
employment impacts that result from the growth in homeport spending.
Passenger Surveys
A total of 1,587 transit passenger surveys were completed and returned for tabulation. Table
98 shows the major attributes of passenger visits in Puerto Rico as derived from the passenger
surveys.
Of the 1,587 cruise parties that completed the surveys 54% stated that this had
been their first visit to Puerto Rico. This is unchanged from the 2009 study.
Ninety-seven percent (97%) of the cruise parties that completed the surveys
disembarked their cruise ship to visit Puerto Rico.
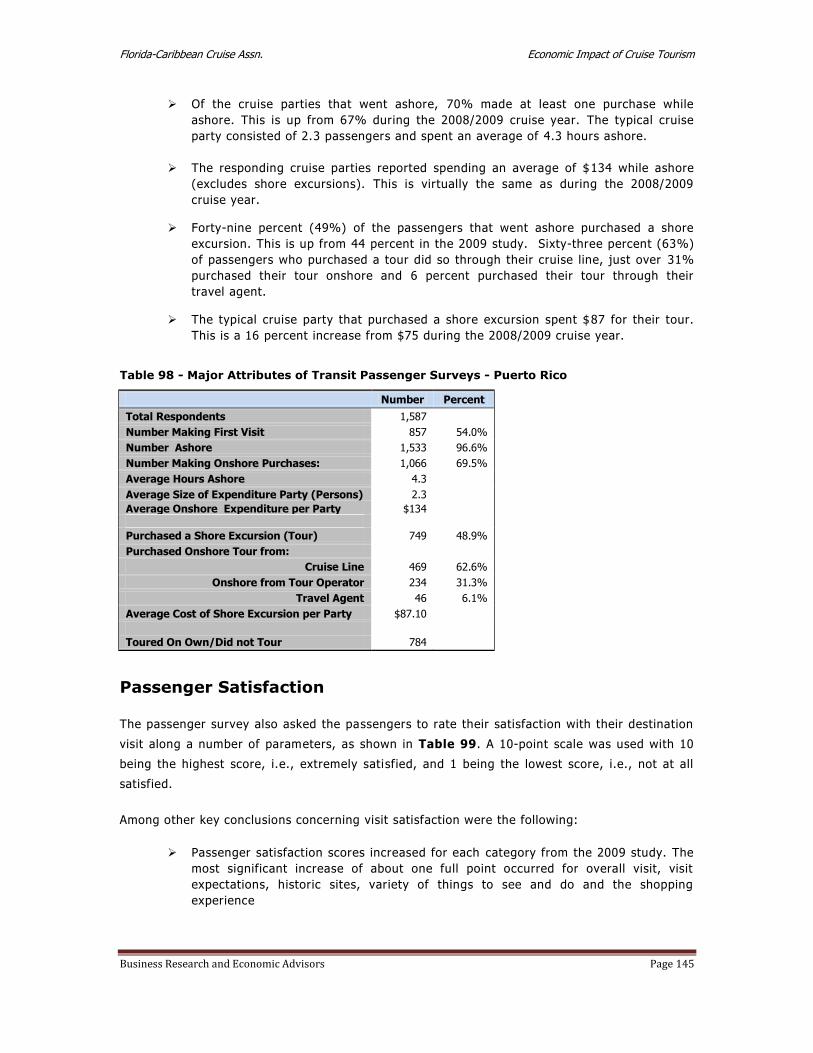
Florida-Caribbean Cruise Assn. Economic Impact of Cruise Tourism
Business Research and Economic Advisors Page 145
Of the cruise parties that went ashore, 70% made at least one purchase while
ashore. This is up from 67% during the 2008/2009 cruise year. The typical cruise
party consisted of 2.3 passengers and spent an average of 4.3 hours ashore.
The responding cruise parties reported spending an average of $134 while ashore
(excludes shore excursions). This is virtually the same as during the 2008/2009
cruise year.
Forty-nine percent (49%) of the passengers that went ashore purchased a shore
excursion. This is up from 44 percent in the 2009 study. Sixty-three percent (63%)
of passengers who purchased a tour did so through their cruise line, just over 31%
purchased their tour onshore and 6 percent purchased their tour through their
travel agent.
The typical cruise party that purchased a shore excursion spent $87 for their tour.
This is a 16 percent increase from $75 during the 2008/2009 cruise year.
Table 98 - Major Attributes of Transit Passenger Surveys - Puerto Rico
Number Percent
Total Respondents 1,587
Number Making First Visit 857 54.0%
Number Ashore 1,533 96.6%
Number Making Onshore Purchases: 1,066 69.5%
Average Hours Ashore 4.3
Average Size of Expenditure Party (Persons) 2.3
Average Onshore Expenditure per Party $134
Purchased a Shore Excursion (Tour) 749 48.9%
Purchased Onshore Tour from:
Cruise Line 469 62.6%
Onshore from Tour Operator 234 31.3%
Travel Agent 46 6.1%
Average Cost of Shore Excursion per Party $87.10
Toured On Own/Did not Tour 784
Passenger Satisfaction
The passenger survey also asked the passengers to rate their satisfaction with their destination
visit along a number of parameters, as shown in Table 99. A 10-point scale was used with 10
being the highest score, i.e., extremely satisfied, and 1 being the lowest score, i.e., not at all
satisfied.
Among other key conclusions concerning visit satisfaction were the following:
Passenger satisfaction scores increased for each category from the 2009 study. The
most significant increase of about one full point occurred for overall visit, visit
expectations, historic sites, variety of things to see and do and the shopping
experience
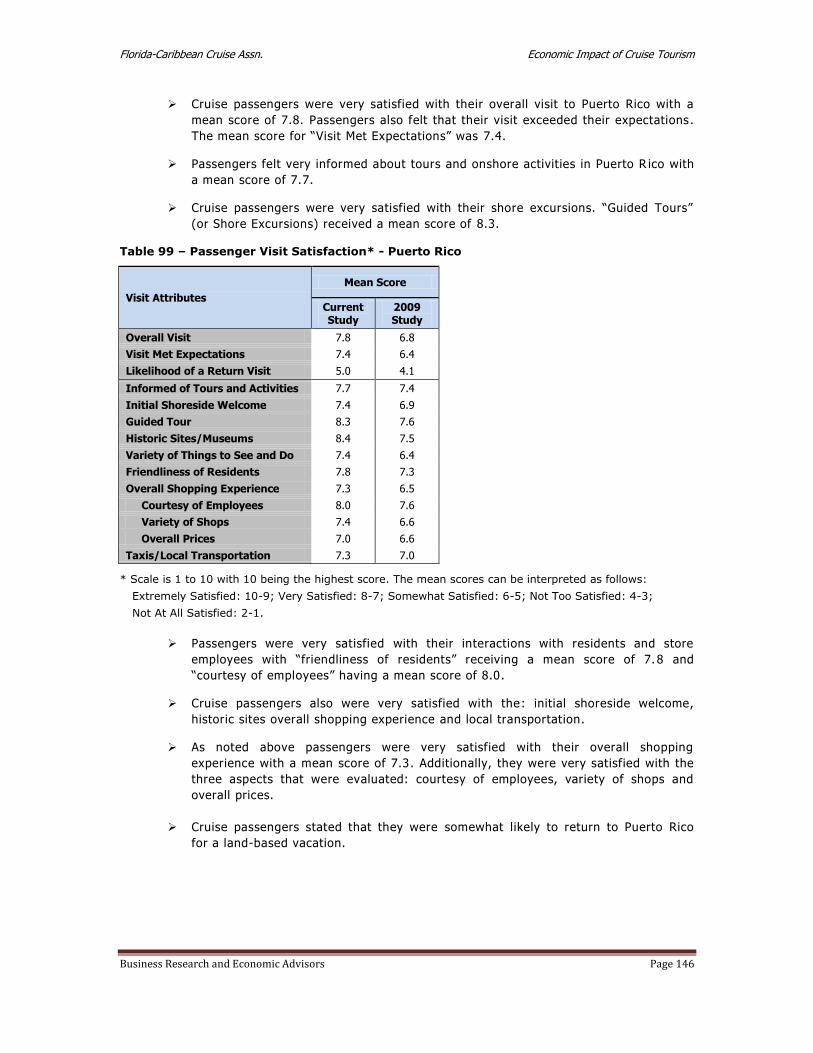
Florida-Caribbean Cruise Assn. Economic Impact of Cruise Tourism
Business Research and Economic Advisors Page 146
Cruise passengers were very satisfied with their overall visit to Puerto Rico with a
mean score of 7.8. Passengers also felt that their visit exceeded their expectations .
The mean score for “Visit Met Expectations” was 7.4.
Passengers felt very informed about tours and onshore activities in Puerto R ico with
a mean score of 7.7.
Cruise passengers were very satisfied with their shore excursions. “Guided Tours”
(or Shore Excursions) received a mean score of 8.3.
Table 99 – Passenger Visit Satisfaction* - Puerto Rico
Visit Attributes
Mean Score
Current Study
2009 Study
Overall Visit 7.8 6.8
Visit Met Expectations 7.4 6.4
Likelihood of a Return Visit 5.0 4.1
Informed of Tours and Activities 7.7 7.4
Initial Shoreside Welcome 7.4 6.9
Guided Tour 8.3 7.6
Historic Sites/Museums 8.4 7.5
Variety of Things to See and Do 7.4 6.4
Friendliness of Residents 7.8 7.3
Overall Shopping Experience 7.3 6.5
Courtesy of Employees 8.0 7.6
Variety of Shops 7.4 6.6
Overall Prices 7.0 6.6
Taxis/Local Transportation 7.3 7.0
* Scale is 1 to 10 with 10 being the highest score. The mean scores can be interpreted as follows:
Extremely Satisfied: 10-9; Very Satisfied: 8-7; Somewhat Satisfied: 6-5; Not Too Satisfied: 4-3;
Not At All Satisfied: 2-1.
Passengers were very satisfied with their interactions with residents and store
employees with “friendliness of residents” receiving a mean score of 7.8 and
“courtesy of employees” having a mean score of 8.0.
Cruise passengers also were very satisfied with the: initial shoreside welcome,
historic sites overall shopping experience and local transportation.
As noted above passengers were very satisfied with their overall shopping
experience with a mean score of 7.3. Additionally, they were very satisfied with the
three aspects that were evaluated: courtesy of employees, variety of shops and
overall prices.
Cruise passengers stated that they were somewhat likely to return to Puerto Rico
for a land-based vacation.

Florida-Caribbean Cruise Assn. Economic Impact of Cruise Tourism
Business Research and Economic Advisors Page 147
Passenger Demographics
Residents of the United States and the Canada accounted for 94 percent of the responding
passengers. The average age of the respondents was 55 years with 35 percent of the
respondents being 65 years of age or older. Puerto Rico passengers had an average household
income of $100,100 with 36 percent having over $100,000 in household income.
Figure 63 – Passenger Age
Puerto Rico
Under 154%
15 - 245%
25 - 4412%
45 - 6444%
Over 6435%
Figure 64 – Passenger Household Income
Puerto Rico
Under $50,00016%
$50,000 to $75,000
30%$75,000 to $100,000
18%
$100,000 to $150,000
19%
$150,000 to $200,000
10%
$200,000 or more
7%
Florida-Caribbean Cruise Assn. Economic Impact of Cruise Tourism
Business Research and Economic Advisors Page 148
St. Kitts and Nevis
At the core of the analysis of the economic contribution of cruise tourism were a set of
passenger and crew surveys that were conducted onboard ships of the FCCA member cruise
lines.80 The surveys were undertaken during the six-month period beginning in December 2011
and ending in May 2012. The survey schedule was designed so that surveys were conducted by
FCCA member cruise lines that called at each destination and that the distribution of passenger
and crew surveys would reflect the distribution of passenger and crew arrivals by cruise line at
each destination. On any given cruise itinerary, passenger and crew surveys were placed in all
passenger cabins and crew quarters following a single destination call. The surveys were
completed by the passengers and crew in the privacy of their quarters and returned to a
designated office on the cruise ship. Thus, passengers and crew were only surveyed once during
a cruise itinerary and for a single destination. On a subsequent itinerary, passengers were
surveyed following a call at a different dest ination.
The passenger and crew surveys were designed to collect data for onshore spending and visit
satisfaction by both passengers and crew. While the crew survey was slightly shorter than the
passenger survey, both surveys were designed to collect the following information:
hours spent ashore;
expenditures by category, including shore tours, food & beverages, clothing, etc.;
visit satisfaction, including shore tour, friendliness of residents, prices, shopping,
etc.;
likelihood of returning for a land-based vacation; and
demographic characteristics, including country of residence, age group, income, etc.
Combining the expenditure data collected from the passenger and crew surveys with data on
expenditures by cruise lines for port fees and services, payments to local tour operat ors for
passenger shore excursions purchased onboard the cruise ships, and other provisions purchased
locally by the cruise lines, estimates of total cruise tourism expenditures were developed for
each participating destination.
Given the direct spending estimates, the economic contribution of these expenditures, as
measured by employment and wage income were then estimated for each de stination. This
process began with the collection of economic data for each destination from a combination of
local, regional and international sources. Utilizing all of these data a set of economic impact
models were developed for each destination to estimate the direct and total employment and
wage impacts. A more detailed description of these models is provided in the Data and
Methods section of Volume I.
80 Surveys were conducted on the ships of the following cruise lines: Carnival Cruise Lines, Celebrity Cruises, Disney Cruise Line, Holland America Line, Norwegian Cruise Line, Princess Cruises, P&O Cruises and Royal Caribbean International.

Florida-Caribbean Cruise Assn. Economic Impact of Cruise Tourism
Business Research and Economic Advisors Page 149
Cruise Tourism Expenditures
Cruise tourism expenditures in destination ports are composed of a broad range of spending
including:
onshore expenditures by passengers which tend to be concentrated in shore excursions
and retail purchases of clothing, jewelry and local crafts and souvenirs;
onshore expenditures by crew which are generally concentrated in purchases of food
and beverages, local transportation and retail purchases of clothing and electronics ;
expenditures by cruise lines for port services, such as dockage fees and linesmen,
utilities, such as water and power and navigation services; and
purchases of supplies, such as food and other stores, by the cruise lines from local
businesses.
According to data obtained from the St. Kitts Tourism Authority, an estimated 629,223 cruise
passengers arrived aboard cruise ships during the 2011/2012 cruise year.81 Of these, an
estimated 560,683 passengers (89 percent) disembarked and visited St. Kitts. Utilizing
additional data provided by the visiting cruise lines, we have est imated that 226,005 crew were
aboard the cruise ships and that 32 percent, or 71,344 crew, disembarked and visited St. Kitts.
These passenger and crew visits along with additional expenditures by the cruise lines
generated a total of $70.6 million ($US) in cruise tourism expenditures in St. Kitts during the
2011/2012 cruise year. The contribution of expenditures by passengers, crew and cruise lines to
this total is discussed below.
Table 100 – Estimated Passenger Spending ($US) in St. Kitts, 2011/2012 Cruise Year82
Purchase Categories Average Spend
per Party Share of All
Onshore Visits
Weighted Average Spend
per Party
Shore Excursions $ 102.70 59.4% $ 61.08
Clothing $ 60.10 55.9% $ 33.62
Local Crafts & Souvenirs $ 30.00 40.4% $ 12.13
F&B at Restaurants & Bars $ 22.80 39.3% $ 8.96
Watches & Jewelry $ 366.50 23.0% $ 84.14
Other Purchases $ 66.60 16.1% $ 10.75
Taxis/Ground Transportation $ 49.00 15.4% $ 7.55
Retail Purchases of Liquor $ 73.40 11.5% $ 8.43
Perfumes & Cosmetics $ 69.80 2.4% $ 1.66
Telephone & Internet $ 5.30 1.1% $ 0.06
Entertainment/Night Clubs/Casinos $ 30.10 0.9% $ 0.28
Electronics $ 9.70 0.2% $ 0.02
Total Spend per Cruise Party $228.68
Average Size of a Cruise Party 2.1
Total Spend per Cruise Passenger $108.90
Cruise Passenger Visits 560,638
Total Cruise Passenger Expenditures $61,051,681
81 The 2011/2012 cruise year includes the twelve months beginning in May, 2011 and ending in April, 2012. 82 The average shore excursion expenditure is a weighted average of the onshore and Internet purchases and the portion of the onboard purchases paid to local tour operators.

Florida-Caribbean Cruise Assn. Economic Impact of Cruise Tourism
Business Research and Economic Advisors Page 150
Per passenger spending estimates were derived from the 1,301 surveys completed by
passengers that went ashore during the survey period. As shown in Table 100, each passenger
cruise party spent an average of $228.68 in St. Kitts. The average spend per cruise party is the
sum of the weighted spending in each of the twelve categories. For example, 39 percent of the
survey respondents reported spending an average of $22.80 at local restaurants and/or bars.
Spread over the cruise parties that visited St. Kitts, this represents an average of $ 8.96 per
party. On a per passenger basis, the average total expenditure was $108.90. This represents
the sum of per party expenditures, $228.68, divided by the average size of a cruise party in St.
Kitts, 2.1 passengers.
Cruise passenger expenditures in St. Kit ts were concentrated in four categories which accounted
for nearly 85 percent of their onshore expenditures: watches and jewelry, shore excursions,
clothing and local crafts. Nearly 40 percent or more of the passengers that went ashore made
purchases of shore excursions, clothing, local crafts and food and beverages.
Fifty-nine percent (59%) of the passengers reported that their cruise party purchased a shore
excursion. The effective local price of the shore excursion was $103 per party but when the full
price of the purchase from cruise lines and travel agents is included passengers spent an
average of $137 per party for their tours.
For the entire 2011/2012 cruise year, the estimated 560,638 cruise passengers who visited St.
Kitts spent a total of $61.1 million ($US).
Table 101 – Estimated Crew Spending ($US) in St. Kitts, 2011/2012 Cruise Year
Purchase Categories Average Spend
per Crew Share of All
Onshore Visits
Weighted Average Spend
per Crew
F&B at Restaurants & Bars $ 29.10 69.7% $ 20.28
Taxis/Ground Transportation $ 15.80 19.9% $ 3.15
Local Crafts & Souvenirs $ 30.80 13.4% $ 4.13
Clothing $ 32.60 10.4% $ 3.39
Other Purchases $ 134.60 7.8% $ 10.49
Watches & Jewelry $ 186.80 5.6% $ 10.51
Entertainment/Night Clubs/Casinos $ 141.10 5.2% $ 7.33
Perfumes & Cosmetics $ 52.30 4.8% $ 2.49
Retail Purchases of Liquor $ 38.60 4.8% $ 1.84
Telephone & Internet $ 12.70 4.3% $ 0.55
Shore Excursions $ 22.40 3.0% $ 0.68
Electronics $ 12.30 1.3% $ 0.16
Total Spend per Crew $65.00
Cruise Passenger Visits 71,344
Total Cruise Passenger Expenditures $4,637,338
Per crew spending estimates were derived from the nearly700 surveys completed by crew
members during the survey period. As shown in Table 101, each crew member spent an
average of $65.00 in St. Kitts. The average spend per crew member is the sum of the weighted
spending in each of the twelve categories. For example, 70 percent of the survey respondents

Florida-Caribbean Cruise Assn. Economic Impact of Cruise Tourism
Business Research and Economic Advisors Page 151
reported spending an average of $29.10 for food and beverages. Spread over all the crew
members that visited St. Kitts, this represents an average of $20.28 per crew member.
Expenditures by crew in St. Kitts were concentrated in three categories which accounted for
nearly 65 percent of their onshore expenditures: food and beverages, watches and jewelry and
other (unspecified) purchases. Combined, crew spent an average of $41.28 for goods in these
three categories. Purchases of food and beverages were the most popular expenditure item with
70% percent of the crew reporting the purchase of food and beverages.
For the entire 2011/2012 cruise year, the estimated 71,344 crew who visited St. Kitts spent an
estimated total of $4.6 million ($US).
Cruise lines made payments to local businesses for a variety of goods and services. Net
payments to local vendors for shore excursions have been included with passenger
expenditures. However, cruise lines made other local expenditures, including payments for port
fees and taxes, navigation services, utilities and other supplies. Based upon data provided by
the FCCA member cruise lines, we estimated that all cruise lines spent $4.9 million ($US) in St.
Kitts during the 2011/2012 cruise year. Essentially all of these expenditures were payments for
port fees and taxes and navigation services.
Economic Contribution of Cruise Tourism Expenditures
As noted in the Data and Methods section of the full report, a set of economic impact models
were developed for each destination to produce estimates of the economic contribution of cruise
tourism. Data for these models were collected from a broad range of local, regional and
international sources. The impact models were designed to reflect the economic structure of
each destination, including the industrial composition of Gross Domestic Product (GDP), the
wage share of GDP by industry and average employee wages by industry.
Table 102 – Total Economic Contribution of Cruise Tourism in St. Kitts
2011/2012 Cruise Year
Employment Wage Income ($US Millions)
Direct Economic Contribution 712 $5.7
Total Economic Contribution 1,123 $9.1
As shown in Table 102, the $70.6 million in total cruise tourism expenditures generated direct
employment of 712 residents of St. Kitts paying $5.7 million in annual wages. Adding the
indirect contribution that results from the spending of those local businesses that are the direct
recipients of passenger, crew and cruise line expenditures , the direct cruise tourism
expenditures generated a total employment contribution of 1,123 jobs and $9.1 million in wage
income in St. Kitts during the 2011/2012 cruise year.
As shown in Figures 65 and 66, the total employment and wage impacts of cruise tourism are
concentrated in the commercial and transport sectors which account for about 98 percent of the
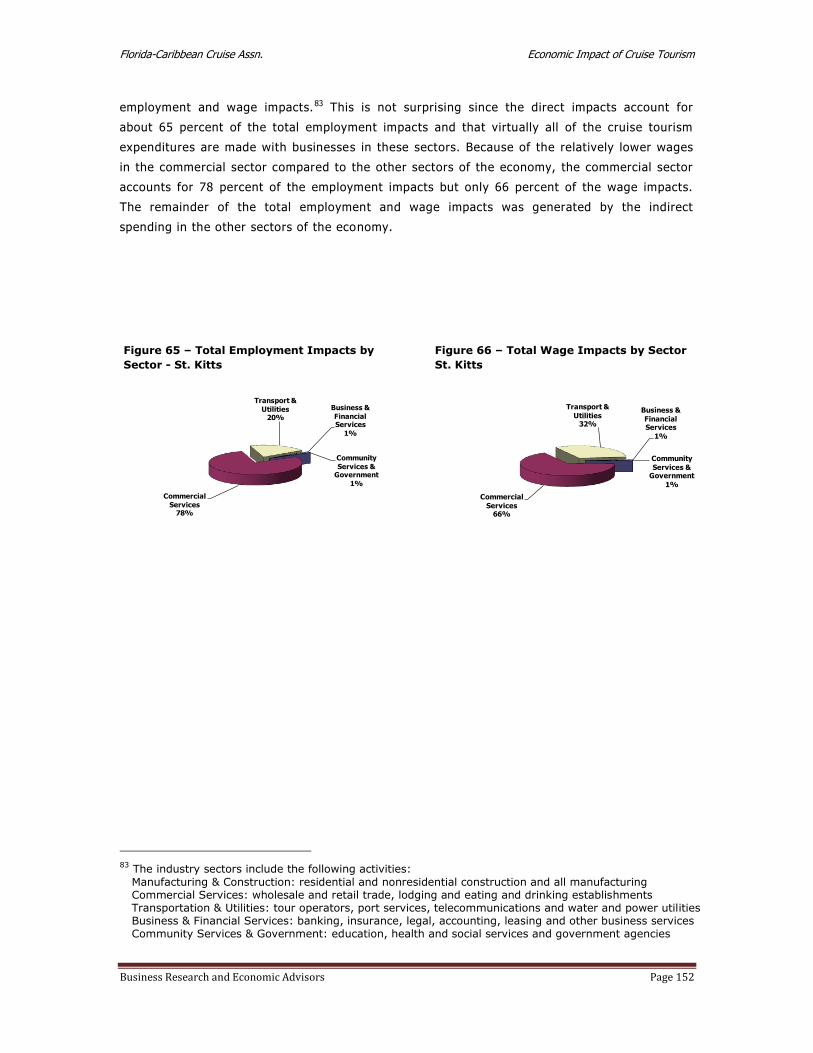
Florida-Caribbean Cruise Assn. Economic Impact of Cruise Tourism
Business Research and Economic Advisors Page 152
employment and wage impacts.83 This is not surprising since the direct impacts account for
about 65 percent of the total employment impacts and that virtually all of the cruise tourism
expenditures are made with businesses in these sectors. Because of the relatively lower wages
in the commercial sector compared to the other sectors of the economy, the commercial sector
accounts for 78 percent of the employment impacts but only 66 percent of the wage impacts.
The remainder of the total employment and wage impacts was generated by the indirect
spending in the other sectors of the economy.
83 The industry sectors include the following activities:
Manufacturing & Construction: residential and nonresidential construction and all manufacturing Commercial Services: wholesale and retail trade, lodging and eating and drinking establishments Transportation & Utilities: tour operators, port services, telecommunications and water and power utilities Business & Financial Services: banking, insurance, legal, accounting, leasing and other business services Community Services & Government: education, health and social services and government agencies
Figure 65 – Total Employment Impacts by
Sector - St. Kitts
Commercial
Services78%
Transport &
Utilities20%
Business &
Financial Services
1%
Community
Services & Government
1%
Figure 66 – Total Wage Impacts by Sector
St. Kitts
Commercial
Services66%
Transport &
Utilities32%
Business &
Financial Services
1%
Community
Services & Government
1%

Florida-Caribbean Cruise Assn. Economic Impact of Cruise Tourism
Business Research and Economic Advisors Page 153
Comparison to 2009 Study
Total estimated passenger and crew visits increased by 63 percent from 388,400 visits during the
2008/2009 cruise year to 631,900 during the 2011/2012 cruise year. Total direct expenditures in St. Kitts
increased similarly, growing by 61 percent from $44 million in the 2008/2009 cruise year to $70.6 million in
the 2011/2012 cruise year. As indicated in Table 111, cruise tourism expenditures by cruise lines and
passengers increased while they declined for crew.
Table 103 – Comparison of Cruise Tourism Impacts, Current Study versus 2009 Study - St. Kitts
Current
Study 2009
Study Percent Change
Total Onshore Visits (Thousands) 631.9 388.4 +62.7%
Passengers 560.6 333.9 +67.9%
Crew 71.3 54.5 +30.8%
Total Direct Expenditures ($US Millions) $ 70.6 $ 44.0 +60.5
Passengers $ 61.1 $ 33.2 +84.0%
Crew $ 4.6 $ 7.8 -41.0%
Cruise Lines $ 4.9 $ 3.0 63.3%
Average Per Passenger Expenditure $108.90 $ 99.41 +9.5% Average Per Crew Expenditure $ 65.00 $142.14 -54.3%
Total Employment Impact 1,123 756 +48.5%
Total Wage Impact ($US Millions) $ 9.1 $ 5.9 +54.2%
The 84 percent increase in passenger expenditures was the result of the 68 percent increase in passenger
visits and the 10 percent increase in the average expenditure per passenger. The increase in the average
expenditure per passenger was primarily the result of increased spending for shore excursions, jewelry and
clothing. Combined, these three categories accounted for the entire increase in average passenger
spending. In all three categories passengers reported they spent more on these goods than during the
2008/2009 cruise year.
The 41 percent decline in crew expenditures was the net result of the 31 percent increase in crew visits and
the 54 percent decline in the average crew expenditure. The decline in average crew expenditures was
primarily the result of a smaller percentage of crew making onshore purchases. For example, during the
2008/2009 cruise year 32 percent of the crew reported spending an average of $16.40 for local crafts.
During the 2011/2012 cruise year, the percentage had dropped to13% while the average expenditure
increased to $30.80. Thus the weighted expenditure for crafts fell from $5.32 in the 2008/2009 cruise year
to $4.13 in the 2011/2012 cruise year.
As a result of the 60 percent increase in total expenditures, the total employment impacts increased by
nearly 50 percent while the wage income impact increased by 54 percent. The slightly higher increase in
wages is due to increased labor productivity and average wages over the intervening period.
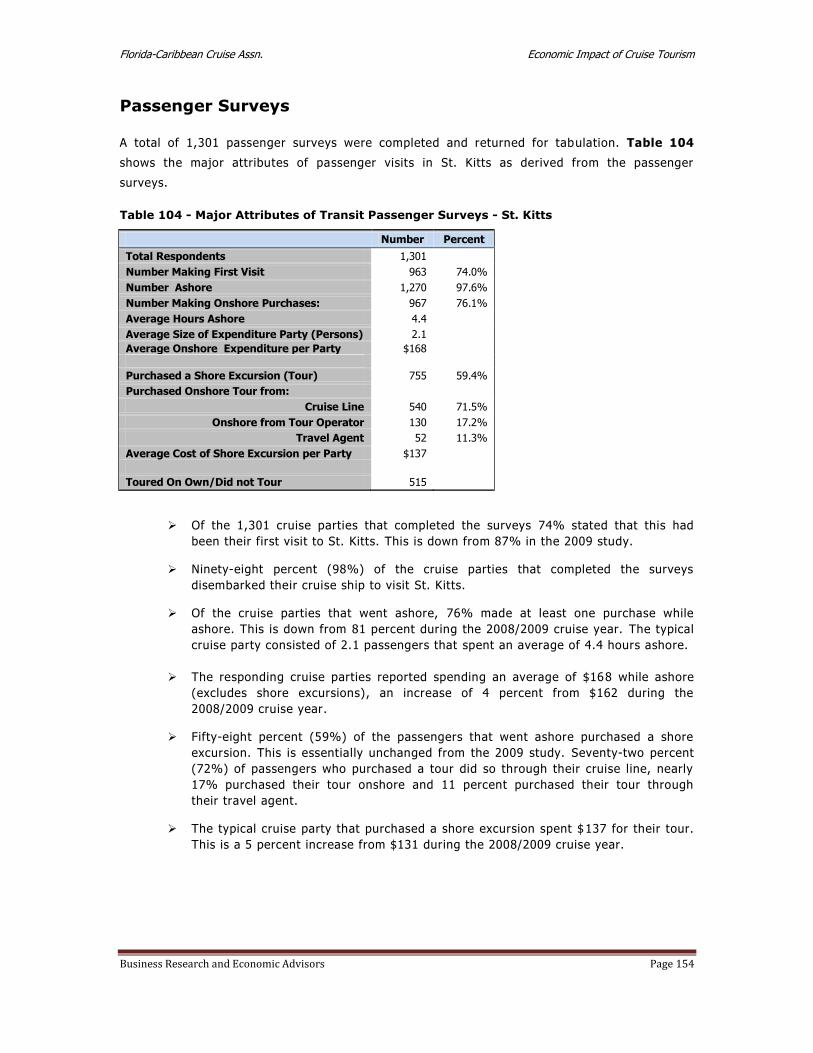
Florida-Caribbean Cruise Assn. Economic Impact of Cruise Tourism
Business Research and Economic Advisors Page 154
Passenger Surveys
A total of 1,301 passenger surveys were completed and returned for tabulation. Table 104
shows the major attributes of passenger visits in St. Kitts as derived from the passenger
surveys.
Table 104 - Major Attributes of Transit Passenger Surveys - St. Kitts
Number Percent
Total Respondents 1,301
Number Making First Visit 963 74.0%
Number Ashore 1,270 97.6%
Number Making Onshore Purchases: 967 76.1%
Average Hours Ashore 4.4
Average Size of Expenditure Party (Persons) 2.1
Average Onshore Expenditure per Party $168
Purchased a Shore Excursion (Tour) 755 59.4%
Purchased Onshore Tour from:
Cruise Line 540 71.5%
Onshore from Tour Operator 130 17.2%
Travel Agent 52 11.3%
Average Cost of Shore Excursion per Party $137
Toured On Own/Did not Tour 515
Of the 1,301 cruise parties that completed the surveys 74% stated that this had
been their first visit to St. Kitts. This is down from 87% in the 2009 study.
Ninety-eight percent (98%) of the cruise parties that completed the surveys
disembarked their cruise ship to visit St. Kitts.
Of the cruise parties that went ashore, 76% made at least one purchase while
ashore. This is down from 81 percent during the 2008/2009 cruise year. The typical
cruise party consisted of 2.1 passengers that spent an average of 4.4 hours ashore.
The responding cruise parties reported spending an average of $168 while ashore
(excludes shore excursions), an increase of 4 percent from $162 during the
2008/2009 cruise year.
Fifty-eight percent (59%) of the passengers that went ashore purchased a shore
excursion. This is essentially unchanged from the 2009 study. Seventy-two percent
(72%) of passengers who purchased a tour did so through their cruise line, nearly
17% purchased their tour onshore and 11 percent purchased their tour through
their travel agent.
The typical cruise party that purchased a shore excursion spent $137 for their tour.
This is a 5 percent increase from $131 during the 2008/2009 cruise year.
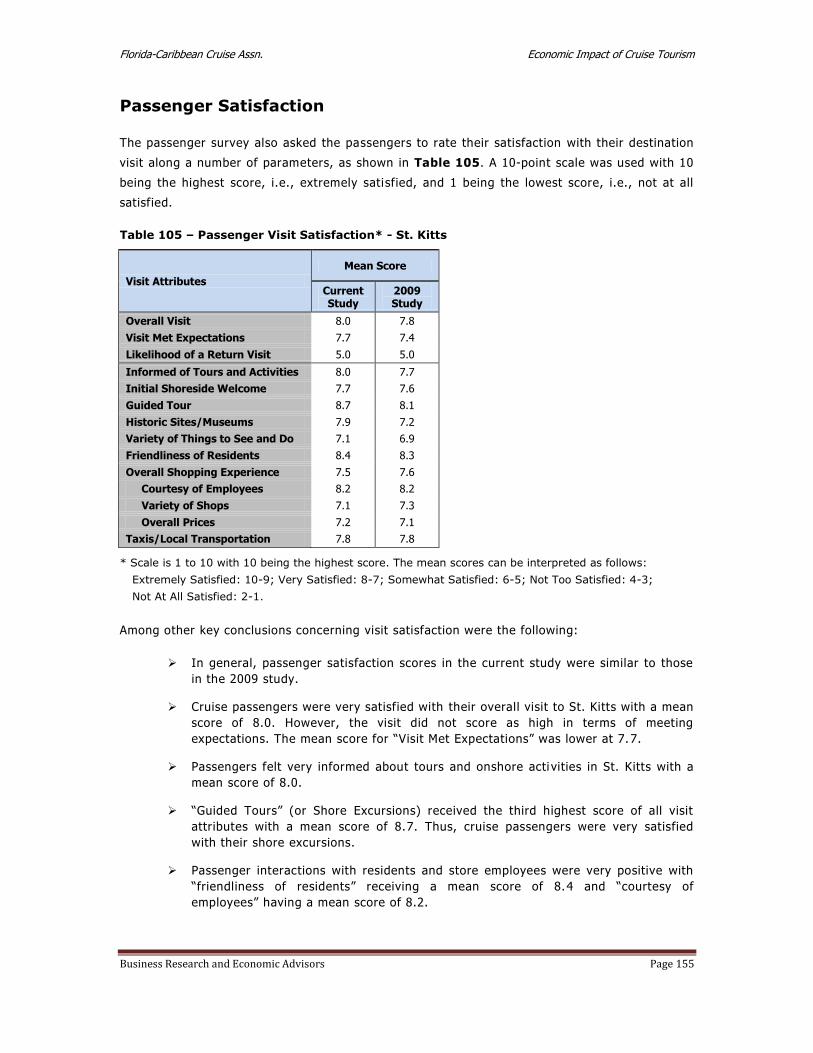
Florida-Caribbean Cruise Assn. Economic Impact of Cruise Tourism
Business Research and Economic Advisors Page 155
Passenger Satisfaction
The passenger survey also asked the passengers to rate their satisfaction with their destination
visit along a number of parameters, as shown in Table 105. A 10-point scale was used with 10
being the highest score, i.e., extremely satisfied, and 1 being the lowest score, i.e., not at all
satisfied.
Table 105 – Passenger Visit Satisfaction* - St. Kitts
Visit Attributes
Mean Score
Current Study
2009 Study
Overall Visit 8.0 7.8
Visit Met Expectations 7.7 7.4
Likelihood of a Return Visit 5.0 5.0
Informed of Tours and Activities 8.0 7.7
Initial Shoreside Welcome 7.7 7.6
Guided Tour 8.7 8.1
Historic Sites/Museums 7.9 7.2
Variety of Things to See and Do 7.1 6.9
Friendliness of Residents 8.4 8.3
Overall Shopping Experience 7.5 7.6
Courtesy of Employees 8.2 8.2
Variety of Shops 7.1 7.3
Overall Prices 7.2 7.1
Taxis/Local Transportation 7.8 7.8
* Scale is 1 to 10 with 10 being the highest score. The mean scores can be interpreted as follows:
Extremely Satisfied: 10-9; Very Satisfied: 8-7; Somewhat Satisfied: 6-5; Not Too Satisfied: 4-3;
Not At All Satisfied: 2-1.
Among other key conclusions concerning visit satisfaction were the following:
In general, passenger satisfaction scores in the current study were similar to those
in the 2009 study.
Cruise passengers were very satisfied with their overall visit to St. Kitts with a mean
score of 8.0. However, the visit did not score as high in terms of meeting
expectations. The mean score for “Visit Met Expectations” was lower at 7.7.
Passengers felt very informed about tours and onshore acti vities in St. Kitts with a
mean score of 8.0.
“Guided Tours” (or Shore Excursions) received the third highest score of all visit
attributes with a mean score of 8.7. Thus, cruise passengers were very satisfied
with their shore excursions.
Passenger interactions with residents and store employees were very positive with
“friendliness of residents” receiving a mean score of 8.4 and “courtesy of
employees” having a mean score of 8.2.

Florida-Caribbean Cruise Assn. Economic Impact of Cruise Tourism
Business Research and Economic Advisors Page 156
Categories with slightly lower scores but still above 7.0 (Very Satisfied) were: initial
shoreside welcome, historic sites, variety of things to see and do, overall shopping
experience and local transportation.
As noted above passengers were very satisfied with their overall shopping
experience with a mean score of 7.5. Additionally, they were very satisfied with the
three aspects that were evaluated: courtesy of employees, variety of shops and
overall prices.
Cruise passengers stated that they were somewhat likely to return to St. Kitts for a
land-based vacation.
Passenger Demographics
Residents of the United States and the Canada accounted for 90 percent of the responding
passengers. The average age of the respondents was 57 years with 38 percent of the
respondents being 65 years of age or older. St. Kitts passengers had an average household
income of $108,500 with 41 percent having over $100,000 in household income.
Figure 67 – Passenger Age
St. Kitts
Under 153%
15 - 242%
25 - 449%
45 - 6448%
Over 6438%
Figure 68 – Passenger Household Income
St. Kitts
Under $50,00012%
$50,000 to $75,000
26%
$75,000 to $100,000
21%
$100,000 to $150,000
21%
$150,000 to $200,000
11%
$200,000 or more
9%
Florida-Caribbean Cruise Assn. Economic Impact of Cruise Tourism
Business Research and Economic Advisors Page 157
St. Maarten
At the core of the analysis of the economic contribution of cruise tourism were a set of
passenger and crew surveys that were conducted onboard ships of the FCCA member cruise
lines.84 The surveys were undertaken during the six-month period beginning in December 2011
and ending in May 2012. The survey schedule was designed so that surveys were conducted by
FCCA member cruise lines that called at each destination and that the distribution of passenger
and crew surveys would reflect the distribution of passenger and crew arrivals by cruise line at
each destination. On any given cruise itinerary, passenger and crew surveys were placed in all
passenger cabins and crew quarters following a single destination call. The surveys were
completed by the passengers and crew in the privacy of their quarters and returned to a
designated office on the cruise ship. Thus, passengers and crew were only surveyed once during
a cruise itinerary and for a single destination. On a subsequent itinerary, passengers were
surveyed following a call at a different destination.
The passenger and crew surveys were designed to collect data for onshore spending and visit
satisfaction by both passengers and crew. While the crew survey was slightly shorter than the
passenger survey, both surveys were designed to collect the following information:
hours spent ashore;
expenditures by category, including shore tours, food & beverages, clothing, etc.;
visit satisfaction, including shore tour, friendliness of residents, prices, shopping,
etc.;
likelihood of returning for a land-based vacation; and
demographic characteristics, including country of residence, age group, income, etc.
Combining the expenditure data collected from the passenger and crew surveys with data on
expenditures by cruise lines for port fees and services, payments to local tour operators for
passenger shore excursions purchased onboard the cruise ships, and other provisions purchased
locally by the cruise lines, estimates of total cruise tourism expenditures were developed for
each participating destination.
Given the direct spending estimates, the economic contribution of these expenditures, as
measured by employment and wage income were then estimated for each de stination. This
process began with the collection of economic data for each destination from a combination of
local, regional and international sources. Utilizing all of these data a set of economic impact
models were developed for each destination to estimate the direct and total employment and
wage impacts. A more detailed description of these models is provided in the Data and
Methods section of Volume I.
84 Surveys were conducted on the ships of the following cruise lines: Carnival Cruise Lines, Celebrity Cruises, Disney Cruise Line, Holland America Line, Norwegian Cruise Line, Princess Cruises, P&O Cruises and Royal Caribbean International.
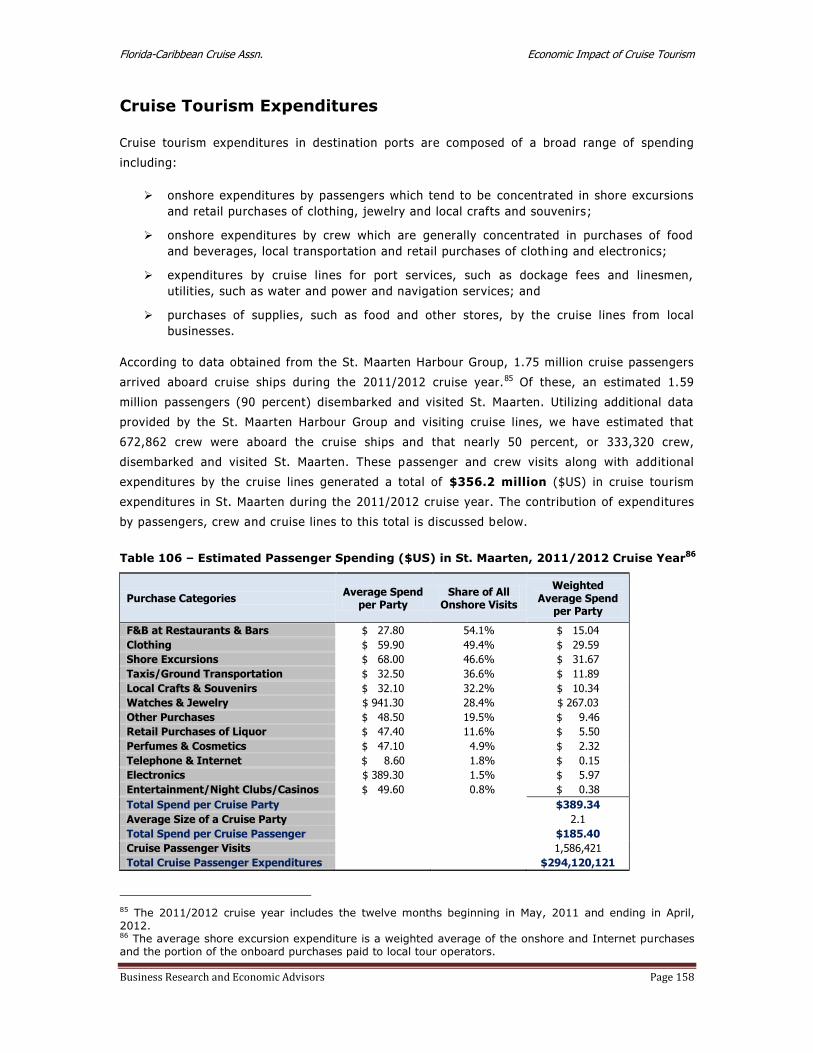
Florida-Caribbean Cruise Assn. Economic Impact of Cruise Tourism
Business Research and Economic Advisors Page 158
Cruise Tourism Expenditures
Cruise tourism expenditures in destination ports are composed of a broad range of spending
including:
onshore expenditures by passengers which tend to be concentrated in shore excursions
and retail purchases of clothing, jewelry and local crafts and souvenirs;
onshore expenditures by crew which are generally concentrated in purchases of food
and beverages, local transportation and retail purchases of cloth ing and electronics;
expenditures by cruise lines for port services, such as dockage fees and linesmen,
utilities, such as water and power and navigation services; and
purchases of supplies, such as food and other stores, by the cruise lines from local
businesses.
According to data obtained from the St. Maarten Harbour Group, 1.75 million cruise passengers
arrived aboard cruise ships during the 2011/2012 cruise year.85 Of these, an estimated 1.59
million passengers (90 percent) disembarked and visited St. Maarten. Utilizing additional data
provided by the St. Maarten Harbour Group and visiting cruise lines, we have estimated that
672,862 crew were aboard the cruise ships and that nearly 50 percent, or 333,320 crew,
disembarked and visited St. Maarten. These passenger and crew visits along with additional
expenditures by the cruise lines generated a total of $356.2 million ($US) in cruise tourism
expenditures in St. Maarten during the 2011/2012 cruise year. The contribution of expenditures
by passengers, crew and cruise lines to this total is discussed below.
Table 106 – Estimated Passenger Spending ($US) in St. Maarten, 2011/2012 Cruise Year86
Purchase Categories Average Spend
per Party Share of All
Onshore Visits
Weighted Average Spend
per Party
F&B at Restaurants & Bars $ 27.80 54.1% $ 15.04
Clothing $ 59.90 49.4% $ 29.59
Shore Excursions $ 68.00 46.6% $ 31.67
Taxis/Ground Transportation $ 32.50 36.6% $ 11.89
Local Crafts & Souvenirs $ 32.10 32.2% $ 10.34
Watches & Jewelry $ 941.30 28.4% $ 267.03
Other Purchases $ 48.50 19.5% $ 9.46
Retail Purchases of Liquor $ 47.40 11.6% $ 5.50
Perfumes & Cosmetics $ 47.10 4.9% $ 2.32
Telephone & Internet $ 8.60 1.8% $ 0.15
Electronics $ 389.30 1.5% $ 5.97
Entertainment/Night Clubs/Casinos $ 49.60 0.8% $ 0.38
Total Spend per Cruise Party $389.34
Average Size of a Cruise Party 2.1
Total Spend per Cruise Passenger $185.40
Cruise Passenger Visits 1,586,421
Total Cruise Passenger Expenditures $294,120,121
85 The 2011/2012 cruise year includes the twelve months beginning in May, 2011 and ending in April, 2012. 86 The average shore excursion expenditure is a weighted average of the onshore and Internet purchases and the portion of the onboard purchases paid to local tour operators.

Florida-Caribbean Cruise Assn. Economic Impact of Cruise Tourism
Business Research and Economic Advisors Page 159
Per passenger spending estimates were derived from the nearly 1,200 surveys completed by
passengers that went ashore during the survey period. As shown in Table 106, each passenger
cruise party spent an average of $389.34 in St. Maarten. The average spend per cruise party is
the sum of the weighted spending in each of the twelve categories. For example, 54 percent of
the survey respondents reported spending an average of $27.80 at local restaurants and/or
bars. Spread over the cruise parties that visited St. Maarten, this represents an average of
$15.04 per party. On a per passenger basis, the average total expenditure was $185.40. This
represents the sum of per party expenditures, $389.34, divided by the average size of a cruise
party in St. Maarten, 2.1 passengers.
Cruise passenger expenditures in St. Maarten were concentrated in four categories which
accounted for 88 percent of their onshore expenditures: watches and jewelry, shore excursions,
clothing and food and beverages. Nearly 40 percent or more of the passengers that went ashore
made purchases of food and beverages, clothing shore excursions and ground transportation.
Forty-seven percent (47%) of the passengers reported that their cruise party purchased a shore
excursion. The effective local price of the shore excursion was $68 per party but when the full
price of the purchase from cruise lines and travel agents is included passengers spent an
average of $111 per party for their tours.
For the entire 2011/2012 cruise year, the estimated 1.59 million cruise passengers who visited
St. Maarten spent a total of $294.1 million ($US).
Table 107 – Estimated Crew Spending ($US) in St. Maarten, 2011/2012 Cruise Year
Purchase Categories Average Spend
per Crew Share of All
Onshore Visits
Weighted Average Spend
per Crew
F&B at Restaurants & Bars $ 27.60 56.7% $ 15.64
Taxis/Ground Transportation $ 12.80 35.0% $ 4.48
Clothing $ 53.10 20.2% $ 10.70
Other Purchases $ 258.30 16.7% $ 43.21
Watches & Jewelry $ 204.70 11.4% $ 23.35
Electronics $ 265.30 10.3% $ 27.24
Telephone & Internet $ 44.00 8.0% $ 3.51
Local Crafts & Souvenirs $ 21.90 8.0% $ 1.75
Entertainment/Night Clubs/Casinos $ 46.90 6.5% $ 3.03
Retail Purchases of Liquor $ 54.50 2.7% $ 1.45
Shore Excursions $ 60.00 1.9% $ 1.14
Total Spend per Crew $135.50
Cruise Passenger Visits 333,320
Total Cruise Passenger Expenditures $45,164,813
Per crew spending estimates were derived from the nearly 400 surveys completed by crew
members during the survey period. As shown in Table 107, each crew member spent an
average of $135.50 in St. Maarten. The average spend per crew member is the sum of the
weighted spending in each of the eleven categories.87 For example, 57 percent of the survey
87 No purchases of perfumes and cosmetics were reported by crew visiting St. Maarten.
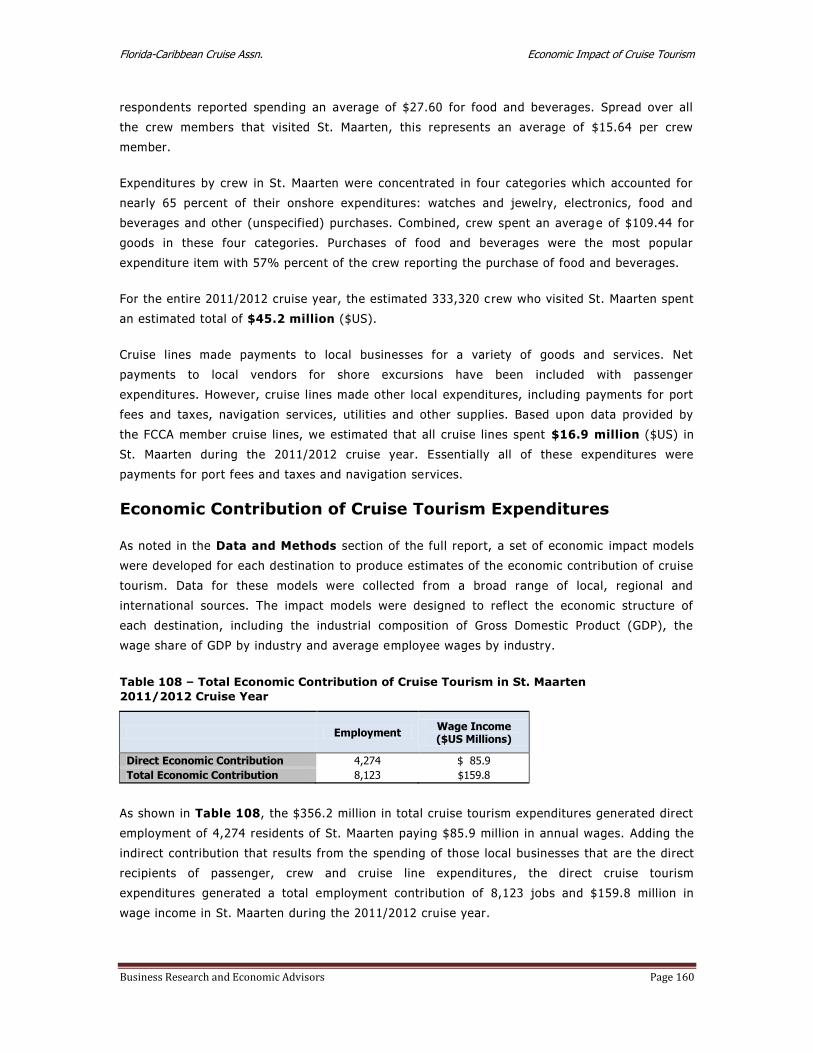
Florida-Caribbean Cruise Assn. Economic Impact of Cruise Tourism
Business Research and Economic Advisors Page 160
respondents reported spending an average of $27.60 for food and beverages. Spread over all
the crew members that visited St. Maarten, this represents an average of $15.64 per crew
member.
Expenditures by crew in St. Maarten were concentrated in four categories which accounted for
nearly 65 percent of their onshore expenditures: watches and jewelry, electronics, food and
beverages and other (unspecified) purchases. Combined, crew spent an average of $109.44 for
goods in these four categories. Purchases of food and beverages were the most popular
expenditure item with 57% percent of the crew reporting the purchase of food and beverages.
For the entire 2011/2012 cruise year, the estimated 333,320 c rew who visited St. Maarten spent
an estimated total of $45.2 million ($US).
Cruise lines made payments to local businesses for a variety of goods and services. Net
payments to local vendors for shore excursions have been included with passenger
expenditures. However, cruise lines made other local expenditures, including payments for port
fees and taxes, navigation services, utilities and other supplies. Based upon data provided by
the FCCA member cruise lines, we estimated that all cruise lines spent $16.9 million ($US) in
St. Maarten during the 2011/2012 cruise year. Essentially all of these expenditures were
payments for port fees and taxes and navigation services.
Economic Contribution of Cruise Tourism Expenditures
As noted in the Data and Methods section of the full report, a set of economic impact models
were developed for each destination to produce estimates of the economic contribution of cruise
tourism. Data for these models were collected from a broad range of local, regional and
international sources. The impact models were designed to reflect the economic structure of
each destination, including the industrial composition of Gross Domestic Product (GDP), the
wage share of GDP by industry and average employee wages by industry.
Table 108 – Total Economic Contribution of Cruise Tourism in St. Maarten
2011/2012 Cruise Year
Employment Wage Income ($US Millions)
Direct Economic Contribution 4,274 $ 85.9
Total Economic Contribution 8,123 $159.8
As shown in Table 108, the $356.2 million in total cruise tourism expenditures generated direct
employment of 4,274 residents of St. Maarten paying $85.9 million in annual wages. Adding the
indirect contribution that results from the spending of those local businesses that are the direct
recipients of passenger, crew and cruise line expenditures , the direct cruise tourism
expenditures generated a total employment contribution of 8,123 jobs and $159.8 million in
wage income in St. Maarten during the 2011/2012 cruise year.

Florida-Caribbean Cruise Assn. Economic Impact of Cruise Tourism
Business Research and Economic Advisors Page 161
As shown in Figures 69 and 70, the total employment and wage impacts of cruise tourism are
concentrated in the commercial and transport sectors which account for about 99 percent of the
employment and wage impacts.88 This is not surprising since the direct impacts account for
more than half of the total employment impacts and that virtually all of the cruise tourism
expenditures are made with businesses in these sectors. Because of the relatively lower wages
in the commercial sector relative to the other sectors of the S t. Maarten economy, the
commercial sector accounts for 91 percent of the employment impacts but only 85 percent of
the wage impacts. The remainder of the total employment and wage impacts was generated by
the indirect spending in the other sectors of the economy.
88 The industry sectors include the following activities:
Manufacturing & Construction: residential and nonresidential construction and all manufacturing Commercial Services: wholesale and retail trade, lodging and eating and drinking establishments Transportation & Utilities: tour operators, port services, telecommunications and water and power utilities Business & Financial Services: banking, insurance, legal, accounting, leasing and other business services Community Services & Government: education, health and social services and government agencies
Figure 69 – Total Employment Impacts by
Sector - St. Maarten
Commercial
Services91%
Transport &
Utilities8%
Business &
Financial Services
0%
Community
Services & Government
1%
Figure 70 – Total Wage Impacts by Sector
St. Maarten
Commercial
Services85%
Transport &
Utilities14%
Business &
Financial Services
0%
Community
Services & Government
1%

Florida-Caribbean Cruise Assn. Economic Impact of Cruise Tourism
Business Research and Economic Advisors Page 162
Comparison to 2009 Study
Total estimated passenger and crew visits increased by nearly 30 percent from 1.48 million visits during the
2008/2009 cruise year to 1.92 million during the 2011/2012 cruise year. Total direct expenditures in St.
Maarten increased at a much higher rate, 55 percent, growing from $230.3 million in the 2008/2009 cruise
year to $356.2 million in the 2011/2012 cruise year. As indicated in Table 109, cruise tourism expenditures
increased among the cruise lines and passengers but decreased slightly for crew.
Table 109 – Comparison of Cruise Tourism Impacts, Current Study versus 2009 Study - St. Maarten
Current
Study 2009
Study Percent Change
Total Onshore Visits (Thousands) 1,919.7 1,478.0 +29.9%
Passengers 1,586.4 1,152.0 +37.7%
Crew 333.3 326.0 +2.2%
Total Direct Expenditures ($US Millions) $356.2 $230.3 +54.7%
Passengers $ 294.1 $ 170.5 +72.5%
Crew $ 45.2 $ 48.7 -6.0%
Cruise Lines $ 16.9 $ 11.0 +53.6%
Average Per Passenger Expenditure $185.40 $147.98 +25.3% Average Per Crew Expenditure $135.50 $149.45 -9.3%
Total Employment Impact 8,123 5,531 +46.9%
Total Wage Impact ($US Millions) $ 159.8 $ 106.3 +50.3%
The 72 percent increase in passenger expenditures was the result of the 38 percent increase in passenger
visits and the 25 percent increase in the average passenger expenditures. The increase in per passenger
expenditures was primarily the result of increased average expenditures for jewelry and food and beverages
which were partially offset by declines in average spending for shore excursion and local crafts. Relative to
the 2008/2009 cruise year, cruise passengers spent more for most goods when they made onshore
purchases, but this was partially offset by a lower percentage of passengers making onshore purchases
during the 2011/2012 cruise year.
In the case of crew expenditures, the 6 percent decline in total crew expenditures was the net result of a 2
percent increase crew visits that was offset by a 9 percent decrease in the average per crew expenditure.
The decline in average crew expenditures was primarily due to a smaller percentage of crew making
onshore purchases during the 2011/2012 cruise year. For example, during the 2008/2009 cruise year 64
percent of the crew reported spending an average of $35.50 for food and beverages. During the 2011/2012
cruise year, the percentage had dropped to 57% while the average expenditure fell to $27.60. Thus the
weighted expenditure for food and beverages fell from $22.77 in the 2008/2009 cruise year to $15.64 in the
2011/2012 cruise year. Crew spending for clothing, local crafts and electronics showed a similar pattern.
As a result of the 55 percent increase in direct cruise tourism expenditures from the 2008/2009 cruise year,
the total employment impact increased by 57 percent over the three-year period while the wage impact
increased by 50 percent. The higher growth in wages is due to increased labor productivity and average
wages over the intervening period.

Florida-Caribbean Cruise Assn. Economic Impact of Cruise Tourism
Business Research and Economic Advisors Page 163
Passenger Surveys
A total of 1,194 passenger surveys were completed and returned for tabulation. Table 110
shows the major attributes of passenger visits in St. Maarten as derived from the passenger
surveys.
Table 110 - Major Attributes of Transit Passenger Surveys - St. Maarten
Number Percent
Total Respondents 1,194
Number Making First Visit 525 48.0%
Number Ashore 1,168 97.7%
Number Making Onshore Purchases: 913 78.3%
Average Hours Ashore 4.5
Average Size of Expenditure Party (Persons) 2.1
Average Onshore Expenditure per Party $294
Purchased a Shore Excursion (Tour) 543 46.6%
Purchased Onshore Tour from:
Cruise Line 438 80.6%
Onshore from Tour Operator 47 8.6%
Travel Agent 58 10.7%
Average Cost of Shore Excursion per Party $111
Toured On Own/Did not Tour 623
Of the 1,194 cruise parties that completed the surveys 48% stated that this had
been their first visit to St. Maarten. This was down from 55% in the 2009 study.
Ninety-eight percent (98%) of the cruise parties that completed the surveys
disembarked their cruise ship to visit St. Maarten.
Of the cruise parties that went ashore, 78% made at least one purchase while
ashore. This was a decline from 84% during the 2008/2009 cruise year. The typical
cruise party consisted of 2.1 passengers that spent an average of 4.5 hours ashore.
The responding cruise parties reported spending an average of $294 while ashore
(excludes shore excursions), which was up marginally from $292 during the
2008/2009 cruise year.
Forty-seven percent (47%) of the passengers that went ashore purchased a shore
excursion. This is unchanged from the 2009 study. Eighty-one percent (81%) of
passengers who purchased a tour did so through their cruise line, 9% purchased
their tour onshore and 10 percent purchased their tour through their travel agent.
The typical cruise party that purchased a shore excursion spent $111 for their tour,
a decline of 4 percent from $116 during the 2008/2009 cruise year.

Florida-Caribbean Cruise Assn. Economic Impact of Cruise Tourism
Business Research and Economic Advisors Page 164
Passenger Satisfaction
The passenger survey also asked the passengers to rate their satisfaction with their destination
visit along a number of parameters, as shown in Table 111. A 10-point scale was used with 10
being the highest score, i.e., extremely satisfied, and 1 being the lowest score, i.e., not at all
satisfied.
Table 111 – Passenger Visit Satisfaction* - St. Maarten
Visit Attributes
Mean Score
Current Study
2009 Study
Overall Visit 7.8 8.0
Visit Met Expectations 7.3 7.5
Likelihood of a Return Visit 5.0 5.1
Informed of Tours and Activities 7.8 7.8
Initial Shoreside Welcome 7.7 7.7
Guided Tour 8.0 8.1
Historic Sites/Museums 6.7 6.9
Variety of Things to See and Do 7.2 7.3
Friendliness of Residents 8.0 8.0
Overall Shopping Experience 7.4 7.6
Courtesy of Employees 8.0 8.1
Variety of Shops 7.4 7.4
Overall Prices 7.0 7.3
Taxis/Local Transportation 7.8 8.1
* Scale is 1 to 10 with 10 being the highest score. The mean scores can be interpreted as follows:
Extremely Satisfied: 10-9; Very Satisfied: 8-7; Somewhat Satisfied: 6-5; Not Too Satisfied: 4-3;
Not At All Satisfied: 2-1.
Among other key conclusions concerning visit satisfaction were the following:
Overall, the satisfaction scores for St. Maarten in the current study were about the
same or marginally lower than in the 2009 study.
Cruise passengers were very satisfied with their overall visit to St. Maarten with a
mean score of 7.8. However, the visit did not score as high in terms of meeting
expectations. The mean score for “Visit Met Expectations” was lower at 7.3.
Passengers felt very informed about tours and onshore activities in St. Maarten with
a mean score of 7.8.
“Guided Tours” (or Shore Excursions) received the highest score of all visit
attributes with a mean score of 8.0. Thus, cruise passengers were very satisfied
with their shore excursions.
Passenger interactions with residents and store employees were very positive with
“friendliness of residents” and “courtesy of employees” each receiving a mean
score of 8.0.
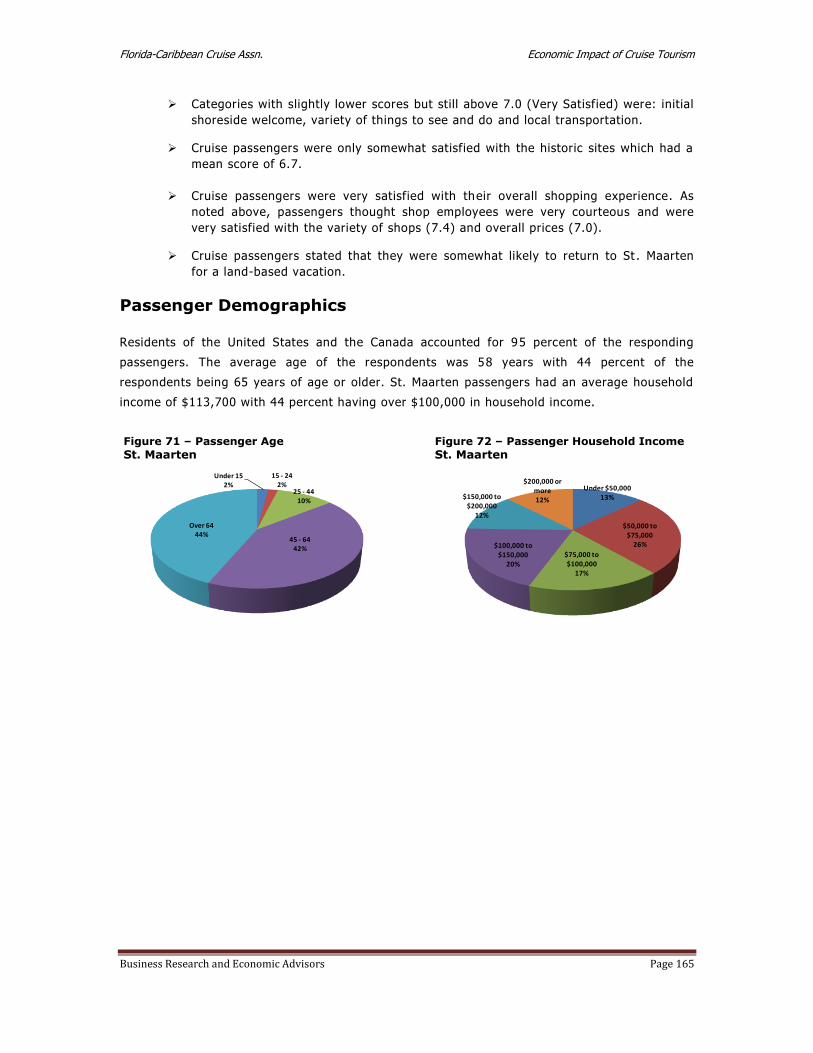
Florida-Caribbean Cruise Assn. Economic Impact of Cruise Tourism
Business Research and Economic Advisors Page 165
Categories with slightly lower scores but still above 7.0 (Very Satisfied) were: initial
shoreside welcome, variety of things to see and do and local transportation.
Cruise passengers were only somewhat satisfied with the historic sites which had a
mean score of 6.7.
Cruise passengers were very satisfied with their overall shopping experience. As
noted above, passengers thought shop employees were very courteous and were
very satisfied with the variety of shops (7.4) and overall prices (7.0).
Cruise passengers stated that they were somewhat likely to return to St . Maarten
for a land-based vacation.
Passenger Demographics
Residents of the United States and the Canada accounted for 95 percent of the responding
passengers. The average age of the respondents was 58 years with 44 percent of the
respondents being 65 years of age or older. St. Maarten passengers had an average household
income of $113,700 with 44 percent having over $100,000 in household income.
Figure 71 – Passenger Age
St. Maarten
Under 152%
15 - 242%
25 - 4410%
45 - 6442%
Over 6444%
Figure 72 – Passenger Household Income
St. Maarten
Under $50,00013%
$50,000 to $75,000
26%
$75,000 to $100,000
17%
$100,000 to $150,000
20%
$150,000 to $200,000
12%
$200,000 or more12%

Florida-Caribbean Cruise Assn. Economic Impact of Cruise Tourism
Business Research and Economic Advisors Page 166
St. Vincent and the Grenadines
At the core of the analysis of the economic contribution of cruise tourism were a set of
passenger and crew surveys that were conducted onboard ships of the FCCA member cruise
lines.89 The surveys were undertaken during the six-month period beginning in December 2011
and ending in May 2012. The survey schedule was designed so that surveys were conducted by
FCCA member cruise lines that called at each destination and that the distribution of passenger
and crew surveys would reflect the distribution of passenger and crew arrivals by cruise line at
each destination. On any given cruise itinerary, passenger and crew surveys were placed in all
passenger cabins and crew quarters following a single destination call. The surveys were
completed by the passengers and crew in the privacy of their quarters and returned to a
designated office on the cruise ship. Thus, passengers and crew were only surveyed once during
a cruise itinerary and for a single destination. On a subsequent itinerary, passengers were
surveyed following a call at a different dest ination.
The passenger and crew surveys were designed to collect data for onshore spending and visit
satisfaction by both passengers and crew. While the crew survey was slightly shorter than the
passenger survey, both surveys were designed to collect the following information:
hours spent ashore;
expenditures by category, including shore tours, food & beverages, clothing, etc.;
visit satisfaction, including shore tour, friendliness of residents, prices, shopping,
etc.;
likelihood of returning for a land-based vacation; and
demographic characteristics, including country of residence, age group, income, etc.
Combining the expenditure data collected from the passenger and crew surveys with data on
expenditures by cruise lines for port fees and services, payments to local tour operators for
passenger shore excursions purchased onboard the cruise ships, and other provisions purchased
locally by the cruise lines, estimates of total cruise tourism expenditures were developed for
each participating destination.
Given the direct spending estimates, the economic contribution of these expenditures, as
measured by employment and wage income were then estimated for each de stination. This
process began with the collection of economic data for each destination from a combination of
local, regional and international sources. Utilizing all of these data a set of economic impact
models were developed for each destination to estimate the direct and total employment and
wage impacts. A more detailed description of these models is provided in the Data and
Methods section of Volume I.
89 Surveys were conducted on the ships of the following cruise lines: Carnival Cruise Lines, Celebrity Cruises, Disney Cruise Line, Holland America Line, Norwegian Cruise Line, Princess Cruises, P&O Cruises and Royal Caribbean International.

Florida-Caribbean Cruise Assn. Economic Impact of Cruise Tourism
Business Research and Economic Advisors Page 167
Cruise Tourism Expenditures
Cruise tourism expenditures in destination ports are composed of a broad range of spending
including:
onshore expenditures by passengers which tend to be concentrated in shore excursions
and retail purchases of clothing, jewelry and local crafts and souvenirs;
onshore expenditures by crew which are generally concentrated in purchases of food
and beverages, local transportation and retail purchases of clothing and electronics ;
expenditures by cruise lines for port services, such as dockage fees and linesmen,
utilities, such as water and power and navigation services; and
purchases of supplies, such as food and other stores, by the cruise lines from local
businesses.
According to data obtained from the Ministry of Tourism, 65,347 cruise passengers arrived
aboard cruise ships during the 2011/2012 cruise year.90 Of these, an estimated 58,812
passengers (90 percent) disembarked and visited St. Vincent and the Grenadines. Utilizing
additional data provided by the visiting cruise lines, we have est imated that 23,089 crew were
aboard the cruise ships and that 30 percent, or 6,927 crew, disembarked and visited St. Vincent
and the Grenadines. These passenger and crew visits along with additional expend itures by the
cruise lines generated a total of $3.0 million ($US) in cruise tourism expenditures in St.
Vincent and the Grenadines during the 2011/2012 cruise year. The contribution of expenditures
by passengers, crew and cruise lines to this total is discussed below.
Table 112 – Estimated Passenger Spending ($US) in St. Vincent and the Grenadines, 2011/2012
Cruise Year91
Purchase Categories Average Spend
per Party Share of All
Onshore Visits
Weighted Average Spend
per Party
F&B at Restaurants & Bars $ 14.80 57.9% $ 8.57
Local Crafts & Souvenirs $ 16.40 39.3% $ 6.45
Shore Excursions $ 63.10 35.6% $ 22.44
Clothing $ 25.50 25.4% $ 6.48
Taxis/Ground Transportation $ 30.40 22.7% $ 6.89
Other Purchases $ 11.90 18.3% $ 2.18
Watches & Jewelry $ 17.70 3.3% $ 0.58
Retail Purchases of Liquor $ 12.50 3.3% $ 0.41
Perfumes & Cosmetics $ 9.80 0.8% $ 0.08
Telephone & Internet $ 3.70 0.5% $ 0.02
Total Spend per Cruise Party $54.10
Average Size of a Cruise Party 2.0
Total Spend per Cruise Passenger $27.05
Cruise Passenger Visits 58,812
Total Cruise Passenger Expenditures $1,591,009
90 The 2011/2012 cruise year includes the twelve months beginning in May, 2011 and ending in April, 2012. 91 The average shore excursion expenditure is a weighted average of the onshore and Internet purchases and the portion of the onboard purchases paid to local tour operators.

Florida-Caribbean Cruise Assn. Economic Impact of Cruise Tourism
Business Research and Economic Advisors Page 168
Per passenger spending estimates were derived from the more than 800 surveys completed by
passengers that went ashore during the survey period. As shown in Table 112, each passenger
cruise party spent an average of $54.10 in St. Vincent and the Grenadines. The average spend
per cruise party is the sum of the weighted spending in each of the ten categories.92 For
example, 58 percent of the survey respondents reported spending an average of $14.80 at local
restaurants and/or bars. Spread over the cruise parties that visited St. Vincent and the
Grenadines, this represents an average of $8.57 per party. On a per passenger basis, the
average total expenditure was $27.05. This represents the sum of per party expenditures,
$54.10, divided by the average size of a cruise party in St. Vincent and the Grenadines, 2.0
passengers.
Cruise passenger expenditures in St. Vincent and the Grenadines were concentrated in four
categories which accounted for 82 percent of their onshore expenditures: shore excursions, food
and beverages, local crafts and ground transportation. Nearly 40 percent or more of the
passengers that went ashore made purchases of local crafts and food and beverages.
Thirty-six percent (36%) of the passengers reported that their cruise party purchased a shore
excursion. The effective local price of the shore excursion was $63.10 per party but when the
full price of the purchase from cruise lines and travel agents is included passengers spent an
average of $95.80 per party for their tours.
For the entire 2011/2012 cruise year, the estimated 58,812 cruise passengers who visited St.
Vincent and the Grenadines spent a total of $1.6 million ($US).
Table 113 – Estimated Crew Spending ($US) in St. Vincent and the Grenadines, 2011/2012
Cruise Year
Purchase Categories Average Spend
per Crew Share of All
Onshore Visits
Weighted Average Spend
per Crew
Other Purchases $ 4.70 50.0% $ 2.35
F&B at Restaurants & Bars $ 5.20 37.5% $ 1.95
Entertainment/Night Clubs/Casinos $ 40.00 15.0% $ 6.00
Taxis/Ground Transportation $ 80.00 12.5% $ 10.00
Local Crafts & Souvenirs $ 14.40 7.6% $ 1.10
Total Spend per Crew $21.40
Cruise Passenger Visits 6,927
Total Cruise Passenger Expenditures $148,231
Per crew spending estimates were derived from the surveys completed by crew members during
the survey period. As shown in Table 113, crew members made limited purchases on the
island. Each crew member spent an average of $17.61 in St. Vincent and the Grenadines. The
average spend per crew member is the sum of the weighted spending in each of the five
92 No purchases of entertainment or electronics were reported by passengers visiting St. Vincent and the Grenadines.
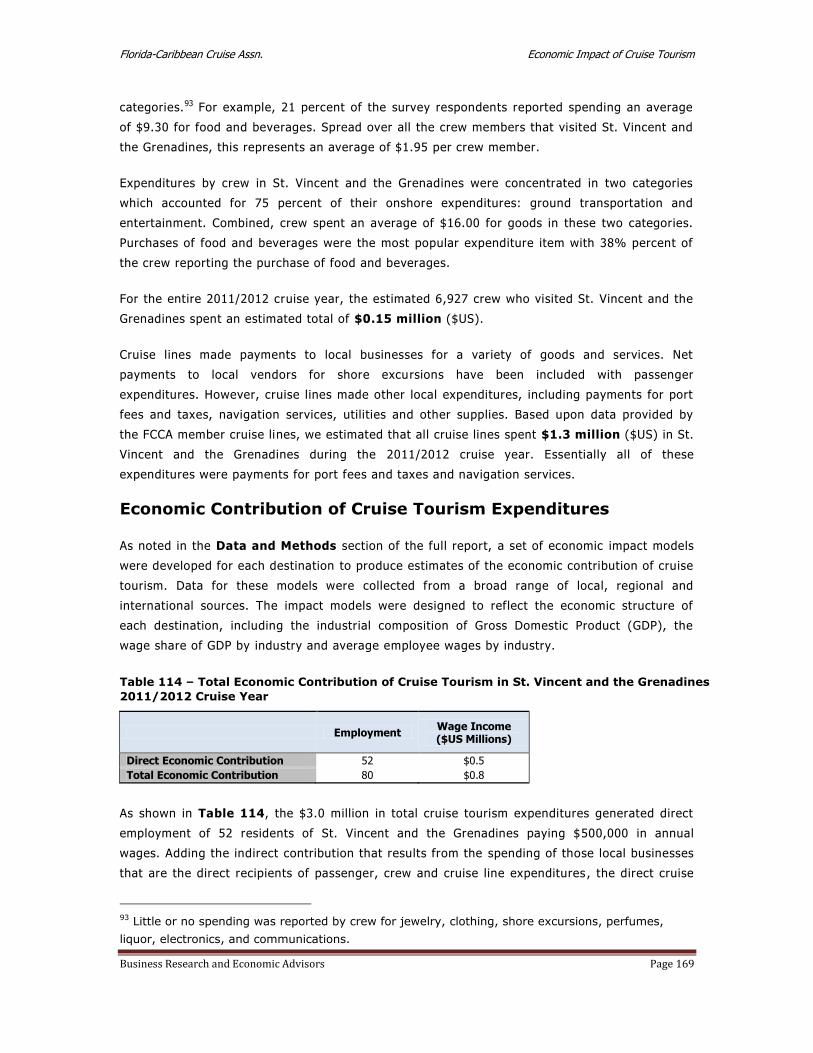
Florida-Caribbean Cruise Assn. Economic Impact of Cruise Tourism
Business Research and Economic Advisors Page 169
categories.93 For example, 21 percent of the survey respondents reported spending an average
of $9.30 for food and beverages. Spread over all the crew members that visited St. Vincent and
the Grenadines, this represents an average of $1.95 per crew member.
Expenditures by crew in St. Vincent and the Grenadines were concentrated in two categories
which accounted for 75 percent of their onshore expenditures: ground transportation and
entertainment. Combined, crew spent an average of $16.00 for goods in these two categories.
Purchases of food and beverages were the most popular expenditure item with 38% percent of
the crew reporting the purchase of food and beverages.
For the entire 2011/2012 cruise year, the estimated 6,927 crew who visited St. Vincent and the
Grenadines spent an estimated total of $0.15 million ($US).
Cruise lines made payments to local businesses for a variety of goods and services. Net
payments to local vendors for shore excursions have been included with passenger
expenditures. However, cruise lines made other local expenditures, including payments for port
fees and taxes, navigation services, utilities and other supplies. Based upon data provided by
the FCCA member cruise lines, we estimated that all cruise lines spent $1.3 million ($US) in St.
Vincent and the Grenadines during the 2011/2012 cruise year. Essentially all of these
expenditures were payments for port fees and taxes and navigation services.
Economic Contribution of Cruise Tourism Expenditures
As noted in the Data and Methods section of the full report, a set of economic impact models
were developed for each destination to produce estimates of the economic contribution of cruise
tourism. Data for these models were collected from a broad range of local, regional and
international sources. The impact models were designed to reflect the economic structure of
each destination, including the industrial composition of Gross Domestic Product (GDP), the
wage share of GDP by industry and average employee wages by industry.
Table 114 – Total Economic Contribution of Cruise Tourism in St. Vincent and the Grenadines
2011/2012 Cruise Year
Employment Wage Income ($US Millions)
Direct Economic Contribution 52 $0.5
Total Economic Contribution 80 $0.8
As shown in Table 114, the $3.0 million in total cruise tourism expenditures generated direct
employment of 52 residents of St. Vincent and the Grenadines paying $500,000 in annual
wages. Adding the indirect contribution that results from the spending of those local businesses
that are the direct recipients of passenger, crew and cruise line expenditures , the direct cruise
93 Little or no spending was reported by crew for jewelry, clothing, shore excursions, perfumes,
liquor, electronics, and communications.
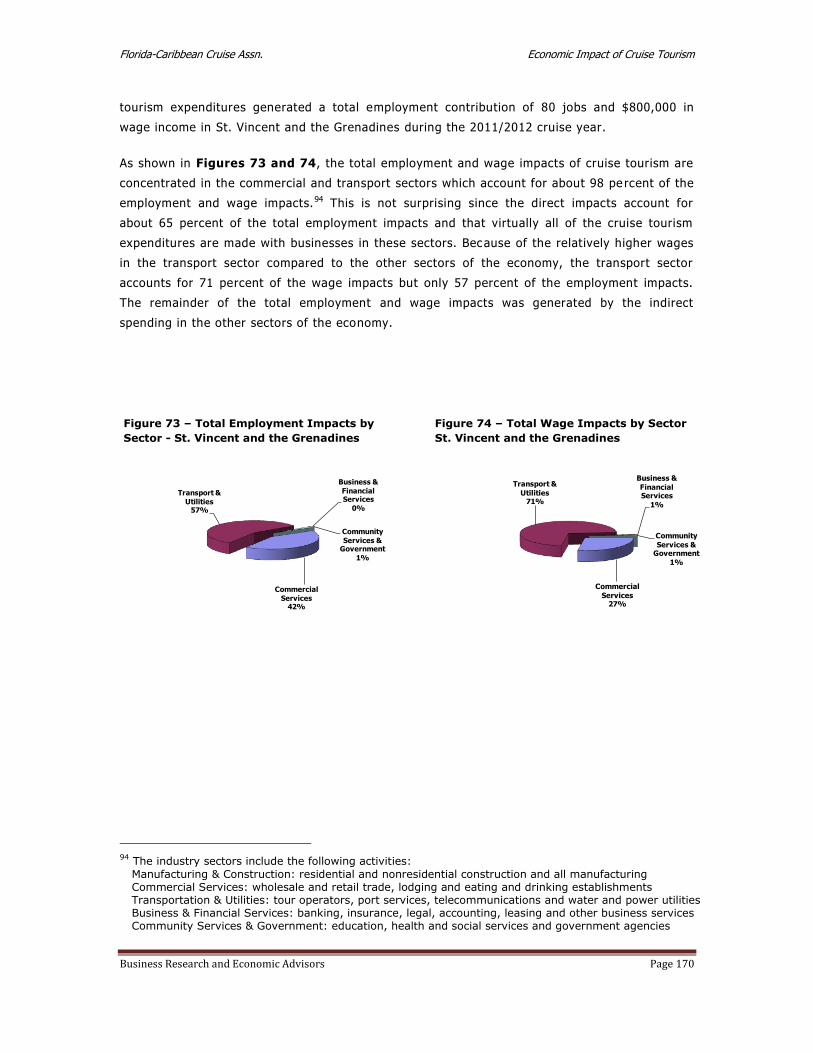
Florida-Caribbean Cruise Assn. Economic Impact of Cruise Tourism
Business Research and Economic Advisors Page 170
tourism expenditures generated a total employment contribution of 80 jobs and $800,000 in
wage income in St. Vincent and the Grenadines during the 2011/2012 cruise year.
As shown in Figures 73 and 74, the total employment and wage impacts of cruise tourism are
concentrated in the commercial and transport sectors which account for about 98 pe rcent of the
employment and wage impacts.94 This is not surprising since the direct impacts account for
about 65 percent of the total employment impacts and that virtually all of the cruise tourism
expenditures are made with businesses in these sectors. Because of the relatively higher wages
in the transport sector compared to the other sectors of the economy, the transport sector
accounts for 71 percent of the wage impacts but only 57 percent of the employment impacts.
The remainder of the total employment and wage impacts was generated by the indirect
spending in the other sectors of the economy.
94 The industry sectors include the following activities:
Manufacturing & Construction: residential and nonresidential construction and all manufacturing Commercial Services: wholesale and retail trade, lodging and eating and drinking establishments Transportation & Utilities: tour operators, port services, telecommunications and water and power utilities Business & Financial Services: banking, insurance, legal, accounting, leasing and other business services Community Services & Government: education, health and social services and government agencies
Figure 73 – Total Employment Impacts by
Sector - St. Vincent and the Grenadines
Commercial
Services42%
Transport &
Utilities57%
Business &
Financial Services
0%
Community
Services & Government
1%
Figure 74 – Total Wage Impacts by Sector
St. Vincent and the Grenadines
Commercial
Services27%
Transport &
Utilities71%
Business &
Financial Services
1%
Community
Services & Government
1%

Florida-Caribbean Cruise Assn. Economic Impact of Cruise Tourism
Business Research and Economic Advisors Page 171
Comparison to 2009 Study
Total passenger and crew declined by nearly 55 percent from 144,600 during the 2008/2009 cruise year to
65,700 during the 2011/2012 cruise year. Total direct cruise tourism expenditures declined by a similar
percentage, 56 percent, over the three year period, falling from $6.8 million to $3.0 million. As indicated in
Table 115, expenditures by cruise lines, passengers and crew declined.
Table 115 – Comparison of Cruise Tourism Impacts, Current Study versus 2009 Study
St. Vincent and the Grenadines
Current
Study 2009
Study Percent Change
Total Onshore Visits (Thousands) 65.7 144.6 -54.6%
Passengers 58.8 124.7 -52.8%
Crew 6.9 19.9 -65.3%
Total Direct Expenditures ($US Millions) $ 3.0 $ 6.8 -55.9%
Passengers $ 1.6 $ 4.2 -61.9%
Crew $ 0.1 $ 0.3 -66.7%
Cruise Lines $ 1.3 $ 2.3 -43.5%
Average Per Passenger Expenditure $27.05 $33.50 -19.3% Average Per Crew Expenditure $21.40 $17.61 +21.5%
Total Employment Impact 80 159 -49.7%
Total Wage Impact ($US Millions) $ 0.8 $ 1.5 -46.7%
The 62 percent decrease in passenger expenditures was the result of a the 53 percent decrease in
passenger visits and the 19 percent decline in average passenger expenditures. Cruise passengers tended to
make smaller purchases in most categories which were partially offset by an increase in the percentage of
passengers making onshore purchases. As a result, the average passenger expenditure declined from the
2008/2009 cruise year. For example, during the 2008/2009 cruise year 20 percent of passengers reported
spending an average of $32.30 on clothing. During the 2011/2012 cruise year 25 percent of passengers
reported purchasing clothing but only spent an average of $25.50. Similar changes occurred for the
purchase of food and beverages and jewelry.
The decrease in crew expenditures was the net result of the 65 percent decline in crew visits and the 22
percent increase in average crew expenditures. The decrease in crew spending was concentrated in crew
expenditures for local transportation, food and beverages and entertainment.
As a result of the 56 percent decline in direct cruise tourism expenditures from the 2008/2009 cruise year,
the economic impacts fell as well. The total employment and wage impacts decreased by slightly less than
50 percent during the three-year period.

Florida-Caribbean Cruise Assn. Economic Impact of Cruise Tourism
Business Research and Economic Advisors Page 172
Passenger Surveys
A total of 813 passenger surveys were completed and returned for tabulation. Table 116 shows
the major attributes of passenger visits in St. Vincent and the Grenadines as derived from the
passenger surveys.
Of the 813 cruise parties that completed the surveys 75% stated that this had been
their first visit to St. Vincent and the Grenadines. This was down from 86% in the
2009 study.
Ninety-nine percent (99%) of the cruise parties that completed the surveys
disembarked their cruise ship to visit St. Vincent and the Grenadines.
Table 116 - Major Attributes of Passenger Surveys - St. Vincent and the Grenadines
Number Percent
Total Respondents 813
Number Making First Visit 610 75.0%
Number Ashore 804 98.9%
Number Making Onshore Purchases: 366 45.5%
Average Hours Ashore 3.5
Average Size of Expenditure Party (Persons) 2.0
Average Onshore Expenditure per Party $30.80
Purchased a Shore Excursion (Tour) 286 35.6%
Purchased Onshore Tour from:
Cruise Line 156 54.5%
Onshore from Tour Operator 84 29.3%
Travel Agent 46 16.2%
Average Cost of Shore Excursion per Party $95.80
Toured On Own/Did not Tour 518
Of the cruise parties that went ashore, 46% made at least one purchase while
ashore, a decline from 76% during the 2008/2009 cruise year. The typical cruise
party consisted of 2.0 passengers that spent an average of 3.5 hours ashore.
The responding cruise parties reported spending an average of $30.80 while ashore
(excludes shore excursions), a decline of 21 percent from $39 during the 2008/2009
cruise year.
Thirty-six percent (36%) of the passengers that went ashore purchased a shore
excursion. This is down from 49% in the 2009 study. Fifty-five percent (55%) of
passengers who purchased a tour did so through their cruise line, 29% purchased
their tour onshore and 16 percent purchased their tour through their travel agent.
The typical cruise party that purchased a shore excursion spent $95.80 for their
tour, a decline of 7 percent from the 2008/2009 cruise year.
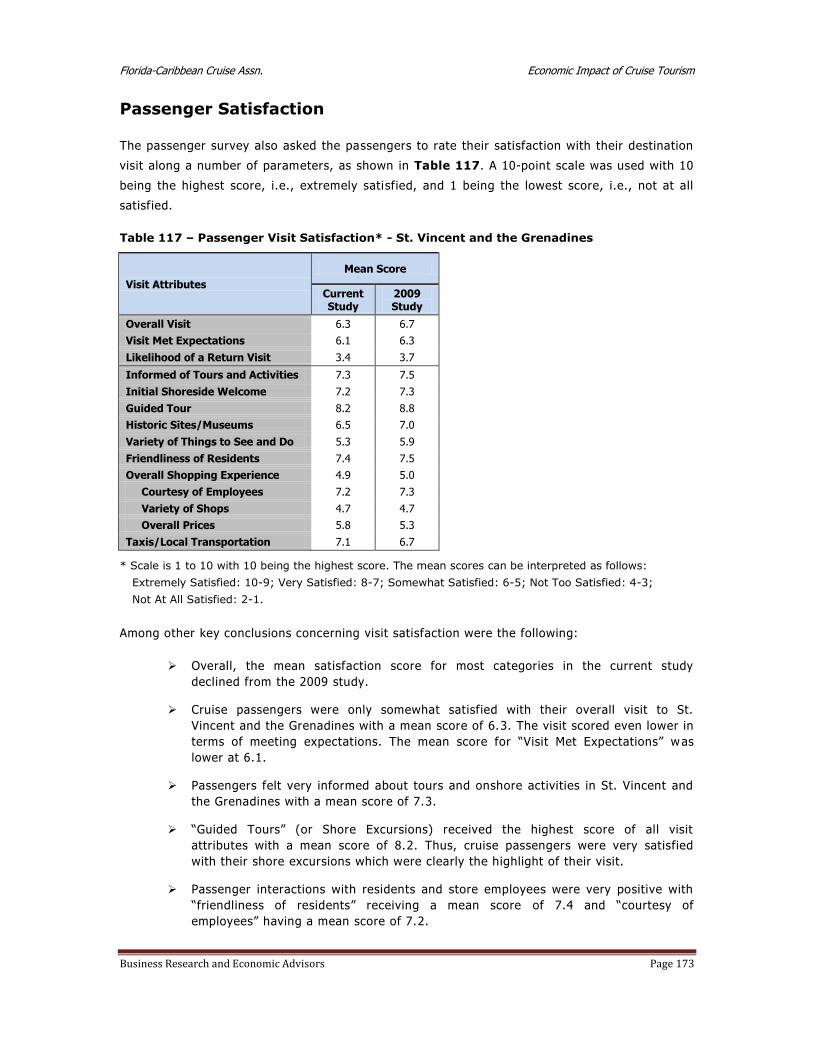
Florida-Caribbean Cruise Assn. Economic Impact of Cruise Tourism
Business Research and Economic Advisors Page 173
Passenger Satisfaction
The passenger survey also asked the passengers to rate their satisfaction with their destination
visit along a number of parameters, as shown in Table 117. A 10-point scale was used with 10
being the highest score, i.e., extremely satisfied, and 1 being the lowest score, i.e., not at all
satisfied.
Table 117 – Passenger Visit Satisfaction* - St. Vincent and the Grenadines
Visit Attributes
Mean Score
Current Study
2009 Study
Overall Visit 6.3 6.7
Visit Met Expectations 6.1 6.3
Likelihood of a Return Visit 3.4 3.7
Informed of Tours and Activities 7.3 7.5
Initial Shoreside Welcome 7.2 7.3
Guided Tour 8.2 8.8
Historic Sites/Museums 6.5 7.0
Variety of Things to See and Do 5.3 5.9
Friendliness of Residents 7.4 7.5
Overall Shopping Experience 4.9 5.0
Courtesy of Employees 7.2 7.3
Variety of Shops 4.7 4.7
Overall Prices 5.8 5.3
Taxis/Local Transportation 7.1 6.7
* Scale is 1 to 10 with 10 being the highest score. The mean scores can be interpreted as follows:
Extremely Satisfied: 10-9; Very Satisfied: 8-7; Somewhat Satisfied: 6-5; Not Too Satisfied: 4-3;
Not At All Satisfied: 2-1.
Among other key conclusions concerning visit satisfaction were the following:
Overall, the mean satisfaction score for most categories in the current study
declined from the 2009 study.
Cruise passengers were only somewhat satisfied with their overall visit to St.
Vincent and the Grenadines with a mean score of 6.3. The visit scored even lower in
terms of meeting expectations. The mean score for “Visit Met Expectations” was
lower at 6.1.
Passengers felt very informed about tours and onshore activities in St. Vincent and
the Grenadines with a mean score of 7.3.
“Guided Tours” (or Shore Excursions) received the highest score of all visit
attributes with a mean score of 8.2. Thus, cruise passengers were very satisfied
with their shore excursions which were clearly the highlight of their visit.
Passenger interactions with residents and store employees were very positive with
“friendliness of residents” receiving a mean score of 7.4 and “courtesy of
employees” having a mean score of 7.2.
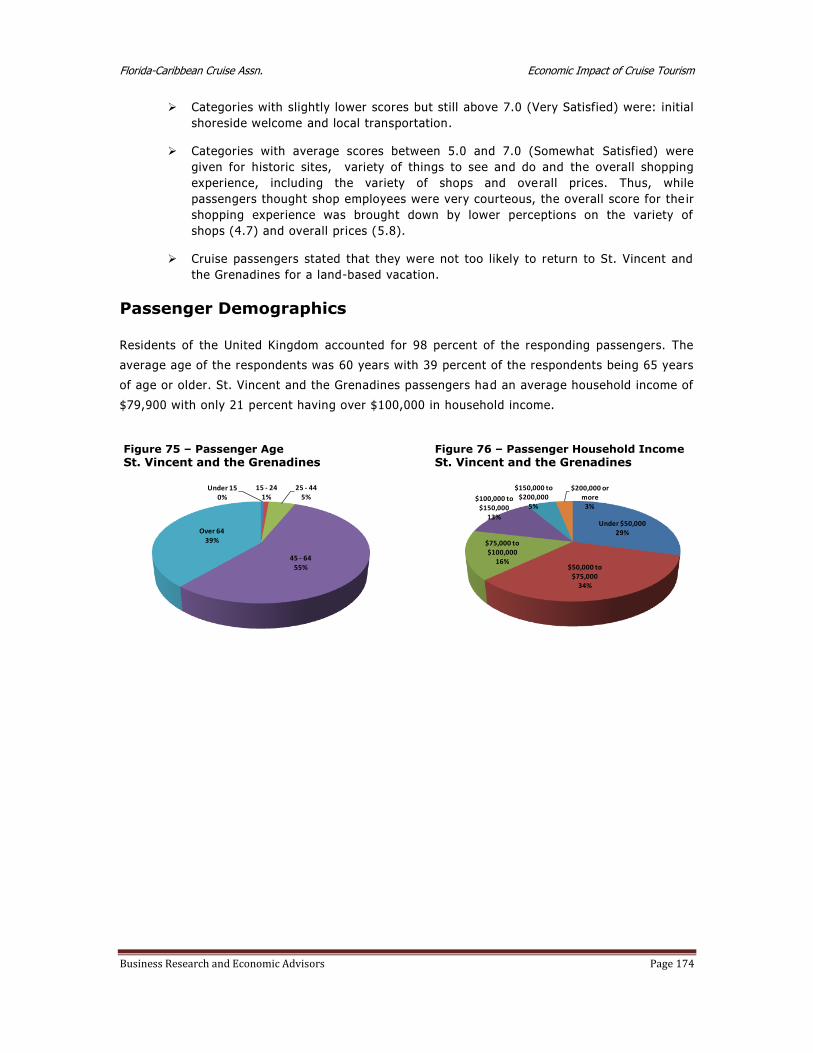
Florida-Caribbean Cruise Assn. Economic Impact of Cruise Tourism
Business Research and Economic Advisors Page 174
Categories with slightly lower scores but still above 7.0 (Very Satisfied) were: initial
shoreside welcome and local transportation.
Categories with average scores between 5.0 and 7.0 (Somewhat Satisfied) were
given for historic sites, variety of things to see and do and the overall shopping
experience, including the variety of shops and overall prices. Thus, while
passengers thought shop employees were very courteous, the overall score for the ir
shopping experience was brought down by lower perceptions on the variety of
shops (4.7) and overall prices (5.8).
Cruise passengers stated that they were not too likely to return to St. Vincent and
the Grenadines for a land-based vacation.
Passenger Demographics
Residents of the United Kingdom accounted for 98 percent of the responding passengers. The
average age of the respondents was 60 years with 39 percent of the respondents being 65 years
of age or older. St. Vincent and the Grenadines passengers had an average household income of
$79,900 with only 21 percent having over $100,000 in household income.
Figure 75 – Passenger Age
St. Vincent and the Grenadines
Under 150%
15 - 241%
25 - 445%
45 - 6455%
Over 6439%
Figure 76 – Passenger Household Income
St. Vincent and the Grenadines
Under $50,00029%
$50,000 to $75,000
34%
$75,000 to $100,000
16%
$100,000 to $150,000
13%
$150,000 to $200,000
5%
$200,000 or more
3%
Florida-Caribbean Cruise Assn. Economic Impact of Cruise Tourism
Business Research and Economic Advisors Page 175
Turks and Caicos
At the core of the analysis of the economic contribution of cruise tourism were a set of
passenger and crew surveys that were conducted onboard ships of the FCCA member cruise
lines.95 The surveys were undertaken during the six-month period beginning in December 2011
and ending in May 2012. The survey schedule was designed so that surveys were conducted by
FCCA member cruise lines that called at each destination and that the distribution of passenger
and crew surveys would reflect the distribution of passenger and crew arrivals by cruise line at
each destination. On any given cruise itinerary, passenger and crew surveys were placed in all
passenger cabins and crew quarters following a single destination call. The surveys were
completed by the passengers and crew in the privacy of their quarters and returned to a
designated office on the cruise ship. Thus, passengers and crew were only surveyed once during
a cruise itinerary and for a single destination. On a subsequent itinerary, passengers were
surveyed following a call at a different dest ination.
The passenger and crew surveys were designed to collect data for onshore spending and visit
satisfaction by both passengers and crew. While the crew survey was slightly shorter than the
passenger survey, both surveys were designed to collect the following information:
hours spent ashore;
expenditures by category, including shore tours, food & beverages, clothing, etc.;
visit satisfaction, including shore tour, f riendliness of residents, prices, shopping,
etc.;
likelihood of returning for a land-based vacation; and
demographic characteristics, including country of residence, age group, income, etc.
Combining the expenditure data collected from the passenger and cr ew surveys with data on
expenditures by cruise lines for port fees and services, payments to local tour operators for
passenger shore excursions purchased onboard the cruise ships, and other provisions purchased
locally by the cruise lines, estimates of total cruise tourism expenditures were developed for
each participating destination.
Given the direct spending estimates, the economic contribution of these expenditures, as
measured by employment and wage income were then estimated for each de stination. This
process began with the collection of economic data for each destination from a combination of
local, regional and international sources. Utilizing all of these data a set of economic impact
models were developed for each destination to estimate the direct and total employment and
wage impacts. A more detailed description of these models is provided in the Data and
Methods section of Volume I.
95 Surveys were conducted on the ships of the following cruise lines: Carnival Cruise Lines, Celebrity Cruises, Disney Cruise Line, Holland America Line, Norwegian Cruise Line, Princess Cruises, P&O Cruises and Royal Caribbean International.

Florida-Caribbean Cruise Assn. Economic Impact of Cruise Tourism
Business Research and Economic Advisors Page 176
Cruise Tourism Expenditures
Cruise tourism expenditures in destination ports are composed of a broad range of spending
including:
onshore expenditures by passengers which tend to be concentrated in shore excursions
and retail purchases of clothing, jewelry and local crafts and souvenirs;
onshore expenditures by crew which are generally concentrated in purchases of fo od
and beverages, local transportation and retail purchases of clothing and electronics ;
expenditures by cruise lines for port services, such as dockage fees and linesmen,
utilities, such as water and power and navigation services; and
purchases of supplies, such as food and other stores, by the cruise lines from local
businesses.
According to data obtained from Ministry of Tourism, 804,674 cruise passengers arrived aboard
cruise ships during the 2011/2012 cruise year.96 Of these, an estimated 724,207 passengers (90
percent) disembarked and visited the Turks and Caicos. Utilizing additional data provided by the
Tourism Ministry and visiting cruise lines, we have estimated that 304,981 crew were aboard the
cruise ships and that 40 percent, or 121,992 crew, disembarked and visited the Turks and
Caicos. These passenger and crew visits along with additional expend itures by the cruise lines
generated a total of $60.6 million ($US) in cruise tourism expenditures in the Turks and
Caicos during the 2011/2012 cruise year. The contribution of expenditures by passengers, crew
and cruise lines to this total is discussed below.
Table 118 – Estimated Passenger Spending ($US) in the Turks and Caicos, 2011/2012 Cruise
Year97
Purchase Categories Average Spend
per Party Share of All
Onshore Visits
Weighted Average Spend
per Party
F&B at Restaurants & Bars $ 33.80 53.5% $ 18.09
Shore Excursions $ 70.50 44.2% $ 31.13
Clothing $ 54.20 43.1% $ 23.33
Local Crafts & Souvenirs $ 24.40 33.2% $ 8.09
Watches & Jewelry $ 245.50 18.7% $ 45.88
Other Purchases $ 45.40 14.4% $ 6.53
Taxis/Ground Transportation $ 29.90 12.2% $ 3.66
Retail Purchases of Liquor $ 33.50 5.7% $ 1.90
Perfumes & Cosmetics $ 50.10 3.0% $ 1.52
Entertainment/Night Clubs/Casinos $ 42.90 0.5% $ 0.21
Telephone & Internet $ 47.70 0.3% $ 0.14
Electronics $ 25.60 0.2% $ 0.05
Total Spend per Cruise Party $140.53
Average Size of a Cruise Party 2.2
Total Spend per Cruise Passenger $63.88
Cruise Passenger Visits 724,207
Total Cruise Passenger Expenditures $46,258,804
96 The 2011/2012 cruise year includes the twelve months beginning in May, 2011 and ending in April, 2012. 97 The average shore excursion expenditure is a weighted average of the onshore and Internet purchases and the portion of the onboard purchases paid to local tour operators.

Florida-Caribbean Cruise Assn. Economic Impact of Cruise Tourism
Business Research and Economic Advisors Page 177
Per passenger spending estimates were derived from the 1,469 surveys completed by
passengers that went ashore during the survey period. As shown in Table 118, each passenger
cruise party spent an average of $140.53 in the Turks and Caicos. The average spend per cruise
party is the sum of the weighted spending in each of the twelve categories. For example, 54
percent of the survey respondents reported spending an average of $33.80 at local restaurants
and/or bars. Spread over the cruise parties that visited the Turks and Caicos, this represents an
average of $18.09 per party. On a per passenger basis, the average total expenditure was
$63.88. This represents the sum of per party expenditures, $140.53, divided by the average size
of a cruise party in the Turks and Caicos, 2.2 passengers.
Cruise passenger expenditures in the Turks and Caicos were concentrated in four categories
which accounted for nearly 85 percent of their onshore expenditures: watches and jewelry,
shore excursions, clothing and food and beverages. Forty percent (40%) or more of the
passengers that went ashore made purchases of food and beverages, shore excursions and
clothing.
Forty-four percent (44%) of the passengers reported that their cruise party purchased a shore
excursion. The effective local price of the shore excursion was $70.50 per party but when the
full price of the purchase from cruise lines and travel agents is included passengers spent an
average of $116 per party for their tours.
For the entire 2011/2012 cruise year, the estimated 724,207 cruise passengers who visited the
Turks and Caicos spent a total of $46.3 million ($US).
Table 119 – Estimated Crew Spending ($US) in the Turks and Caicos, 2011/2012 Cruise Year
Purchase Categories Average Spend
per Crew Share of All
Onshore Visits
Weighted Average Spend
per Crew
F&B at Restaurants & Bars $ 37.70 50.5% $ 19.07
Taxis/Ground Transportation $ 12.10 9.7% $ 1.17
Local Crafts & Souvenirs $ 16.60 9.1% $ 1.52
Perfumes & Cosmetics $ 67.50 7.5% $ 5.08
Other Purchases $ 109.00 5.4% $ 5.86
Clothing $ 41.10 4.8% $ 1.99
Watches & Jewelry $ 139.30 4.3% $ 5.99
Telephone & Internet $ 9.70 2.7% $ 0.26
Shore Excursions $ 16.10 1.6% $ 0.26
Total Spend per Crew $41.20
Cruise Passenger Visits 121,992
Total Cruise Passenger Expenditures $5,026,087
Per crew spending estimates were derived from the nearly 400 crew surveys completed by crew
members during the survey period. Based upon these data, and as shown in Table 119, crew
members were estimated to have spent an average of $41.20 in the Turks and Caicos. The
average spend per crew member is the sum of the weighted spending in each of the nine

Florida-Caribbean Cruise Assn. Economic Impact of Cruise Tourism
Business Research and Economic Advisors Page 178
categories.98 For example, 51 percent of the survey respondents reported spending an average
of $37.70 for food and beverages. Spread over all the crew members that visited the Turks and
Caicos, this represents an average of $19.07 per crew member.
Expenditures by crew in the Turks and Caicos were concentrated in three categories which
accounted for nearly 75 percent of their onshore expenditures: food and beverages, watches
and jewelry and perfumes and cosmetics. Combined, crew spent an average of $30.14 for goods
in these three categories. Purchases of food and beverages were the most popular expenditure
item with 51% percent of the crew reporting the purchase of food and beverages.
For the entire 2011/2012 cruise year, the estimated, 121,992 crew who visited the Turks and
Caicos spent an estimated total of $5.0 million ($US).
Cruise lines made payments to local businesses for a variety of goods and services. Net
payments to local vendors for shore excursions have been included with passenger
expenditures. However, cruise lines made other local expenditures, including payments for port
fees and taxes, navigation services, utilities and other supplies. Based upon data provided by
the FCCA member cruise lines, we estimated that all cruise lines spent $9.3 million ($US) in
The Turks and Caicos during the 2011/2012 cruise year. Essentially all of these expenditures
were payments for port fees and taxes and navigation services.
Economic Contribution of Cruise Tourism Expenditures
As noted in the Data and Methods section of the full report, a set of economic impact models
were developed for each destination to produce estimates of the economic contribution of cruise
tourism. Data for these models were collected from a broad range of local, regional and
international sources. The impact models were designed to reflect the economic structure of
each destination, including the industrial composition of Gross Domestic Product (GDP), the
wage share of GDP by industry and average employee wages by industry.
Table 120 – Total Economic Contribution of Cruise Tourism in the Turks and Caicos
2011/2012 Cruise Year
Employment Wage Income ($US Millions)
Direct Economic Contribution 715 $11.9
Total Economic Contribution 1,115 $18.6
As shown in Table 120, the $60.6 million in total cruise tourism expenditures generated direct
employment of 715 residents of the Turks and Caicos paying $11.9 million in annual wages.
Adding the indirect contribution that results from the spending of those local businesses that
are the direct recipients of passenger, crew and cruise line expenditures , the direct cruise
98 No purchases of entertainment or retail purchases of liquor or electronics were reported by crew visiting the Turks and Caicos.

Florida-Caribbean Cruise Assn. Economic Impact of Cruise Tourism
Business Research and Economic Advisors Page 179
tourism expenditures generated a total employment contribution of 1,115 jobs and $18.6 million
in wage income in The Turks and Caicos during the 2011/2012 cruise year.
As shown in Figures 77 and 78, the total employment and wage impacts of cruise tourism are
concentrated in the commercial and transport sectors which account for about 98 percent of the
employment and wage impacts.99 This is not surprising since the direct impacts account for
about 65 percent of the total employment impacts and that virtually all of the cruise tourism
expenditures are made with businesses in these sectors. Because of the relatively higher wages
in the transport sector compared to the other sectors of the economy, the transport sector
accounts for 33 percent of the wage impacts but only 21 percent of the employment impacts.
The remainder of the total employment and wage impacts was generated by the indirect
spending in the other sectors of the economy.
99 The industry sectors include the following activities:
Manufacturing & Construction: residential and nonresidential construction and all manufacturing Commercial Services: wholesale and retail trade, lodging and eating and drinking establishments Transportation & Utilities: tour operators, port services, telecommunications and water and power utilities Business & Financial Services: banking, insurance, legal, accounting, leasing and other business services Community Services & Government: education, health and social services and government agencies
Figure 77 – Total Employment Impacts by
Sector - Turks and Caicos
Manuf. &
Construction1%
Commercial
Services77%
Transport &
Utilities21%
Community
Services & Government
1%
Figure 78 – Total Wage Impacts by Sector
Turks and Caicos
Manuf. &
Construction1%
Commercial
Services64%
Transport &
Utilities33%
Community
Services & Government
2%
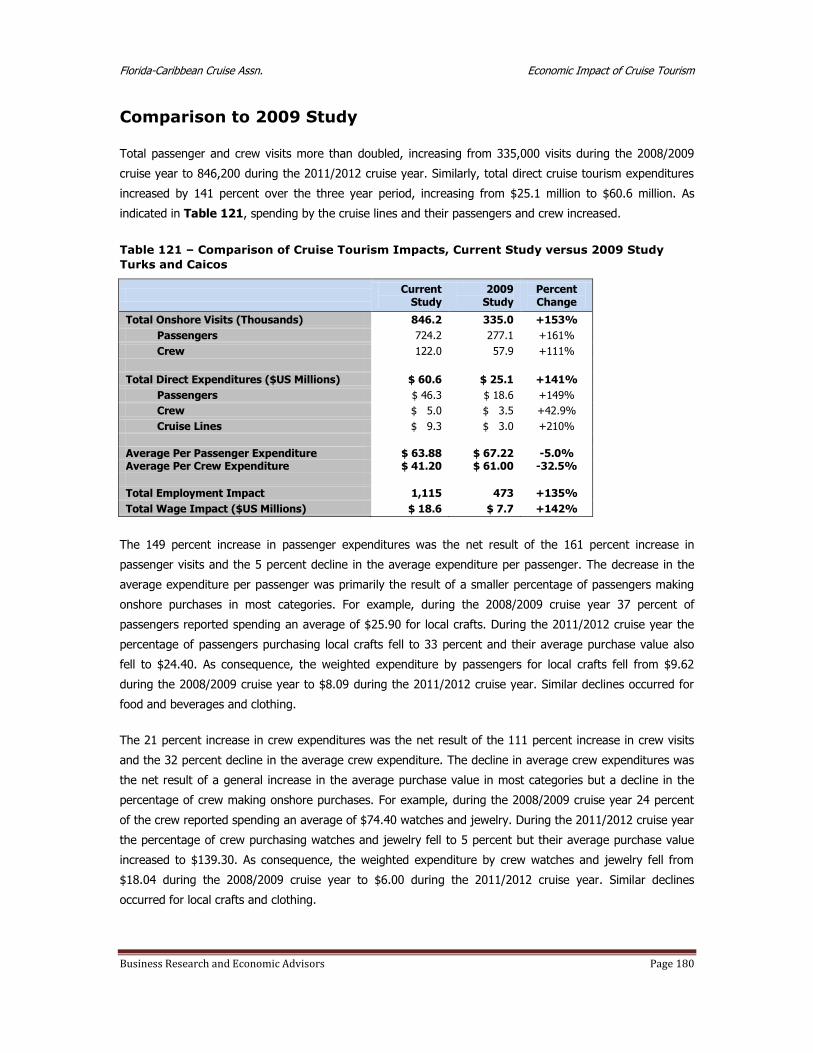
Florida-Caribbean Cruise Assn. Economic Impact of Cruise Tourism
Business Research and Economic Advisors Page 180
Comparison to 2009 Study
Total passenger and crew visits more than doubled, increasing from 335,000 visits during the 2008/2009
cruise year to 846,200 during the 2011/2012 cruise year. Similarly, total direct cruise tourism expenditures
increased by 141 percent over the three year period, increasing from $25.1 million to $60.6 million. As
indicated in Table 121, spending by the cruise lines and their passengers and crew increased.
Table 121 – Comparison of Cruise Tourism Impacts, Current Study versus 2009 Study
Turks and Caicos
Current
Study 2009
Study Percent Change
Total Onshore Visits (Thousands) 846.2 335.0 +153%
Passengers 724.2 277.1 +161%
Crew 122.0 57.9 +111%
Total Direct Expenditures ($US Millions) $ 60.6 $ 25.1 +141%
Passengers $ 46.3 $ 18.6 +149%
Crew $ 5.0 $ 3.5 +42.9%
Cruise Lines $ 9.3 $ 3.0 +210%
Average Per Passenger Expenditure $ 63.88 $ 67.22 -5.0% Average Per Crew Expenditure $ 41.20 $ 61.00 -32.5%
Total Employment Impact 1,115 473 +135%
Total Wage Impact ($US Millions) $ 18.6 $ 7.7 +142%
The 149 percent increase in passenger expenditures was the net result of the 161 percent increase in
passenger visits and the 5 percent decline in the average expenditure per passenger. The decrease in the
average expenditure per passenger was primarily the result of a smaller percentage of passengers making
onshore purchases in most categories. For example, during the 2008/2009 cruise year 37 percent of
passengers reported spending an average of $25.90 for local crafts. During the 2011/2012 cruise year the
percentage of passengers purchasing local crafts fell to 33 percent and their average purchase value also
fell to $24.40. As consequence, the weighted expenditure by passengers for local crafts fell from $9.62
during the 2008/2009 cruise year to $8.09 during the 2011/2012 cruise year. Similar declines occurred for
food and beverages and clothing.
The 21 percent increase in crew expenditures was the net result of the 111 percent increase in crew visits
and the 32 percent decline in the average crew expenditure. The decline in average crew expenditures was
the net result of a general increase in the average purchase value in most categories but a decline in the
percentage of crew making onshore purchases. For example, during the 2008/2009 cruise year 24 percent
of the crew reported spending an average of $74.40 watches and jewelry. During the 2011/2012 cruise year
the percentage of crew purchasing watches and jewelry fell to 5 percent but their average purchase value
increased to $139.30. As consequence, the weighted expenditure by crew watches and jewelry fell from
$18.04 during the 2008/2009 cruise year to $6.00 during the 2011/2012 cruise year. Similar declines
occurred for local crafts and clothing.

Florida-Caribbean Cruise Assn. Economic Impact of Cruise Tourism
Business Research and Economic Advisors Page 181
As a result of the 141 percent increase in total expenditures, the total employment impacts increased by
135 percent while the wage income impact increased by 142 percent. The higher increase in wages is due
to increased labor productivity and average wages over the intervening period.
Passenger Surveys
A total of 1,469 passenger surveys were completed and returned for tabulation. Table 122
shows the major attributes of passenger visits in the Turks and Caicos as derived from the
passenger surveys.
Of the 1,469 cruise parties that completed the surveys 80% stated that this had
been their first visit to the Turks and Caicos. This down from 86% in the 2009
study.
Ninety-nine percent (99%) of the cruise parties that completed the surveys
disembarked their cruise ship to visit the Turks and Caicos.
Table 122 - Major Attributes of Passenger Surveys - Turks and Caicos
Number Percent
Total Respondents 1,469
Number Making First Visit 1,175 80.0%
Number Ashore 1,454 99.0%
Number Making Onshore Purchases: 1,022 70.3%
Average Hours Ashore 3.8
Average Size of Expenditure Party (Persons) 2.2
Average Onshore Expenditure per Party $109
Purchased a Shore Excursion (Tour) 642 44.2%
Purchased Onshore Tour from:
Cruise Line 557 86.8%
Onshore from Tour Operator 46 7.1%
Travel Agent 39 6.1%
Average Cost of Shore Excursion per Party $116
Toured On Own/Did not Tour 812
Of the cruise parties that went ashore, 70% made at least one purchase while
ashore. This is essentially unchanged from the 2008/2009 cruise year. The typical
cruise party consisted of 2.2 passengers and spent an average of 3.8 hours ashore.
The responding cruise parties reported spending an average of $109 while ashore
(excludes shore excursions). Again, this is essentially unchanged from the
2008/2009 cruise year.
Forty-four percent (44%) of the passengers that went ashore purchased a shore
excursion. This is up from 31% in the 2009 study. Eighty-seven percent (87%) of
passengers who purchased a tour did so through their cruise line, 7% purchased
their tour onshore and 6 percent purchased their tour through their travel agent.
The typical cruise party that purchased a shore excursion spent $116 for their tour.
This is a 14 percent decline from $135 during the 2008/2009 cruise year.

Florida-Caribbean Cruise Assn. Economic Impact of Cruise Tourism
Business Research and Economic Advisors Page 182
Passenger Satisfaction
The passenger survey also asked the passengers to rate their satisfaction with their destination
visit along a number of parameters, as shown in Table 123. A 10-point scale was used with 10
being the highest score, i.e., extremely satisfied, and 1 being the lowest score, i.e., not at all
satisfied.
Table 123 – Passenger Visit Satisfaction* - Turks and Caicos
Visit Attributes
Mean Score
Current Study
2009 Study
Overall Visit 7.5 6.9
Visit Met Expectations 7.2 6.3
Likelihood of a Return Visit 4.4 4.1
Informed of Tours and Activities 7.9 7.0
Initial Shoreside Welcome 7.8 7.6
Guided Tour 8.2 7.7
Historic Sites/Museums 6.8 5.7
Variety of Things to See and Do 6.2 5.3
Friendliness of Residents 8.1 7.7
Overall Shopping Experience 6.8 6.5
Courtesy of Employees 7.9 7.7
Variety of Shops 6.6 6.2
Overall Prices 6.2 5.8
Taxis/Local Transportation 7.2 6.5
* Scale is 1 to 10 with 10 being the highest score. The mean scores can be interpreted as follows:
Extremely Satisfied: 10-9; Very Satisfied: 8-7; Somewhat Satisfied: 6-5; Not Too Satisfied: 4-3;
Not At All Satisfied: 2-1.
Among other key conclusions concerning visit satisfaction were the following:
Passenger satisfaction scores for most categories in the current study increased by
a half point or better from the 2009 study.
Cruise passengers were very satisfied with their overall visit to the Turks and Caicos
with a mean score of 7.5. Passengers also reported that the visit exceeded their
expectations. The mean score for “Visit Met Expectations” was 7.2, up from 6.3 in
the 2009 study.
Passengers felt very informed about tours and onshore activities in the Turks and
Caicos with a mean score of 7.9.
“Guided Tours” (or Shore Excursions) received the highest score of all visit
attributes with a mean score of 8.2. Thus, cruise passengers were very satisfied
with their shore excursions.
Passenger interactions with residents and store employees were very positive with
“friendliness of residents” receiving a mean score of 8.1 and “courtesy of
employees” having a mean score of 7.9.

Florida-Caribbean Cruise Assn. Economic Impact of Cruise Tourism
Business Research and Economic Advisors Page 183
Cruise passengers were very satisfied with their initial shoreside welcome which
received a mean score of 7.6 and local transportation with a mean score of 7.2.
Categories with average scores between 5.0 and 7.0 (Somewhat Satisfied) were
given for historic sites, variety of things to see and do, local transportation and the
overall shopping experience, including the variety of shops and overall prices. Thus,
while passengers thought shop employees were very courteous, the overall score for
their shopping experience was brought down by lower perceptions on the variety of
shops (6.6) and overall prices (6.2).
Cruise passengers stated that they were not too likely to return to the Turks and
Caicos for a land-based vacation.
Passenger Demographics
Residents of the United States and Canada accounted for 95 percent of the respondents. The
average age of the respondents was 53 years with 33 percent of the respondents being 65 years
of age or older. The Turks and Caicos passengers had an average household income of
$108,700 with 42 percent having over $100,000 in household income.
Figure 79 – Passenger Age
Turks and Caicos
Under 155%
15 - 246%
25 - 4415%
45 - 6441%
Over 6433%
Figure 80 – Passenger Household Income
Turks and Caicos
Under $50,00012%
$50,000 to $75,000
25%
$75,000 to $100,000
20%
$100,000 to $150,000
23%
$150,000 to $200,000
10%
$200,000 or more10%
Florida-Caribbean Cruise Assn. Economic Impact of Cruise Tourism
Business Research and Economic Advisors Page 184
U.S. Virgin Islands
At the core of the analysis of the economic contribution of cruise tourism were a set of
passenger and crew surveys that were conducted onboard ships of the FCCA member cruise
lines.100 The surveys were undertaken during the six-month period beginning in December 2011
and ending in May 2012. The survey schedule was designed so that surveys were conducted by
FCCA member cruise lines that called at each destination and that the distribution of passenger
and crew surveys would reflect the distribution of passenger and crew arrivals by cruise line at
each destination. On any given cruise itinerary, passenger and crew surveys were placed in all
passenger cabins and crew quarters following a single destination call. The surveys were
completed by the passengers and crew in the privacy of their quarters and returned to a
designated office on the cruise ship. Thus, passengers and crew were only surveyed once during
a cruise itinerary and for a single destination. On a subsequent itinerary, passengers were
surveyed following a call at a different dest ination.
The passenger and crew surveys were designed to collect data for onshore spending and visit
satisfaction by both passengers and crew. While the crew survey was slightly shorter than the
passenger survey, both surveys were designed to collect the following information:
hours spent ashore;
expenditures by category, including shore tours, food & beverages, clothing, etc.;
visit satisfaction, including shore tour, friendliness of residents, prices, shopping,
etc.;
likelihood of returning for a land-based vacation; and
demographic characteristics, including country of residence, age group, income, etc.
Combining the expenditure data collected from the passenger and crew surveys with data on
expenditures by cruise lines for port fees and services, payments to local tour operators for
passenger shore excursions purchased onboard the cruise ships, and other provisions purchased
locally by the cruise lines, estimates of total cruise tourism expenditures were developed for
each participating destination.
Given the direct spending estimates, the economic contribution of these expenditures, as
measured by employment and wage income were then estimated for each de stination. This
process began with the collection of economic data for each destination from a combination of
local, regional and international sources. Utilizing all of these data a set of economic impact
models were developed for each destination to estimate the direct and total employment and
wage impacts. A more detailed description of these models is provided in the Data and
Methods section of Volume I.
100 Surveys were conducted on the ships of the following cruise lines: Carnival Cruise Lines, Celebrity Cruises, Disney Cruise Line, Holland America Line, Norwegian Cruise Line, Princess Cruises, P&O Cruises and Royal Caribbean International.

Florida-Caribbean Cruise Assn. Economic Impact of Cruise Tourism
Business Research and Economic Advisors Page 185
Cruise Tourism Expenditures
Cruise tourism expenditures in destination ports are composed of a broad range of spending
including:
onshore expenditures by passengers which tend to be concentrated in shore excursions
and retail purchases of clothing, jewelry and local crafts and souvenirs;
onshore expenditures by crew which are generally concentrated in purchases of food
and beverages, local transportation and retail purchases of clothing and electronics ;
expenditures by cruise lines for port services, such as dockage f ees and linesmen,
utilities, such as water and power and navigation services; and
purchases of supplies, such as food and other stores, by the cruise lines from local
businesses.
According to data obtained from the Department of Tourism and the CTO, an estimated 2.0
million cruise passengers arrived aboard cruise ships during the 2011/2012 cruise year.101 Of
these, an estimated 1.8 million passengers (90 percent) disembarked and visited U.S. Virgin
Islands. Utilizing additional data provided by the visiting cruise lines, we have estimated that
745,634 crew were aboard the cruise ships and that 46 percent, or 342,355 crew, disembarked
and visited the U.S. Virgin Islands. These passenger and crew visits along with additional
expenditures by the cruise lines generated a total of $339.8 million ($US) in cruise tourism
expenditures in the U.S. Virgin Islands during the 2011/2012 cruise year. The contribution of
expenditures by passengers, crew and cruise lines to this total is discussed below.
Table 124 – Estimated Passenger Spending ($US) in the U.S. Virgin Islands,
2011/2012 Cruise Year102
Purchase Categories Average Spend
per Party Share of All
Onshore Visits
Weighted Average Spend
per Party
Clothing $ 63.30 48.4% $ 30.64
F&B at Restaurants & Bars $ 27.70 45.9% $ 12.70
Shore Excursions $ 73.00 45.5% $ 33.23
Taxis/Ground Transportation $ 34.60 44.5% $ 15.40
Watches & Jewelry $ 547.30 34.3% $ 187.67
Local Crafts & Souvenirs $ 30.50 33.7% $ 10.29
Other Purchases $ 72.80 20.0% $ 14.57
Retail Purchases of Liquor $ 53.70 15.9% $ 8.56
Perfumes & Cosmetics $ 68.20 6.9% $ 4.73
Electronics $ 192.60 2.0% $ 3.84
Entertainment/Night Clubs/Casinos $ 47.20 1.7% $ 0.79
Telephone & Internet $ 20.70 1.6% $ 0.33
Total Spend per Cruise Party $322.75
Average Size of a Cruise Party 2.2
Total Spend per Cruise Passenger $146.70
Cruise Passenger Visits 1,795,884
Total Cruise Passenger Expenditures $263,461,201
101 The 2011/2012 cruise year includes the twelve months beginning in May, 2011 and ending in April, 2012. 102 The average shore excursion expenditure is a weighted average of the onshore and Internet purchases and the portion of the onboard purchases paid to local tour operators.

Florida-Caribbean Cruise Assn. Economic Impact of Cruise Tourism
Business Research and Economic Advisors Page 186
Per passenger spending estimates were derived from the 1,703 surveys completed by
passengers that went ashore during the survey period. As shown in Table 124, each passenger
cruise party spent an average of $322.75 in the U.S. Virgin Islands. The average spend per
cruise party is the sum of the weighted spending in each of the twelve categories. For example,
46 percent of the survey respondents reported spending an average of $27.70 at local
restaurants and/or bars. Spread over the cruise parties that visited the U.S. Virgin Islands, this
represents an average of $12.70 per party. On a per passenger basis, the average total
expenditure was $146.70. This represents the sum of per party expenditures, $322.75, divided
by the average size of a cruise party in the U.S. Virgin Islands, 2.2 passengers.
Cruise passenger expenditures in the U.S. Virgin Islands were concentrated in four categories
which accounted for nearly 85 percent of their onshore expenditures: watches and jewelry,
shore excursions, clothing and ground transportation. Over 40 percent of the passengers that
went ashore made purchases of clothing, food and beverages, shore excursions and ground
transportation.
Forty-six percent (46%) of the passengers reported that their cruise party purchased a shore
excursion. The effective local price of the shore excursion was $73 per party but when the full
price of the purchase from cruise lines and travel agents is included passengers spent an
average of $120 per party for their tours.
For the entire 2011/2012 cruise year, the estimated 1.8 million cruise passengers who visited
the U.S. Virgin Islands spent a total of $263.5 million ($US).
Table 125 – Estimated Crew Spending ($US) in the U.S. Virgin Islands,
2011/2012 Cruise Year
Purchase Categories Average Spend
per Crew Share of All
Onshore Visits
Weighted Average Spend
per Crew
F&B at Restaurants & Bars $ 25.90 69.5% $ 18.00
Taxis/Ground Transportation $ 10.90 43.5% $ 4.74
Clothing $ 66.40 24.5% $ 16.27
Other Purchases $ 125.10 16.5% $ 20.64
Telephone & Internet $ 17.20 17.5% $ 3.01
Local Crafts & Souvenirs $ 18.30 16.0% $ 2.93
Electronics $ 322.20 14.5% $ 46.72
Retail Purchases of Liquor $ 53.10 8.0% $ 4.25
Perfumes & Cosmetics $ 92.50 7.5% $ 6.94
Watches & Jewelry $ 138.00 7.0% $ 9.66
Shore Excursions $ 9.20 6.0% $ 0.55
Entertainment/Night Clubs/Casinos $ 131.10 3.5% $ 4.59
Total Spend per Crew $138.30
Cruise Passenger Visits 342,355
Total Cruise Passenger Expenditures $47,347,737
Per crew spending estimates were derived from the nearly 300 surveys completed by crew
members during the survey period. As shown in Table 125, each crew member spent an
average of $138.30 in the U.S. Virgin Islands. The average spend per crew member is the sum
of the weighted spending in each of the twelve categories. For example, 70 percent of the

Florida-Caribbean Cruise Assn. Economic Impact of Cruise Tourism
Business Research and Economic Advisors Page 187
survey respondents reported spending an average of $25.90 for food and beverages. Spread
over all the crew members that visited the U.S. Virgin Islands, this represents an average of
$18.00 per crew member.
Expenditures by crew in the U.S Virgin Islands were concentrated in four categories which
accounted for nearly 75 percent of their onshore expenditures: electronics, food and beverages,
clothing and other (unspecified) purchases. Combined, crew spent an average of $102 for goods
in these four categories. Purchases of food and beverages were the most popular expenditure
item with 70% percent of the crew reporting the purchase of food and beverages.
For the entire 2011/2012 cruise year, the estimated 324,355 crew who visited the U.S. Virgin
Islands spent an estimated total of $47.3 million ($US).
Cruise lines made payments to local businesses for a variety of goods and services. Net
payments to local vendors for shore excursions have been included with passenger
expenditures. However, cruise lines made other local expenditures, including payments for port
fees and taxes, navigation services, utilities and other supplies. Based upon data provided by
the FCCA member cruise lines, we estimated that all cruise lines spent $28.9 million ($US) in
the Virgin Islands during the 2011/2012 cruise year. Approximately 80 percent of these
expenditures were payments for port fees and navigation services while the remaining 20
percent consisted of payments for ship supplies.
Economic Contribution of Cruise Tourism Expenditures
As noted in the Data and Methods section of the full report, a set of economic impact models
were developed for each destination to produce estimates of the economic contribution of cruise
tourism. Data for these models were collected from a broad range of local, regional and
international sources. The impact models were designed to reflect the economic structure of
each destination, including the industrial composition of Gross Domestic Product (GDP), the
wage share of GDP by industry and average employee wages by industry.
Table 126 – Total Economic Contribution of Cruise Tourism in the U.S. Virgin Islands
2011/2012 Cruise Year
Employment Wage Income ($US Millions)
Direct Economic Contribution 3,375 $ 74.4
Total Economic Contribution 6,349 $139.6
As shown in Table 126, the $339.8 million in total cruise tourism expenditures generated direct
employment of 3,375 residents of the U.S. Virgin Islands paying $74.4 million in annual wages.
Adding the indirect contribution that results from the spending of those local businesses that
are the direct recipients of passenger, crew and cruise line expenditures , the direct cruise
tourism expenditures generated a total employment contribution of 6,349 jobs and $139.6
million in wage income in the U.S. Virgin Islands during the 2011/2012 cruise year.

Florida-Caribbean Cruise Assn. Economic Impact of Cruise Tourism
Business Research and Economic Advisors Page 188
As shown in Figures 81 and 82, the total employment and wage impacts of cru ise tourism are
concentrated in the commercial and transport sectors which account for about 85 percent of the
employment and wage impacts.103 This is not surprising since the direct impacts account for
more than half of the total employment impacts and that virtually all of the cruise tourism
expenditures are made with businesses in these sectors. Because of the relatively lower wages
in the commercial sector relative to the other sectors of the U.S. Virgin Islands economy, the
commercial sector accounts for 75 percent of the employment impacts but only 70 percent of
the wage impacts. The remainder of the total employment and wage impacts was generated by
the indirect spending in the other sectors of the economy.
103 The industry sectors include the following activities:
Manufacturing & Construction: residential and nonresidential construction and all manufacturing Commercial Services: wholesale and retail trade, lodging and eating and drinking establishments Transportation & Utilities: tour operators, port services, telecommunications and water and power utilities Business & Financial Services: banking, insurance, legal, accounting, leasing and other business services Community Services & Government: education, health and social services and government agencies
Figure 81 – Total Employment Impacts by
Sector - U.S. Virgin Islands
Manuf. &
Construction2%
Commercial
Services75%
Transport &
Utilities14%
Business &
Financial Services
1%
Community
Services & Government
8%
Figure 82 – Total Wage Impacts by Sector
U.S. Virgin Islands
Manuf. &
Construction2%
Commercial
Services70%
Transport &
Utilities15%
Business &
Financial Services
2%
Community
Services & Government
11%
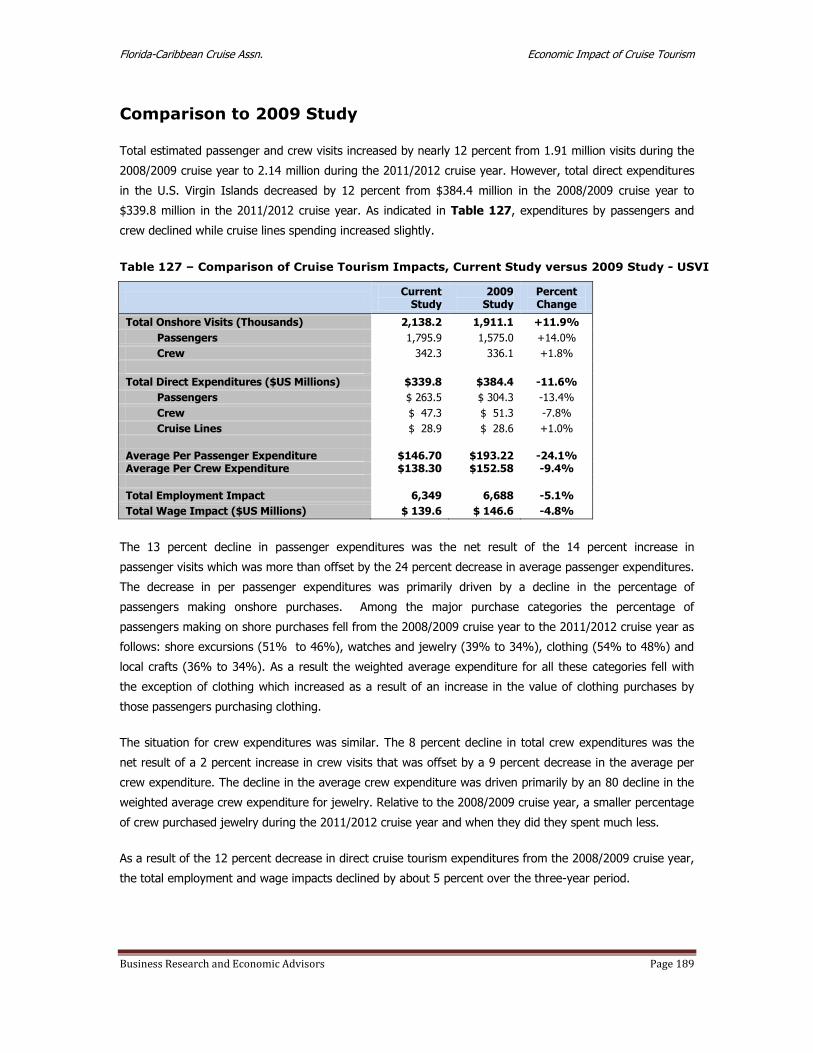
Florida-Caribbean Cruise Assn. Economic Impact of Cruise Tourism
Business Research and Economic Advisors Page 189
Comparison to 2009 Study
Total estimated passenger and crew visits increased by nearly 12 percent from 1.91 million visits during the
2008/2009 cruise year to 2.14 million during the 2011/2012 cruise year. However, total direct expenditures
in the U.S. Virgin Islands decreased by 12 percent from $384.4 million in the 2008/2009 cruise year to
$339.8 million in the 2011/2012 cruise year. As indicated in Table 127, expenditures by passengers and
crew declined while cruise lines spending increased slightly.
Table 127 – Comparison of Cruise Tourism Impacts, Current Study versus 2009 Study - USVI
Current
Study 2009
Study Percent Change
Total Onshore Visits (Thousands) 2,138.2 1,911.1 +11.9%
Passengers 1,795.9 1,575.0 +14.0%
Crew 342.3 336.1 +1.8%
Total Direct Expenditures ($US Millions) $339.8 $384.4 -11.6%
Passengers $ 263.5 $ 304.3 -13.4%
Crew $ 47.3 $ 51.3 -7.8%
Cruise Lines $ 28.9 $ 28.6 +1.0%
Average Per Passenger Expenditure $146.70 $193.22 -24.1% Average Per Crew Expenditure $138.30 $152.58 -9.4%
Total Employment Impact 6,349 6,688 -5.1%
Total Wage Impact ($US Millions) $ 139.6 $ 146.6 -4.8%
The 13 percent decline in passenger expenditures was the net result of the 14 percent increase in
passenger visits which was more than offset by the 24 percent decrease in average passenger expenditures.
The decrease in per passenger expenditures was primarily driven by a decline in the percentage of
passengers making onshore purchases. Among the major purchase categories the percentage of
passengers making on shore purchases fell from the 2008/2009 cruise year to the 2011/2012 cruise year as
follows: shore excursions (51% to 46%), watches and jewelry (39% to 34%), clothing (54% to 48%) and
local crafts (36% to 34%). As a result the weighted average expenditure for all these categories fell with
the exception of clothing which increased as a result of an increase in the value of clothing purchases by
those passengers purchasing clothing.
The situation for crew expenditures was similar. The 8 percent decline in total crew expenditures was the
net result of a 2 percent increase in crew visits that was offset by a 9 percent decrease in the average per
crew expenditure. The decline in the average crew expenditure was driven primarily by an 80 decline in the
weighted average crew expenditure for jewelry. Relative to the 2008/2009 cruise year, a smaller percentage
of crew purchased jewelry during the 2011/2012 cruise year and when they did they spent much less.
As a result of the 12 percent decrease in direct cruise tourism expenditures from the 2008/2009 cruise year,
the total employment and wage impacts declined by about 5 percent over the three-year period.

Florida-Caribbean Cruise Assn. Economic Impact of Cruise Tourism
Business Research and Economic Advisors Page 190
Passenger Surveys
A total of 1,703 passenger surveys were completed and returned for tabulation. Table 128
shows the major attributes of passenger visits in the U.S. Virgin Islands as derived from the
passenger surveys.
Table 128 - Major Attributes of Transit Passenger Surveys - U.S. Virgin Islands
Number Percent
Total Respondents 1,703
Number Making First Visit 664 39.0%
Number Ashore 1,654 97.1%
Number Making Onshore Purchases: 1,254 75.8%
Average Hours Ashore 4.5
Average Size of Expenditure Party (Persons) 2.2
Average Onshore Expenditure per Party $272
Purchased a Shore Excursion (Tour) 753 45.5%
Purchased Onshore Tour from:
Cruise Line 571 75.8%
Onshore from Tour Operator 125 16.6%
Travel Agent 57 7.6%
Average Cost of Shore Excursion per Party $120
Toured On Own/Did not Tour 901
Of the 1,703 cruise parties that completed the surveys 39% stated that this had
been their first visit to the U.S. Virgin Islands. This is a decline from 44% in the
2009 study.
Ninety-seven percent (97%) of the cruise parties that completed the surveys
disembarked their cruise ship to visit the U.S. Virgin Islands.
Of the cruise parties that went ashore, 76% made at least one purchase while
ashore. This is a decline from 82% during the 2008/2009 cruise year. The typical
cruise party consisted of 2.2 passengers that spent an average of 4.5 hours ashore.
The responding cruise parties reported spending an average of $272 while ashore
(excludes shore excursions), a decline of 26 percent from $367 during the
2008/2009 cruise year.
Forty-six percent (46%) of the passengers that went ashore purchased a shore
excursion. This is a decline from 51 percent in the 2009 study. Seventy-six percent
(76%) of passengers who purchased a tour did so through their cruise line, 17%
purchased their tour onshore and 7 percent purchased their tour through their
travel agent.
The typical cruise party that purchased a shore excursion spent $120 for their tour.
This is a 9 percent increase from $110 during the 2008/2009 cruise year.

Florida-Caribbean Cruise Assn. Economic Impact of Cruise Tourism
Business Research and Economic Advisors Page 191
Passenger Satisfaction
The passenger survey also asked the passengers to rate their satisfaction with their destination
visit along a number of parameters, as shown in Table 129. A 10-point scale was used with 10
being the highest score, i.e., extremely satisfied, and 1 being the lowest score, i.e., not at all
satisfied.
Table 129 – Passenger Visit Satisfaction* - U.S. Virgin Islands
Visit Attributes
Mean Score
Current Study
2009 Study
Overall Visit 7.9 8.0
Visit Met Expectations 7.4 7.4
Likelihood of a Return Visit 5.8 5.4
Informed of Tours and Activities 8.0 8.0
Initial Shoreside Welcome 7.6 7.6
Guided Tour 7.9 8.1
Historic Sites/Museums 7.0 7.2
Variety of Things to See and Do 7.2 7.4
Friendliness of Residents 8.1 8.0
Overall Shopping Experience 7.5 7.5
Courtesy of Employees 8.2 8.1
Variety of Shops 7.2 7.2
Overall Prices 7.0 7.1
Taxis/Local Transportation 7.6 7.7
* Scale is 1 to 10 with 10 being the highest score. The mean scores can be interpreted as follows:
Extremely Satisfied: 10-9; Very Satisfied: 8-7; Somewhat Satisfied: 6-5; Not Too Satisfied: 4-3;
Not At All Satisfied: 2-1.
Among other key conclusions concerning visit satisfaction were the following:
Cruise passenger satisfaction with the various attributes of their visit to the U.S.
Virgin islands changed very little from the 2009 study.
Cruise passengers were very satisfied with their overall visit to the U.S. Virgin
Islands with a mean score of 7.9. They also reported that their visit exceeded their
expectations. The mean score for “Visit Met Expectations” was lower at 7.4.
Passengers felt very informed about tours and onshore activities in the U.S. Virgin
Islands with a mean score of 8.0.
“Guided Tours” (or Shore Excursions) received a mean score of 7.9. Thus, cruise
passengers were very satisfied with their shore excursions.
Passenger interactions with residents and store employees were very positive with
“friendliness of residents” receiving a mean score of 8.1 and “courtesy of
employees” having a mean score of 8.2.
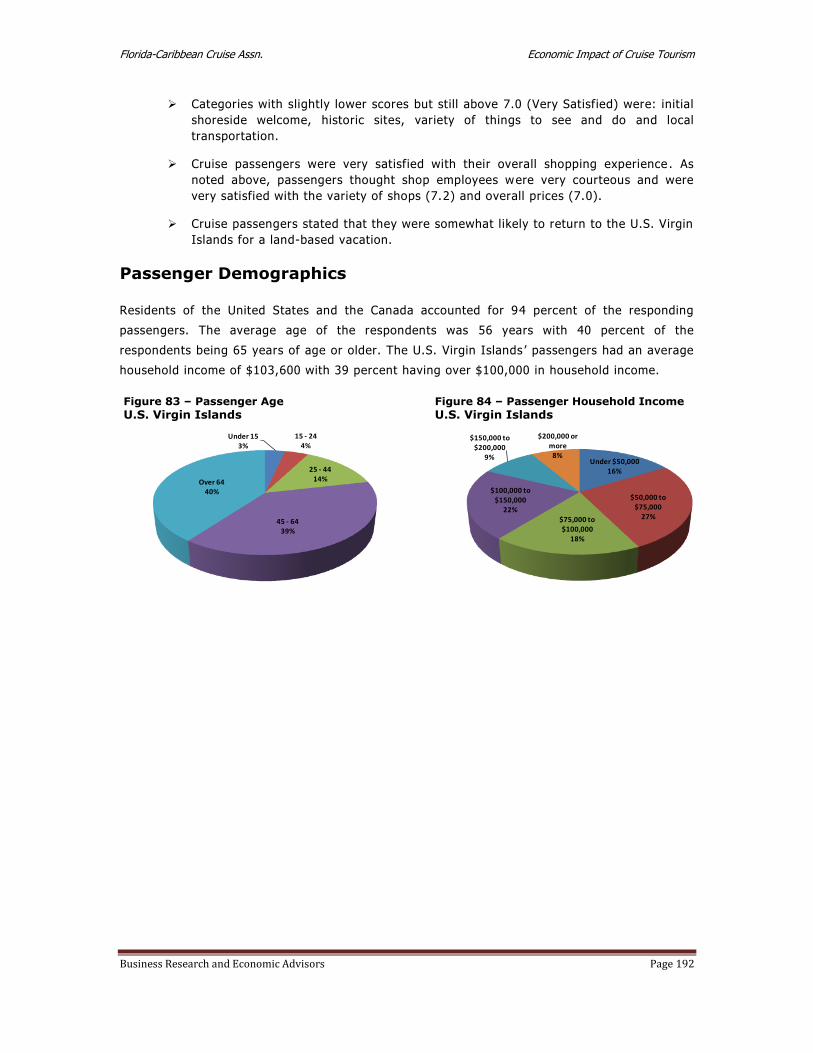
Florida-Caribbean Cruise Assn. Economic Impact of Cruise Tourism
Business Research and Economic Advisors Page 192
Categories with slightly lower scores but still above 7.0 (Very Satisfied) were: initial
shoreside welcome, historic sites, variety of things to see and do and local
transportation.
Cruise passengers were very satisfied with their overall shopping experience . As
noted above, passengers thought shop employees were very courteous and were
very satisfied with the variety of shops (7.2) and overall prices (7.0).
Cruise passengers stated that they were somewhat likely to return to the U.S. Virgin
Islands for a land-based vacation.
Passenger Demographics
Residents of the United States and the Canada accounted for 94 percent of the responding
passengers. The average age of the respondents was 56 years with 40 percent of the
respondents being 65 years of age or older. The U.S. Virgin Islands ’ passengers had an average
household income of $103,600 with 39 percent having over $100,000 in household income.
Figure 83 – Passenger Age
U.S. Virgin Islands
Under 153%
15 - 244%
25 - 4414%
45 - 6439%
Over 6440%
Figure 84 – Passenger Household Income
U.S. Virgin Islands
Under $50,00016%
$50,000 to $75,000
27%$75,000 to $100,000
18%
$100,000 to $150,000
22%
$150,000 to $200,000
9%
$200,000 or more
8%

Florida-Caribbean Cruise Association Economic Impact of Cruise Tourism
Business Research and Economic Advisors Page 193
BREA specializes in custom market analyses for clients throughout the private and public
sectors. These unique market analyses integrate economic, financial, and demographic trends
with primary market research, proprietary client data, and advanced statis tical and modeling
techniques. This approach results in comprehensive and actionable analysis, databases and
models, designed to support planning, sales and marketing, and education within client
organizations.
Dr. Moody, President of BREA, has more than twenty-five years of experience in consulting and
forecasting with a wide range of international product and service companies, including
consumer products, leisure, retailing, gaming, business services, tel ecommunications, and utility
and financial services. Typical consulting assignments provide critical analysis and insight into
market dynamics, product demand, economic trends, consumer behavior and public policy.
BREA has provided specialized consulting support, including market research, economic impact
studies and demand analyses, to the cruise lines, port service providers and industry
associations. Among BREA’s recent clients are: Port of Philade lphia and Camden, Tampa Port
Authority, Port of San Diego, Royal Caribbean Cruises Ltd., Carnival Corp., P&O Ports of North
America, and the International Council of Cruise Lines. Since studies are designed to meet the
specific needs of each client, they can incorporate many dimensions of the market and i nclude a
variety of ancillary services.
BREA provides the following services:
Market Research: design and implementation of primary market research instruments using
telephone, mail, and intercept surveys. Test instruments are designed to collect i nformation on
product demand, attributes of consumers and users, perceived product attributes, and customer
satisfaction.
Economic Impact Studies: thorough analysis of industries and consumption behavior and their
contribution to or impact on national and regional (state, metropolitan areas, counties, etc.)
economies.
Statistical and Econometric Modeling: developing quantitative models relating market and
product demand to key economic factors and demographic market/consumer a ttributes. Models
can be used for forecasting, trend analysis and divergence/convergence analysis.
Market Studies and Trend Analyses: detailed descriptions of markets (defined as products,
regions, industries, consumer segments, etc.) and comprehensive analyses of unde rlying market
forces (such as economic and financial conditions, competitive envi ronment, technology, etc.).
BREA Business Research &
Economic Advisors