ECONOMIC BULLETIN 07-08/2015 - Banco de España Rules on the prevention of misuse of inside...
94
ECONOMIC BULLETIN 07-08/2015
Transcript of ECONOMIC BULLETIN 07-08/2015 - Banco de España Rules on the prevention of misuse of inside...

ECONOMIC BULLETIN 07-08/2015

BANCO DE ESPAÑA 2 ECONOMIC BULLETIN. JULY-AUGUST 2015 CONTENTS
CONTENTS
Financial regulation: 2015 Q2 3
Economic indicators 1*
Banco de España publications 67*
Acronyms and abbreviations 68*

BANCO DE ESPAÑA 3 ECONOMIC BULLETIN, JULY-AUGUST 2015 FINANCIAL REGULATION: 2015 Q2
FINANCIAL REGULATION: 2015 Q2
The author of this article is Juan Carlos Casado Cubillas, of the Directorate General Economics, Statistics and Research.
The second quarter of 2015 saw the publication of several financial regulations, which are
summarised below.
Of particular note is the Law on the recovery and resolution of credit institutions and
investment firms (IFs), which completes the adaptation of Spanish law to European Union
regulations in respect of the recovery and resolution mechanisms for these institutions.
This Law also amends the Securities Market Law, marking a significant step forward in the
ongoing reform of the Spanish securities clearing, settlement and registration system to
adapt it to the new European setting. These amendments complete those already
undertaken under Law 32/2011 of 4 October 2011.
With regard to the activity of the European Central Bank (ECB), several provisions have
been promulgated in relation to: 1) the changes in the Eurosystem monetary policy
framework; 2) the conditions for including specific items in the calculation of credit
institutions’ own funds; 3) the characteristics of a public securities asset purchase
programme on secondary markets for Eurosystem national central banks (NCBs); 4) the
updating of the regulations governing the Trans-European Automated Real-Time Gross
Settlement Express Transfer system (TARGET2); 5) the total amount of annual supervisory
charges applicable to credit institutions for the year 2015; 6) certain changes in the
preparation of securities portfolio statistics, and 7) the updating of the Eurosystem’s ethics
framework when conducting monetary policy operations and foreign exchange operations,
and its extension to the members of the bodies and staff members of the ECB and of the
national competent authorities (NCAs) of the Member States participating in the Single
Supervisory Mechanism (SSM).
As regards European Union regulations, two provisions of substantial financial scope were
published relating to: 1) the regulation of European long-term investment funds, and 2) the
regulation governing interchange fees for card-based payment transactions.
The Banco de España, for its part, has set in place a series of rules for the transmission of
payment and payment systems statistics by payment services providers and payment
system operators. Moreover, it has made changes to its internal structure as a consequence
of the start-up of the SSM.
In the securities market field, the legal regime for IFs has been amended in order to
complete the transposition to Spanish law of European Union regulations, in line with the
requirements already established for credit institutions. Further, regulations have been laid
down for the statistical information to be compiled by institutions that manage, administer
or control market infrastructures.
Finally, the most relevant aspects of the following are discussed: 1) the legislation to
foment business financing; 2) new measures in respect of insolvency proceedings, and 3)
the tax treatment of subordinated debt and of preference debt instruments.
Introduction
BANCO DE ESPAÑA 4 ECONOMIC BULLETIN, JULY-AUGUST 2015 FINANCIAL REGULATION: 2015 Q2
The Spanish version of this article analyses and discusses these regulations in greater
depth and detail.
Table 1 sets out the content of this article.
Law 11/2015 of 18 June 2015 (Official State Gazette of 19 June) (hereafter, the Law) on the
recovery and resolution of credit institutions and of IFs (hereafter, the institutions) has been
published, entering into force on 20 June 2015.
The Law transposes a very important part of European Union law1 into Spanish law in
respect of the recovery and resolution mechanisms for credit institutions and IFs. It further
assumes many of the provisions of Law 9/2012 of 14 November 20122 on the restructuring
and resolution of credit institutions, which it partially repeals.
The regime set in place constitutes a special and full administrative procedure that seeks
to ensure maximum speed in the intervention of the institution so as to provide for the
continuity of its core functions, while minimising the impact of its non-viability on the
economic system and on public resources.
Unlike the previous regulations affecting credit institutions, the scope of the Law is
broadened to take in IFs established in Spain3, in line with the European regulations being
transposed.
Supervisory4 and resolution-related functions are separated, such that supervision and
resolution functions in the pre-emptive phase are entrusted to the Banco de España for
credit institutions and to the Spanish National Securities Market Commission (CNMV) for
IFs. Functions shall be exercised by each of these authorities through internal operationally
independent bodies. Resolution functions in the enforcement phase are assigned to the
Fund for the Orderly Restructuring of the Banking Sector (FROB).
The early intervention phase is reinforced and the pre-emptive resolution phase is
developed, given that all institutions, and not only non-viable ones, must have recovery
and resolution plans.
One new aspect involves the regulation of internal recapitalisation as a resolution
instrument conceived as a “bail-in” arrangement (the absorption of losses by the
shareholders and by the creditors of the institution under resolution).
Recovery and resolution of credit institutions and investment firms
OBJECTIVES OF THE LAW
MAIN CHANGES IN THE LAW
1 The Law carries out the transposition into Spanish law of Directive 2014/59/EU of the European Parliament and of the Council of 15 May 2014 establishing a framework for the recovery and resolution of credit institutions and investment firms and amending Council Directive 82/891/EEC, and Directives 2001/24/EC, 2002/47/EC, 2004/25/EC, 2005/56/EEC, 2007/36/EEC, 2011/35/EU, 2012/30/EU and 2013/36/EU, and Regulations (EU) No 1093/2010 and (EU) No 648/2012, of the European Parliament and of the Council, which is in turn one of the regulations that contributes to the constitution of the Single Resolution Mechanism, created by means of Regulation (EU) 806/2014 of the European Parliament and of the Council of 15 July 2014 establishing uniform rules and a uniform procedure for the resolution of credit institutions and certain investment firms in the framework of a Single Resolution Mechanism and a Single Resolution Fund and amending Regulation (EU) No 1093/2010, this being one of the pillars of the so-called Banking Union.
2 See “Financial Regulation: 2012 Q4”, Economic Bulletin, January 2013 Banco de España, pp. 36-42.3 The provisions of this Law will not be applicable to IFs whose legally required minimum share capital is less than
€730,000, or whose activity meets certain characteristics indicated in the regulations, such as not being able to have deposited with it the money or securities of its customers and, for this reason, not being ever able to be in a debtor position vis-à-vis such customers.
4 The supervisory function involves ensuring compliance with the disciplinary regulations governing institutions’ activity and, especially, with solvency regulations, with the ultimate aim of safeguarding financial stability. Its interest, above all else, is in the continuity of the institution.
BANCO DE ESPAÑA 5 ECONOMIC BULLETIN, JULY-AUGUST 2015 FINANCIAL REGULATION: 2015 Q2
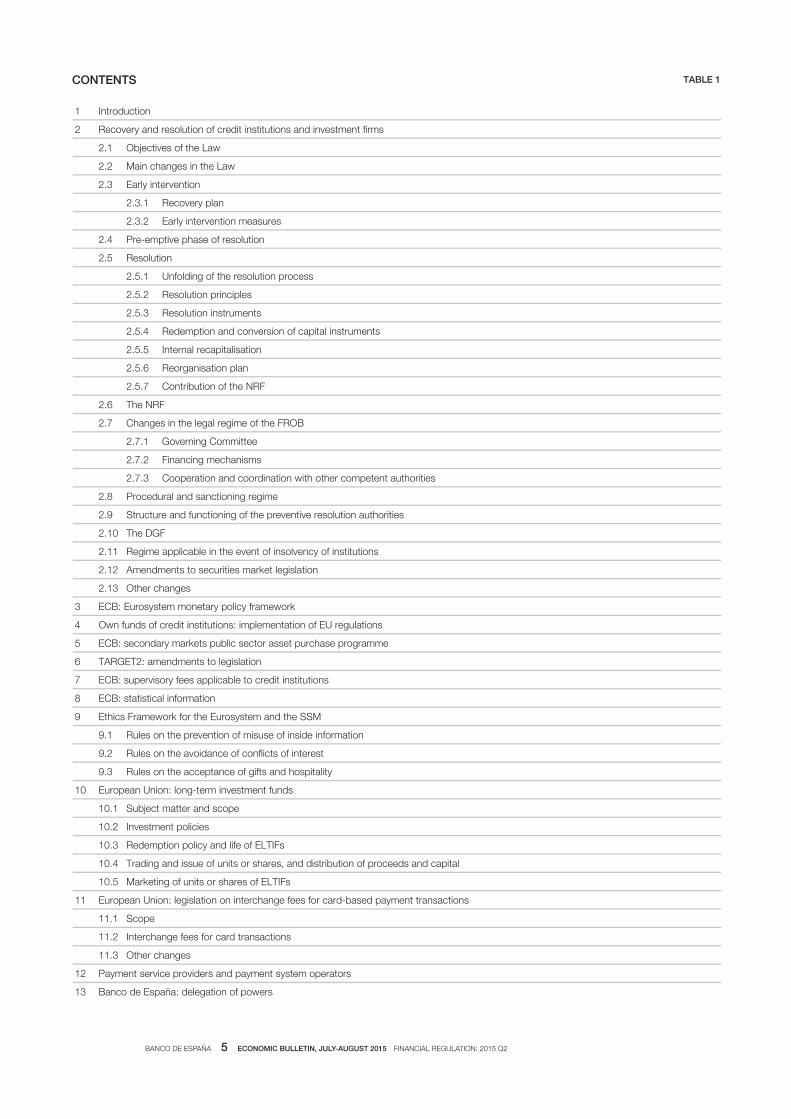
1 Introduction
2 Recovery and resolution of credit institutions and investment firms
2.1 Objectives of the Law
2.2 Main changes in the Law
2.3 Early intervention
2.3.1 Recovery plan
2.3.2 Early intervention measures
2.4 Pre-emptive phase of resolution
2.5 Resolution
2.5.1 Unfolding of the resolution process
2.5.2 Resolution principles
2.5.3 Resolution instruments
2.5.4 Redemption and conversion of capital instruments
2.5.5 Internal recapitalisation
2.5.6 Reorganisation plan
2.5.7 Contribution of the NRF
2.6 The NRF
2.7 Changes in the legal regime of the FROB
2.7.1 Governing Committee
2.7.2 Financing mechanisms
2.7.3 Cooperation and coordination with other competent authorities
2.8 Procedural and sanctioning regime
2.9 Structure and functioning of the preventive resolution authorities
2.10 The DGF
2.11 Regime applicable in the event of insolvency of institutions
2.12 Amendments to securities market legislation
2.13 Other changes
3 ECB: Eurosystem monetary policy framework
4 Own funds of credit institutions: implementation of EU regulations
5 ECB: secondary markets public sector asset purchase programme
6 TARGET2: amendments to legislation
7 ECB: supervisory fees applicable to credit institutions
8 ECB: statistical information
9 Ethics Framework for the Eurosystem and the SSM
9.1 Rules on the prevention of misuse of inside information
9.2 Rules on the avoidance of conflicts of interest
9.3 Rules on the acceptance of gifts and hospitality
10 European Union: long-term investment funds
10.1 Subject matter and scope
10.2 Investment policies
10.3 Redemption policy and life of ELTIFs
10.4 Trading and issue of units or shares, and distribution of proceeds and capital
10.5 Marketing of units or shares of ELTIFs
11 European Union: legislation on interchange fees for card-based payment transactions
11.1 Scope
11.2 Interchange fees for card transactions
11.3 Other changes
12 Payment service providers and payment system operators
13 Banco de España: delegation of powers
CONTENTS TABLE 1

BANCO DE ESPAÑA 6 ECONOMIC BULLETIN, JULY-AUGUST 2015 FINANCIAL REGULATION: 2015 Q2
A National Resolution Fund (NRF) financed by the institutions themselves has been
created. Its end-purpose will be to finance the resolution measures executed by the FROB,
which will oversee its management and administration.
These changes, along with others of particular relevance, are elaborated upon below.
On a pre-emptive basis, institutions shall draw up and keep updated a recovery plan
envisaging the measures and actions to be adopted by the institution in order to restore its
financial position should this undergo a significant deterioration. The plan and its updates
shall be approved by the institution’s board, for subsequent review by the competent
supervisor.
The plan shall include a series of quantitative and qualitative indicators that will be taken
into account as a reference for undertaking the actions envisaged. In no case may access
to public financial assistance be assumed.
If an institution or a parent of a consolidated group of institutions does not comply, or will
foreseeably not be able to comply in the near future, with solvency, regulatory and
disciplinary rules, but is in a position to return to compliance through its own means, the
competent supervisor shall declare an early intervention situation as initiated and may
adopt certain measures detailed in the regulations, such as requiring the cessation or
replacement of one or several members of the board of directors. If the measures were not
sufficient, it may resolve to appoint one or several administrators, or to provisionally
replace the institution’s board of directors or one or several of its members.
The pre-emptive resolution authority shall draw up and approve, further to a report from
the FROB and from the competent supervisor and having previously consulted the
resolution authorities of the jurisdictions in which significant branches are established, a
resolution plan for each institution that is not part of a group subject to supervision on a
EARLY INTERVENTION
Recovery plan
Early intervention measures
PRE-EMPTIVE PHASE
OF RESOLUTION
14 Legal framework governing investment firms and other institutions providing investment services: legislative amendment
14.1 Share capital
14.2 Corporate governance and remuneration policy measures
14.3 Solvency of investment firms
14.3.1 Risk management and internal control requirements
14.3.2 Adoption of measures to return to compliance with solvency standards
14.3.3 Capital buffers
14.4 Prudential supervision and reporting requirements
15 CNMV: Statistical information on market infrastructures
16 Promotion of business financing
16.1 New legal regime for credit financial intermediaries (CFIs)
16.2 Reform of securitisations regime
16.3 Improved access to capital markets
16.4 Measures to promote SME financing
16.5 Other new developments
17 Urgent insolvency measures
17.1 Insolvency arrangements
17.2 Winding-up
17.3 Refinancing agreements
17.4 Other new developments
18 Tax treatment of subordinated debt and preference shares
CONTENTS (cont'd) TABLE 1

BANCO DE ESPAÑA 7 ECONOMIC BULLETIN, JULY-AUGUST 2015 FINANCIAL REGULATION: 2015 Q2
consolidated basis. This plan shall contain the resolution actions to be applied by the
FROB if the institution were non-viable or it was foreseen that it would be so in the near
future, without prejudice to the fact that, in light of the circumstances, the FROB may also
apply other measures.
The resolution of an institution shall proceed when, simultaneously, certain circumstances
arise: 1) the institution is non-viable or is reasonably expected to be so in the near future5;
2) there is no reasonable prospect that private-sector measures (such as, inter alia, the
measures applied by institutional protection systems), supervisory measures (such as,
inter alia, early intervention measures) or the redemption or conversion of capital
instruments may prevent the non-viability of the institution within a reasonable time; and 3)
for reasons of public interest, it is necessary or advisable to undertake the resolution of the
institution, provided that the winding-up and liquidation of the institution through an
insolvency procedure would not reasonably allow the objectives to be attained to the same
extent.
Following the opening of the resolution process, the FROB shall agree to and make public
the replacement of the institution’s board of directors and of the managing directors or
similar officers6, appointing as administrator of the institution the person or persons who,
on their behalf and under their control, shall exercise the functions and powers proper to
such status. The FROB shall likewise approve the framework of action of the special
administrator, including the periodic information the latter has to prepare on the
performance of its functions. The substitution measure shall remain in force for a period no
longer than one year, although the FROB may, exceptionally, extend this period if it
considers it necessary in order to complete the resolution process.
Resolution processes shall be based on specific principles set out in the Law. These
include the following: 1) the shareholders of the institutions shall be the first to bear losses;
2) the creditors of the institutions shall bear the losses arising from resolution after the
shareholders or partners and in accordance with the order of seniority established under
insolvency legislation, with the qualifications set out in the Law, and 3) guaranteed deposits
shall be fully protected.
The resolution instruments the FROB may implement are: 1) the sale of the institution’s
business; 2) the transfer of assets or liabilities to a bridge entity; 3) the transfer of assets
or liabilities to an asset management company, and 4) internal recapitalisation.
With the exception of internal recapitalisation (which shall be addressed later), the
remaining instruments are already included under Law 9/2012, which is now updated by
the Law in keeping with European regulations.
RESOLUTION
Unfolding of the resolution
process
Resolution principles
Resolution instruments
5 An institution shall be understood to be non-viable if any of the following circumstances prevail: 1) the institution fails significantly to meet, or it is reasonably foreseeable that in the near future it will fail significantly to meet, solvency requirements or other requirements needed to maintain authorisation; 2) the institution’s liabilities exceed its assets or it is reasonably foreseeable that this will be so in the near future; 3) the institution cannot meet, or it is reasonably foreseeable in the near future that it cannot meet, the claims on it, and 4) the institution requires extraordinary public financial assistance. In relation to this latter point, the institution shall not be considered to be non-viable if the extraordinary public financial assistance is granted to avoid or resolve severe shocks in the economy and to preserve financial stability, provided that such assistance adopts one of the forms specified in the Law.
6 The FROB shall be entitled not to replace the board of directors, or the managing directors or similar officers, in those extraordinary cases in which, in view of the composition of the shareholder structure or of the institution’s board of directors at the time the resolution process is initiated, it is strictly necessary to maintain them to ensure the appropriate unfolding of the resolution process.

BANCO DE ESPAÑA 8 ECONOMIC BULLETIN, JULY-AUGUST 2015 FINANCIAL REGULATION: 2015 Q2
Before agreeing to the redemption and conversion of capital instruments or, indeed,
internal recapitalisation, the FROB shall value the institution’s assets and liabilities, which
will be the basis for the calculation of the amount for which the institution concerned will
need to be recapitalised.
In keeping with the calculation made, the FROB shall determine the amount at which the
eligible liabilities should be redeemed or converted in order to restore the common equity
Tier 1 capital ratio of the institution under resolution or, where appropriate, of the bridge
entity, and to maintain sufficient market confidence in these institutions, so as to allow
them to comply, for at least one year, with the conditions governing their authorisation and
to pursue the activities in which they are authorised to engage.
Internal recapitalisation, which will come into force on 1 January 2016, is a new resolution
instrument, since the loss-absorption mechanism makes it extensive to all the institution’s
creditors, and not only to the shareholders and the subordinated creditors as envisaged
under Law 9/2012 of 14 November 2012.7
In this respect, eligible liabilities are all the institution’s liabilities that are not expressly
excluded or have not been excluded further to a decision by the FROB.8 These liabilities
shall be susceptible to amortisation or conversion into capital for the internal recapitalisation
of the institution concerned. Among the liabilities excluded are: 1) deposits guaranteed by
the DGF (up to €100,000), and 2) liabilities incurred with employees, trade creditors (whose
end-purpose is the supply of goods and services essential to the normal pursuit of the
institution’s activities) and the tax or social security authorities.
Internal recapitalisation may be adopted, on one hand, to recapitalise the institution so
that it may resume its activities, maintaining market confidence, and, on the other, to
convert into capital or to reduce the principal of the loans or debt instruments transferred
on applying resolution instruments comprising the constitution of a bridge entity, the sale
of the business or the segregation of assets.
On applying the internal recapitalisation measure, the FROB shall require the institution’s
board of directors, or the person or persons designated for this purpose, to submit an
activities reorganisation plan containing the measures, having regard to the economy’s
situation and to the markets in which the institution operates, geared to restoring the
long-term viability of the institution, or a part of its activities, over a reasonable
timeframe.
In certain cases, the NRF may make a contribution to the institution under resolution in
order to cover any loss that has not been absorbed by eligible liabilities and to restore the
net value of the institution’s assets, making it equal to zero, or to purchase shares or other
capital instruments of the institution under resolution, in order to recapitalise it. For this
contribution to be made, the conditions laid down in the Law must be met.
Redemption and conversion
of capital instruments
Internal recapitalisation
Reorganisation plan
Contribution of the NRF
7 The rules on recapitalisation contained in Law 9/2012 14 November 2012 shall remain in force until 31 December 2015.
8 Such as, for instance, when exclusion is strictly necessary and proportionate in order to: 1) ensure the continuity of core functions and the main branches of activity so as to maintain the capacity of the institution subject to resolution to continue with the main operations, services and transactions, or 2) to avoid giving rise to extensive contagion, in particular in respect of eligible deposits held by individuals, micro-firms and SMEs, that may seriously upset the functioning of the financial markets, including their infrastructure, in such a way as to seriously disrupt the economy of a Member State or that of the European Union.

BANCO DE ESPAÑA 9 ECONOMIC BULLETIN, JULY-AUGUST 2015 FINANCIAL REGULATION: 2015 Q2
The Law creates the NRF, administered by the FROB and set up as a separate fund, whose
financial resources should be at least 1% of the amount of the guaranteed deposits of all
institutions. The Law establishes a transition period – which will commence in 2015 – to
attain this level, to be reached no later than 31 December 2024.
To this end, the FROB shall, at least annually, levy ordinary contributions from institutions,
including branches in the European Union, in conformity with the following criteria: 1) the
contribution of each institution will be commensurate with the proportion it accounts for
relative to the total aggregate of institutions, calculated taking the institution’s total liabilities,
excluding own funds and the guaranteed amount of deposits, and 2) the contributions will
be adjusted to each institution’s risk profile, in keeping with the regulatory criteria specified.
When institutions’ ordinary contributions prove insufficient to finance the measures
envisaged in this Law, the FROB may raise extraordinary contributions.
Finally, the mutualisation of the NRF along with the funds of the Eurosystem member
countries in the Single Resolution Fund (SRF) is envisaged, pursuant to the provisions of
Regulation (EU) 806/2014 of 15 July 2014, and the Agreement on the transfer and
mutualisation of contributions to the SRF, entered into on 21 May 2014, whereby the
portion corresponding to the NRF shall be transferred to the SRF for the amount and in the
form established in the above-mentioned regulations.
The end-purpose of the FROB shall be to manage the resolution processes of institutions
in the enforcement stage and, in any event, to exercise the powers attributed to it by the
Law, other national legislation and European Union law.
One change involves the creation of the figure of Chairman, appointed by the Council of
Ministers, upon a proposal by the Ministry of Economic Affairs and Competitiveness, as
the maximum representative of the Governing Committee. The Chairman shall be entrusted
with direction and day-to-day management, with a five-year non-renewable mandate and
with regulated causes of dismissal. A member of the CNMV will also join the Governing
Committee owing to the extension of the scope of the law to IFs.
The Governing Committee shall approve internal regulations for the FROB which shall
detail the essential rules governing its conduct in economic, financial, budgetary,
accounting, organisational and procedural matters. The rules shall reflect the guiding
principles of its policy of ownership of institutions to which it has provided public financial
support and shall include internal control mechanisms for the governance of the FROB.
These rules shall be underpinned by the principles of good management, objectivity,
transparency, competition and publicity.
For the financing of the measures envisaged in this Law, the FROB shall have the following
mechanisms:
1) The NRF.
2) Alternative means of financing such as the issuance of fixed-income securities,
receiving loans, applying for the opening of credit lines and the carrying out of
whatsoever other debt operations, provided that the ordinary contributions
are insufficient to cover resolution costs and that extraordinary contributions
are not immediately accessible or sufficient.
THE NRF
CHANGES IN THE LEGAL REGIME
OF THE FROB
Governing Committee
Financing mechanisms
BANCO DE ESPAÑA 10 ECONOMIC BULLETIN, JULY-AUGUST 2015 FINANCIAL REGULATION: 2015 Q2
3) The possibility of applying to the financing mechanisms of the other European
Union Member States for loans, under the procedure envisaged in the
attendant regulations. Such application may only be made if, along with the
previous options having been exhausted, the alternative financing mechanisms
cannot be employed under reasonable conditions either.
As regards the national authorities, the FROB shall collaborate with those that have been
entrusted with functions relating to the supervision or resolution of institutions and, in
particular, with the supervisory or preventive resolution bodies or authorities overseeing
the institutions covered by the scope of the Law.
With regard to other international authorities, in the event of the resolution of institutions
belonging to international groups, the FROB and the preventive resolution authority shall
collaborate with the European Union institutions, including the Single Resolution Board,
the ECB, the European Banking Authority (EBA), and the foreign authorities entrusted with
functions relating to the supervision or resolution of institutions, and they may to this end
finalise collaborative agreements with them and request and exchange information to the
extent necessary for the exercise of the competencies attributed to them in relation to the
planning and execution of early intervention or resolution measures.
The procedural regime regulates the particularities of administrative appeals against the
acts dictated by the FROB and, especially, of the decisions adopted in early intervention
and resolution processes, and the measures applied in respect of the redemption or
conversion of capital instruments and internal recapitalisation.
With regard to the sanctioning regime, the different types of infringements are regulated,
along with the related sanctions to be applied to the institutions and individuals who hold
administrative or management posts in such institutions, if they infringe the obligations
envisaged in the Law.
The Banco de España and the CNMV shall adopt the necessary measures so that their
organisational structure may ensure operational independence and prevent conflicts of
interest between the supervisory functions and preventive resolution functions attributed
to them by the Law. Both institutions shall draw up a regulation for the management of
potential conflicts of interest, so that the latter are duly identified, managed, controlled
and, where appropriate, eliminated.
They shall further provide the information that the FROB requires in the exercise of its
competences and, generally, of those powers it holds as the enforcement resolution
authority.
Royal Decree-Law 16/2011 of 14 October 20119, creating the DGF, has been amended to
include certain changes that are discussed below.
The DGF is divided into two self-contained parts: one relating to the guarantee for deposits,
the other to that for securities.
Each part shall respond exclusively for the costs, expenses and obligations expressly
attributed to it. In addition, the contribution by each part to types of items that were not
Cooperation and coordination
with other competent authorities
PROCEDURAL
AND SANCTIONING REGIME
STRUCTURE AND FUNCTIONING
OF THE PREVENTIVE
RESOLUTION AUTHORITIES
THE DGF
9 See “Financial Regulation: 2011 Q4”, Economic Bulletin, January 2012, Banco de España, pp. 126-128.

BANCO DE ESPAÑA 11 ECONOMIC BULLETIN, JULY-AUGUST 2015 FINANCIAL REGULATION: 2015 Q2
attributed to either part shall be calculated on the basis of the amount of the deposits or
securities guaranteed by each part, under the regulatory terms established.
The funds in the deposit guarantee part shall amount, at least, to 0.8% of guaranteed
deposits, although, in light of certain factors, it may be reduced to 0.5% further to
authorisation by the European Commission. In any event, the level shall be attained by no
later than 3 July 2024.
The envisaged annual contributions to the securities guarantee part may not exceed 0.3%
of the amount of the securities guaranteed.
Finally, the Law stipulates that, as from 3 July 2017, the Banco de España shall subject the
DGF, at least once every three years, to stress tests of its capacity to meet its payment
obligations in situations of stress.
Certain changes are made to the regime applicable in the event of the insolvency of an
institution, in order to provide greater protection to the deposits of individuals and SMEs.
In this respect, the following shall be considered as privileged credit in the order of seniority
of claims:
1) Deposits guaranteed by the DGF (maximum of €100,000) and the rights to
which they may have been subrogated should the guarantee have been made
effective.
2) The portion of the deposits of individuals and of SMEs that exceeds the
guaranteed level, and those deposits of those individuals and SMEs that
would be guaranteed had they not been set up in branches located outside
the European Union.
The first final provision of the Law introduces certain amendments to Law 24/1988 of
28 July 199810 on the Securities Market. A series of adjustments in respect of book-entry
securities is included, providing for both the reversibility of this book-entry status and for
the requirements that must be met by the issuance document. Further amendments clarify
the structure and functioning of the Spanish securities registration system, which has two
levels making up the so-called two-step system.
Moreover, the questions relating to the settlement of securities and to the legal regime
governing central securities depositories are adapted to the provisions of Regulation (EU)
909/2014 of the European Parliament and of the Council of 23 July 201411.
Also of note is the creation of a specific reporting system for the oversight of securities
clearance, settlement and registration, which will be managed by the central securities
depository.
Specific limits have been placed on the compensation of directors and managers of
institutions wholly owned or financially supported by the FROB, or those which, being
REGIME APPLICABLE
IN THE EVENT OF INSOLVENCY
OF INSTITUTIONS
AMENDMENTS TO SECURITIES
MARKET LEGISLATION
OTHER CHANGES
10 See “Regulación financiera: tercer trimestre de 1988”, Boletín Económico, October 1988, Banco de España, pp. 61-62.
11 Regulation (EU) No 909/2014 of the European Parliament and of the Council of 23 July 2014 on improving security settlements in the European Union and on central securities depositories and amending Directives 98/26/EC and 2014/65/EU Regulation (EU) No 236/2012.

BANCO DE ESPAÑA 12 ECONOMIC BULLETIN, JULY-AUGUST 2015 FINANCIAL REGULATION: 2015 Q2
subject to resolution measures, require financing from the NRF or the SRF. Exceptions to
this limit are made for the directors and managers who would have joined the institution or
its group after or at the same time that a stake was taken in it or that financial support was
given by the FROB, the NRF or the SRF.
Lastly, Law 10/2014 of 26 June 2014 on the regulation, supervision and solvency of credit
institutions12 has been amended to adapt the provisions of this law to the causes of
intervention and replacement of directors, and to the content of the agreement governing
the intervention and replacement of said directors.
Guideline (EU) 2015/510 (ECB/2014/60) of 19 December 2014 (OJ L of 2 April 2015) (hereinafter,
the Guideline) on the implementation of the Eurosystem monetary policy framework was
published and subsequently amended by Guideline (UE) 2015/732 (ECB/2015/20) of 16 April
2015 (OJ L of 6 May 2015). These Guidelines came into force on 1 May 2015.
Resolution of 23 April 2015 of the Executive Commission of the Banco de España (BOE of
28 July 2015) was published, amending the Resolution of 11 December 1998, approving
the general conditions applicable to the Banco de España’s monetary policy operations, in
order to incorporate the changes introduced by both Guidelines.
Guideline (EU) 2015/510 introduces new changes to the framework set out in Guideline
ECB/2011/14 of 20 September 201113 on monetary policy instruments and procedures of
the Eurosystem, and recasts all earlier Guidelines into a single text.
While Guideline (EU) 2015/510 includes some amendments in its core content with respect
to Guideline ECB/2011/14, updating the monetary policy implementation framework, the
most significant change is its completely new structure. As a result of this change, the new
text is divided into articles on the monetary policy framework, specifying more clearly the
binding provisions of the latter and removing the merely informative or descriptive parts.
Decision (EU) 2015/656 (ECB/2015/4) of 4 February 2015 (OJ L of 25 April 2015) (hereinafter,
the Decision) on the conditions under which credit institutions are permitted to include
interim or year-end profits in Common Equity Tier 1 capital in accordance with Article 26(2)
of Regulation (EU) No 575/201314 was published, and came into force on 6 February 2015.
The purpose of the Decision is to develop certain aspects of the respective conditions,
which shall only apply to credit institutions over which the ECB exercises direct supervision
in accordance with Regulation (EU) 1024/201315 and Regulation (EU) 468/2014
(ECB/2014/17)16.
ECB: Eurosystem monetary policy framework
Own funds of credit institutions: implementation of EU regulations
12 See “Financial regulation: 2014 Q2”, Economic Bulletin, July-August 2014, Banco de España, pp. 33-42.13 See “Financial Regulation: 2011 Q4”, Economic Bulletin, January 2012, Banco de España, pp. 113-114.14 Regulation (EU) No 575/2013 of the European Parliament and of the Council of 26 June 2013 on prudential
requirements for credit institutions and investment firms and amending Regulation (EU) No 648/2012 of the European Parliament and of the Council of 4 July 2012 on OTC derivatives, central counterparties and trade repositories. See “Financial Regulation: 2013 Q2”, Economic Bulletin, July-August 2013, Banco de España, pp. 53-61.
15 Council Regulation (EU) No 1024/2013 of 15 October 2013, conferring specific tasks on the ECB concerning policies relating to the prudential supervision of credit institutions, established a Single Supervisory Mechanism, comprising the ECB and the National Competent Authorities (NCAs) of the participating Member States. See “Financial Regulation: 2013 Q4”, Economic Bulletin, January 2014, Banco de España, pp. 71-74.
16 Regulation (EU) 468/2014 (ECB/2014/17) of 16 April 2014 establishing the framework for cooperation within the SSM between the ECB and the NCAs and with national designated authorities (SSM Framework Regulation). See “Financial Regulation: 2014 Q2”, Economic Bulletin, July-August 2014, Banco de España, pp. 42-45.

BANCO DE ESPAÑA 13 ECONOMIC BULLETIN, JULY-AUGUST 2015 FINANCIAL REGULATION: 2015 Q2
Thus, the ECB considers that the verification of the profits requirement has been fulfilled if
the credit institution provides the ECB with a document signed by an external auditor. In
connection with the second requirement, in order to demonstrate that any foreseeable
charges or dividends have been deducted from the amount of profits, the credit institution
shall submit to the ECB a document signed by a qualified person (using the model letter in
the Annex to the Decision) detailing the main components of those interim or year-end
profits, including deductions for any foreseeable charges or dividends, within the meaning
of Articles 2 and 4 of Commission Delegated Regulation (EU) No 241/2014 of 7 January
201417.
Decision (EU) 2015/774 (ECB/2015/10) of 4 March 2015 (OJ L of 14 May 2015) (hereinafter,
the Decision) on a secondary markets public sector asset purchase programme (hereinafter,
PSPP18) was published, and applies from 9 March 2015. The PSPP is aimed at enhancing
the transmission of monetary policy and facilitating credit provision to the euro area
economy.
Under the PSPP, the Eurosystem central banks may puchase from eligible conterparties19
eligible marketable debt securities issued by 1) central governments of a Member State
whose currency is the euro, and 2) recognised agencies, international organisations and
multilateral development banks, all of them located in the euro area.
Where the envisaged amount to be purchased in marketable debt securities issued by
central governments or recognised agencies located in their jurisdiction cannot be
attained, Eurosystem central banks may propose to the Governing Council the purchase
of marketable debt instruments issued by public non-financial corporations that fulfil
certain criteria.
The PSPP also establishes certain limitations on the execution of purchases which affect,
among other instruments, newly issued securities and marketable debt instruments issued
or fully guaranteed by the central governments of euro area Member States under a
financial assistance programme.
Additionally, certain portfolio allocation percentages are set, so that of the total value of
the instruments purchased under the PSPP, 12% shall be purchased by Eurosystem
central banks in securities issued by eligible international organisations and multilateral
development banks, and 88% shall be purchased in securities issued by eligible central
governments and recognised agencies, with the ECB also participating in these purchases.
Overall, 92% of the total purchases shall be conducted by the Eurosystem central banks
according to their key for subscription to the ECB’s capital, and the remaining 8% shall be
purchased by the ECB.
Guideline (EU) 2015/930 (ECB/2015/15) of 2 April 2015 (OJ L of 19 June 2015) amending
Guideline ECB/2012/27 of 5 December 201220 on TARGET2 (hereinafter, the Guideline) was
published, and took effect on the day following its notification to the NCBs of the Member
ECB: secondary markets public sector asset purchase programme
TARGET2: amendments to legislation
17 Commission Delegated Regulation (EU) No 241/2014 of 7 January 2014 supplementing Regulation (EU) No 575/2013 of the European Parliament and of the Council with regard to regulatory technical standards for Own Funds requirements for institutions.
18 PSPP stands for Public Sector Purchase Programme.19 Eligible counterparties are as follows: 1) entities that participate in Eurosystem monetary policy operations, and
2) counterparties that are used by NCBs for the investment of their euro-denominated investment portfolios.20 See “Financial Regulation: 2013 Q1”, Ecnomic Bulletin, April 2013, Banco de España, p. 66.

BANCO DE ESPAÑA 14 ECONOMIC BULLETIN, JULY-AUGUST 2015 FINANCIAL REGULATION: 2015 Q2
States whose currency is the euro, and Decision (EU) 2015/929 (ECB/2015/22) of 26 May 2015
(OJ L of 19 June 2015) amending Decision ECB/2007/7 of 24 July 2007, concerning the terms
and conditions of TARGET2-ECB, was issued, and became effective from 22 June 2015.
Additionally, the following two Resolutions were published: Resolution of 11 June 2015 of
the Executive Commission of the Banco de España (BOE of 19 June 2015), amending the
Resolution of 20 July 2007, approving the general clauses relating to the harmonised
conditions for participation in TARGET2-Banco de España, and Resolution of 11 June
2015 of the Executive Commission of the Banco de España (BOE of 19 June 2015),
approving the general clauses relating to the harmonised conditions for the opening and
operation of a dedicated cash account in TARGET2-Banco de España in order to adapt
Spanish legislation to the Guideline. Both the amendments to the Resolution of the
Executive Commission of the Banco de España of 20 July 2007 and the general clauses
relating to the harmonised conditions for the opening and operation of a dedicated cash
account in TARGET2-Banco de España came into force on 22 June 2015.
The Guideline amends Guideline ECB/2012/27 to include the operation of TARGET2-
Securities (T2S)21, and to adapt it to the judgment of the General Court of the European
Union in case T-496/11, United Kingdom v ECB, ECLI:EU:T:2015:133.
Decision (EU) 2015/727 (ECB/2015/17) of 10 April 2015 (OJ L of 6 May 2015) (hereinafter,
the Decision) on the total amount of annual supervisory fees for the first fee period and for
2015 was published, in conformity with Regulation (EU) No 1163/2014 (ECB/2014/41) of
22 October 201422, and came into force on 29 April 2015.
The Decision sets the total amount of annual supervisory fees for the first fee period (i.e.
November to December 2014) and for 2015 at €326 million, corresponding to the ECB’s
actual costs for November and December 2014 (€30 million) and an estimate of the ECB’s
annual costs for 2015 (€296 million), as set out in Annex I to the Decision. Each category
of supervised entities and supervised groups shall pay the total amount of annual
supervisory fees as laid down in Annex II.
The following legal acts were published: Regulation (EU) 2015/730 (ECB/2015/18) of
16 April 2015 (OJ L of 7 May 2015) (hereinafter, the Regulation) amending Regulation (EU)
No 1011/2012 (ECB/2012/24) concerning statistics on holdings of securities, which came
into force on 27 May 2015; Guideline (EU) 2015/948 (ECB/2015/19)of 16 April 2015 (OJ L of
19 June 2015) amending Guideline ECB/2013/7, of 22 March 2013, concerning statistics on
holdings of securities, which came into force on 19 June 2015, and Guideline (EU) 2015/571
(ECB/2014/43) of 6 November 2014 (OJ L of 9 April 2015) amending Guideline ECB/2014/15,
of 4 April 2014, on monetary and financial statistics, which came into force on 9 April 2015.
The main purpose of Regulation (EU) 2015/730 and of Guideline (EU) 2015/948 is to
expand the actual reporting population to include insurance corporations and to lay down
the statistical reporting requirements in connection with their holdings of securities.
ECB: supervisory fees applicable to credit institutions
ECB: statistical information
21 T2S, regulated in Guideline (ECB/2012/13) of 18 July 2012 on T2S, is the set of hardware and software components and other components of the technical infrastructure through which the Eurosystem provides central security depositories and the Eurosystem NCBs with services allowing for the core, neutral and borderless settlement of securities transactions on a delivery-versus-payment basis in an integrated technical environment with cross-border capabilities.
22 Regulation (EU) 1163/2014 of the ECB (ECB/2014/41) of 22 October 2014 on supervisory fees. See “Financial Regulation: 2014 Q4, Economic Bulletin, January 2015, Banco de España, pp. 15-16.

BANCO DE ESPAÑA 15 ECONOMIC BULLETIN, JULY-AUGUST 2015 FINANCIAL REGULATION: 2015 Q2
The entities with reporting obligations are: 1) insurance companies incorporated and resident
in the territory of the relevant euro area Member State, including subsidiaries whose parent
entities are located outside that territory; 2) branches of the aforementioned insurance
corportations that are resident outside the territory of the relevant euro area Member State, and
3) branches of the insurance corporations that are resident in the territory of the relevant euro
area Member State but whose head office is outside the European Economic Area (EEA)23.
The statistical reporting requirements for insurance corporations and the derogations
therefrom that may be granted by NCBs are similar, albeit observing their specificities and
establishing a transitional period, to those laid down for the other reporting agents.
The following Guidelines were published: Guideline (EU) 2015/855 (ECB/2015/11) of
12 March 2015 (OJ L of 2 June 2015) laying down the principles of a Eurosystem Ethics
Framework and repealing Guideline ECB/2002/6, of 26 September 200224, and Guideline
(EU) 2015/856 (ECB/2015/12) of 12 March 2015 (OJ L of 2 June) laying down the principles
of an Ethics Framework for the SSM.
Guideline (EU) 2015/855 updates Guideline ECB/2002/6 which laid down minimum ethics
standards for the Eurosystem NCBs when conducting monetary policy operations and
foreign exchange operations with the ECB’s foreign reserves and managing the ECB’s
foreign reserve assets. Furthermore, Guideline (EU) 2015/856 lays down similar provisions
for the members of the bodies and staff members of the ECB and the NCAs of the Member
States participating in the SSM.
The ECB and the NCAs shall adopt internal rules laying down the specific restrictions for
insiders taking into account effectiveness, efficiency and proportionality considerations.
Such specific restrictions may comprise, among others, the prohibition of specific financial
transactions or a prior authorisation requirement for specific financial transactions.
The ECB and the NCAs shall adopt internal rules requiring the members of their bodies
and their staff members to avoid during their employment any situation liable to give rise
to a conflict of interest and to report such situations. The ECB and the NCAs shall ensure
that, when a conflict of interest is reported, appropriate measures are in place to avoid
such conflict, including the relief from duties for the relevant matter.
The ECB and the NCAs shall adopt internal rules prohibiting the members of their bodies
and their staff members from soliciting, receiving or accepting a promise related to
receiving for themselves or any other person any advantage connected in any way with the
performance of their official duties, unless these advantages are offered by NCBs, Union
institutions, bodies or agencies, international organisations and government agencies, or,
as the case may be, are of a negligible value. The ECB and the NCAs shall ensure that
these exemptions do not influence or may not be perceived as influencing the independence
and impartiality of the members of their bodies and of their staff members.
Regulation (EU) 2015/760 of the European Parliament and of the Council of 29 April 2015
(OJ L of 19 May 2015) (hereinafter, the Regulation) on European long-term investment
funds (ELTIFs) was published, and shall apply from 9 December 2015.
Ethics Framework for the Eurosystem and the SSM
RULES ON THE PREVENTION
OF MISUSE OF INSIDE
INFORMATION
RULES ON THE AVOIDANCE
OF CONFLICTS OF INTEREST
RULES ON THE ACCEPTANCE
OF GIFTS AND HOSPITALITY
European Union: long-term investment funds
23 The EEA consists of the 29 European Union countries, Liechtenstein, Norway and Iceland.24 Guideline ECB/2002/6 of 26 September 2002 on minimum standards for the ECB and NCBs when conducting
monetary policy operations, foreign exchange operations with the ECB’s foreign reserves and managing the ECB’s foreign reserve assets.

BANCO DE ESPAÑA 16 ECONOMIC BULLETIN, JULY-AUGUST 2015 FINANCIAL REGULATION: 2015 Q2
The Regulation lays down uniform rules on the authorisation, investment policies and
operating conditions of European Union alternative investment funds (AIFs) that are
marketed in the EU as ELTIFs.
The ELTIFs are structured as a type of AIF that may only be marketed in the European
Union when it has been authorised by the NCAs, for which it must comply with the
provisions laid down in the Regulation. The authorisation as an ELTIF shall be valid for all
Member States (European passport). The NCAs shall inform ESMA, on a quarterly basis,
of authorisations granted to or withdrawn from ELTIFs. ESMA shall keep a central public
register identifying each ELTIF authorised under this Regulation, its manager and its NCA.
ELTIFs shall be managed by alternative investment fund managers (AIFMs) authorised in
accordance with Directive 2011/61/EU25 that shall be responsible for ensuring compliance
with this Regulation and shall be liable for any losses or damages resulting from non-
compliance therewith. ELTIFs may be internally managed where the legal form of the ELTIF
so permits it and no external AIFM has been appointed
The Regulation lays down a set of rules relating mainly to eligible investments, diversification
limits and the attendant marketing requirements.
An ELTIF shall invest at least 70% of its capital in the following assets: 1) equity or quasi-
equity instruments which have been issued by a qualifying portfolio undertaking or by an
undertaking of which the former is a majority-owned subsidiary; 2) debt instruments issued
by a qualifying portfolio undertaking; 3) loans granted by the ELTIF to a qualifying portfolio
undertaking with a maturity no longer than the life of the ELTIF; 4) units or shares of one or
several other ELTIFs, European Venture Capital Funds (EuVECAs) and European social
Entrepreneurship Funds (EuSEFs) provided that those ELTIFs, EuVECAs and EuSEFs have
not themselves invested more than 10 % of their capital in ELTIFs, and 5) direct holdings
or indirect holdings via qualifying portfolio undertakings of individual real assets with a
value of at least €10,000,000.
A qualifying portfolio undertaking shall be a portfolio undertaking that fulfils the following
requirements: 1) it is not a financial undertaking; 2) it is not admitted to trading on a
regulated market or on a multilateral trading facility (MTF), or it is admitted to trading but
has a market capitalisation of no more than €500 million, and 3) it is established in the
European Union or in a third country provided that the third country meets certain
requirements26.
Additionally, the Regulation sets certain capital diversification limits. For example, an ELTIF
shall invest no more than: 1) 10% of its capital in instruments issued by, or loans granted
to, any single qualifying portfolio undertaking; 2) 10% of its capital directly or indirectly in
a single real asset, and 3) 10% of its capital in units or shares of any single ELTIF, EuVECA
or EuSEF. However, the Regulation provides for certain derogations from the general
diversification limits.
SUBJECT MATTER AND SCOPE
INVESTMENT POLICIES
25 Directive 2011/61/EU of the European Parliament and of the Council of 8 June 2011 on Alternative Investment Fund Managers and amending Directives 2003/41/EC and 2009/65/EC, and Regulations (EC) No 1060/2009 and (EU) No 1095/2010.
26 Most notably, it is not a high-risk and non-cooperative jurisdiction identified by the Financial Action Task Force (FATF) and has signed an agreement with the home Member State of the manager of the ELTIF and with every other Member State in which the units or shares of the ELTIF are intended to be marketed to ensure an effective exchange of information in tax matters.
BANCO DE ESPAÑA 17 ECONOMIC BULLETIN, JULY-AUGUST 2015 FINANCIAL REGULATION: 2015 Q2
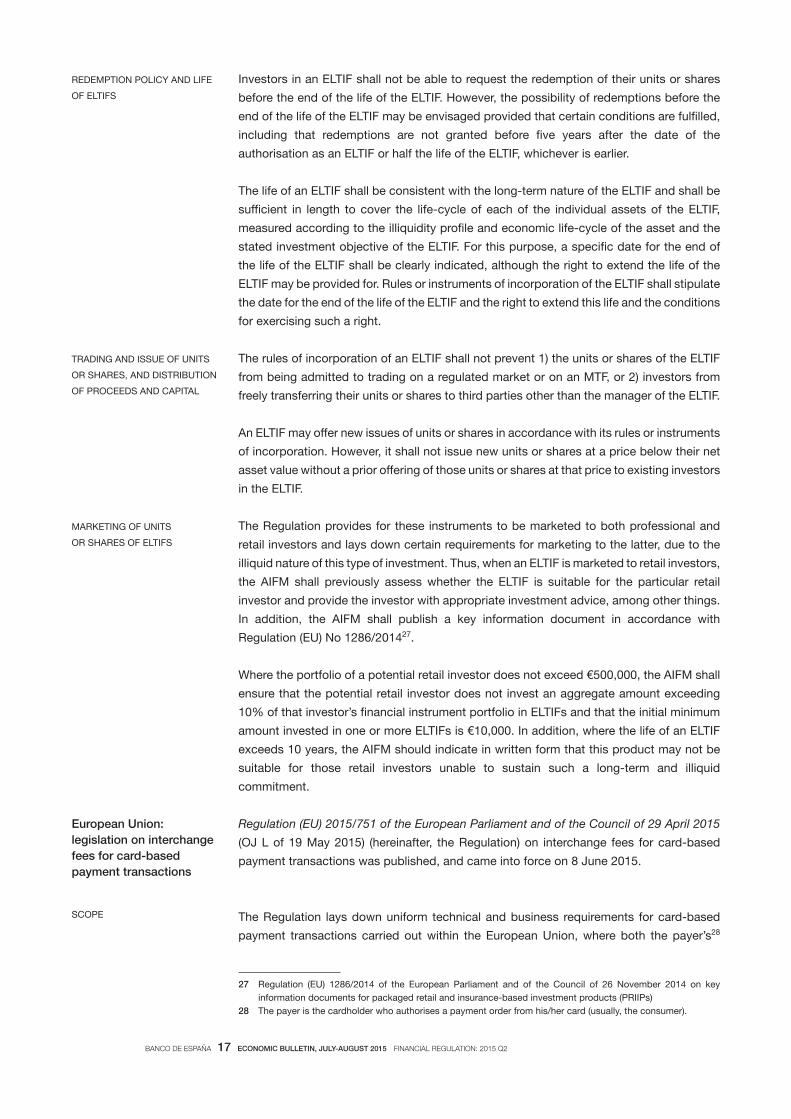
Investors in an ELTIF shall not be able to request the redemption of their units or shares
before the end of the life of the ELTIF. However, the possibility of redemptions before the
end of the life of the ELTIF may be envisaged provided that certain conditions are fulfilled,
including that redemptions are not granted before five years after the date of the
authorisation as an ELTIF or half the life of the ELTIF, whichever is earlier.
The life of an ELTIF shall be consistent with the long-term nature of the ELTIF and shall be
sufficient in length to cover the life-cycle of each of the individual assets of the ELTIF,
measured according to the illiquidity profile and economic life-cycle of the asset and the
stated investment objective of the ELTIF. For this purpose, a specific date for the end of
the life of the ELTIF shall be clearly indicated, although the right to extend the life of the
ELTIF may be provided for. Rules or instruments of incorporation of the ELTIF shall stipulate
the date for the end of the life of the ELTIF and the right to extend this life and the conditions
for exercising such a right.
The rules of incorporation of an ELTIF shall not prevent 1) the units or shares of the ELTIF
from being admitted to trading on a regulated market or on an MTF, or 2) investors from
freely transferring their units or shares to third parties other than the manager of the ELTIF.
An ELTIF may offer new issues of units or shares in accordance with its rules or instruments
of incorporation. However, it shall not issue new units or shares at a price below their net
asset value without a prior offering of those units or shares at that price to existing investors
in the ELTIF.
The Regulation provides for these instruments to be marketed to both professional and
retail investors and lays down certain requirements for marketing to the latter, due to the
illiquid nature of this type of investment. Thus, when an ELTIF is marketed to retail investors,
the AIFM shall previously assess whether the ELTIF is suitable for the particular retail
investor and provide the investor with appropriate investment advice, among other things.
In addition, the AIFM shall publish a key information document in accordance with
Regulation (EU) No 1286/201427.
Where the portfolio of a potential retail investor does not exceed €500,000, the AIFM shall
ensure that the potential retail investor does not invest an aggregate amount exceeding
10% of that investor’s financial instrument portfolio in ELTIFs and that the initial minimum
amount invested in one or more ELTIFs is €10,000. In addition, where the life of an ELTIF
exceeds 10 years, the AIFM should indicate in written form that this product may not be
suitable for those retail investors unable to sustain such a long-term and illiquid
commitment.
Regulation (EU) 2015/751 of the European Parliament and of the Council of 29 April 2015
(OJ L of 19 May 2015) (hereinafter, the Regulation) on interchange fees for card-based
payment transactions was published, and came into force on 8 June 2015.
The Regulation lays down uniform technical and business requirements for card-based
payment transactions carried out within the European Union, where both the payer’s28
REDEMPTION POLICY AND LIFE
OF ELTIFS
TRADING AND ISSUE OF UNITS
OR SHARES, AND DISTRIBUTION
OF PROCEEDS AND CAPITAL
MARKETING OF UNITS
OR SHARES OF ELTIFS
European Union: legislation on interchange fees for card-based payment transactions
SCOPE
27 Regulation (EU) 1286/2014 of the European Parliament and of the Council of 26 November 2014 on key information documents for packaged retail and insurance-based investment products (PRIIPs)
28 The payer is the cardholder who authorises a payment order from his/her card (usually, the consumer).
BANCO DE ESPAÑA 18 ECONOMIC BULLETIN, JULY-AUGUST 2015 FINANCIAL REGULATION: 2015 Q2
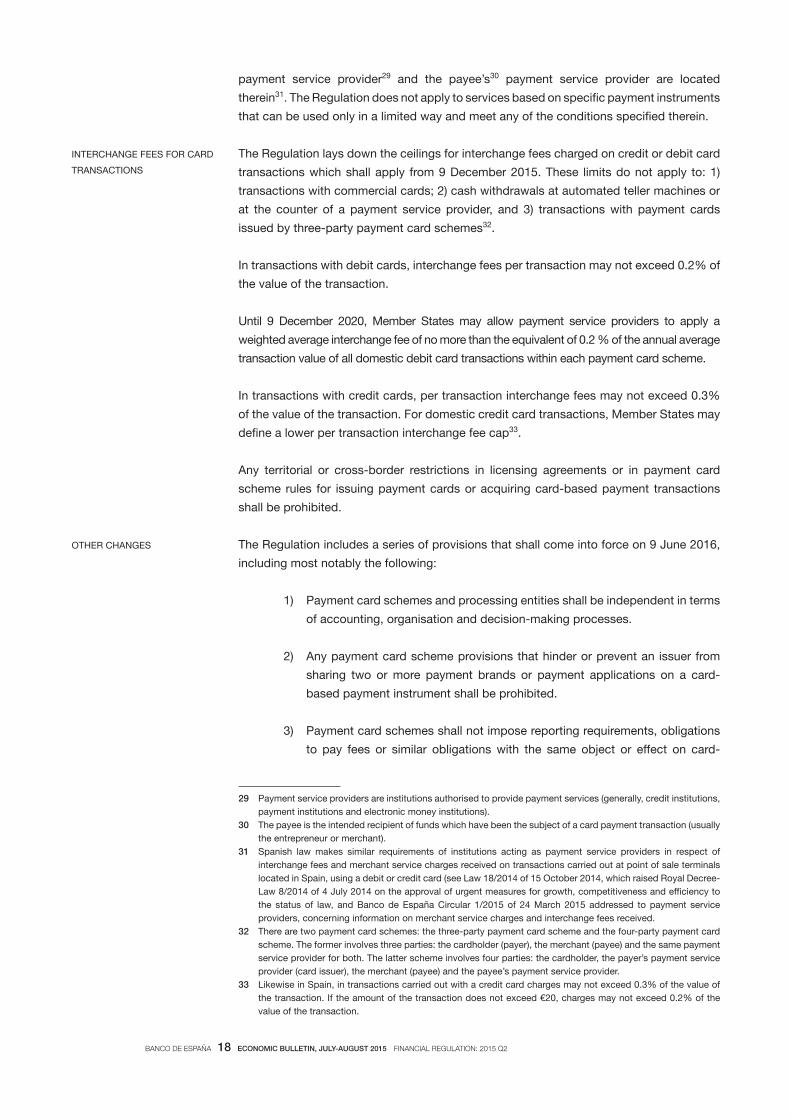
payment service provider29 and the payee’s30 payment service provider are located
therein31. The Regulation does not apply to services based on specific payment instruments
that can be used only in a limited way and meet any of the conditions specified therein.
The Regulation lays down the ceilings for interchange fees charged on credit or debit card
transactions which shall apply from 9 December 2015. These limits do not apply to: 1)
transactions with commercial cards; 2) cash withdrawals at automated teller machines or
at the counter of a payment service provider, and 3) transactions with payment cards
issued by three-party payment card schemes32.
In transactions with debit cards, interchange fees per transaction may not exceed 0.2% of
the value of the transaction.
Until 9 December 2020, Member States may allow payment service providers to apply a
weighted average interchange fee of no more than the equivalent of 0.2 % of the annual average
transaction value of all domestic debit card transactions within each payment card scheme.
In transactions with credit cards, per transaction interchange fees may not exceed 0.3%
of the value of the transaction. For domestic credit card transactions, Member States may
define a lower per transaction interchange fee cap33.
Any territorial or cross-border restrictions in licensing agreements or in payment card
scheme rules for issuing payment cards or acquiring card-based payment transactions
shall be prohibited.
The Regulation includes a series of provisions that shall come into force on 9 June 2016,
including most notably the following:
1) Payment card schemes and processing entities shall be independent in terms
of accounting, organisation and decision-making processes.
2) Any payment card scheme provisions that hinder or prevent an issuer from
sharing two or more payment brands or payment applications on a card-
based payment instrument shall be prohibited.
3) Payment card schemes shall not impose reporting requirements, obligations
to pay fees or similar obligations with the same object or effect on card-
INTERCHANGE FEES FOR CARD
TRANSACTIONS
OTHER CHANGES
29 Payment service providers are institutions authorised to provide payment services (generally, credit institutions, payment institutions and electronic money institutions).
30 The payee is the intended recipient of funds which have been the subject of a card payment transaction (usually the entrepreneur or merchant).
31 Spanish law makes similar requirements of institutions acting as payment service providers in respect of interchange fees and merchant service charges received on transactions carried out at point of sale terminals located in Spain, using a debit or credit card (see Law 18/2014 of 15 October 2014, which raised Royal Decree-Law 8/2014 of 4 July 2014 on the approval of urgent measures for growth, competitiveness and efficiency to the status of law, and Banco de España Circular 1/2015 of 24 March 2015 addressed to payment service providers, concerning information on merchant service charges and interchange fees received.
32 There are two payment card schemes: the three-party payment card scheme and the four-party payment card scheme. The former involves three parties: the cardholder (payer), the merchant (payee) and the same payment service provider for both. The latter scheme involves four parties: the cardholder, the payer’s payment service provider (card issuer), the merchant (payee) and the payee’s payment service provider.
33 Likewise in Spain, in transactions carried out with a credit card charges may not exceed 0.3% of the value of the transaction. If the amount of the transaction does not exceed €20, charges may not exceed 0.2% of the value of the transaction.

BANCO DE ESPAÑA 19 ECONOMIC BULLETIN, JULY-AUGUST 2015 FINANCIAL REGULATION: 2015 Q2
issuing and acquiring payment service providers for transactions carried out
with any device on which their payment brand is present in relation to
transactions for which their scheme is not used.
4) Acquirers shall offer and charge payees merchant service charges34 individually
specified for different categories and different brands of payment cards with
different interchange fee levels unless payees request the acquirer, in writing,
to charge blended merchant service charges.
Banco de España Circular 2/2015 of 22 May 2015 (BOE of 26 May 2015) (hereafter, the
Circular), on the rules for the transmission of the payments and payment systems statistics,
envisaged in Regulation (EU) No 1409/2013 (ECB/2013/43) of 28 November 2013 on
payments statistics, by payment service providers and payment system operators to the
Banco de España, was published and came into force on 27 May 2015.
The Circular applies to the payment service providers established in Spain and inscribed
in the official registers of the Banco de España, and the payment system operators
established in Spain, which comprise the actual reporting population and are, at all times,
reporting agents and, in general, senders.
The reporting agents shall provide the Banco de España with all the statistical information
required under Regulation (EU) No 1409/2013, unless the Banco de España decides that
they need not send certain information that it already possesses through other means of
compilation of statistical information. The reporting agents shall provide the statistical
information annually, relating to the previous calendar year, by electronic means, in
accordance with the formats, conditions and requirements established in the technical
applications implementing the Circular.
The Resolution of 22 May 2015 of the Executive Commission of the Banco de España
(BOE of 2 June 2015) approving the regime governing the delegation of powers was
published. The Resolution repeals the regime governing the delegation of powers
approved by the Executive Commission of the Banco de España in a resolution dated
18 December 2009, in its version in force up to the entry into force of this Resolution on
3 June 2015.
The start-up of the SSM on 4 November 2014 prompted a major change in banking
supervision procedures and responsibilities in the euro area countries. It has required the
Banco de España to take on new activities and pursue new functions, as a result of which
recent changes have been made in its internal structure entailing significant changes in its
organisation chart.
The regime governing the delegation of powers has had to be adapted to the new internal
structure established, for which purpose the Executive Commission, at its session on
22 May 2015, approved a new regime governing the delegation of powers that replaces
the former regime.35
Payment service providers and payment system operators
Banco de España: delegation of powers
34 The merchant service charge is a fee paid by the payee to the acquirer in relation to card-based payment transactions.
35 The regime governing the delegation of powers was contained in the Resolution of the Executive Commission of the Banco de España of 18 December 2009 and successive amendments thereof, which become null and void.

BANCO DE ESPAÑA 20 ECONOMIC BULLETIN, JULY-AUGUST 2015 FINANCIAL REGULATION: 2015 Q2
Royal Decree 358/2015 of 8 May 2015 (BOE of 9 May 2015) (hereafter, the Royal Decree),
amending Royal Decree 217/2008 of 15 February 200836 on the legal framework governing
investment firms and other institutions providing investment services, and partially
amending the implementing regulations of Collective Investment Institutions Law 35/2003
of 4 November 2003, approved by Royal Decree 1309/2005 of 4 November 2005,37 was
published and came into force on 10 May 2015.
The Royal Decree has two essential aims: to complete the transposition into Spanish law
of European Directive 2013/36/EU of the European Parliament and of the Council of
26 June 2013;38 and to transform Royal Decree 217/2008 into the main set of implementing
regulations governing the regulation, supervision and solvency of investment firms.
The main new developments are discussed below.
A significant reduction is established in the minimum share capital required of investment
firms: 1) for securities dealers, down to €730,000 (from €2 million previously); 2) for
securities brokers, down to €125,000 (from €500,000 or €300,000 previously, according to
whether they intended to become members of secondary markets or to join securities
clearing and settlement systems and whether their activity programmes included the
custody of financial instruments or they were authorised to keep special temporary credit-
balance accounts); 3) for securities brokers not authorised to hold customer funds or
securities, down to €50,000 (previously €120,000 or professional indemnity insurance, a
bond or equivalent guarantee, or a combination of the two); and 4) for portfolio management
companies, down to €50,000 or professional indemnity insurance, a bond or equivalent
guarantee, or a combination of capital and professional indemnity insurance (previously
€100,000 without the insurance option).
The Royal Decree places more emphasis on the suitability requirements for board
members, managers and similar officers and for persons holding internal control functions
or key posts for the day-to-day running of the business of investment firms, in similar
terms to those required of credit institutions. In the case of remuneration policy, it
implements the legislation introduced by Law 10/2014 that also applies to credit institutions.
Regarding the supervision of remuneration policies, the CNMV will compile and send to
the EBA information on the number of natural persons receiving annual remuneration of
€1 million or more, including their responsibilities in their respective posts, the business
area concerned and the main salary components, incentives, long-term bonuses and
pension contributions.
The functions of risk management units39 are extended; they must present a full view of the
complete range of risks to which an investment firm is exposed and must determine,
Legal framework governing investment firms and other institutions providing investment services: legislative amendment
SHARE CAPITAL
CORPORATE GOVERNANCE
AND REMUNERATION POLICY
MEASURES
SOLVENCY OF INVESTMENT
FIRMS
36 See “Financial regulation: 2008 Q1”, Economic Bulletin, April 2008, Banco de España, pp. 11-13.37 See “Financial regulation: 2005 Q4”, Economic Bulletin, January 2006, Banco de España, pp. 112-116.38 Directive 2013/36/EU of the European Parliament and of the Council of 26 June 2013 on access to the activity
of credit institutions and the prudential supervision of credit institutions and investment firms, amending Directive 2002/87/EC of the European Parliament and of the Council of 16 December 2002 on the supplementary supervision of credit institutions, insurance undertakings and investment firms in a financial conglomerate, and repealing Directive 2006/48/EC of the European Parliament and of the Council of 14 June 2006 relating to the taking up and pursuit of the business of credit institutions and Directive 2006/49/EC of the European Parliament and of the Council of 14 June 2006 on the capital adequacy of investment firms and credit institutions.
39 Investment firms must establish and maintain an independent risk management unit when this is proportionate to the nature, scale and complexity of their business activity and to the nature and range of investment services they provide.

BANCO DE ESPAÑA 21 ECONOMIC BULLETIN, JULY-AUGUST 2015 FINANCIAL REGULATION: 2015 Q2
quantify and give notice of the key risks in an appropriate manner. In addition, the figure of
risk management unit manager is created; the manager must be an independent senior
executive who does not have operational duties and who specifically assumes that
responsibility, and whose appointment cannot be revoked without the prior approval of the
Board of Directors.
The Royal Decree also implements the internal capital adequacy assessment process
envisaged in Law 10/2014. The ICAAP strategies and procedures will be summarised in an
annual internal capital adequacy assessment report, to be submitted to the CNMV by
30 April of each year, or earlier if so established by the latter.
Similarly to credit institutions, when the eligible capital of an investment firm or consolidated
group of investment firms falls short of the capital required by the solvency regulations, it
will inform the CNMV immediately and will submit, within one month, a programme setting
out the plans for a return to compliance. That programme must be approved by the CNMV,
which may include any changes or additional measures it considers necessary to ensure a
return to the minimum capital levels required.
Also similarly to credit institutions, investment firms must comply, at all times, with the
combined capital buffer requirement, understood to be the common equity Tier 1 (CET1)
required to establish a capital conservation buffer40 and, where appropriate, the following
capital buffers: an institution-specific countercyclical capital buffer; a capital buffer for
global systemically important institutions (G-SIIs); a capital buffer for other systemically
important institutions (O-SIIs); and a capital buffer against systemic risks.
In the event of non-compliance with the combined capital buffer requirement, Royal
Decree 84/2015 of 13 February 201541 shall apply, which establishes a series of limits on
the distribution of CET1, for which purpose investment firms must calculate the maximum
amount that may be distributed, as stipulated by the CNMV. They must also prepare a
capital conservation plan to be submitted to the CNMV.
The Royal Decree describes the objective and subjective scope of the supervisory function
of the CNMV, the cooperation arrangements among the supervisory authorities and the
reporting and disclosure requirements on similar terms to those established in Royal
Decree 84/2015 for credit institutions.
Objective scope of supervision: the CNMV will review the systems, strategies, procedures
and means used by investment firms to comply with the solvency regulations and will
assess, 1) the risks to which investment firms and their consolidated groups are or could
be exposed, 2) the risks that investment firms pose for the financial system, taking into
account the determination and measurement of systemic risk, and 3) any risks revealed by
the stress tests, taking into account the nature, scale and complexity of the investment
firms’ activities.
Subjective scope of the supervisory function: the CNMV is responsible for the consolidated
supervision of investment firms and their consolidated groups, in specific cases detailed
in the regulations.
Risk management and internal
control requirements
Adoption of measures to return
to compliance with solvency
standards
Capital buffers
PRUDENTIAL SUPERVISION
AND REPORTING
REQUIREMENTS
40 Capital conservation buffers comprise CET1 equivalent to 2.5% of the total amount of the risk exposure, on an individual and consolidated basis.
41 Royal Decree 84/2015 of 13 February 2015 implementing Law 10/2014 of 26 June 2014 on the regulation, supervision and solvency of credit institutions.
BANCO DE ESPAÑA 22 ECONOMIC BULLETIN, JULY-AUGUST 2015 FINANCIAL REGULATION: 2015 Q2
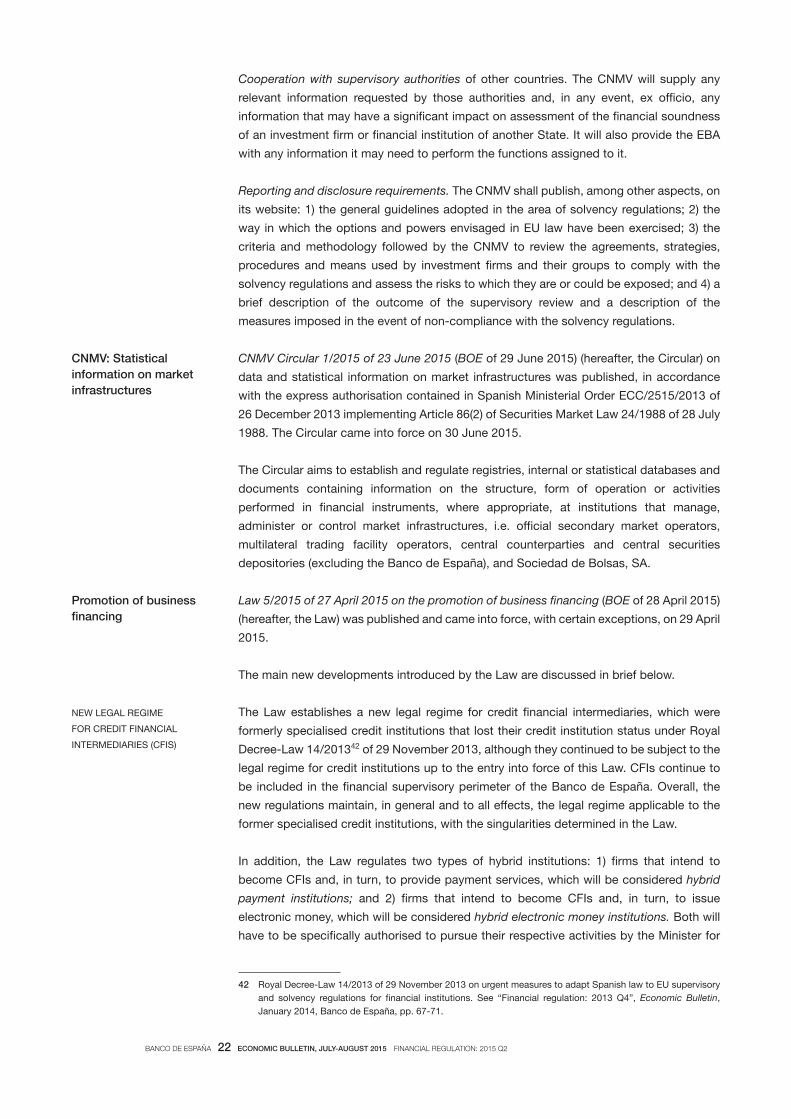
Cooperation with supervisory authorities of other countries. The CNMV will supply any
relevant information requested by those authorities and, in any event, ex officio, any
information that may have a significant impact on assessment of the financial soundness
of an investment firm or financial institution of another State. It will also provide the EBA
with any information it may need to perform the functions assigned to it.
Reporting and disclosure requirements. The CNMV shall publish, among other aspects, on
its website: 1) the general guidelines adopted in the area of solvency regulations; 2) the
way in which the options and powers envisaged in EU law have been exercised; 3) the
criteria and methodology followed by the CNMV to review the agreements, strategies,
procedures and means used by investment firms and their groups to comply with the
solvency regulations and assess the risks to which they are or could be exposed; and 4) a
brief description of the outcome of the supervisory review and a description of the
measures imposed in the event of non-compliance with the solvency regulations.
CNMV Circular 1/2015 of 23 June 2015 (BOE of 29 June 2015) (hereafter, the Circular) on
data and statistical information on market infrastructures was published, in accordance
with the express authorisation contained in Spanish Ministerial Order ECC/2515/2013 of
26 December 2013 implementing Article 86(2) of Securities Market Law 24/1988 of 28 July
1988. The Circular came into force on 30 June 2015.
The Circular aims to establish and regulate registries, internal or statistical databases and
documents containing information on the structure, form of operation or activities
performed in financial instruments, where appropriate, at institutions that manage,
administer or control market infrastructures, i.e. official secondary market operators,
multilateral trading facility operators, central counterparties and central securities
depositories (excluding the Banco de España), and Sociedad de Bolsas, SA.
Law 5/2015 of 27 April 2015 on the promotion of business financing (BOE of 28 April 2015)
(hereafter, the Law) was published and came into force, with certain exceptions, on 29 April
2015.
The main new developments introduced by the Law are discussed in brief below.
The Law establishes a new legal regime for credit financial intermediaries, which were
formerly specialised credit institutions that lost their credit institution status under Royal
Decree-Law 14/201342 of 29 November 2013, although they continued to be subject to the
legal regime for credit institutions up to the entry into force of this Law. CFIs continue to
be included in the financial supervisory perimeter of the Banco de España. Overall, the
new regulations maintain, in general and to all effects, the legal regime applicable to the
former specialised credit institutions, with the singularities determined in the Law.
In addition, the Law regulates two types of hybrid institutions: 1) firms that intend to
become CFIs and, in turn, to provide payment services, which will be considered hybrid
payment institutions; and 2) firms that intend to become CFIs and, in turn, to issue
electronic money, which will be considered hybrid electronic money institutions. Both will
have to be specifically authorised to pursue their respective activities by the Minister for
CNMV: Statistical information on market infrastructures
Promotion of business financing
NEW LEGAL REGIME
FOR CREDIT FINANCIAL
INTERMEDIARIES (CFIS)
42 Royal Decree-Law 14/2013 of 29 November 2013 on urgent measures to adapt Spanish law to EU supervisory and solvency regulations for financial institutions. See “Financial regulation: 2013 Q4”, Economic Bulletin, January 2014, Banco de España, pp. 67-71.

BANCO DE ESPAÑA 23 ECONOMIC BULLETIN, JULY-AUGUST 2015 FINANCIAL REGULATION: 2015 Q2
Economic Affairs and Competitiveness, following a report from the Banco de España and
from the Executive Service of the Commission for the Prevention of Money Laundering
and Monetary Offences (SEPBLAC) on matters within their respective remit.
The Law groups asset securitisation vehicles and mortgage securitisation vehicles in a
single legal category. However, mortgage securitisation vehicles existing at the date of
entry into force of the Law will coexist with the new asset securitisation vehicles until they
are gradually extinguished.
In keeping with best international practice, the Law significantly reinforces transparency
and investor protection requirements and stipulates the functions that management
companies must exercise, including, in any event, administering and managing the assets
grouped in the securitisation vehicles, without prejudice to the relevant expenses being
charged to the latter, in accordance with the provisions of the deeds setting them up.
The Law amends Securities Market Law 24/1988 of 28 July 1988 to encourage companies
to move from multilateral trading facilities (MTFs) to official secondary markets, easing
some of the requirements for a transitional period of two years. Specifically, companies will
not be required to release and disseminate the second half-yearly financial report and the
interim management statement.
It also regulates, for the first time, the legal regime for crowdfunding platforms.43 To that
end, these platforms must be authorised by and registered with the CNMV, restricting the
activity to authorised institutions so as to safeguard financial stability, combining, therefore,
the principles of necessity and proportionality envisaged in Law 20/2013 of 9 December
2013 on market unity.
Credit institutions must inform SMEs, in writing and with sufficient advance notice, of any
decision to cancel or significantly reduce (by 35% or more) the funding extended to them.
This advance notice must be accompanied by a document (“SME-Financial Information”)
reflecting the SME’s financial situation and payment record, in a standard format in
accordance with the criteria established by the Banco de España.
Credit institutions must also provide SMEs with a report on their credit assessment, using
the common methodology and models that will be prepared for this purpose by the Banco
de España. These reports will assess the risk of Spanish SMEs on comparable and reliable
terms, based on the combination of quality financial information, provided by the
institutions, and the appropriate and standard uniform methodology devised by the
supervisor.
The supervisory capacity of the CNMV is reinforced, to strengthen its role in safeguarding
securities market transparency, correct price formation in the markets and investor
protection.
Lastly, the government is mandated to make, within a period of six months, the necessary
legislative changes required to enhance the existing institutional arrangements for
customer protection and to make the existing public complaints services, ombudsmen
REFORM OF SECURITISATIONS
REGIME
IMPROVED ACCESS TO CAPITAL
MARKETS
MEASURES TO PROMOTE SME
FINANCING
OTHER NEW DEVELOPMENTS
43 These platforms bring together promoters of projects in need of funding (in the form of securities or share issues or loans) and investors or funders seeking to obtain a return on their investment. Crowdfunding essentially involves a large number of investors providing small amounts of funding to small high-potential projects through high-risk investments.

BANCO DE ESPAÑA 24 ECONOMIC BULLETIN, JULY-AUGUST 2015 FINANCIAL REGULATION: 2015 Q2
and customer care services more efficient. In this context, it will assess the advisability of
unifying the complaints services that are currently divided between the Banco de España,
the CNMV and the Directorate General of Insurance and Pension Funds (DGSFP).
Law 9/2015 of 25 May 2015 (BOE of 26 May 2015) on urgent insolvency measures
(hereafter, the Law) came into effect on 27 May 2015. The Law amends several provisions
of Insolvency Law 22/2003 of 9 July 2003 relating to insolvency arrangements, the winding-
up phase, classification of the insolvency proceeding, out-of-court payment agreements
and refinancing agreements, along with other related aspects of that Law. Ultimately, the
Law derives from Royal Decree-Law 11/2014 of 5 September 201444 on urgent insolvency
measures which introduced some key changes, with further changes added in its passage
through Parliament.
The Law aims, inter alia, to include in insolvency arrangements the new features that were
introduced into pre-insolvency arrangements by Law 17/2014 of 30 September 2014
adopting urgent measures on the refinancing and restructuring of corporate debt, namely:
1) making insolvency arrangements more flexible, seeking the continuity of economically
viable firms; 2) adapting legal privilege to the underlying economic reality; and 3) respecting
insofar as possible the legal nature of collateral in keeping with its genuine economic
value. It also aims to clarify certain aspects introduced by Law 17/2014 that had caused
some degree of controversy in their application.
The main new developments are discussed below.
Creditors’ meetings shall be understood to be duly assembled, not only when attended by
creditors whose claims account for at least half of the ordinary claims, but also (the new
development), if that percentage is not reached, when attended by creditors whose claims
account for at least half of those that may be affected by the insolvency arrangements,
excluding subordinated creditors. Thus, creditors that have acquired their claims after the
insolvency order was made are assured the right to vote, except for creditors with special
links to the debtor.
In the case of legal entities, once the winding-up plan has been approved, the insolvency
administrator must send, for publication on the Public Insolvency Register’s portal of
winding-up proceedings, any information necessary to facilitate their sale.
Regarding the rules to be applied if a winding-up plan has not been approved and, where
appropriate, in respect of any matters not envisaged in an approved plan, the general
principle that establishments, operations and any other production units of goods or
services be sold as a single unit is maintained, unless, following a report from the insolvency
administrator, the court considers that it is in the interest of the insolvency proceeding that
they be previously divided up or that some or all of the component parts be realised
separately.
Under the existing regulations, simple notice given by the debtor to the court of the fact
that it had entered into negotiations to reach a refinancing agreement or to obtain support
for an advance proposal for an arrangement on the terms envisaged in Law 22/2003
stayed judicial enforcement proceedings against assets required for the continuity of its
professional or business activity, including any enforcement proceedings under way, for a
Urgent insolvency measures
INSOLVENCY ARRANGEMENTS
WINDING-UP
REFINANCING AGREEMENTS
44 See “Financial regulation: 2014 Q3”, Economic Bulletin, October 2014, Banco de España, pp. 92-94.

BANCO DE ESPAÑA 25 ECONOMIC BULLETIN, JULY-AUGUST 2015 FINANCIAL REGULATION: 2015 Q2
maximum period of three months. The Law now provides that the debtor must indicate in
that notice which enforcement proceedings are under way against its assets and which
affect assets that it considers essential for the continuity of its professional or business
activity. In the event of dispute, the court shall decide whether or not an asset is essential
for the continuity of the economic activity of the debtor, for the purpose of stay of the
enforcement proceedings.
Law 9/2012 of 14 November 2012 on the restructuring and resolution of credit institutions
is amended, adding the qualification that credit claims transferred to SAREB (the asset
management company for assets arising from bank restructuring) shall be taken into
account for calculation of the majorities needed to adopt court-approved refinancing
agreements, even if SAREB is considered to have special links to the debtor.
It is clarified that steps arising from refinancing agreements, including court-approved
refinancing agreements, and out-of-court payment agreements shall be deemed
restructuring measures for the purposes of Royal Decree-Law 5/2005 of 11 March 2005 on
urgent reforms to boost productivity and improve public sector procurement. They shall
also be considered insolvency proceedings for the purposes of Law 41/1999 of 12 November
1999 on payment and securities settlement systems.
Lastly, a committee is established to monitor forbearance practices and debt overhang
reduction, responsible for following up on and verifying compliance with the measures
adopted by this Law and, where appropriate, for proposing to the Government any relevant
reforms to facilitate the restructuring, at the pre-insolvency or insolvency stage, of the debt
of economically viable firms.
Royal Decree-Law 6/2015 of 14 May 2015 (BOE of 15 May 2015) was published, amending
Film Industry Law 55/2007 of 28 December 2007, granting several extraordinary loans and
supplementary funding in the State budget and adopting other tax measures.
Law 35/2006 of 28 November 2006 on personal income tax and partially amending the
corporate income tax, non-resident income tax and wealth tax laws, was amended,
establishing, in certain cases, improvements in the tax treatment of taxpayers affected by
mis-selling of subordinated debt and preference shares.
The new rules will apply to taxpayers that receive compensation, on or after 1 January
2013, as a consequence of agreements reached with institutions that issued subordinated
debt securities or preference shares and will affect: 1) that compensation; 2) any positive
or negative income that may have been generated previously as a result of buy-back and
subscription or exchange for other securities; and 3) income obtained on the sale of those
securities.
Lastly, holders of subordinated debt or preference shares whose contracts have been
declared null and void by the courts may request that their personal income tax self-
assessments be corrected and, where appropriate, may obtain a refund of any tax paid
incorrectly on the returns obtained, even if the right to apply for that refund is statute-
barred. Rectification of self-assessments will only affect returns obtained on subordinated
debt and preference shares, and any tax withholdings made against those returns.
15.07.2015.
OTHER NEW DEVELOPMENTS
Tax treatment of subordinated debt and preference shares


BANCO DE ESPAÑA 1* ECONOMIC BULLETIN, JULY-AUGUST 2015 ECONOMIC INDICATORS
CONTENTS
MAIN MACROECONOMIC
MAGNITUDES1.1 Gross domestic product. Volume chain-linked indices, reference
year 2010 = 100. Demand components. Spain and euro area 4*
1.2 Gross domestic product. Volume chain-linked indices, reference
year 2010 = 100. Demand components. Spain 5*
1.3 Gross domestic product. Volume chain-linked indices, reference
year 2010 = 100. Branches of activity. Spain 6*
1.4 Grossdomesticproduct.Implicitdeflators.Spain 7*
INTERNATIONAL ECONOMY 2.1 International comparison. Gross domestic product at constant prices 8*
2.2 International comparison. Unemployment rates 9*
2.3 International comparison. Consumer prices 10*
2.4 Bilateral exchange rates and nominal and real effective exchange rate
indices for the euro, US dollar and Japanese yen 11*
2.5 Central bank intervention interest rates and short-term domestic market
interest rates 12*
2.6 10-year government bond yields on domestic markets 13*
2.7 International markets: non-energy commodities price index. Crude oil
and gold price 14*
NATIONAL DEMAND
AND ACTIVITY3.1 Indicators of private consumption. Spain and euro area 15*
3.2 Investment in industry (excluding construction): opinion surveys. Spain 16*
3.3 Construction. Indicators of building starts and consumption of cement.
Spain 17*
3.4 Industrial production index. Spain and euro area 18*
3.5 Monthly business survey: industry and construction. Spain and euro area
(NACE 2009) 19*
3.6 Business survey: capacity utilisation. Spain and euro area (NACE 2009) 20*
3.7 Tourism and transport statistics. Spain 21*
LABOUR MARKET 4.1 Labour force. Spain 22*
4.2 Employment and wage-earners. Spain and euro area 23*
4.3 Employment by branch of activity. Spain 24*
4.4 Wage-earners by type of contract and unemployment by duration.
Spain 25*
4.5 Registered unemployment by branch of activity. Contracts and
placements. Spain 26*
4.6 Collective bargaining agreements. Spain 27*
4.7 Quarterly labour costs survey 28*
4.8 Unit labour costs. Spain and euro area 29*
These economic indicators are permanently updated on the Banco de España website (http://www.bde.es/homee.htm). The date on which the indicators whose source is the Banco de España [those indicated with (BE) in this table of contents] are updated is published in a calendar that is disseminated on the Internet (http://www.bde.es/bde/en/areas/estadis/).
BANCO DE ESPAÑA 2* ECONOMIC BULLETIN, JULY-AUGUST 2015 ECONOMIC INDICATORS
PRICES 5.1 Consumer price index. Spain (2011 = 100) 30*
5.2 Harmonised index of consumer prices. Spain and euro area (2005 = 100) 31*
5.3 Producer price index. Spain and euro area (2010=100) 32*
5.4 Unit value indices for Spanish foreign trade 33*
GENERAL GOVERNMENT 6.1 General Government. Net lending (+) or net borrowing (–) 34*
6.2 GeneralGovernment.DebtaccordingtotheExcessiveDeficitProcedure
(EDP) 35*
6.3 State resources and uses according to the National Accounts 36*
6.4 Statefinancialtransactions1. Spain. 37*
6.5 State. Liabilities outstanding according to the methodology of Excessive
DeficitProcedure(EDP)1. Spain 38*
6.6 Regional (autonomous) governments. Net lending (+)
or net borrowing (–) 39*
BALANCE OF PAYMENTS,
FOREIGN TRADE
AND INTERNATIONAL
INVESTMENT POSITION
7.1 Spanish balance of payments vis-à-vis other euro area residents
and the rest of the world. Current account1 (BE) 40*
7.2 Spanish balance of payments vis-à-vis other euro area residents
and the rest of the world. Financial account (BE) 41*
7.3 Spanish foreign trade with other euro area countries and with the rest
of the world. Exports and dispatches 42*
7.4 Spanish foreign trade with other euro area countries and with the rest
of the world. Imports and arrivals 43*
7.5 Spanish foreign trade with other euro area countries and with the rest
of the world. Trade balance: geographical distribution 44*
7.6 Spanish international investment position vis-à-vis other euro area
residents and the rest of the world. Summary1 (BE) 45*
7.7 Spanish international investment position vis-à-vis other euro area
residents and the rest of the world. Breakdown by investment1 (BE) 46*
7.8 Spanish reserve assets1 (BE) 47*
7.9 Spanish external debt vis-à-vis other euro area residents and the rest
of the world. Summary1 (BE) 48*
FINANCIAL VARIABLES 8.1 Consolidated balance sheet of the Eurosystem, and balance sheet
of the Banco de España. Net lending to credit institutions and its
counterparts (BE) 49*
8.2 Cash and cash equivalents, other liabilities of credit institutions and
mutualfundssharesofnon-financialcorporations,householdsand
NPISHs resident in Spain (BE) 50*
8.3 Cash and cash equivalents, other liabilities of credit institutions and mutual
fundssharesofnon-financialcorporationsresidentinSpain(BE) 51*
8.4 Cash and cash equivalents, other liabilities of credit institutions and mutual
funds shares of households and NPISHs resident in Spain (BE) 52*
8.5 Financingofnon-financialsectorsresidentinSpain(BE) 53*
8.6 Financingofnon-financialcorporationsresidentinSpain(BE) 54*
8.7 Financing of households and NPISHs resident in Spain (BE) 55*
8.8 GrossfinancingofSpain’sgeneralgovernment(BE) 56*
8.9 Lendingbycreditinstitutionsandcreditfinancialintermediariestoother
resident sectors. Breakdown by end-use 57*
1 IMF Special Data Dissemination Standard (SDDS).
BANCO DE ESPAÑA 3* ECONOMIC BULLETIN, JULY-AUGUST 2015 ECONOMIC INDICATORS
8.10 Profitandlossaccountofdeposit-takinginstitutionsresidentinSpain
(BE) 58*
8.11 Mutual funds resident in Spain 59*
8.12 Share price indices and turnover on securities markets. Spain and euro
area 60*
8.13 Otherfinancialcorporations:consolidatedfinancialbalancesheet 61*
INTEREST RATES
AND INDICES OF SPANISH
COMPETITIVENESS
9.1 Interest rates. Eurosystem and money market. Euro area and Spain
(BE) 62*
9.2 Interest rates: Spanish short-term and long-term securities markets1
(BE) 63*
9.3 Interestratesonnewbusiness.Creditinstitutionsandcreditfinancial
intermediaries (CBE 4/2002)1 (BE) 64*
9.4 Indices of Spanish competitiveness vis-à-vis the EU-28 and the euro
area 65*
9.5 Indices of Spanish competitiveness vis-à-vis the developed countries
and industrialised countries 66*
1 IMF Special Data Dissemination Standard (SDDS).

2010 2011 2012 2013 2014 2015-9
-8
-7
-6
-5
-4
-3
-2
-1
0
1
2
3
4
5
6
-9
-8
-7
-6
-5
-4
-3
-2
-1
0
1
2
3
4
5
6%%
GDP SPAIN
GDP EURO AREA
DOMESTIC DEMAND SPAIN
DOMESTIC DEMAND EURO AREA
GDP. AND DOMESTIC DEMAND. SPAIN AND EURO AREA Annual percentage changes
2010 2011 2012 2013 2014 2015-9
-8
-7
-6
-5
-4
-3
-2
-1
0
1
2
3
4
5
6
-9
-8
-7
-6
-5
-4
-3
-2
-1
0
1
2
3
4
5
6%%
FINAL CONS. HOUS. AND NPISHs. SPAIN
FINAL CONS. HOUS. AND NPISHs. EURO AREA
GFCF SPAIN
GFCF EURO AREA
DEMAND COMPONENTS. SPAIN AND EURO AREA Annual percentage changes
P A A
. Series depicted in chart.
. 1 . 2
. 3 . 4 5 6
. 7 . 8
. 9 . 10 11 12 13 14 15 16
1.1. GROSS DOMESTIC PRODUCT. VOLUME CHAIN-LINKED INDICES, REFERENCE YEAR 2010=100. DEMAND COMPONENTS. SPAIN AND EURO AREA (a)
___________________________________________________________________________________________________________________________
Annual percentage changes
GDP Final consumption General govern- Gross fixed Domestic Exports of Imports of Memorandum item: of households ment final capital demand goods and goods and GDPmp (current and NPISHs consumption formation services services prices) (g)
Euro Euro Euro Euro Euro Euro Euro Euro
Spain area Spain area Spain area Spain area Spain area Spain area Spain area Spain area (b) (c) (d) (e) (f) (f)
12 -2.1 -0.8 -2.9 -1.3 -3.7 -0.1 -8.1 -3.5 -4.2 -2.3 1.2 2.9 -6.3 -0.6 1 055 9 841 13 -1.2 -0.3 -2.3 -0.6 -2.9 0.2 -3.8 -2.3 -2.7 -0.7 4.3 2.1 -0.5 1.3 1 049 9 937 14 1.4 0.9 2.4 1.0 0.1 0.6 3.4 1.2 2.3 0.9 4.2 3.7 7.6 4.0 1 058 10 112
P P P
A A A A
A A A A
A
Sources: INE (Quarterly National Accounts of Spain. Base year 2010) and Eurostat.
a. Spain: prepared in accordance with ESA2010, seasonally- and working-day-adjusted series; Euro area, prepared in accordance with
ESA2010. b. Final consumption expenditure may take place on the domestic territory or abroad. It therefore includes residents’ consumption abroad, which is
subsequently deducted in Imports of goods and services. c. Euro area, private consumption.
d. Euro area, government consumption. e. Residents’ demand within and outside the economic territory.
f. Exports and imports comprise goods and services and include cross-border trade within the euro area. g. Billions of euro.
12 Q2 -2.1 -0.8 -3.1 -1.1 -3.2 -0.1 -8.0 -3.5 -4.4 -2.5 0.9 3.1 -7.4 -0.8 264 2 456 Q3 -2.1 -0.9 -2.7 -1.4 -4.3 -0.1 -8.3 -3.9 -4.0 -2.5 2.1 3.1 -4.6 -0.7 264 2 463 Q4 -2.5 -0.9 -3.2 -1.4 -5.0 -0.4 -8.4 -3.8 -4.5 -2.1 1.5 2.2 -5.3 -0.4 262 2 465
13 Q1 -2.2 -1.1 -3.8 -1.3 -4.5 -0.1 -6.3 -4.7 -4.3 -2.1 -0.0 1.2 -7.3 -0.9 262 2 464 Q2 -1.7 -0.5 -3.1 -0.7 -3.6 0.0 -5.5 -2.9 -3.5 -1.1 7.3 2.1 1.3 0.8 262 2 482 Q3 -1.0 -0.2 -2.1 -0.3 -2.4 0.4 -2.6 -1.2 -2.4 0.0 4.9 1.7 0.5 2.3 262 2 490 Q4 0.0 0.5 -0.1 0.2 -1.1 0.5 -0.5 -0.3 -0.5 0.3 5.1 3.3 3.8 3.2 263 2 501
14 Q1 0.6 1.1 1.3 0.7 0.3 0.5 0.8 2.5 1.3 1.2 6.4 3.5 9.4 3.9 262 2 515 Q2 1.2 0.8 2.3 0.8 0.3 0.6 3.9 1.2 2.4 1.0 1.0 3.2 4.9 3.8 264 2 521 Q3 1.6 0.8 2.7 1.0 0.3 0.6 3.9 0.6 2.7 0.6 4.5 4.1 8.6 3.9 266 2 532 Q4 2.0 0.9 3.3 1.5 -0.5 0.7 5.1 0.5 2.8 1.0 4.7 4.1 7.7 4.6 267 2 545
15 Q1 2.7 1.0 3.4 1.7 0.1 1.1 6.0 0.8 3.1 1.3 5.7 4.2 7.4 5.1 271 2 565
BANCO DE ESPAÑA 4* ECONOMIC BULLETIN, JULY-AUGUST 2015 ECONOMIC INDICATORS

2010 2011 2012 2013 2014 2015-12
-10
-8
-6
-4
-2
0
2
4
6
8
10
12
14
16
-12
-10
-8
-6
-4
-2
0
2
4
6
8
10
12
14
16%%
GDPmp
DOMESTIC DEMAND (b)
GDP. DOMESTIC DEMAND Annual percentage changes
2010 2011 2012 2013 2014 2015-12
-10
-8
-6
-4
-2
0
2
4
6
8
10
12
14
16
-12
-10
-8
-6
-4
-2
0
2
4
6
8
10
12
14
16%%
GFCF ON EQUIPMENT AND CULTIVATED ASSETS
EXPORTS
IMPORTS
GDP. DEMAND COMPONENTS Annual percentage changes
P A A
. Series depicted in chart.
1 2 3 . 4 5 6
. 7 8 9 10 . 11 12 13 14
. 15 . 16
1.2. GROSS DOMESTIC PRODUCT. VOLUME CHAIN-LINKED INDICES. REFERENCE YEAR 2010=100. DEMAND COMPONENTS. SPAIN: BREAKDOWN (a)
___________________________________________________________________________________________________________________________
Annual percentage changes
Gross fixed capital formation Exports of goods and services Imports of goods and services Memorandum items Tangible fixed assets Intangible Change Of which Of which fixed in
Total assets Stocks Total Goods Services Final con- Total Goods Services Final con- Domestic GDP Total Construc- Equipment (b) sumption sumption demand tion and of non- of resi- (b) (c) cultivated residents dents in assets in the rest economic of the territory world
12 -8.1 -9.2 -9.3 -9.0 -0.2 -0.1 1.2 1.2 1.0 -0.7 -6.3 -6.4 -6.0 -7.4 -4.3 -2.1 13 -3.8 -4.2 -9.2 5.6 -1.3 0.1 4.3 5.7 0.9 2.9 -0.5 0.4 -4.7 1.9 -2.7 -1.2 14 3.4 3.6 -1.5 12.2 2.5 0.2 4.2 4.5 3.3 3.7 7.6 7.8 7.0 8.6 2.2 1.4
P P P
A A A A
A A A A
A
Source: INE (Quarterly National Accounts of Spain. Base year 2010).
a. Prepared in accordance with ESA2010, seasonally- and working-day-adjusted series.
b. Contribution to GDPmp growth rate.
c. Residents’ demand within and outside the economic territory.
12 Q2 -8.0 -9.0 -9.3 -8.4 -1.0 -0.3 0.9 0.6 1.4 -1.3 -7.4 -7.7 -5.5 -2.5 -4.4 -2.1 Q3 -8.3 -9.7 -8.9 -11.1 1.0 0.3 2.1 2.3 1.8 0.6 -4.6 -4.8 -3.4 -9.4 -4.1 -2.1 Q4 -8.4 -9.4 -8.8 -10.6 -1.4 0.1 1.5 2.9 -1.5 -2.4 -5.3 -5.4 -4.9 -8.7 -4.5 -2.5
13 Q1 -6.3 -7.0 -7.4 -6.2 -2.3 0.3 -0.0 0.0 -0.3 0.9 -7.3 -8.3 -2.0 -3.3 -4.3 -2.2 Q2 -5.5 -6.4 -11.4 3.4 -0.0 0.3 7.3 10.4 0.2 2.3 1.3 2.3 -3.9 -1.8 -3.5 -1.7 Q3 -2.6 -2.6 -9.7 11.4 -2.7 -0.1 4.9 6.9 0.3 2.4 0.5 2.1 -7.4 4.4 -2.4 -1.0 Q4 -0.5 -0.5 -8.3 14.7 -0.3 -0.1 5.1 5.8 3.3 6.0 3.8 5.7 -5.2 8.4 -0.5 0.0
14 Q1 0.8 0.7 -7.4 15.8 1.8 0.3 6.4 6.7 5.7 6.2 9.4 10.1 5.9 6.8 1.2 0.6 Q2 3.9 4.3 -0.7 12.9 1.7 0.2 1.0 0.8 1.6 3.9 4.9 4.8 5.4 10.0 2.3 1.2 Q3 3.9 3.9 0.1 10.2 3.4 0.3 4.5 5.5 2.4 1.3 8.6 8.7 7.8 9.0 2.6 1.6 Q4 5.1 5.5 2.4 10.3 3.1 -0.1 4.7 5.3 3.4 3.3 7.7 7.5 8.7 8.7 2.7 2.0
15 Q1 6.0 6.7 4.9 9.4 2.0 -0.1 5.7 3.4 11.2 1.4 7.4 6.8 10.4 10.4 3.0 2.7
BANCO DE ESPAÑA 5* ECONOMIC BULLETIN, JULY-AUGUST 2015 ECONOMIC INDICATORS

2010 2011 2012 2013 2014 2015-20
-10
0
10
20
30
-20
-10
0
10
20
30%%
GDPmp
AGRICULTURE,FORESTRY AND FISHING
INDUSTRY
MANUFACTURING INDUSTRY
GDP. BRANCHES OF ACTIVITY Annual percentage changes
2010 2011 2012 2013 2014 2015-20
-10
0
10
20
30
-20
-10
0
10
20
30%%
GDPpm
CONSTRUCTION
SERVICES
GDP. BRANCHES OF ACTIVITY Annual percentage changes
P A A
. Series depicted in chart.
. 1 . 2
. 3 . 4
. 5 . 6 7 8 9 10 11 12 13 14
1.3. GROSS DOMESTIC PRODUCT. VOLUME CHAIN-LINKED INDICES. REFERENCE YEAR 2010=100. BRANCHES OF ACTIVITY. SPAIN (a)
___________________________________________________________________________________________________________________________
Annual percentage changes
Gross Agri- Industry Construc- Services Net taxes domestic culture tion on product livestock industry products at market breeding, Of which Total Trade, Informa- Financial Real Profes- Public Ad- Artistic, prices forestry Total transport tion and estate sional ministra- recreational and Manufac- and and insurance activities activities tion, and other fishing turing acomoda- communi- activities Health and services industry tion cations Education activities
12 -2.1 -12.8 -3.8 -4.0 -14.3 0.2 0.4 2.6 -3.4 2.4 -0.5 -0.6 -0.3 -4.4 13 -1.2 15.6 -1.8 -1.1 -8.1 -1.0 -0.7 -2.8 -7.8 1.1 -1.1 -1.3 1.5 -1.5 14 1.4 3.3 1.5 2.3 -1.2 1.6 2.8 1.6 -5.5 2.0 2.6 0.5 2.9 0.6
P P P
A A A A
A A A A
A
Source: INE (Quarterly National Accounts of Spain. Base year 2010).
a. Prepared in accordance with ESA2010, seasonally- and working-day-adjusted series.
12 Q2 -2.1 -16.4 -3.4 -4.1 -14.8 0.4 0.2 2.6 -2.5 2.0 0.2 -0.1 0.2 -4.4 Q3 -2.1 -13.4 -4.3 -3.9 -14.0 0.3 0.7 3.5 -4.2 2.4 0.0 -0.9 -0.4 -4.2 Q4 -2.5 -12.1 -4.2 -4.1 -12.7 -0.5 -0.0 1.6 -4.9 2.6 -3.2 -1.3 -1.9 -4.2
13 Q1 -2.2 5.3 -3.3 -2.9 -8.8 -1.5 -1.5 -3.2 -6.2 1.7 -2.4 -1.9 -0.3 -2.9 Q2 -1.7 21.9 -2.4 -1.2 -9.6 -1.6 -1.5 -2.9 -9.1 1.6 -2.4 -1.8 1.1 -1.5 Q3 -1.0 17.2 -0.9 -0.6 -8.0 -1.1 -0.8 -3.5 -7.9 0.3 -1.0 -0.9 1.4 -1.1 Q4 0.0 18.4 -0.5 0.4 -6.0 0.0 0.9 -1.6 -8.2 0.8 1.3 -0.7 3.8 -0.6
14 Q1 0.6 10.3 0.5 1.5 -6.2 0.9 1.9 1.3 -6.5 1.3 1.4 0.2 3.6 -0.0 Q2 1.2 1.6 1.9 2.4 -1.7 1.4 2.6 0.8 -5.3 1.9 2.0 0.6 2.4 0.5 Q3 1.6 5.3 1.5 2.3 0.0 1.7 3.0 2.0 -5.4 2.5 2.3 0.6 2.5 1.1 Q4 2.0 -3.4 2.1 3.0 3.4 2.3 3.7 2.4 -4.6 2.3 4.8 0.5 3.0 1.0
15 Q1 2.7 -2.6 2.7 2.8 5.8 2.6 4.3 2.4 -4.5 2.0 5.8 1.2 2.7 2.4
BANCO DE ESPAÑA 6* ECONOMIC BULLETIN, JULY-AUGUST 2015 ECONOMIC INDICATORS
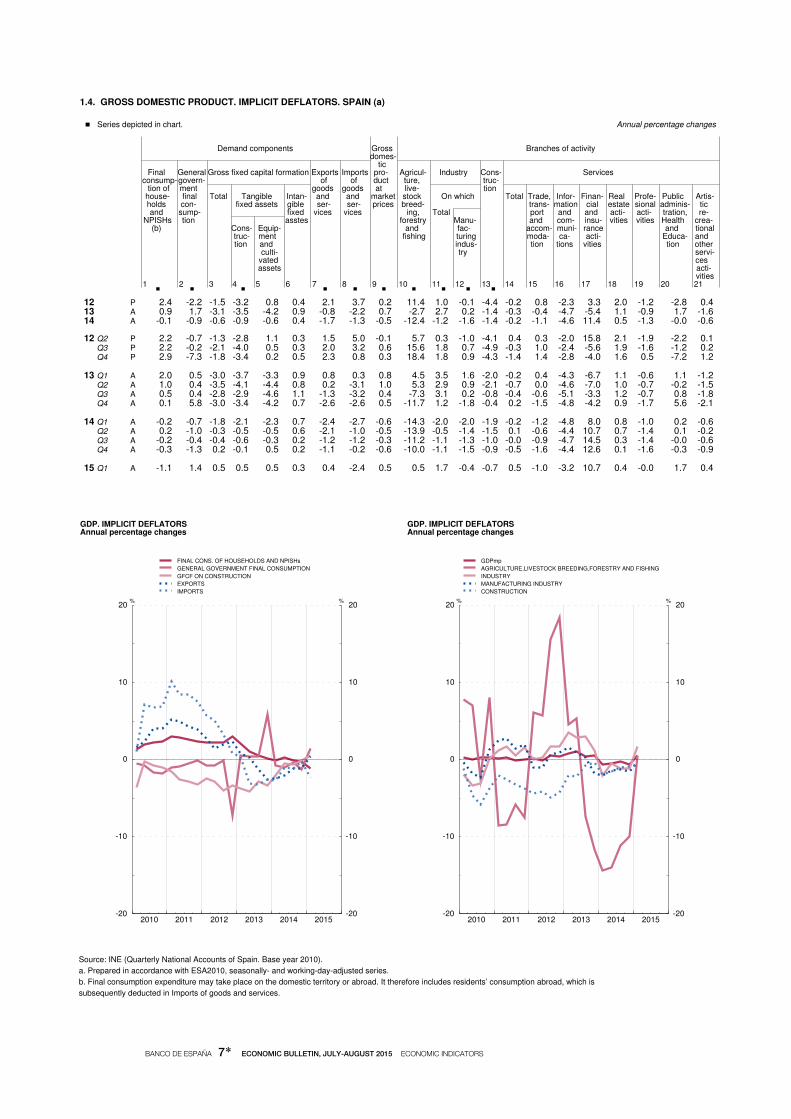
2010 2011 2012 2013 2014 2015-20
-10
0
10
20
-20
-10
0
10
20%%
FINAL CONS. OF HOUSEHOLDS AND NPISHs
GENERAL GOVERNMENT FINAL CONSUMPTION
GFCF ON CONSTRUCTION
EXPORTS
IMPORTS
GDP. IMPLICIT DEFLATORS Annual percentage changes
2010 2011 2012 2013 2014 2015-20
-10
0
10
20
-20
-10
0
10
20%%
GDPmp
AGRICULTURE,LIVESTOCK BREEDING,FORESTRY AND FISHING
INDUSTRY
MANUFACTURING INDUSTRY
CONSTRUCTION
GDP. IMPLICIT DEFLATORS Annual percentage changes
P A A
. Series depicted in chart.
. 1 . 2 3
. 4 5 6 . 7
. 8 . 9
. 10 . 11
. 12 . 13 14 15 16 17 18 19 20 21
1.4. GROSS DOMESTIC PRODUCT. IMPLICIT DEFLATORS. SPAIN (a)
___________________________________________________________________________________________________________________________
Annual percentage changes
Demand components Gross Branches of activity domes- tic
Final General Gross fixed capital formation Exports Imports pro- Agricul- Industry Cons- Services consump- govern- of of duct ture, truc-
tion of ment goods goods at live- tion house- final Total Tangible Intan- and and market stock On which Total Trade, Infor- Finan- Real Profe- Public Artis- holds con- fixed assets gible ser- ser- prices breed- trans- mation cial estate sional adminis- tic and sump- fixed vices vices ing, Total port and and acti- acti- tration, re-
NPISHs tion asstes forestry Manu- and com- insu- vities vities Health crea- (b) Cons- Equip- and fac- accom- muni- rance and tional truc- ment fishing turing moda- ca- acti- Educa- and tion and indus- tion tions vities tion other culti- try servi- vated ces assets acti- vities
12 2.4 -2.2 -1.5 -3.2 0.8 0.4 2.1 3.7 0.2 11.4 1.0 -0.1 -4.4 -0.2 0.8 -2.3 3.3 2.0 -1.2 -2.8 0.4 13 0.9 1.7 -3.1 -3.5 -4.2 0.9 -0.8 -2.2 0.7 -2.7 2.7 0.2 -1.4 -0.3 -0.4 -4.7 -5.4 1.1 -0.9 1.7 -1.6 14 -0.1 -0.9 -0.6 -0.9 -0.6 0.4 -1.7 -1.3 -0.5 -12.4 -1.2 -1.6 -1.4 -0.2 -1.1 -4.6 11.4 0.5 -1.3 -0.0 -0.6
P P P
A A A A
A A A A
A
Source: INE (Quarterly National Accounts of Spain. Base year 2010).
a. Prepared in accordance with ESA2010, seasonally- and working-day-adjusted series.
b. Final consumption expenditure may take place on the domestic territory or abroad. It therefore includes residents’ consumption abroad, which is
subsequently deducted in Imports of goods and services.
12 Q2 2.2 -0.7 -1.3 -2.8 1.1 0.3 1.5 5.0 -0.1 5.7 0.3 -1.0 -4.1 0.4 0.3 -2.0 15.8 2.1 -1.9 -2.2 0.1 Q3 2.2 -0.2 -2.1 -4.0 0.5 0.3 2.0 3.2 0.6 15.6 1.8 0.7 -4.9 -0.3 1.0 -2.4 -5.6 1.9 -1.6 -1.2 0.2 Q4 2.9 -7.3 -1.8 -3.4 0.2 0.5 2.3 0.8 0.3 18.4 1.8 0.9 -4.3 -1.4 1.4 -2.8 -4.0 1.6 0.5 -7.2 1.2
13 Q1 2.0 0.5 -3.0 -3.7 -3.3 0.9 0.8 0.3 0.8 4.5 3.5 1.6 -2.0 -0.2 0.4 -4.3 -6.7 1.1 -0.6 1.1 -1.2 Q2 1.0 0.4 -3.5 -4.1 -4.4 0.8 0.2 -3.1 1.0 5.3 2.9 0.9 -2.1 -0.7 0.0 -4.6 -7.0 1.0 -0.7 -0.2 -1.5 Q3 0.5 0.4 -2.8 -2.9 -4.6 1.1 -1.3 -3.2 0.4 -7.3 3.1 0.2 -0.8 -0.4 -0.6 -5.1 -3.3 1.2 -0.7 0.8 -1.8 Q4 0.1 5.8 -3.0 -3.4 -4.2 0.7 -2.6 -2.6 0.5 -11.7 1.2 -1.8 -0.4 0.2 -1.5 -4.8 -4.2 0.9 -1.7 5.6 -2.1
14 Q1 -0.2 -0.7 -1.8 -2.1 -2.3 0.7 -2.4 -2.7 -0.6 -14.3 -2.0 -2.0 -1.9 -0.2 -1.2 -4.8 8.0 0.8 -1.0 0.2 -0.6 Q2 0.2 -1.0 -0.3 -0.5 -0.5 0.6 -2.1 -1.0 -0.5 -13.9 -0.5 -1.4 -1.5 0.1 -0.6 -4.4 10.7 0.7 -1.4 0.1 -0.2 Q3 -0.2 -0.4 -0.4 -0.6 -0.3 0.2 -1.2 -1.2 -0.3 -11.2 -1.1 -1.3 -1.0 -0.0 -0.9 -4.7 14.5 0.3 -1.4 -0.0 -0.6 Q4 -0.3 -1.3 0.2 -0.1 0.5 0.2 -1.1 -0.2 -0.6 -10.0 -1.1 -1.5 -0.9 -0.5 -1.6 -4.4 12.6 0.1 -1.6 -0.3 -0.9
15 Q1 -1.1 1.4 0.5 0.5 0.5 0.3 0.4 -2.4 0.5 0.5 1.7 -0.4 -0.7 0.5 -1.0 -3.2 10.7 0.4 -0.0 1.7 0.4
BANCO DE ESPAÑA 7* ECONOMIC BULLETIN, JULY-AUGUST 2015 ECONOMIC INDICATORS

2012 2013 2014 2015-4
-3
-2
-1
0
1
2
3
4
-4
-3
-2
-1
0
1
2
3
4%%
UNITED STATES
EURO AREA
JAPAN
GROSS DOMESTIC PRODUCT Annual percentage changes
2012 2013 2014 2015-4
-3
-2
-1
0
1
2
3
4
-4
-3
-2
-1
0
1
2
3
4%%
SPAIN
UNITED KINGDOM
FRANCE
ITALY
GERMANY
GROSS DOMESTIC PRODUCT Annual percentage changes
. Series depicted in chart.
1 2 . 3
. 4 . 5
. 6 . 7
. 8 . 9
. 10
2.1. INTERNATIONAL COMPARISON. GROSS DOMESTIC PRODUCT AT CONSTANT PRICES
___________________________________________________________________________________________________________________________
Annual percentage changes
OECD European Euro Germany Spain United France Italy Japan United Union area States Kingdom
12 1.3 -0.5 -0.8 0.6 -2.1 2.3 0.2 -2.8 1.7 0.7 13 1.4 0.1 -0.3 0.2 -1.2 2.2 0.7 -1.7 1.6 1.7 14 1.8 1.3 0.9 1.6 1.4 2.4 0.2 -0.4 -0.1 2.8
Sources: ECB, INE and OECD.
Note: The underlying series for this indicator are in Table 26.2 of the BE Boletín Estadístico.
12 Q1 1.8 -0.1 -0.5 0.9 -1.7 2.6 0.4 -2.3 3.3 1.0 Q2 1.6 -0.5 -0.8 0.8 -2.1 2.3 0.2 -3.1 3.5 0.6 Q3 1.2 -0.6 -0.9 0.5 -2.1 2.7 0.3 -3.1 0.3 0.7 Q4 0.7 -0.7 -0.9 0.1 -2.5 1.6 0.0 -2.7 -0.0 0.4
13 Q1 0.8 -0.7 -1.1 -0.6 -2.2 1.7 0.1 -2.6 0.3 0.9 Q2 1.1 -0.0 -0.5 0.1 -1.7 1.8 1.1 -2.0 1.4 1.7 Q3 1.6 0.3 -0.2 0.3 -1.0 2.3 0.8 -1.4 2.4 1.6 Q4 2.2 1.0 0.5 1.1 0.0 3.1 1.0 -0.9 2.3 2.4
14 Q1 1.9 1.4 1.1 2.3 0.6 1.9 0.7 -0.2 2.1 2.7 Q2 1.9 1.3 0.8 1.4 1.2 2.6 -0.2 -0.3 -0.4 2.9 Q3 1.8 1.3 0.8 1.2 1.6 2.7 0.2 -0.5 -1.4 2.8 Q4 1.8 1.4 0.9 1.5 2.0 2.4 -0.0 -0.4 -0.8 3.0
15 Q1 ... 1.5 1.0 1.0 2.7 2.7 0.7 0.1 -1.4 2.4
BANCO DE ESPAÑA 8* ECONOMIC BULLETIN, JULY-AUGUST 2015 ECONOMIC INDICATORS

2012 2013 2014 20150
2
4
6
8
10
12
14
16
18
20
22
24
26
28
0
2
4
6
8
10
12
14
16
18
20
22
24
26
28%%
SPAIN
EURO AREA
UNEMPLOYMENT RATES
2012 2013 2014 20150
2
4
6
8
10
12
14
16
18
20
22
24
26
28
0
2
4
6
8
10
12
14
16
18
20
22
24
26
28%%
GERMANY
UNITED STATES
FRANCE
ITALY
JAPAN
UNITED KINGDOM
UNEMPLOYMENT RATES
. Series depicted in chart.
1 2 . 3
. 4 . 5
. 6 . 7
. 8 . 9
. 10
2.2. INTERNATIONAL COMPARISON. UNEMPLOYMENT RATES
Source: OECD.
___________________________________________________________________________________________________________________________
Percentages
OECD European Euro Germany Spain United France Italy Japan United Union area States Kingdom
12 7.9 10.5 11.4 5.4 24.8 8.1 9.8 10.6 4.3 7.9 13 7.9 10.8 12.0 5.2 26.1 7.4 10.3 12.2 4.0 7.6 14 7.4 10.2 11.6 5.0 24.5 6.1 10.3 12.6 3.6 6.1
13 Nov 7.7 10.7 11.9 5.1 25.8 7.0 10.1 12.4 3.9 7.2 Dec 7.6 10.6 11.9 5.1 25.5 6.7 10.1 12.5 3.7 7.1
14 Jan 7.6 10.6 11.9 5.1 25.5 6.6 10.1 12.8 3.7 6.9 Feb 7.6 10.5 11.8 5.1 25.2 6.7 10.1 12.7 3.6 6.7 Mar 7.6 10.4 11.7 5.1 25.1 6.6 10.1 12.5 3.6 6.6 Apr 7.4 10.3 11.7 5.0 24.9 6.2 10.1 12.5 3.6 6.4 May 7.4 10.3 11.7 5.0 24.7 6.3 10.1 12.6 3.6 6.3 Jun 7.3 10.2 11.6 5.0 24.5 6.1 10.2 12.4 3.7 6.2 Jul 7.4 10.2 11.6 5.0 24.3 6.2 10.3 12.8 3.7 6.0 Aug 7.3 10.1 11.5 5.0 24.2 6.1 10.4 12.6 3.5 5.9 Sep 7.3 10.1 11.5 5.0 24.0 5.9 10.4 12.7 3.6 5.9 Oct 7.2 10.0 11.5 5.0 23.9 5.7 10.4 12.8 3.5 5.8 Nov 7.2 10.0 11.5 4.9 23.7 5.8 10.5 13.0 3.5 5.6 Dec 7.0 9.9 11.4 4.8 23.6 5.6 10.5 12.4 3.4 5.5
15 Jan 7.0 9.8 11.3 4.8 23.3 5.7 10.5 12.3 3.6 5.4 Feb 7.0 9.8 11.2 4.8 23.1 5.5 10.5 12.4 3.5 5.4 Mar 6.9 9.7 11.2 4.7 22.9 5.5 10.5 12.6 3.4 ... Apr 6.9 9.7 11.1 4.7 22.7 5.4 10.5 12.4 3.3 ...
BANCO DE ESPAÑA 9* ECONOMIC BULLETIN, JULY-AUGUST 2015 ECONOMIC INDICATORS

2012 2013 2014 2015-2
-1
0
1
2
3
4
-2
-1
0
1
2
3
4%%
UNITED STATES
EURO AREA
JAPAN
CONSUMER PRICES Annual percentage changes
2012 2013 2014 2015-2
-1
0
1
2
3
4
-2
-1
0
1
2
3
4%%
SPAIN
GERMANY
FRANCE
ITALY
UNITED KINGDOM
CONSUMER PRICES Annual percentage changes
. Series depicted in chart.
1 2 . 3
. 4 . 5
. 6 . 7
. 8 . 9
. 10
2.3. INTERNATIONAL COMPARISON. CONSUMER PRICES (a)
Sources: OECD, INE and Eurostat.
Note: The underlying series for this indicator are in Tables 26.11 and 26.15 of the BE Boletín Estadístico.
a. Harmonised Index of Consumer Prices for the EU countries.
___________________________________________________________________________________________________________________________
Annual percentage changes
OECD European Euro Germany Spain United France Italy Japan United Union area States Kingdom
12 2.3 2.6 2.5 2.1 2.4 2.1 2.2 3.3 -0.0 2.8 13 1.6 1.5 1.4 1.6 1.5 1.5 1.0 1.3 0.4 2.6 14 1.7 0.6 0.4 0.8 -0.2 1.6 0.6 0.2 2.7 1.5
13 Dec 1.6 1.0 0.8 1.2 0.3 1.5 0.8 0.7 1.6 2.0
14 Jan 1.6 0.9 0.8 1.2 0.3 1.6 0.8 0.6 1.4 1.8 Feb 1.4 0.8 0.7 1.0 0.1 1.1 1.1 0.4 1.5 1.8 Mar 1.6 0.6 0.5 0.9 -0.2 1.6 0.7 0.3 1.6 1.7 Apr 2.0 0.8 0.7 1.1 0.3 2.0 0.8 0.5 3.4 1.7 May 2.1 0.6 0.5 0.6 0.2 2.2 0.8 0.4 3.7 1.5 Jun 2.1 0.7 0.5 1.0 0.0 2.1 0.6 0.2 3.6 1.9 Jul 2.0 0.5 0.4 0.8 -0.4 2.1 0.6 - 3.4 1.6 Aug 1.8 0.5 0.4 0.8 -0.5 1.7 0.5 -0.2 3.3 1.5 Sep 1.7 0.4 0.3 0.8 -0.3 1.7 0.4 -0.1 3.3 1.3 Oct 1.8 0.5 0.4 0.7 -0.2 1.7 0.5 0.2 2.9 1.3 Nov 1.5 0.3 0.3 0.5 -0.5 1.3 0.4 0.3 2.4 0.9 Dec 1.1 -0.1 -0.2 0.1 -1.1 0.7 0.1 -0.1 2.4 0.5
15 Jan 0.6 -0.5 -0.6 -0.5 -1.5 -0.1 -0.4 -0.5 2.4 0.3 Feb 0.6 -0.3 -0.3 - -1.2 -0.1 -0.3 0.1 2.2 - Mar 0.6 -0.1 -0.1 0.2 -0.8 -0.1 -0.0 - 2.3 -0.1 Apr 0.5 - 0.0 0.3 -0.7 -0.2 0.1 -0.1 0.6 -0.1 May ... ... 0.3 ... -0.3 ... ... 0.2 ... ...
BANCO DE ESPAÑA 10* ECONOMIC BULLETIN, JULY-AUGUST 2015 ECONOMIC INDICATORS

2012 2013 2014 20150.6
0.7
0.8
0.9
1.0
1.1
1.2
1.3
1.4
1.5
0.6
0.7
0.8
0.9
1.0
1.1
1.2
1.3
1.4
1.5
US DOLLAR PER ECU-EURO
JAPANESE YEN PER US DOLLAR/100
JAPANESE YEN PER ECU-EURO/100
EXCHANGE RATES
2012 2013 2014 201550
60
70
80
90
100
110
50
60
70
80
90
100
110IndicesIndices
EURO
US DOLLAR
JAPANESE YEN
INDICES OF THE REAL EFFECTIVE EXCHANGE RATE BASED ON CONSUMER PRICES VIS-À-VIS THE DEVELOPED COUNTRIES
. Series depicted in chart.
. 1 . 2
. 3 4 5 6 . 7
. 8 . 9 10 11 12
2.4. BILATERAL EXCHANGE RATES AND NOMINAL AND REAL EFFECTIVE EXCHANGE RATE INDICES FOR THE EURO, US DOLLAR AND JAPANESE YEN
Sources: ECB and BE.
a. Geometric mean calculated using a double weighting system based on (1995-1997),(1998-2000), (2001-2003), (2004-2006) and (2007-2009) manufacturing trade of changes in
the
spot price of each currency against the currencies of the other developed countries. A fall in the index denotes a depreciation of the currency against those of
the other developed countries.
b. Obtained by multiplying the relative prices of each area/country (relation betwen its price index and the price index of the group) by the nominal effective exchange rate.
A decline in the index denotes a depreciation of the real effective exchange rate and, may be interpreted as an improvement in that area/country’s competitiveness.___________________________________________________________________________________________________________________________
Average of daily data Indices of the nominal effective Indices of the real effective exchange rate
Exchange rates exchange rate vis-à-vis the (a) vis-à-vis the developed countries (b) developed countries 1999 QI=100 1999 QI=100
Based on consumer prices Based on producer prices
US dollar Japanese yen Japanese yen Euro US dollar Japanese per per per yen
ECU/euro ECU/euro US dollar Euro US dollar Japanese Euro US dollar Japanese yen yen
12 1.2854 102.61 79.81 97.9 76.8 131.7 95.8 85.8 93.9 93.1 94.7 88.7 13 1.3281 129.69 97.64 101.7 79.5 106.8 99.2 89.2 75.3 96.6 98.2 72.1 14 1.3286 140.38 105.87 102.3 82.3 98.8 98.9 92.5 70.8 96.5 101.4 68.3
14 J-M 1.3728 140.75 102.53 104.1 80.4 100.2 100.9 90.5 71.3 98.1 99.3 68.6 15 J-M 1.1146 133.25 119.57 92.8 94.2 95.2 89.5 105.0 68.9 88.9 110.8 66.4
14 Mar 1.3823 141.48 102.35 104.7 80.3 100.1 101.6 90.5 70.5 98.7 99.4 67.8 Apr 1.3813 141.62 102.53 104.6 80.1 99.8 101.3 90.0 71.6 98.6 99.3 69.2 May 1.3732 139.74 101.76 103.9 79.9 100.7 100.4 90.0 72.4 98.0 99.1 69.9 Jun 1.3592 138.72 102.06 103.1 80.2 100.8 99.6 90.4 72.3 97.2 99.3 70.0 Jul 1.3539 137.72 101.72 102.7 80.0 101.2 99.1 90.4 72.8 96.8 99.2 70.5 Aug 1.3316 137.11 102.97 102.0 81.3 101.0 98.5 91.7 72.8 96.1 100.9 70.2 Sep 1.2901 138.39 107.28 100.5 83.4 98.5 97.0 93.9 71.1 94.8 103.3 68.6 Oct 1.2673 136.85 107.99 99.6 84.8 98.9 96.1 95.2 71.3 94.1 104.3 68.9 Nov 1.2472 145.03 116.28 99.6 87.0 92.7 96.1 97.5 66.9 94.2 106.1 64.8 Dec 1.2331 147.06 119.26 99.7 88.4 91.2 96.0 98.7 65.9 94.3 106.8 64.0
15 Jan 1.1621 137.47 118.28 95.9 91.8 94.5 92.4 102.8 68.8 91.1 108.6 66.1 Feb 1.1350 134.69 118.67 94.0 93.7 95.2 90.7 104.7 68.8 89.9 110.1 66.4 Mar 1.0838 130.41 120.34 91.4 96.2 96.0 88.2 107.4 69.1 87.5 113.6 66.7 Apr 1.0779 128.94 119.62 90.5 95.7 96.6 87.3 ... ... 87.0 ... ... May 1.1150 134.75 120.87 92.3 93.8 93.9 89.0 ... ... 88.9 ... ...
BANCO DE ESPAÑA 11* ECONOMIC BULLETIN, JULY-AUGUST 2015 ECONOMIC INDICATORS
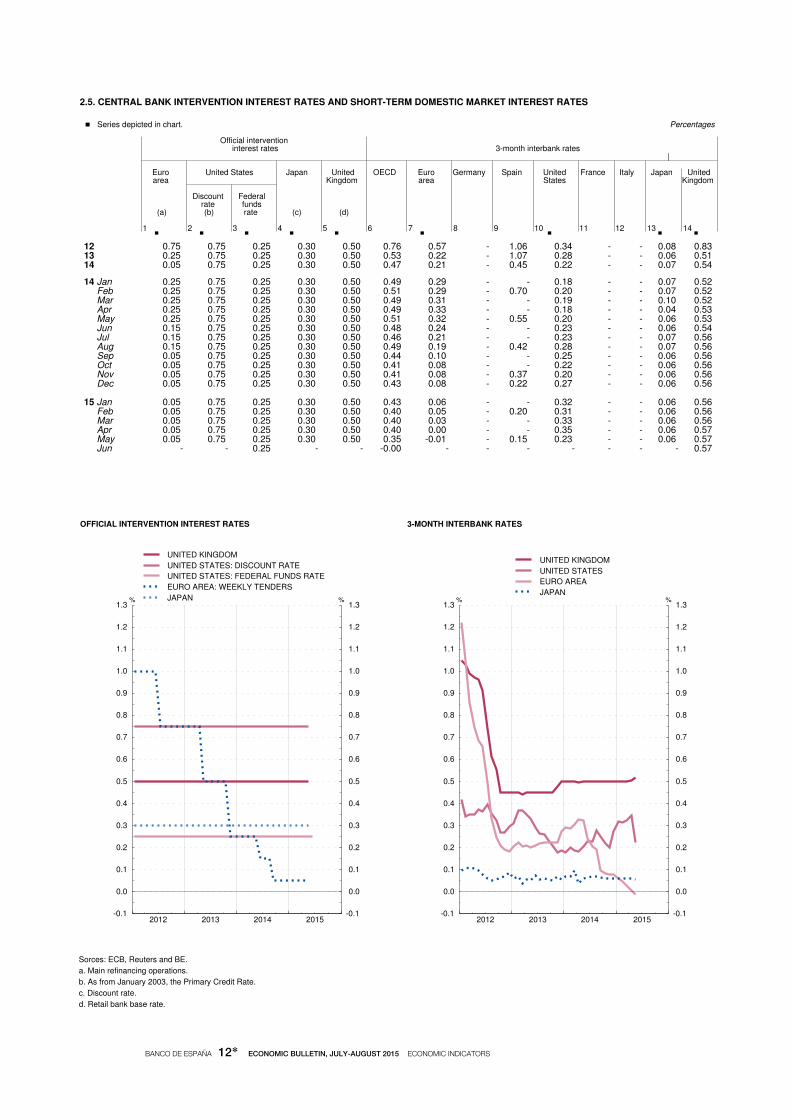
2012 2013 2014 2015-0.1
0.0
0.1
0.2
0.3
0.4
0.5
0.6
0.7
0.8
0.9
1.0
1.1
1.2
1.3
-0.1
0.0
0.1
0.2
0.3
0.4
0.5
0.6
0.7
0.8
0.9
1.0
1.1
1.2
1.3%%
UNITED KINGDOM
UNITED STATES: DISCOUNT RATE
UNITED STATES: FEDERAL FUNDS RATE
EURO AREA: WEEKLY TENDERS
JAPAN
OFFICIAL INTERVENTION INTEREST RATES
2012 2013 2014 2015-0.1
0.0
0.1
0.2
0.3
0.4
0.5
0.6
0.7
0.8
0.9
1.0
1.1
1.2
1.3
-0.1
0.0
0.1
0.2
0.3
0.4
0.5
0.6
0.7
0.8
0.9
1.0
1.1
1.2
1.3%%
UNITED KINGDOM
UNITED STATES
EURO AREA
JAPAN
3-MONTH INTERBANK RATES
. Series depicted in chart.
. 1 . 2
. 3 . 4
. 5 6 . 7 8 9
. 10 11 12 . 13
. 14
2.5. CENTRAL BANK INTERVENTION INTEREST RATES AND SHORT-TERM DOMESTIC MARKET INTEREST RATES
___________________________________________________________________________________________________________________________
Percentages
Official intervention interest rates 3-month interbank rates
|
Euro United States Japan United OECD Euro Germany Spain United France Italy Japan United area Kingdom area States Kingdom Discount Federal rate funds (a) (b) rate (c) (d)
12 0.75 0.75 0.25 0.30 0.50 0.76 0.57 - 1.06 0.34 - - 0.08 0.83 13 0.25 0.75 0.25 0.30 0.50 0.53 0.22 - 1.07 0.28 - - 0.06 0.51 14 0.05 0.75 0.25 0.30 0.50 0.47 0.21 - 0.45 0.22 - - 0.07 0.54
Sorces: ECB, Reuters and BE.
a. Main refinancing operations.
b. As from January 2003, the Primary Credit Rate.
c. Discount rate.
d. Retail bank base rate.
14 Jan 0.25 0.75 0.25 0.30 0.50 0.49 0.29 - - 0.18 - - 0.07 0.52 Feb 0.25 0.75 0.25 0.30 0.50 0.51 0.29 - 0.70 0.20 - - 0.07 0.52 Mar 0.25 0.75 0.25 0.30 0.50 0.49 0.31 - - 0.19 - - 0.10 0.52 Apr 0.25 0.75 0.25 0.30 0.50 0.49 0.33 - - 0.18 - - 0.04 0.53 May 0.25 0.75 0.25 0.30 0.50 0.51 0.32 - 0.55 0.20 - - 0.06 0.53 Jun 0.15 0.75 0.25 0.30 0.50 0.48 0.24 - - 0.23 - - 0.06 0.54 Jul 0.15 0.75 0.25 0.30 0.50 0.46 0.21 - - 0.23 - - 0.07 0.56 Aug 0.15 0.75 0.25 0.30 0.50 0.49 0.19 - 0.42 0.28 - - 0.07 0.56 Sep 0.05 0.75 0.25 0.30 0.50 0.44 0.10 - - 0.25 - - 0.06 0.56 Oct 0.05 0.75 0.25 0.30 0.50 0.41 0.08 - - 0.22 - - 0.06 0.56 Nov 0.05 0.75 0.25 0.30 0.50 0.41 0.08 - 0.37 0.20 - - 0.06 0.56 Dec 0.05 0.75 0.25 0.30 0.50 0.43 0.08 - 0.22 0.27 - - 0.06 0.56
15 Jan 0.05 0.75 0.25 0.30 0.50 0.43 0.06 - - 0.32 - - 0.06 0.56 Feb 0.05 0.75 0.25 0.30 0.50 0.40 0.05 - 0.20 0.31 - - 0.06 0.56 Mar 0.05 0.75 0.25 0.30 0.50 0.40 0.03 - - 0.33 - - 0.06 0.56 Apr 0.05 0.75 0.25 0.30 0.50 0.40 0.00 - - 0.35 - - 0.06 0.57 May 0.05 0.75 0.25 0.30 0.50 0.35 -0.01 - 0.15 0.23 - - 0.06 0.57 Jun - - 0.25 - - -0.00 - - - - - - - 0.57
BANCO DE ESPAÑA 12* ECONOMIC BULLETIN, JULY-AUGUST 2015 ECONOMIC INDICATORS

2012 2013 2014 20150
1
2
3
4
5
6
7
0
1
2
3
4
5
6
7%%
UNITED STATES
EURO AREA
JAPAN
10-YEAR GOVERNMENT BOND YIELDS
2012 2013 2014 20150
1
2
3
4
5
6
7
0
1
2
3
4
5
6
7%%
SPAIN
UNITED KINGDOM
GERMANY
ITALY
FRANCE
10-YEAR GOVERNMENT BOND YIELDS
. Series depicted in chart.
1 2 . 3
. 4 . 5
. 6 . 7
. 8 . 9
. 10
2.6. 10-YEAR GOVERNMENT BOND YIELDS ON DOMESTIC MARKETS
Sources: ECB, Reuters and BE.
___________________________________________________________________________________________________________________________
Percentages
OECD European Euro Germany Spain United France Italy Japan United Union area States Kingdom
12 2.35 3.36 3.05 1.49 5.85 1.80 2.53 5.49 0.86 1.74 13 2.44 2.79 3.01 1.57 4.56 2.35 2.20 4.31 0.72 2.03 14 2.26 2.11 2.28 1.16 2.72 2.55 1.66 2.89 0.55 2.14
13 Dec 2.75 2.91 3.31 1.80 4.14 2.90 2.33 4.11 0.67 2.50
14 Jan 2.72 2.81 3.21 1.76 3.78 2.88 2.38 3.87 0.67 2.48 Feb 2.58 2.66 3.09 1.56 3.56 2.72 2.25 3.65 0.60 2.37 Mar 2.54 2.54 2.89 1.51 3.31 2.74 2.15 3.40 0.62 2.34 Apr 2.48 2.42 2.61 1.46 3.10 2.72 2.03 3.23 0.62 2.30 May 2.35 2.28 2.55 1.33 2.93 2.58 1.84 3.12 0.60 2.27 Jun 2.31 2.17 2.28 1.26 2.71 2.60 1.71 2.92 0.59 2.35 Jul 2.23 2.07 2.16 1.11 2.67 2.55 1.56 2.79 0.54 2.31 Aug 2.11 1.90 1.99 0.95 2.42 2.43 1.41 2.63 0.51 2.12 Sep 2.13 1.81 1.85 0.92 2.20 2.54 1.35 2.40 0.54 2.08 Oct 1.97 1.70 1.69 0.79 2.11 2.30 1.26 2.42 0.49 1.82 Nov 1.95 1.61 1.62 0.72 2.07 2.34 1.14 2.29 0.47 1.72 Dec 1.80 1.41 1.45 0.59 1.79 2.21 0.92 1.99 0.39 1.52
15 Jan 1.56 1.18 1.27 0.39 1.54 1.90 0.67 1.70 0.27 1.21 Feb 1.56 1.12 1.21 0.30 1.51 1.97 0.60 1.56 0.38 1.59 Mar 1.57 1.03 0.96 0.23 1.23 2.04 0.51 1.29 0.38 1.59 Apr 1.49 1.00 0.85 0.12 1.31 1.93 0.44 1.36 0.33 1.65 May 1.80 1.41 1.34 0.56 1.77 2.21 0.89 1.81 0.41 1.94
BANCO DE ESPAÑA 13* ECONOMIC BULLETIN, JULY-AUGUST 2015 ECONOMIC INDICATORS

2010 2011 2012 2013 2014 2015120
130
140
150
160
170
180
190
200
210
220
230
240
120
130
140
150
160
170
180
190
200
210
220
230
240IndicesIndices
IN US DOLLARS
IN EUROS
NON-ENERGY COMMODITY PRICE INDEX
2010 2011 2012 2013 2014 20150
100
200
300
400
500
600
700
0
100
200
300
400
500
600
700IndicesIndices
FOOD
INDUSTRIAL PRODUCTS
OIL
GOLD
PRICE INDICES FOR NON-ENERGY COMMODITIES, OIL AND GOLD
. Series depicted in chart.
. 1 . 2
. 3 . 4 5 6
. 7 8 . 9 10 11
2.7 INTERNATIONAL MARKETS. NON-ENERGY COMMODITIES PRICE INDEX. CRUDE OIL AND GOLD PRICE.
Sources: The Economist, IMF, ECB and BE.
a. The weights are based on the value of the world commodity imports during the period 1999-2001.
b. Index of the average price in US dollars of various medium, light and heavy crudes.
c. Index of the London market’s 15.30 fixing in dollars.
___________________________________________________________________________________________________________________________
Base 2000 = 100
Non-energy commodity price index (a) Oil Gold
Euro index US dollar index Brent North sea US dollars Euro Industrial products Index Index per per (b) US (c) troy gram
General General Food dollars ounce Total Non-food Metals per agricul- barrel tural products
10 158.6 213.1 207.9 220.2 211.2 225.9 280.0 79.9 439.2 1 225.3 29.76 11 187.3 209.6 220.3 198.5 239.6 180.9 368.4 112.2 562.6 1 569.5 36.29 12 183.8 189.6 217.0 161.1 171.7 156.6 371.8 112.4 598.0 1 668.3 41.73 13 161.1 172.8 194.2 150.2 161.2 145.5 368.6 109.6 505.4 1 409.8 34.16 14 154.8 164.8 185.6 143.1 141.6 143.7 340.6 99.3 453.9 1 266.1 30.64
14 J-M 155.1 171.2 197.0 144.3 152.0 141.1 369.6 109.2 463.7 1 293.6 30.29 15 J-M 162.3 143.0 159.5 125.8 120.9 127.9 ... 57.0 433.9 1 210.5 34.93
14 Apr 159.7 177.5 208.4 145.4 153.0 142.1 371.7 108.1 465.9 1 299.7 30.24 May 158.2 173.3 199.6 145.9 146.9 145.5 374.5 110.2 461.5 1 287.5 30.17 Jun 155.8 170.3 193.0 146.8 150.1 145.3 383.8 112.1 458.5 1 279.1 30.25 Jul 154.0 166.1 182.8 148.8 142.5 151.5 372.7 106.7 470.1 1 311.4 31.14 Aug 153.8 163.3 177.9 148.2 135.8 153.8 354.4 101.5 464.6 1 296.0 31.26 Sep 150.2 152.6 165.6 139.1 128.4 143.6 339.6 97.0 444.1 1 238.8 30.86 Oct 153.5 157.4 173.8 140.2 130.6 144.4 305.0 87.5 438.2 1 222.5 31.02 Nov 158.0 158.7 176.4 140.2 125.7 146.4 272.6 79.1 421.3 1 175.4 30.32 Dec 156.7 153.3 173.7 132.1 126.8 134.3 214.5 63.2 431.0 1 202.3 31.31
15 Jan 158.0 144.9 164.8 124.1 118.7 126.4 168.1 47.7 448.0 1 249.7 34.66 Feb 158.8 144.8 164.0 124.8 121.0 126.4 194.6 58.0 439.9 1 227.2 34.76 Mar 163.7 141.4 157.2 124.9 118.6 127.7 187.1 56.4 422.5 1 178.6 35.01 Apr 169.9 143.1 156.9 128.8 121.5 131.9 203.4 59.4 429.2 1 197.3 35.69 May 160.9 141.0 155.0 126.5 124.8 127.2 ... 63.7 430.4 1 200.7 34.53
BANCO DE ESPAÑA 14* ECONOMIC BULLETIN, JULY-AUGUST 2015 ECONOMIC INDICATORS

2011 2012 2013 2014 2015-50.0
-44.5
-39.0
-33.5
-28.0
-22.5
-17.0
-11.5
-6.0
-0.5
5.0
-50.0
-44.5
-39.0
-33.5
-28.0
-22.5
-17.0
-11.5
-6.0
-0.5
5.0%%
SPAIN
EURO AREA
CONSUMER CONFIDENCE INDICATOR Percentage balances,seasonally adjusted
2011 2012 2013 2014 2015-50
-40
-30
-20
-10
0
10
20
30
40
50
-50
-40
-30
-20
-10
0
10
20
30
40
50%%
ESTIMATED SALES (SPAIN)
CAR SALES (Trend obtained with TRAMO-SEATS)
. Series depicted in chart.
. 1 2 3 4 . 5 6 7
. 8 9 10 11 12 13 14 15 16 17
3.1 INDICATORS OF PRIVATE CONSUMPTION. SPAIN AND EURO AREA
___________________________________________________________________________________________________________________________
Percentage balances, annual percentage changes and indices
Opinion surveys (a) New car registrations and sales Retail trade indices (2010=100, NACE 2009) (Percentage balances seasonally adjusted) (Annual percentage changes) (Deflacted indices)
Consumers Retail Memorandum Registra- Estimated Memoran- General General index without petrol stations trade item: tions sales dum item: retail confi- euro area euro area trade
dence registra- index of which Large Large Small Single- Memoran- indi- tions retail chain chain outlet dum item:
Confi- General House- cator Consu- Retail Total outlets stores stores retail- euro area dence economic hold mer trade Food ers (Annual indi- situation: economic confi- confi- percen- cator anticipa- situation: dence dence tage ted anticipa- indi- indi- changes, trend ted cator cator adjusted trend by working days)
12 -31.6 -30.7 -18.0 -21.4 -22.3 -15.2 -13.1 -13.4 -11.2 87.6 88.0 94.4 84.6 97.1 84.9 84.3 -1.3 13 -25.3 -19.3 -12.1 -10.1 -18.7 -12.5 4.5 3.3 -3.8 84.2 84.6 91.5 80.9 96.7 80.8 79.7 -0.8 14 -9.7 4.2 -1.4 6.7 -10.0 -3.5 18.4 18.3 3.7 84.9 85.3 92.2 81.9 97.2 81.9 79.7 1.4
14 J-M -12.0 3.5 -2.8 5.9 -9.9 -2.7 16.7 16.3 3.3 81.2 81.5 87.9 76.2 92.2 78.2 77.4 1.1 15 J-M 0.7 15.6 5.0 14.0 -5.8 -0.8 23.4 21.7 ... ... ... ... ... ... ... ... ...
Sources: European Commission (European Economy, Supplement B), INE, DGT, ANFAC and ECB.
a. Additional information available at http://ec.europa.eu/economy_finance/db_indicators/surveys/index_en.htm
14 Jun -3.9 5.6 1.4 6.0 -7.5 -1.1 24.2 23.9 3.3 83.3 83.6 90.8 76.2 93.5 81.4 80.3 2.2 Jul -7.7 3.6 -0.5 6.0 -8.3 -1.3 4.2 10.9 5.7 92.9 93.7 97.5 91.0 106.1 92.8 86.7 0.7 Aug -6.4 9.5 1.0 9.0 -10.1 -3.7 15.4 14.1 4.1 83.7 83.6 95.0 82.0 100.3 82.0 73.8 1.7 Sep -9.6 5.6 -0.2 6.9 -11.4 -6.6 27.0 26.2 2.5 83.2 83.6 91.3 77.7 95.5 79.4 79.2 0.3 Oct -10.0 3.7 0.1 6.3 -11.1 -5.5 27.8 26.1 4.4 85.3 85.4 93.7 75.6 99.1 81.9 81.4 1.5 Nov -11.8 -1.3 -4.2 6.9 -11.6 -5.2 18.9 17.4 0.3 81.9 82.0 88.2 80.5 93.4 76.7 76.7 1.5 Dec -7.1 5.8 - 10.0 -10.9 -4.6 23.1 21.4 -0.0 102.8 104.1 110.2 119.4 117.5 97.3 91.1 3.2
15 Jan -1.4 11.6 4.1 10.5 -8.5 -2.7 32.8 27.5 11.0 90.4 90.6 88.0 97.0 102.7 87.0 81.4 2.8 Feb -2.1 14.4 2.7 12.9 -6.7 -1.3 26.9 26.1 8.1 75.9 75.5 80.8 69.1 84.8 71.7 74.1 2.8 Mar 1.7 16.1 5.5 14.5 -3.7 -0.8 41.5 40.5 8.2 83.3 83.1 90.3 74.3 95.5 77.9 81.4 1.9 Apr 3.6 18.4 7.0 16.0 -4.6 -0.8 4.8 3.2 6.5 83.2 83.0 90.4 75.2 95.5 79.7 80.0 ... May 1.6 17.6 5.7 15.9 -5.5 1.4 15.2 14.0 ... ... ... ... ... ... ... ... ...
BANCO DE ESPAÑA 15* ECONOMIC BULLETIN, JULY-AUGUST 2015 ECONOMIC INDICATORS

2009 2010 2011 2012 2013 2014 2015-40
-30
-20
-10
0
10
20
30
40
-40
-30
-20
-10
0
10
20
30
40%%
1st FORECAST
2nd FORECAST
3rd FORECAST
ACTUAL INV.
INVESTMENT IN INDUSTRY Annual rates of change
. Series depicted in chart.
. 1 . 2
. 3 . 4
3.2. INVESTMENT IN INDUSTRY (EXCLUDING CONSTRUCTION): OPINION SURVEYS. SPAIN
Source: Ministerio de Industria, Energía y Turismo.
Note: The first forecast is made in the autumn of the previous year and the second and third ones in the spring and autumn of the current year, respectively; the information relating
to actual investment for the year t is obtained in the spring of the year t+1.
___________________________________________________________________________________________________________________________
Annual percentage changes at current prices
ACTUAL INV. 1st FORECAST 2nd FORECAST 3rd FORECAST
09 -28 -4 -35 -27 10 -14 -37 -23 -26 11 11 11 26 11 12 6 15 28 -4 13 2 27 32 7 14 ... 30 6 6 15 ... 7 ... ...
BANCO DE ESPAÑA 16* ECONOMIC BULLETIN, JULY-AUGUST 2015 ECONOMIC INDICATORS

2012 2013 2014 2015-60
-51
-42
-33
-24
-15
-6
3
12
21
30
-60
-51
-42
-33
-24
-15
-6
3
12
21
30%%
PERMITS
APPROVALS
CONSTRUCTION Trend obtained with TRAMO-SEATS
2012 2013 2014 2015-60
-51
-42
-33
-24
-15
-6
3
12
21
30
-60
-51
-42
-33
-24
-15
-6
3
12
21
30%%
APPARENT CONSUMPTION OF CEMENT
CONSTRUCTION Trend obtained with TRAMO-SEATS
P
. Series depicted in chart.
. 1 2 3 4 . 5 6
. 7 8 9 10 11 12 13 . 14
3.3. CONSTRUCTION. INDICATORS OF BUILDING STARTS AND CONSUMPTION OF CEMENT. SPAIN
___________________________________________________________________________________________________________________________
Annual percentage changes
Permits: buildable floorage Approvals: Government tenders (budget) buildable floorage
of which of which Total Building Apparent consumption of cement Non- of which Civil
Total Residential residential Total Non- engineering Housing Housing For the Year to Total Residential residential month date Housing
12 -19.6 -24.0 -23.3 -10.0 -37.2 -39.9 -45.6 -45.6 -48.7 -68.4 -62.4 -43.8 -44.1 -33.5 13 -27.2 -43.3 -46.6 2.0 -18.2 -20.3 17.3 17.3 -2.8 41.5 55.6 -9.1 25.8 -21.0 14 -8.9 5.8 12.4 -23.7 -1.7 2.2 32.8 32.8 24.6 31.6 9.6 23.0 35.5 -0.0
P P
14 J-A -4.9 -0.0 2.2 -10.7 -10.2 -7.4 87.7 87.7 18.9 40.3 19.7 14.9 115.2 -5.1 15 J-A ... ... ... ... ... ... ... ... ... ... ... ... ... 9.7
P P P P P P P P P P P P
P P P P
Sources: Ministerio de Fomento and Asociación de Fabricantes de Cemento de España.
Note: The underlying series for this indicator are in Tables 23.7, 23.8, and 23.9 of the BE Boletín estadístico.
14 Jan -7.1 21.4 20.0 -41.3 -5.6 -17.9 166.4 166.4 20.3 40.2 88.6 15.8 220.5 -16.2 Feb -39.3 -38.7 -36.9 -40.3 -41.1 -36.8 47.8 96.0 -4.8 -65.1 -90.1 24.0 59.1 -10.9 Mar 2.4 19.2 23.3 -21.3 11.3 32.7 99.0 97.0 28.3 299.6 277.8 -2.1 131.7 15.8 Apr 34.5 16.8 20.6 49.1 12.2 11.9 55.1 87.7 23.7 5.8 38.5 25.7 77.1 -6.7 May 8.8 30.4 39.5 -17.3 2.1 12.8 129.2 95.9 50.4 -53.2 -94.4 104.0 167.4 -2.9 Jun -2.2 -1.4 42.6 -3.6 -9.5 8.9 3.8 79.8 58.0 -2.5 31.8 81.9 -9.3 -2.0 Jul -10.5 -11.5 -13.9 -9.3 30.3 17.4 29.0 68.0 109.7 579.4 1 743.6 52.9 11.5 5.0 Aug -57.6 -5.4 -7.9 -73.5 24.4 23.3 -17.9 52.0 20.0 46.3 700.3 16.6 -26.6 -3.2 Sep 15.0 -7.3 2.0 49.4 25.5 26.5 23.7 49.4 -29.5 14.8 -63.3 -33.6 56.0 6.1 Oct -6.8 1.9 11.3 -18.8 -4.0 13.8 60.7 50.7 15.0 111.8 -54.9 10.0 77.0 4.2 Nov 35.8 43.4 45.4 24.5 -19.5 -7.8 -10.1 43.8 62.0 32.9 -11.5 70.2 -29.5 1.0 Dec -22.1 27.4 28.2 -48.9 -18.7 -30.5 -25.1 32.8 -17.5 -32.9 -84.7 -10.8 -27.3 12.5
15 Jan ... ... ... ... 25.8 31.9 -48.3 -48.3 -2.5 -43.2 -43.8 8.7 -54.7 5.4 Feb ... ... ... ... 68.3 53.9 -43.8 -46.3 64.2 113.1 428.8 57.7 -57.8 7.2 Mar ... ... ... ... 3.7 -5.9 17.0 -24.8 36.2 -50.6 -46.9 75.7 12.1 12.1 Apr ... ... ... ... ... ... ... ... ... ... ... ... ... 13.3
BANCO DE ESPAÑA 17* ECONOMIC BULLETIN, JULY-AUGUST 2015 ECONOMIC INDICATORS

2012 2013 2014 2015-11
-10
-9
-8
-7
-6
-5
-4
-3
-2
-1
0
1
2
3
4
-11
-10
-9
-8
-7
-6
-5
-4
-3
-2
-1
0
1
2
3
4%%
SPAIN
EURO AREA
INDUSTRIAL PRODUCTION INDEX Trend obtained with TRAMO-SEATS
2012 2013 2014 2015-11
-10
-9
-8
-7
-6
-5
-4
-3
-2
-1
0
1
2
3
4
-11
-10
-9
-8
-7
-6
-5
-4
-3
-2
-1
0
1
2
3
4%%
CONSUMPTION GOODS
INVESTMENT GOODS
INTERMEDIATE GOODS
INDUSTRIAL PRODUCTION INDEX Trend obtained with TRAMO-SEATS
M M M
. Series depicted in chart.
1 . 2
. 3 . 4
. 5 6 7 8 9 . 10 11 12 13 14
3.4. INDUSTRIAL PRODUCTION INDEX. SPAIN AND EURO AREA (a)
___________________________________________________________________________________________________________________________
Annual percentage changes
Overall Index By end-use of goods By branch of activity (NACE 2009) Memorandum item: euro area of which By end-use of goods
Total Consumer Capital Inter- Energy Mining Manufac- Electrity goods goods mediate and turing and gas goods quarrying supply Inter-
Original 12-month Total Manufac- Consumer Capital mediate series %change turing goods goods goods 12
12 91.8 -6.4 -4.8 -11.0 -8.9 0.9 -23.6 -7.5 0.1 -2.4 -2.6 -2.5 -1.0 -4.5 13 90.2 -1.7 -2.2 1.2 -2.6 -2.6 -14.3 -1.4 -3.9 -0.7 -0.7 -0.3 -0.6 -1.0 14 91.6 1.5 2.0 1.4 3.2 -1.6 0.0 2.3 -2.4 0.8 1.7 2.6 1.8 1.2
M M P
14 J-A 91.2 2.1 2.2 5.0 2.6 -2.1 2.3 3.1 -3.4 1.4 3.2 5.8 3.4 3.2 15 J-A 92.7 1.7 -0.1 2.2 3.0 1.5 -1.0 1.8 1.9 ... ... ... ... ...
P P P
Sources: INE and BCE.
Note: The underlying series for this indicator are in Table 23.1 of the BE Boletín estadístico.
a. Spain 2010 = 100; euro area 2010 = 100.
14 Jan 89.5 -0.3 1.5 1.3 -0.6 -3.6 -2.4 0.5 -3.1 1.7 3.1 0.6 5.4 3.2 Feb 90.0 2.8 2.6 6.3 3.5 -1.6 -4.3 3.9 -2.3 1.8 3.9 4.0 4.3 3.7 Mar 95.4 8.1 8.8 12.8 10.1 -1.0 23.6 10.3 -4.8 0.4 2.6 2.6 3.0 2.9 Apr 89.8 -2.1 -3.5 -0.2 -2.2 -2.3 -3.6 -2.1 -3.4 1.6 3.1 5.8 1.0 3.2 May 95.7 0.6 0.3 -0.3 0.7 2.0 2.8 0.3 0.0 0.6 1.2 2.4 1.4 0.4 Jun 94.6 2.8 3.9 -0.3 4.1 2.4 -6.1 2.9 1.0 0.3 0.7 2.0 0.3 0.6 Jul 100.7 1.1 2.8 -0.8 3.9 -3.4 -6.8 2.1 -4.7 1.8 2.5 2.2 4.2 1.5 Aug 71.2 -2.4 -3.1 -10.9 3.3 -2.8 -1.5 -2.3 -2.6 -0.6 -0.2 2.4 -2.2 0.1 Sep 96.0 3.6 5.3 3.2 3.8 1.1 2.1 4.1 2.9 0.3 0.8 1.1 1.5 -0.4 Oct 98.4 0.9 1.3 -1.1 3.2 -1.4 -3.3 1.4 -1.1 0.8 1.3 3.1 1.6 -0.5 Nov 91.5 -0.3 -1.0 -1.6 3.3 -3.6 -1.1 0.8 -5.4 -0.5 0.3 3.0 -0.8 -0.7 Dec 86.1 3.1 4.8 5.4 5.4 -3.9 8.8 5.0 -3.8 0.8 1.5 1.6 2.0 0.2
15 Jan 87.5 -2.3 -7.3 -1.0 -2.1 2.9 -10.4 -3.4 4.2 0.7 0.3 0.8 0.2 -0.1 Feb 91.0 1.1 -0.9 3.9 1.8 -0.1 1.9 1.4 1.1 1.9 1.2 2.4 1.2 -0.2 Mar 100.2 5.1 6.1 3.7 6.7 2.4 -2.3 5.6 3.9 1.8 1.7 4.8 0.3 -0.0 Apr 92.2 2.7 1.6 1.8 5.2 0.9 7.1 3.1 -2.2 ... ... ... ... ...
BANCO DE ESPAÑA 18* ECONOMIC BULLETIN, JULY-AUGUST 2015 ECONOMIC INDICATORS

2012 2013 2014 2015-80
-70
-60
-50
-40
-30
-20
-10
0
10
-80
-70
-60
-50
-40
-30
-20
-10
0
10%%
SPAIN (b)
EURO AREA (b)
INDUSTRIAL CONFIDENCE INDICATOR Percentage balances
2012 2013 2014 2015-80
-70
-60
-50
-40
-30
-20
-10
0
10
-80
-70
-60
-50
-40
-30
-20
-10
0
10%%
SPAIN
EURO AREA (b)
CONSTRUCTION CONFIDENCE INDICATOR Percentage balances
M M M
M M
. Series depicted in chart.
. 1 2 3 4 5 6 7 8 9 10 . 11 12 13 14 15
. 16 17 . 18
3.5. MONTHLY BUSINESS SURVEY: INDUSTRY (ECI) AND CONSTRUCTION (ECC). SPAIN AND EURO AREA (NACE 2009)(a)
Sources: Ministerio de Industria, Energía y Turismo and ECB.
a.The ECI methodology is available at http://www.minetur.gob.es/es-ES/IndicadoresyEstadisticas/Industria/EncuestaCoyuntura/Documents/metodologiaeci.pdf
and the ECC methodology at http://www.minetur.gob.es/es-ES/IndicadoresyEstadisticas/Industria/EncuestaCoyuntura/documents/metodologiaECC.pdf
b. Seasonally adjusted.
c. To April 2010, NACE 1993; from May 2010, NACE 2009.
___________________________________________________________________________________________________________________________
Percentage balances Memorandum item:
Industry,excluding construction (b) Construction euro area (b) (c)
Industrial Components of the indus- Produc- Foreign Industrial confidence indi- Construc- Components of Produc- Produc- Industry, exclu- Construc- confi- trial confidence indicator tion order- cator by sectors tion con- the CCI tion tion ding construction tion con-
dence book findence expec- fidence indica- levels indicator tations indicator tor order- Stocks Produc- Con- Invest Inter- Other (CCI) order- Employ- Indus- Order- book of fi- tion sum- ment me- sec- book ment trial book levels nished expec- ption diate tors levels expecta- confi- levels products tations goods tions dence indica-
=(2-3+4)/3 =(11+12)/2 tor
12 -17 -37 9 -4 -20 -26 -10 -15 -22 -15 -55 -50 -60 -23 -44 -12 -25 -29 13 -14 -31 9 -1 -10 -21 -9 -13 -17 -6 -57 -57 -56 -27 -40 -9 -26 -30 14 -8 -17 9 3 0 -11 -3 -6 -12 -2 -41 -51 -31 -16 -24 -4 -15 -28
14 J-M -10 -20 9 -0 -2 -13 -5 -9 -13 -3 -53 -62 -44 -26 -40 -3 -16 -29 15 J-M -2 -8 5 8 8 -3 -2 3 -3 -3 -27 -37 -18 -7 -16 -4 -12 -25
14 Feb -9 -21 7 2 -5 -13 -6 -11 -9 -5 -57 -57 -58 -31 -54 -3 -16 -28 Mar -10 -22 9 1 3 -17 -8 -9 -13 -2 -51 -61 -42 -35 -26 -3 -17 -28 Apr -10 -19 10 -1 -4 -9 -5 -9 -13 -4 -50 -59 -41 -23 -21 -3 -14 -30 May -9 -18 10 -0 -1 -11 -4 -6 -13 -1 -48 -60 -36 -16 -41 -3 -14 -29 Jun -7 -18 11 7 3 -14 -1 -11 -11 -4 -60 -69 -52 -15 -35 -4 -15 -31 Jul -6 -16 8 6 -4 -9 -3 1 -11 -1 -32 -46 -19 -5 -8 -4 -15 -27 Aug -7 -14 11 4 5 -7 -2 -6 -9 -7 -34 -49 -19 -12 -8 -5 -15 -28 Sep -7 -13 10 3 -1 -10 -1 -7 -11 -0 -21 -35 -6 -11 -6 -5 -15 -27 Oct -7 -13 13 6 1 -7 -2 -1 -15 0 -23 -29 -17 -6 -10 -5 -15 -24 Nov -5 -12 8 5 8 -5 -3 2 -11 - -27 -38 -16 -20 -7 -4 -13 -25 Dec -6 -14 9 5 1 -11 -4 -2 -14 1 -31 -36 -26 4 -13 -5 -14 -24
15 Jan -5 -14 8 8 -1 -12 -2 3 -11 -8 -31 -36 -25 -8 -15 -5 -14 -25 Feb -4 -11 7 7 8 -4 -3 -4 -6 -2 -28 -30 -27 -20 -33 -5 -15 -25 Mar -1 -7 4 8 10 2 0 2 -3 -1 -20 -37 -3 -9 2 -3 -11 -24 Apr - -3 3 7 15 -2 -4 7 1 -5 -29 -43 -15 -1 -23 -3 -11 -26 May 1 -2 5 11 9 -1 -4 8 3 -0 -29 -40 -18 0 -14 -3 -11 -25
BANCO DE ESPAÑA 19* ECONOMIC BULLETIN, JULY-AUGUST 2015 ECONOMIC INDICATORS

2012 2013 2014 201560
64
68
72
76
80
84
88
92
96
100
60
64
68
72
76
80
84
88
92
96
100%%
TOTAL INDUSTRY (SPAIN)
TOTAL INDUSTRY (EURO AREA)
CAPACITY UTILISATION. TOTAL INDUSTRY Percentages
2012 2013 2014 201560
64
68
72
76
80
84
88
92
96
100
60
64
68
72
76
80
84
88
92
96
100%%
INVESTMENT GOODS
CONSUMPTION GOODS
INTERMEDIATE GOODS
OTHER SECTORS
CAPACITY UTILISATION. BY TYPE OF GOOD Percentages
. Series depicted in chart.
. 1 2 3 . 4 5 6
. 7 8 9 . 10 11 12
. 13 14 15 . 16
3.6. BUSINESS SURVEY (ECI): CAPACITY UTILISATION. SPAIN AND EURO AREA (NACE 2009) (a)
___________________________________________________________________________________________________________________________
Percentages and percentage balances
Total industry Consumer goods Investment goods Intermediate goods Other sectors (b) Memorandum item: euro area
% of productive Installed % of productive Installed % of productive Installed % of productive Installed % of productive Installed euro. capacity productive capacity productive capacity productive capacity productive capacity productive % of pro- utilisation capacity utilisation capacity utilisation capacity utilisation capacity utilisation capacity ductive (Percen- (Percen- (Percen- (Percen- (Percen- capacity
tage tage tage tage tage utilisation balances) balances) balances) balances) balances) (c)
Level Expec- Level Expec- Level Expec- Level Expec- Level Expec- ted ted ted ted ted trend trend trend trend trend
12 72.9 73.5 21 70.2 71.0 16 75.3 75.7 16 71.8 72.1 30 90.0 93.3 3 78.9 13 72.5 73.2 21 68.4 69.7 17 75.0 75.6 11 72.0 72.5 31 91.7 91.9 0 78.1 14 75.9 76.6 17 73.1 73.9 13 77.4 77.8 11 76.0 76.3 25 87.3 92.3 1 80.1
14 Q1-Q2 75.5 76.5 19 72.8 72.8 15 76.9 78.1 11 75.4 76.5 28 88.7 92.4 2 80.1 15 Q1-Q2 77.3 78.7 14 73.2 74.3 11 80.9 81.6 12 76.8 79.3 19 90.5 88.3 1 81.1
Sources: Ministerio de Industria, Energía y Turismo and ECB.
a. The ECI methodology is available at http://www.minetur.gob.es/es-ES/IndicadoresyEstadisticas/Industria/EncuestaCoyuntura/Documents/metodologiaeci.pdf
b. Includes mining and quarrying, manufacture of coke and refined petroleum products, and nuclear fuels.
c. To April 2010, NACE 1993; from May 2010, NACE 2009.
12 Q4 74.3 74.1 20 70.9 71.7 13 78.2 77.8 14 72.4 71.6 30 96.9 96.9 1 77.2
13 Q1 69.4 70.6 24 66.4 67.0 15 69.0 71.2 18 69.4 70.5 34 92.6 92.5 - 77.6 Q2 73.1 74.4 21 68.6 70.9 18 77.9 78.9 11 71.5 72.6 29 93.5 93.2 1 77.5 Q3 73.9 73.7 20 69.3 69.5 18 77.6 77.1 5 73.1 72.9 30 92.7 92.9 1 78.5 Q4 73.6 74.2 20 69.2 71.5 16 75.6 75.2 10 74.0 74.1 29 87.9 89.0 0 78.6
14 Q1 75.6 75.7 20 72.9 70.6 16 76.2 77.7 10 75.9 76.5 30 88.5 92.5 1 80.3 Q2 75.4 77.2 19 72.6 75.0 15 77.6 78.5 12 74.9 76.5 27 88.8 92.3 2 79.8 Q3 75.8 76.2 16 72.8 74.8 15 77.5 78.3 10 76.0 74.8 20 86.0 90.6 1 80.0 Q4 76.9 77.1 15 74.2 75.0 8 78.4 76.5 12 77.0 77.2 23 86.0 93.7 0 80.3
15 Q1 76.8 78.1 14 71.8 73.2 10 80.8 81.6 11 76.5 78.7 18 91.1 86.9 0 81.0 Q2 77.7 79.3 15 74.5 75.3 11 81.0 81.5 12 77.0 79.8 20 89.8 89.7 3 81.2
BANCO DE ESPAÑA 20* ECONOMIC BULLETIN, JULY-AUGUST 2015 ECONOMIC INDICATORS

2011 2012 2013 2014 2015-12
-10
-8
-6
-4
-2
0
2
4
6
8
10
-12
-10
-8
-6
-4
-2
0
2
4
6
8
10%%
OVERNIGHT STAYS
VISITORS ENTERING SPAIN
TOURISM Trend obtained with TRAMO-SEATS
2011 2012 2013 2014 2015-12
-10
-8
-6
-4
-2
0
2
4
6
8
10
-12
-10
-8
-6
-4
-2
0
2
4
6
8
10%%
AIR TRANSPORT
RAIL TRANSPORT
TRANSPORT Trend obtained with TRAMO-SEATS
P
. Series depicted in chart.
1 2 . 3 4
. 5 6 7 . 8 9 10 11 12 13
. 14 15
3.7. TOURISM AND TRANSPORT STATISTICS. SPAIN
___________________________________________________________________________________________________________________________
Annual percentage changes
Hotel stays (a) Overnight stays Visitors entering Spain Air transport Maritime transport Rail transport Passengers
Total Foreig- Total Foreig- Total Tourists Day-trip- ners ners pers Interna- Freight Passen- Freight Passen- Freight Total Domestic tional gers gers flights flights
12 -0.0 0.0 -0.0 0.0 -1.1 2.3 -5.5 -5.0 -12.5 -0.5 -4.9 -0.5 4.1 -1.9 -1.5 13 1.1 3.4 1.9 3.9 5.2 5.6 4.7 -3.5 -14.0 2.1 -1.3 8.7 -3.2 -0.7 -4.1 14 4.5 4.4 2.9 2.6 4.2 7.1 0.0 4.6 2.0 5.7 6.8 -6.1 4.2 0.6 15.0
P P
14 J-A 5.1 5.8 5.5 7.6 5.6 9.2 1.3 4.1 -2.0 7.4 6.9 2.9 5.1 1.7 9.2 15 J-A 5.8 4.3 3.5 0.9 1.2 4.4 -3.0 ... ... ... ... ... ... -1.5 ...
P P P P P P P P P P P P
P P P P
Sources: INE and Instituto de Estudios Turísticos, Estadística de Movimientos Turísticos en Frontera.
Note: The underlying series for this indecator are in Tables 23.14 and 23.15 of the BE Boletín estadístico .
a. Information from hotel directories. Since January 2006, the frequency of data collection has been increased to every day of the month. Because hotel directories are updated
at different times, data for different years are not directly comparable. Chaining coefficients are available for the periods 2005, June 2009-May 2010 and July 2010-July 2011.
14 Jan 6.6 10.3 7.7 11.3 6.7 12.3 0.8 2.6 -7.3 8.6 6.3 5.5 5.2 0.1 5.5 Feb 7.1 6.3 5.9 7.5 8.1 11.2 4.5 3.1 -4.2 7.4 8.8 0.8 3.6 -1.4 8.1 Mar -6.5 1.4 -3.6 5.9 -2.5 0.6 -6.1 0.4 -1.9 1.5 12.4 -11.6 4.0 -1.7 22.3 Apr 16.2 9.0 16.5 11.0 10.4 13.2 6.5 9.4 4.2 11.8 0.5 17.0 7.3 10.4 2.2 May 4.7 4.0 1.4 0.2 2.7 5.7 -2.2 3.9 -0.4 5.7 9.8 -2.3 0.1 -2.6 18.3 Jun 3.3 3.3 2.0 1.2 3.8 4.5 2.5 4.8 4.1 5.1 5.6 -6.2 4.5 -4.4 19.5 Jul 2.4 1.4 -0.2 -1.8 3.4 5.9 -0.7 4.1 3.6 4.2 9.2 -7.4 4.8 -3.3 18.5 Aug 5.0 5.2 2.7 2.2 3.6 8.8 -3.2 6.4 5.7 6.6 6.5 -8.5 -1.7 -0.1 14.9 Sep 4.9 5.0 3.7 2.8 3.7 8.1 -3.3 5.2 5.5 5.1 14.1 -20.8 3.7 9.3 19.9 Oct 7.0 6.4 5.1 4.3 5.4 7.8 1.5 5.1 5.4 4.9 5.7 -8.0 9.5 3.6 15.7 Nov 0.2 1.0 -0.1 1.8 3.7 2.9 4.7 3.2 1.7 3.9 3.4 -14.1 3.1 2.2 12.9 Dec 7.2 5.1 2.9 0.6 3.8 5.6 2.0 4.5 3.1 5.3 1.3 0.4 7.1 -3.8 24.7
15 Jan 7.6 5.4 4.1 1.0 2.2 3.6 0.6 5.4 2.5 6.9 1.6 1.0 -1.9 -1.4 -0.9 Feb 5.7 6.5 4.3 2.6 1.5 5.3 -3.0 6.5 6.2 6.6 11.0 0.1 8.8 -0.5 3.3 Mar 6.3 1.6 2.4 -2.1 1.7 6.7 -4.6 7.0 6.5 7.2 8.1 0.6 5.9 -0.1 7.6 Apr 4.6 4.5 3.6 2.1 -0.1 2.8 -4.3 ... ... ... ... ... ... -4.0 ...
BANCO DE ESPAÑA 21* ECONOMIC BULLETIN, JULY-AUGUST 2015 ECONOMIC INDICATORS

2010 2011 2012 2013 2014-2.0
-1.8
-1.6
-1.4
-1.2
-1.0
-0.8
-0.6
-0.4
-0.2
0.0
0.2
0.4
0.6
0.8
-2.0
-1.8
-1.6
-1.4
-1.2
-1.0
-0.8
-0.6
-0.4
-0.2
0.0
0.2
0.4
0.6
0.8%%
POPULATION
LABOUR FORCE
LABOUR FORCE SURVEY Annual percentage change
2010 2011 2012 2013 2014-500
-400
-300
-200
-100
0
100
200
-500
-400
-300
-200
-100
0
100
200 thousandsthousands
TOTAL
DUE TO CHANGE IN POPULATION
DUE TO CHANGE IN PARTICIPATION RATE
LABOUR FORCE Annual changes
M M M
. Series depicted in chart.
1 2 . 3 4 5
. 6 . 7
. 8 . 9
4.1. LABOUR FORCE. SPAIN
___________________________________________________________________________________________________________________________
Thousands and annual percentage changes
Population over 16 years of age Labour force Annual change (a) Participation rate Due to change Due to change
Thousands Annual 4-quarter (%) Thousands Total in population in partici- 4-quarter change % change over 16 years pation rate % change of age (Thousands) (Thousands) (Thousands) (Thousands)
12 38 815 -27 -0.1 60.40 23 444 10 -16 26 0.0 13 38 639 -176 -0.5 60.02 23 190 -254 -106 -148 -1.1 14 38 515 -124 -0.3 59.60 22 955 -236 -74 -162 -1.0
M M
14 Q1-Q1 38 484 -250 -0.6 59.46 22 884 -425 -148 -276 -1.8 15 Q1-Q1 38 517 34 0.1 59.45 22 899 16 20 -4 0.1
Source: INE (Labour Force Survey: 2005 methodology).
a. Col.7 = (col.5/col.1)x annual change in col.2; Col.8 = (annual change in col.4/100) x col.1(t-4).
General note to the tables: As a result of the change in the population base (2011 Census), all the series in this table have been revised as from 2002. In addition, since 2005
Q1 the new obligatory variables referred to in Regulation (EC) 2257/2003 (on the adaptation of the list of labour force survey characteristics) have been included, a centralised
procedure for telephone interviews has been set in place and the questionnaire has been modified. Thus, in 2005 Q1, there is a break in the series of some variables. For further
information, see www.ine.es
12 Q3 38 799 -53 -0.1 60.55 23 492 9 -32 41 0.0 Q4 38 783 -99 -0.3 60.23 23 360 -80 -60 -20 -0.3
13 Q1 38 733 -121 -0.3 60.18 23 308 -125 -73 -52 -0.5 Q2 38 681 -143 -0.4 60.00 23 208 -282 -86 -196 -1.2 Q3 38 597 -202 -0.5 60.04 23 173 -319 -121 -197 -1.4 Q4 38 543 -240 -0.6 59.86 23 071 -290 -144 -146 -1.2
14 Q1 38 484 -250 -0.6 59.46 22 884 -425 -148 -276 -1.8 Q2 38 528 -153 -0.4 59.63 22 976 -232 -91 -141 -1.0 Q3 38 523 -74 -0.2 59.53 22 932 -242 -44 -198 -1.0 Q4 38 523 -20 -0.1 59.77 23 027 -44 -12 -32 -0.2
15 Q1 38 517 34 0.1 59.45 22 899 16 20 -4 0.1
BANCO DE ESPAÑA 22* ECONOMIC BULLETIN, JULY-AUGUST 2015 ECONOMIC INDICATORS

2010 2011 2012 2013 2014-5
-4
-3
-2
-1
0
1
2
3
-5
-4
-3
-2
-1
0
1
2
3%%
SPAIN
EURO AREA
EMPLOYMENT Annual percentage changes
2010 2011 2012 2013 2014-10
-8
-6
-4
-2
0
2
4
6
8
10
12
14
16
18
20
-10
-8
-6
-4
-2
0
2
4
6
8
10
12
14
16
18
20%%
WAGE-EARNERS
OTHER EMPLOYMENT
UNEMPLOYED
LABOUR FORCE: COMPONENTS Annual percentage changes
M M M
. Series depicted in chart.
1 2 . 3 4 5
. 6 7 8 . 9 10 11
. 12 13 14 15
4.2. EMPLOYMENT AND WAGE-EARNERS. SPAIN AND EURO AREA
___________________________________________________________________________________________________________________________
Thousands and annual percentage changes Memorandum item:
Employment Unemployment euro area
Total Wage-earners Other Employ- Unem- ment Unem- Annual 4-quarter Annual 4-quarter Annual 4-quarter Annual 4-quarter ployment 4-quarter ployment
Thousands change % change Thousands change % change Thousands change % change Thousands change % change rate % change rate (Thou- (Thou- (Thou- (Thou- sands) sands) sands) sands)
12 17 633 -789 -4.3 14 573 -821 -5.3 3 059 32 1.1 5 811 798 15.9 24.79 -0.5 11.33 13 17 139 -494 -2.8 14 069 -504 -3.5 3 070 11 0.3 6 051 240 4.1 26.10 -0.7 12.01 14 17 344 205 1.2 14 286 217 1.5 3 058 -12 -0.4 5 610 -441 -7.3 24.44 0.6 11.63
M M
14 Q1-Q1 16 951 -80 -0.5 13 930 -58 -0.4 3 021 -22 -0.7 5 933 -345 -5.5 25.93 0.2 11.80 15 Q1-Q1 17 455 504 3.0 14 394 464 3.3 3 061 40 1.3 5 445 -489 -8.2 23.78 ... 11.32
Sources: INE (Labour Force Survey: 2005 methodology), and ECB.
General note to the tables: As a result of the change in the population base (2011 Census), all the series in this table have been revised as from 2002. In addition, since 2005
Q1 the new obligatory variables referred to in Regulation (EC) 2257/2003 (on the adaptation of the list of labour force survey characteristics) have been included, a centralised
procedure for telephone interviews has been set in place and the questionnaire has been modified. Thus, in 2005 Q1, there is a break in the series of some variables. For further
information, see www.ine.es.
12 Q3 17 668 -817 -4.4 14 561 -918 -5.9 3 107 102 3.4 5 824 826 16.5 24.79 -0.6 11.47 Q4 17 339 -814 -4.5 14 289 -862 -5.7 3 051 48 1.6 6 021 734 13.9 25.77 -0.7 11.77
13 Q1 17 030 -735 -4.1 13 987 -737 -5.0 3 043 2 0.1 6 278 610 10.8 26.94 -1.0 12.03 Q2 17 161 -598 -3.4 14 072 -648 -4.4 3 088 50 1.7 6 047 316 5.5 26.06 -0.9 12.07 Q3 17 230 -438 -2.5 14 124 -437 -3.0 3 106 -1 -0.0 5 943 119 2.0 25.65 -0.7 12.02 Q4 17 135 -204 -1.2 14 093 -195 -1.4 3 042 -9 -0.3 5 936 -85 -1.4 25.73 -0.4 11.91
14 Q1 16 951 -80 -0.5 13 930 -58 -0.4 3 021 -22 -0.7 5 933 -345 -5.5 25.93 0.2 11.80 Q2 17 353 192 1.1 14 318 245 1.7 3 036 -53 -1.7 5 623 -424 -7.0 24.47 0.6 11.63 Q3 17 504 274 1.6 14 413 289 2.0 3 091 -15 -0.5 5 428 -516 -8.7 23.67 0.7 11.58 Q4 17 569 434 2.5 14 483 390 2.8 3 086 44 1.5 5 458 -478 -8.1 23.70 0.9 11.51
15 Q1 17 455 504 3.0 14 394 464 3.3 3 061 40 1.3 5 445 -489 -8.2 23.78 ... 11.32
BANCO DE ESPAÑA 23* ECONOMIC BULLETIN, JULY-AUGUST 2015 ECONOMIC INDICATORS

2010 2011 2012 2013 2014-20
-18
-16
-14
-12
-10
-8
-6
-4
-2
0
2
4
6
-20
-18
-16
-14
-12
-10
-8
-6
-4
-2
0
2
4
6%%
INDUSTRY
CONSTRUCTION
SERVICES
EMPLOYMENT Annual percentage changes
2010 2011 2012 2013 201412
14
16
18
20
22
24
26
28
30
32
34
36
38
40
42
12
14
16
18
20
22
24
26
28
30
32
34
36
38
40
42%%
TOTAL
INDUSTRY
CONSTRUCTION
SERVICES
TEMPORARY EMPLOYMENT Percentages
M M M
. Series depicted in chart.
1 2 . 3 4 5 6
. 7 8 . 9
. 10 11 . 12
. 13 14 . 15 16
4.3. EMPLOYMENT BY BRANCH OF ACTIVITY. SPAIN (a)
___________________________________________________________________________________________________________________________
Annual percentage changes Memorandum
Total Agriculture Industry Construction Services item: Propor- Propor- Propor- Propor- Propor- Employment tion of tion of tion of tion of tion of in
Employ- Wage- tempora Employ- Wage- tempora Employ- Wage- tempora Employ- Wage- tempora Employ- Wage- tempora- branches ment earners ry em- ment earners ry em- ment earners ry em- ment earners ry em- ment earners ry em- other ploy- ploy- ploy- ploy- ployment than ment ment ment ment agriculture
12 -4.3 -5.3 23.4 -1.6 -2.5 59.4 -4.6 -5.6 16.3 -17.3 -22.4 35.8 -3.0 -3.8 22.6 -4.4 13 -2.8 -3.5 23.1 -0.9 -1.8 59.5 -5.2 -4.6 16.6 -11.4 -14.0 34.0 -1.7 -2.5 22.3 -2.9 14 1.2 1.5 24.0 -0.1 5.0 62.0 1.0 1.1 18.0 -3.5 -2.8 36.2 1.7 1.8 22.9 1.3
M M
14 Q1-Q1 -0.5 -0.4 23.1 12.9 26.2 66.6 -3.4 -3.4 16.6 -11.6 -11.4 33.3 0.2 -0.1 21.8 -1.1 15 Q1-Q1 3.0 3.3 23.6 -11.3 -16.3 59.8 6.2 6.8 18.2 12.6 12.7 38.7 2.6 3.0 22.3 3.7
Source: INE (Labour Force Survey: 2005 methodology).
a.NACE 2009. The underlying series of this indicator are in Tables 24.4 and 24.6 of the BE Boletín Estadístico.
General note to the tables:As a result of the change in the population base (2011 Census), all the series in this table have been revised as from 2002. In addition, since 2005
Q1 the new obligatory variables referred to in Regulation (EC) 2257/2003 (on the adaptation of the list of labour force survey characteristics) have been included, a centralised
procedure for telephone interviews has been set in place and the questionnaire has been modified. Thus, in 2005 Q1, there is a break in the series of some variables. For further
information, see www.ine.es.
12 Q3 -4.4 -5.9 23.9 1.3 0.3 55.3 -5.2 -6.5 17.0 -17.0 -22.6 35.2 -3.3 -4.6 23.3 -4.6 Q4 -4.5 -5.7 22.8 -3.5 -3.4 64.0 -5.6 -5.6 16.3 -15.5 -20.4 34.6 -3.3 -4.6 21.6 -4.5
13 Q1 -4.1 -5.0 21.9 -6.1 -8.8 57.6 -5.2 -4.7 15.3 -11.3 -14.0 33.4 -3.2 -4.3 21.2 -4.0 Q2 -3.4 -4.4 22.9 4.3 4.4 59.4 -5.3 -4.4 15.8 -14.1 -18.5 34.7 -2.4 -3.6 22.1 -3.7 Q3 -2.5 -3.0 24.1 -2.1 -2.8 57.2 -6.1 -5.5 17.4 -10.6 -12.8 34.1 -1.1 -1.8 23.6 -2.5 Q4 -1.2 -1.4 23.7 0.4 0.4 63.8 -4.0 -3.9 17.9 -9.1 -10.3 33.9 -0.1 -0.3 22.5 -1.3
14 Q1 -0.5 -0.4 23.1 12.9 26.2 66.6 -3.4 -3.4 16.6 -11.6 -11.4 33.3 0.2 -0.1 21.8 -1.1 Q2 1.1 1.7 24.0 -1.8 3.5 63.4 -0.1 -0.1 18.1 -5.3 -3.1 35.5 2.0 2.3 22.8 1.3 Q3 1.6 2.0 24.6 -4.8 -1.9 57.8 3.5 3.6 18.6 -0.5 -0.9 37.9 1.8 2.1 23.9 1.9 Q4 2.5 2.8 24.2 -6.2 -6.5 60.3 4.2 4.4 18.7 4.0 4.7 38.1 2.6 2.7 23.1 2.9
15 Q1 3.0 3.3 23.6 -11.3 -16.3 59.8 6.2 6.8 18.2 12.6 12.7 38.7 2.6 3.0 22.3 3.7
BANCO DE ESPAÑA 24* ECONOMIC BULLETIN, JULY-AUGUST 2015 ECONOMIC INDICATORS

2010 2011 2012 2013 2014-14
-12
-10
-8
-6
-4
-2
0
2
4
6
8
10
-14
-12
-10
-8
-6
-4
-2
0
2
4
6
8
10%%
PERMANENT
TEMPORARY
PART-TIME
WAGE-EARNERS Annual percentage changes
2010 2011 2012 2013 20146
7
8
9
10
11
12
13
14
15
16
6
7
8
9
10
11
12
13
14
15
16%%
LESS THAN ONE YEAR
MORE THAN ONE YEAR
UNEMPLOYMENT Unemployment rate
M M M
. Series depicted in chart.
1 . 2 3
. 4 5 6 7 8 . 9 10
. 11 12 . 13 14
4.4. WAGE-EARNERS BY TYPE OF CONTRACT AND UNEMPLOYMENT BY DURATION. SPAIN.
___________________________________________________________________________________________________________________________
Thousands, annual percentage changes and %
Wage-earners Unemployment
By type of contract By duration of working day By duration Less More
Permanent Temporary Full-time Part-time than one year than one year
Annual 4-quar- Annual 4-quar- Proportion Annual 4-quar- Annual 4-quar- As % for Unem- 4-quar- Unem- 4-quar- change ter % change ter % of tempo- change ter % change ter % wage ployment ter % ployment ter %
change change rary em- change change earners rate change rate change ployment
(Thousands) (Thousands) (Thousands) (Thousands)
12 -363 -3.1 -458 -11.8 23.41 -855 -6.5 34 1.6 15.34 10.69 7.5 12.98 26.0 13 -348 -3.1 -156 -4.6 23.14 -661 -5.4 157 7.0 17.00 9.72 -10.1 15.24 16.1 14 43 0.4 173 5.3 23.99 158 1.4 58 2.4 17.15 8.22 -16.3 15.10 -1.9
M M
14 Q1-Q1 -210 -1.9 153 5.0 23.13 -103 -0.9 46 1.9 17.37 8.91 -18.9 15.98 3.5 15 Q1-Q1 290 2.7 175 5.4 23.60 368 3.2 96 4.0 17.48 8.13 -8.7 14.55 -8.9
Source: INE (Labour Force Survey: 2005 methodology).
General note to the tables: As a result of the change in the population base (2011 Census), all the series in this table have been revised as from 2002. In addition, since 2005
Q1 the new obligatory variables referred to in Regulation (EC) 2257/2003 (on the adaptation of the list of labour force survey characteristics) have been included, a centralised
procedure for telephone interviews has been set in place and the questionnaire has been modified. Thus, in 2005 Q1, there is a break in the series of some variables. For further
information, see www.ine.es.
12 Q3 -391 -3.4 -527 -13.2 23.86 -971 -7.3 53 2.5 14.91 10.48 8.3 12.98 26.7 Q4 -365 -3.2 -497 -13.2 22.82 -994 -7.7 132 6.1 16.02 10.63 2.7 14.14 24.9
13 Q1 -343 -3.0 -394 -11.4 21.94 -922 -7.4 185 8.5 16.98 10.79 -3.5 15.16 24.8 Q2 -421 -3.7 -228 -6.6 22.89 -800 -6.4 152 6.6 17.37 9.71 -9.1 15.20 18.0 Q3 -360 -3.2 -77 -2.2 24.05 -578 -4.7 141 6.5 16.37 9.33 -12.2 14.98 13.9 Q4 -270 -2.4 74 2.3 23.66 -344 -2.9 149 6.5 17.30 9.05 -15.9 15.62 9.2
14 Q1 -210 -1.9 153 5.0 23.13 -103 -0.9 46 1.9 17.37 8.91 -18.9 15.98 3.5 Q2 37 0.3 209 6.5 23.95 159 1.4 86 3.5 17.67 8.10 -17.4 15.21 -0.9 Q3 135 1.3 155 4.6 24.64 264 2.2 26 1.1 16.22 7.63 -19.1 14.65 -3.2 Q4 213 2.0 177 5.3 24.24 314 2.7 75 3.1 17.36 8.26 -8.9 14.56 -7.0
15 Q1 290 2.7 175 5.4 23.60 368 3.2 96 4.0 17.48 8.13 -8.7 14.55 -8.9
BANCO DE ESPAÑA 25* ECONOMIC BULLETIN, JULY-AUGUST 2015 ECONOMIC INDICATORS

2012 2013 2014 2015-20
-10
0
10
20
30
40
-20
-10
0
10
20
30
40%%
TOTAL
AGRICULTURE
INDUSTRY
CONSTRUCTION
SERVICES
REGISTERED UNEMPLOYMENT Annual percentage changes
2012 2013 2014 2015-6
-4
-2
0
2
4
6
8
10
12
14
16
18
-6
-4
-2
0
2
4
6
8
10
12
14
16
18%%
TOTAL
PLACEMENTS Annual percentage changes (Trend obtained with TRAMO-SEATS)
M M M
. Series depicted in chart.
1 2 . 3 4 5
. 6 7 . 8
. 9 . 10 11 12 13 14 15 16
. 17
4.5. REGISTERED UNEMPLOYMENT BY BRANCH OF ACTIVITY. CONTRACTS AND PLACEMENTS. SPAIN
___________________________________________________________________________________________________________________________
Thousands, annual percentage changes and %
Registered unemployment Contracts Placements
Total First time Previously employed (a) Total Percentage of total Total job-seekers(a)
12-month % change Annual 12 12 12 12 change month month month month
Thou- % % Branches other than agriculture Thou- % Perma- Part Tempo- Thou- % sands (Thou- change change sands change nent time rary sands change
sands) Total Agri- culture Total Industry Construc- Services tion
12 4 720 463 10.9 3.4 11.6 19.3 11.3 8.1 4.2 14.1 1 187 -1.3 9.87 34.63 90.13 1 169 -3.7 13 4 845 125 2.6 -3.3 3.3 19.8 2.6 -0.7 -9.6 6.6 1 233 3.9 7.78 35.31 92.22 1 257 7.6 14 4 576 -269 -5.6 1.7 -6.2 7.7 -6.8 -10.6 -17.4 -3.7 1 394 13.1 8.09 35.20 91.91 1 423 13.2
M M
14 J-M 4 736 -251 -5.0 1.6 -5.6 6.2 -6.1 -9.2 -16.4 -3.1 1 264 15.8 8.70 33.79 91.30 1 286 15.7 15 J-M 4 408 -328 -6.9 -1.3 -7.4 -0.6 -7.8 -12.6 -18.5 -4.7 1 410 11.5 9.02 34.65 90.98 1 418 10.3
Source: Instituto de Empleo Servicio Público de Empleo Estatal (SEPE).
Note: The underlying series for this indicator are in Tables 24.16 and 24.17 of the BE Boletín estadístico.
a. To December 2008, NACE 1993; from January 2009, NACE 2009.
14 Apr 4 684 -305 -6.1 1.0 -6.7 8.8 -7.4 -10.1 -16.8 -4.7 1 297 12.4 9.46 35.66 90.54 1 328 12.2 May 4 572 -319 -6.5 1.2 -7.2 9.5 -7.9 -11.3 -18.0 -4.9 1 459 13.7 7.95 35.53 92.05 1 490 13.8 Jun 4 450 -314 -6.6 0.5 -7.2 11.1 -8.1 -12.0 -18.6 -4.9 1 519 18.9 7.26 36.75 92.74 1 529 18.3 Jul 4 420 -279 -5.9 1.7 -6.6 11.9 -7.5 -12.0 -18.7 -4.1 1 645 9.1 6.93 38.23 93.07 1 648 9.1 Aug 4 428 -271 -5.8 2.6 -6.5 9.6 -7.2 -11.4 -18.3 -3.9 1 135 8.8 6.43 35.47 93.57 1 162 8.4 Sep 4 448 -277 -5.9 2.4 -6.6 10.0 -7.3 -11.5 -18.0 -4.2 1 634 17.4 8.48 36.95 91.52 1 730 16.7 Oct 4 527 -285 -5.9 1.5 -6.6 9.4 -7.3 -11.3 -18.1 -4.3 1 702 7.6 8.75 38.22 91.25 1 742 7.0 Nov 4 512 -297 -6.2 1.1 -6.8 3.0 -7.3 -11.6 -17.9 -4.3 1 385 11.6 8.49 34.39 91.51 1 397 11.5 Dec 4 448 -254 -5.4 2.4 -6.1 6.2 -6.7 -10.9 -16.8 -3.7 1 384 7.2 7.21 33.48 92.79 1 442 11.6
15 Jan 4 526 -289 -6.0 -0.7 -6.4 9.7 -7.2 -11.7 -17.6 -4.3 1 368 8.6 8.79 32.14 91.21 1 321 3.9 Feb 4 512 -300 -6.2 -1.2 -6.7 5.9 -7.3 -12.1 -18.3 -4.2 1 227 12.5 9.80 34.32 90.20 1 237 12.3 Mar 4 452 -344 -7.2 -1.3 -7.7 -2.7 -8.0 -12.5 -17.9 -5.2 1 442 18.5 10.01 35.64 89.99 1 457 17.7 Apr 4 333 -351 -7.5 -1.0 -8.1 -6.7 -8.2 -13.4 -19.6 -4.9 1 440 11.1 8.57 35.62 91.43 1 467 10.5 May 4 215 -357 -7.8 -2.4 -8.3 -9.4 -8.3 -13.5 -19.3 -5.1 1 573 7.9 7.92 35.53 92.08 1 609 8.0
BANCO DE ESPAÑA 26* ECONOMIC BULLETIN, JULY-AUGUST 2015 ECONOMIC INDICATORS

TOTAL INDUSTRY SERVICES
AGRICULTURE CONSTRUCTION
0
1000
2000
3000
4000
0
1000
2000
3000
4000thousandsthousands
2014
2015
EMPLOYEES AFFECTEDJanuary - May
TOTAL INDUSTRY SERVICES
AGRICULTURE CONSTRUCTION
0.0
0.1
0.2
0.3
0.4
0.5
0.6
0.7
0.8
0.9
1.0
1.1
1.2
1.3
1.4
1.5
0.0
0.1
0.2
0.3
0.4
0.5
0.6
0.7
0.8
0.9
1.0
1.1
1.2
1.3
1.4
1.5%%
2014
2015
AVERAGE WAGE SETTLEMENTJanuary - May
P
P P P P P P P P P P P P
P P P P P
. Series depicted in chart.
1 2 3 4 . 5 6
. 7 . 8
. 9 . 10 11 12
. 13 . 14
. 15 . 16
. 17
4.6. COLLECTIVE BARGAINING AGREEMENTS. SPAIN
Source: Ministerio de Empleo y Seguridad Social, Estadística de Convenios Colectivos de Trabajo.
a.The data include agreements registered after the end of the year.
b.Until 2010, includes revisions arising from indexation clauses.
c. The information on the number of collective bargaining agreements registered in 2013 with economic effects in 2013 is not homogeneous with respect to that
of the same period a year earlier.
___________________________________________________________________________________________________________________________
Thousands and %. Cumulative data
As per month As per month recorded economic effects come into force
(a) Employees affected Average wage settlement (%) Year of Year of Year of Year of
Em- Average signa- signa- signa- signa- ployees wage ture ture Annual Agricul- Indus- Construc- Services ture ture Agricul- Indus- Construc- affec- settle- prior to equal to Total change ture try tion prior to equal to Total ture try tion Services ted ment econo- econo- econo- econo- (b)(c) mic mic mic mic effects effects effects effects year year year year
12 10 099 1.00 ... ... 6 078 -189 392 1 323 417 3 947 ... ... 1.31 1.81 1.41 1.07 1.25 13 9 762 0.52 ... ... 5 041 -1 038 229 1 411 351 3 049 ... ... 0.57 0.95 0.49 0.58 0.58 14 6 567 0.59 3 171 1 585 4 756 -285 393 1 421 16 2 927 0.54 0.62 0.57 0.68 0.58 0.63 0.54
13 Dec 9 762 0.52 ... ... 5 041 -1 038 229 1 411 351 3 049 ... ... 0.57 0.95 0.49 0.58 0.58
14 Jan 5 909 0.57 953 13 966 478 36 223 0 706 0.61 0.02 0.60 1.00 0.79 - 0.52 Feb 5 916 0.57 1 669 30 1 699 898 176 380 3 1 140 0.60 0.42 0.60 0.66 0.90 1.46 0.49 Mar 5 924 0.57 2 536 173 2 709 1 557 248 908 4 1 549 0.55 0.53 0.55 0.72 0.61 1.43 0.49 Apr 6 210 0.58 2 749 318 3 067 1 642 265 1 016 4 1 783 0.56 0.61 0.56 0.74 0.62 1.42 0.51 May 6 214 0.58 2 952 549 3 500 1 795 306 1 193 4 1 998 0.55 0.49 0.54 0.70 0.58 1.41 0.49 Jun 6 244 0.58 2 981 622 3 603 1 527 308 1 232 4 2 059 0.55 0.52 0.54 0.70 0.59 1.31 0.49 Jul 6 404 0.59 3 009 759 3 768 1 333 310 1 238 4 2 216 0.54 0.59 0.55 0.70 0.59 1.29 0.51 Aug 6 417 0.59 3 038 836 3 874 482 312 1 290 4 2 267 0.54 0.57 0.55 0.70 0.58 1.21 0.51 Sep 6 478 0.59 3 060 1 137 4 197 478 313 1 336 5 2 544 0.54 0.62 0.56 0.70 0.58 1.22 0.54 Oct 6 559 0.59 3 100 1 227 4 327 118 313 1 350 7 2 658 0.54 0.64 0.57 0.70 0.58 0.79 0.55 Nov 6 565 0.59 3 130 1 289 4 418 -162 313 1 369 7 2 729 0.54 0.64 0.57 0.70 0.59 0.79 0.55 Dec 6 567 0.59 3 171 1 585 4 756 -285 393 1 421 16 2 927 0.54 0.62 0.57 0.68 0.58 0.63 0.54
15 Jan 2 598 0.72 1 031 4 1 035 68 40 371 26 597 0.63 0.51 0.63 0.99 0.59 0.50 0.64 Feb 2 598 0.72 1 611 21 1 632 -67 241 527 26 839 0.67 0.61 0.67 0.80 0.68 0.50 0.64 Mar 2 600 0.72 1 977 50 2 027 -682 241 634 26 1 126 0.69 0.39 0.69 0.80 0.73 0.50 0.64 Apr 2 705 0.73 2 232 181 2 413 -654 270 643 26 1 474 0.70 0.82 0.71 0.81 0.73 0.50 0.69 May 2 706 0.73 2 488 220 2 708 -793 276 675 176 1 580 0.73 0.75 0.73 0.81 0.72 1.31 0.66
BANCO DE ESPAÑA 27* ECONOMIC BULLETIN, JULY-AUGUST 2015 ECONOMIC INDICATORS

2012 2013 2014 2015-4
-3
-2
-1
0
1
2
3
4
-4
-3
-2
-1
0
1
2
3
4%%
LABOUR COSTS
WAGE COSTS
PER WORKER AND MONTH Annual percentage change
2012 2013 2014 2015-4
-3
-2
-1
0
1
2
3
4
-4
-3
-2
-1
0
1
2
3
4%%
LABOUR COSTS PER HOUR. SPAIN
LABOUR COSTS PER HOUR. EURO AREA
PER HOUR WORKED Annual percentage change
M M M
. Series depicted in chart.
. 1 2 3 4 5 . 6 7 8 9 10 11
. 12 . 13
4.7. QUARTERLY LABOUR COSTS SURVEY
___________________________________________________________________________________________________________________________
Annual percentage change
Labour costs Wage costs Other memoramdum item: costs total hourly costs per (a)
Per worker and per month Per hour Per worker and per month Per hour worker worked worked and month Spain Euro (b) area (c)
Total Industry Construc- Services Total Industry Construc- Services tion tion
12 -0.6 1.9 1.5 -1.3 -0.1 -0.6 1.2 1.3 -1.1 -0.1 -0.8 -0.2 2.4 13 0.2 1.8 0.5 -0.1 0.5 0.0 1.9 0.5 -0.4 0.4 0.6 0.6 1.2 14 -0.3 1.3 -0.2 -0.6 0.1 -0.1 1.5 0.7 -0.5 0.3 -1.0 0.6 1.2
M M
14 Q1-Q1 -0.2 1.0 0.4 -0.5 -1.8 -0.2 1.4 -0.0 -0.5 -1.8 -0.4 0.6 0.8 15 Q1-Q1 ... ... ... ... ... ... ... ... ... ... ... 1.2 ...
Sources: INE (Quarterly Labour Costs Survey and Harmonised Labour Costs Index) and Eurostat.
Note: The underlying series for this indicator are in Tables 24.25, 24.26 and 24.27 of de BE Boletín estadístico.
a. Working day adjusted.
b. Harmonised Labour Costs Index.
c. Whole economy, excluding agriculture, public administration, education, health and services not classified elsewhere.
12 Q3 -0.1 1.8 1.0 -0.4 - 0.3 1.0 1.2 0.0 0.3 -0.9 0.6 2.5 Q4 -3.2 0.7 0.0 -4.2 -2.2 -3.6 -0.2 0.4 -4.7 -2.7 -1.8 -3.5 2.4
13 Q1 -1.4 1.5 -0.8 -2.0 2.1 -1.8 1.4 -0.5 -2.6 1.8 -0.3 -1.0 2.0 Q2 -0.3 1.8 1.8 -0.8 -2.4 -0.6 1.8 1.5 -1.2 -2.6 0.4 -0.4 1.0 Q3 0.2 2.5 0.2 -0.2 0.5 -0.2 2.1 0.5 -0.8 0.1 1.4 0.5 0.8 Q4 2.1 1.4 0.7 2.6 1.8 2.5 2.3 0.5 2.8 2.2 0.8 3.1 1.0
14 Q1 -0.2 1.0 0.4 -0.5 -1.8 -0.2 1.4 -0.0 -0.5 -1.8 -0.4 0.6 0.8 Q2 -0.1 1.8 -1.3 -0.3 3.5 0.0 2.1 0.4 -0.3 3.7 -0.5 1.4 1.6 Q3 -0.4 1.0 0.4 -0.7 -0.1 -0.1 1.7 1.2 -0.4 0.3 -1.5 0.2 1.3 Q4 -0.5 1.4 -0.2 -0.9 -1.2 -0.2 0.9 1.1 -0.5 -0.8 -1.5 0.1 1.0
15 Q1 ... ... ... ... ... ... ... ... ... ... ... 1.2 ...
BANCO DE ESPAÑA 28* ECONOMIC BULLETIN, JULY-AUGUST 2015 ECONOMIC INDICATORS

2010 2011 2012 2013 2014 2015-8
-7
-6
-5
-4
-3
-2
-1
0
1
2
3
-8
-7
-6
-5
-4
-3
-2
-1
0
1
2
3%%
SPAIN
EURO AREA
UNIT LABOUR COSTS: TOTAL Annual percentage changes
2010 2011 2012 2013 2014 2015-8
-7
-6
-5
-4
-3
-2
-1
0
1
2
3
-8
-7
-6
-5
-4
-3
-2
-1
0
1
2
3%%
SPAIN
EURO AREA
UNIT LABOUR COSTS: INDUSTRY Annual percentage changes
P A A
. Series depicted in chart.
. 1 . 2
. 3 . 4 5 6 7 8 9 10 11 12
4.8. UNIT LABOUR COSTS. SPAIN AND EURO AREA (a)
___________________________________________________________________________________________________________________________
Annual percentage changes
Unit labour costs Whole-economy Memorandum items Compensation per Productivity GDP Employment
Whole-economy Industry employee (volume measures) Whole-economy
Spain Euro Spain Euro Spain Euro Spain Euro Spain Euro Spain Euro area area (b) area area area (b) area
12 -3.0 1.9 0.2 1.7 -0.6 1.6 2.5 -0.3 -2.1 -0.8 -4.4 -0.5 13 -0.4 1.3 -1.1 1.5 1.7 1.7 2.1 0.4 -1.2 -0.3 -3.3 -0.7 14 -0.4 1.1 0.4 1.7 -0.2 1.4 0.2 0.3 1.4 0.9 1.2 0.6
P P P
A A A A
A A A A
A
Sources: INE (Quarterly National Accounts of Spain. Base year 2010) and EUROSTAT.
a. Spain: prepared in accordance with ESA2010. SEASONALLY- AND WORKING-DAY-ADJUSTED SERIES.
b. Full-time equivalent employment.
12 Q2 -2.5 2.0 0.2 1.8 0.1 1.7 2.7 -0.3 -2.1 -0.8 -4.6 -0.6 Q3 -2.9 2.0 -0.6 1.4 -0.6 1.7 2.4 -0.4 -2.1 -0.9 -4.4 -0.5 Q4 -5.2 1.5 -1.0 1.7 -3.0 1.2 2.4 -0.3 -2.5 -0.9 -4.7 -0.7
13 Q1 -1.6 1.7 -0.3 2.4 0.5 1.5 2.2 -0.2 -2.2 -1.1 -4.3 -0.9 Q2 -1.3 1.0 -1.0 1.4 1.0 1.5 2.3 0.5 -1.7 -0.5 -3.9 -0.9 Q3 -0.6 1.2 -2.1 2.2 1.4 1.7 2.0 0.5 -1.0 -0.2 -3.0 -0.7 Q4 2.0 1.1 -0.9 -0.0 3.8 2.0 1.8 0.8 0.0 0.5 -1.8 -0.4
14 Q1 -1.1 0.8 -2.1 0.8 -0.1 1.6 1.1 0.9 0.6 1.1 -0.4 0.2 Q2 -0.3 1.0 -0.3 1.6 -0.0 1.2 0.2 0.2 1.2 0.8 1.0 0.6 Q3 -0.3 1.2 1.8 1.6 -0.3 1.2 -0.0 0.1 1.6 0.8 1.7 0.7 Q4 -0.1 1.3 2.1 2.7 -0.5 1.3 -0.4 -0.0 2.0 0.9 2.4 0.9
15 Q1 1.0 ... 1.1 ... 0.9 ... -0.1 ... 2.7 1.0 2.8 ...
BANCO DE ESPAÑA 29* ECONOMIC BULLETIN, JULY-AUGUST 2015 ECONOMIC INDICATORS

2012 2013 2014 2015-2
-1
0
1
2
3
4
-2
-1
0
1
2
3
4%%
TOTAL
IPSEBENE
INDUSTRIAL GOODS EXCL. ENERGY PRODUCTS
SERVICES
CONSUMER PRICE INDEX. TOTAL AND COMPONENTS Annual percentage changes
2012 2013 2014 2015-12
-10
-8
-6
-4
-2
0
2
4
6
8
10
12
14
-12
-10
-8
-6
-4
-2
0
2
4
6
8
10
12
14%%
PROCESSED FOOD
UNPROCESSED FOOD
ENERGY
CONSUMER PRICE INDEX. COMPONENTS Annual percentage changes
M M M
. Series depicted in chart.
1 2 . 3 4
. 5 . 6
. 7 . 8
. 9 . 10 11 12
5.1. CONSUMER PRICE INDEX. SPAIN (2011=100)
___________________________________________________________________________________________________________________________
Indices and annual percentage changes Memorandum item:prices for
Total (100%) Annual percentage change (12-month % change) agricultural products (2005=100)
Industrial Month-on- 12-month Cumulative goods Original 12-month
Original month % change % change Unprocessed Processed excl. Energy Services IPSEBENE series % change series % change during year food food energy (c) (a) (b) products
12 102.4 _ 2.5 2.9 2.3 3.0 0.8 8.9 1.5 1.6 111.6 9.9 13 103.9 _ 1.4 0.3 3.5 3.1 0.6 0.1 1.4 1.5 114.6 2.7 14 103.7 _ -0.1 -1.0 -1.2 0.4 -0.4 -0.8 0.2 0.0 106.5 -7.0
M M
Sources: INE, Ministerio de Agricultura,Alimentación y Medio Ambiente.
Note: The underlying series for this indicator are in Tables 25.2 and 25.8 of the BE Boletín estadístico.
a. For annual periods: average growth for each year on the previous year.
b. For annual periods: December-on-December growth rate.
c. Index of non-energy processed goods and service prices.
14 J-M 103.7 -0.0 0.1 -0.9 -0.2 1.1 -0.4 0.3 0.1 0.1 109.7 -6.8 15 J-M 102.9 0.1 -0.8 -0.6 0.7 0.4 -0.1 -8.5 0.4 0.3 ... ...
14 Feb 103.1 - - -1.4 1.2 1.3 -0.4 -1.7 - 0.1 108.1 -5.6 Mar 103.4 0.2 -0.1 -1.2 - 1.2 -0.3 -1.4 -0.2 - 110.0 -7.7 Apr 104.3 0.9 0.4 -0.3 -0.5 0.8 -0.4 1.6 0.5 0.3 112.0 -4.0 May 104.3 - 0.2 -0.3 -2.7 0.6 -0.5 3.0 0.2 - 111.0 -10.3 Jun 104.3 - 0.1 -0.2 -3.8 0.2 -0.5 2.6 0.3 - 111.7 -6.9 Jul 103.3 -0.9 -0.3 -1.2 -5.2 -0.1 -0.4 0.3 0.2 - 96.5 -10.0 Aug 103.5 0.2 -0.5 -1.0 -5.4 -0.2 -0.4 -0.9 0.2 - 97.6 -6.3 Sep 103.7 0.2 -0.2 -0.9 -1.5 -0.2 -0.3 - 0.1 -0.1 107.0 -5.7 Oct 104.2 0.5 -0.1 -0.4 1.7 -0.2 -0.3 -1.1 0.1 -0.1 107.4 -9.0 Nov 104.1 -0.1 -0.4 -0.5 1.2 -0.2 -0.3 -3.2 0.2 -0.1 107.8 -2.9 Dec 103.5 -0.6 -1.0 -1.0 -0.4 -0.2 -0.2 -8.5 0.3 - 106.7 -9.3
15 Jan 101.8 -1.6 -1.3 -1.6 -0.7 -0.1 -0.1 -11.4 0.5 0.2 ... ... Feb 102.0 0.2 -1.1 -1.4 0.9 0.1 -0.1 -10.2 0.3 0.2 ... ... Mar 102.7 0.6 -0.7 -0.8 0.9 0.3 -0.2 -7.4 0.4 0.2 ... ... Apr 103.6 0.9 -0.6 0.1 0.2 0.7 - -7.2 0.3 0.3 ... ... May 104.1 0.5 -0.2 0.6 2.3 0.9 0.1 -6.4 0.6 0.5 ... ...
BANCO DE ESPAÑA 30* ECONOMIC BULLETIN, JULY-AUGUST 2015 ECONOMIC INDICATORS

2012 2013 2014 2015-3
-2
-1
0
1
2
3
4
5
-3
-2
-1
0
1
2
3
4
5%%
TOTAL (SPAIN)
TOTAL (EURO AREA)
HARMONISED INDEX OF CONSUMER PRICES. TOTAL Annual percentage changes
2012 2013 2014 2015-3
-2
-1
0
1
2
3
4
5
-3
-2
-1
0
1
2
3
4
5%%
GOODS (SPAIN)
GOODS (EURO AREA)
SERVICES (SPAIN)
SERVICES (EURO AREA)
HARMONISED INDEX OF CONSUMER PRICES. COMPONENTS Annual percentage changes
M M M
. Series depicted in chart.
. 1 . 2
. 3 . 4 5 6 7 8 9 10 11 12 13 14 15 16
. 17 . 18
5.2. HARMONISED INDEX OF CONSUMER PRICES. SPAIN AND EURO AREA (2005=100) (a)
___________________________________________________________________________________________________________________________
Annual percentage changes
Total Goods Services Food Industrial Euro Euro Total Processed Unprocessed Euro Non-energy Energy Euro
Spain area Spain area Spain area Spain area Euro Euro Euro Euro Euro Spain area Spain area Spain area Spain area Spain area
12 2.4 2.5 3.1 3.0 2.6 3.1 3.5 3.1 1.6 3.0 3.4 3.0 1.0 1.2 8.8 7.6 1.5 1.8 13 1.5 1.4 1.7 1.3 3.2 2.7 3.1 2.2 3.4 3.5 0.8 0.6 1.1 0.6 0.0 0.6 1.3 1.4 14 -0.2 0.4 -0.3 -0.2 -0.1 0.5 -0.1 1.2 -0.1 -0.8 -0.4 -0.5 -0.3 0.1 -0.8 -1.9 -0.0 1.2
M M P
14 J-A 0.1 0.7 0.2 0.2 1.0 1.2 0.8 1.8 1.2 0.4 -0.2 -0.3 -0.2 0.2 -0.4 -1.7 -0.1 1.3 15 J-A -1.0 -0.2 -1.9 -1.2 0.3 0.5 0.1 0.6 0.5 0.4 -3.1 -2.1 -0.2 -0.0 -9.0 -7.2 0.2 1.0
P
Source: Eurostat.
a. Since January 2011 the rules of Commission Regulation (EC) No 330/2009 on the treatment of seasonal products have been incorporated. This has prompted a break in the
series. The series constructed with the new methodology are only available from January 2010. The year-on-year rates of change presented here for 2010 are those
disseminated by Eurostat, wich were constructed using the series prepared with the new methodology for 2010 and using the series prepared with the old methodology for
2009. Thus, these rates give a distorted view since they compare price indices prepared using two different methodologies. The year-on-year rates of change in the HICP
in 2010, calculated on a uniform basis using solely the previous methodology and wich are consequently consistent, are as follows: Jan:1,1; Feb:0,9; Mar:1,5; Apr:1,6;
May:1,8; Jun:1,5; Jul:1,9; Aug:1,8; Sep:2,1; Oct:2,3; Nov:2,2; Dec:2,9. More detailed methodological notes can be consulted on the Eurostat Internet site (www.europa.eu.int).
14 Jan 0.3 0.8 0.6 0.5 1.4 1.7 1.3 2.0 1.5 1.3 0.1 -0.2 0.1 0.2 - -1.2 -0.2 1.2 Feb 0.1 0.7 0.2 0.3 1.3 1.5 0.9 1.8 1.7 0.9 -0.6 -0.4 - 0.4 -1.7 -2.3 -0.1 1.3 Mar -0.2 0.5 -0.1 - 0.8 1.0 0.7 1.7 0.9 -0.1 -0.7 -0.5 -0.3 0.2 -1.4 -2.1 -0.4 1.1 Apr 0.3 0.7 0.3 0.1 0.4 0.7 0.4 1.6 0.5 -0.7 0.3 -0.3 -0.3 0.1 1.6 -1.2 0.3 1.6 May 0.2 0.5 0.3 - -0.4 0.1 - 1.5 -0.9 -2.1 0.8 - -0.2 - 3.0 - - 1.1 Jun - 0.5 - -0.1 -1.0 -0.2 -0.3 1.4 -1.7 -2.8 0.6 - -0.3 -0.1 2.6 0.1 0.1 1.3 Jul -0.4 0.4 -0.6 -0.3 -1.6 -0.3 -0.7 1.1 -2.7 -2.6 - -0.3 -0.2 - 0.3 -1.0 - 1.3 Aug -0.5 0.4 -0.9 -0.3 -1.8 -0.3 -0.8 1.0 -2.9 -2.4 -0.4 -0.4 -0.2 0.3 -0.9 -2.0 - 1.3 Sep -0.3 0.3 -0.4 -0.3 -0.6 0.3 -0.8 1.0 -0.5 -0.9 -0.3 -0.6 -0.5 0.2 - -2.3 -0.1 1.1 Oct -0.2 0.4 -0.3 -0.2 0.4 0.5 -0.8 0.8 1.6 - -0.7 -0.6 -0.5 -0.1 -1.1 -2.0 -0.1 1.2 Nov -0.5 0.3 -0.8 -0.4 0.2 0.5 -0.7 0.6 1.2 0.2 -1.3 -0.8 -0.3 -0.1 -3.2 -2.6 - 1.2 Dec -1.1 -0.2 -1.9 -1.2 -0.2 - -0.6 0.5 0.2 -1.0 -2.9 -1.8 -0.3 - -8.4 -6.3 0.1 1.2
15 Jan -1.5 -0.6 -2.6 -1.8 -0.3 -0.1 -0.4 0.4 -0.1 -0.8 -4.0 -2.8 -0.3 -0.1 -11.4 -9.3 0.3 1.0 Feb -1.2 -0.3 -2.1 -1.4 0.3 0.5 -0.1 0.5 0.8 0.4 -3.5 -2.4 -0.2 -0.1 -10.1 -7.9 0.2 1.2 Mar -0.8 -0.1 -1.5 -0.9 0.5 0.6 0.2 0.6 0.8 0.7 -2.6 -1.7 -0.3 - -7.4 -6.0 0.2 1.0 Apr -0.7 - -1.3 -0.7 0.5 1.0 0.6 0.7 0.5 1.3 -2.4 -1.6 -0.1 0.1 -7.1 -5.8 0.1 1.0
BANCO DE ESPAÑA 31* ECONOMIC BULLETIN, JULY-AUGUST 2015 ECONOMIC INDICATORS

2012 2013 2014 2015-4
-3
-2
-1
0
1
2
3
4
5
-4
-3
-2
-1
0
1
2
3
4
5%%
TOTAL (SPAIN)
TOTAL (EURO AREA)
PRODUCER PRICE INDEX. TOTAL Annual percentage changes
2012 2013 2014 2015-3
-2
-1
0
1
2
3
4
-3
-2
-1
0
1
2
3
4%%
CONSUMPTION
INVESTMENT
INTERMEDIATE GOODS
PRODUCER PRICE INDEX. COMPONENTS Annual percentage changes
M M M
. Series depicted in chart.
1 2 . 3 4
. 5 6 . 7 8
. 9 10 11 . 12 13 14 15 16
5.3. PRODUCER PRICE INDEX. SPAIN AND EURO AREA (2010 = 100)
___________________________________________________________________________________________________________________________
Annual percentage changes
Total Consumer Capital Intermediate Energy Memorandum item: euro area goods goods goods
Consumer Capital Intermediate Total goods goods goods Energy Month- 12- Month- 12- Month- 12- Month- 12- Month- 12-
Original on - month on - month on - month on - month on - month series month % month % month % month % month % 12- 12- 12- 12- 12- % change % change % change % change % change month month month month month change change change change change % % % % % change change change change change
12 111.0 _ 3.8 _ 2.5 _ 0.5 _ 1.4 _ 9.7 2.8 2.5 1.0 0.7 6.6 13 111.7 _ 0.6 _ 2.2 _ -0.1 _ -0.5 _ 0.5 -0.2 1.7 0.6 -0.6 -1.6 14 110.2 _ -1.3 _ -0.5 _ 0.2 _ -1.5 _ -3.1 -1.5 0.1 0.4 -1.1 -4.4
M M P
14 J-A 109.8 _ -1.7 _ -0.8 _ -0.2 _ -2.6 _ -2.8 -1.5 0.6 0.3 -1.7 -4.0 15 J-A 107.9 _ -1.7 _ 1.1 _ 0.6 _ -0.8 _ -7.1 -2.7 -0.8 0.7 -1.4 -7.9
P P P P
Sources: INE and ECB.
Note: The underlying series for this indicator, for Spain, are in Table 25.3 of the BE Boletín estadístico.
a. For annual periods: average growth for each year on the previous year.
14 Jan 110.5 -1.4 -1.9 -0.1 -0.6 0.2 -0.1 0.2 -2.4 -5.2 -3.9 -1.3 0.7 0.4 -1.6 -3.4 Feb 109.4 -1.0 -3.1 -0.1 -0.9 -0.2 -0.3 -0.2 -2.8 -3.3 -7.6 -1.7 0.6 0.3 -1.8 -4.4 Mar 109.5 0.1 -1.5 0.0 -0.9 0.3 -0.1 -0.2 -2.9 0.6 -1.7 -1.7 0.5 0.3 -1.9 -4.4 Apr 109.7 0.1 -0.2 0.1 -0.7 -0.0 -0.2 0.2 -2.2 0.1 2.4 -1.3 0.7 0.3 -1.5 -3.6 May 110.6 0.8 -0.5 0.2 -0.5 0.1 0.2 0.0 -1.9 3.1 0.5 -1.1 0.5 0.3 -1.2 -3.1 Jun 111.5 0.9 0.3 -0.0 -0.7 -0.1 0.4 0.2 -1.4 3.1 3.1 -0.9 0.4 0.4 -0.9 -2.5 Jul 111.6 0.1 -0.5 0.2 -0.5 0.2 0.4 -0.0 -1.0 -0.1 -0.7 -1.3 0.2 0.4 -0.6 -4.0 Aug 110.6 -0.9 -1.3 0.3 -0.3 0.0 0.2 -0.2 -0.9 -3.3 -3.7 -1.5 -0.0 0.5 -0.6 -4.9 Sep 111.3 0.6 -0.9 -0.2 -0.5 0.2 0.6 0.1 -0.7 2.2 -2.4 -1.5 -0.4 0.6 -0.5 -4.5 Oct 110.3 -0.8 -1.2 -0.2 -0.3 -0.1 0.5 -0.1 -0.5 -2.7 -4.0 -1.3 -0.6 0.6 -0.4 -4.1 Nov 109.1 -1.2 -1.5 0.0 -0.1 -0.1 0.5 -0.3 -0.6 -4.1 -5.5 -1.5 -0.6 0.6 -0.5 -4.9 Dec 107.9 -1.1 -3.6 0.2 0.4 0.1 0.6 -0.3 -0.8 -4.1 -13.3 -2.7 -0.7 0.6 -1.0 -8.3
15 Jan 107.4 -0.5 -2.8 0.4 0.9 0.2 0.6 -0.3 -1.2 -2.0 -10.4 -3.5 -0.9 0.7 -1.7 -10.5 Feb 107.7 0.2 -1.5 0.1 1.1 0.0 0.8 -0.2 -1.2 1.0 -6.4 -2.7 -0.8 0.7 -1.7 -8.0 Mar 108.1 0.4 -1.3 0.2 1.3 -0.1 0.5 0.5 -0.4 0.9 -6.1 -2.3 -0.6 0.7 -1.3 -6.7 Apr 108.6 0.4 -1.0 0.1 1.2 0.1 0.6 0.4 -0.2 0.9 -5.5 -2.2 -0.9 0.8 -1.0 -6.4
BANCO DE ESPAÑA 32* ECONOMIC BULLETIN, JULY-AUGUST 2015 ECONOMIC INDICATORS

2012 2013 2014 2015-3
-2
-1
0
1
2
3
4
5
6
-3
-2
-1
0
1
2
3
4
5
6%%
EXPORTS
IMPORTS
EXPORT AND IMPORT UNIT VALUE INDICES (a)
2012 2013 2014 2015-7
-6
-5
-4
-3
-2
-1
0
1
2
3
4
5
6
7
8
9
-7
-6
-5
-4
-3
-2
-1
0
1
2
3
4
5
6
7
8
9%%
CONSUMER GOODS
CAPITAL GOODS
INTERMEDIATE GOODS
IMPORT UNIT VALUE INDICES BY PRODUCT GROUP (a)
. Series depicted in chart.
. 1 2 3 4 5 6 . 7
. 8 . 9
. 10 11 12
5.4. UNIT VALUE INDICES FOR SPANISH FOREIGN TRADE
Sources: ME, MHAP and BE.
Note: The underlying series for this indicator are in the Tables 18.6 and 18.7 of the Boletín Estadístico.
a. Annual percentage changes (trend obtained with TRAMO-SEATS).
___________________________________________________________________________________________________________________________
Annual percentage changes
Exports/dispatches Imports/arrivals Consumer Capital Intermediate goods Consumer Capital Intermediate goods
Total goods goods goods goods Total Total Energy Non-energy Total Energy Non-energy
12 2.1 5.7 7.0 -0.4 3.1 -0.7 4.6 3.4 -2.1 5.7 10.0 2.3 13 -0.1 1.2 -5.2 -0.1 -5.8 0.6 -4.2 -0.9 -8.2 -4.9 -8.6 -2.6 14 -1.0 0.3 -2.1 -1.6 -5.2 -1.4 -2.4 1.1 -2.1 -3.5 -6.8 -1.6
14 J-M 0.1 1.9 -0.7 -0.8 -2.0 -0.7 -5.0 -2.1 -10.1 -5.4 -9.4 -3.5 15 J-M 0.6 2.4 -2.5 -0.1 -20.9 1.9 -1.4 9.3 7.0 -6.0 -25.5 3.8
13 Oct 0.6 0.1 -1.2 1.0 -10.0 2.9 -6.7 -5.3 -10.0 -7.0 -8.4 -5.3 Nov -1.3 0.1 -10.3 -0.4 -14.0 0.5 -2.8 1.8 -0.3 -4.5 -8.3 -2.1 Dec -2.4 -0.8 -3.8 -2.9 -7.1 -1.1 -3.5 -0.5 2.9 -5.5 -7.7 -2.2
14 Jan -2.2 -0.9 -2.4 -2.8 -4.3 -2.8 -6.7 -2.7 -1.9 -8.3 -12.1 -5.1 Feb -0.3 3.6 0.6 -2.7 -7.3 -2.3 -3.3 -1.2 -7.4 -3.7 -7.7 -2.0 Mar 2.8 3.0 -0.2 3.0 5.0 2.8 -4.9 -2.1 -20.6 -4.1 -8.2 -3.4 Apr -1.6 -0.3 4.8 -3.5 -9.8 -2.5 0.3 1.4 1.4 -0.1 -3.7 3.0 May 1.3 0.7 2.8 1.4 1.5 2.2 0.8 -0.8 -4.3 1.7 11.5 -1.3 Jun -2.6 -1.7 -2.0 -3.3 1.6 -4.0 -2.1 2.8 -4.0 -3.5 -5.6 -1.7 Jul -1.8 0.6 -4.0 -2.7 -9.7 -2.4 -1.3 0.4 -3.1 -1.7 1.3 -1.5 Aug -4.1 -2.1 -2.6 -5.3 -11.3 -5.1 -1.7 -0.9 10.4 -2.9 -7.4 -0.4 Sep 1.4 3.7 -9.9 2.1 1.5 1.0 -3.6 1.1 -4.6 -5.1 -11.2 -1.9 Oct -2.3 -0.7 -10.0 -1.9 -6.1 -1.5 -2.0 3.8 7.7 -4.8 -11.1 -2.4 Nov -1.3 0.4 0.0 -2.6 -5.3 -2.0 -2.2 3.4 3.4 -4.9 -11.7 -1.5 Dec -1.5 -2.3 -1.5 -0.9 -18.1 0.2 -1.8 7.9 -2.7 -5.3 -16.4 -0.7
15 Jan 0.1 3.0 -2.2 -1.5 -22.1 0.5 -2.8 9.9 -3.8 -7.1 -28.3 2.8 Feb 1.2 2.1 -6.1 1.8 -18.8 3.3 -2.1 7.9 0.9 -5.9 -26.2 3.5 Mar 0.6 2.1 0.6 -0.5 -21.6 2.1 0.6 9.9 23.5 -4.9 -22.1 5.0
BANCO DE ESPAÑA 33* ECONOMIC BULLETIN, JULY-AUGUST 2015 ECONOMIC INDICATORS

2013 2014 2015-80
-70
-60
-50
-40
-30
-20
-10
0
10
-80
-70
-60
-50
-40
-30
-20
-10
0
10bn bn
GENERAL GOVERNMENT
CENTRAL GOVERNMENT
REGIONAL (AUTONOMOUS) GOVERNMENTS
LOCAL GOVERNMENTS
SOCIAL SECURITY FUNDS
NET LENDING (+)/NET BORROWING (-) By level of government.4-quarter moving average
-40
-30
-20
-10
0
10
-40
-30
-20
-10
0
10bn bn
JanFeb
MarApr
MayJun
JulAug
SepOct
NovDec
CENTRAL GOVERNMENT (2014)
CENTRAL GOVERNMENT (2015)
REGIONAL (AUTONOMOUS) GOVERNMENTS (2014)
REGIONAL (AUTONOMOUS) GOVERNMENTS (2015)
SOCIAL SECURITY FUNDS (2014)
SOCIAL SECURITY FUNDS (2015)
NET LENDING (+)/NET BORROWING (-) By level of government. Cumulative data from January. Monthly information
A A
. Series depicted in chart.
. 1 = 2+4+5+6 . 2 3
. 4 . 5
. 6
6.1. GENERAL GOVERNMENT. NET LENDING (+)/NET BORROWING (-)
___________________________________________________________________________________________________________________________
EUR millions Central government Total Regional Social
General (autonomous) Local security government governments governments funds
Of which: State (b) (a)
13 -71 291 -49 190 -45 321 -15 932 5 474 -11 643 14 -61 391 -38 264 -39 660 -17 541 5 616 -11 202
A A A A
14 Q1 -6 325 -7 774 -9 570 -2 855 928 3 376 Q2 -28 887 -16 210 -16 986 -7 644 -172 -4 861 Q3 -3 245 -6 966 -6 042 -505 2 755 1 471 Q4 -22 934 -7 314 -7 062 -6 537 2 105 -11 188
A A
A A A A A A A A
A A A
SOURCE: Ministerio de Hacienda y Administraciones Públicas (IGAE).
a. Detailed operations are published in indicator 6.3.
b. The breakdown by regional (autonomous) government is published in indicator 6.6.
14 J-M ... -7 774 -9 570 -2 855 ... 3 376 15 J-M ... -9 131 -9 665 -2 190 ... 2 719
14 May ... -11 047 -11 505 -1 489 ... 707 Jun ... -5 -440 -4 293 ... -6 914 Jul ... -5 946 -5 712 1 566 ... 1 158 Aug ... -3 290 -2 825 -499 ... -653 Sep ... 2 270 2 495 -1 572 ... 966 Oct ... 2 563 2 296 -1 743 ... -250 Nov ... -5 089 -5 072 -468 ... -456 Dec ... -4 788 -4 286 -4 326 ... -10 482
15 Jan ... -7 113 -6 557 -692 ... 1 784 Feb ... -4 455 -5 657 -281 ... 382 Mar ... 2 437 2 549 -1 217 ... 553
BANCO DE ESPAÑA 34* ECONOMIC BULLETIN, JULY-AUGUST 2015 ECONOMIC INDICATORS

2011 2012 2013 2014 20150
110
220
330
440
550
660
770
880
990
1100
0
110
220
330
440
550
660
770
880
990
1100bnbn
GENERAL GOVERNMENT
STATE
OTHER CENTRAL GOVERNMENT UNITS
REGIONAL (AUTONOMOUS) GOVERNMENTS
LOCAL GOVERNMENTS
SOCIAL SECURITY FUNDS
GENERAL GOVERNMENT DEBT ACCORDING TO THE EDP By sub-sector. Billions of euro
2011 2012 2013 2014 20150
110
220
330
440
550
660
770
880
990
1100
0
110
220
330
440
550
660
770
880
990
1100bnbn
SHORT-TERM SECURITIES
MEDIUM AND LONG-TERM SECURITIES
SHORT-TERM LOANS
LONG-TERM LOANS
CURRENCY AND DEPOSITS
GENERAL GOVERNMENT DEBT ACCORDING TO THE EDP By instrument. Billions of euro
P
P P P
P P P P P P P P P P P P
A A A
. Series depicted in chart.
. 1=(2 a 6)-7 . 2 3
. 4 . 5 6 7
. 8 . 9=10+11 10 11
. 12=13+14 13 14
6.2. GENERAL GOVERNMENT. DEBT ACCORDING TO THE EXCESSIVE DEFICIT PROCEDURE (EDP)
SOURCE: BE.
a. The most recent data to have been checked against those of the regional (autonomous) governments and the six largest municipalities correspond to September 2014.
b. Since July 2014, the debt (loans and securities) of the Fund for the Financing of Payments to Suppliers (FFPS) has been included in the debt of the State instead of in Other
Central Government Units, owing to the integration of the latter into the State. From January 2015, this indicator incorporates the effect of the creation of the Fund for the Financing
of Regional Governments and the Fund for the Financing of Local Governments, which are also included in the State and have assumed the outstanding amounts of FFPP and
FLA as at December 2014.
___________________________________________________________________________________________________________________________
EUR millions By government sector By instrument
Total Central Securities other government b) Debt than shares Loans held by Curren- Regional Local Social general cy Other (autono- govern- security gover- and State units mous) ments funds ment deposits Total Short- Long- Total Short- Long- govern- (consoli- term term term term ments dation) (a)
10 649 259 544 790 6 767 123 419 35 453 17 169 78 338 3 584 534 226 68 929 465 297 111 449 8 438 103 011 11 743 531 598 995 25 243 145 086 36 819 17 169 79 781 3 685 610 699 74 185 536 514 129 146 15 232 113 915 12 890 976 711 474 114 932 188 407 44 005 17 188 185 030 3 681 669 887 60 576 609 311 217 407 15 139 202 269 13 966 169 789 028 153 935 209 761 42 114 17 187 245 857 3 696 765 746 78 977 686 769 196 726 12 078 184 648
13 Oct 957 829 774 927 140 242 198 224 42 160 17 747 215 472 3 690 748 408 75 624 672 784 205 730 16 331 189 399 Nov 957 765 782 423 147 682 195 600 41 816 17 195 226 951 3 688 760 164 77 512 682 652 193 913 12 486 181 427 Dec 966 169 789 028 153 935 209 761 42 114 17 187 245 857 3 696 765 746 78 977 686 769 196 726 12 078 184 648
14 Jan 985 120 796 203 161 933 211 177 42 036 17 187 243 417 3 712 776 220 78 615 697 604 205 188 13 776 191 412 Feb 994 054 804 942 162 513 213 801 42 266 17 188 246 655 3 712 787 114 76 530 710 584 203 228 10 783 192 445 Mar 995 832 813 206 162 689 224 964 41 911 17 188 264 126 3 726 788 962 72 474 716 487 203 144 10 720 192 425 Apr 988 690 806 390 167 540 224 151 41 906 17 192 268 488 3 737 782 294 70 736 711 557 202 659 10 281 192 378 May 1 002 728 821 941 167 504 222 200 42 647 17 189 268 752 3 767 796 702 71 667 725 035 202 259 10 634 191 625 Jun 1 012 595 831 414 170 468 228 207 41 994 17 203 276 691 3 804 804 833 74 652 730 181 203 958 11 546 192 412 Jul 1 006 244 850 012 127 494 227 719 40 897 17 196 257 072 3 849 801 645 73 032 728 613 200 751 13 335 187 415 Aug 1 010 021 854 390 127 459 226 679 41 278 17 199 256 984 3 857 805 595 72 271 733 324 200 570 12 070 188 500 Sep 1 020 302 865 657 129 553 232 068 40 787 17 200 264 964 3 863 815 106 74 078 741 029 201 332 11 676 189 656 Oct 1 016 883 856 245 130 597 232 643 40 693 17 189 260 484 3 844 810 904 74 759 736 145 202 135 12 595 189 540 Nov 1 022 945 862 809 127 994 231 557 40 728 17 202 257 344 3 852 817 297 77 028 740 269 201 795 11 971 189 825 Dec 1 033 848 870 763 131 881 236 740 38 386 17 188 261 109 3 847 825 101 77 611 747 490 204 900 11 668 193 232
15 Jan 1 035 576 870 797 69 230 238 113 38 556 17 188 198 309 3 865 825 106 78 991 746 115 206 605 13 970 192 636 Feb 1 040 667 877 434 69 147 238 731 38 753 17 193 200 590 3 874 832 215 76 299 755 915 204 579 12 840 191 739 Mar 1 046 192 883 590 67 658 240 411 38 302 17 190 200 959 3 878 839 387 75 220 764 166 202 927 13 869 189 058
BANCO DE ESPAÑA 35* ECONOMIC BULLETIN, JULY-AUGUST 2015 ECONOMIC INDICATORS

2013 2014 2015-50
-40
-30
-20
-10
0
-50
-40
-30
-20
-10
0bn bn
Net lending or borrowing
Cash-basis deficit
STATE. NET LENDING OR BORROWING AND CASH-BASIS DEFICIT Lastest 12 months
2013 2014 20150
20
40
60
80
100
120
140
160
180
200
220
0
20
40
60
80
100
120
140
160
180
200
220bn bn
Total resources
VAT
Income and wealth taxes
Total uses
Interest
Current and capital transfer within general government
STATE. RESOURCES AND USES ACCORDING TO THE NATIONAL ACCOUNTS Lastest 12 months
P A
A A
A A A A A A A A A
A A A A
. Series depicted in chart.
. 1=2-8 . 2=3 a 7
. 3 4 5 . 6 7
. 8=9 a13 9 . 10
. 11 12 13 . 14=15-16 15 16
6.3. STATE RESOURCES AND USES ACCORDING TO THE NACIONAL ACCOUNTS. SPAIN
Source: Ministerio de Hacienda y Administraciones Públicas (IGAE).
___________________________________________________________________________________________________________________________
EUR millions Current and capital resources Current and capital uses Memorandum item: cash-basis deficit
Net Other Inter- Income Compen- Current Invest- Cash- Expendi- lending taxes est and sation and ca- ment Other basis ture (+) or Value on and wealth of pital grants deficit Revenue borro- added products other taxes emplo- Inter- trans- and wing Total tax and income Other Total yees est fers other (-) (VAT) imports on within capital pro- general trans- perty govern- fers ment
13 -45 321 169 504 55 441 22 765 9 878 62 213 19 207 214 825 18 250 28 690 125 752 1 326 40 807 -39 678 121 118 160 796 14 -39 660 174 521 57 395 22 425 10 233 63 543 20 925 214 181 18 023 30 359 122 709 2 939 40 151 -23 957 134 036 157 993
14 J-A -14 611 55 592 22 038 7 260 3 351 18 604 4 339 70 203 5 276 9 823 41 129 134 13 841 -15 101 41 528 56 629 15 J-A -11 984 57 837 23 974 7 421 1 969 19 686 4 787 69 821 5 385 9 871 40 345 254 13 966 -2 506 55 869 58 376
14 Apr -5 041 13 050 3 763 1 728 691 5 706 1 162 18 091 1 313 2 474 10 383 41 3 880 -730 13 440 14 170 May -11 505 6 003 2 830 1 895 452 -421 1 247 17 508 1 307 2 532 10 710 24 2 935 -3 308 7 654 10 961 Jun -440 18 988 7 452 1 797 589 6 863 2 287 19 428 2 374 2 478 10 672 146 3 758 -8 793 3 855 12 649 Jul -5 712 16 303 3 820 1 878 568 6 591 3 446 22 015 1 322 2 619 15 230 49 2 795 -335 20 242 20 577 Aug -2 825 11 403 2 569 1 681 552 5 285 1 316 14 228 1 285 2 607 8 003 12 2 321 424 8 739 8 315 Sep 2 495 18 240 7 888 2 075 827 5 799 1 651 15 745 1 329 2 503 9 550 87 2 276 -4 006 4 847 8 853 Oct 2 296 17 979 3 828 1 908 456 10 065 1 722 15 683 1 330 2 627 8 770 130 2 826 7 624 22 836 15 213 Nov -5 072 11 228 3 416 2 241 382 3 573 1 616 16 300 1 311 2 516 9 339 165 2 969 -3 002 7 448 10 450 Dec -4 286 18 785 3 554 1 690 3 056 7 184 3 301 23 071 2 489 2 654 9 306 2 192 6 430 2 541 16 886 14 345
15 Jan -6 557 10 862 4 923 1 896 253 2 633 1 157 17 419 1 453 2 582 10 571 126 2 687 -6 686 6 276 12 962 Feb -5 657 12 619 5 595 2 046 147 3 762 1 069 18 276 1 292 2 258 10 215 32 4 479 -2 659 17 369 20 028 Mar 2 549 20 312 9 443 1 477 1 117 6 919 1 356 17 763 1 344 2 581 10 020 2 3 816 1 167 11 241 10 073 Apr -2 319 14 044 4 013 2 002 452 6 372 1 205 16 363 1 296 2 450 9 539 94 2 984 5 671 20 984 15 312
BANCO DE ESPAÑA 36* ECONOMIC BULLETIN, JULY-AUGUST 2015 ECONOMIC INDICATORS

2013 2014 2015-10
0
10
20
30
40
50
60
70
80
90
100
110
120
130
140
150
-10
0
10
20
30
40
50
60
70
80
90
100
110
120
130
140
150bn bn
NET INCURRENCE OF LIABILITIES
SHORT-TERM DEBT SECURITIES
LONG-TERM DEBT SECURITIES
OTHER MARKETABLE LIABILITIES
STATE. NET INCURRENCE OF LIABILITIES. BY INSTRUMENT Lastest 12 months
2013 2014 2015-80
-60
-40
-20
0
20
40
60
80
100
120
140
160
-80
-60
-40
-20
0
20
40
60
80
100
120
140
160bn bn
NET INCURRENCE OF LIABILITIES
HELD BY MONETARY FINANCIAL INSTITUTIONS
HELD BY OTHER RESIDENT SECTORS
HELD BY THE REST OF THE WORLD
STATE. NET INCURRENCE OF LIABILITIES. BY COUNTERPART SECTOR Lastest 12 months
P A
. Series depicted in chart.
1 2 3 . 4 5
. 6 . 7 8
. 9 10 11 . 12
. 13 . 14 15
6.4. STATE FINANCIAL TRANSACTIONS. SPAIN
___________________________________________________________________________________________________________________________
EUR millions Net acquisition Net incurrence of liabilities Net of financial incurren- assets ce of Of which By instrument By counterpart sector liabili-
Net ties lending (exclu- (+) or Of which In cur- Short- Long- Banco Other Other Held by resident sectors Rest ding net rencies term term de marketa- accounts of the other borro- other debt debt España ble payable world accounts wing(-) Deposits than the securi- securi- loans liabili- payable) at the Total peseta/ ties ties ties Monetary Other Banco euro (a) (b) Total financial resident de institu- sectors Total España tions
13 -45 321 35 678 -2 400 80 999 -34 18 293 55 694 -876 8 014 -127 25 886 9 546 16 340 55 113 81 125 14 -39 660 25 210 -91 64 870 240 -1 806 63 406 -946 131 4 085 33 154 21 290 11 864 31 715 60 785
A A
A A A A A A A A A
A A A A
Source: BE.
a. Including Treasury Bills with a maturity of more than one year..
b. Includes other loans, non-negotiable securities, coined money and Caja General de Depósitos (General Deposit Fund).
14 J-A -14 611 -4 240 0 10 371 -10 -5 905 20 884 -946 1 502 -5 164 8 220 13 220 -5 000 2 150 15 535 15 J-A -11 984 -10 214 0 1 770 -11 1 664 8 585 -970 -2 873 -4 636 -12 800 -20 626 2 559 25 393 6 406
14 Apr -5 041 -12 391 2 -7 350 -15 -1 585 -8 153 -946 966 2 368 -6 480 -72 -6 408 -870 -9 718 May -11 505 9 442 -0 20 947 2 865 17 947 - 34 2 101 11 874 2 912 8 962 9 073 18 846 Jun -440 12 845 -89 13 285 2 -143 12 498 - 6 923 -5 182 -184 -4 998 18 467 12 362 Jul -5 712 -16 756 0 -11 044 2 -53 -10 612 - -2 545 2 167 3 048 -9 678 12 726 -14 092 -13 210 Aug -2 825 4 435 -2 7 260 2 318 6 086 - 336 519 5 376 16 732 -11 356 1 884 6 741 Sep 2 495 12 224 0 9 729 2 2 296 11 509 - -20 -4 057 9 450 8 970 480 279 13 786 Oct 2 296 -11 761 0 -14 057 -3 -170 -13 400 - 38 -525 -10 791 -5 443 -5 347 -3 267 -13 532 Nov -5 072 7 308 0 12 380 241 400 8 633 - 305 3 042 -2 103 -5 278 3 175 14 483 9 338 Dec -4 286 11 713 -1 15 999 2 585 9 861 - 474 5 079 13 261 38 13 223 2 738 10 920
15 Jan -6 557 15 347 5 990 21 904 2 1 405 -4 838 - 11 25 326 -2 968 -11 801 8 833 24 872 -3 422 Feb -5 657 -25 771 -5 989 -20 114 2 -32 12 562 - -1 381 -31 262 -18 011 -8 969 -9 042 -2 103 11 148 Mar 2 549 13 352 -0 10 803 2 -348 12 779 - -1 517 -110 8 179 5 411 2 768 2 624 10 913 Apr -2 319 -13 142 -1 -10 823 -17 640 -11 918 -970 15 1 410 ... -5 267 ... ... -12 234
BANCO DE ESPAÑA 37* ECONOMIC BULLETIN, JULY-AUGUST 2015 ECONOMIC INDICATORS

2010 2011 2012 2013 2014 20150
90
180
270
360
450
540
630
720
810
900
0
90
180
270
360
450
540
630
720
810
900bn bn
STATE DEBT
SHORT-TERM DEBT SECURITIES
LONG-TERM DEBT SECURITIES
BANCO DE ESPAÑA LOANS
OTHER MARKETABLE LIABILITIES
STATE. LIABILITIES OUTSTANDING By instrument. Billions of euro
2010 2011 2012 2013 2014 20150
90
180
270
360
450
540
630
720
810
900
0
90
180
270
360
450
540
630
720
810
900bn bn
STATE DEBT
OTHER RESIDENT SECTORS
REST OF THE WORLD
GENERAL GOVERNMENT
STATE. LIABILITIES OUTSTANDING By counterpart sector. Billions of euro
P
P P P P P P P P P
A A A A
. Series depicted in chart.
. 1 2 . 3
. 4 . 5
. 6 7 . 8
. 9 . 10 11 12 13 14 15
6.5. STATE. LIABILITIES OUTSTANDING ACCORDING TO THE METHODOLOGY OF EXCESSIVE DEFICIT PROCEDURE. SPAIN
SOURCE: BE.
a. Included from July 2014 is the debt (loans and securities) of the Fund for the Financing of Payments to Suppliers, which was integrated into the State as from that date.
b. Including Treasury Bills with a maturity of more than one year.
c. Includes loans from European Stability Mechanism (ESM), other loans, non-negotiable securities and coined money.
d. European Financial Stability Facility.
___________________________________________________________________________________________________________________________
EUR millions
Liabilities outstanding according to the methodology Memorandum item: of the Excessive Deficit Procedure (PDE) (a)
Of which: By instruments By counterpart sector Sureties granted Deposits at the Banco Of which:
Total In Short- Long- Banco Other Held by resident sectors Rest de España curren- term term de marke- of the including cies debt debt España table world Treasury other securi- securi- loans liabi- liquidity Total to other to to than ties ties lities Total General Other tenders General FEEF credit euro (b) (c) Govern- resident Govern- (d) ins- ment sectors ment titu- units tions
10 544 790 0 70 484 463 580 4 082 6 644 302 636 61 170 241 466 242 154 28 898 73 560 6 000 - 59 506 11 598 995 0 68 639 517 630 3 499 9 228 391 375 62 613 328 763 207 620 30 616 99 748 23 851 2 993 64 659 12 711 474 0 62 627 581 314 2 915 64 619 427 727 67 328 360 399 283 748 35 000 168 165 26 608 30 820 68 399 13 789 028 240 80 045 634 407 1 943 72 633 435 741 57 387 378 354 353 287 20 284 165 358 31 954 35 145 46 607
14 Apr 806 390 243 73 962 657 320 972 74 136 462 992 57 955 405 037 343 398 18 659 143 736 28 299 35 693 30 583 May 821 941 246 74 808 671 991 972 74 170 468 098 58 219 409 879 353 842 29 627 143 645 28 299 36 307 29 962 Jun 831 414 250 74 640 681 627 972 74 176 460 705 59 291 401 413 370 709 29 705 143 761 28 299 36 922 29 512 Jul 850 012 252 74 561 693 049 972 81 430 487 877 55 250 432 627 362 135 19 264 143 802 28 299 38 516 28 273 Aug 854 390 251 74 850 696 802 972 81 766 490 269 55 161 435 108 364 121 22 340 133 844 28 299 38 516 18 373 Sep 865 657 257 77 129 705 810 972 81 746 499 858 55 466 444 392 365 798 27 997 132 659 28 299 38 516 17 473 Oct 856 245 255 76 949 696 540 972 81 784 498 297 49 986 448 311 357 947 24 080 126 984 28 299 38 516 11 935 Nov 862 809 251 77 344 702 404 972 82 089 489 510 46 146 443 364 373 298 30 865 121 406 25 009 38 823 9 486 Dec 870 763 257 77 926 709 307 972 82 558 486 732 45 135 441 597 384 031 29 125 120 483 24 809 39 127 8 662
15 Jan 870 797 266 79 321 707 931 972 82 574 465 827 45 135 420 692 404 970 47 857 119 535 24 809 39 742 7 310 Feb 877 434 275 78 436 716 834 972 81 192 483 206 47 416 435 789 394 228 34 497 118 472 24 809 39 435 6 641 Mar 883 590 275 77 345 725 598 972 79 675 484 040 47 088 436 952 399 550 39 954 116 334 24 809 39 435 5 966 Apr 873 149 275 77 409 716 051 - 79 690 ... 47 333 ... ... 25 104 116 322 25 329 40 049 4 854
BANCO DE ESPAÑA 38* ECONOMIC BULLETIN, JULY-AUGUST 2015 ECONOMIC INDICATORS

-18
-16
-14
-12
-10
-8
-6
-4
-2
0
2
-18
-16
-14
-12
-10
-8
-6
-4
-2
0
2bn bn
JanuaryFebruary
MarchApril
MayJune
JulyAugust
SeptemberOctober
NovemberDecember
January to December 2013 cumulative
January to December 2014 cumulative
January to March 2015 cumulative
NET LENDING (+)/NET BORROWING (-) OF THE REGIONAL (AUTONOMOUS) GOVERNMENTS Cumulative data from January
A A
1 2 3 4 5 6 7 8 9 10 11 12 13 14 15 16 17 18
6.6. REGIONAL (AUTONOMOUS) GOVERNMENTS. NET LENDING (+)/NET BORROWING (-)
___________________________________________________________________________________________________________________________
EUR millions
Total Anda- Aragón Princ. Illes Cana- Canta- Cas- Cas- Cata- Extre- Gali- La Comun. Región Comun. País Comun. lucía de Balears rias bria tilla- tilla luña madura cia Rioja de de Foral Vasco Valen- Astu- La y Madrid Murcia Nava- ciana rias Mancha León rra
13 -15 932 -2 151 -718 -224 -324 -412 -151 -770 -633 -3 860 -147 -626 -81 -1 838 -851 -257 -739 -2 150 14 -17 541 -1 645 -551 -278 -458 -379 -179 -666 -601 -5 152 -421 -557 -95 -2 648 -766 -133 -642 -2 370
A A A A
14 Q1 -2 855 -640 -138 7 7 -8 -28 -135 -111 -918 -130 -128 -28 -655 -97 98 15 34 Q2 -7 644 -1 255 -171 -148 -146 -143 -87 -279 -366 -1 709 -251 -346 -42 -1 122 -288 -198 -305 -788 Q3 -505 -132 50 71 10 74 51 46 144 -435 73 142 6 -183 -86 11 90 -437 Q4 -6 537 382 -292 -208 -329 -302 -115 -298 -268 -2 090 -113 -225 -31 -688 -295 -44 -442 -1 179
A A
A A A A A A A A
A A A
SOURCE: Ministerio de Hacienda y Administraciones Públicas (IGAE).
14 J-M -2 855 -640 -138 7 7 -8 -28 -135 -111 -918 -130 -128 -28 -655 -97 98 15 34 15 J-M -2 190 -565 -88 11 -60 19 -31 -149 -122 -585 -34 -76 25 -429 -148 46 146 -150
14 May -1 489 -294 -33 -34 -34 51 -28 -24 -47 -341 -53 -40 -11 -238 -72 -147 -95 -49 Jun -4 293 -759 -110 -107 -93 -29 -53 -189 -272 -825 -137 -198 -31 -617 -141 -69 -161 -502 Jul 1 566 232 109 108 171 139 52 79 174 172 79 228 15 50 24 -63 -72 69 Aug -499 -26 -39 -7 -44 -18 -1 -10 -13 -184 -38 -30 -4 -9 -43 81 101 -215 Sep -1 572 -338 -20 -30 -117 -47 - -23 -17 -423 32 -56 -5 -224 -67 -7 61 -291 Oct -1 743 -377 -68 -35 -74 40 -28 -76 -124 -459 -38 -27 -1 -231 -92 160 -56 -257 Nov -468 228 -53 1 -76 -54 -10 - 20 -342 -20 -96 -6 -256 -85 -124 696 -291 Dec -4 326 531 -171 -174 -179 -288 -77 -222 -164 -1 289 -55 -102 -24 -201 -118 -80 -1 082 -631
15 Jan -692 -213 -39 8 15 - -22 -59 - -78 -34 68 51 -191 -34 41 -11 -194 Feb -281 -25 -14 22 -36 -35 -12 -13 -95 -181 -36 -36 -7 -122 -13 106 131 85 Mar -1 217 -327 -35 -19 -39 54 3 -77 -27 -326 36 -108 -19 -116 -101 -101 26 -41
BANCO DE ESPAÑA 39* ECONOMIC BULLETIN, JULY-AUGUST 2015 ECONOMIC INDICATORS
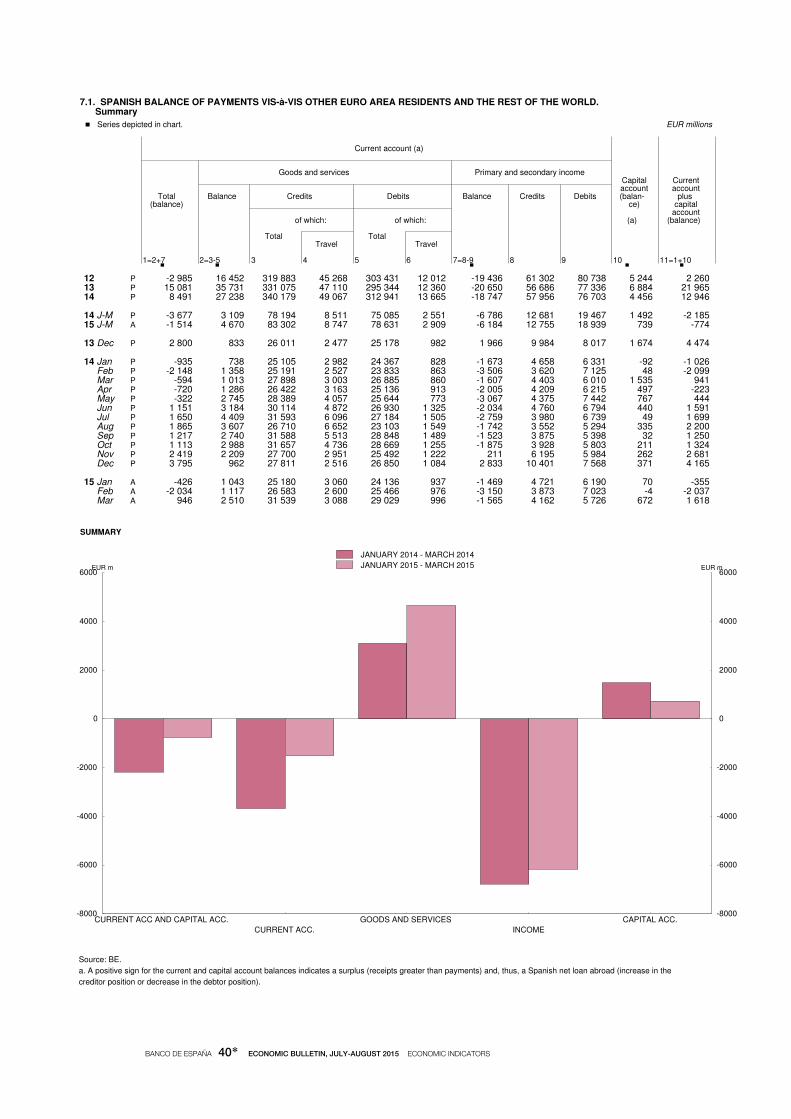
CURRENT ACC AND CAPITAL ACC. GOODS AND SERVICES CAPITAL ACC.
CURRENT ACC. INCOME
-8000
-6000
-4000
-2000
0
2000
4000
6000
-8000
-6000
-4000
-2000
0
2000
4000
6000EUR mEUR m
JANUARY 2014 - MARCH 2014
JANUARY 2015 - MARCH 2015
SUMMARY
P P P
P A
P
P P P P P P P P P P P P
A A A
. Series depicted in chart.
. 1=2+7 . 2=3-5 3 4 5 6
. 7=8-9 8 9 . 10
. 11=1+10
7.1. SPANISH BALANCE OF PAYMENTS VIS-à-VIS OTHER EURO AREA RESIDENTS AND THE REST OF THE WORLD. Summary
Source: BE.
a. A positive sign for the current and capital account balances indicates a surplus (receipts greater than payments) and, thus, a Spanish net loan abroad (increase in the
creditor position or decrease in the debtor position).
___________________________________________________________________________________________________________________________
EUR millions
Current account (a) Goods and services Primary and secondary income Capital Current account account
Total Balance Credits Debits Balance Credits Debits (balan- plus (balance) ce) capital
account of which: of which: (a) (balance) Total Total Travel Travel
12 -2 985 16 452 319 883 45 268 303 431 12 012 -19 436 61 302 80 738 5 244 2 260 13 15 081 35 731 331 075 47 110 295 344 12 360 -20 650 56 686 77 336 6 884 21 965 14 8 491 27 238 340 179 49 067 312 941 13 665 -18 747 57 956 76 703 4 456 12 946
14 J-M -3 677 3 109 78 194 8 511 75 085 2 551 -6 786 12 681 19 467 1 492 -2 185 15 J-M -1 514 4 670 83 302 8 747 78 631 2 909 -6 184 12 755 18 939 739 -774
13 Dec 2 800 833 26 011 2 477 25 178 982 1 966 9 984 8 017 1 674 4 474
14 Jan -935 738 25 105 2 982 24 367 828 -1 673 4 658 6 331 -92 -1 026 Feb -2 148 1 358 25 191 2 527 23 833 863 -3 506 3 620 7 125 48 -2 099 Mar -594 1 013 27 898 3 003 26 885 860 -1 607 4 403 6 010 1 535 941 Apr -720 1 286 26 422 3 163 25 136 913 -2 005 4 209 6 215 497 -223 May -322 2 745 28 389 4 057 25 644 773 -3 067 4 375 7 442 767 444 Jun 1 151 3 184 30 114 4 872 26 930 1 325 -2 034 4 760 6 794 440 1 591 Jul 1 650 4 409 31 593 6 096 27 184 1 505 -2 759 3 980 6 739 49 1 699 Aug 1 865 3 607 26 710 6 652 23 103 1 549 -1 742 3 552 5 294 335 2 200 Sep 1 217 2 740 31 588 5 513 28 848 1 489 -1 523 3 875 5 398 32 1 250 Oct 1 113 2 988 31 657 4 736 28 669 1 255 -1 875 3 928 5 803 211 1 324 Nov 2 419 2 209 27 700 2 951 25 492 1 222 211 6 195 5 984 262 2 681 Dec 3 795 962 27 811 2 516 26 850 1 084 2 833 10 401 7 568 371 4 165
15 Jan -426 1 043 25 180 3 060 24 136 937 -1 469 4 721 6 190 70 -355 Feb -2 034 1 117 26 583 2 600 25 466 976 -3 150 3 873 7 023 -4 -2 037 Mar 946 2 510 31 539 3 088 29 029 996 -1 565 4 162 5 726 672 1 618
BANCO DE ESPAÑA 40* ECONOMIC BULLETIN, JULY-AUGUST 2015 ECONOMIC INDICATORS

TOTAL BANCO DE ESPAÑA
TOTAL EXCL. B.E.
-16000
-12000
-8000
-4000
0
4000
8000
12000
16000
-16000
-12000
-8000
-4000
0
4000
8000
12000
16000EUR mEUR m
JANUARY 2014 - MARCH 2014
JANUARY 2015 - MARCH 2015
FINANCIAL ACCOUNT (NCA-NCL)
DIRECT INV. OTHER INV.
PORT.INV. FIN.DERIVATIVES
-16000
-12000
-8000
-4000
0
4000
8000
12000
16000
-16000
-12000
-8000
-4000
0
4000
8000
12000
16000EUR mEUR m
JANUARY 2014 - MARCH 2014
JANUARY 2015 - MARCH 2015
FINANCIAL ACCOUNT, EXCLUDING BANCO DE ESPAÑA. Breakdown. (NCA-NCL)
P P P
P A
P
P P P P P P P P P P P P
A A A
. Series depicted in chart.
. 2+13 . 9+12
. 3=4-5 4 5 . 6=7-8 7 8
. 9=10-11 10 11 . 12
. 15+16 14 15 16
7.2. SPANISH BALANCE OF PAYMENTS VIS-à-VIS OTHER EURO AREA RESIDENTS AND THE REST OF THE WORLD. FINANCIAL ACCOUNT
Sources: BE.
a. Mainly, loans, deposits and repos.
b. A positive (negative) sign indicates an increase (decrease) in the reserves and/or claims of the BE with the Eurosystem and/or other assets and liabilities fo the BE.
___________________________________________________________________________________________________________________________
EUR millions Total, excluding Banco de España Banco de España
Financial Direct investment Portfolio investment Other investment (a) Net account finan- Net
Total cial Total Reser- position Other deriva- ves with Balance Balance Balance tives Euro-
(NCA- (NCA- (NCA- NCA NCL (NCA- NCA NCL (NCA- NCA NCL (NCA- (NCA- system NCL) NCL) NCL) NCL) NCL) NCL) NCL) (b)
1= 2=3+6+ 13=14+
12 149 173 665 -23 099 -3 908 19 191 55 403 3 758 -51 645 149 710 44 866 -104 844 -8 349 -173 516 2 211 -162 366 -13 361 13 40 583 -73 599 -11 979 19 453 31 432 -34 853 -6 283 28 571 -27 807 -55 854 -28 047 1 039 114 182 535 123 660 -10 012 14 32 581 8 246 5 867 23 131 17 264 8 068 51 447 43 380 -7 319 383 7 702 1 630 24 335 3 891 23 819 -3 375
14 J-M 1 582 14 508 4 108 12 863 8 755 15 960 19 661 3 701 -5 762 -2 215 3 547 202 -12 926 -37 -13 365 476 15 J-M -362 14 933 -903 6 388 7 291 11 224 38 325 27 102 5 502 6 052 550 -889 -15 295 4 658 -22 511 2 558
13 Dec 12 847 -14 056 1 411 1 888 477 -18 681 -631 18 049 2 017 1 474 -542 1 197 26 903 -20 27 571 -648
14 Jan -1 198 5 813 -116 4 054 4 170 10 664 8 314 -2 350 -4 602 -3 189 1 412 -134 -7 011 37 -7 411 363 Feb -1 339 9 570 4 300 5 195 895 7 158 4 732 -2 425 -1 735 -4 991 -3 256 -153 -10 909 -101 -11 002 194 Mar 4 118 -875 -76 3 614 3 690 -1 862 6 614 8 477 575 5 965 5 390 489 4 993 26 5 049 -82 Apr 2 760 7 212 -2 554 -216 2 338 13 086 8 305 -4 782 -3 269 2 646 5 915 -51 -4 451 103 -3 472 -1 082 May -2 435 -7 454 -1 248 815 2 064 -14 919 -1 337 13 582 9 183 12 975 3 792 -469 5 019 -80 5 684 -585 Jun 13 443 -1 290 4 158 6 581 2 424 -22 672 -1 320 21 352 16 821 8 074 -8 747 405 14 733 96 15 367 -730 Jul -329 7 322 -9 475 -1 474 8 001 23 043 3 985 -19 058 -6 402 -2 285 4 117 157 -7 652 45 -6 967 -730 Aug 2 302 -376 -4 230 1 420 5 650 10 366 10 782 416 -6 540 -15 452 -8 912 27 2 679 -8 3 135 -449 Sep -1 828 -3 195 6 025 2 081 -3 944 -1 077 2 841 3 918 -8 024 9 607 17 631 -119 1 367 40 1 648 -322 Oct 13 023 4 403 2 077 3 073 997 20 556 8 143 -12 413 -19 051 -3 241 15 810 821 8 620 30 10 184 -1 594 Nov 10 918 -1 358 3 877 4 168 291 -7 183 8 806 15 988 1 610 13 480 11 870 338 12 276 2 634 9 195 447 Dec -6 855 -11 525 3 130 -6 182 -9 312 -29 092 -8 417 20 675 14 116 -23 207 -37 323 320 4 670 1 067 2 409 1 194
15 Jan -6 615 -5 250 313 3 172 2 859 -19 216 8 336 27 552 13 707 3 706 -10 001 -54 -1 365 -109 -2 052 796 Feb 3 490 827 384 347 -37 8 506 12 320 3 814 -8 545 -2 732 5 813 482 2 663 2 597 -500 565 Mar 2 763 19 357 -1 600 2 869 4 469 21 933 17 670 -4 264 341 5 078 4 738 -1 317 -16 594 2 170 -19 960 1 197
BANCO DE ESPAÑA 41* ECONOMIC BULLETIN, JULY-AUGUST 2015 ECONOMIC INDICATORS

2000 2002 2004 2006 2008 2010 2012 2014-6
-4
-2
0
2
4
6
8
10
12
14
-6
-4
-2
0
2
4
6
8
10
12
14%%
TOTAL
CONSUMER
CAPITAL
INTERMEDIATE
BY PRODUCT Annual percentage changes (trend obtained with TRAMO-SEATS method)
2000 2002 2004 2006 2008 2010 2012 2014-10
0
10
20
30
-10
0
10
20
30%%
OECD
EURO AREA
UNITED STATES
NEWLY INDUSTR. COUNTRIES
BY GEOGRAPHICAL AREA Annual percentage changes (trend obtained with TRAMO-SEATS method)
. Series depicted in chart.
1 2 . 3
. 4 . 5
. 6 7 8 9 . 10
. 11 . 12 13 14 15
. 16
7.3. SPANISH FOREIGN TRADE WITH OTHER EURO AREA COUNTRIES AND WITH THE REST OF THE WORLD EXPORTS AND DISPATCHES
___________________________________________________________________________________________________________________________
Eur millions and annual percentage changes
Total By product (deflated data) (a) By geographical area (nominal data) Intermediate EU 28 OECD Newly
EUR Nom- De- Con- Other industri- millions inal flated sumer Capital Amer- alised (a) Total Energy Non- of which: OPEC ican China coun- energy Euro coun- tries Total Area Total tries United States
07 185 023 8.6 5.8 3.0 4.4 8.1 6.6 8.1 8.0 8.6 7.1 -1.1 22.3 -12.7 23.5 -0.8 08 189 228 2.3 0.7 2.4 -5.6 0.6 19.0 -0.6 -0.1 -0.5 -0.4 1.4 30.1 0.5 1.2 4.2 09 159 890 -15.5 -9.4 -3.4 -14.1 -12.8 -19.9 -12.2 -15.5 -13.3 -15.1 -24.4 -11.4 -18.2 -7.7 8.5 10 186 780 16.8 15.0 -3.4 22.4 28.6 15.4 29.6 14.3 13.6 15.2 15.5 9.6 36.1 34.1 27.0 11 215 230 15.2 10.0 6.8 17.9 10.7 12.1 11.4 12.7 9.6 13.6 20.0 26.2 19.1 27.2 1.3 12 226 115 5.1 3.0 -2.6 -8.2 7.9 27.0 6.0 0.5 -0.6 2.3 14.0 24.4 13.8 11.7 29.9 13 235 814 4.3 4.5 5.8 15.8 2.2 0.1 2.4 3.1 2.4 2.5 -2.9 13.2 20.6 4.2 -1.7
P 14 ... ... 3.5 5.5 9.9 1.6 9.1 1.1 4.0 4.0 4.4 23.4 -4.5 -6.2 4.9 46.4
P P P P P P P P P P P
P P P
Sources: ME, MHAP y BE.
Note: The underlying series for this indicator are in Tables 18.4 and 18.5 of the Boletín estadístico.
The monthly series are provisional data, while the annual series are the final foreign trade data.
a. Series deflated by unit value indices.
14 Feb 19 325 4.9 5.2 7.0 17.0 2.5 2.2 2.5 7.0 5.6 7.9 32.4 -18.3 4.1 1.7 3.9 Mar 20 633 1.7 -1.1 5.8 12.9 -6.7 -5.6 -6.8 11.3 11.4 9.8 8.7 -24.7 7.2 -14.7 37.5 Apr 19 645 -3.7 -2.1 -1.8 -16.2 0.3 -10.7 1.1 -3.1 -2.9 -3.7 -3.4 35.3 -19.7 -14.3 43.9 May 20 626 -1.3 -2.5 3.9 10.3 -7.8 -25.5 -6.2 -0.5 0.9 -0.1 15.3 -1.9 -13.4 -1.8 44.4 Jun 20 601 -1.2 1.5 3.1 1.8 0.6 3.7 0.4 -2.9 -1.1 -1.1 18.3 -16.8 -13.7 16.3 30.6 Jul 21 585 8.7 10.6 16.0 33.0 4.4 21.8 3.2 16.8 16.1 14.0 28.3 -23.9 -6.3 -0.3 63.2 Aug 16 342 -5.1 -1.0 -1.8 -11.8 0.9 19.1 -0.7 -3.8 -3.9 -2.3 17.2 -20.3 -23.3 -17.3 57.5 Sep 21 199 9.6 8.1 9.2 39.0 3.2 38.7 0.8 9.6 8.9 11.8 28.9 17.8 -6.9 41.4 56.4 Oct 22 347 4.1 6.6 3.9 16.4 6.7 7.9 6.6 2.4 3.1 4.0 37.8 6.9 -9.4 -5.4 117.7 Nov 19 944 3.2 4.5 7.8 -6.1 4.3 -5.7 5.1 0.8 0.2 2.8 53.5 15.3 -8.9 9.9 21.6 Dec 19 353 5.7 7.2 11.0 2.4 5.7 50.4 2.8 4.9 4.1 3.6 36.3 15.3 12.6 16.3 34.2
15 Jan 17 895 -2.9 -3.0 8.4 -19.6 -7.4 -15.7 -6.8 0.2 -1.4 -0.2 13.1 -6.4 -4.6 -24.5 -28.2 Feb 19 860 2.8 1.5 8.2 1.4 -2.8 -3.0 -2.8 5.1 7.1 6.6 5.2 -18.9 -4.9 2.5 10.1 Mar 23 218 12.5 11.8 20.1 6.5 7.5 -26.3 10.0 11.4 9.8 12.1 2.8 44.3 22.4 33.6 7.1
BANCO DE ESPAÑA 42* ECONOMIC BULLETIN, JULY-AUGUST 2015 ECONOMIC INDICATORS

2000 2002 2004 2006 2008 2010 2012 2014-20
-10
0
10
20
-20
-10
0
10
20%%
TOTAL
CONSUMER
CAPITAL
INTERMEDIATE
BY PRODUCTS Annual percentage changes (trend obtained with TRAMO SEATS method)
2000 2002 2004 2006 2008 2010 2012 2014-30
-20
-10
0
10
20
-30
-20
-10
0
10
20%%
OECD
EURO AREA
UNITED STATES
NEWLY INDUSTR. COUNTRIES
BY GEOGRAPHICAL AREA Annual percentage changes (trend obtained with TRAMO-SEATS method)
. Series depicted in chart.
1 2 . 3
. 4 . 5
. 6 7 8 9 . 10
. 11 . 12 13 14 15
. 16
7.4. SPANISH FOREIGN TRADE WITH OTHER EURO AREA COUNTRIES AND WITH THE REST OF THE WORLD IMPORTS AND ARRIVALS
___________________________________________________________________________________________________________________________
Eur millions and annual percentage changes
Total By product (deflated data) (a) By geographical area (nominal data) Intermediate EU 28 OECD Newly
EUR Nom- De- Con- Other industri- millions inal flated sumer Capital Amer- alised (a) Total Energy Non- of which: OPEC ican China coun- energy Euro coun- tries Total Area Total tries United States
07 285 038 8.5 7.6 5.8 10.8 7.8 4.0 8.9 10.5 11.0 9.7 16.4 -6.3 -7.1 28.7 -3.7 08 283 388 -0.6 -4.5 -6.4 -14.3 -1.9 5.8 -3.9 -8.2 -8.5 -7.3 12.9 37.4 16.2 10.8 -16.1 09 206 116 -27.3 -17.5 -12.1 -31.4 -17.5 -9.9 -20.0 -23.8 -25.6 -24.6 -25.1 -38.6 -31.6 -29.5 -31.6 10 240 056 16.5 11.3 -4.1 9.0 19.0 3.3 24.5 9.8 7.9 10.5 14.2 36.0 46.3 30.8 7.1 11 263 141 9.6 1.1 -3.0 -4.6 3.2 1.8 3.6 5.9 6.3 6.6 12.6 20.1 21.3 -1.1 -2.8 12 257 946 -2.0 -6.3 -8.2 -7.9 -5.5 0.2 -7.0 -5.8 -5.8 -4.7 -9.1 15.0 9.2 -4.8 -12.4 13 252 347 -2.2 2.2 0.8 13.1 1.7 0.8 1.8 -0.3 -0.6 -0.3 4.7 -7.7 -16.6 -2.2 0.7
P 14 264 507 5.8 8.4 12.4 19.7 6.2 4.3 6.9 9.5 9.2 8.0 2.5 -2.3 -2.8 13.7 3.6
P P P P P P P P P P P
P P P
Sources: ME, MHAP y BE.
Note: The underlying series for this indicator are in Tables 18.2 and 18.3 of the Boletín estadístico.
The monthly series are provisional data, while the annual series are the final foreign trade data.
a. Series deflated by unit value indices .
14 Feb 20 948 6.9 10.6 19.9 28.3 6.4 8.1 5.9 8.1 8.0 7.1 20.4 -7.8 19.6 13.7 33.5 Mar 22 686 15.4 21.4 26.0 59.2 17.0 26.2 14.2 22.3 23.4 19.1 9.7 1.6 -19.6 9.5 1.2 Apr 21 800 -1.1 -1.4 8.1 11.9 -5.2 -12.5 -2.9 7.4 7.0 2.0 -23.9 -16.2 11.9 6.4 -24.4 May 22 383 7.0 6.2 13.7 25.5 2.4 -4.2 4.4 8.3 8.8 7.2 10.3 1.1 5.4 12.9 -9.1 Jun 22 078 5.4 7.7 11.6 15.4 5.6 -0.3 7.3 7.4 8.3 4.4 13.7 -9.3 23.0 21.7 -1.1 Jul 23 411 13.4 14.9 20.2 30.9 11.9 1.4 15.2 22.2 20.4 20.0 7.3 -0.4 -21.1 15.1 16.0 Aug 19 114 0.5 2.2 2.9 -1.0 2.1 4.3 1.3 -2.2 0.5 -2.3 4.6 1.6 -1.8 10.0 -7.6 Sep 23 573 7.5 11.5 13.9 25.8 9.3 5.8 10.3 8.9 7.6 10.6 22.7 -3.4 -0.2 20.3 11.5 Oct 24 587 7.7 9.9 5.0 10.6 11.5 15.5 10.3 10.1 8.3 6.7 -15.9 22.2 -2.4 16.0 20.2 Nov 21 500 2.0 4.3 4.7 2.2 4.4 0.3 5.6 4.4 2.6 3.0 -13.1 -6.4 -3.1 15.2 3.2 Dec 21 174 5.1 7.0 6.3 16.3 6.2 10.5 4.9 8.2 7.9 8.0 -20.8 10.3 -16.3 18.7 -7.1
15 Jan 20 491 -3.6 -0.8 -1.3 23.2 -2.6 -15.7 1.3 3.8 2.6 -1.1 -10.4 -27.1 -17.6 12.7 2.0 Feb 21 897 4.5 6.8 7.7 29.4 4.3 -4.8 7.0 12.9 12.5 11.4 16.7 -27.6 -2.3 24.1 16.0 Mar 24 109 6.3 5.6 12.0 3.4 3.7 -17.7 10.7 8.1 4.9 12.2 48.2 -30.1 19.6 51.2 23.1
BANCO DE ESPAÑA 43* ECONOMIC BULLETIN, JULY-AUGUST 2015 ECONOMIC INDICATORS

TOTAL USA OPEC EU 28 EURO AREA FRANCE
OECD JAPAN CHINA UNITED KINGDOM GERMANY ITALY
-7000
-6000
-5000
-4000
-3000
-2000
-1000
0
1000
2000
3000
4000
-7000
-6000
-5000
-4000
-3000
-2000
-1000
0
1000
2000
3000
4000EUR mEUR m
JANUARY 2014 - MARCH 2014
JANUARY 2015 - MARCH 2015
CUMULATIVE TRADE BALANCE
1 2=3+7 3 4 5 6 7 8 9 10 11 12 13 14 15
7.5. SPANISH FOREIGN TRADE WITH OTHER EURO AREA COUNTRIES AND WITH THE REST OF THE WORLD. TRADE BALANCE. GEOGRAPHICAL DISTRIBUTION
___________________________________________________________________________________________________________________________
EUR millions European Union (EU 28) OECD Euro area Other EU 28 Of which: Other Newly
World American indus- total Total OPEC coun- China trialised tries countries Of which: Of which: Total United Japan Total Total States Germany France Italy United Kingdom
08 -94 160 -26 033 -26 162 -19 612 3 019 -6 608 129 356 -39 729 -3 739 -3 663 -20 561 -4 774 -18 340 -3 296 09 -46 227 -8 922 -6 540 -9 980 6 787 -1 847 -2 382 187 -15 708 -2 742 -1 958 -10 701 -2 497 -12 471 -1 532 10 -53 276 -4 816 -1 886 -8 598 7 904 -477 -2 929 597 -11 261 -3 058 -2 054 -16 216 -4 130 -16 253 -1 252 11 -47 910 3 559 1 387 -8 984 8 590 219 2 172 2 955 -1 751 -2 956 -1 389 -19 066 -5 152 -15 317 -1 116 12 -31 831 12 203 7 306 -4 118 9 222 656 4 897 3 778 9 933 -858 -859 -21 120 -5 281 -14 023 83 13 -16 533 17 058 10 573 -4 360 10 639 1 563 6 485 6 134 14 760 -1 575 -183 -17 248 -1 184 -13 470 6
P 14 -24 472 11 223 6 338 -7 085 8 642 1 704 4 885 5 454 10 299 332 -21 -17 278 -1 228 -15 686 1 395
P P P P P P P P P P P
P P P
Source: MHAP.
Note: The underlying series for this indicator are in Tables 18.3 and 18.5 of the Boletín Estadístico.
The monthly series are provisional data, while the annual series are the final foreign trade data.
14 Feb -1 622 1 493 809 -474 788 125 683 815 1 311 -93 6 -1 405 44 -1 212 38 Mar -2 054 852 383 -480 756 115 470 548 961 99 -25 -1 539 63 -1 060 58 Apr -2 155 387 75 -576 330 -1 312 380 576 58 -19 -1 053 -200 -1 028 131 May -1 756 1 230 673 -529 784 110 558 607 1 211 30 -43 -1 625 -81 -1 187 87 Jun -1 477 967 370 -645 795 30 597 674 1 099 9 44 -1 365 -115 -1 204 54 Jul -1 827 1 307 1 031 -423 1 150 189 276 397 1 050 90 18 -1 608 84 -1 473 180 Aug -2 772 1 157 582 -409 629 141 575 527 1 186 26 39 -1 880 -343 -1 366 151 Sep -2 374 1 049 822 -716 877 288 228 301 792 -18 -0 -1 343 -426 -1 595 108 Oct -2 240 698 433 -906 652 302 265 374 815 154 36 -1 623 -67 -1 551 281 Nov -1 555 687 619 -660 705 229 68 128 709 136 -40 -1 039 -188 -1 241 125 Dec -1 822 227 -44 -766 548 -15 271 281 301 193 -58 -1 288 149 -1 504 162
15 Jan -2 596 783 223 -580 527 257 561 692 415 -150 -26 -951 -48 -1 572 -74 Feb -2 037 721 390 -672 771 158 331 533 764 -202 -13 -939 25 -1 579 27 Mar -891 1 358 925 -471 759 289 432 524 1 069 -272 -73 -378 98 -1 652 19
BANCO DE ESPAÑA 44* ECONOMIC BULLETIN, JULY-AUGUST 2015 ECONOMIC INDICATORS

2009 2010 2011 2012 2013 2014-1000
-900
-800
-700
-600
-500
-400
-300
-200
-100
0
-1000
-900
-800
-700
-600
-500
-400
-300
-200
-100
0EUR bEUR b
TOTAL NET POSITION
TOTAL EXCLUDING BANCO DE ESPAÑA
BANCO DE ESPAÑA
INTERNATIONAL INVESTMENT POSITION
2009 2010 2011 2012 2013 2014-700
-600
-500
-400
-300
-200
-100
0
100
-700
-600
-500
-400
-300
-200
-100
0
100EUR bEUR b
DIRECT INVEST. NET POSITION
PORTFOLIO INVEST.EXC.BE. NET POSITION
OTHER INV. EXCLUDING BE. NET POSITION
COMPONENTS OF THE POSITION
1=2+13 9+12 3=4-5 4 5 6=7-8 7 8 9=10-11 10 11 12 14 a 16 14 15 16
7.6. SPANISH INTERNATIONAL INVESTMENT POSITION VIS-à-VIS OTHER EURO AREA RESIDENTS AND THE REST OF THE WORLD. SUMMARY
Source: BE.
a. See note b to table 17.21 of the Boletín Estadístico.
___________________________________________________________________________________________________________________________
End-of-period stocks in EUR billions Total excluding Banco de España Banco de España
Net inter-
national Net Direct investment Portfolio investment Other investment Financial invest- position deriva- Banco de Net Other ment excluding tives España position position Banco de Net Net Net Net Net Reserves vis-à-vis (assets- España position Assets Liabili- position Assets Liabili- position Assets Liabili- position position the Euro- liabil.) (assets- (assets- ties (assets- ties (assets- ties (assets - (assets- system liabil.) liab.) liab.) liab.) liabil.) liabil.) 2=3+6+ 13=
06 ... ... ... ... ... ... ... ... ... ... ... ... ... ... ... ... 07 ... ... ... ... ... ... ... ... ... ... ... ... ... ... ... ... 08 ... ... ... ... ... ... ... ... ... ... ... ... ... ... ... ... 09 ... ... ... ... ... ... ... ... ... ... ... ... ... ... ... ... 10 ... ... ... ... ... ... ... ... ... ... ... ... ... ... ... ...
11 Q4 ... ... ... ... ... ... ... ... ... ... ... ... ... ... ... ...
12 Q1 ... ... ... ... ... ... ... ... ... ... ... ... ... ... ... ... Q2 ... ... ... ... ... ... ... ... ... ... ... ... ... ... ... ... Q3 ... ... ... ... ... ... ... ... ... ... ... ... ... ... ... ... Q4 -949 -696 -23 521 543 -504 287 791 -171 388 558 2 -254 38 -333 41
13 Q1 -946 -732 -19 539 559 -505 301 806 -209 386 595 2 -214 40 -292 38 Q2 -942 -735 -42 522 564 -488 297 786 -208 379 586 2 -207 35 -278 36 Q3 -973 -777 -51 518 569 -535 301 836 -194 348 542 2 -196 35 -264 32 Q4 -984 -839 -60 522 582 -583 310 893 -199 348 547 3 -144 34 -209 31
14 Q1 -991 -835 -46 537 583 -584 338 922 -205 345 550 -1 -156 34 -222 32 Q2 -998 -858 -47 543 590 -626 353 980 -181 369 551 -3 -140 35 -204 30 Q3 -991 -849 -44 558 603 -599 375 973 -202 366 568 -4 -142 37 -207 28 Q4 -990 -874 -39 555 595 -622 384 1 006 -207 354 561 -6 -115 41 -185 28
BANCO DE ESPAÑA 45* ECONOMIC BULLETIN, JULY-AUGUST 2015 ECONOMIC INDICATORS
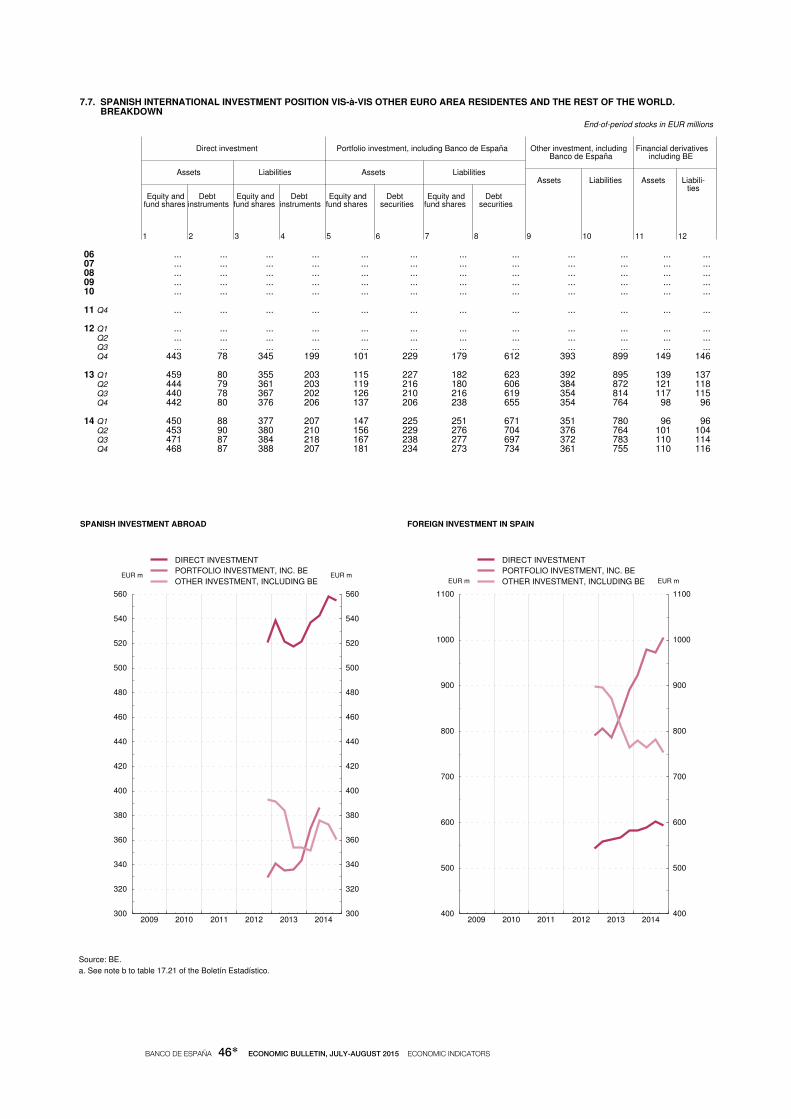
2009 2010 2011 2012 2013 2014300
320
340
360
380
400
420
440
460
480
500
520
540
560
300
320
340
360
380
400
420
440
460
480
500
520
540
560
EUR mEUR m
DIRECT INVESTMENT
PORTFOLIO INVESTMENT, INC. BE
OTHER INVESTMENT, INCLUDING BE
SPANISH INVESTMENT ABROAD
2009 2010 2011 2012 2013 2014400
500
600
700
800
900
1000
1100
400
500
600
700
800
900
1000
1100
EUR mEUR m
DIRECT INVESTMENT
PORTFOLIO INVESTMENT, INC. BE
OTHER INVESTMENT, INCLUDING BE
FOREIGN INVESTMENT IN SPAIN
1 2 3 4 5 6 7 8 9 10 11 12
7.7. SPANISH INTERNATIONAL INVESTMENT POSITION VIS-à-VIS OTHER EURO AREA RESIDENTES AND THE REST OF THE WORLD. BREAKDOWN
Source: BE.
a. See note b to table 17.21 of the Boletín Estadístico.
___________________________________________________________________________________________________________________________
End-of-period stocks in EUR millions
Direct investment Portfolio investment, including Banco de España Other investment, including Financial derivatives Banco de España including BE
Assets Liabilities Assets Liabilities Assets Liabilities Assets Liabili- ties
Equity and Debt Equity and Debt Equity and Debt Equity and Debt fund shares instruments fund shares instruments fund shares securities fund shares securities
06 ... ... ... ... ... ... ... ... ... ... ... ... 07 ... ... ... ... ... ... ... ... ... ... ... ... 08 ... ... ... ... ... ... ... ... ... ... ... ... 09 ... ... ... ... ... ... ... ... ... ... ... ... 10 ... ... ... ... ... ... ... ... ... ... ... ...
11 Q4 ... ... ... ... ... ... ... ... ... ... ... ...
12 Q1 ... ... ... ... ... ... ... ... ... ... ... ... Q2 ... ... ... ... ... ... ... ... ... ... ... ... Q3 ... ... ... ... ... ... ... ... ... ... ... ... Q4 443 78 345 199 101 229 179 612 393 899 149 146
13 Q1 459 80 355 203 115 227 182 623 392 895 139 137 Q2 444 79 361 203 119 216 180 606 384 872 121 118 Q3 440 78 367 202 126 210 216 619 354 814 117 115 Q4 442 80 376 206 137 206 238 655 354 764 98 96
14 Q1 450 88 377 207 147 225 251 671 351 780 96 96 Q2 453 90 380 210 156 229 276 704 376 764 101 104 Q3 471 87 384 218 167 238 277 697 372 783 110 114 Q4 468 87 388 207 181 234 273 734 361 755 110 116
BANCO DE ESPAÑA 46* ECONOMIC BULLETIN, JULY-AUGUST 2015 ECONOMIC INDICATORS

2002 2004 2006 2008 2010 20120
10000
20000
30000
40000
50000
60000
0
10000
20000
30000
40000
50000
60000EUR mEUR m
OTHER RESERVE ASSETS
MONETARY GOLD
SDR
IMF RESERVE POSITION
FOREIGN EXCHANGE
RESERVE ASSETS END-OF-YEAR POSITIONS
Q2 Q3 Q4 Q1 Q2
2014 2015
0
10000
20000
30000
40000
50000
60000
0
10000
20000
30000
40000
50000
60000EUR mEUR m
OTHER RESERVE ASSETS
MONETARY GOLD
SDR
IMF RESERVE POSITION
FOREIGN EXCHANGE
RESERVE ASSETS END-OF-MONTH POSITIONS
. Series depicted in chart.
1 . 2
. 3 . 4
. 5 . 6 7
7.8. SPANISH RESERVE ASSETS
Source: BE.
Note: From January 1999 the assets denominated in euro and other currencies vis-à-vis residents of other euro area countries are not considered reserve assets. To December
1998, data in pesetas have been converted to euro using the irrevocable euro conversion rate. Since January 1999, all reserve assets are valued at market prices.
Reserve assets data have been compiled in accordance with the IMF´s new methodological guidelines published in the document ’International Reserves and Foreign
Currency Liquidity Guidelines for a Data Template’, 2013 (https://www.imf.org/external/np/sta/ir/IRProcessWeb/pdf/guide2013.pdf)
___________________________________________________________________________________________________________________________
End-of-period stocks in EUR millions
Reserve assets Memorandum item: gold Reserve
Total Foreign position in Monetary Other Millions of exchange the IMF SDRs gold reserve troy ounces assets
09 19 578 8 518 541 3 222 6 938 358 9.1 10 23 905 9 564 995 3 396 9 555 395 9.1 11 36 402 19 578 2 251 3 163 11 017 394 9.1 12 38 347 20 984 2 412 3 132 11 418 401 9.1 13 33 587 20 093 2 152 3 122 7 888 332 9.1
13 Dec 33 587 20 093 2 152 3 122 7 888 332 9.1
14 Jan 34 733 20 701 2 139 3 171 8 399 323 9.1 Feb 34 442 20 307 2 093 3 020 8 706 315 9.1 Mar 34 196 20 258 2 097 3 029 8 497 316 9.1 Apr 33 957 20 046 2 157 3 024 8 418 311 9.1 May 34 463 20 701 2 078 3 062 8 314 309 9.1 Jun 34 834 20 645 2 115 3 071 8 704 299 9.1 Jul 35 282 21 036 2 138 3 106 8 693 309 9.1 Aug 35 768 21 391 2 106 3 128 8 832 311 9.1 Sep 36 684 22 322 2 125 3 200 8 706 330 9.1 Oct 36 592 22 497 2 130 3 176 8 432 358 9.1 Nov 39 328 25 109 2 117 3 161 8 587 354 9.1 Dec 41 469 27 076 1 888 3 233 8 943 328 9.1
15 Jan 45 050 29 282 1 975 3 377 10 089 327 9.1 Feb 47 377 32 049 1 782 3 393 9 828 325 9.1 Mar 51 349 35 938 1 614 3 486 9 987 325 9.1 Apr 49 362 34 504 1 540 3 407 9 594 317 9.1 May 50 302 35 188 1 542 3 447 9 802 323 9.1
BANCO DE ESPAÑA 47* ECONOMIC BULLETIN, JULY-AUGUST 2015 ECONOMIC INDICATORS
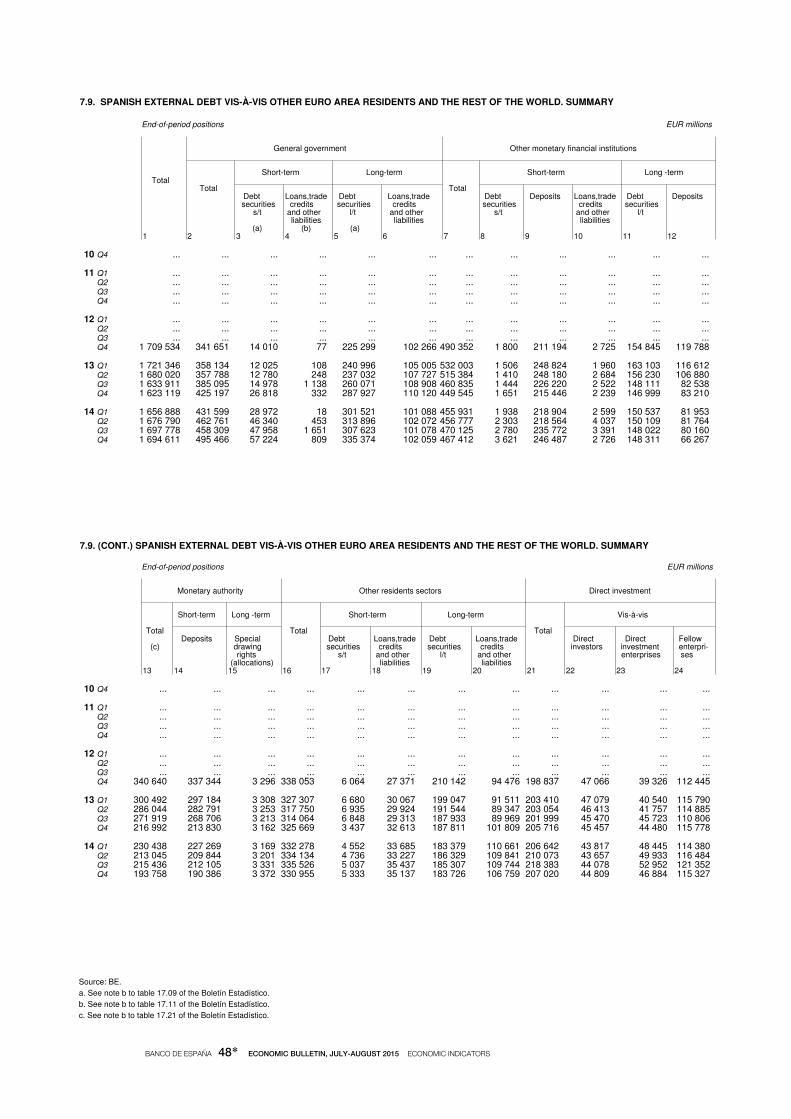
1 2 3 4 5 6 7 8 9 10 11 12
7.9. SPANISH EXTERNAL DEBT VIS-À-VIS OTHER EURO AREA RESIDENTS AND THE REST OF THE WORLD. SUMMARY
___________________________________________________________________________________________________________________________
End-of-period positions EUR millions General government Other monetary financial institutions Short-term Long-term Short-term Long -term
Total Total Total Debt Loans,trade Debt Loans,trade Debt Deposits Loans,trade Debt Deposits securities credits securities credits securities credits securities s/t and other l/t and other s/t and other l/t liabilities liabilities liabilities (a) (b) (a)
10 Q4 ... ... ... ... ... ... ... ... ... ... ... ...
11 Q1 ... ... ... ... ... ... ... ... ... ... ... ... Q2 ... ... ... ... ... ... ... ... ... ... ... ... Q3 ... ... ... ... ... ... ... ... ... ... ... ... Q4 ... ... ... ... ... ... ... ... ... ... ... ...
12 Q1 ... ... ... ... ... ... ... ... ... ... ... ... Q2 ... ... ... ... ... ... ... ... ... ... ... ... Q3 ... ... ... ... ... ... ... ... ... ... ... ... Q4 1 709 534 341 651 14 010 77 225 299 102 266 490 352 1 800 211 194 2 725 154 845 119 788
13 Q1 1 721 346 358 134 12 025 108 240 996 105 005 532 003 1 506 248 824 1 960 163 103 116 612 Q2 1 680 020 357 788 12 780 248 237 032 107 727 515 384 1 410 248 180 2 684 156 230 106 880 Q3 1 633 911 385 095 14 978 1 138 260 071 108 908 460 835 1 444 226 220 2 522 148 111 82 538 Q4 1 623 119 425 197 26 818 332 287 927 110 120 449 545 1 651 215 446 2 239 146 999 83 210
14 Q1 1 656 888 431 599 28 972 18 301 521 101 088 455 931 1 938 218 904 2 599 150 537 81 953 Q2 1 676 790 462 761 46 340 453 313 896 102 072 456 777 2 303 218 564 4 037 150 109 81 764 Q3 1 697 778 458 309 47 958 1 651 307 623 101 078 470 125 2 780 235 772 3 391 148 022 80 160 Q4 1 694 611 495 466 57 224 809 335 374 102 059 467 412 3 621 246 487 2 726 148 311 66 267
13 14 15 16 17 18 19 20 21 22 23 24
7.9. (CONT.) SPANISH EXTERNAL DEBT VIS-À-VIS OTHER EURO AREA RESIDENTS AND THE REST OF THE WORLD. SUMMARY
c. See note b to table 17.21 of the Boletín Estadístico.
b. See note b to table 17.11 of the Boletín Estadístico.
a. See note b to table 17.09 of the Boletín Estadístico.
Source: BE.
___________________________________________________________________________________________________________________________
End-of-period positions EUR millions
Monetary authority Other residents sectors Direct investment Short-term Long -term Short-term Long-term Vis-à-vis
Total Total Total Deposits Special Debt Loans,trade Debt Loans,trade Direct Direct Fellow (c) drawing securities credits securities credits investors investment enterpri- rights s/t and other l/t and other enterprises ses (allocations) liabilities liabilities
10 Q4 ... ... ... ... ... ... ... ... ... ... ... ...
11 Q1 ... ... ... ... ... ... ... ... ... ... ... ... Q2 ... ... ... ... ... ... ... ... ... ... ... ... Q3 ... ... ... ... ... ... ... ... ... ... ... ... Q4 ... ... ... ... ... ... ... ... ... ... ... ...
12 Q1 ... ... ... ... ... ... ... ... ... ... ... ... Q2 ... ... ... ... ... ... ... ... ... ... ... ... Q3 ... ... ... ... ... ... ... ... ... ... ... ... Q4 340 640 337 344 3 296 338 053 6 064 27 371 210 142 94 476 198 837 47 066 39 326 112 445
13 Q1 300 492 297 184 3 308 327 307 6 680 30 067 199 047 91 511 203 410 47 079 40 540 115 790 Q2 286 044 282 791 3 253 317 750 6 935 29 924 191 544 89 347 203 054 46 413 41 757 114 885 Q3 271 919 268 706 3 213 314 064 6 848 29 313 187 933 89 969 201 999 45 470 45 723 110 806 Q4 216 992 213 830 3 162 325 669 3 437 32 613 187 811 101 809 205 716 45 457 44 480 115 778
14 Q1 230 438 227 269 3 169 332 278 4 552 33 685 183 379 110 661 206 642 43 817 48 445 114 380 Q2 213 045 209 844 3 201 334 134 4 736 33 227 186 329 109 841 210 073 43 657 49 933 116 484 Q3 215 436 212 105 3 331 335 526 5 037 35 437 185 307 109 744 218 383 44 078 52 952 121 352 Q4 193 758 190 386 3 372 330 955 5 333 35 137 183 726 106 759 207 020 44 809 46 884 115 327
BANCO DE ESPAÑA 48* ECONOMIC BULLETIN, JULY-AUGUST 2015 ECONOMIC INDICATORS

+5+6-7 2 3 4 5 6 7 -11-12 9 10 11 12 13
8.1.a CONSOLIDATED BALANCE SHEET OF THE EUROSYSTEM. NET LENDING TO CREDIT INSTITUTIONS AND ITS COUNTERPARTS
___________________________________________________________________________________________________________________________
Average of daily data, EUR millions
Net lending in euro Counterparts Open market operations Standing Autonomous factors Actual facilities reserves
Total of credit Main Longer- Fine- Structu- Marginal Deposit Total Bank- Deposits Gold and Other institu- refinan- term tuning ral re- lending facility notes to net as- assets tions cing refinan- reverse verse facility general sets in (net) opera- cing opera- opera- govern- foreign tions opera- tions tions ment currency tions (net) (net)
1=2+3+4 8=9+10
13 Dec 665 849 114 636 603 234 - - 268 52 290 426 416 943 271 66 754 549 143 34 466 239 433
14 Jan 649 566 122 069 579 586 - - 252 52 341 417 009 938 118 75 739 509 423 87 425 232 556 Feb 634 781 95 993 573 273 - - 333 34 818 426 501 930 579 81 875 510 096 75 857 208 280 Mar 619 809 97 899 550 816 - - 666 29 572 420 296 936 399 74 847 512 208 78 743 199 513 Apr 609 276 115 461 521 294 - - 257 27 736 420 512 945 539 76 475 535 966 65 537 188 764 May 628 409 145 647 510 952 - - 127 28 317 439 931 948 316 112 573 536 656 84 302 188 478 Jun 581 427 129 914 477 857 - - 199 26 542 371 611 955 928 108 495 537 158 155 654 209 816 Jul 507 639 101 169 429 621 - - 269 23 420 297 259 964 376 103 583 547 497 223 204 210 380 Aug 483 061 114 947 393 227 - - 119 25 232 267 252 971 781 67 203 547 655 224 077 215 809 Sep 470 099 106 955 387 138 - - 196 24 191 276 727 970 593 75 832 548 834 220 863 193 371 Oct 480 000 91 221 417 154 - - 257 28 631 288 777 972 659 79 858 561 915 201 824 191 223 Nov 474 620 103 760 399 875 - - 144 29 159 290 858 976 005 72 851 562 897 195 100 183 762 Dec 506 285 110 831 429 556 - - 138 34 241 279 468 999 398 64 557 566 006 218 481 226 817
15 Jan 527 989 128 640 456 509 - - 740 57 899 297 251 1 005 172 69 948 585 434 192 434 230 738 Feb 481 684 135 790 387 228 - - 446 41 780 251 321 1 004 298 61 435 588 807 225 606 230 364 Mar 436 119 140 623 344 586 - - 209 49 298 198 667 1 010 181 64 599 594 510 281 602 237 452 Apr 431 994 101 712 417 158 - - 81 86 957 153 441 1 020 338 75 476 656 841 285 532 278 553 May 399 967 95 097 407 474 - - 82 102 685 96 963 1 027 386 72 348 655 368 347 403 303 004
+19-20 15 16 17 18 19 20 21 22 -26-27 24 25 26 27 28
8.1.b BALANCE SHEET OF THE BANCO DE ESPAÑA. NET LENDING TO CREDIT INSTITUTIONS AND ITS COUNTERPARTS
Sources: ECB for Table 8.1.a and BE for Table 8.1.b.
___________________________________________________________________________________________________________________________
Average of daily data, EUR millions
Net lending in euro Counterparts Open market operations Standing Intra-ESCB Autonomous factors Actual facilities reserves
Total of credit Main Longer- Fine- Struc- Margi- Deposit Target Rest Total Bank- Deposits Gold Other institu- refinan- term tuning tural nal facility notes to and net assets tions cing refinan- reserve reserve lending general assets (net) opera- cing opera- opera- facility govern- in tions opera- tions tions ment foreign tions (net) (net) curren- cy
14=15+16 +17+18 23=24+25
13 Dec 201 865 19 833 186 927 - - - 4 895 238 791 -5 861 -44 945 56 223 3 386 34 327 70 227 13 879
14 Jan 188 796 15 414 178 006 - - - 4 623 228 664 -6 265 -46 237 54 791 3 187 32 533 71 683 12 634 Feb 188 792 14 494 176 094 - - - 1 796 229 277 -6 316 -45 635 52 868 4 453 32 507 70 448 11 466 Mar 183 454 19 332 165 571 - - 75 1 525 228 005 -6 436 -49 760 52 424 2 445 32 464 72 164 11 644 Apr 182 373 23 303 161 030 - - 0 1 960 226 925 -6 436 -50 033 52 526 1 821 33 133 71 246 11 916 May 185 514 26 898 160 973 - - 0 2 358 228 297 -6 436 -47 899 51 124 2 002 33 146 67 879 11 552 Jun 173 088 24 701 149 752 - - - 1 365 215 101 -6 436 -47 723 50 677 2 645 33 248 67 796 12 145 Jul 160 694 26 520 134 179 - - - 5 202 469 -6 436 -48 094 50 836 334 33 694 65 570 12 755 Aug 162 546 37 585 124 993 - - - 33 206 055 -6 436 -48 406 49 686 1 111 33 712 65 492 11 333 Sep 154 798 31 401 123 448 - - - 51 199 974 -6 436 -51 141 47 537 185 33 755 65 109 12 401 Oct 154 788 27 338 127 455 - - 0 5 200 926 -6 436 -51 132 45 925 532 35 571 62 018 11 430 Nov 150 994 27 417 123 583 - - - 6 191 981 -6 436 -45 785 44 835 5 786 36 553 59 853 11 235 Dec 141 338 21 115 120 508 - - 0 285 190 903 -6 436 -56 469 46 567 733 39 500 64 270 13 341
15 Jan 141 490 26 984 114 942 - - - 436 195 486 -6 436 -57 889 45 667 2 093 40 694 64 955 10 329 Feb 132 010 48 280 83 792 - - - 63 187 936 -6 436 -62 925 43 930 126 41 649 65 332 13 434 Mar 123 819 53 920 69 985 - - 12 97 187 900 -6 436 -69 351 43 900 690 44 985 68 957 11 706 Apr 135 763 30 903 104 977 - - 0 117 203 296 -6 436 -72 745 44 140 3 814 50 577 70 122 11 648 May 132 595 28 836 104 018 - - - 259 209 409 -6 436 -83 252 43 269 244 50 644 76 121 12 874
BANCO DE ESPAÑA 49* ECONOMIC BULLETIN, JULY-AUGUST 2015 ECONOMIC INDICATORS

2011 2012 2013 2014 2015-20
-15
-10
-5
0
5
10
15
20
25
30
35
-20
-15
-10
-5
0
5
10
15
20
25
30
35%%
CASH AND CASH EQUIVALENTS
OTHER LIABILITIES OF CREDIT INSTITUTIONS
MUTUAL FUNDS SHARES
NON-FINANCIAL CORPORATIONS, HOUSEHOLDS AND NPISHs Annual percentage change
2010 2011 2012 2013 2014-10
-5
0
5
10
15
-10
-5
0
5
10
15%%
AL
CONTRIBUTION OF THE MFIs RESID. TO M3
NON-FINANCIAL CORPORATIONS, HOUSEHOLDS AND NPISHs Annual percentage change
P
P P P P P P P P
P A A A
. Series depicted in chart.
1 . 2 3 4 5
. 6 7 8 9 10 . 11 12 13
. 14 . 15
8.2 CASH AND CASH EQUIVALENTS, OTHER LIABILITIES OF CREDIT INSTITUTIONS AND MUTUAL FUNDS SHARES OF NON-FINANCIAL CORPORATIONS, HOUSEHOLDS AND NPISHS RESIDENT IN SPAIN (a)
Source: BE. a. This concept refers to the instruments included in the headings of the table, issued by resident credit institutions and mutual funds.
The exception is column 9, whichincludes deposits in Spanish bank branches abroad.
b. It includes open-ended investment companies.
c. Current accounts, savings accounts and deposits redeemable at up to 3 months’ notice.
d. Deposits redeemable at over 3 months’ notice and time deposits.
e. The series includes the old categories of Money market funds and Fixed income mutual funds in euros.
f. Defined as cash and cash equivalents, other liabilities of credit institutions and Fixed income mutual funds shares in euros.___________________________________________________________________________________________________________________________
EUR millions and %
Cash and cash equivalents Other liabilities of credit institutions Mutual funds shares (b) Memorandum items 12-m. % change 12-month % change 12-month % change 12-month % change 12- 12 12-
Stocks month Stocks month Stocks month % Depo- % Other Repos + Depo- % Fixed Other AL Contri- change Cash sits change depo- credit sits change income (f) bution (c) sits insti- in in EUR of the (d) tutions’ bran- (e) MFIs securi- ches resid. ties abroad to M3
12 506 551 -0.7 -3.1 -0.1 580 209 0.8 -0.2 7.8 12.3 134 897 -3.0 -10.0 -0.5 -0.2 0.3 13 537 676 6.1 -5.8 8.8 552 617 -4.8 0.7 -40.5 -32.1 168 370 24.8 38.7 20.2 1.5 -3.6 14 576 888 7.3 -8.1 10.3 472 793 -14.4 -11.0 -55.5 22.7 209 856 24.6 24.4 24.7 -2.6 4.3
14 Jan 535 132 8.2 -5.5 11.2 547 237 -6.8 0.0 -51.8 -26.0 172 038 25.6 41.5 20.3 1.3 -3.1 Feb 525 508 5.3 -5.5 7.7 542 723 -7.0 -0.7 -52.7 -28.8 176 025 26.8 42.8 21.6 0.0 -3.4 Mar 538 509 5.3 -7.1 7.9 536 439 -6.9 -1.0 -54.1 -22.8 180 821 27.3 38.7 23.5 0.1 -3.6 Apr 533 536 5.3 -7.8 8.2 529 484 -7.1 -1.8 -51.7 -32.4 183 840 27.1 37.7 23.4 0.0 -2.7 May 549 666 7.0 -8.2 10.3 525 101 -7.5 -3.1 -47.8 -29.9 188 532 29.0 37.2 26.2 0.7 -1.7 Jun 566 028 6.3 -8.4 9.4 515 882 -7.7 -3.7 -47.9 -11.8 193 916 31.7 33.0 31.3 0.3 -0.4 Jul 559 515 7.8 -8.3 11.2 508 418 -9.6 -5.7 -50.8 -19.8 197 142 30.1 31.5 29.6 -0.1 1.6 Aug 564 024 7.9 -8.5 11.3 501 627 -11.4 -7.3 -54.5 -22.6 199 822 31.0 31.8 30.7 -0.9 0.8 Sep 562 288 7.9 -9.0 11.3 496 707 -11.7 -7.7 -56.0 -20.7 203 233 29.2 30.7 28.7 -1.0 1.6 Oct 554 611 6.7 -8.8 9.8 485 273 -13.3 -9.2 -61.4 -10.9 204 602 26.7 29.0 25.8 -2.4 1.9 Nov 570 663 7.4 -8.6 10.5 474 257 -14.8 -10.7 -65.9 4.9 208 807 26.7 27.1 26.6 -2.7 2.8 Dec 576 888 7.3 -8.1 10.3 472 793 -14.4 -11.0 -55.5 22.7 209 856 24.6 24.4 24.7 -2.6 4.3
15 Jan 575 855 7.6 -7.9 10.6 459 351 -16.1 -12.5 -67.3 15.3 214 813 24.9 21.8 26.0 -3.2 2.4 Feb 582 658 10.9 -7.7 14.5 454 173 -16.3 -13.4 -63.5 11.4 221 994 26.1 19.9 28.5 -1.9 3.9 Mar 588 603 9.3 -7.2 12.4 446 693 -16.7 -14.8 -53.2 3.3 228 077 26.1 16.1 30.0 -2.8 4.8 Apr 596 129 11.7 -6.7 15.2 437 905 -17.3 -14.9 -62.3 8.5 231 557 26.0 12.3 31.2 -2.0 5.4
BANCO DE ESPAÑA 50* ECONOMIC BULLETIN, JULY-AUGUST 2015 ECONOMIC INDICATORS
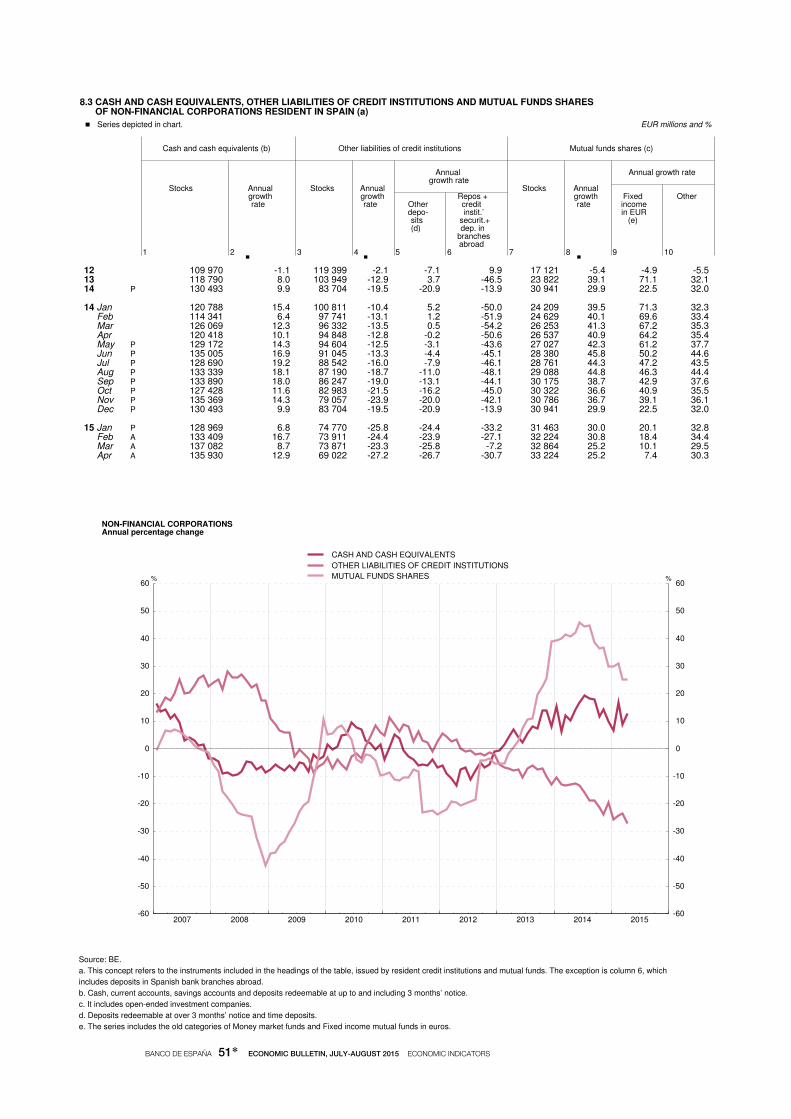
2007 2008 2009 2010 2011 2012 2013 2014 2015-60
-50
-40
-30
-20
-10
0
10
20
30
40
50
60
-60
-50
-40
-30
-20
-10
0
10
20
30
40
50
60%%
CASH AND CASH EQUIVALENTS
OTHER LIABILITIES OF CREDIT INSTITUTIONS
MUTUAL FUNDS SHARES
NON-FINANCIAL CORPORATIONS Annual percentage change
P
P P P P P P P P
P A A A
. Series depicted in chart.
1 . 2 3
. 4 5 6 7 . 8 9 10
8.3 CASH AND CASH EQUIVALENTS, OTHER LIABILITIES OF CREDIT INSTITUTIONS AND MUTUAL FUNDS SHARES OF NON-FINANCIAL CORPORATIONS RESIDENT IN SPAIN (a)
Source: BE.
a. This concept refers to the instruments included in the headings of the table, issued by resident credit institutions and mutual funds. The exception is column 6, which
includes deposits in Spanish bank branches abroad.
b. Cash, current accounts, savings accounts and deposits redeemable at up to and including 3 months’ notice.
c. It includes open-ended investment companies.
d. Deposits redeemable at over 3 months’ notice and time deposits.
e. The series includes the old categories of Money market funds and Fixed income mutual funds in euros.___________________________________________________________________________________________________________________________
EUR millions and %
Cash and cash equivalents (b) Other liabilities of credit institutions Mutual funds shares (c) Annual Annual growth rate growth rate
Stocks Annual Stocks Annual Stocks Annual growth growth Repos + growth Fixed Other rate rate Other credit rate income depo- instit.’ in EUR sits securit.+ (e) (d) dep. in branches abroad
12 109 970 -1.1 119 399 -2.1 -7.1 9.9 17 121 -5.4 -4.9 -5.5 13 118 790 8.0 103 949 -12.9 3.7 -46.5 23 822 39.1 71.1 32.1 14 130 493 9.9 83 704 -19.5 -20.9 -13.9 30 941 29.9 22.5 32.0
14 Jan 120 788 15.4 100 811 -10.4 5.2 -50.0 24 209 39.5 71.3 32.3 Feb 114 341 6.4 97 741 -13.1 1.2 -51.9 24 629 40.1 69.6 33.4 Mar 126 069 12.3 96 332 -13.5 0.5 -54.2 26 253 41.3 67.2 35.3 Apr 120 418 10.1 94 848 -12.8 -0.2 -50.6 26 537 40.9 64.2 35.4 May 129 172 14.3 94 604 -12.5 -3.1 -43.6 27 027 42.3 61.2 37.7 Jun 135 005 16.9 91 045 -13.3 -4.4 -45.1 28 380 45.8 50.2 44.6 Jul 128 690 19.2 88 542 -16.0 -7.9 -46.1 28 761 44.3 47.2 43.5 Aug 133 339 18.1 87 190 -18.7 -11.0 -48.1 29 088 44.8 46.3 44.4 Sep 133 890 18.0 86 247 -19.0 -13.1 -44.1 30 175 38.7 42.9 37.6 Oct 127 428 11.6 82 983 -21.5 -16.2 -45.0 30 322 36.6 40.9 35.5 Nov 135 369 14.3 79 057 -23.9 -20.0 -42.1 30 786 36.7 39.1 36.1 Dec 130 493 9.9 83 704 -19.5 -20.9 -13.9 30 941 29.9 22.5 32.0
15 Jan 128 969 6.8 74 770 -25.8 -24.4 -33.2 31 463 30.0 20.1 32.8 Feb 133 409 16.7 73 911 -24.4 -23.9 -27.1 32 224 30.8 18.4 34.4 Mar 137 082 8.7 73 871 -23.3 -25.8 -7.2 32 864 25.2 10.1 29.5 Apr 135 930 12.9 69 022 -27.2 -26.7 -30.7 33 224 25.2 7.4 30.3
BANCO DE ESPAÑA 51* ECONOMIC BULLETIN, JULY-AUGUST 2015 ECONOMIC INDICATORS
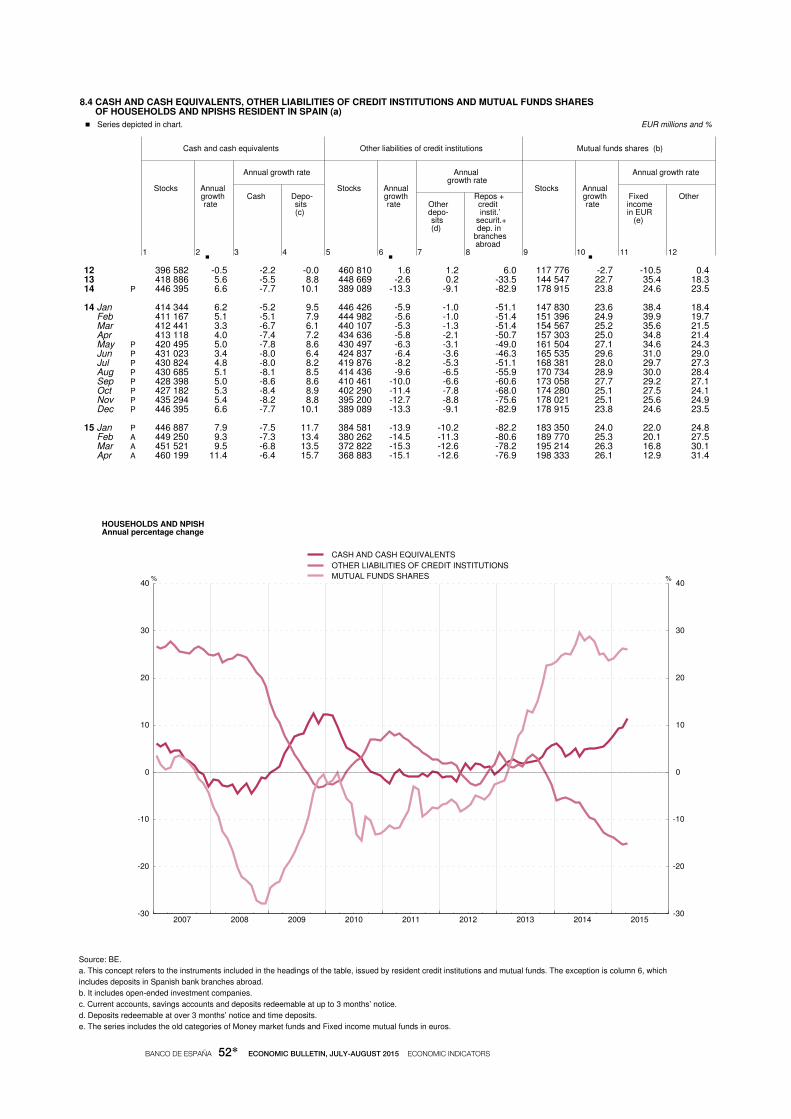
2007 2008 2009 2010 2011 2012 2013 2014 2015-30
-20
-10
0
10
20
30
40
-30
-20
-10
0
10
20
30
40%%
CASH AND CASH EQUIVALENTS
OTHER LIABILITIES OF CREDIT INSTITUTIONS
MUTUAL FUNDS SHARES
HOUSEHOLDS AND NPISH Annual percentage change
P
P P P P P P P P
P A A A
. Series depicted in chart.
1 . 2 3 4 5
. 6 7 8 9 . 10 11 12
8.4 CASH AND CASH EQUIVALENTS, OTHER LIABILITIES OF CREDIT INSTITUTIONS AND MUTUAL FUNDS SHARES OF HOUSEHOLDS AND NPISHS RESIDENT IN SPAIN (a)
Source: BE.
a. This concept refers to the instruments included in the headings of the table, issued by resident credit institutions and mutual funds. The exception is column 6, which
includes deposits in Spanish bank branches abroad.
b. It includes open-ended investment companies.
c. Current accounts, savings accounts and deposits redeemable at up to 3 months’ notice.
d. Deposits redeemable at over 3 months’ notice and time deposits.
e. The series includes the old categories of Money market funds and Fixed income mutual funds in euros.___________________________________________________________________________________________________________________________
EUR millions and %
Cash and cash equivalents Other liabilities of credit institutions Mutual funds shares (b) Annual growth rate Annual Annual growth rate growth rate
Stocks Annual Stocks Annual Stocks Annual growth Cash Depo- growth Repos + growth Fixed Other rate sits rate Other credit rate income (c) depo- instit.’ in EUR sits securit.+ (e) (d) dep. in branches abroad
12 396 582 -0.5 -2.2 -0.0 460 810 1.6 1.2 6.0 117 776 -2.7 -10.5 0.4 13 418 886 5.6 -5.5 8.8 448 669 -2.6 0.2 -33.5 144 547 22.7 35.4 18.3 14 446 395 6.6 -7.7 10.1 389 089 -13.3 -9.1 -82.9 178 915 23.8 24.6 23.5
14 Jan 414 344 6.2 -5.2 9.5 446 426 -5.9 -1.0 -51.1 147 830 23.6 38.4 18.4 Feb 411 167 5.1 -5.1 7.9 444 982 -5.6 -1.0 -51.4 151 396 24.9 39.9 19.7 Mar 412 441 3.3 -6.7 6.1 440 107 -5.3 -1.3 -51.4 154 567 25.2 35.6 21.5 Apr 413 118 4.0 -7.4 7.2 434 636 -5.8 -2.1 -50.7 157 303 25.0 34.8 21.4 May 420 495 5.0 -7.8 8.6 430 497 -6.3 -3.1 -49.0 161 504 27.1 34.6 24.3 Jun 431 023 3.4 -8.0 6.4 424 837 -6.4 -3.6 -46.3 165 535 29.6 31.0 29.0 Jul 430 824 4.8 -8.0 8.2 419 876 -8.2 -5.3 -51.1 168 381 28.0 29.7 27.3 Aug 430 685 5.1 -8.1 8.5 414 436 -9.6 -6.5 -55.9 170 734 28.9 30.0 28.4 Sep 428 398 5.0 -8.6 8.6 410 461 -10.0 -6.6 -60.6 173 058 27.7 29.2 27.1 Oct 427 182 5.3 -8.4 8.9 402 290 -11.4 -7.8 -68.0 174 280 25.1 27.5 24.1 Nov 435 294 5.4 -8.2 8.8 395 200 -12.7 -8.8 -75.6 178 021 25.1 25.6 24.9 Dec 446 395 6.6 -7.7 10.1 389 089 -13.3 -9.1 -82.9 178 915 23.8 24.6 23.5
15 Jan 446 887 7.9 -7.5 11.7 384 581 -13.9 -10.2 -82.2 183 350 24.0 22.0 24.8 Feb 449 250 9.3 -7.3 13.4 380 262 -14.5 -11.3 -80.6 189 770 25.3 20.1 27.5 Mar 451 521 9.5 -6.8 13.5 372 822 -15.3 -12.6 -78.2 195 214 26.3 16.8 30.1 Apr 460 199 11.4 -6.4 15.7 368 883 -15.1 -12.6 -76.9 198 333 26.1 12.9 31.4
BANCO DE ESPAÑA 52* ECONOMIC BULLETIN, JULY-AUGUST 2015 ECONOMIC INDICATORS

2010 2011 2012 2013 2014 2015-10
-5
0
5
10
15
20
25
30
35
40
45
-10
-5
0
5
10
15
20
25
30
35
40
45%%
GENERAL GOVERNMENT
NON-FINANCIAL CORPORATIONS
HOUSEHOLDS AND NPISHS
TOTAL
FINANCING OF NON-FINANCIAL SECTORS Annual percentage change
2010 2011 2012 2013 2014 2015-10
-5
0
5
10
15
20
25
-10
-5
0
5
10
15
20
25%%
GENERAL GOVERNMENT
NON-FINANCIAL CORPORATIONS
HOUSEHOLDS AND NPISHS
TOTAL
FINANCING OF NON-FINANCIAL SECTORS Contributions to the annual percentage change
P
P P P P P P P P
P A A A
. Series depicted in chart.
1 2 . 3
. 4 5 . 6
. 7 8 9 10 . 11 12
. 13 . 14 15 16 17
8.5. FINANCING OF NON-FINANCIAL SECTORS RESIDENT IN SPAIN (a)
Source: BE.
a. The annual percentage changes are calculated as the effective flow of the period / the stock at the beginning of the period.
b. Total liabilities (consolidated). Inter-general government liabilities are deduced.
c. Including loans transferred to SAREB, which is an Asset Management Corporation (AMC).
___________________________________________________________________________________________________________________________
EUR millions and %
Total Annual growth rate Contribution to col. 3 Non-financial corp. and households and NPISHs Non-financial corp. and households and NPISHs
Stocks Effec- Annual Gene- Gene- tive growth ral ral flow rate go- By sectors By instruments go- By sectors By instrumentss vern- vern- ment Credit ment (b) Non- House- institu- Securi- Exter- (b) Non- House- Credit Securi- Exter- finan- holds tions ties nal finan- holds institu- ties nal cial and loans, other loans cial and tions’ other loans corpo- NPISHs secur. than corpo- NPISHs loans & than rations funds & shares rations securit. shares loans tr. funds to AMC(c)
12 2 804 705 37 449 1.3 19.8 -5.3 -6.4 -3.8 -5.8 14.2 -7.2 5.3 -3.9 -2.7 -1.2 -3.5 0.3 -0.7 13 2 742 459 -38 141 -1.4 8.4 -5.9 -6.6 -5.1 -7.1 3.8 -1.8 2.7 -4.0 -2.5 -1.5 -4.0 0.1 -0.2 14 2 731 546 -3 522 -0.1 7.0 -4.0 -4.2 -3.8 -5.2 1.9 0.5 2.5 -2.6 -1.5 -1.1 -2.7 0.1 0.0
14 Jan 2 779 605 11 549 -0.5 10.6 -5.7 -6.3 -5.1 -7.0 2.5 -1.1 3.4 -3.9 -2.4 -1.5 -3.9 0.1 -0.1 Feb 2 770 837 -6 518 -1.6 8.0 -6.2 -7.2 -4.9 -7.2 -1.5 -2.0 2.6 -4.2 -2.7 -1.4 -3.9 -0.0 -0.2 Mar 2 763 371 -1 007 -1.6 7.0 -5.9 -6.6 -4.8 -7.2 -0.2 -0.2 2.3 -3.9 -2.5 -1.4 -3.9 -0.0 -0.0 Apr 2 752 492 -10 304 -1.3 7.2 -5.5 -6.1 -4.6 -6.9 -0.7 0.9 2.4 -3.7 -2.3 -1.4 -3.7 -0.0 0.1 May 2 761 678 10 440 -1.3 6.1 -5.0 -5.3 -4.6 -6.4 1.0 1.1 2.1 -3.3 -2.0 -1.3 -3.4 0.0 0.1 Jun 2 768 994 10 597 -1.0 6.5 -5.0 -5.4 -4.4 -6.4 2.7 0.8 2.2 -3.3 -2.0 -1.3 -3.4 0.1 0.1 Jul 2 751 972 -15 145 -1.2 5.5 -4.7 -4.8 -4.5 -6.5 -0.3 4.3 1.9 -3.1 -1.8 -1.3 -3.5 -0.0 0.4 Aug 2 752 165 1 009 -0.8 6.1 -4.4 -4.3 -4.6 -6.5 0.1 5.3 2.1 -2.9 -1.6 -1.3 -3.4 0.0 0.5 Sep 2 754 693 5 326 -0.8 6.1 -4.4 -4.7 -4.1 -6.3 3.2 3.4 2.1 -2.9 -1.7 -1.2 -3.3 0.1 0.3 Oct 2 737 987 -12 944 -1.0 6.2 -4.8 -5.5 -4.0 -6.4 1.5 2.0 2.1 -3.1 -2.0 -1.1 -3.4 0.0 0.2 Nov 2 746 510 10 638 -0.6 6.8 -4.5 -5.0 -3.9 -6.0 1.7 1.2 2.4 -3.0 -1.8 -1.1 -3.1 0.0 0.1 Dec 2 731 546 -7 162 -0.1 7.0 -4.0 -4.2 -3.8 -5.2 1.9 0.5 2.5 -2.6 -1.5 -1.1 -2.7 0.1 0.0
15 Jan 2 728 223 -4 554 -0.7 5.1 -3.9 -4.1 -3.6 -5.2 2.2 0.6 1.8 -2.5 -1.5 -1.0 -2.6 0.1 0.1 Feb 2 731 023 3 555 -0.3 4.7 -3.2 -2.8 -3.6 -4.6 9.2 0.5 1.7 -2.0 -1.0 -1.0 -2.3 0.3 0.0 Mar 2 736 589 8 570 0.0 5.1 -2.8 -2.4 -3.4 -4.1 8.1 0.1 1.8 -1.8 -0.9 -1.0 -2.1 0.2 0.0 Apr ... ... ... ... -2.9 -2.6 -3.2 -3.8 5.0 -0.5 ... ... ... ... ... ... ...
BANCO DE ESPAÑA 53* ECONOMIC BULLETIN, JULY-AUGUST 2015 ECONOMIC INDICATORS

2010 2011 2012 2013 2014 2015-12
-10
-8
-6
-4
-2
0
2
4
6
8
10
-12
-10
-8
-6
-4
-2
0
2
4
6
8
10%%
LOANS, SECURITISATION FUNDS AND AMC
TOTAL
FINANCING OF NON-FINANCIAL CORPORATIONS Annual percentage change
2010 2011 2012 2013 2014 2015-12
-10
-8
-6
-4
-2
0
2
4
6
8
10
-12
-10
-8
-6
-4
-2
0
2
4
6
8
10%%
LOANS, SECURITISATION FUNDS AND AMC
SECURITIES OTHER THAN SHARES
EXTERNAL LOANS
TOTAL
FINANCING OF NON-FINANCIAL CORPORATIONS Contributions to the annual percentage change
P
P P P P P P P P
P A A A
. Series depicted in chart.
1 2 . 3 4
. 5 . 6 7 8 9
. 10 11 12 . 13 14
8.6. FINANCING OF NON-FINANCIAL CORPORATIONS RESIDENT IN SPAIN (a)
Source: BE.
a. The annual percentage changes are calculated as the effective flow of the period / the stock at the beginning of the period.
b. Includes issues of resident financial subsidiaries of non-financial corporations, insofar as the funds raised in these issues are routed to the parent company as loans. The issuing
institutions of these financial instruments are classified as Other financial intermediaries in the Boletín Estadístico and in the Financial Accounts of the Spanish Economy.
c. Including loans transferred to SAREB, which is an Asset Management Corporation (AMC).
___________________________________________________________________________________________________________________________
EUR millions and %
Resident credit institu- tions’ loans , Securities other External loans Memoran-
off-balance-sheet than shares (b) dum items: securitised loans & off-
loans transf. to AMC (c) balance- sheet
Stocks Effec- Annual Stocks Annual Contri- of which Annual Contri- Stocks Annual Contri- securi- tive growth growth bution growth bution growth bution tised and flow rate rate to Stocks rate to rate to transferred col.3 Issues col.3 col.3 to AMC by re- loans sident financ. (c) subsid.
12 1 082 851 -76 783 -6.4 736 625 -7.8 -5.5 77 653 60 331 14.2 0.8 268 573 -7.2 -1.7 28 680 13 993 308 -71 010 -6.6 646 868 -9.4 -6.4 80 615 60 529 3.8 0.3 265 826 -1.8 -0.5 37 970 14 949 245 -41 494 -4.2 579 436 -6.9 -4.5 82 137 61 051 1.9 0.2 287 673 0.5 0.1 34 754
14 Jan 1 016 115 -3 061 -6.3 641 675 -9.1 -6.2 81 159 60 507 2.5 0.2 293 281 -1.1 -0.3 38 058 Feb 1 002 139 -12 010 -7.2 633 766 -9.8 -6.6 76 767 56 448 -1.5 -0.1 291 606 -2.0 -0.5 37 666 Mar 996 032 -246 -6.6 627 624 -9.8 -6.6 78 193 56 529 -0.2 -0.0 290 215 -0.2 -0.1 37 454 Apr 995 096 -639 -6.1 623 693 -9.5 -6.3 78 993 56 673 -0.7 -0.0 292 410 0.9 0.2 37 717 May 992 501 -1 769 -5.3 618 778 -8.6 -5.7 81 293 58 204 1.0 0.1 292 431 1.1 0.3 37 609 Jun 985 921 -3 776 -5.4 612 657 -8.7 -5.8 81 763 58 719 2.7 0.2 291 501 0.8 0.2 37 630 Jul 983 943 -498 -4.8 605 237 -8.8 -5.9 80 413 57 577 -0.3 -0.0 298 293 4.3 1.1 37 153 Aug 984 316 718 -4.3 599 243 -8.7 -5.7 80 584 57 711 0.1 0.0 304 488 5.3 1.4 36 745 Sep 977 935 -4 277 -4.7 594 347 -8.8 -5.8 83 373 60 031 3.2 0.2 300 215 3.4 0.9 36 695 Oct 967 551 -7 378 -5.5 585 674 -9.3 -6.1 82 645 60 639 1.5 0.1 299 232 2.0 0.5 36 335 Nov 966 268 490 -5.0 587 737 -8.4 -5.5 82 604 60 687 1.7 0.1 295 926 1.2 0.3 35 919 Dec 949 245 -9 045 -4.2 579 436 -6.9 -4.5 82 137 61 051 1.9 0.2 287 673 0.5 0.1 34 754
15 Jan 947 419 -3 319 -4.1 572 241 -7.0 -4.4 82 913 60 224 2.2 0.2 292 266 0.6 0.2 33 314 Feb 948 193 1 294 -2.8 572 967 -5.8 -3.7 83 858 60 751 9.2 0.7 291 368 0.5 0.1 33 215 Mar 950 240 4 375 -2.4 573 172 -4.8 -3.1 84 499 60 273 8.1 0.6 292 569 0.1 0.0 32 849 Apr 946 574 -2 879 -2.6 571 027 -4.6 -2.9 82 956 59 272 5.0 0.4 292 591 -0.5 -0.2 32 841
BANCO DE ESPAÑA 54* ECONOMIC BULLETIN, JULY-AUGUST 2015 ECONOMIC INDICATORS

2010 2011 2012 2013 2014 2015-8
-6
-4
-2
0
2
4
6
-8
-6
-4
-2
0
2
4
6%%
LOANS, SECURITISATION FUNDS AND AMC. HOUSING
LOANS, SECURITISATION FUNDS AND AMC. OTHER
TOTAL
FINANCING OF HOUSEHOLDS AND NPISHs Annual percentage change
2010 2011 2012 2013 2014 2015-8
-6
-4
-2
0
2
4
6
-8
-6
-4
-2
0
2
4
6%%
LOANS, SECURITISATION FUNDS AND AMC. HOUSING
LOANS, SECURITISATION FUNDS AND AMC. OTHER
TOTAL
FINANCING OF HOUSEHOLDS AND NPISHs Contributions to the annual percentage change
P
P P P P P P P P
P A A A
. Series depicted in chart.
1 2 . 3 4
. 5 . 6 7
. 8 . 9 10 11
8.7. FINANCING OF HOUSEHOLDS AND NPISHS RESIDENT IN SPAIN (a)
Source: BE.
a. The annual percentage changes are calculated as the effective flow of the period / the stock at the beginning of the period.
b. Including loans transferred to SAREB, which is an Asset Management Corporation (AMC).
___________________________________________________________________________________________________________________________
EUR millions and % Resident credit institu- Resident credit institu- Memorandum items:
Total tions’ loans, tions’ loans off-balance-sheet off-balance-sheet off-balance-sheet securitised and securitised loans & loans securitised loans & loans trans.to AMC loans transf.to AMC. Housing (b) transf.to AMC. Other (b) (b)
Contri- Contri-
Stocks Effective Annual Stocks Annual bution Stocks Annual bution Housing Other flow growth growth to growth to rate rate col.3 rate col.3
12 830 879 -33 213 -3.8 641 948 -3.6 -2.7 188 930 -4.7 -1.1 8 813 801 13 782 982 -42 324 -5.1 610 846 -4.6 -3.5 172 136 -6.9 -1.6 6 451 450 14 748 452 -29 708 -3.8 585 272 -3.8 -2.9 163 180 -3.9 -0.9 5 478 529
14 Jan 778 371 -4 341 -5.1 608 438 -4.4 -3.4 169 933 -7.3 -1.6 5 948 444 Feb 774 644 -3 442 -4.9 606 754 -4.2 -3.3 167 889 -7.3 -1.7 6 059 444 Mar 771 507 -2 539 -4.8 602 406 -4.6 -3.6 169 101 -5.6 -1.3 5 982 437 Apr 768 705 -2 523 -4.6 605 791 -3.9 -3.0 162 914 -7.3 -1.6 5 873 488 May 766 449 -1 829 -4.6 600 439 -4.3 -3.3 166 010 -5.6 -1.3 5 815 491 Jun 770 479 4 506 -4.4 597 839 -4.6 -3.5 172 640 -4.0 -0.9 5 562 669 Jul 761 785 -8 296 -4.5 600 163 -3.8 -3.0 161 621 -7.0 -1.6 5 534 632 Aug 757 828 -3 487 -4.6 593 635 -4.5 -3.5 164 193 -5.0 -1.1 5 489 572 Sep 756 457 -677 -4.1 591 265 -3.8 -3.0 165 192 -5.0 -1.1 5 434 568 Oct 753 553 -2 147 -4.0 589 337 -3.7 -2.9 164 215 -4.8 -1.1 5 352 588 Nov 757 297 4 087 -3.9 587 387 -4.1 -3.2 169 910 -3.1 -0.7 5 301 572 Dec 748 452 -9 020 -3.8 585 272 -3.8 -2.9 163 180 -3.9 -0.9 5 478 529
15 Jan 745 228 -2 963 -3.6 582 804 -3.8 -3.0 162 424 -3.1 -0.7 5 385 501 Feb 742 163 -2 830 -3.6 581 300 -3.8 -3.0 160 863 -2.8 -0.6 5 393 494 Mar 740 158 -1 329 -3.4 579 288 -3.4 -2.7 160 869 -3.5 -0.8 5 322 480 Apr 737 412 -363 -3.2 576 789 -3.6 -2.9 160 623 -1.4 -0.3 9 506 1 036
BANCO DE ESPAÑA 55* ECONOMIC BULLETIN, JULY-AUGUST 2015 ECONOMIC INDICATORS

2011 2012 2013 2014 2015-35
-20
-5
10
25
40
55
70
85
-35
-20
-5
10
25
40
55
70
85%%
SHORT-TERM SECURITIES
MEDIUM AND LONG-TERM SECURITIES
NON-COMMERCIAL LOANS AND OTHER
TOTAL
GROSS FINANCING OF GENERAL GOVERNMENT Annual percentage changes
2011 2012 2013 2014 2015-10
-5
0
5
10
15
20
25
30
-10
-5
0
5
10
15
20
25
30%%
SHORT-TERM SECURITIES
MEDIUM AND LONG-TERM SECURITIES
NON-COMMERCIAL LOANS AND OTHER
GROSS FINANCING OF GENERAL GOVERNMENT Contributions to the annual percentage change
P
P P P
P P P P P P P P P P P P
A A A
. Series depicted in chart.
1=4+8+12 2=5+9+13 . 3 4 5
. 6 . 7 8 9
. 10 . 11 12 13
. 14 . 15
8.8. GROSS FINANCING OF SPAIN’S GENERAL GOVERMENT
FUENTE: BE.
a.Debt according to Excessive Deficit Procedure (EDP).Consolidated nominal gross debt.
b.Including coined money and Caja General de Depositos
___________________________________________________________________________________________________________________________
EUR millions and %
Gross financing Short-term securities Medium and long term securities Non Comercial Loans and Others (b) Contribu- Contribu- Contribu-
EDP Monthly 12 Total Monthly 12 tion to Total Monthly 12 tion to Total Monthly 12 tion to Debt change month change month 12-month change month 12-month change month 12-month (a) % % % % % % % change change change change change chage change
10 649 259 80 559 14.2 68 929 -17 466 -20.2 -3.1 465 297 79 014 20.5 13.9 115 033 19 010 19.8 3.3 11 743 531 94 272 14.5 74 185 5 257 7.6 0.8 536 514 71 217 15.3 11.0 132 831 17 798 15.5 2.7 12 890 976 147 445 19.8 60 576 -13 609 -18.3 -1.8 609 311 72 797 13.6 9.8 221 088 88 257 66.4 11.9 13 966 169 75 193 8.4 78 977 18 400 30.4 2.1 686 769 77 458 12.7 8.7 200 423 -20 666 -9.3 -2.3
13 Oct 957 829 -3 402 16.2 75 624 2 869 22.4 1.7 672 784 -5 235 14.7 10.5 209 421 -1 037 19.1 4.1 Nov 957 765 -64 14.3 77 512 1 888 19.1 1.5 682 652 9 868 14.1 10.1 197 601 -11 820 13.3 2.8 Dec 966 169 8 404 8.4 78 977 1 464 30.4 2.1 686 769 4 118 12.7 8.7 200 423 2 822 -9.3 -2.3
14 Jan 985 120 18 951 10.6 78 615 -361 31.6 2.1 697 604 10 835 12.0 8.4 208 900 8 477 0.5 0.1 Feb 994 054 8 934 8.0 76 530 -2 086 21.0 1.4 710 584 12 980 12.2 8.4 206 940 -1 959 -7.7 -1.9 Mar 995 832 1 778 7.0 72 474 -4 055 18.1 1.2 716 487 5 903 11.0 7.6 206 870 -70 -7.3 -1.8 Apr 988 690 -7 142 7.2 70 736 -1 738 16.1 1.1 711 557 -4 930 11.4 7.9 206 396 -474 -7.2 -1.7 May 1 002 728 14 038 6.1 71 667 931 16.5 1.1 725 035 13 478 8.1 5.8 206 026 -371 -3.4 -0.8 Jun 1 012 595 9 867 6.5 74 652 2 985 12.7 0.9 730 181 5 146 8.5 6.0 207 762 1 736 -1.5 -0.3 Jul 1 006 244 -6 351 5.5 73 032 -1 620 3.0 0.2 728 613 -1 568 8.4 5.9 204 599 -3 162 -3.1 -0.7 Aug 1 010 021 3 777 6.1 72 271 -761 2.1 0.2 733 324 4 711 9.2 6.5 204 427 -173 -2.2 -0.5 Sep 1 020 302 10 280 6.1 74 078 1 806 1.8 0.1 741 029 7 705 9.3 6.6 205 195 769 -2.5 -0.5 Oct 1 016 883 -3 419 6.2 74 759 681 -1.1 -0.1 736 145 -4 884 9.4 6.6 205 979 784 -1.6 -0.4 Nov 1 022 945 6 062 6.8 77 028 2 269 -0.6 -0.1 740 269 4 124 8.4 6.0 205 648 -331 4.1 0.8 Dec 1 033 848 10 904 7.0 77 611 583 -1.7 -0.1 747 490 7 221 8.8 6.3 208 747 3 099 4.2 0.9
15 Jan 1 035 576 1 728 5.1 78 991 1 380 0.5 0.0 746 115 -1 375 7.0 4.9 210 470 1 723 0.8 0.2 Feb 1 040 667 5 091 4.7 76 299 -2 691 -0.3 -0.0 755 915 9 800 6.4 4.6 208 452 -2 017 0.7 0.2 Mar 1 046 192 5 525 5.1 75 220 -1 079 3.8 0.3 764 166 8 251 6.7 4.8 206 805 -1 647 -0.0 -0.0
BANCO DE ESPAÑA 56* ECONOMIC BULLETIN, JULY-AUGUST 2015 ECONOMIC INDICATORS

2010 2011 2012 2013 2014-24
-22
-20
-18
-16
-14
-12
-10
-8
-6
-4
-2
0
2
-24
-22
-20
-18
-16
-14
-12
-10
-8
-6
-4
-2
0
2%%
TOTAL
PRODUCTIVE ACTIVITIES
INDIVIDUALS
CONSTRUCTION AND HOUSINING (d)
CREDIT BY END-USE Annual percentage changes (c)
2010 2011 2012 2013 2014-24
-22
-20
-18
-16
-14
-12
-10
-8
-6
-4
-2
0
2
-24
-22
-20
-18
-16
-14
-12
-10
-8
-6
-4
-2
0
2%%
TOTAL
HOME PURCHASES
PURCHASE OF CONSUMER DURABLES
CREDIT TO INDIVIDUALS BY END-USE Annual percentages changes (c)
R P
. Series depicted in chart.
. 1 . 2 3 4 5 6 7
. 8 9 . 10
. 11 12 13 14 . 15
8.9 LENDING BY CREDIT INSTITUTIONS AND CFI’s TO OTHER RESIDENT SECTORS. BREAKDOWN BY END-USE.
SOURCE: BE.
a. See chapters 4.13, 4.18 y 4.23 of the Boletín Estadístico and their notes which are published at www.bde.es and the notes of changes.
b. Includes loans and credit to households for the purchase of land and rural property, the purchase of securities, the purchase of current goods and services not considered to
be consumer durables (e.g. loans to finance travel expenses) and for various end-uses not included in the foregoing.
c. Asset-backed securities brought back onto the balance sheet as a result of the entry into force of Banco de España Circular BE 4/2004 have caused a break in the series in
June 2005. The rates depicted in the chart have been adjusted to eliminate this effect.
d. Including: construction, real estate activities and home purchases and improvements___________________________________________________________________________________________________________________________
EUR millions and percentages Financing of productive activities Financing of individuals Finan- Unclas- Memo- cing of sified randum private item: Agricul- Industry Cons- Services Home purchases and Pur- non- cons-
Total Total ture excluding truc- Total improvements chases Other profit truction (a) and construc- tion Of which of institu- and fish- tion Of which consumer (b) tions housing eries durables (d) Total Real estate Total Purchases activities
09 1 837 038 999 570 23 123 152 199 130 438 693 809 322 984 813 939 654 566 624 755 49 273 110 101 5 523 18 006 1 107 988 10 1 843 952 1 012 916 23 128 152 376 114 519 722 893 315 782 812 781 662 798 632 449 42 068 107 916 6 096 12 159 1 093 099 11 1 782 555 970 773 21 782 143 246 98 546 707 198 298 323 793 430 656 452 626 550 37 686 99 292 7 000 11 352 1 053 321 12 1 604 961 829 788 20 217 131 109 76 217 602 246 224 015 755 689 633 138 605 057 32 904 89 647 6 976 12 507 933 370
11 Q3 1 788 847 976 280 22 203 145 503 102 258 706 316 303 506 794 554 655 726 625 101 38 478 100 350 6 557 11 455 1 061 491 Q4 1 782 555 970 773 21 782 143 246 98 546 707 198 298 323 793 430 656 452 626 550 37 686 99 292 7 000 11 352 1 053 321
12 Q1 1 768 488 968 348 21 416 139 850 96 193 710 889 295 696 782 441 649 716 620 182 35 835 96 890 6 643 11 055 1 041 606 Q2 1 744 215 944 709 21 085 138 007 91 869 693 749 286 942 779 915 644 201 614 707 34 726 100 988 7 013 12 578 1 023 012 Q3 1 701 789 916 389 20 852 135 138 87 794 672 604 280 245 767 855 639 522 610 943 31 953 96 381 6 910 10 635 1 007 561 Q4 1 604 961 829 788 20 217 131 109 76 217 602 246 224 015 755 689 633 138 605 057 32 904 89 647 6 976 12 507 933 370
13 Q1 1 558 660 798 151 19 138 127 110 69 013 582 891 204 281 743 849 625 439 599 955 29 212 89 199 6 759 9 901 898 732 Q2 1 519 123 763 059 18 974 122 351 64 195 557 539 198 432 738 107 618 663 593 929 26 762 92 683 6 754 11 203 881 290 Q3 1 481 543 742 033 18 731 118 251 62 934 542 117 195 083 724 319 610 497 586 299 27 239 86 583 6 882 8 309 868 514 Q4 1 448 244 719 180 18 448 115 465 60 154 525 113 176 822 714 984 604 395 580 784 25 910 84 679 6 299 7 781 841 371
14 Q1 1 440 349 712 509 17 756 113 148 58 386 523 218 170 839 713 733 599 144 576 464 22 671 91 918 6 221 7 887 828 369 Q2 1 423 178 693 553 17 571 110 307 55 436 510 239 161 218 713 717 595 437 573 393 25 321 92 959 6 376 9 532 812 091 Q3 1 386 860 671 336 17 793 108 673 53 403 491 467 156 197 697 741 586 086 564 252 24 459 87 196 6 972 10 811 795 686 Q4 1 380 222 674 082 17 693 112 271 49 754 494 364 150 328 690 203 579 823 558 003 29 252 81 128 5 962 9 976 779 905
BANCO DE ESPAÑA 57* ECONOMIC BULLETIN, JULY-AUGUST 2015 ECONOMIC INDICATORS

2011 2012 2013 2014 2015-40
-30
-20
-10
0
10
-40
-30
-20
-10
0
10%%
RETURN ON OWN FUNDS (c)
INTEREST INCOME (c)
INTEREST EXPENSES (c)
DIFF. BETWEEN AVERAGE RETURN AND COST
PROFIT AND LOSS ACCOUNT Percentages of the adjusted average balance sheet and returns
2011 2012 2013 2014 2015-9
-8
-7
-6
-5
-4
-3
-2
-1
0
1
2
3
-9
-8
-7
-6
-5
-4
-3
-2
-1
0
1
2
3%%
GROSS INCOME
GROSS INCOME (c)
NET INTEREST INCOME
NET INTEREST INCOME (c)
ADJUSTED NET INCOME
ADJUSTED NET INCOME (c)
PROFIT BEFORE TAX
PROFIT BEFORE TAX (c)
PROFIT AND LOSS ACCOUNT Percentages of the adjusted average balance sheet
. Series depicted in chart.
. 1 . 2
. 3 4 . 5 6 7 8
. 9 10 . 11
. 12 13 14 . 15
8.10. PROFIT AND LOSS ACCOUNT OF DEPOSIT-TAKING INSTITUTIONS RESIDENT IN SPAIN
Source: BE.
Note: The underlying series for this indicator are in Table 4.36 of the BE Boletín estadístico.
a. Profit before tax divided by own funds.
b. Only those financial assets and liabilities which respectively give rise to financial income and costs have been considered to calculate the averge return and cost.
c. Average of the last four quarters.
___________________________________________________________________________________________________________________________
As a percentage of the adjusted average balance sheet Percentages Return Average Average Average Inte- on Of Other Adjus- Other return return cost of
Inte- rest Net in- equity Gross Opera- which: opera- ted net Profit on own on lend- borrow- Differ- rest expen- terest instru- income ting ting net income before funds ing ing ence
income ses income ments expen- Staff income income tax opera- opera- (12-13 ) and non ses: costs (a) tions tions interest (b) (b) income
12 2.4 1.4 1.0 0.9 1.8 0.9 0.5 6.3 -5.3 3.3 -8.3 -39.2 2.8 1.8 1.0 13 2.2 1.2 0.9 0.9 1.8 1.0 0.5 0.8 0.1 0.4 -0.1 2.0 2.4 1.6 0.8 14 2.0 0.9 1.1 1.0 2.1 1.0 0.5 0.7 0.3 -0.1 0.5 5.9 2.2 1.2 0.9
12 Q2 2.6 1.5 1.1 1.0 2.0 0.9 0.5 2.3 -1.1 0.6 -1.8 -15.4 3.0 2.0 0.9 Q3 2.4 1.4 1.1 0.8 1.8 0.8 0.5 2.0 -1.0 0.5 -1.1 -18.3 2.9 1.9 1.0 Q4 2.4 1.4 1.0 0.9 1.8 0.9 0.5 6.3 -5.3 3.3 -8.3 -39.2 2.8 1.8 1.0
13 Q1 2.3 1.4 0.9 0.8 1.8 0.9 0.5 0.7 0.2 0.1 0.0 -41.3 2.6 1.7 0.9 Q2 2.3 1.3 0.9 1.4 2.4 0.9 0.5 1.0 0.4 0.2 0.4 -34.3 2.5 1.7 0.9 Q3 2.2 1.3 0.9 0.8 1.7 0.9 0.5 0.8 -0.0 0.4 0.3 -29.3 2.4 1.6 0.8 Q4 2.2 1.2 0.9 0.9 1.8 1.0 0.5 0.8 0.1 0.4 -0.1 2.0 2.4 1.6 0.8
14 Q1 2.1 1.1 0.9 1.2 2.2 1.0 0.5 0.5 0.7 0.2 0.6 3.9 2.3 1.5 0.8 Q2 2.1 1.1 1.0 1.3 2.3 1.0 0.5 0.7 0.7 0.1 0.5 4.0 2.2 1.4 0.8 Q3 2.0 1.0 1.0 0.7 1.8 1.0 0.5 0.5 0.3 0.2 0.3 4.1 2.2 1.3 0.9 Q4 2.0 0.9 1.1 1.0 2.1 1.0 0.5 0.7 0.3 -0.1 0.5 5.9 2.2 1.2 0.9
15 Q1 1.8 0.8 1.0 1.2 2.2 1.0 0.5 0.5 0.7 0.2 0.6 5.7 2.1 1.1 1.0
BANCO DE ESPAÑA 58* ECONOMIC BULLETIN, JULY-AUGUST 2015 ECONOMIC INDICATORS
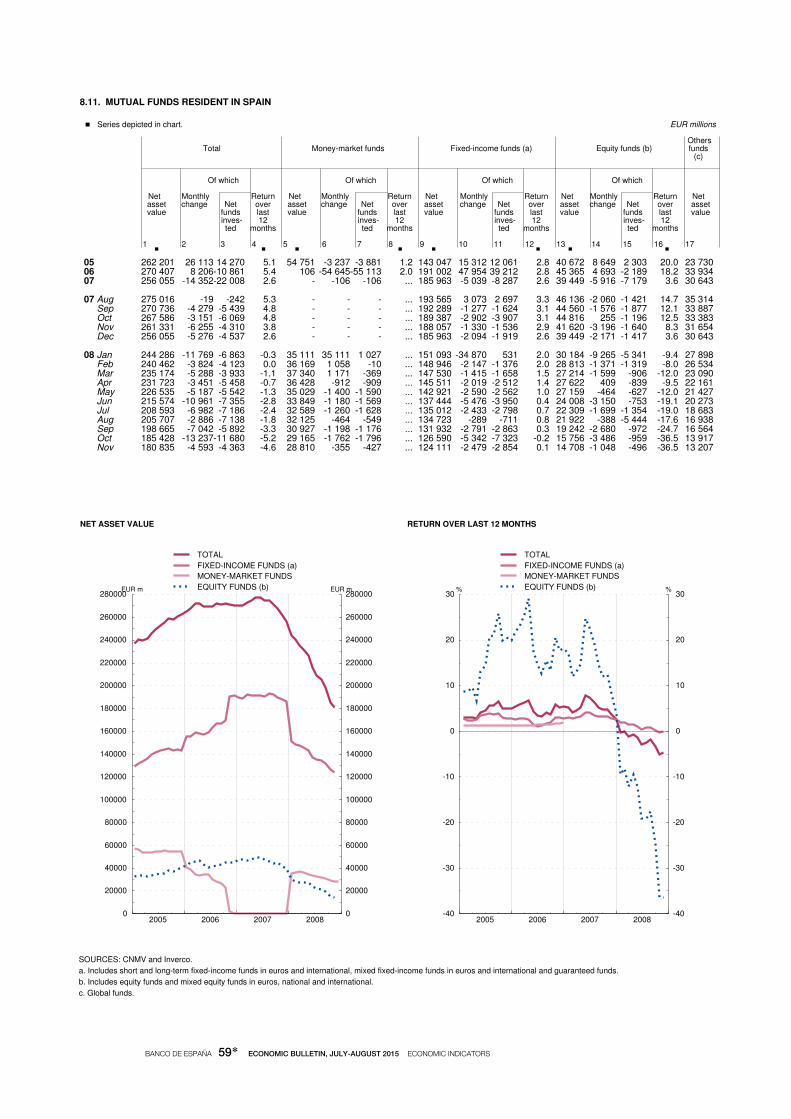
2005 2006 2007 20080
20000
40000
60000
80000
100000
120000
140000
160000
180000
200000
220000
240000
260000
280000
0
20000
40000
60000
80000
100000
120000
140000
160000
180000
200000
220000
240000
260000
280000EUR mEUR m
TOTAL
FIXED-INCOME FUNDS (a)
MONEY-MARKET FUNDS
EQUITY FUNDS (b)
NET ASSET VALUE
2005 2006 2007 2008-40
-30
-20
-10
0
10
20
30
-40
-30
-20
-10
0
10
20
30%%
TOTAL
FIXED-INCOME FUNDS (a)
MONEY-MARKET FUNDS
EQUITY FUNDS (b)
RETURN OVER LAST 12 MONTHS
. Series depicted in chart.
. 1 2 3 . 4
. 5 6 7 . 8
. 9 10 11 . 12
. 13 14 15 . 16 17
8.11. MUTUAL FUNDS RESIDENT IN SPAIN
SOURCES: CNMV and Inverco.
a. Includes short and long-term fixed-income funds in euros and international, mixed fixed-income funds in euros and international and guaranteed funds.
b. Includes equity funds and mixed equity funds in euros, national and international.
c. Global funds.
___________________________________________________________________________________________________________________________
EUR millions Others
Total Money-market funds Fixed-income funds (a) Equity funds (b) funds (c)
Of which Of which Of which Of which
Net Monthly Return Net Monthly Return Net Monthly Return Net Monthly Return Net asset change Net over asset change Net over asset change Net over asset change Net over asset value funds last value funds last value funds last value funds last value inves- 12 inves- 12 inves- 12 inves- 12 ted months ted months ted months ted months
05 262 201 26 113 14 270 5.1 54 751 -3 237 -3 881 1.2 143 047 15 312 12 061 2.8 40 672 8 649 2 303 20.0 23 730 06 270 407 8 206 -10 861 5.4 106 -54 645 -55 113 2.0 191 002 47 954 39 212 2.8 45 365 4 693 -2 189 18.2 33 934 07 256 055 -14 352 -22 008 2.6 - -106 -106 ... 185 963 -5 039 -8 287 2.6 39 449 -5 916 -7 179 3.6 30 643
07 Aug 275 016 -19 -242 5.3 - - - ... 193 565 3 073 2 697 3.3 46 136 -2 060 -1 421 14.7 35 314 Sep 270 736 -4 279 -5 439 4.8 - - - ... 192 289 -1 277 -1 624 3.1 44 560 -1 576 -1 877 12.1 33 887 Oct 267 586 -3 151 -6 069 4.8 - - - ... 189 387 -2 902 -3 907 3.1 44 816 255 -1 196 12.5 33 383 Nov 261 331 -6 255 -4 310 3.8 - - - ... 188 057 -1 330 -1 536 2.9 41 620 -3 196 -1 640 8.3 31 654 Dec 256 055 -5 276 -4 537 2.6 - - - ... 185 963 -2 094 -1 919 2.6 39 449 -2 171 -1 417 3.6 30 643
08 Jan 244 286 -11 769 -6 863 -0.3 35 111 35 111 1 027 ... 151 093 -34 870 531 2.0 30 184 -9 265 -5 341 -9.4 27 898 Feb 240 462 -3 824 -4 123 0.0 36 169 1 058 -10 ... 148 946 -2 147 -1 376 2.0 28 813 -1 371 -1 319 -8.0 26 534 Mar 235 174 -5 288 -3 933 -1.1 37 340 1 171 -369 ... 147 530 -1 415 -1 658 1.5 27 214 -1 599 -906 -12.0 23 090 Apr 231 723 -3 451 -5 458 -0.7 36 428 -912 -909 ... 145 511 -2 019 -2 512 1.4 27 622 409 -839 -9.5 22 161 May 226 535 -5 187 -5 542 -1.3 35 029 -1 400 -1 590 ... 142 921 -2 590 -2 562 1.0 27 159 -464 -627 -12.0 21 427 Jun 215 574 -10 961 -7 355 -2.8 33 849 -1 180 -1 569 ... 137 444 -5 476 -3 950 0.4 24 008 -3 150 -753 -19.1 20 273 Jul 208 593 -6 982 -7 186 -2.4 32 589 -1 260 -1 628 ... 135 012 -2 433 -2 798 0.7 22 309 -1 699 -1 354 -19.0 18 683 Aug 205 707 -2 886 -7 138 -1.8 32 125 -464 -549 ... 134 723 -289 -711 0.8 21 922 -388 -5 444 -17.6 16 938 Sep 198 665 -7 042 -5 892 -3.3 30 927 -1 198 -1 176 ... 131 932 -2 791 -2 863 0.3 19 242 -2 680 -972 -24.7 16 564 Oct 185 428 -13 237 -11 680 -5.2 29 165 -1 762 -1 796 ... 126 590 -5 342 -7 323 -0.2 15 756 -3 486 -959 -36.5 13 917 Nov 180 835 -4 593 -4 363 -4.6 28 810 -355 -427 ... 124 111 -2 479 -2 854 0.1 14 708 -1 048 -496 -36.5 13 207
BANCO DE ESPAÑA 59* ECONOMIC BULLETIN, JULY-AUGUST 2015 ECONOMIC INDICATORS

2011 2012 2013 2014120
140
160
180
200
220
240
260
280
300
320
340
120
140
160
180
200
220
240
260
280
300
320
340IndicesIndices
MADRID STOCK EXCHANGE INDEX
IBEX-35
DJ EURO STOXX BROAD
DJ EURO STOXX 50
SHARE PRICE INDICES JAN 1994 = 100
2011 2012 2013 20140
100000
200000
300000
400000
500000
600000
700000
800000
0
100000
200000
300000
400000
500000
600000
700000
800000EUR MEUR M
BOOK-ENTRY GVT. DEBT
EQUITIES
AIAF
TURNOVER ON SECURITIES MARKETS
A
. Series depicted in chart.
. 1 . 2
. 3 . 4
. 5 6 . 7
. 8 9 10 11 12
8.12. SHARE PRICE INDICES AND TURNOVER ON SECURITIES MARKETS. SPAIN AND EURO AREA
___________________________________________________________________________________________________________________________
Indices, EUR millions and thousands of contracts
Share price indices Turnover on securities markets Financial options Financial futures
General Dow Jones Stock market AIAF (thousands of (thousands of Madrid EURO STOXX indices Book-entry fixed- contracts) contracts) Stock IBEX government income
Exchange 35 debt market Shares Shares Broad 50 Equities Bonds Fixed- and other Fixed- and other income equities income equities
13 883.52 8 718.64 283.43 2 809.28 698 744 46 094 5 057 285 1 293 402 - 27 462 - 5 778 14 1 073.64 10 529.84 320.84 3 167.93 884 349 38 114 6 267 303 1 099 992 - 26 367 - 7 236 15 1 126.30 11 118.32 364.64 3 564.61 347 510 12 345 2 180 812 225 331 - 6 694 - 2 592
P
Sources: Madrid, Barcelona, Bilbao and Valencia Stock Exchanges (columns 1, 2, 5 and 6); Reuters (columns 3 and4); AIAF (column 8) and Spanish Financial Futures
Market (MEFFSA) (columns 9 to 12)
14 Jan 1 012.85 9 920.20 307.33 3 013.96 74 939 2 530 614 391 90 964 ... 2 988 ... 660 Feb 1 034.34 10 114.20 322.43 3 149.23 50 973 2 418 544 467 143 929 ... 1 524 ... 523 Mar 1 056.06 10 340.50 323.35 3 161.60 64 726 4 182 513 320 144 325 ... 2 423 ... 582 Apr 1 070.05 10 459.00 324.97 3 198.39 78 741 3 687 492 433 122 334 ... 1 836 ... 559 May 1 106.04 10 798.70 329.79 3 244.60 72 282 3 009 554 780 128 261 ... 1 848 ... 535 Jun 1 116.05 10 923.50 326.10 3 228.24 75 549 2 732 531 607 101 957 ... 2 384 ... 540 Jul 1 092.82 10 707.20 314.68 3 115.51 90 178 4 509 616 036 100 025 ... 2 375 ... 585 Aug 1 094.63 10 728.80 319.65 3 172.63 44 238 2 459 462 166 48 558 ... 1 205 ... 542 Sep 1 104.62 10 825.50 321.96 3 225.93 62 114 2 656 538 956 55 548 ... 2 109 ... 583 Oct 1 062.15 10 477.80 313.30 3 113.32 95 633 3 425 543 022 58 337 ... 2 550 ... 875 Nov 1 090.60 10 770.70 327.56 3 250.93 94 176 2 743 452 975 42 990 ... 2 165 ... 622 Dec 1 042.46 10 279.50 319.67 3 146.43 80 799 3 764 403 149 62 765 ... 2 960 ... 630
15 Jan 1 051.80 10 403.30 342.26 3 351.44 93 850 2 489 567 722 49 790 ... 1 626 ... 771 Feb 1 132.91 11 178.30 367.25 3 599.00 80 983 2 735 557 632 55 109 ... 1 503 ... 567 Mar 1 168.87 11 521.10 377.92 3 697.38 85 725 4 104 559 826 54 835 ... 2 095 ... 613 Apr 1 153.14 11 385.00 371.62 3 615.59 86 952 3 017 495 631 65 597 ... 1 469 ... 641
BANCO DE ESPAÑA 60* ECONOMIC BULLETIN, JULY-AUGUST 2015 ECONOMIC INDICATORS

2009 2010 2011 2012 2013 20140
100
200
300
400
500
600
700
800
900
1000
1100
1200
1300
1400
0
100
200
300
400
500
600
700
800
900
1000
1100
1200
1300
1400bn
Total assets
Foreign assets
Assets on resident General government
Assets on resident Monetary financial institutions
Assets on other resident sectors
FINANCIAL ASSETS
2009 2010 2011 2012 2013 2014160
180
200
220
240
260
280
300
320
340
360
380
400
160
180
200
220
240
260
280
300
320
340
360
380
400bn
Foreign liabilities
Liabilities on resident Monetary financial institutions
Liabilities on other resident sectors
Shares and other equity
LIABILITIES
. Series depicted in chart.
11-14-15 2=3-4 . 3
. 4 5=6-7 . 6
. 7 8=9-10 . 9
. 10 11=12-13 . 12
. 13 14 15 . 12
8.13. OTHER FINANCIAL CORPORATIONS (a): CONSOLIDATED FINANCIAL BALANCE SHEET (b)
SOURCE: Financial accounts of the spanish economy
(a) Consisting of Investment funds (Collective investment funds including monetary funds), Limitied scope financial institutions and money lenders, Insurance companies and
Pension funds, Other financial intermediaries and Financial auxiliaries
(b) Consolidation refers to the netting of the asset and liability positions (intra-sectoral) between corporations that comprise an economic sector or group of economic sectors, in this
case, those included under the institutional grouping of Other financial corporations
(c) Except Money market funds which are included among the corporations under the institutional grouping of Other financial corporations
(d) Non-financial corporations, Households and Non-profit institutions serving households___________________________________________________________________________________________________________________________
EUR billions Net claims on Net claims on Net claims on Net foreign assets resident General resident Monetary other resident sectors (d) government financial institutions (c) Pro
Net Shares Rest of memoria: financial and other Total assets other Liabi- financial
equity lities assets Net Assets Liabilities Net Assets Liabi- Net Assets Liabi- Net Assets Liabi- (net) lities lities lities
1=2+5+8+ 16=3+6+9+
06 13 26 330 304 61 61 - 418 484 66 -26 247 273 487 -22 1 121 07 8 -44 315 359 56 56 - 501 663 162 -21 268 289 504 -20 1 301 08 26 -73 252 325 59 60 2 441 739 298 -96 190 286 318 -14 1 240 09 31 -30 273 303 72 75 3 409 760 351 -62 237 299 375 -16 1 346
11 Q1 38 -39 224 263 99 102 3 374 765 391 -83 227 310 339 -26 1 318 Q2 35 -48 207 255 106 109 3 367 758 390 -94 209 303 314 -19 1 283 Q3 36 -42 200 242 112 115 3 358 739 381 -104 202 307 302 -14 1 256 Q4 41 -38 188 226 120 122 1 350 732 382 -107 201 309 296 -12 1 243
12 Q1 45 -35 187 222 120 120 - 346 732 386 -113 198 310 292 -19 1 236 Q2 57 -6 181 188 119 119 - 320 681 361 -117 186 303 277 -18 1 168 Q3 36 -15 178 194 124 124 - 313 642 329 -124 184 308 275 -14 1 129 Q4 15 -37 179 216 126 127 1 282 626 344 -100 211 310 273 -17 1 142
13 Q1 15 -34 181 215 131 133 2 275 626 351 -95 219 314 282 -19 1 159 Q2 7 -28 180 208 138 139 2 263 584 322 -96 218 313 288 -19 1 121 Q3 3 -22 184 206 143 145 2 261 570 309 -97 221 318 300 -18 1 120 Q4 -10 -16 187 203 152 154 2 252 552 300 -103 222 325 315 -19 1 115
14 Q1 -18 -8 197 205 161 162 2 256 541 285 -118 218 336 329 -20 1 119 Q2 -13 4 209 204 165 167 2 268 553 285 -110 232 341 360 -19 1 159 Q3 -24 15 218 203 163 165 2 257 537 280 -109 232 341 371 -21 1 151 Q4 -32 16 222 206 163 165 2 250 540 290 -107 230 336 376 -21 1 157
BANCO DE ESPAÑA 61* ECONOMIC BULLETIN, JULY-AUGUST 2015 ECONOMIC INDICATORS

2011 2012 2013 2014-0.4
-0.2
0.0
0.2
0.4
0.6
0.8
1.0
1.2
1.4
1.6
1.8
2.0
2.2
2.4
-0.4
-0.2
0.0
0.2
0.4
0.6
0.8
1.0
1.2
1.4
1.6
1.8
2.0
2.2
2.4%%
MARGINAL LENDING FACILITY
EURO AREA OVERNIGHT (EONIA)
MAIN REFINANCING OPERATIONS
DEPOSIT FACILITY
EUROSYSTEM: MONETARY POLICY OPERATIONS AND EURO AREA OVERNIGHT DEPOSITS
2011 2012 2013 2014-0.4
-0.2
0.0
0.2
0.4
0.6
0.8
1.0
1.2
1.4
1.6
1.8
2.0
2.2
2.4
-0.4
-0.2
0.0
0.2
0.4
0.6
0.8
1.0
1.2
1.4
1.6
1.8
2.0
2.2
2.4%%
EURO AREA 12 MONTHS
EURO AREA 3 MONTHS
INTERBANK MARKET: EURO AREA 3-MONTH AND 1-YEAR RATES
A
. Series depicted in chart.
. 1 2 . 3
. 4 . 5 6
. 7 8 . 9 10 11 12 13 14 15 16 17 18
9.1. INTEREST RATES. EUROSYSTEM AND MONEY MARKET. EURO AREA AND SPAIN
___________________________________________________________________________________________________________________________
Averages of daily data. Percentages per annum
Eurosystem monetary policy Money market operations
Main Longer Standing Euro area: deposits Spain refinan- term facilities (Euribor) (a) cing ope- refinan- rations: cing ope- weekly rations: Non-transferable deposits Govermment-securities tenders monthly Margin- repos
tenders al Over- lending Deposit night 1-month 3-month 6-month 1-year (EONIA) Over- 1-month 3-month 6-month 1-year Over- 1-month 3-month 1-year night night
13 0.25 0.25 0.75 0.00 0.089 0.13 0.22 0.34 0.54 0.15 0.41 1.07 0.33 0.53 0.08 0.34 0.45 - 14 0.05 0.05 0.30 -0.20 0.095 0.13 0.21 0.31 0.48 0.11 0.18 0.45 - 0.55 0.09 0.14 0.24 - 15 0.05 0.05 0.30 -0.20 -0.064 -0.02 0.03 0.10 0.22 -0.04 0.05 0.17 - - -0.09 -0.01 0.02 0.17
Source: ECB (columns 1 to 8).
a. To December 1998, synthetic euro area rates have been calculated on the basis of national rates weighted by GDP
14 Feb 0.25 0.25 0.75 0.00 0.157 0.22 0.29 0.39 0.55 0.17 0.30 0.70 - 0.55 0.18 0.24 0.22 - Mar 0.25 0.25 0.75 0.00 0.192 0.23 0.31 0.41 0.58 0.20 0.30 - - - 0.20 0.25 0.26 - Apr 0.25 - 0.75 0.00 0.254 0.25 0.33 0.43 0.60 0.25 0.28 - - - 0.26 0.25 0.49 - May 0.25 0.25 0.75 0.00 0.248 0.26 0.32 0.42 0.59 0.26 0.25 0.55 - - 0.27 0.30 0.36 - Jun 0.15 0.15 0.40 -0.10 0.076 0.15 0.24 0.33 0.51 0.10 0.15 - - - 0.08 0.15 0.17 - Jul 0.15 0.15 0.40 -0.10 0.043 0.10 0.21 0.30 0.49 0.07 0.27 - - - 0.04 0.06 0.11 - Aug 0.15 0.15 0.40 -0.10 0.018 0.09 0.19 0.29 0.47 0.07 0.13 0.42 - - -0.02 0.06 0.19 - Sep 0.05 0.05 0.30 -0.20 0.007 0.02 0.10 0.20 0.36 0.05 0.08 - - - -0.01 0.01 0.08 - Oct 0.05 0.05 0.30 -0.20 -0.004 0.01 0.08 0.18 0.34 0.03 0.03 - - - -0.01 0.03 0.06 - Nov 0.05 0.05 0.30 -0.20 -0.012 0.01 0.08 0.18 0.34 0.02 0.06 0.37 - - -0.01 0.06 0.12 - Dec 0.05 0.05 0.30 -0.20 -0.030 0.02 0.08 0.18 0.33 0.01 0.04 0.22 - - -0.03 0.14 0.30 -
15 Jan 0.05 0.05 0.30 -0.20 -0.051 0.01 0.06 0.15 0.30 -0.04 0.04 - - - -0.07 0.01 0.08 0.17 Feb 0.05 0.05 0.30 -0.20 -0.036 0.00 0.05 0.13 0.26 -0.00 0.07 0.20 - - -0.02 0.04 0.04 - Mar 0.05 0.05 0.30 -0.20 -0.050 -0.01 0.03 0.10 0.21 -0.03 0.05 - - - -0.06 0.00 0.06 - Apr 0.05 0.05 0.30 -0.20 -0.074 -0.03 0.00 0.07 0.18 -0.07 0.03 - - - -0.14 -0.03 -0.03 - May 0.05 0.05 0.30 -0.20 -0.106 -0.05 -0.01 0.06 0.17 -0.07 0.05 0.15 - - -0.15 -0.07 -0.06 -
BANCO DE ESPAÑA 62* ECONOMIC BULLETIN, JULY-AUGUST 2015 ECONOMIC INDICATORS
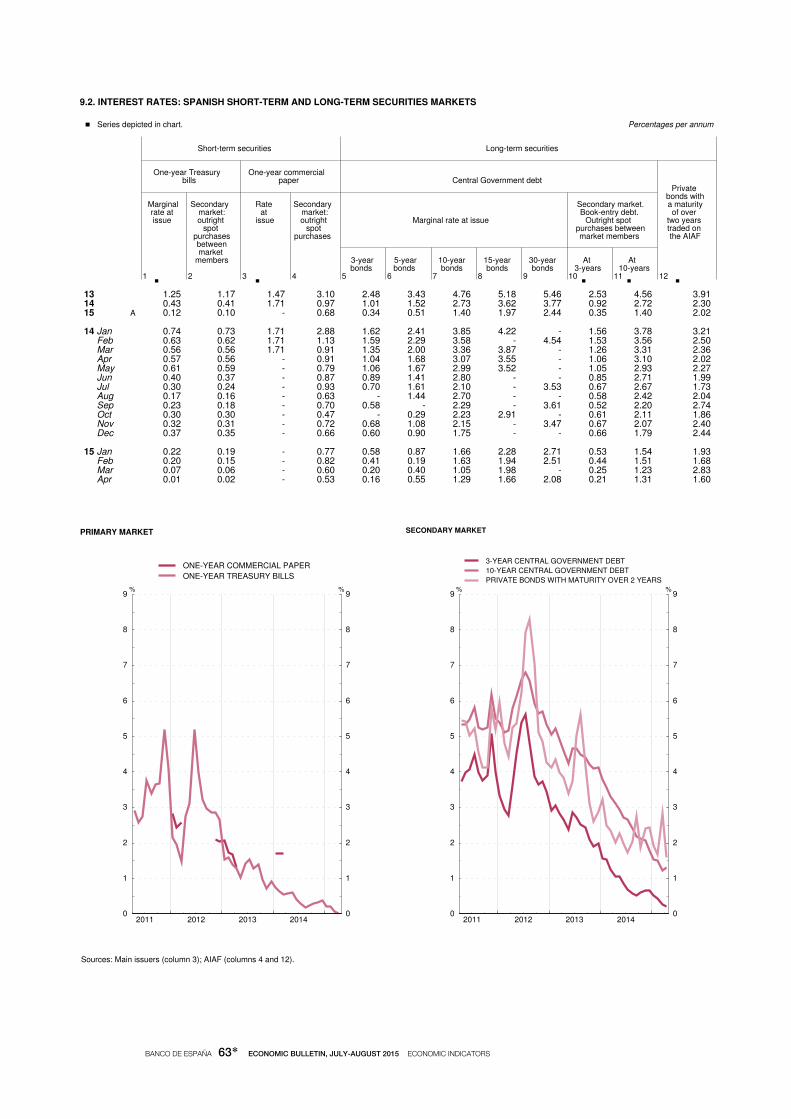
2011 2012 2013 20140
1
2
3
4
5
6
7
8
9
0
1
2
3
4
5
6
7
8
9%%
ONE-YEAR COMMERCIAL PAPER
ONE-YEAR TREASURY BILLS
PRIMARY MARKET
2011 2012 2013 20140
1
2
3
4
5
6
7
8
9
0
1
2
3
4
5
6
7
8
9%%
3-YEAR CENTRAL GOVERNMENT DEBT
10-YEAR CENTRAL GOVERNMENT DEBT
PRIVATE BONDS WITH MATURITY OVER 2 YEARS
SECONDARY MARKET
A
. Series depicted in chart.
. 1 2 . 3 4 5 6 7 8 9
. 10 . 11
. 12
9.2. INTEREST RATES: SPANISH SHORT-TERM AND LONG-TERM SECURITIES MARKETS
Sources: Main issuers (column 3); AIAF (columns 4 and 12).
___________________________________________________________________________________________________________________________
Percentages per annum
Short-term securities Long-term securities
One-year Treasury One-year commercial bills paper Central Government debt
Private bonds with
Marginal Secondary Rate Secondary Secondary market. a maturity rate at market: at market: Book-entry debt. of over issue outright issue outright Marginal rate at issue Outright spot two years spot spot purchases between traded on purchases purchases market members the AIAF between market members 3-year 5-year 10-year 15-year 30-year At At bonds bonds bonds bonds bonds 3-years 10-years
13 1.25 1.17 1.47 3.10 2.48 3.43 4.76 5.18 5.46 2.53 4.56 3.91 14 0.43 0.41 1.71 0.97 1.01 1.52 2.73 3.62 3.77 0.92 2.72 2.30 15 0.12 0.10 - 0.68 0.34 0.51 1.40 1.97 2.44 0.35 1.40 2.02
14 Jan 0.74 0.73 1.71 2.88 1.62 2.41 3.85 4.22 - 1.56 3.78 3.21 Feb 0.63 0.62 1.71 1.13 1.59 2.29 3.58 - 4.54 1.53 3.56 2.50 Mar 0.56 0.56 1.71 0.91 1.35 2.00 3.36 3.87 - 1.26 3.31 2.36 Apr 0.57 0.56 - 0.91 1.04 1.68 3.07 3.55 - 1.06 3.10 2.02 May 0.61 0.59 - 0.79 1.06 1.67 2.99 3.52 - 1.05 2.93 2.27 Jun 0.40 0.37 - 0.87 0.89 1.41 2.80 - - 0.85 2.71 1.99 Jul 0.30 0.24 - 0.93 0.70 1.61 2.10 - 3.53 0.67 2.67 1.73 Aug 0.17 0.16 - 0.63 - 1.44 2.70 - - 0.58 2.42 2.04 Sep 0.23 0.18 - 0.70 0.58 - 2.29 - 3.61 0.52 2.20 2.74 Oct 0.30 0.30 - 0.47 - 0.29 2.23 2.91 - 0.61 2.11 1.86 Nov 0.32 0.31 - 0.72 0.68 1.08 2.15 - 3.47 0.67 2.07 2.40 Dec 0.37 0.35 - 0.66 0.60 0.90 1.75 - - 0.66 1.79 2.44
15 Jan 0.22 0.19 - 0.77 0.58 0.87 1.66 2.28 2.71 0.53 1.54 1.93 Feb 0.20 0.15 - 0.82 0.41 0.19 1.63 1.94 2.51 0.44 1.51 1.68 Mar 0.07 0.06 - 0.60 0.20 0.40 1.05 1.98 - 0.25 1.23 2.83 Apr 0.01 0.02 - 0.53 0.16 0.55 1.29 1.66 2.08 0.21 1.31 1.60
BANCO DE ESPAÑA 63* ECONOMIC BULLETIN, JULY-AUGUST 2015 ECONOMIC INDICATORS

2011 2012 2013 20142.4
2.6
2.8
3.0
3.2
3.4
3.6
3.8
4.0
4.2
4.4
4.6
4.8
2.4
2.6
2.8
3.0
3.2
3.4
3.6
3.8
4.0
4.2
4.4
4.6
4.8%%
TOTAL
HOUSEHOLDS
NON-FINANCIAL CORPORATIONS
LOANS SYNTHETIC RATES
2011 2012 2013 20140.0
0.2
0.4
0.6
0.8
1.0
1.2
1.4
1.6
1.8
2.0
0.0
0.2
0.4
0.6
0.8
1.0
1.2
1.4
1.6
1.8
2.0%%
TOTAL
HOUSEHOLDS
NON-FINANCIAL CORPORATIONS
DEPOSITS SYNTHETIC RATES
A
P
. Series depicted in chart.
. 1 . 2 3 4
. 5 6 7 . 8
. 9 10 11 12 . 13 14 15 16
9.3. INTEREST RATES ON NEW BUSINESS. CREDIT INSTITUTIONS AND CFIs. (CBE 4/2002) SDDS (a)
Source: BE.
a. This table is included among the IMF’s requirements to meet the Special Data Dissemination Standards (SDDS)
b. APRC: annual percentage rate of charge. NEDR: narrowly defined effective rate, which is the same as the APRC without including commissions.
c. Calculated by adding to the NDER rate, which does not include commissions and other expenses, a moving average of such expenses.
d. The synthetic rates of loans and deposits are obtained as the average of the interest rates on new business weighted by the euro-denominated stocks included in the balance
sheet for all the instruments of each sector.
e. Up to the reference month May 2010, this column includes credit granted through credit cards (see the ’Changes’ note in the July-August 2010 Boletín Estadístico).___________________________________________________________________________________________________________________________
Percentages
Loans (APRC) (b) Deposits (NDER) (b)
Syn- Households and NPISH Non-financial Syn- Households and NPISH Non-financial corporations thetic corporations thetic rate rate (d) (d) Syn- House Con- Syn- Up to Over Syn- Over- Time Repos Syn- Over- Time Repos thetic pur- sump- thetic EUR 1 EUR 1 thetic night thetic night rate chase tion rate million million rate and re- rate and (c) deema- other ble at notice
13 3.84 4.06 3.16 7.22 3.57 5.18 2.91 0.90 0.93 0.22 1.50 0.49 0.77 0.35 1.30 0.75 14 3.16 3.47 2.64 6.42 2.74 4.16 2.08 0.40 0.41 0.17 0.64 0.42 0.39 0.31 0.50 0.46 15 3.20 3.33 2.47 6.35 3.03 3.98 2.34 0.29 0.30 0.15 0.46 0.31 0.27 0.22 0.39 0.17
13 Sep 3.88 4.22 3.20 7.77 3.47 5.39 2.50 1.02 1.07 0.19 1.74 0.19 0.86 0.45 1.37 0.32 Oct 4.14 4.15 3.12 7.70 4.13 5.39 3.33 1.03 1.07 0.18 1.74 0.12 0.89 0.40 1.51 0.17 Nov 4.20 4.15 3.19 7.43 4.27 5.24 3.71 0.94 0.99 0.17 1.62 0.12 0.77 0.37 1.30 0.33 Dec 3.84 4.06 3.16 7.22 3.57 5.18 2.91 0.90 0.93 0.22 1.50 0.49 0.77 0.35 1.30 0.75
14 Jan 4.07 4.22 3.32 7.40 3.89 5.42 2.96 0.87 0.91 0.21 1.46 0.24 0.74 0.47 1.11 0.51 Feb 4.08 4.19 3.28 7.46 3.93 5.21 3.02 0.82 0.86 0.21 1.37 0.41 0.68 0.42 1.00 0.39 Mar 4.06 4.19 3.31 7.28 3.91 5.43 2.95 0.75 0.78 0.20 1.23 1.11 0.67 0.45 0.97 0.44 Apr 4.06 4.08 3.19 7.36 4.03 5.32 3.07 0.71 0.72 0.20 1.13 0.56 0.65 0.43 0.96 0.19 May 4.00 4.08 3.17 7.33 3.90 5.13 2.88 0.67 0.68 0.20 1.07 0.35 0.63 0.44 0.93 0.22 Jun 3.94 4.18 3.31 7.14 3.63 4.91 3.00 0.61 0.62 0.19 0.98 0.21 0.58 0.43 0.82 0.10 Jul 3.88 3.92 3.05 7.10 3.83 4.93 2.90 0.58 0.58 0.20 0.92 0.58 0.57 0.39 0.86 0.16 Aug 3.93 4.03 3.07 7.45 3.80 4.80 3.00 0.54 0.55 0.19 0.86 0.37 0.52 0.40 0.73 0.09 Sep 3.88 4.04 3.10 7.37 3.67 4.54 2.91 0.50 0.51 0.17 0.81 0.60 0.47 0.38 0.62 0.12 Oct 3.81 3.94 3.02 7.21 3.64 4.53 2.74 0.47 0.47 0.17 0.74 0.51 0.46 0.35 0.63 0.15 Nov 3.59 3.81 2.88 7.01 3.29 4.32 2.43 0.42 0.43 0.17 0.66 0.48 0.40 0.35 0.50 0.30 Dec 3.16 3.47 2.64 6.42 2.74 4.16 2.08 0.40 0.41 0.17 0.64 0.42 0.39 0.31 0.50 0.46
15 Jan 3.49 3.60 2.65 6.94 3.35 4.54 2.36 0.39 0.39 0.17 0.61 0.41 0.38 0.33 0.48 0.17 Feb 3.38 3.61 2.67 6.96 3.07 4.22 2.17 0.35 0.36 0.18 0.54 0.33 0.30 0.27 0.37 0.11 Mar 3.15 3.38 2.52 6.46 2.85 3.92 2.22 0.32 0.32 0.16 0.49 0.34 0.30 0.26 0.41 0.10 Apr 3.20 3.33 2.47 6.35 3.03 3.98 2.34 0.29 0.30 0.15 0.46 0.31 0.27 0.22 0.39 0.17
BANCO DE ESPAÑA 64* ECONOMIC BULLETIN, JULY-AUGUST 2015 ECONOMIC INDICATORS

2012 2013 2014 201597
98
99
100
101
102
103
104
105
106
107
108
109
110
111
112
97
98
99
100
101
102
103
104
105
106
107
108
109
110
111
112IndicesIndices
WITH PRODUCER PRICES
WITH CONSUMER PRICES
WITH EXPORT UNIT VALUES
INDICES OF SPANISH COMPETITIVENESS VIS À VIS THE EU-28
2012 2013 2014 201599
100
101
102
103
104
105
106
107
108
109
110
111
112
99
100
101
102
103
104
105
106
107
108
109
110
111
112IndicesIndices
WITH PRODUCER PRICES
WITH CONSUMER PRICES
WITH EXPORT UNIT VALUES
INDICES OF SPANISH COMPETITIVENESS VIS À VIS THE EURO AREA
. Series depicted in chart.
. 1 . 2 3
. 4 5 6 7 8 9 . 10
. 11 12 13 . 14
9.4 INDICES OF SPANISH COMPETITIVENESS VIS-à-VIS THE EU-28 AND THE EURO AREA
___________________________________________________________________________________________________________________________
Base 1999 QI = 100
Vis-à-vis the EU-28 Vis-à-vis the euro area
Total (a) Price component (c) Based on Based on Based on Based on Based on Nominal producer consumer total unit manufactu export component prices prices labour ring unit unit
Based on Based on Based on Based on (b) Based on Based on Based on Based on costs labour values producer consumer total unit export producer consumer total unit export (d) costs prices prices labour unit prices prices labour unit (d) costs values(e) costs values(e) (d) (d)
12 110.1 109.6 104.4 102.8 101.4 108.6 108.0 102.9 101.7 110.5 110.3 105.9 119.7 104.8 13 110.7 110.2 102.9 101.5 101.9 108.6 108.1 101.0 100.0 110.7 110.5 103.9 115.9 103.4 14 110.1 109.2 101.3 100.1 101.7 108.2 107.3 99.6 98.8 110.4 109.8 102.4 114.9 101.8
13 Q2 110.8 110.5 103.0 101.7 101.9 108.8 108.5 101.1 100.2 110.9 110.9 104.1 116.5 103.6 Q3 110.7 110.0 102.6 101.0 102.0 108.5 107.9 100.6 99.4 110.7 110.2 103.5 114.3 102.9 Q4 110.2 110.4 102.4 100.8 101.9 108.2 108.3 100.5 99.3 110.3 110.7 103.3 116.0 102.7
14 Q1 110.0 109.0 101.9 100.5 101.9 108.0 107.0 100.0 99.1 110.2 109.5 102.8 114.0 102.3 Q2 110.0 109.9 101.8 99.9 101.7 108.1 108.0 100.0 98.6 110.2 110.4 102.8 115.0 101.7 Q3 110.1 108.7 101.0 99.9 101.6 108.3 106.9 99.4 98.7 110.5 109.4 102.1 114.8 101.7 Q4 110.2 109.1 100.6 100.0 101.6 108.5 107.4 99.1 98.9 110.7 109.8 101.8 115.8 101.7
15 Q1 110.0 107.2 100.2 ... 101.1 108.8 106.0 99.1 ... 110.9 108.4 101.8 114.5 ...
Source: BE.
a. Outcome of multiplying nominal and cost/price components. A decline in the index denotes an improvement in the competitiveness of Spanish products.
b. Geometric mean calculated using a double weighting system based on (1995-1997), (1998-2000), (2001-2003),
(2004-2006) and (2007-2009) manufacturing foreign trade figures.
c. Relationship between the price indices of Spain and of the group.
d. Quarterly series. Indices for Spain have been calculated using data for Unit Labour Costs (total and manufacturing) compiled from Quarterly Spanish
National Accounts. Base 2010. Source INE.
14 Aug 110.0 108.4 ... 100.0 101.7 108.2 106.6 ... 98.7 110.4 109.1 ... ... 101.7 Sep 110.3 109.2 101.0 100.1 101.6 108.5 107.5 99.4 98.9 110.7 109.9 102.1 114.8 101.8 Oct 110.2 109.3 ... 100.2 101.5 108.5 107.6 ... 99.1 110.7 110.1 ... ... 101.9 Nov 110.2 109.3 ... 100.0 101.6 108.5 107.6 ... 98.8 110.7 110.0 ... ... 101.6 Dec 110.1 108.6 100.6 99.9 101.6 108.4 106.9 99.1 98.7 110.6 109.3 101.8 115.8 101.5
15 Jan 109.9 107.5 ... 99.7 101.5 108.4 106.0 ... 98.7 110.6 108.5 ... ... 101.6 Feb 110.1 106.5 ... ... 101.1 108.9 105.4 ... ... 111.1 107.8 ... ... ... Mar 109.9 107.4 ... ... 100.8 109.0 106.6 ... ... 111.2 108.9 ... ... ... Apr ... 107.8 ... ... 100.7 ... 107.1 ... ... ... 109.4 ... ... ... May ... ... ... ... 100.8 ... ... ... ... ... ... ... ... ...
BANCO DE ESPAÑA 65* ECONOMIC BULLETIN, JULY-AUGUST 2015 ECONOMIC INDICATORS

2012 2013 2014 201596
98
100
102
104
106
108
110
112
114
96
98
100
102
104
106
108
110
112
114IndicesIndices
WITH PRODUCER PRICES
WITH CONSUMER PRICES
WITH EXPORT UNITS VALUES
NOMINAL COMPONENT
INDICES OF SPANISH COMPETITIVENESS VIS-À-VIS THE DEVELOPED COUNTRIES
2012 2013 2014 201594
96
98
100
102
104
106
108
110
112
114
94
96
98
100
102
104
106
108
110
112
114IndicesIndices
WITH PRODUCER PRICES
WITH CONSUMER PRICES
NOMINAL COMPONENT
INDICES OF SPANISH COMPETITIVENESS VIS-À-VIS THE INDUSTRIALISED COUNTRIES
. Series depicted in chart.
. 1 . 2 3
. 4 . 5 6 7 8 9
. 10 . 11
. 12 13 14
9.5 INDICES OF SPANISH COMPETITIVENESS VIS-à-VIS THE DEVELOPED COUNTRIES AND INDUSTRIALISED COUNTRIES
___________________________________________________________________________________________________________________________
Base 1999 QI = 100
Vis-à-vis developed countries Vis-à-vis industrialised countries
Total (a) Prices component (c) Total (a) Prices component(c) Nominal Nominal compon- compon-
Based on Based on Based on Based on ent Based on Based on Based on Based on Based on Based on ent Based on Based on producer consumer manufac - export unit (b) producer consumer manufac - export unit producer consumer (b) producer consumer prices prices turing unit values prices prices turing unit values prices prices prices prices labour costs labour costs (d) (d)
12 111.4 111.6 120.7 103.0 100.2 111.2 111.4 120.5 103.3 109.7 110.0 99.6 110.2 110.5 13 112.9 113.4 118.7 102.4 101.6 111.1 111.6 116.9 101.3 111.2 111.7 101.1 110.0 110.5 14 112.2 112.4 117.8 101.1 101.6 110.4 110.6 116.0 100.1 110.3 110.5 101.2 109.0 109.2
13 Q2 112.8 113.6 119.2 102.5 101.4 111.3 112.0 117.5 101.6 110.9 111.7 100.7 110.1 111.0 Q3 112.9 113.2 117.0 101.9 101.7 111.0 111.3 115.1 100.8 111.2 111.5 101.2 109.9 110.1 Q4 112.7 114.0 118.9 102.0 101.9 110.6 111.8 116.7 100.6 111.2 112.4 101.7 109.3 110.5
14 Q1 112.5 112.6 117.5 101.7 102.0 110.3 110.4 115.2 100.3 111.0 111.2 101.9 108.9 109.0 Q2 112.3 113.3 118.3 101.2 101.8 110.3 111.3 116.1 99.9 110.9 112.0 101.9 108.9 109.9 Q3 112.1 111.7 117.3 100.9 101.4 110.5 110.1 115.7 100.1 110.1 109.7 100.9 109.1 108.7 Q4 111.8 111.8 118.1 100.8 101.1 110.6 110.6 116.8 100.2 109.0 109.1 100.0 109.0 109.1
15 Q1 110.5 108.7 115.0 ... 99.6 111.0 109.2 115.5 ... 106.5 105.0 97.5 109.2 107.6
Source: BE.
a. Outcome of multiplying nominal and cost/price components. A decline in the index denotes an improvement in the competitiveness of Spanish products.
b. Geometric mean calculated using a double weighting system based on (1995-1997), (1998-2000), (2001-2003),
(2004-2006) and (2007-2009) manufacturing foreign trade figures.
c. Relationship between the price indices of Spain and of the group.
d. Quarterly series. Indices for Spain have been calculated using data for Unit Labour Costs (total and manufacturing) compiled from Quarterly Spanish
National Accounts. Base 2010. Source INE.
14 Aug 112.0 111.4 ... 101.0 101.4 110.4 109.8 ... 100.1 110.1 109.5 101.0 109.0 108.4 Sep 112.0 112.0 117.3 100.9 101.2 110.7 110.7 115.7 100.3 109.6 109.7 100.4 109.2 109.3 Oct 111.8 112.0 ... 100.9 101.0 110.7 110.9 ... 100.5 109.2 109.4 100.1 109.1 109.4 Nov 111.9 112.1 ... 100.7 101.1 110.7 110.9 ... 100.2 109.1 109.3 100.0 109.0 109.3 Dec 111.8 111.4 118.1 100.6 101.1 110.5 110.2 116.8 100.0 108.8 108.6 100.0 108.8 108.6
15 Jan 110.7 109.3 ... 99.7 100.1 110.6 109.2 ... 100.1 107.0 105.7 98.4 108.7 107.4 Feb 110.8 108.2 ... ... 99.6 111.2 108.6 ... ... 106.9 104.5 97.7 109.4 107.0 Mar 110.2 108.7 ... ... 99.0 111.3 109.8 ... ... 105.8 104.6 96.6 109.6 108.3 Apr ... 109.0 ... ... 98.8 ... 110.3 ... ... ... 104.7 96.3 ... 108.8 May ... ... ... ... 99.2 ... ... ... ... ... ... 97.0 ... ...
BANCO DE ESPAÑA 66* ECONOMIC BULLETIN, JULY-AUGUST 2015 ECONOMIC INDICATORS
BANCO DE ESPAÑA 67* ECONOMIC BULLETIN, JULY-AUGUST 2015 BANCO DE ESPAÑA PUBLICATIONS
BANCO DE ESPAÑA PUBLICATIONS
The Banco de España publishes various types of documents providing information on its
activity (economic reports, statistics, research papers, etc.). The full list of Banco de España
publications can be found on its website at http://www.bde.es/f/webbde/Secciones/Publica-
ciones/Relacionados/Fic/cat_publ.pdf.
The list of articles published in the Economic Bulletin since 1990 can be consulted at http://
www.bde.es/f/webbde/Secciones/Publicaciones/InformesBoletinesRevistas/BoletinEconomico/
indice_general_ingles.pdf.
Most of these documents are available in pdf format and can be downloaded free of charge
from the Banco de España website at http://www.bde.es/webbde/en/secciones/informes/.
Requests for others should be addressed to [email protected].
Reproduction for educational and non-commercial purposes is permitted
provided that the source is acknowledged.
© Banco de España, Madrid, 2015
ISSN: 1579 - 8623 (online edition)

BANCO DE ESPAÑA 68* ECONOMIC BULLETIN, JULY-AUGUST 2015 ABBREVIATIONS
ABBREVIATIONS
COUNTRIES AND CURRENCIESIn accordance with Community practice, the EU countries are listed using the alphabetical order of the country names in the national languages.
BE Belgium EUR (euro)BG Bulgaria BGN (Bulgarian lev)CZ Czech Republic CZK (Czech koruna)DK Denmark DKK (Danish krone)DE Germany EUR (euro)EE Estonia EUR (euro)IE Ireland EUR (euro)GR Greece EUR (euro)ES Spain EUR (euro)FR France EUR (euro)IT Italy EUR (euro)HR Croatia HRK (Croatian kuna)CY Cyprus EUR (euro)LV Latvia EUR (euro)LT Lithuania EUR (euro)LU Luxembourg EUR (euro)HU Hungary HUF (Hungarian forint)MT Malta EUR (euro)NL Netherlands EUR (euro)AT Austria EUR (euro)PL Poland PLN (Polish zloty)PT Portugal EUR (euro)RO Romania RON (New Romanian leu)SI Slovenia EUR (euro)SK Slovakia EUR (euro)FI Finland EUR (euro)SE Sweden SEK (Swedish krona)UK United Kingdom GBP (Pound sterling)JP Japan JPY (Japanese yen)US United States USD (US dollar)
ABSPP Asset-Backed Securities Purchase ProgrammeAIReF Independent Authority for Fiscal ResponsibilityBCBS Basel Committee on Banking SupervisionBE Banco de EspañaBIS Bank for International SettlementsBLS Bank Lending SurveyBOE Official State GazetteBRICs Brazil, Russia, India and ChinaCBA Central Balance Sheet Data Office Annual SurveyCBQ Central Balance Sheet Data Office Quarterly SurveyCBSO Central Balance Sheet Data OfficeCCR Central Credit RegisterCDSs Credit default swapsCESR Committee of European Securities RegulatorsCNE Spanish National AccountsCNMV National Securities Market CommissionCPI Consumer Price IndexDGF Deposit Guarantee FundEBA European Banking AuthorityECB European Central BankECOFIN Council of the European Communities (Economic and
Financial Affairs)EDP Excessive Deficit ProcedureEFF Spanish Survey of Household FinancesEFSF European Financial Stability FacilityEMU Economic and Monetary UnionEONIA Euro overnight index averageEPA Official Spanish Labour Force SurveyESA 2010 European System of National and Regional AccountsESCB European System of Central BanksESFS European System of Financial SupervisorsESM European Stability MechanismESRB European Systemic Risk BoardEU European UnionEURIBOR Euro interbank offered rateEUROSTAT Statistical Office of the European CommunitiesFASE Financial Accounts of the Spanish EconomyFDI Foreign direct investmentFOMC Federal Open Market CommitteeFROB Fund for the Orderly Restructuring of the Banking SectorFSB Financial Stability BoardFSF Financial Stability Forum
GDI Gross disposable incomeGDP Gross domestic productGFCF Gross fixed capital formationGNP Gross national productGOP Gross operating profitGVA Gross value addedHICP Harmonised Index of Consumer PricesIASB International Accounting Standards Board ICO Official Credit InstituteIFRSs International Financial Reporting StandardsIGAE National Audit OfficeIIP International Investment PositionIMF International Monetary FundINE National Statistics InstituteLTROs Longer-term refinancing operationsMFIs Monetary financial institutionsMMFs Money market fundsMROs Main refinancing operationsMTBE Banco de España quarterly macroeconomic modelNAIRU Non-accelerating-inflation rate of unemploymentNCBs National central banksNFCs Non-financial corporationsNPISHs Non-profit institutions serving householdsOECD Organisation for Economic Co-operation and DevelopmentOJ L Official Journal of the European Union (Legislation)ONP Ordinary net profitOPEC Organisation of Petroleum Exporting CountriesPMI Purchasing Managers’ IndexPPP Purchasing power parityQNA Quarterly National AccountsSDRs Special Drawing RightsSEPA Single Euro Payments AreaSMEs Small and medium-sized enterprisesSPEE National Public Employment ServiceSRM Single Resolution MechanismSSM Single Supervisory MechanismTARGET Trans-European Automated Real-time Gross settlement
Express Transfer systemTFP Total factor productivityTLTROs Targeted longer-tem refinancing operationsULCs Unit labour costsVAT Value Added Tax
CONVENTIONS USED
M1 Notes and coins held by the public + sight deposits.M2 M1 + deposits redeemable at notice of up to three months +
deposits with an agreed maturity of up to two years.M3 M2 + repos + shares in money market funds and money
market instruments + debt securities issued with an agreed maturity of up to two years.
Q1, Q4 Calendar quarters.H1, H2 Calendar half-years.bn Billions (109).m Millions.bp Basis points.pp Percentage points.... Not available.— Nil, non-existence of the event considered or insignificance
of changes when expressed as rates of growth.0.0 Less than half the final digit shown in the series.