Economic benefits of European airspace modernization€¦ · ECONOMIC GROWTH 17 SEO AMSTERDAM...
132
Economic benefits of European airspace modernization
Transcript of Economic benefits of European airspace modernization€¦ · ECONOMIC GROWTH 17 SEO AMSTERDAM...
Economic benefits of European airspace
modernization

Roetersstraat 29 - 1018 WB Amsterdam - T (+31) 20 525 1630 - F (+31) 020 525 1686 - www.seo.nl - [email protected]
ABN-AMRO IBAN: NL14ABNA0411744356 BIC: ABNANL2A - ING: IBAN: NL96INGB0004641100 BIC: INGBNL2A KvK Amsterdam 41197444 - BTW NL 003023965 B
Amsterdam, February 2016
Commissioned by IATA
Economic benefits of European airspace modernization
Guillaume Burghouwt Rogier Lieshout
Thijs Boonekamp Valentijn van Spijker
SEO AMSTERDAM ECONOMICS
“The science of knowing” SEO Amsterdam Economics carries out independent applied economic research on behalf of national and international clients – both public institutions and private sector clients. Our research aims to make a major contribution to the decision-making processes of our clients. Originally founded by, and still affiliated with, the University of Amsterdam, SEO Amsterdam Economics is now an independent research group but retains a strong academic component. Operating on a nonprofit basis, SEO continually invests in the intellectual capital of its staff by granting them time to pursue continuing education, publish in academic journals, and participate in academic networks and conferences. As a result, our staff is fully up to date on the latest economic theories and econometric techniques.
SEO-report nr. 2015-83 ISBN 978-90-6733-797-7
Copyright © 2015 SEO Amsterdam. All rights reserved. Data from this report may be used in articles, studies and syllabi, provided that the source is clearly and accurately mentioned. Data in this report may not be used for commercial purposes without prior permission of the author(s). Permission can be obtained by contacting: [email protected].

ECONOMIC BENEFITS OF EUROPEAN AIRSPACE MODERNIZATION i
SEO AMSTERDAM ECONOMICS
Executive summary
Connectivity by air is key to competitiveness and growth The air transport network plays an important role in today’s globalized society. The connectivity it generates is a key element for the competitive position of European countries, regions and cities. It drives consumer and wider economic benefits. A superior connectivity performance minimizes travel costs for passengers, businesses and shippers. Aviation facilitates global contacts, mobility and trade. It stimulates productivity, trade, R&D and foreign direct investment. In addition, the aviation industry is a major industry in its own right, supporting about 12 million jobs and 4.1 percent of GDP in Europe.1 It is therefore no surprise that air transport connectivity and related issues play an increasingly important role in European policy discussions.
Figure 1.1 Connectivity growth drives consumer and wider economic benefits
Source: SEO
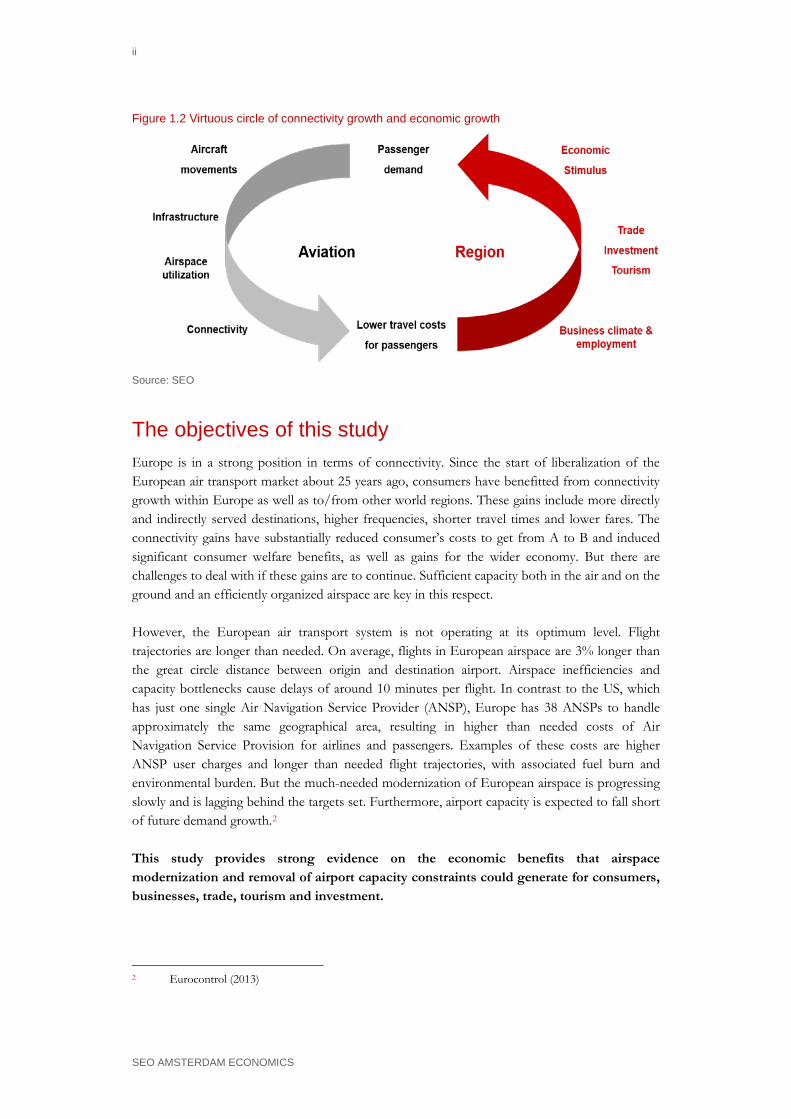
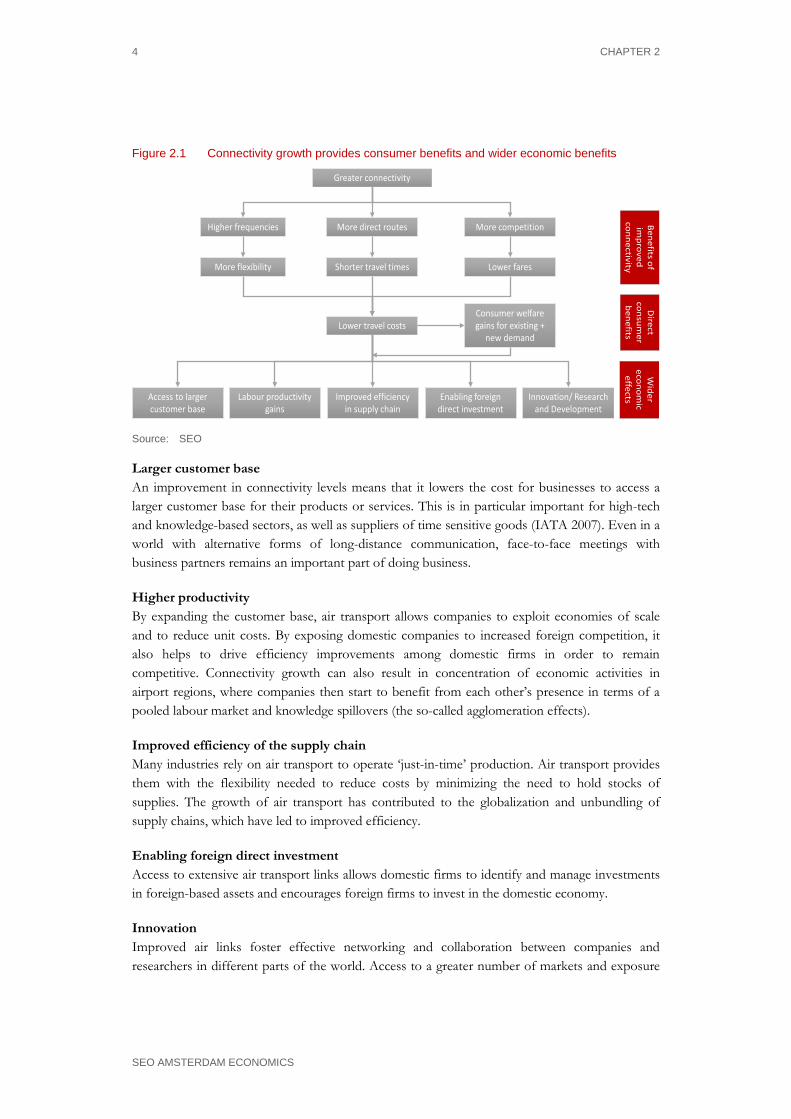
The relationship between connectivity and economic growth is a two-way relationship. Air travel contributes to the efficient functioning of the economy. Economic growth again stimulates the demand for air travel. In other words, there is a ‘virtuous circle’ between connectivity growth and economic growth.
1 InterVISTAS (2015)
Greater connectivity
More competitionHigher frequencies More direct routes
Shorter travel times Lower faresMore flexibility
Lower travel costs
Access to largercustomer base
Labour productivitygains
Improved efficiency in supply chain
Enabling foreigndirect investment
Innovation/ Research and Development
Consumer welfare gains for existing +
new demand
Direct
consumer
benefits
Wider
economic
effects
Benefits of im
provedconnectivity
ii
SEO AMSTERDAM ECONOMICS
Figure 1.2 Virtuous circle of connectivity growth and economic growth
Source: SEO
The objectives of this study Europe is in a strong position in terms of connectivity. Since the start of liberalization of the European air transport market about 25 years ago, consumers have benefitted from connectivity growth within Europe as well as to/from other world regions. These gains include more directly and indirectly served destinations, higher frequencies, shorter travel times and lower fares. The connectivity gains have substantially reduced consumer’s costs to get from A to B and induced significant consumer welfare benefits, as well as gains for the wider economy. But there are challenges to deal with if these gains are to continue. Sufficient capacity both in the air and on the ground and an efficiently organized airspace are key in this respect. However, the European air transport system is not operating at its optimum level. Flight trajectories are longer than needed. On average, flights in European airspace are 3% longer than the great circle distance between origin and destination airport. Airspace inefficiencies and capacity bottlenecks cause delays of around 10 minutes per flight. In contrast to the US, which has just one single Air Navigation Service Provider (ANSP), Europe has 38 ANSPs to handle approximately the same geographical area, resulting in higher than needed costs of Air Navigation Service Provision for airlines and passengers. Examples of these costs are higher ANSP user charges and longer than needed flight trajectories, with associated fuel burn and environmental burden. But the much-needed modernization of European airspace is progressing slowly and is lagging behind the targets set. Furthermore, airport capacity is expected to fall short of future demand growth.2 This study provides strong evidence on the economic benefits that airspace modernization and removal of airport capacity constraints could generate for consumers, businesses, trade, tourism and investment.
2 Eurocontrol (2013)
EXECUTIVE SUMMARY iii
SEO AMSTERDAM ECONOMICS
IATA commissioned SEO Amsterdam Economics to independently quantify the economic benefits of European airspace modernization and European airport capacity enhancements. Benefits in terms of safety generated by the modernization of the European airspace are not the subject of the present study. The results provide evidence that if airspace is not modernized and airport capacity fails to keep up with aviation demand growth, significant potential benefits for the European airline industry and European economy will be foregone for consumers and businesses. This study uses two different approaches to assess the economic impacts: the welfare approach and the economic contribution approach. The welfare approach focuses primarily on consumer (user) benefits. We use a generalized travel cost model to estimate these consumer benefits. The economic contribution approach refers mainly to GDP and jobs. Econometric estimations have been used to estimate GDP and job impacts. Although there is some overlap between both approaches (for example, cost savings for business travellers are reflected in GDP growth), they are different approaches, of which the results cannot be added up. The study distinguishes between different scenarios. The ‘Airspace Modernization’ scenario assumes modernization of European airspace, which will lead to more efficiency, more airspace capacity and lower cost levels. The ‘Maximizing Connectivity Benefits’ scenario assumes removal of any airport infrastructure capacity constraints on top of airspace modernization, based on the unaccommodated demand in Eurocontrol’s ‘Regulated Growth’ scenario. Economic impacts in both scenarios are all in comparison to a ‘do nothing’ scenario (‘Baseline’). Results are presented for the ESRA08 region, which are all European countries and Morocco.
Key results
Airspace modernization drives efficiency and connectivity growth to the benefit of the European consumer Airspace modernization could deliver European consumers an additional € 32 billion of welfare benefits in the year 2035, compared to a ‘do nothing’ scenario (in which no further airspace modernization takes place). Consumer benefits ripple through the rest of the economy and create wider economic benefits. We estimate these agglomeration, productivity and labour market effects to create additional wider economic benefits of € 1.7 billion in 2035. The total present value of airspace modernization3 over the period 2015-2035 period cumulates to € 126 billion. These benefits consist of: • More efficient air navigation services provision at a higher capacity, which translates into
airline cost savings and lower air fares; • Time and reliability savings: travel times are shorter because routings will be more direct.
Passengers and airlines will face fewer delays; • Average flight times will be reduced with 4-8 minutes per one-way flight, while average delays
decrease from 12 to 8 minutes per flight, in comparison to a ‘do nothing’ scenario;
3 Total benefits over the 2015-2035 period at present day prices (discounted).
iv
SEO AMSTERDAM ECONOMICS
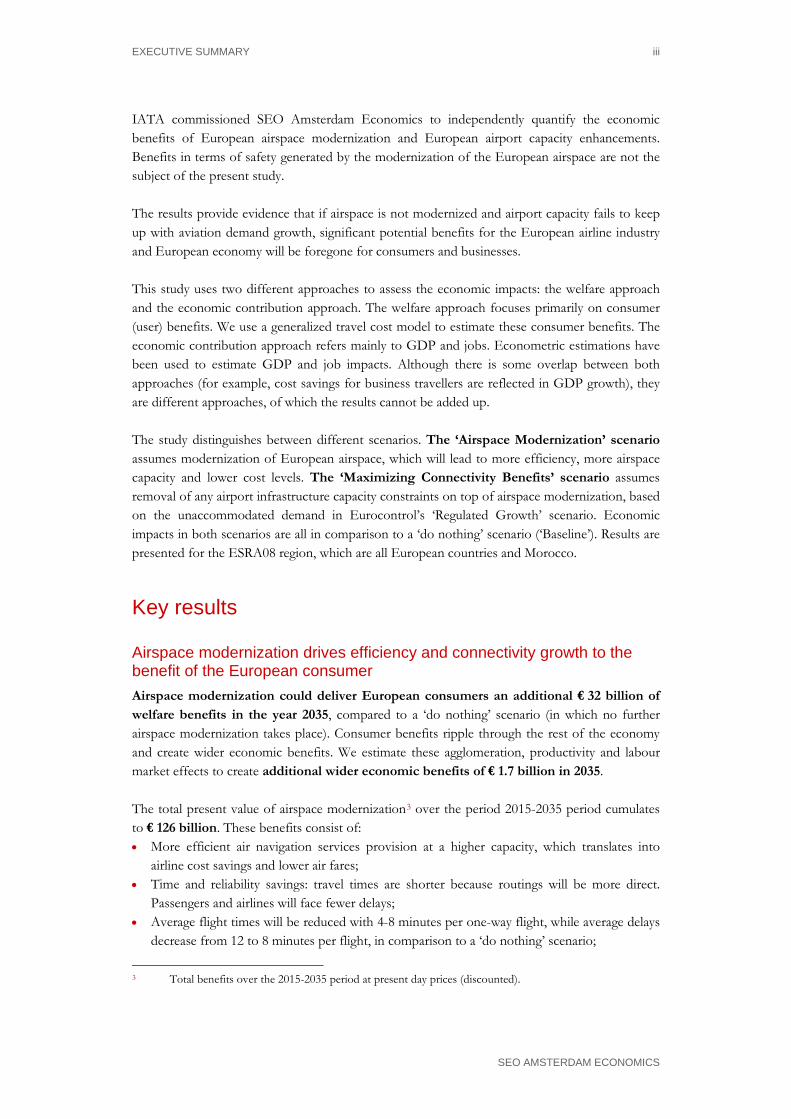
• Connectivity growth (more routes, more frequencies); • Wider economic benefits caused by agglomeration effects and higher productivity levels; • Lower CO2 emissions per flight. Estimated consumer benefits are on average €43 per passenger in 2035. Benefits are higher for business (€ 69) than for leisure (€ 36) passengers. To value the magnitude of such benefits: per passenger benefits are 14 percent and 11 percent of the 2014 average return ticket price of business and leisure passengers respectively.
Figure 1.3 Consumer benefits of airspace modernization and airspace modernization plus removal of remaining airport capacity constraints in 2035
Source: SEO NetCost; Note: undiscounted values
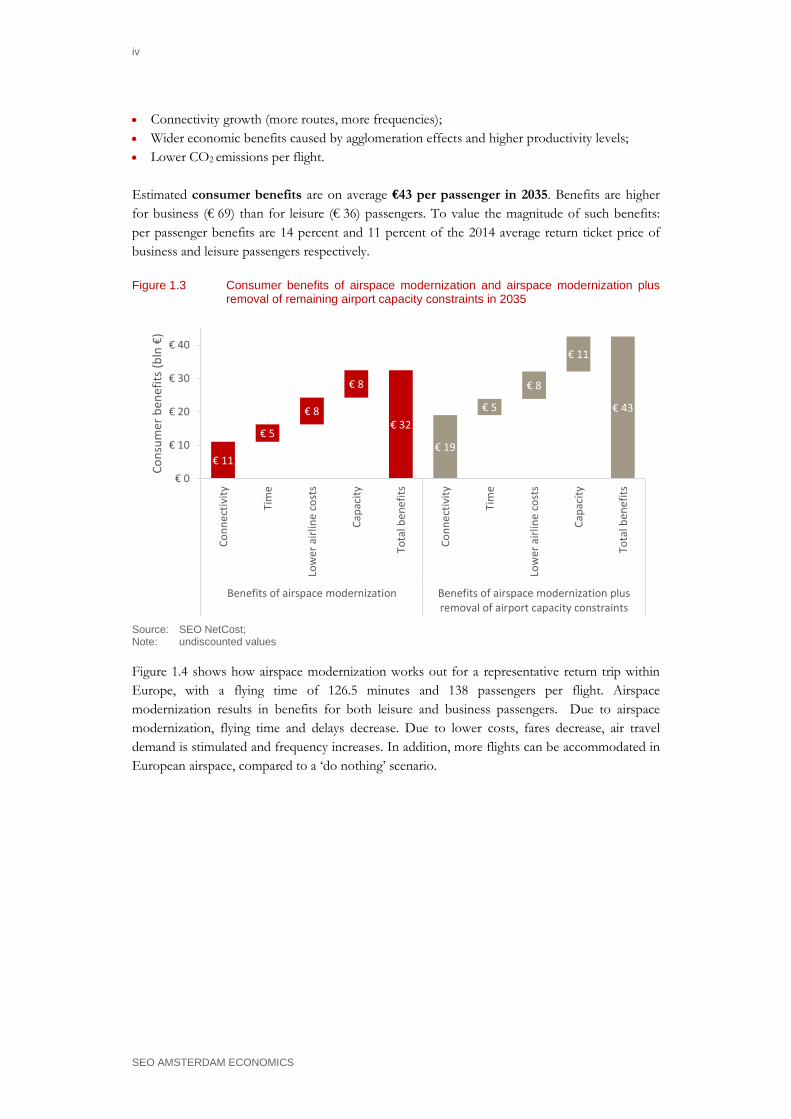
Figure 1.4 shows how airspace modernization works out for a representative return trip within Europe, with a flying time of 126.5 minutes and 138 passengers per flight. Airspace modernization results in benefits for both leisure and business passengers. Due to airspace modernization, flying time and delays decrease. Due to lower costs, fares decrease, air travel demand is stimulated and frequency increases. In addition, more flights can be accommodated in European airspace, compared to a ‘do nothing’ scenario.
€ 11€ 19
€ 5
€ 5€ 8
€ 8€ 8
€ 11
€ 32€ 43
€ 0
€ 10
€ 20
€ 30
€ 40
Conn
ectiv
ity
Tim
e
Low
er a
irlin
e co
sts
Capa
city
Tota
l ben
efits
Conn
ectiv
ity
Tim
e
Low
er a
irlin
e co
sts
Capa
city
Tota
l ben
efits
Benefits of airspace modernization Benefits of airspace modernization plusremoval of airport capacity constraints
Cons
umer
ben
efits
(bln
€)
EXECUTIVE SUMMARY v
SEO AMSTERDAM ECONOMICS
Figure 1.4 Airspace modernization leads to substantial time and cost savings on a representative intra-European return trip
Flight time : -11,4 min.
Departure delay: -8 min.
Frequency increase: +35 %
Maintenance, aircraft and crew costs:
Fuel cost:
ANS costs:
Delay costs:
12 12
30
45
6
17
48
74
Savings€ per pax
Savi
ngs
€pe
r pax
TotalTime savings
Connectivity effects
Cost savings
3,42
2,40
10,17
7,18
4,07
3,04
0,52
4,14
3045
BusinessLeisure
138 pax per flight
Leisure
Business
Value per hour Fuel price = € 0,78 / kg. Flying time of 126,5 minutes per leg
Based on:
€ 54
€ 18
Source: SEO
Airport capacity constraints are a further barrier to maximize connectivity benefits Airport capacity is expected to fall short of forecasted aviation demand growth in Europe in Eurocontrol’s ‘Regulated Growth’ scenario4. An additional 174 million European origin-destination passengers can be served in the European aviation system if airport capacity constraints would be solved and European airspace would be modernized. As a major share of traffic from European airports is within Europe, it is the European airlines that are affected most by airport capacity shortages and that would benefit from reducing these constraints. The estimations show that solving airport capacity constraints together with airspace modernization increases the consumer benefits to € 43 billion in the year 2035. € 19 billion is realized through connectivity gains, € 5 billion through shorter travel times and fewer delays for passengers and € 8 billion because of lower fares due to cost decreases for airlines. Another € 11
4 Eurocontrol (2013). Challenges of Growth 2013. Task 4: European Air Traffic in 2035. STATFOR, June
2013.

vi
SEO AMSTERDAM ECONOMICS
billion of these benefits can be attributed to lower ticket prices as a result of less scarcity in capacity and more competition. The economic gains quickly become larger after 2025, when airport and airspace capacity bottlenecks start to constrain air traffic growth if not addressed. The total present value is € 153 billion. Making sure that airports have enough capacity to accommodate future growth leads to a per passenger benefit of € 54 in 2035.
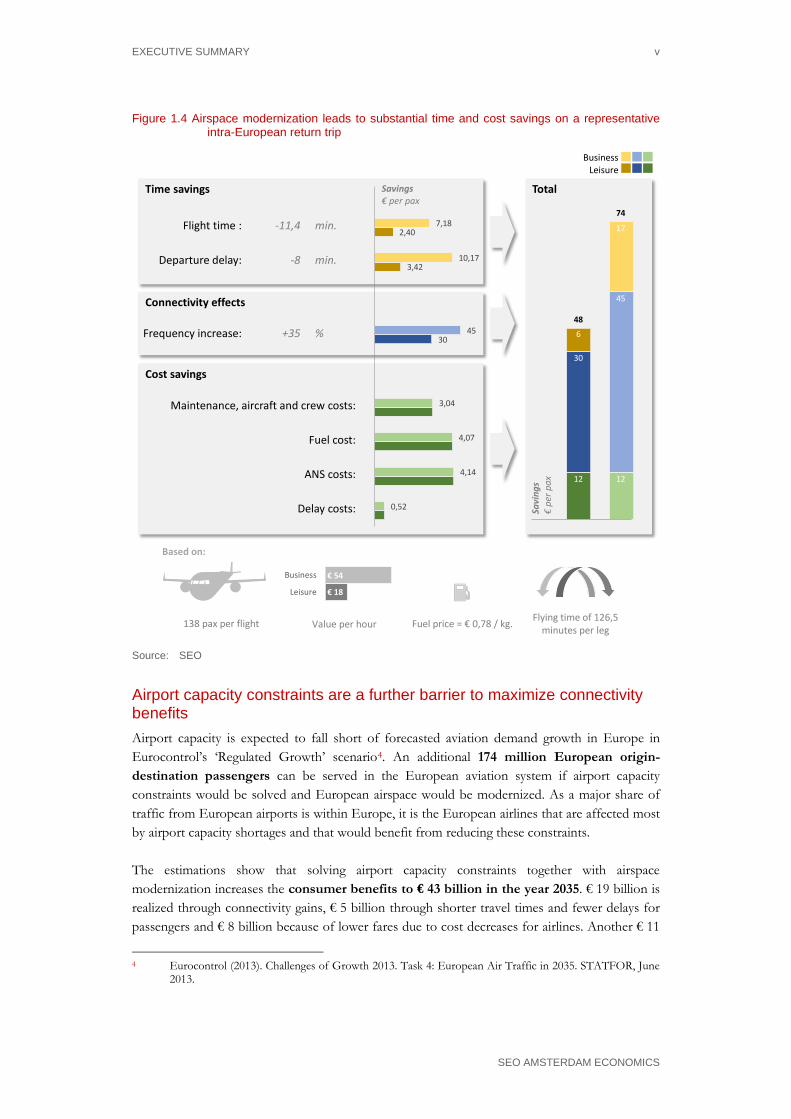
The economic contribution of airspace modernization and airport capacity enhancements As far as the economic contribution approach of airspace modernization and airport capacity enhancements are concerned, we have calculated the effects of airspace modernization and removal of airport capacity constraints on GDP and employment change. Furthermore, based on econometric analysis, we have estimated the wider catalytic impacts, including the effects on tourism, productivity, innovation and trade. Airspace modernization results in € 245 billion of additional GDP by 2035. If also remaining airport infrastructure capacity constraints would be removed, the GDP benefit would be maximized to € 301 billion euro in 2035. These figures result from a respective increase of 1.6 percent and 2.1 percent of the total GDP in 2035. Total employment increases by 0.4 percent in case of airspace modernization and 0.5 percent if any remaining airport capacity constraints would be removed. Using today’s employment figures, this would generate 1.0 and 1.3 million additional jobs related to aviation respectively. These are additional direct, indirect, induced and catalytic jobs. In addition, trade, tourism, R&D and innovation would be positively affected.
Figure 1.5 Airspace modernization has positive effects on tourism, trade, innovation, employment in knowledge intensive sectors and productivity
Source: SEO analysis
Total GDP impacts are realized through different channels. Firstly, increased connectivity generates additional employment, leading to additional GDP output. Secondly, productivity of
1,30%
5,54%
4,68%
2,19%
1,26%
1,72%
7,34%
6,19%
2,90%
1,67%
0% 2% 4% 6% 8%
Employment in knowledge intensive sectors
Number of patent applications
R&D expenditure
Trade in services
Number of hotel beds
% increase resulting from passenger increase
Benefits of airspace modernization plus removal of airport capacity constraints
'Airspace Modernization' scenario
EXECUTIVE SUMMARY vii
SEO AMSTERDAM ECONOMICS
both existing and new employees increases due to better connectivity, yielding a higher GDP per job. As a result, relatively small productivity increases due to connectivity growth can have substantial effects, as they affect the average productivity of the entire labour force.
Figure 1.6 GDP growth is realized through new employment as well as through productivity increase of the current labour force
Source: Eurostat, SEO Note: Figures are shown for EU28 + Switzerland + Norway + Turkey5
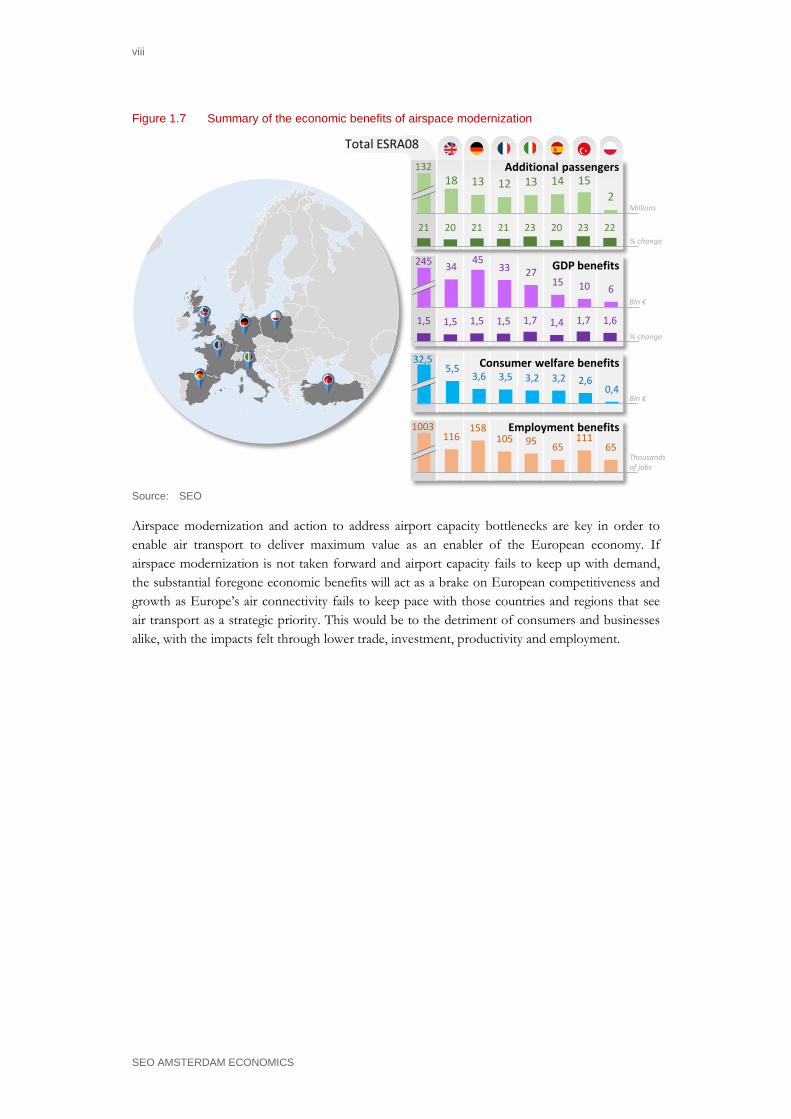
Substantial economic benefits of airspace modernization at a per country basis The total welfare impacts and economic contribution of airspace modernization differ between European countries. This is mainly due to differences in the level of passenger demand and to which extent airspace modernization is able to solve capacity bottlenecks. Figure 1.7 shows the economic impacts for 7 focus countries, that together account for over 70 percent of the total consumer benefits in 2035. To other European countries, airspace modernization brings substantial economic benefits on a per passenger basis as well. Also these countries will benefit from lower ANSP costs, shorter flight trajectories, less delays and more capacity. The fact that their total economic benefit is smaller in absolute terms is largely due to the smaller size of their aviation markets.
5 Employment data is only consistently available for the EU28 region, Norway, Switzerland and Turkey.
Therefore the figure does not include other countries in the ESRA08 region.
viii
SEO AMSTERDAM ECONOMICS
Figure 1.7 Summary of the economic benefits of airspace modernization
Total ESRA08
1,5 1,5 1,5 1,5 1,7 1,4 1,7 1,6
3445
33 2715 10 6
116158
105 95 65111
65
132
32,55,5
3,6 3,5 3,2 3,2 2,60,4
Consumer welfare benefits
Employment benefits
GDP benefits
Millions
Additional passengers
% change
Bln €
% change
Bln €
Thousandsof jobs
1003
245
18 13 12 13 14 152
21 20 21 21 23 20 23 22
Source: SEO
Airspace modernization and action to address airport capacity bottlenecks are key in order to enable air transport to deliver maximum value as an enabler of the European economy. If airspace modernization is not taken forward and airport capacity fails to keep up with demand, the substantial foregone economic benefits will act as a brake on European competitiveness and growth as Europe’s air connectivity fails to keep pace with those countries and regions that see air transport as a strategic priority. This would be to the detriment of consumers and businesses alike, with the impacts felt through lower trade, investment, productivity and employment.
ECONOMIC BENEFITS OF EUROPEAN AIRSPACE MODERNIZATION
SEO AMSTERDAM ECONOMICS
Table of Contents Executive summary.............................................................................................................. i
Connectivity by air is key to competitiveness and growth ........................................................... i
The objectives of this study ............................................................................................................. ii
Key results .......................................................................................................................................... iii
1 Introduction ................................................................................................................... 1
2 How airspace inefficiencies and airport capacity constraints limit connectivity and economic growth ............................................................................................... 3 2.1 Connectivity by air is key to competitiveness and growth ............................................... 3
2.2 Europe has a strong position in terms of connectivity ..................................................... 7
2.3 The problem: inefficient organized airspace results in economic and environmental costs ............................................................................................................ 10
2.4 The problem: airport capacity fails to keep up with demand ........................................ 16
3 Scenario analysis and forecast ..................................................................................... 19 3.1 Introduction ........................................................................................................................... 19
3.2 Scope ....................................................................................................................................... 19
3.3 Scenarios ................................................................................................................................. 20
3.4 Forecast ................................................................................................................................... 22
4 Calculating the economic benefits of airspace modernization: two approaches .........25 4.1 Two approaches to assess the economic benefits of airspace modernization ............ 25
4.2 Economic welfare approach ................................................................................................ 25
4.3 Economic contribution approach ...................................................................................... 26
4.4 Differences between the two approaches ......................................................................... 26
5 Welfare impacts of airspace modernization ................................................................. 31 5.1 Methodology .......................................................................................................................... 31
5.2 Results: consumer benefits .................................................................................................. 42
5.3 External environmental impacts ......................................................................................... 49
5.4 Total impacts .......................................................................................................................... 50
6 Focus on individual countries ......................................................................................53 6.1 Regional differentiation of total welfare benefits............................................................. 53
6.2 United Kingdom ................................................................................................................... 55
6.3 Turkey ..................................................................................................................................... 57
6.4 Germany ................................................................................................................................. 58
SEO AMSTERDAM ECONOMICS
6.5 France ...................................................................................................................................... 60
6.6 Italy .......................................................................................................................................... 61
6.7 Spain ........................................................................................................................................ 62
6.8 Poland ..................................................................................................................................... 64
7 Economic contribution of airspace modernization .....................................................67 7.1 Methodology .......................................................................................................................... 67
7.2 Macro-economic contribution of airspace modernization and removal of airport capacity constraints ................................................................................................ 68
7.3 Decomposition of GDP impacts into productivity and employment growth ........... 74
7.4 Wider, catalytic impacts of airspace modernization ........................................................ 75
7.5 Conclusions ............................................................................................................................ 77
8 Conclusions ..................................................................................................................79
Literature ............................................................................................................................ 81
Glossary ..............................................................................................................................87
ECONOMIC BENEFITS OF EUROPEAN AIRSPACE MODERNIZATION 1
SEO AMSTERDAM ECONOMICS
1 Introduction
The current European air transport system is not operating at its optimum level. The much-needed modernization of European airspace is progressing slowly, with the risk of missed benefits for the European air transport industry and the economy as a whole. This study provides an estimate of the economic benefits of European airspace modernization and removal of airport capacity constraints. Over 12 million jobs and 4.1 percent of European GDP are currently directly or indirectly related to aviation (InterVISTAS 2015). Aviation facilitates global contacts, mobility and trade. It generates agglomeration economies, stimulates productivity, trade, R&D and foreign direct investment. All in all, the European aviation industry system contributes significantly to the European economy. Despite this economic value, the current European air transport system is not operating at its optimum level. In other words, the use of European airspace is not efficient. Flight paths are not as direct as they could be, which leads to time losses for passengers and airlines as well as higher than necessary environmental costs. And because each country still has its own airspace management infrastructure, there are many times more equipment, people and processes managing this across Europe than necessary. This results in delays, higher costs (for airlines and their customers), emissions and airspace capacity bottlenecks. This situation may only get worse in the future. Eurocontrol (2013) expects that the number of air traffic movements will grow by 43 percent until 2035. In its ‘Most Likely’ scenario, Eurocontrol projects that 12 percent of European flights cannot be accommodated by 2035. As such, airspace modernization and the removal of airport capacity constraints could result in significant economic benefits for Europe. However, airspace modernization is only progressing slowly. High ATM costs and delays in the implementation of the Single European Sky persist. Furthermore, airport capacity investments have been significantly scaled back, compared to a number of years ago. Against this background, this study provides insight into the economic benefits of airspace modernization. More specifically, it answers the following questions: • What will be the economic benefits of airspace modernization for Europe between 2015 and
2035? • What will be the benefits for the European economy if any airport capacity constraints would
also be lifted?

ECONOMIC BENEFITS OF EUROPEAN AIRSPACE MODERNIZATION 3
SEO AMSTERDAM ECONOMICS
2 How airspace inefficiencies and airport capacity constraints limit connectivity and economic growth
Growth in connectivity by air brings economic benefits. Europe experienced substantial improvements in connectivity by air during the past two decades and its current connectivity performance is among the highest in the world. However, airport capacity bottlenecks and airspace inefficiencies will be a threat if Europe wants to continue to maximise the economic benefits associated with a strong air network.
2.1 Connectivity by air is key to competitiveness and growth
Aviation plays a crucial role in today’s globalized society. Air connectivity is a key element for the competitive position of European countries, regions and cities. There is an increased understanding among policy makers about the potential benefits of air connectivity. The European Commission stated in its communication ‘The EU’s external aviation policy – meeting future challenges’ that ‘connectivity is key to competitiveness’. Connectivity is also central to the Commission’s new aviation strategy. Maximizing connectivity by air is a central objective to various national aviation strategies inside and outside Europe. For example, connectivity was among the main issues considered by the UK Airports Commission in its advice on the expansion of UK airport capacity.
2.1.1 Consumer benefits
A superior connectivity performance minimizes travel costs for passengers, businesses and shippers. Growth in connectivity resulting from an increase in the number of in(direct) destinations and more frequencies leads to shorter travel times, increased competition and lower fares. This translates into lower travel costs for consumers, individuals and businesses alike. These lower ‘generalized’ travel costs translate into a direct consumer welfare gain or consumer surplus. Consumer surplus is a widely accepted way of quantifying changes in welfare from policy interventions. It is the amount consumers are willing to pay for a good or service in excess of the actual price they pay for the good or service without these interventions.
2.1.2 Wider economic benefits
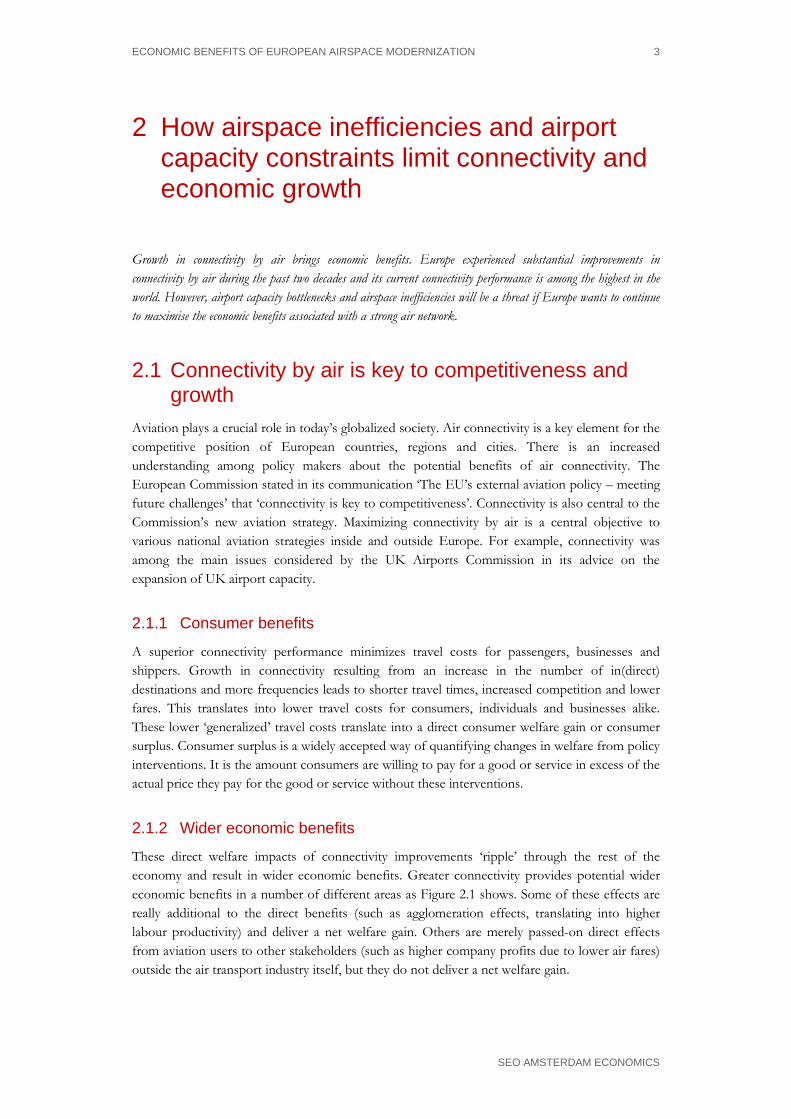
These direct welfare impacts of connectivity improvements ‘ripple’ through the rest of the economy and result in wider economic benefits. Greater connectivity provides potential wider economic benefits in a number of different areas as Figure 2.1 shows. Some of these effects are really additional to the direct benefits (such as agglomeration effects, translating into higher labour productivity) and deliver a net welfare gain. Others are merely passed-on direct effects from aviation users to other stakeholders (such as higher company profits due to lower air fares)
outside the air transport industry itself, but they do not deliver a net welfare gain.
4 CHAPTER 2
SEO AMSTERDAM ECONOMICS
Figure 2.1 Connectivity growth provides consumer benefits and wider economic benefits
Source: SEO
Larger customer base An improvement in connectivity levels means that it lowers the cost for businesses to access a larger customer base for their products or services. This is in particular important for high-tech and knowledge-based sectors, as well as suppliers of time sensitive goods (IATA 2007). Even in a world with alternative forms of long-distance communication, face-to-face meetings with business partners remains an important part of doing business.
Higher productivity By expanding the customer base, air transport allows companies to exploit economies of scale and to reduce unit costs. By exposing domestic companies to increased foreign competition, it also helps to drive efficiency improvements among domestic firms in order to remain competitive. Connectivity growth can also result in concentration of economic activities in airport regions, where companies then start to benefit from each other’s presence in terms of a pooled labour market and knowledge spillovers (the so-called agglomeration effects).
Improved efficiency of the supply chain Many industries rely on air transport to operate ‘just-in-time’ production. Air transport provides them with the flexibility needed to reduce costs by minimizing the need to hold stocks of supplies. The growth of air transport has contributed to the globalization and unbundling of supply chains, which have led to improved efficiency.
Enabling foreign direct investment Access to extensive air transport links allows domestic firms to identify and manage investments in foreign-based assets and encourages foreign firms to invest in the domestic economy.
Innovation Improved air links foster effective networking and collaboration between companies and researchers in different parts of the world. Access to a greater number of markets and exposure
Greater connectivity
More competitionHigher frequencies More direct routes
Shorter travel times Lower faresMore flexibility
Lower travel costs
Access to largercustomer base
Labour productivitygains
Improved efficiency in supply chain
Enabling foreigndirect investment
Innovation/ Research and Development
Consumer welfare gains for existing +
new demand
Direct
consumer
benefits
Wider
economic
effects
Benefits of im
provedconnectivity

HOW AIRSPACE INEFFICIENCIES AND AIRPORT CAPACITY CONSTRAINTS LIMIT CONNECTIVITY AND ECONOMIC GROWTH 5
SEO AMSTERDAM ECONOMICS
to foreign competition also stimulate R&D spending by companies, given the increased size of the potential market for future sales. There is increasing evidence on the wider economic benefits of connectivity growth, both additional and non-additional. The box below provides an overview of a number of important studies considering the wider economic benefits of aviation growth. Evidence on the economic impact of connectivity growth in Europe • Headquarters. Research of the University of Barcelona finds that a 10 percent growth in the
number of intercontinental flights results in a 4 percent growth in the number of headquarters in European metropolitan areas (Bel & Fageda 2008), controlling for causality via a simultaneous equation system.
• Productivity. According to InterVISTAS (2015) a 10 percent growth in connectivity by air is associated with a 0.5 percent growth in GDP/capita at the national level in Europe. IATA (2007) finds that a 10 percent growth in connectivity, relative to GDP, can increase long-term productivity in terms of GDP per hour worked by 0.07 percent.
• Foreign Direct Investment. Opening of new routes to Italian regions is associated with increases in Foreign Direct Investments in the years after the route opening (Bannò & Redondi 2014). For the UK, a 10 percent increase in seat capacity is associated with a 1.9 percent in FDI outflows and 4.7 percent FDI inflows (PWC 2014).
• Trade. Belenkiy & Riker (2012) find that each additional business trip in the United States increases U.S. commodity exports to the visited country by almost 37,000 US dollar. For the UK, a 10 percent increase in seat capacity is associated with a 1.7 percent increase in UK goods imports and a 3.3 percent in goods exports (PWC 2014).
• Tourism. For the UK, a 10 percent increase in seat capacity results in a 4 percent increase in inbound tourists and a 3 percent increase in outbound tourists (PWC 2014).
• Innovation. According to the work of Hovhannisyan & Keller (2014), a 10 percent increase in business travel leads to an increase in patenting by about 0.2 percent, based on research in 37 industries in 34 countries, covering outward business travel from the United States. Baruffaldi (2015) finds that firms located in German regions where airline liberalization induced a higher level of interregional knowledge integration, innovative productivity increased significantly.
2.1.3 Virtuous circle
The relationship between connectivity and economic growth is a two-way relationship. Air travel contributes to the efficient functioning of the economy and economic growth again stimulates the demand for air travel. In fact, there can be a ‘virtuous circle’ between connectivity growth and economic growth.
6 CHAPTER 2
SEO AMSTERDAM ECONOMICS
Figure 2.2 Virtuous circle of connectivity growth and economic growth
2.1.4 Jobs and GDP
Apart from the benefits of connectivity, EU airports and civil airspace users support many jobs in Europe’s economy. According to a recent study (InterVISTAS 2015), over 12 million jobs and 4.1 percent of GDP in Europe are currently directly or indirectly related to aviation. 1.7 million jobs and 101 billion of GDP are directly related to the aviation sector, which is the employment and GDP associated with the operation and management of activities at the airports, including the airlines, ATC, ground handlers, security, maintenance, immigration and customs. The remainder of the impacts are indirect (generated by downstream industries that support and supply the activities at the airport), induced (economic activity and spending generated by employees of firms directly or indirectly related to the airport) and catalytic (facilitation of business of other sectors of the economy due to aviation).
HOW AIRSPACE INEFFICIENCIES AND AIRPORT CAPACITY CONSTRAINTS LIMIT CONNECTIVITY AND ECONOMIC GROWTH 7
SEO AMSTERDAM ECONOMICS
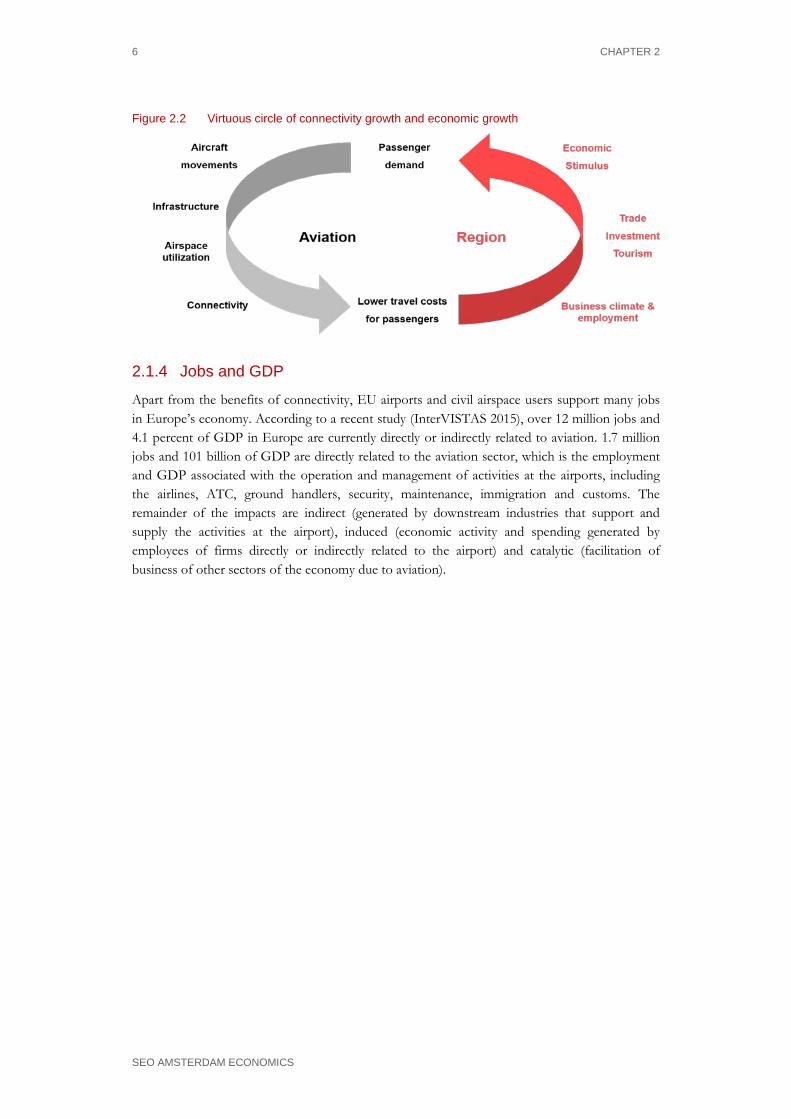
Figure 2.3 Map of total employment (direct, indirect, induced and catalytic) by country
Source: InterVISTAS (2015)
2.2 Europe has a strong position in terms of connectivity
Europe is in a strong position in terms of connectivity. Its connectivity increased considerably during the past twenty years. After North America and Australia/Oceania, Europe is the world region with the highest direct, non-stop connectivity per capita in the world. Since the start of liberalization of the European air transport market about 25 years ago, consumers have benefitted from connectivity growth, both within Europe and between Europe and other world regions. These gains entail more destinations, higher frequencies, shorter travel times, more choice and lower fares. According to the study by Allroggen et al. (2015), non-stop connectivity increased by 90 percent between 1990 and 2012, while one-stop connectivity increased by a factor 10, due to the establishment of European airline hub-and-spoke systems during the 1990s. A study by SEO and ACI Europe (2015) on connectivity developments in Europe further illustrates the substantial connectivity benefits to European businesses and consumers over the past decade. Total connectivity (direct, non-stop plus indirect connectivity via other hubs) from/to European airports increased by almost 39 percent between 2004 and 2015, while direct and indirect connectivity increased by 18 percent and 51 percent respectively. Largest connectivity growth was found on the markets to Asia-Pacific, Africa and the Middle East, while growth within Europe and to the Americas was more modest (Figure 2.4).
8 CHAPTER 2
SEO AMSTERDAM ECONOMICS
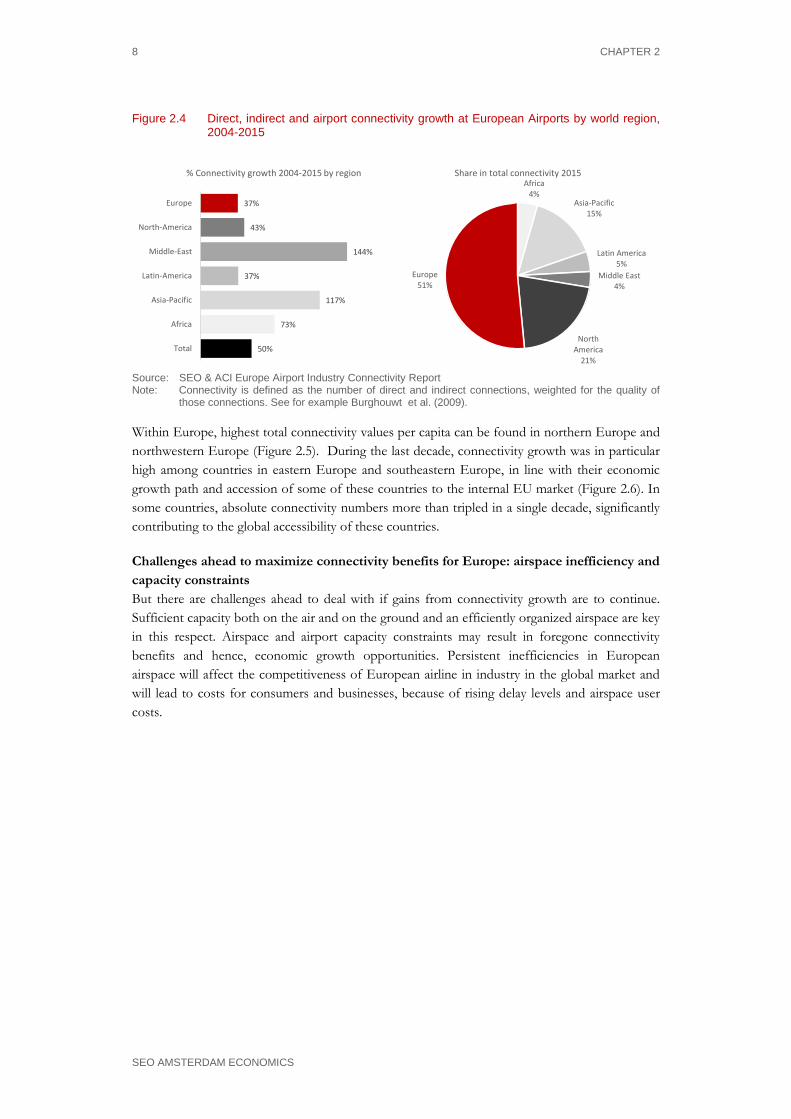
Figure 2.4 Direct, indirect and airport connectivity growth at European Airports by world region, 2004-2015
50%
73%
117%
37%
144%
43%
37%
Total
Africa
Asia-Pacific
Latin-America
Middle-East
North-America
Europe
% Connectivity growth 2004-2015 by regionAfrica
4%Asia-Pacific
15%
Latin America5%
Middle East4%
North America
21%
Europe51%
Share in total connectivity 2015
Source: SEO & ACI Europe Airport Industry Connectivity Report Note: Connectivity is defined as the number of direct and indirect connections, weighted for the quality of
those connections. See for example Burghouwt et al. (2009).
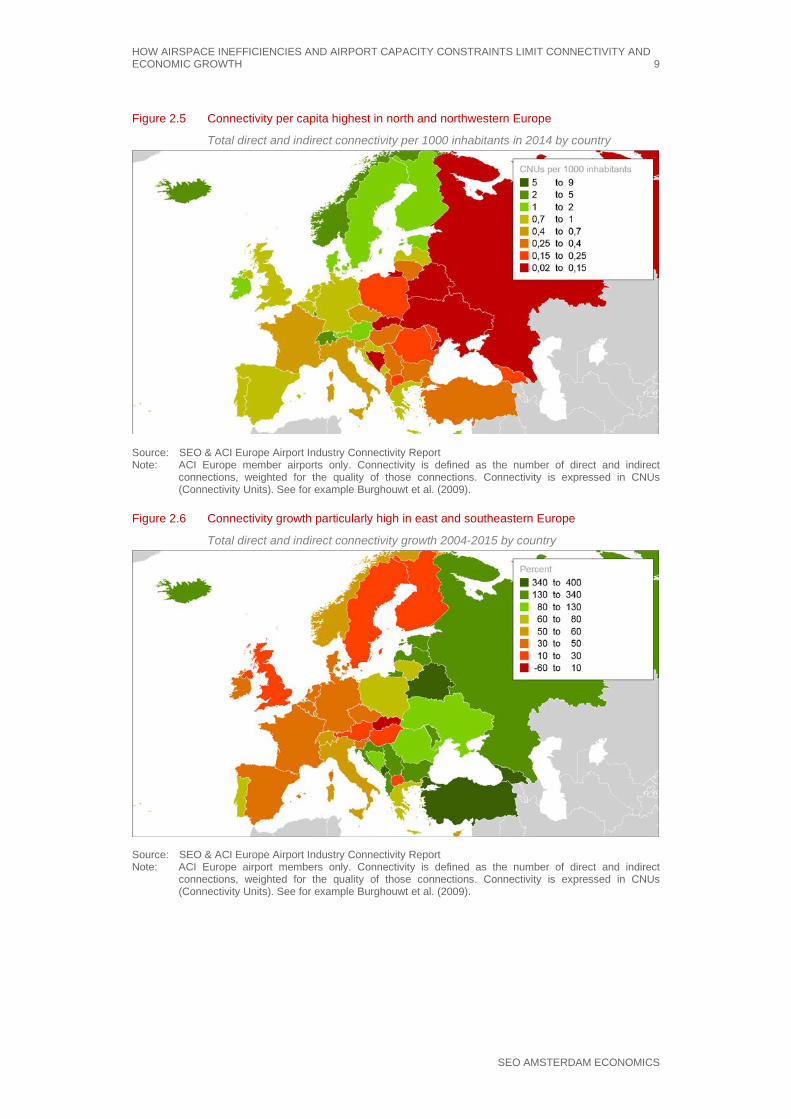
Within Europe, highest total connectivity values per capita can be found in northern Europe and northwestern Europe (Figure 2.5). During the last decade, connectivity growth was in particular high among countries in eastern Europe and southeastern Europe, in line with their economic growth path and accession of some of these countries to the internal EU market (Figure 2.6). In some countries, absolute connectivity numbers more than tripled in a single decade, significantly contributing to the global accessibility of these countries.
Challenges ahead to maximize connectivity benefits for Europe: airspace inefficiency and capacity constraints But there are challenges ahead to deal with if gains from connectivity growth are to continue. Sufficient capacity both on the air and on the ground and an efficiently organized airspace are key in this respect. Airspace and airport capacity constraints may result in foregone connectivity benefits and hence, economic growth opportunities. Persistent inefficiencies in European airspace will affect the competitiveness of European airline in industry in the global market and will lead to costs for consumers and businesses, because of rising delay levels and airspace user costs.
HOW AIRSPACE INEFFICIENCIES AND AIRPORT CAPACITY CONSTRAINTS LIMIT CONNECTIVITY AND ECONOMIC GROWTH 9
SEO AMSTERDAM ECONOMICS
Figure 2.5 Connectivity per capita highest in north and northwestern Europe
Total direct and indirect connectivity per 1000 inhabitants in 2014 by country
Source: SEO & ACI Europe Airport Industry Connectivity Report Note: ACI Europe member airports only. Connectivity is defined as the number of direct and indirect
connections, weighted for the quality of those connections. Connectivity is expressed in CNUs (Connectivity Units). See for example Burghouwt et al. (2009).
Figure 2.6 Connectivity growth particularly high in east and southeastern Europe
Total direct and indirect connectivity growth 2004-2015 by country
Source: SEO & ACI Europe Airport Industry Connectivity Report Note: ACI Europe airport members only. Connectivity is defined as the number of direct and indirect
connections, weighted for the quality of those connections. Connectivity is expressed in CNUs (Connectivity Units). See for example Burghouwt et al. (2009).
10 CHAPTER 2
SEO AMSTERDAM ECONOMICS
2.3 The problem: inefficient organized airspace results in economic and environmental costs
A major challenge relates to the organization and capacity of European airspace. The current organization of European airspace is not optimal. Flight paths are not as direct as they could be. Because each country still has its own airspace management infrastructure, there are many times more equipment, people and processes managing this across Europe than is necessary. This results in longer than necessary flight times and delays, as well as higher than needed ANSP costs. Airlines and the airline clients bear these higher costs. Extended flight paths also lead to higher than necessary aircraft fuel consumption, avoidable emissions such as CO2, and airspace capacity bottlenecks.
2.3.1 Comparing the US and Europe
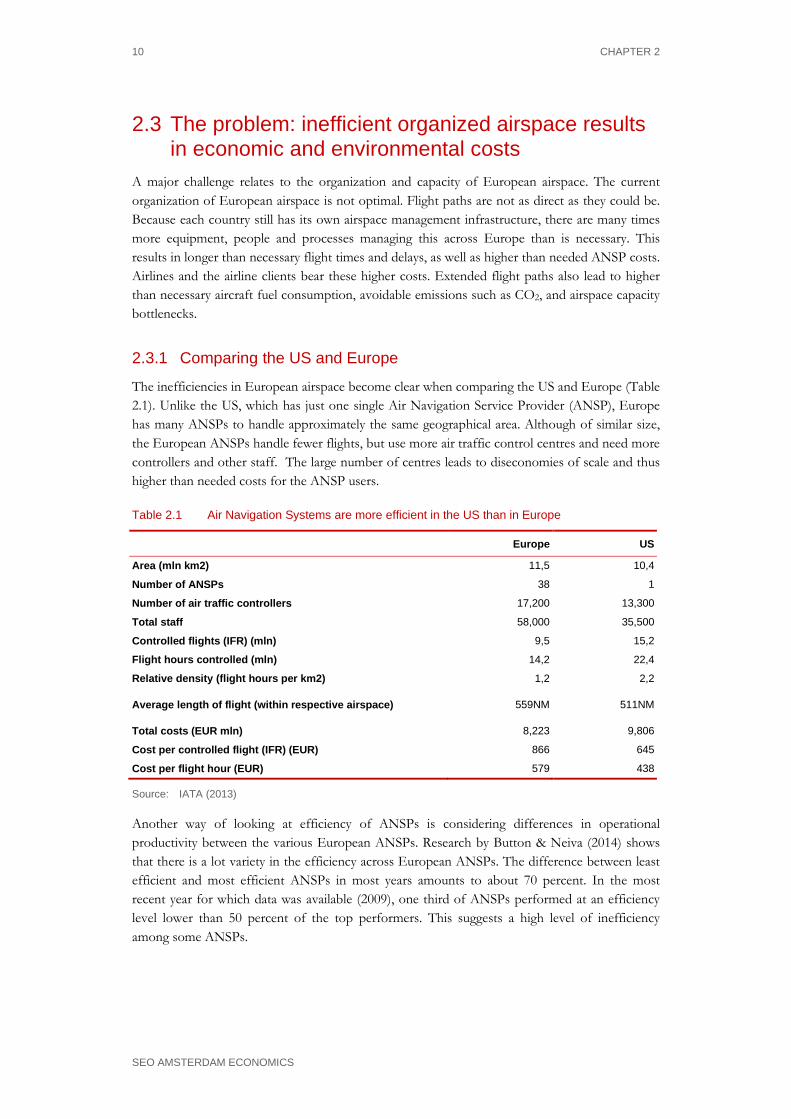
The inefficiencies in European airspace become clear when comparing the US and Europe (Table 2.1). Unlike the US, which has just one single Air Navigation Service Provider (ANSP), Europe has many ANSPs to handle approximately the same geographical area. Although of similar size, the European ANSPs handle fewer flights, but use more air traffic control centres and need more controllers and other staff. The large number of centres leads to diseconomies of scale and thus higher than needed costs for the ANSP users.
Table 2.1 Air Navigation Systems are more efficient in the US than in Europe
Europe US
Area (mln km2) 11,5 10,4
Number of ANSPs 38 1
Number of air traffic controllers 17,200 13,300
Total staff 58,000 35,500
Controlled flights (IFR) (mln) 9,5 15,2
Flight hours controlled (mln) 14,2 22,4
Relative density (flight hours per km2) 1,2 2,2
Average length of flight (within respective airspace) 559NM 511NM
Total costs (EUR mln) 8,223 9,806
Cost per controlled flight (IFR) (EUR) 866 645
Cost per flight hour (EUR) 579 438
Source: IATA (2013)
Another way of looking at efficiency of ANSPs is considering differences in operational productivity between the various European ANSPs. Research by Button & Neiva (2014) shows that there is a lot variety in the efficiency across European ANSPs. The difference between least efficient and most efficient ANSPs in most years amounts to about 70 percent. In the most recent year for which data was available (2009), one third of ANSPs performed at an efficiency level lower than 50 percent of the top performers. This suggests a high level of inefficiency among some ANSPs.
HOW AIRSPACE INEFFICIENCIES AND AIRPORT CAPACITY CONSTRAINTS LIMIT CONNECTIVITY AND ECONOMIC GROWTH 11
SEO AMSTERDAM ECONOMICS
2.3.2 Flight inefficiency
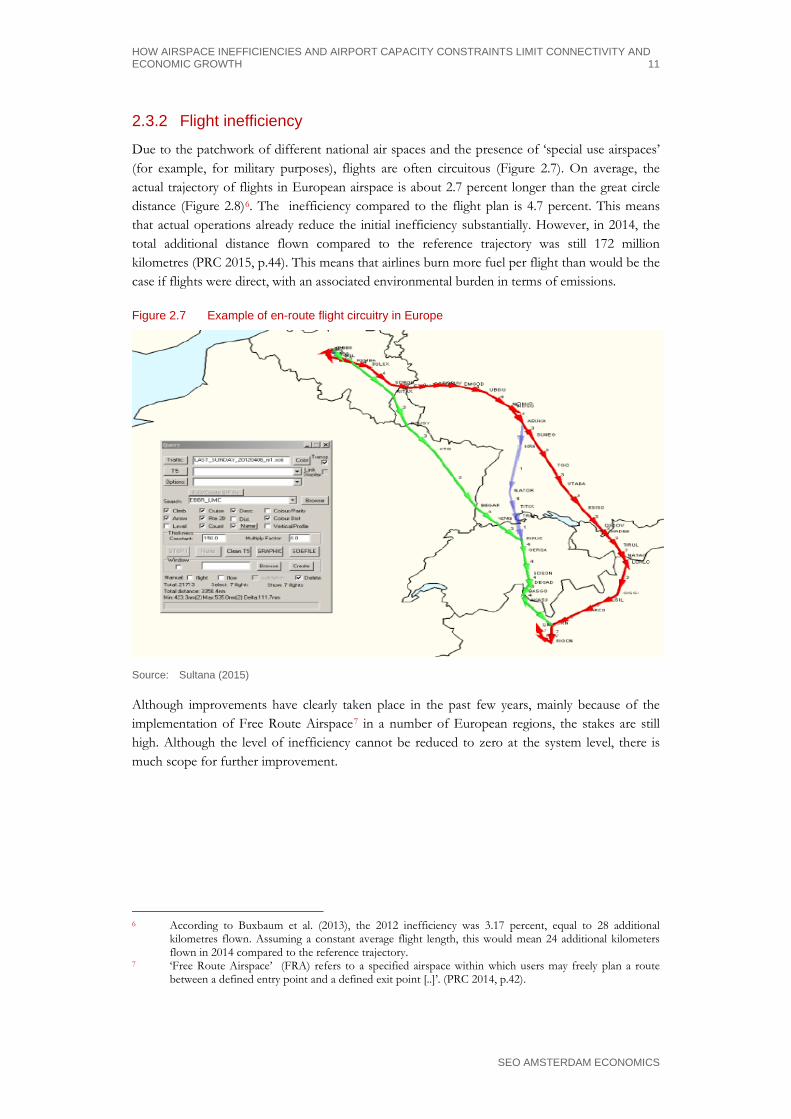
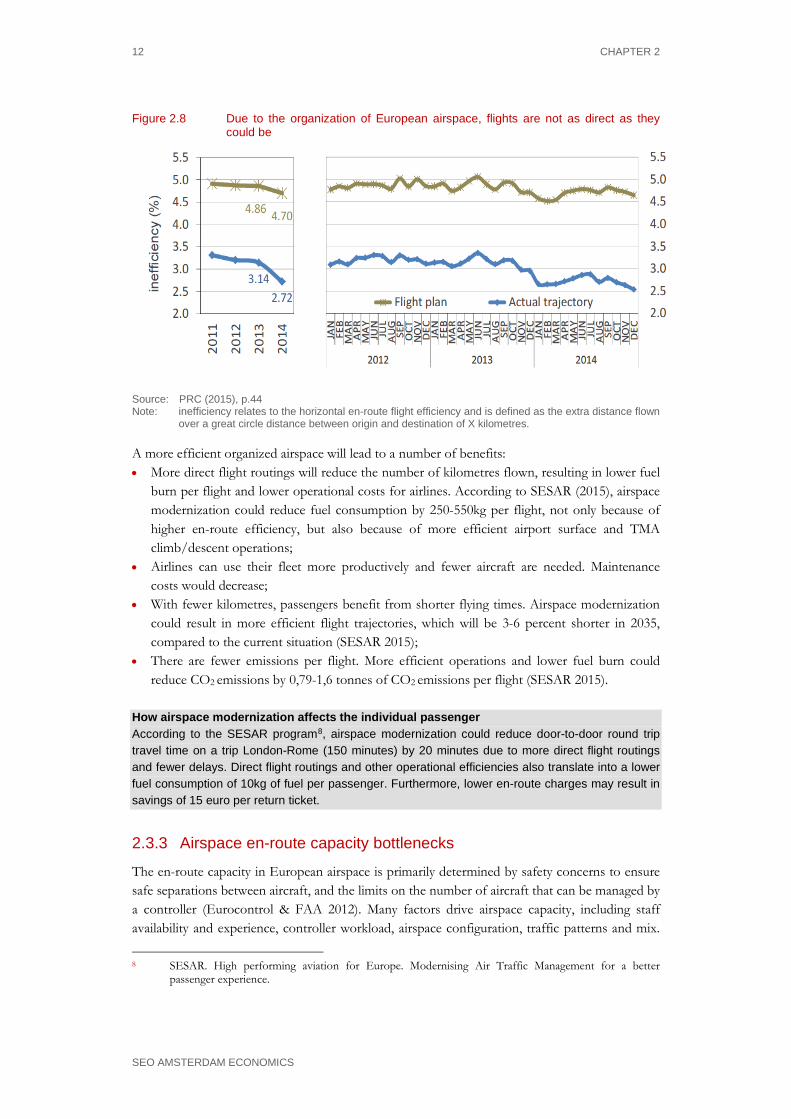
Due to the patchwork of different national air spaces and the presence of ‘special use airspaces’ (for example, for military purposes), flights are often circuitous (Figure 2.7). On average, the actual trajectory of flights in European airspace is about 2.7 percent longer than the great circle distance (Figure 2.8)6. The inefficiency compared to the flight plan is 4.7 percent. This means that actual operations already reduce the initial inefficiency substantially. However, in 2014, the total additional distance flown compared to the reference trajectory was still 172 million kilometres (PRC 2015, p.44). This means that airlines burn more fuel per flight than would be the case if flights were direct, with an associated environmental burden in terms of emissions.
Figure 2.7 Example of en-route flight circuitry in Europe
Source: Sultana (2015)
Although improvements have clearly taken place in the past few years, mainly because of the implementation of Free Route Airspace7 in a number of European regions, the stakes are still high. Although the level of inefficiency cannot be reduced to zero at the system level, there is much scope for further improvement.
6 According to Buxbaum et al. (2013), the 2012 inefficiency was 3.17 percent, equal to 28 additional
kilometres flown. Assuming a constant average flight length, this would mean 24 additional kilometers flown in 2014 compared to the reference trajectory.
7 ‘Free Route Airspace’ (FRA) refers to a specified airspace within which users may freely plan a route between a defined entry point and a defined exit point [..]’. (PRC 2014, p.42).
12 CHAPTER 2
SEO AMSTERDAM ECONOMICS
Figure 2.8 Due to the organization of European airspace, flights are not as direct as they could be
Source: PRC (2015), p.44 Note: inefficiency relates to the horizontal en-route flight efficiency and is defined as the extra distance flown
over a great circle distance between origin and destination of X kilometres.
A more efficient organized airspace will lead to a number of benefits: • More direct flight routings will reduce the number of kilometres flown, resulting in lower fuel
burn per flight and lower operational costs for airlines. According to SESAR (2015), airspace modernization could reduce fuel consumption by 250-550kg per flight, not only because of higher en-route efficiency, but also because of more efficient airport surface and TMA climb/descent operations;
• Airlines can use their fleet more productively and fewer aircraft are needed. Maintenance costs would decrease;
• With fewer kilometres, passengers benefit from shorter flying times. Airspace modernization could result in more efficient flight trajectories, which will be 3-6 percent shorter in 2035, compared to the current situation (SESAR 2015);
• There are fewer emissions per flight. More efficient operations and lower fuel burn could reduce CO2 emissions by 0,79-1,6 tonnes of CO2 emissions per flight (SESAR 2015).
How airspace modernization affects the individual passenger According to the SESAR program8, airspace modernization could reduce door-to-door round trip travel time on a trip London-Rome (150 minutes) by 20 minutes due to more direct flight routings and fewer delays. Direct flight routings and other operational efficiencies also translate into a lower fuel consumption of 10kg of fuel per passenger. Furthermore, lower en-route charges may result in savings of 15 euro per return ticket.
2.3.3 Airspace en-route capacity bottlenecks
The en-route capacity in European airspace is primarily determined by safety concerns to ensure safe separations between aircraft, and the limits on the number of aircraft that can be managed by a controller (Eurocontrol & FAA 2012). Many factors drive airspace capacity, including staff availability and experience, controller workload, airspace configuration, traffic patterns and mix.
8 SESAR. High performing aviation for Europe. Modernising Air Traffic Management for a better
passenger experience.
HOW AIRSPACE INEFFICIENCIES AND AIRPORT CAPACITY CONSTRAINTS LIMIT CONNECTIVITY AND ECONOMIC GROWTH 13
SEO AMSTERDAM ECONOMICS
Additionally, en-route capacity may be affected by external factors such as weather and availability of special use airspace. With the expected growth of air traffic, not only the European airport infrastructure will become more and more congested, but also European en-route airspace itself. Without airspace modernization, airspace en-route capacity shortages will lead to rising delay levels. When flight demand approaches system capacity, delay will increase nonlinearly if no further action is undertaken (NEXTOR 2010). Currently, when an imbalance between airspace demand and capacity is detected, the Eurocontrol Network Management Operations Centre (NMOC) may employ a number of measures to avoid airspace congestion (Eurocontrol & FAA 2012). One of these includes imposing ATFM slot allocation regulations9. This means limiting the number of flights that can enter the congested airspace during a certain period of time. The result is that aircraft will be on hold on the ground, the so-called ATFM delays. The latter measure is based on the principle that delays on the ground are less costly and safer than those in the air.
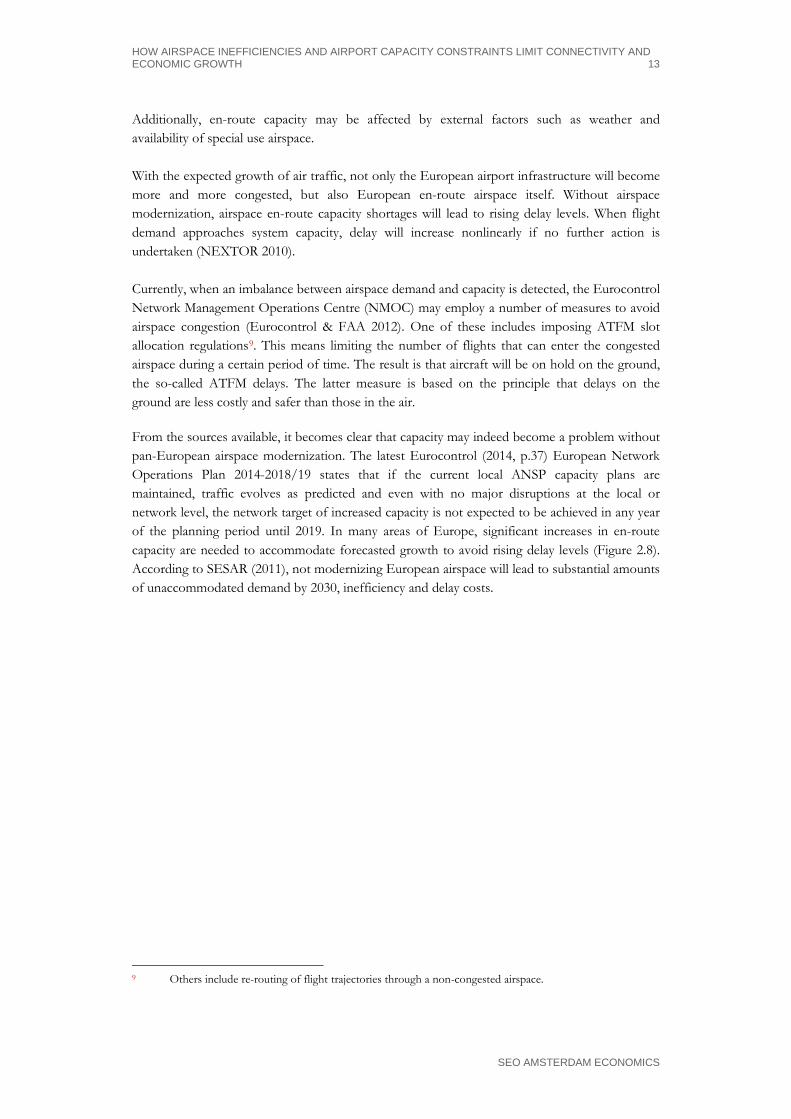
From the sources available, it becomes clear that capacity may indeed become a problem without pan-European airspace modernization. The latest Eurocontrol (2014, p.37) European Network Operations Plan 2014-2018/19 states that if the current local ANSP capacity plans are maintained, traffic evolves as predicted and even with no major disruptions at the local or network level, the network target of increased capacity is not expected to be achieved in any year of the planning period until 2019. In many areas of Europe, significant increases in en-route capacity are needed to accommodate forecasted growth to avoid rising delay levels (Figure 2.8). According to SESAR (2011), not modernizing European airspace will lead to substantial amounts of unaccommodated demand by 2030, inefficiency and delay costs.
9 Others include re-routing of flight trajectories through a non-congested airspace.
14 CHAPTER 2
SEO AMSTERDAM ECONOMICS
Figure 2.9 Summer capacity increases required in European airspace by 2019
Source: Eurocontrol (2014)
2.3.4 Delays
Airspace capacity bottlenecks cause delays. The average all-causes flight delay in Europe was almost 10 minutes per flight in 2014 (Eurocontrol 2014). The average all-causes delay per delayed flight was 26 minutes. Average delay per flight in September 2015 was 10.6 minutes. Delays do not only result in inconvenience and costs for the passenger, but also in considerable costs for the airlines. A 30 minute delay of a Boeing 737-800 flight generates a cost burden for the airline of approximately 1.170 euro. This rapidly increases to 28.390 euro for a three hour delay (University of Westminster 2015)10. Airspace modernization could reduce delays by 10-30 percent by 2035, resulting in substantial airline cost savings and passenger benefits (SESAR 2015).
2.3.5 The costs of airspace inefficiencies to airspace users and consumers
A number of studies have quantified the costs of airspace inefficiencies and airport infrastructure capacity bottlenecks or demonstrated the benefits of solving them: • Taking together ATFM delays and additional time losses during taxi-out, en-route and arrival,
IATA (2013) estimates the cost for airspace users (airlines) at 4.5 billion euro per year. On top
10 Amongst other things, the sharp increase in delay costs is due to compensation to to passengers under
Regulation 261, as well as the increase in reactionary delays due to a long primary delay.
HOW AIRSPACE INEFFICIENCIES AND AIRPORT CAPACITY CONSTRAINTS LIMIT CONNECTIVITY AND ECONOMIC GROWTH 15
SEO AMSTERDAM ECONOMICS
of the cost for airspace users, the delays and time losses also incur costs for consumers. IATA estimated the total additional time costs for consumers at 6.7 billion euro in 2012.
• InterVISTAS (2015) estimates that the foregone economic contribution due to airport capacity bottlenecks could be 97 billion of GDP until 2035 and 2 million jobs on an annual basis in Eurocontrol’s most likely ‘Regulated Growth’ scenario.
• SESAR JU (2011) quantifies the macroeconomic benefits of airspace modernization. The study estimates a GDP benefit of 419 billion euro over the period 2013-2030 or a 0.02 percentage point increase in GDP annual growth, including the direct, indirect and induced impacts. The GDP benefits are the result of more aviation demand that can be accommodated (43 percent of benefits), but also fuel savings, fewer delays, time enabled savings, CO2 savings and ATC cost efficiency. The study expects airspace modernization to create 328,000 additional jobs in Europe of which 42,000 are direct jobs within the aviation industry itself.
• In the supporting document ‘Performance and business views’ of the draft European ATM Master Plan 2015 Edition, SESAR (2015) addresses the impact of airspace modernization through SESAR in various key performance areas: cost efficiency (ANS productivity), operational efficiency, capacity, environment, safety and security. All benefits/savings have been assessed for 2035 by comparing a scenario of airspace modernization through SESAR with a baseline scenario. The baseline scenario assumes an ATM system with exact capabilities of the 2012 ATM system, but with an increase in traffic in line with Eurocontrol’s ‘Regulated Growth’ scenario.
• SESAR (2015) monetizes the benefits in the key performance areas for the civil airspace users (airlines and airports) in the field of ANS productivity, operational efficiency and additional capacity at congested airports for two deployment scenarios, which differ with respect to the level of coordination during deployment. In 2035 these benefits range between € 8-15 billion per year for the optimized deployment scenario and € 7-12 billion for the local deployment scenario. The 20 percent difference between both scenarios is driven by a wider scope of infrastructure rationalization and increased en-route operations savings.
2.3.6 The problem: progress of airspace modernization is slow, airport capacity expansion plans scaled back
It is clear that airspace modernization, capacity enhancements and more efficient use of airport capacity could result in significant benefits for Europe: for its consumers, for its airlines, for its airports and for the wider economy. Not realizing them may result in foregone connectivity benefits and associated economic growth potential. To improve airspace efficiency and capacity, the European Commission created the Single European Sky initiative with the aim of treating the European sky as one entity. The objective of the Single European Sky and its technological pillar SESAR is to modernize European airspace structure and air traffic management technologies as to accommodate future traffic growth in a cost-efficient, safe and sustainable way. In 2005 the European Commission stated a number of high level goals for SES and its technological pillar (SESAR 2009): enable a three-fold increase in capacity which will also reduce delays, improve the safety performance by a factor of 10, enable a 10% reduction in in the effects flights have on the environment and provide ATM services to the airspace users at a cost of at least 50% less.
16 CHAPTER 2
SEO AMSTERDAM ECONOMICS
However, the Single European Sky (SES) is progressing slowly. High ATM costs and delays in SES implementation persist. Furthermore, Eurocontrol concludes that planned airport capacity investments have been significantly scaled back, compared to a number of years ago. With reference to the performance of the Air Navigation Services, targets are set under the SES Performance Scheme at both Union-wide and national/FAB levels. Union-wide targets have been set for three key areas, environment, capacity and cost-efficiency during the first reference period (RP1: 2012-2014) The RP1 outcome has been poor especially in terms of operational benefits and cost control. According to the Performance Review Body Annual Monitoring Report 201411, en-route ATFM delays increased by 15 percent compared with 2013 and the EU-wide capacity KPI was 0.61 minutes ATFM delay per flight, which does not meet the 0.50 minute/flight targets set for 2014. ATFM delays were concentrated in France, Greece, Cyprus, Portugal and Poland. In terms of cost efficiency, the targeted cost per flight at EU level of 53.92 euro was not reached in 2014, being the actual cost/flight higher than planned (54.13 euro). Germany, Italy, Spain Canarias and Finland reported the largest increases in the actual unit costs.
2.4 The problem: airport capacity fails to keep up with demand
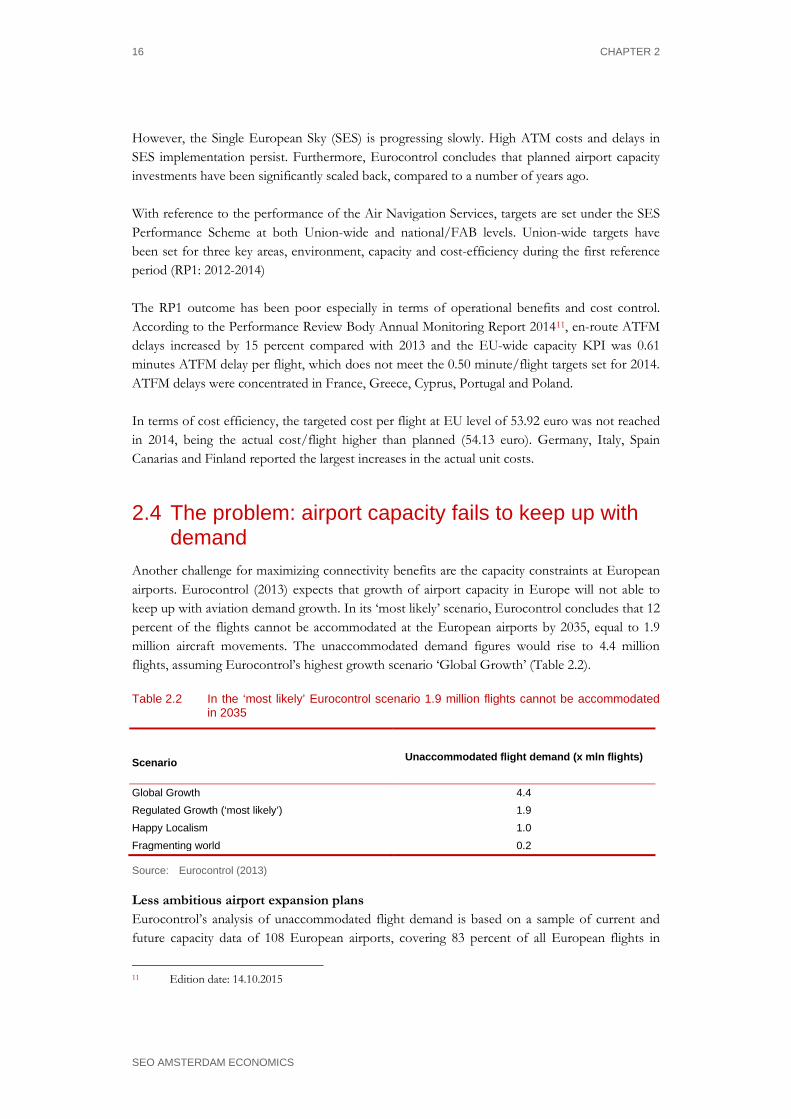
Another challenge for maximizing connectivity benefits are the capacity constraints at European airports. Eurocontrol (2013) expects that growth of airport capacity in Europe will not able to keep up with aviation demand growth. In its ‘most likely’ scenario, Eurocontrol concludes that 12 percent of the flights cannot be accommodated at the European airports by 2035, equal to 1.9 million aircraft movements. The unaccommodated demand figures would rise to 4.4 million flights, assuming Eurocontrol’s highest growth scenario ‘Global Growth’ (Table 2.2).
Table 2.2 In the ‘most likely’ Eurocontrol scenario 1.9 million flights cannot be accommodated in 2035
Scenario
Unaccommodated flight demand (x mln flights)
Global Growth 4.4 Regulated Growth (‘most likely’) 1.9 Happy Localism 1.0 Fragmenting world 0.2
Source: Eurocontrol (2013)
Less ambitious airport expansion plans Eurocontrol’s analysis of unaccommodated flight demand is based on a sample of current and future capacity data of 108 European airports, covering 83 percent of all European flights in
11 Edition date: 14.10.2015
HOW AIRSPACE INEFFICIENCIES AND AIRPORT CAPACITY CONSTRAINTS LIMIT CONNECTIVITY AND ECONOMIC GROWTH 17
SEO AMSTERDAM ECONOMICS
2012. Based on the sample, airport capacity is expected to increase by 17 percent until 2035. This percentage is less than half of the percentage that was reported in Eurocontrol’s analysis in 2010. Out of 13 airports that contributed significantly to the capacity growth that was expected in 2010, 12 have cut back their expansion plans12.
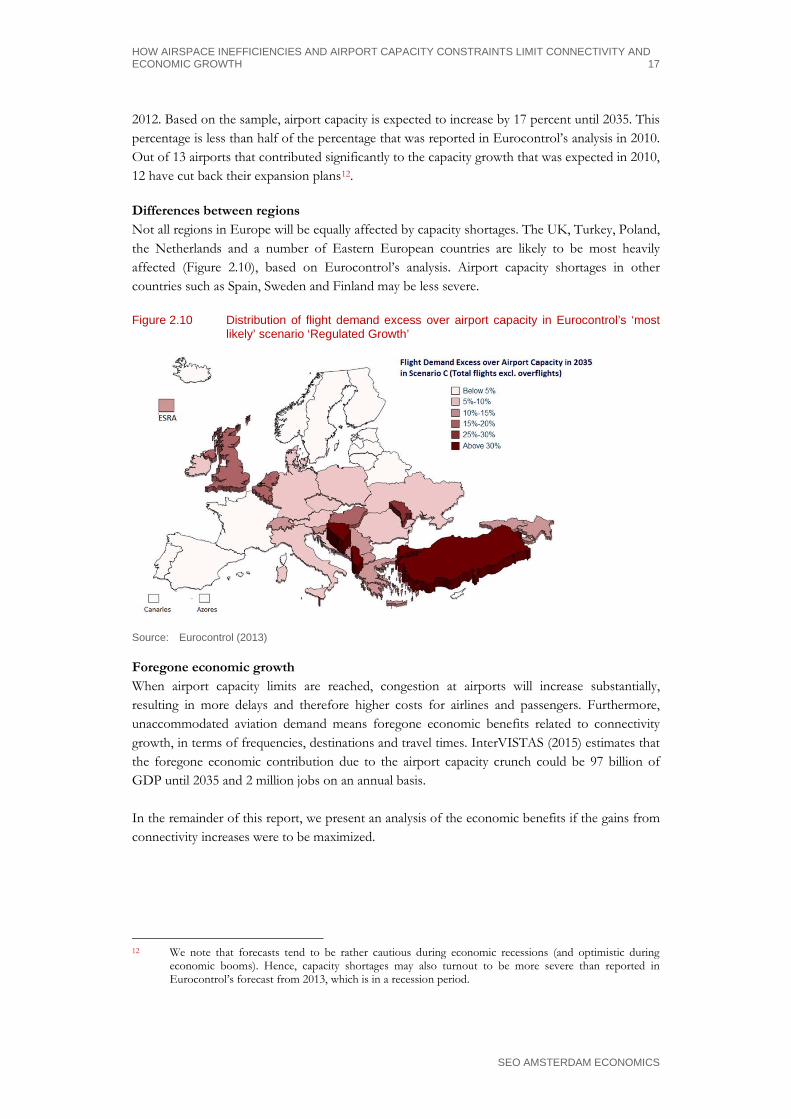
Differences between regions Not all regions in Europe will be equally affected by capacity shortages. The UK, Turkey, Poland, the Netherlands and a number of Eastern European countries are likely to be most heavily affected (Figure 2.10), based on Eurocontrol’s analysis. Airport capacity shortages in other countries such as Spain, Sweden and Finland may be less severe.
Figure 2.10 Distribution of flight demand excess over airport capacity in Eurocontrol’s ‘most likely’ scenario ‘Regulated Growth’
Source: Eurocontrol (2013)
Foregone economic growth When airport capacity limits are reached, congestion at airports will increase substantially, resulting in more delays and therefore higher costs for airlines and passengers. Furthermore, unaccommodated aviation demand means foregone economic benefits related to connectivity growth, in terms of frequencies, destinations and travel times. InterVISTAS (2015) estimates that the foregone economic contribution due to the airport capacity crunch could be 97 billion of GDP until 2035 and 2 million jobs on an annual basis. In the remainder of this report, we present an analysis of the economic benefits if the gains from connectivity increases were to be maximized.
12 We note that forecasts tend to be rather cautious during economic recessions (and optimistic during
economic booms). Hence, capacity shortages may also turnout to be more severe than reported in Eurocontrol’s forecast from 2013, which is in a recession period.


ECONOMIC BENEFITS OF EUROPEAN AIRSPACE MODERNIZATION 19
SEO AMSTERDAM ECONOMICS
3 Scenario analysis and forecast
Three future scenarios have been constructed in order to assess the economic benefits of airspace modernization and removal of airport capacity constraints. For each scenario, we have made an air traffic movement and passenger forecast. The forecast shows that airspace modernization and action to address airport capacity bottlenecks stimulates air travel demand and enables the European aviation system to accommodate a larger number of passengers and aircraft movements compared to a ‘do nothing’ scenario.
3.1 Introduction Airspace modernization and expansion of airport capacity is likely to deliver substantial economic benefits for Europe. These benefits will increase in future years, as capacity bottlenecks will get more severe when demand for air traffic grows, but airspace modernization and airport infrastructure development is not catching up. To assess the impact of airspace modernization, a future of European aviation with and without airspace modernization needs to be compared. Hence, in this chapter we discuss the construction of future air traffic scenarios for 2035 (as well as the intermediate milestone 2025). These scenarios and related forecasts will be used for the economic impact assessments in the subsequent chapters. We have forecasted the European aviation network and associated passenger demand in three different scenarios: • ‘Airspace Modernization’ scenario: an airspace modernization protocol is implemented
and airspace capacity is no longer restricted, but there are still airport capacity constraints; • ‘Maximizing Connectivity Benefits’ scenario: no airspace and airport capacity restrictions
throughout Europe; • ‘Baseline’ scenario: airspace modernization is not taken forward beyond current levels. The
absence of airspace modernization causes additional capacity constraints in the airspace and inefficiencies remain.
In the following sections, we discuss the scope of the research as well as the data and methodology used regarding the construction of the three different scenarios. Finally, we present the forecast/scenario results in terms of ATM movements and passengers.
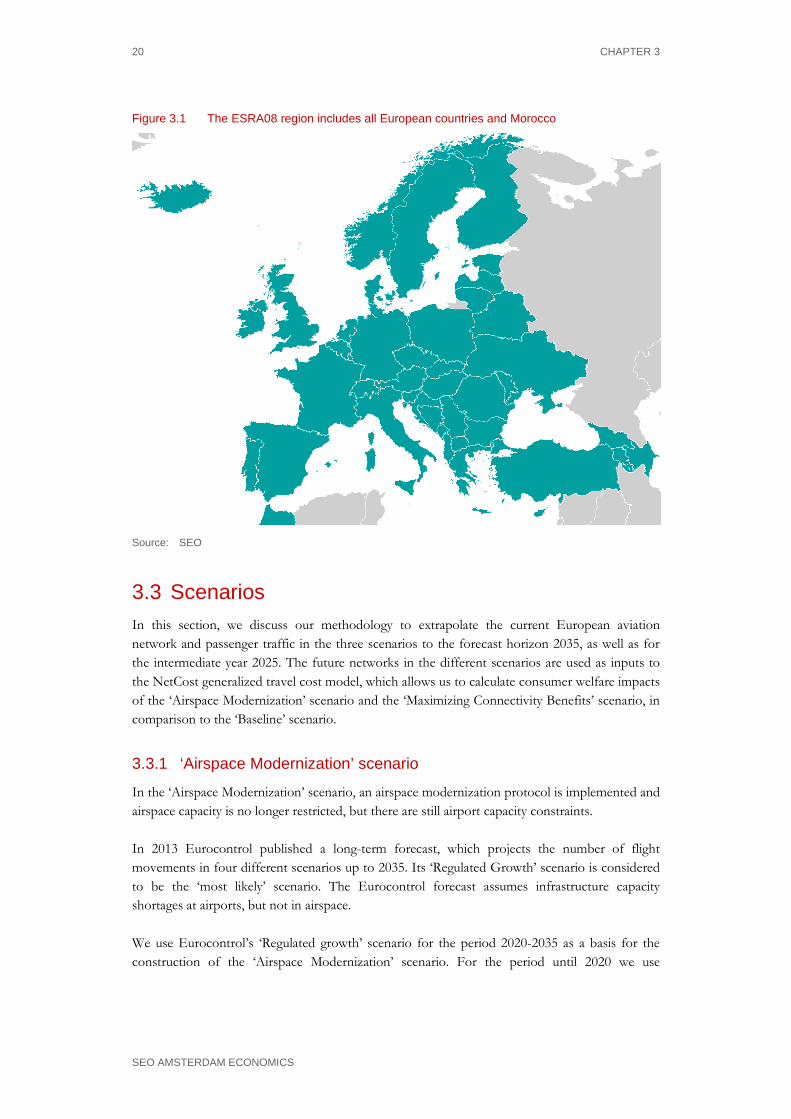
3.2 Scope The economic benefits in the ‘Airspace Modernization’ scenario and the ‘Maximizing Connectivity Benefits’ scenario have been compared to those in the ‘Baseline’ scenario for 2025 and 2035. The benefits will be estimated for the entire ESRA08 region (see Figure 3.1) and broken down to the country level. Results have been calculated for European passengers travelling on scheduled passenger flights.
20 CHAPTER 3
SEO AMSTERDAM ECONOMICS
Figure 3.1 The ESRA08 region includes all European countries and Morocco
Source: SEO
3.3 Scenarios In this section, we discuss our methodology to extrapolate the current European aviation network and passenger traffic in the three scenarios to the forecast horizon 2035, as well as for the intermediate year 2025. The future networks in the different scenarios are used as inputs to the NetCost generalized travel cost model, which allows us to calculate consumer welfare impacts of the ‘Airspace Modernization’ scenario and the ‘Maximizing Connectivity Benefits’ scenario, in comparison to the ‘Baseline’ scenario.
3.3.1 ‘Airspace Modernization’ scenario
In the ‘Airspace Modernization’ scenario, an airspace modernization protocol is implemented and airspace capacity is no longer restricted, but there are still airport capacity constraints. In 2013 Eurocontrol published a long-term forecast, which projects the number of flight movements in four different scenarios up to 2035. Its ‘Regulated Growth’ scenario is considered to be the ‘most likely’ scenario. The Eurocontrol forecast assumes infrastructure capacity shortages at airports, but not in airspace. We use Eurocontrol’s ‘Regulated growth’ scenario for the period 2020-2035 as a basis for the construction of the ‘Airspace Modernization’ scenario. For the period until 2020 we use

SCENARIO ANALYSIS AND FORECAST 21
SEO AMSTERDAM ECONOMICS
Eurocontrol’s more recent Seven-Year Forecast (2015) covering the period 2015-2021. This forecast projects the number of flight movements in a ‘High’, ‘Base’ and ‘Low’ scenario. We follow the results in the ‘Base’ scenario, which is Eurocontrol’s ‘most likely’ scenario.
According to the SESAR ATM Master Plan, airspace modernization will increase airport capacity resulting in a certain reduction of unaccommodated demand due to airport infrastructure constraints. This reduction was not included in Eurocontrol’s ‘Regulated Growth’ forecast, as the forecast does not specifically assume airspace modernization. In our scenario, we do assume the implementation of an airspace modernization protocol such as SES. Therefore, we adjust the growth rates for the additional system capacity that airspace modernization may deliver through the increase in airport capacity. The SESAR ATM Master Plan estimates that this additional capacity will increase from 170,000 flight movements in 2025 to 247,000 flight movements in 2030 and 332,000 flight movements in 2035. Figure 2.10 shows that some European countries face more excess demand than others because of differences in air traffic growth rates and airport infrastructure capacity constraints. The additional movements are divided among the different Eurocontrol Member States based on these levels of unaccommodated demand. Eurocontrol’s ‘Regulated Growth’ scenario does not take into account the cost savings arising from airspace modernization. However, passengers will benefit from lower travel times and costs, leading to additional market growth. These market stimulation effects have been added to the Eurocontrol forecasts. We estimate that these cost and time savings increase with the average annual growth rate of 0.3 percent point in the ‘Airspace Modernization’ and ‘Maximizing Connectivity Benefits’ scenarios, using so-called ‘generalized travel cost elasticities’ (see also section 5.1).
3.3.2 ‘Maximizing Connectivity Benefits’ scenario
In the ‘Maximizing Connectivity Benefits’ scenario, there are no airspace or airport capacity restrictions throughout Europe. All demand can be accommodated. The ‘Maximizing Connectivity Benefits’ scenario has been derived from the Eurocontrol ‘Regulated Growth’ scenario as well, by adjusting its growth figures upward as a result of the absence of any airport capacity restrictions. In its long-term forecast, Eurocontrol estimates the total number of unaccommodated flights. In the ‘Regulated Growth’ scenario, assuming no airspace constraints, 3.8 percent of the flight movements cannot be accommodated in 2025. This number increases to 11.7 percent in 2035.13 We assigned the total unaccommodated demand to each of the European countries based on the level of excess demand in Figure 2.10. Next, we adjusted the number of flight movements in the ‘Airspace Modernization’ scenario upward using this unaccommodated demand to obtain the
13 In 2020 the number of unaccommodated flights in the ‘Regulated Growth scenario’ of the Eurocontrol
long-term forecast is very limited. Therefore we assume that there are no airport capacity restrictions until 2020.
22 CHAPTER 3
SEO AMSTERDAM ECONOMICS
number of flight movements in the ‘Maximizing Connectivity Benefits’ scenario. The upward adjustment results in an average annual growth rate between 2014 and 2035 of 2.8 percent.
3.3.3 ‘Baseline’ scenario
In the ‘Baseline’ scenario, airspace modernization is not taken forward beyond current levels. The absence of airspace modernization causes additional capacity constraints in the airspace and inefficiencies remain. Airport capacity constraints are not removed. The ‘Baseline’ scenario is based on an adjusted Eurocontrol’s ‘Regulated Growth’ scenario by adjusting its growth figures downward, because of airspace restrictions and congestion in the absence of airspace modernization. The SESAR ATM Master Plan 2015 Edition provides ambition levels with respect to airspace capacity (80-100 percent more capacity compared to 2012 levels) due to airspace modernization, but it does not indicate to what extent the actual supply of air traffic movements is reduced when airspace modernization would not be implemented and individual ANSPs would not increase airspace capacity14. In the ‘Baseline’ scenario (without airspace modernization), we assume that airspace capacity increases by approximately 30 percent in terms of the number of flights that can be accommodated in European airspace in 2035 compared to 2014 levels. This is equal to a 1.3 percent growth in aircraft movements per year. As unconstrained market growth is larger than the capacity in the baseline scenario, a certain amount of traffic demand cannot be accommodated. In addition, airport capacity limitations constrain traffic growth. The number of aircraft movements without airspace modernization has been estimated by adjusting Eurocontrol’s ‘Regulated Growth’ scenario downward, using results from the SESAR JU (2011) study. The study shows to what extent the number of flight movements could be reduced without airspace modernization. In addition, as we expect airlines to increase average aircraft size in case of airport and airspace constraints, average aircraft size will increase in this scenario. We refer to Appendix A for the steps followed to derive the ‘Baseline’ scenario, as well as the assumptions on aircraft size growth.
3.4 Forecast
3.4.1 Growth in air traffic movements per scenario
Table 3.1 presents the total number of aircraft movements departing from the ESRA08 Member States in the forecast years. The growth rates until 2020 are equal for all three scenarios as capacity restrictions do not yet form a bottleneck in this year. Appendix F shows the growth rates for each of the Member States. The figures denote scheduled movements departing from any of
14 In the monetization of the benefits of airspace modernization through SESAR, SESAR (2015) defines a
baseline scenario without airspace modernization. This scenario entails an ATM system with the exact capabilities of the 2012 ATM system, but allowing traffic to increase in line with Eurocontrol’s ‘Regulated Growth’ scenario. Traffic levels are equal with and without airspace modernization. In our study, the ‘Baseline’ scenario contains a lower capacity of the European ATM system and lower traffic levels as a result.
SCENARIO ANALYSIS AND FORECAST 23
SEO AMSTERDAM ECONOMICS
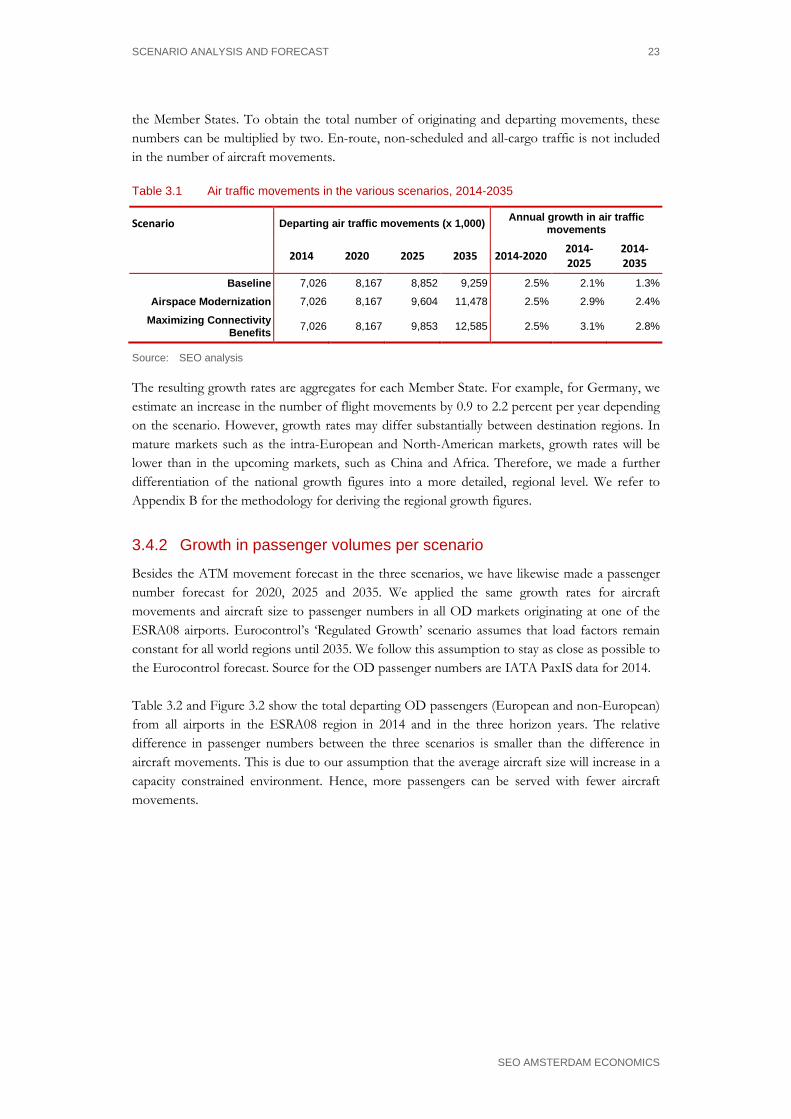
the Member States. To obtain the total number of originating and departing movements, these numbers can be multiplied by two. En-route, non-scheduled and all-cargo traffic is not included in the number of aircraft movements.
Table 3.1 Air traffic movements in the various scenarios, 2014-2035
Scenario Departing air traffic movements (x 1,000) Annual growth in air traffic movements
2014 2020 2025 2035 2014-2020 2014-2025
2014-2035
Baseline 7,026 8,167 8,852 9,259 2.5% 2.1% 1.3%
Airspace Modernization 7,026 8,167 9,604 11,478 2.5% 2.9% 2.4%
Maximizing Connectivity Benefits 7,026 8,167 9,853 12,585 2.5% 3.1% 2.8%
Source: SEO analysis
The resulting growth rates are aggregates for each Member State. For example, for Germany, we estimate an increase in the number of flight movements by 0.9 to 2.2 percent per year depending on the scenario. However, growth rates may differ substantially between destination regions. In mature markets such as the intra-European and North-American markets, growth rates will be lower than in the upcoming markets, such as China and Africa. Therefore, we made a further differentiation of the national growth figures into a more detailed, regional level. We refer to Appendix B for the methodology for deriving the regional growth figures.
3.4.2 Growth in passenger volumes per scenario
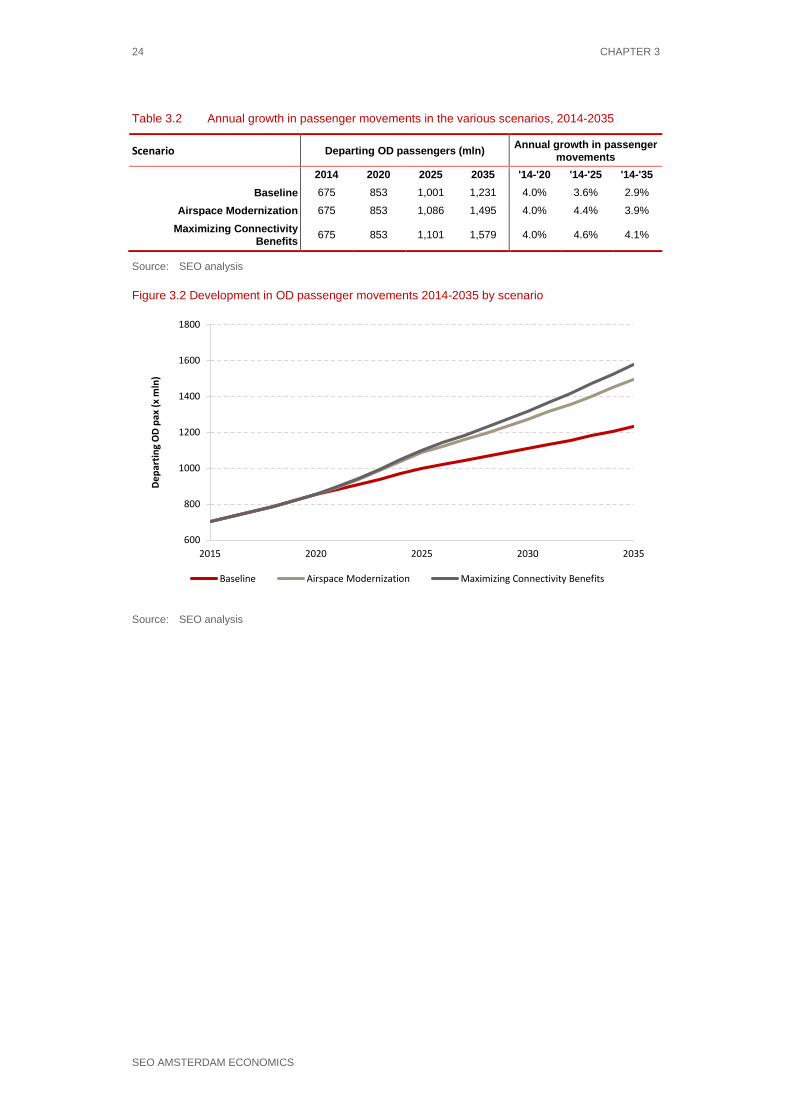
Besides the ATM movement forecast in the three scenarios, we have likewise made a passenger number forecast for 2020, 2025 and 2035. We applied the same growth rates for aircraft movements and aircraft size to passenger numbers in all OD markets originating at one of the ESRA08 airports. Eurocontrol’s ‘Regulated Growth’ scenario assumes that load factors remain constant for all world regions until 2035. We follow this assumption to stay as close as possible to the Eurocontrol forecast. Source for the OD passenger numbers are IATA PaxIS data for 2014. Table 3.2 and Figure 3.2 show the total departing OD passengers (European and non-European) from all airports in the ESRA08 region in 2014 and in the three horizon years. The relative difference in passenger numbers between the three scenarios is smaller than the difference in aircraft movements. This is due to our assumption that the average aircraft size will increase in a capacity constrained environment. Hence, more passengers can be served with fewer aircraft movements.
24 CHAPTER 3
SEO AMSTERDAM ECONOMICS
Table 3.2 Annual growth in passenger movements in the various scenarios, 2014-2035
Scenario Departing OD passengers (mln) Annual growth in passenger movements
2014 2020 2025 2035 '14-'20 '14-'25 '14-'35
Baseline 675 853 1,001 1,231 4.0% 3.6% 2.9%
Airspace Modernization 675 853 1,086 1,495 4.0% 4.4% 3.9%
Maximizing Connectivity Benefits 675 853 1,101 1,579 4.0% 4.6% 4.1%
Source: SEO analysis
Figure 3.2 Development in OD passenger movements 2014-2035 by scenario
Source: SEO analysis
600
800
1000
1200
1400
1600
1800
2015 2020 2025 2030 2035
Depa
rtin
g O
D pa
x (x
mln
)
Baseline Airspace Modernization Maximizing Connectivity Benefits
ECONOMIC BENEFITS OF EUROPEAN AIRSPACE MODERNIZATION 25
SEO AMSTERDAM ECONOMICS
4 Calculating the economic benefits of airspace modernization: two approaches
To assess the economic benefits of airspace modernization up to 2035, we use two different approaches. The first is the economic welfare approach. The approach focuses primarily on consumer benefits. The second is the economic contribution approach. The approach calculates the macro-economic contribution of additional aviation activity in terms of GDP and employment growth as well as the wider, catalytic impacts.
4.1 Two approaches to assess the economic benefits of airspace modernization
We use two different approaches to assess the economic benefits of airspace modernization up to 2035. The first is the economic welfare approach. The approach takes into account the impacts of airspace modernization that are valued by society. This includes the money and time saved by air travelers because of more direct flight routings, but also the monetized impacts of CO2 reductions per flight. The second is the economic contribution approach. The approach calculates the economic contribution of additional aviation activity in terms of GDP and employment growth. In this chapter we explain both approaches and highlight the differences between the two.
4.2 Economic welfare approach The economic welfare impact is the total impact on society from a certain policy intervention or economic transaction. In our case, we calculate the economic welfare impact of a scenario in which European airspace would be modernized (‘Airspace Modernization’ scenario), compared to a ‘Baseline’ scenario without airspace modernization. In addition, using a generalized travel cost approach we estimate the welfare impacts of an ‘unconstrained’ future (the ‘Maximizing Connectivity Benefits’ scenario), in which both airspace inefficiencies and capacity constraints would be removed, also in comparison to the ‘Baseline’ scenario (see chapter 4). We distinguish between different impacts: • Impact for travelers (‘consumer surplus’ for both business and leisure trips). Airspace
modernization brings various benefits to the passenger. These benefits include travel time savings due to shorter – less circuitous – flight paths and fewer delays, as well as higher frequencies and more flights. In addition, there may be a reduction in average fares in case part of the productivity and efficiency gains among ANSPs and airlines are passed through to the passenger. These lower fares result in market generation, which also constitutes a welfare gain. Finally, additional capacity results in less unaccommodated demand;
• Impact for suppliers of aviation services (producer surplus). Airspace modernization also brings about productivity and efficiency gains for ANSPs and airlines. As far as they are able to keep these gains to themselves, this will lead to an increase in producer surplus. If not, they are passed-on downstream. We assume that airlines will pass on any cost advantages to consumers in the long run. Any other changes in producer surplus for airlines, airports,

26 CHAPTER 4
SEO AMSTERDAM ECONOMICS
ANSPs or other stakeholders in the aviation value chain have not been quantified in this study, although we acknowledge that these effects may exist. For example, changes in the producer surplus of airlines as a result of lower fares due to less capacity scarcity and more competition have not been addressed, but the consumer benefits of such a development have been taken into account.
• External environmental impacts. External environmental impacts of aviation consist of emissions, noise and safety. Although airspace modernization increases airspace and airport capacity throughout Europe and external impacts per flight may decrease, total emissions and noise may increase in comparison to a scenario without airspace modernization (‘Baseline’) due to the increase in flight movements;
• Wider economic impacts. Important sources of additional wider economic impacts are agglomeration effects. Connectivity growth in an airport region may lead to higher density of activities in that region. Concentration of economic activity in itself can reduce (spatial) market imperfections and result in higher productivity measured in GDP/capita, for example because of knowledge spillovers, a pooled labour market and consumption variety.
4.3 Economic contribution approach In the economic contribution approach we estimate the net impacts of an increase in air travel on total GDP and employment, using a panel data approach with time-lag variables. Using the elasticities from this analysis, we estimate the macro-economic impact of growth in air passengers or connectivity. The macro-economic impacts of air transport result from the production of air transport. Catalytic impacts capture the extent to which the growth in air transport boosts performance in other industries. For example, air transport growth may impact tourism, investment, labour productivity and innovation. These effects are the direct result from people and companies using air transport for private or business purposes. These effects all contribute to the total GDP impact of air travel. As such, the catalytic impacts are a specification of the total GDP impact and not additional impacts.
4.4 Differences between the two approaches The welfare benefits as addressed in section 4.2 are only partly captured in output measures such as GDP. For instance, the fact that travel time for leisure passengers will be shortened because of airspace modernization will not result in higher GDP. However, lower ticket prices for business passengers may result in lower cost levels for European companies and therefore in a higher GDP. Another difference between the welfare and economic contribution approach is the fact that the welfare approach estimates the impacts for European residents and companies. The economic contribution approach also takes into account the impact of non-European companies located in Europe. Finally, the economic contribution approach tends to measure the gross impacts, without adjusting for labour costs and capital costs. Aviation growth due to airspace modernization may lead to more jobs in a certain airport region. Generally, employing people entails costs, not only to their employers but also to society. The size of these costs depend on the type of jobs and on the labour market situation. If unemployed people fill the jobs, the labour costs are partly compensated by reduced unemployment benefits. If the jobs will be filled in by
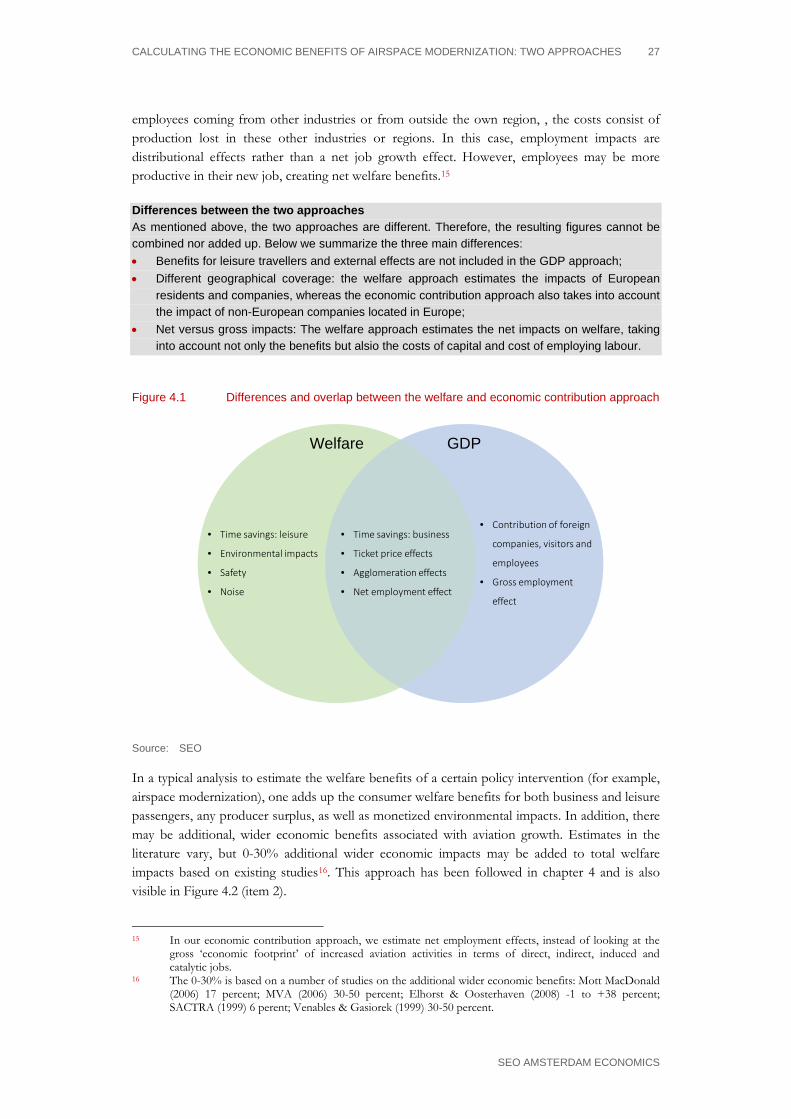
CALCULATING THE ECONOMIC BENEFITS OF AIRSPACE MODERNIZATION: TWO APPROACHES 27
SEO AMSTERDAM ECONOMICS
employees coming from other industries or from outside the own region, , the costs consist of production lost in these other industries or regions. In this case, employment impacts are distributional effects rather than a net job growth effect. However, employees may be more productive in their new job, creating net welfare benefits.15
Differences between the two approaches As mentioned above, the two approaches are different. Therefore, the resulting figures cannot be combined nor added up. Below we summarize the three main differences: • Benefits for leisure travellers and external effects are not included in the GDP approach; • Different geographical coverage: the welfare approach estimates the impacts of European
residents and companies, whereas the economic contribution approach also takes into account the impact of non-European companies located in Europe;
• Net versus gross impacts: The welfare approach estimates the net impacts on welfare, taking into account not only the benefits but alsio the costs of capital and cost of employing labour.
Figure 4.1 Differences and overlap between the welfare and economic contribution approach
Welfare GDP
• Time savings: leisure
• Environmental impacts
• Safety
• Noise
• Time savings: business
• Ticket price effects
• Agglomeration effects
• Net employment effect
• Contribution of foreign
companies, visitors and
employees
• Gross employment
effect
Source: SEO
In a typical analysis to estimate the welfare benefits of a certain policy intervention (for example, airspace modernization), one adds up the consumer welfare benefits for both business and leisure passengers, any producer surplus, as well as monetized environmental impacts. In addition, there may be additional, wider economic benefits associated with aviation growth. Estimates in the literature vary, but 0-30% additional wider economic impacts may be added to total welfare impacts based on existing studies16. This approach has been followed in chapter 4 and is also visible in Figure 4.2 (item 2).
15 In our economic contribution approach, we estimate net employment effects, instead of looking at the
gross ‘economic footprint’ of increased aviation activities in terms of direct, indirect, induced and catalytic jobs.
16 The 0-30% is based on a number of studies on the additional wider economic benefits: Mott MacDonald (2006) 17 percent; MVA (2006) 30-50 percent; Elhorst & Oosterhaven (2008) -1 to +38 percent; SACTRA (1999) 6 perent; Venables & Gasiorek (1999) 30-50 percent.
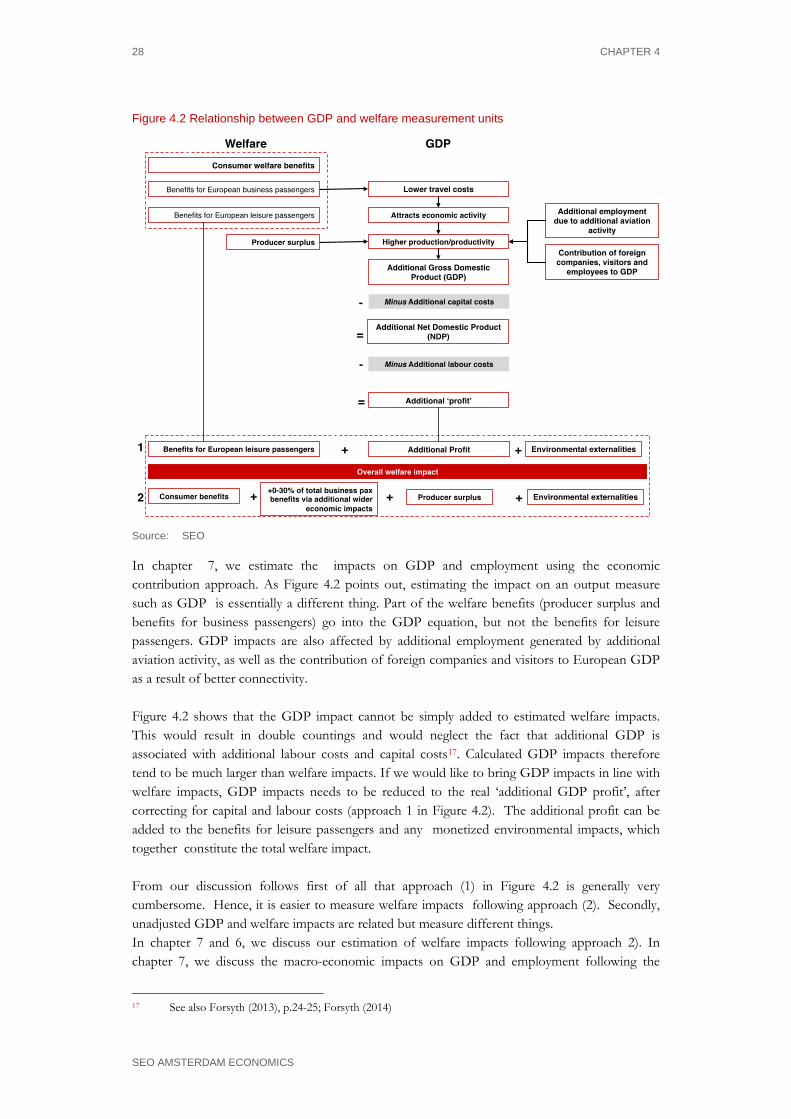
28 CHAPTER 4
SEO AMSTERDAM ECONOMICS
Figure 4.2 Relationship between GDP and welfare measurement units
Source: SEO
In chapter 7, we estimate the impacts on GDP and employment using the economic contribution approach. As Figure 4.2 points out, estimating the impact on an output measure such as GDP is essentially a different thing. Part of the welfare benefits (producer surplus and benefits for business passengers) go into the GDP equation, but not the benefits for leisure passengers. GDP impacts are also affected by additional employment generated by additional aviation activity, as well as the contribution of foreign companies and visitors to European GDP as a result of better connectivity. Figure 4.2 shows that the GDP impact cannot be simply added to estimated welfare impacts. This would result in double countings and would neglect the fact that additional GDP is associated with additional labour costs and capital costs17. Calculated GDP impacts therefore tend to be much larger than welfare impacts. If we would like to bring GDP impacts in line with welfare impacts, GDP impacts needs to be reduced to the real ‘additional GDP profit’, after correcting for capital and labour costs (approach 1 in Figure 4.2). The additional profit can be added to the benefits for leisure passengers and any monetized environmental impacts, which together constitute the total welfare impact. From our discussion follows first of all that approach (1) in Figure 4.2 is generally very cumbersome. Hence, it is easier to measure welfare impacts following approach (2). Secondly, unadjusted GDP and welfare impacts are related but measure different things. In chapter 7 and 6, we discuss our estimation of welfare impacts following approach 2). In chapter 7, we discuss the macro-economic impacts on GDP and employment following the
17 See also Forsyth (2013), p.24-25; Forsyth (2014)

CALCULATING THE ECONOMIC BENEFITS OF AIRSPACE MODERNIZATION: TWO APPROACHES 29
SEO AMSTERDAM ECONOMICS
economic contribution approach. The GDP effects calculated are the unadjusted GDP impacts, not corrected for labour and capital costs.

ECONOMIC BENEFITS OF EUROPEAN AIRSPACE MODERNIZATION 31
SEO AMSTERDAM ECONOMICS
5 Welfare impacts of airspace modernization
Airspace modernization can potentially deliver European consumers € 32 billion of welfare benefits in 2035, compared to a scenario in which no further airspace modernization would take place. The total present value of airspace modernization over the period 2015-2035 period accumulates to € 126 billion. Consumer benefits increase to € 43 billion in 2035 if also remaining airport infrastructure capacity constraints are addressed, with a total present value of € 153 billion over the period 2015-2035. In this chapter, we discuss the economic welfare impacts of airspace modernization and reduction of capacity constraints under the economic welfare approach. These welfare impacts relate to benefits for aviation users (consumer surplus), per passenger reductions in external environmental costs and wider economic benefits. We first discuss the methodology for calculating the impacts and then present the results.
5.1 Methodology
5.1.1 Impact for aviation users (consumer surplus)
Consumer surplus is a widely accepted way of quantifying changes in welfare impact from policy interventions. In short, consumer surplus is a concept of monetized welfare. It is the amount consumers are willing to pay for these policy interventions in excess of the actual price they pay for the service without these interventions. In the context of connectivity and air travel, consumer surplus relates to the change in welfare as a result of a change in the generalized travel costs. This includes direct costs (such as ticket prices) and a valuation of travel time. To estimate the economic contribution of air travel, the change in consumer surplus can be calculated as a result of a change in generalized travel costs. With SEO’s NetCost generalized travel cost model, we calculate the consumer surplus in the different scenarios and future years. We call these gains ‘consumer benefits’. The NetCost generalized travel cost model The NetCost model measures the quality of airline networks, looking at both direct and indirect (transfer) connections. The model translates airline network data (origin, destination, frequency and travel time) into indicators expressing the attractiveness of specific routes (and airlines) for the user. For each relevant connection, direct as well as indirect, the model determines the generalized travel costs, being a representation of all inconveniences the traveller is confronted with for that specific connection. Generalized travel costs include not only airfares, but also the perceived costs of travel time and waiting time for the next flight (‘schedule delay’). These costs are translated into an indicator, expressing the perceived value for the consumer (passenger). Using these generalized travel costs, NetCost is able to estimate market shares of routes, airlines and airports in each individual OD market. The model is a useful tool in forecasting, particularly if network scenarios need to be considered. Generalized travel costs, passenger numbers and any market (de)generation can be translated into consumer welfare estimates (consumer surplus) of a network scenario compared to a reference
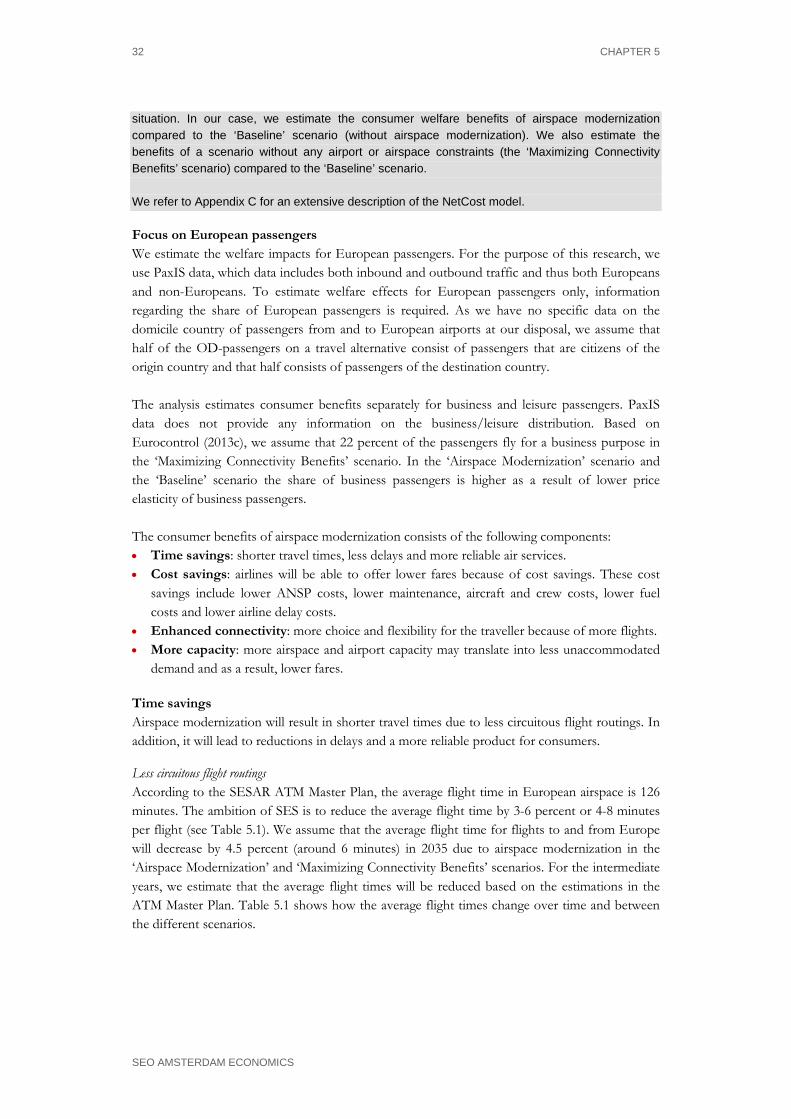
32 CHAPTER 5
SEO AMSTERDAM ECONOMICS
situation. In our case, we estimate the consumer welfare benefits of airspace modernization compared to the ‘Baseline’ scenario (without airspace modernization). We also estimate the benefits of a scenario without any airport or airspace constraints (the ‘Maximizing Connectivity Benefits’ scenario) compared to the ‘Baseline’ scenario. We refer to Appendix C for an extensive description of the NetCost model.
Focus on European passengers We estimate the welfare impacts for European passengers. For the purpose of this research, we use PaxIS data, which data includes both inbound and outbound traffic and thus both Europeans and non-Europeans. To estimate welfare effects for European passengers only, information regarding the share of European passengers is required. As we have no specific data on the domicile country of passengers from and to European airports at our disposal, we assume that half of the OD-passengers on a travel alternative consist of passengers that are citizens of the origin country and that half consists of passengers of the destination country. The analysis estimates consumer benefits separately for business and leisure passengers. PaxIS data does not provide any information on the business/leisure distribution. Based on Eurocontrol (2013c), we assume that 22 percent of the passengers fly for a business purpose in the ‘Maximizing Connectivity Benefits’ scenario. In the ‘Airspace Modernization’ scenario and the ‘Baseline’ scenario the share of business passengers is higher as a result of lower price elasticity of business passengers. The consumer benefits of airspace modernization consists of the following components: • Time savings: shorter travel times, less delays and more reliable air services. • Cost savings: airlines will be able to offer lower fares because of cost savings. These cost
savings include lower ANSP costs, lower maintenance, aircraft and crew costs, lower fuel costs and lower airline delay costs.
• Enhanced connectivity: more choice and flexibility for the traveller because of more flights. • More capacity: more airspace and airport capacity may translate into less unaccommodated
demand and as a result, lower fares.
Time savings Airspace modernization will result in shorter travel times due to less circuitous flight routings. In addition, it will lead to reductions in delays and a more reliable product for consumers.
Less circuitous flight routings According to the SESAR ATM Master Plan, the average flight time in European airspace is 126 minutes. The ambition of SES is to reduce the average flight time by 3-6 percent or 4-8 minutes per flight (see Table 5.1). We assume that the average flight time for flights to and from Europe will decrease by 4.5 percent (around 6 minutes) in 2035 due to airspace modernization in the ‘Airspace Modernization’ and ‘Maximizing Connectivity Benefits’ scenarios. For the intermediate years, we estimate that the average flight times will be reduced based on the estimations in the ATM Master Plan. Table 5.1 shows how the average flight times change over time and between the different scenarios.
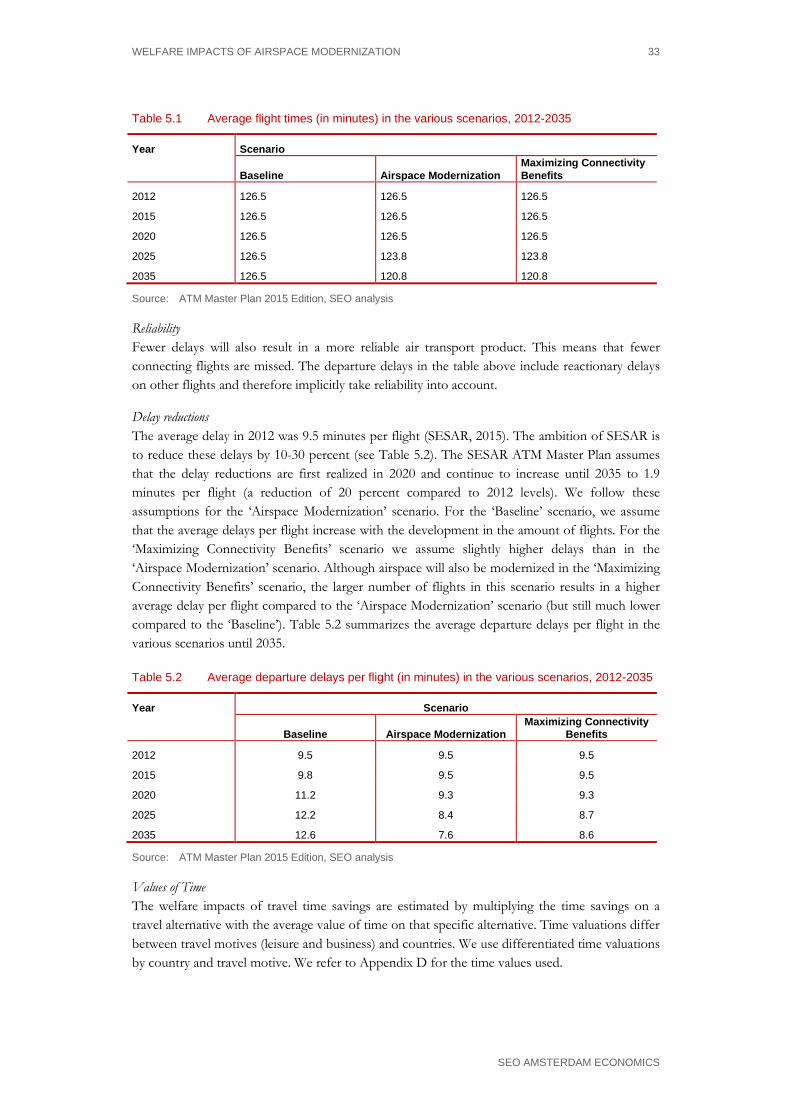
WELFARE IMPACTS OF AIRSPACE MODERNIZATION 33
SEO AMSTERDAM ECONOMICS
Table 5.1 Average flight times (in minutes) in the various scenarios, 2012-2035
Year Scenario
Baseline Airspace Modernization
Maximizing Connectivity Benefits
2012 126.5 126.5 126.5
2015 126.5 126.5 126.5
2020 126.5 126.5 126.5
2025 126.5 123.8 123.8
2035 126.5 120.8 120.8
Source: ATM Master Plan 2015 Edition, SEO analysis
Reliability Fewer delays will also result in a more reliable air transport product. This means that fewer connecting flights are missed. The departure delays in the table above include reactionary delays on other flights and therefore implicitly take reliability into account.
Delay reductions The average delay in 2012 was 9.5 minutes per flight (SESAR, 2015). The ambition of SESAR is to reduce these delays by 10-30 percent (see Table 5.2). The SESAR ATM Master Plan assumes that the delay reductions are first realized in 2020 and continue to increase until 2035 to 1.9 minutes per flight (a reduction of 20 percent compared to 2012 levels). We follow these assumptions for the ‘Airspace Modernization’ scenario. For the ‘Baseline’ scenario, we assume that the average delays per flight increase with the development in the amount of flights. For the ‘Maximizing Connectivity Benefits’ scenario we assume slightly higher delays than in the ‘Airspace Modernization’ scenario. Although airspace will also be modernized in the ‘Maximizing Connectivity Benefits’ scenario, the larger number of flights in this scenario results in a higher average delay per flight compared to the ‘Airspace Modernization’ scenario (but still much lower compared to the ‘Baseline’). Table 5.2 summarizes the average departure delays per flight in the various scenarios until 2035.
Table 5.2 Average departure delays per flight (in minutes) in the various scenarios, 2012-2035
Year Scenario
Baseline Airspace Modernization
Maximizing Connectivity Benefits
2012 9.5 9.5 9.5
2015 9.8 9.5 9.5
2020 11.2 9.3 9.3
2025 12.2 8.4 8.7
2035 12.6 7.6 8.6
Source: ATM Master Plan 2015 Edition, SEO analysis
Values of Time The welfare impacts of travel time savings are estimated by multiplying the time savings on a travel alternative with the average value of time on that specific alternative. Time valuations differ between travel motives (leisure and business) and countries. We use differentiated time valuations by country and travel motive. We refer to Appendix D for the time values used.
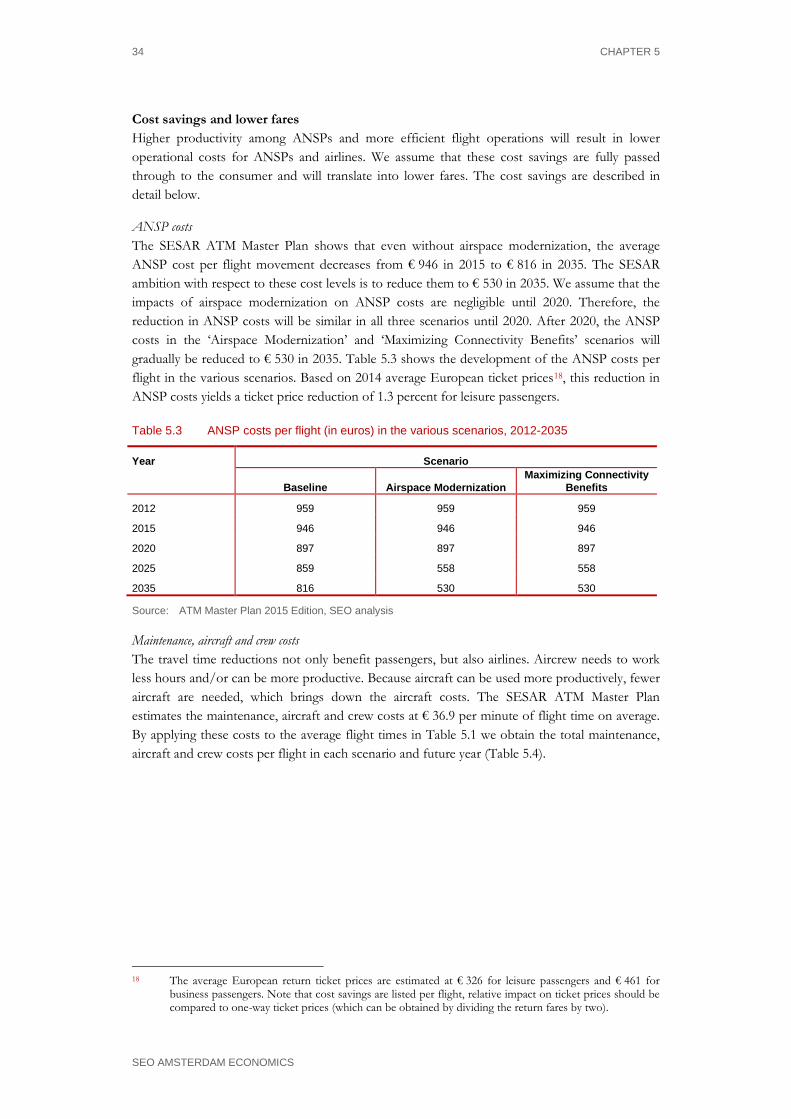
34 CHAPTER 5
SEO AMSTERDAM ECONOMICS
Cost savings and lower fares Higher productivity among ANSPs and more efficient flight operations will result in lower operational costs for ANSPs and airlines. We assume that these cost savings are fully passed through to the consumer and will translate into lower fares. The cost savings are described in detail below.
ANSP costs The SESAR ATM Master Plan shows that even without airspace modernization, the average ANSP cost per flight movement decreases from € 946 in 2015 to € 816 in 2035. The SESAR ambition with respect to these cost levels is to reduce them to € 530 in 2035. We assume that the impacts of airspace modernization on ANSP costs are negligible until 2020. Therefore, the reduction in ANSP costs will be similar in all three scenarios until 2020. After 2020, the ANSP costs in the ‘Airspace Modernization’ and ‘Maximizing Connectivity Benefits’ scenarios will gradually be reduced to € 530 in 2035. Table 5.3 shows the development of the ANSP costs per flight in the various scenarios. Based on 2014 average European ticket prices18, this reduction in ANSP costs yields a ticket price reduction of 1.3 percent for leisure passengers.
Table 5.3 ANSP costs per flight (in euros) in the various scenarios, 2012-2035
Year Scenario
Baseline Airspace Modernization
Maximizing Connectivity Benefits
2012 959 959 959
2015 946 946 946
2020 897 897 897
2025 859 558 558
2035 816 530 530
Source: ATM Master Plan 2015 Edition, SEO analysis
Maintenance, aircraft and crew costs The travel time reductions not only benefit passengers, but also airlines. Aircrew needs to work less hours and/or can be more productive. Because aircraft can be used more productively, fewer aircraft are needed, which brings down the aircraft costs. The SESAR ATM Master Plan estimates the maintenance, aircraft and crew costs at € 36.9 per minute of flight time on average. By applying these costs to the average flight times in Table 5.1 we obtain the total maintenance, aircraft and crew costs per flight in each scenario and future year (Table 5.4).
18 The average European return ticket prices are estimated at € 326 for leisure passengers and € 461 for
business passengers. Note that cost savings are listed per flight, relative impact on ticket prices should be compared to one-way ticket prices (which can be obtained by dividing the return fares by two).
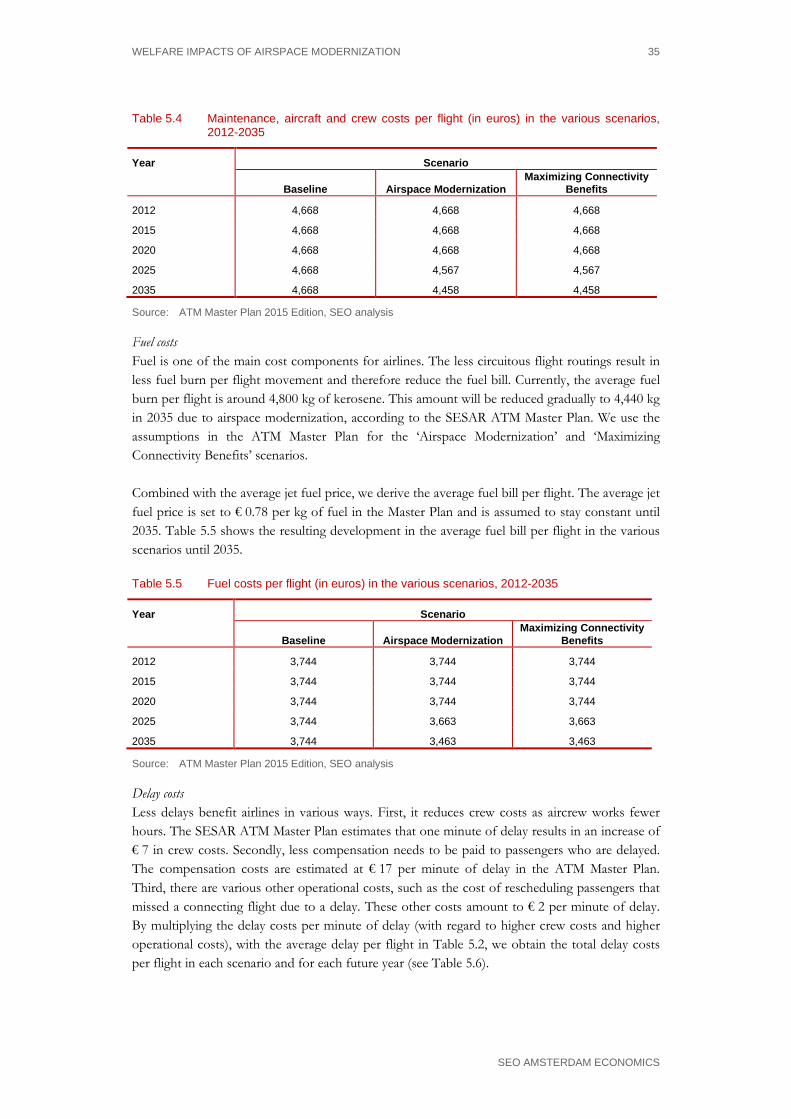
WELFARE IMPACTS OF AIRSPACE MODERNIZATION 35
SEO AMSTERDAM ECONOMICS
Table 5.4 Maintenance, aircraft and crew costs per flight (in euros) in the various scenarios, 2012-2035
Year Scenario
Baseline Airspace Modernization
Maximizing Connectivity Benefits
2012 4,668 4,668 4,668
2015 4,668 4,668 4,668
2020 4,668 4,668 4,668
2025 4,668 4,567 4,567
2035 4,668 4,458 4,458
Source: ATM Master Plan 2015 Edition, SEO analysis
Fuel costs Fuel is one of the main cost components for airlines. The less circuitous flight routings result in less fuel burn per flight movement and therefore reduce the fuel bill. Currently, the average fuel burn per flight is around 4,800 kg of kerosene. This amount will be reduced gradually to 4,440 kg in 2035 due to airspace modernization, according to the SESAR ATM Master Plan. We use the assumptions in the ATM Master Plan for the ‘Airspace Modernization’ and ‘Maximizing Connectivity Benefits’ scenarios. Combined with the average jet fuel price, we derive the average fuel bill per flight. The average jet fuel price is set to € 0.78 per kg of fuel in the Master Plan and is assumed to stay constant until 2035. Table 5.5 shows the resulting development in the average fuel bill per flight in the various scenarios until 2035.
Table 5.5 Fuel costs per flight (in euros) in the various scenarios, 2012-2035
Year Scenario
Baseline Airspace Modernization
Maximizing Connectivity Benefits
2012 3,744 3,744 3,744
2015 3,744 3,744 3,744
2020 3,744 3,744 3,744
2025 3,744 3,663 3,663
2035 3,744 3,463 3,463
Source: ATM Master Plan 2015 Edition, SEO analysis
Delay costs Less delays benefit airlines in various ways. First, it reduces crew costs as aircrew works fewer hours. The SESAR ATM Master Plan estimates that one minute of delay results in an increase of € 7 in crew costs. Secondly, less compensation needs to be paid to passengers who are delayed. The compensation costs are estimated at € 17 per minute of delay in the ATM Master Plan. Third, there are various other operational costs, such as the cost of rescheduling passengers that missed a connecting flight due to a delay. These other costs amount to € 2 per minute of delay. By multiplying the delay costs per minute of delay (with regard to higher crew costs and higher operational costs), with the average delay per flight in Table 5.2, we obtain the total delay costs per flight in each scenario and for each future year (see Table 5.6).
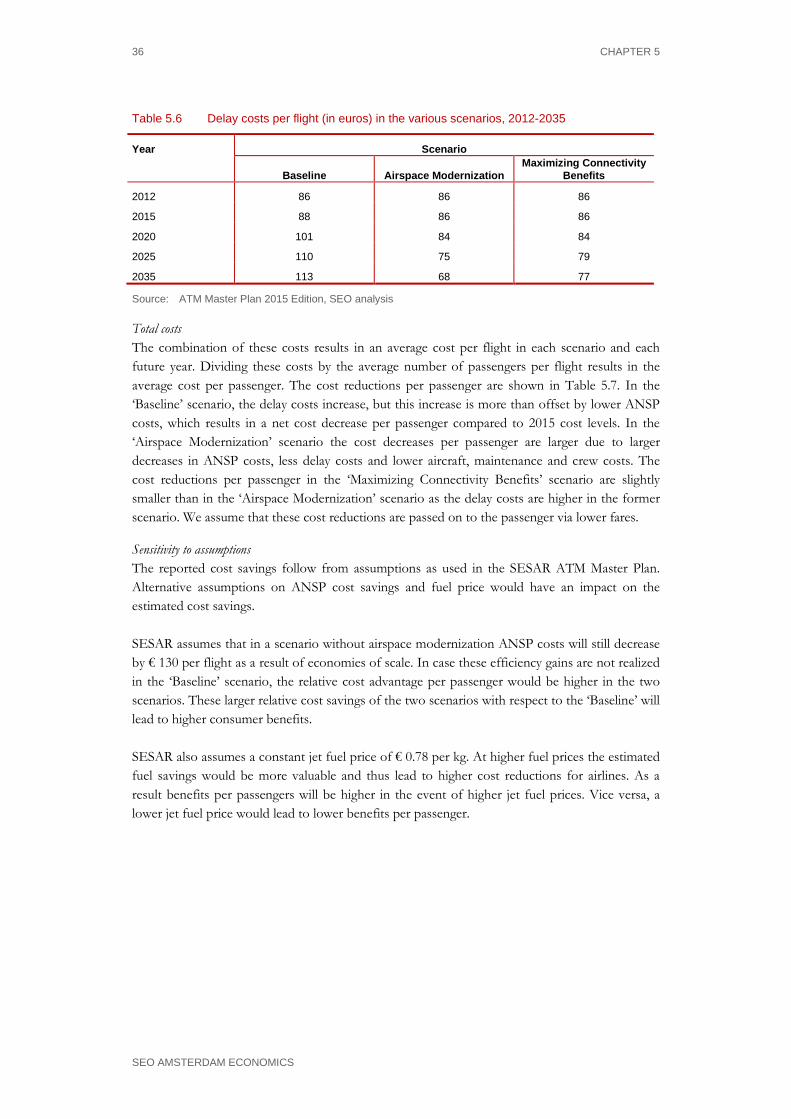
36 CHAPTER 5
SEO AMSTERDAM ECONOMICS
Table 5.6 Delay costs per flight (in euros) in the various scenarios, 2012-2035
Year Scenario
Baseline Airspace Modernization
Maximizing Connectivity Benefits
2012 86 86 86
2015 88 86 86
2020 101 84 84
2025 110 75 79
2035 113 68 77
Source: ATM Master Plan 2015 Edition, SEO analysis
Total costs The combination of these costs results in an average cost per flight in each scenario and each future year. Dividing these costs by the average number of passengers per flight results in the average cost per passenger. The cost reductions per passenger are shown in Table 5.7. In the ‘Baseline’ scenario, the delay costs increase, but this increase is more than offset by lower ANSP costs, which results in a net cost decrease per passenger compared to 2015 cost levels. In the ‘Airspace Modernization’ scenario the cost decreases per passenger are larger due to larger decreases in ANSP costs, less delay costs and lower aircraft, maintenance and crew costs. The cost reductions per passenger in the ‘Maximizing Connectivity Benefits’ scenario are slightly smaller than in the ‘Airspace Modernization’ scenario as the delay costs are higher in the former scenario. We assume that these cost reductions are passed on to the passenger via lower fares.
Sensitivity to assumptions The reported cost savings follow from assumptions as used in the SESAR ATM Master Plan. Alternative assumptions on ANSP cost savings and fuel price would have an impact on the estimated cost savings. SESAR assumes that in a scenario without airspace modernization ANSP costs will still decrease by € 130 per flight as a result of economies of scale. In case these efficiency gains are not realized in the ‘Baseline’ scenario, the relative cost advantage per passenger would be higher in the two scenarios. These larger relative cost savings of the two scenarios with respect to the ‘Baseline’ will lead to higher consumer benefits. SESAR also assumes a constant jet fuel price of € 0.78 per kg. At higher fuel prices the estimated fuel savings would be more valuable and thus lead to higher cost reductions for airlines. As a result benefits per passengers will be higher in the event of higher jet fuel prices. Vice versa, a lower jet fuel price would lead to lower benefits per passenger.
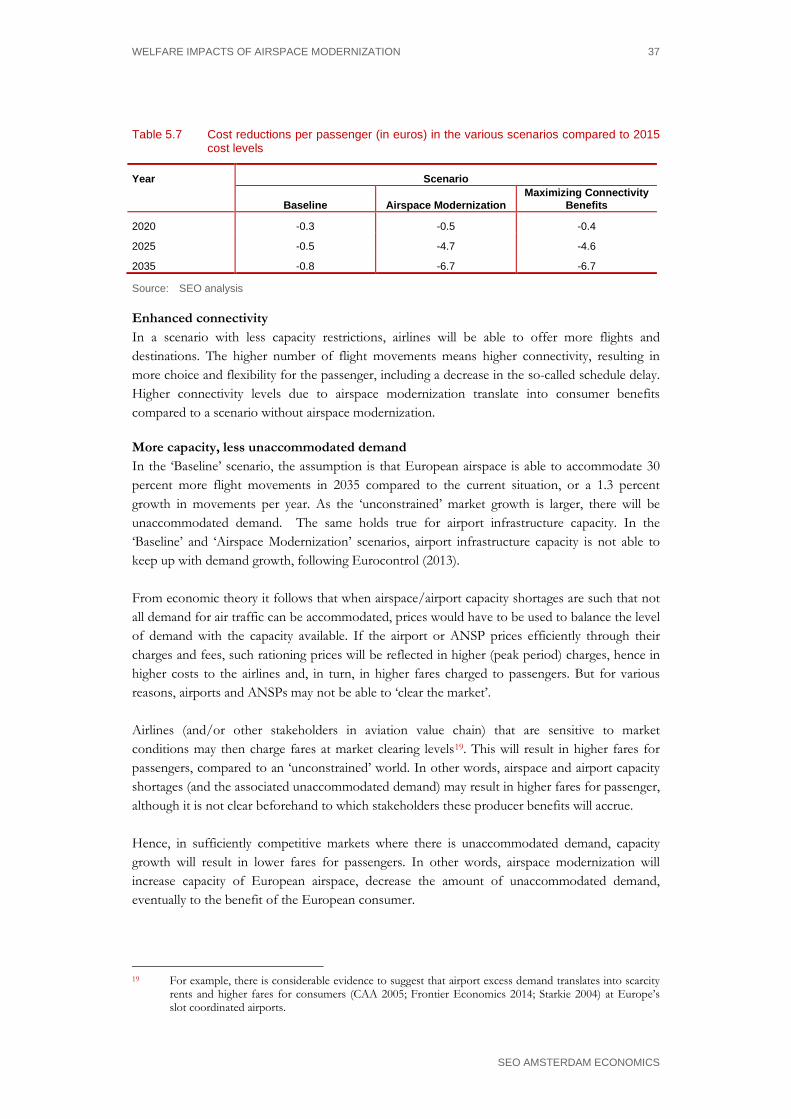
WELFARE IMPACTS OF AIRSPACE MODERNIZATION 37
SEO AMSTERDAM ECONOMICS
Table 5.7 Cost reductions per passenger (in euros) in the various scenarios compared to 2015 cost levels
Year Scenario
Baseline Airspace Modernization
Maximizing Connectivity Benefits
2020 -0.3 -0.5 -0.4
2025 -0.5 -4.7 -4.6
2035 -0.8 -6.7 -6.7
Source: SEO analysis
Enhanced connectivity In a scenario with less capacity restrictions, airlines will be able to offer more flights and destinations. The higher number of flight movements means higher connectivity, resulting in more choice and flexibility for the passenger, including a decrease in the so-called schedule delay. Higher connectivity levels due to airspace modernization translate into consumer benefits compared to a scenario without airspace modernization.
More capacity, less unaccommodated demand In the ‘Baseline’ scenario, the assumption is that European airspace is able to accommodate 30 percent more flight movements in 2035 compared to the current situation, or a 1.3 percent growth in movements per year. As the ‘unconstrained’ market growth is larger, there will be unaccommodated demand. The same holds true for airport infrastructure capacity. In the ‘Baseline’ and ‘Airspace Modernization’ scenarios, airport infrastructure capacity is not able to keep up with demand growth, following Eurocontrol (2013). From economic theory it follows that when airspace/airport capacity shortages are such that not all demand for air traffic can be accommodated, prices would have to be used to balance the level of demand with the capacity available. If the airport or ANSP prices efficiently through their charges and fees, such rationing prices will be reflected in higher (peak period) charges, hence in higher costs to the airlines and, in turn, in higher fares charged to passengers. But for various reasons, airports and ANSPs may not be able to ‘clear the market’. Airlines (and/or other stakeholders in aviation value chain) that are sensitive to market conditions may then charge fares at market clearing levels19. This will result in higher fares for passengers, compared to an ‘unconstrained’ world. In other words, airspace and airport capacity shortages (and the associated unaccommodated demand) may result in higher fares for passenger, although it is not clear beforehand to which stakeholders these producer benefits will accrue. Hence, in sufficiently competitive markets where there is unaccommodated demand, capacity growth will result in lower fares for passengers. In other words, airspace modernization will increase capacity of European airspace, decrease the amount of unaccommodated demand, eventually to the benefit of the European consumer.
19 For example, there is considerable evidence to suggest that airport excess demand translates into scarcity
rents and higher fares for consumers (CAA 2005; Frontier Economics 2014; Starkie 2004) at Europe’s slot coordinated airports.
38 CHAPTER 5
SEO AMSTERDAM ECONOMICS
The NetCost model takes the impact of less unaccommodated demand through fares into account. In case of more capacity, more demand can be accommodated, leading to less excess demand and a lower price level. The price decrease (and resulting welfare effects) is estimated using ‘generalized travel cost’ elasticities. Again, we use an elasticity of -1.5 for leisure passengers and an elasticity of -0.5 for business passengers. In case individual ANSPs would ensure that most flights can still be accommodated in European airspace, even in the absence of airspace modernization, but at higher costs, the downward impact of fares due to airspace capacity constraints may not be present (although unaccommodated demand due to airport capacity constraints will still remain).
Case study: how airspace modernization works out on a single flight What are the implications of airspace modernization on a particular air route? In this case study we zoom in on an average, intra-European flight of 126.5 minutes with a Boeing 737 aircraft and 138 passengers. Airspace modernization brings benefits to the consumer in terms of time savings, cost savings and connectivity increase. This case study illustrates how these components accrue to a consumer benefit per passenger. We focus on the benefits in the ‘Maximizing Connectivity Benefits’ scenario compared to the ‘Baseline’ scenario in 2035. Table 5.8 presents the factors resulting in consumer benefits for passengers travelling on this particular route. The benefits through connectivity increase and time and cost savings add up to €48 per leisure passenger and €74 per business passenger for a return trip. Time savings In the ‘Maximizing Connectivity Benefits’ scenario, the flight time on this route is 5.7 minutes shorter than in the baseline. In addition, consumers benefit from a 4 minute reduction in departure delay per flight, due to modernization of European airspace. This leads to a total time saving of 19.4 minutes for a return trip. Using Values of Travel Time of € 18 per hour for leisure passengers and € 54 per hour for business passenger (UK values), this yields respective time benefits of € 6 and € 17 per passenger. Cost savings Airlines will see cost reductions as a result of shorter flying times, less fuel consumption, lower ANSP costs and lower maintenance and crew costs. On the longer term, it is likely that airlines pass on these cost savings to the passengers through lower fares. These savings add up to a decrease in airfares of € 12 for business and leisure passengers. Based on a return fare of € 211 for leisure passengers and € 305 for business passengers20 this implies a respective ticket price decrease of 6 percent and 4 percent. Connectivity benefits Due to the expansion of capacity, the weekly flight frequency increases for this route from 100 to 135 flights per week. This means more flexibility for the individual passenger, which is expressed in a decrease in generalized travel costs. On this route, the welfare increase associated with the increased flexibility equals €30 for leisure passengers and €45 for business passengers.
20 Fares resulting from the output of the NetCost airfare model (see Appendix C)
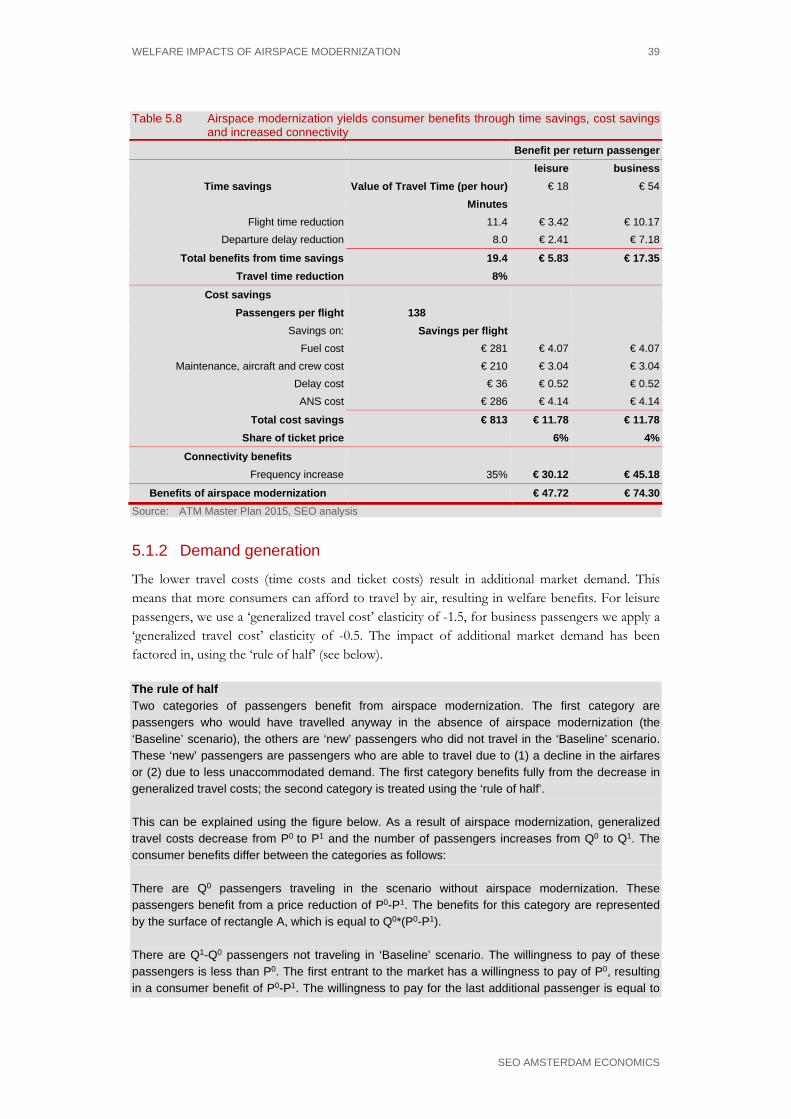
WELFARE IMPACTS OF AIRSPACE MODERNIZATION 39
SEO AMSTERDAM ECONOMICS
Table 5.8 Airspace modernization yields consumer benefits through time savings, cost savings and increased connectivity
Benefit per return passenger
leisure business Time savings Value of Travel Time (per hour) € 18 € 54
Minutes Flight time reduction 11.4 € 3.42 € 10.17
Departure delay reduction 8.0 € 2.41 € 7.18
Total benefits from time savings 19.4 € 5.83 € 17.35 Travel time reduction 8%
Cost savings Passengers per flight 138
Savings on: Savings per flight Fuel cost € 281 € 4.07 € 4.07
Maintenance, aircraft and crew cost € 210 € 3.04 € 3.04 Delay cost € 36 € 0.52 € 0.52 ANS cost € 286 € 4.14 € 4.14
Total cost savings € 813 € 11.78 € 11.78 Share of ticket price 6% 4%
Connectivity benefits Frequency increase 35% € 30.12 € 45.18
Benefits of airspace modernization € 47.72 € 74.30 Source: ATM Master Plan 2015, SEO analysis
5.1.2 Demand generation
The lower travel costs (time costs and ticket costs) result in additional market demand. This means that more consumers can afford to travel by air, resulting in welfare benefits. For leisure passengers, we use a ‘generalized travel cost’ elasticity of -1.5, for business passengers we apply a ‘generalized travel cost’ elasticity of -0.5. The impact of additional market demand has been factored in, using the ‘rule of half’ (see below).
The rule of half Two categories of passengers benefit from airspace modernization. The first category are passengers who would have travelled anyway in the absence of airspace modernization (the ‘Baseline’ scenario), the others are ‘new’ passengers who did not travel in the ‘Baseline’ scenario. These ‘new’ passengers are passengers who are able to travel due to (1) a decline in the airfares or (2) due to less unaccommodated demand. The first category benefits fully from the decrease in generalized travel costs; the second category is treated using the ‘rule of half’. This can be explained using the figure below. As a result of airspace modernization, generalized travel costs decrease from P0 to P1 and the number of passengers increases from Q0 to Q1. The consumer benefits differ between the categories as follows: There are Q0 passengers traveling in the scenario without airspace modernization. These passengers benefit from a price reduction of P0-P1. The benefits for this category are represented by the surface of rectangle A, which is equal to Q0*(P0-P1). There are Q1-Q0 passengers not traveling in ‘Baseline’ scenario. The willingness to pay of these passengers is less than P0. The first entrant to the market has a willingness to pay of P0, resulting in a consumer benefit of P0-P1. The willingness to pay for the last additional passenger is equal to
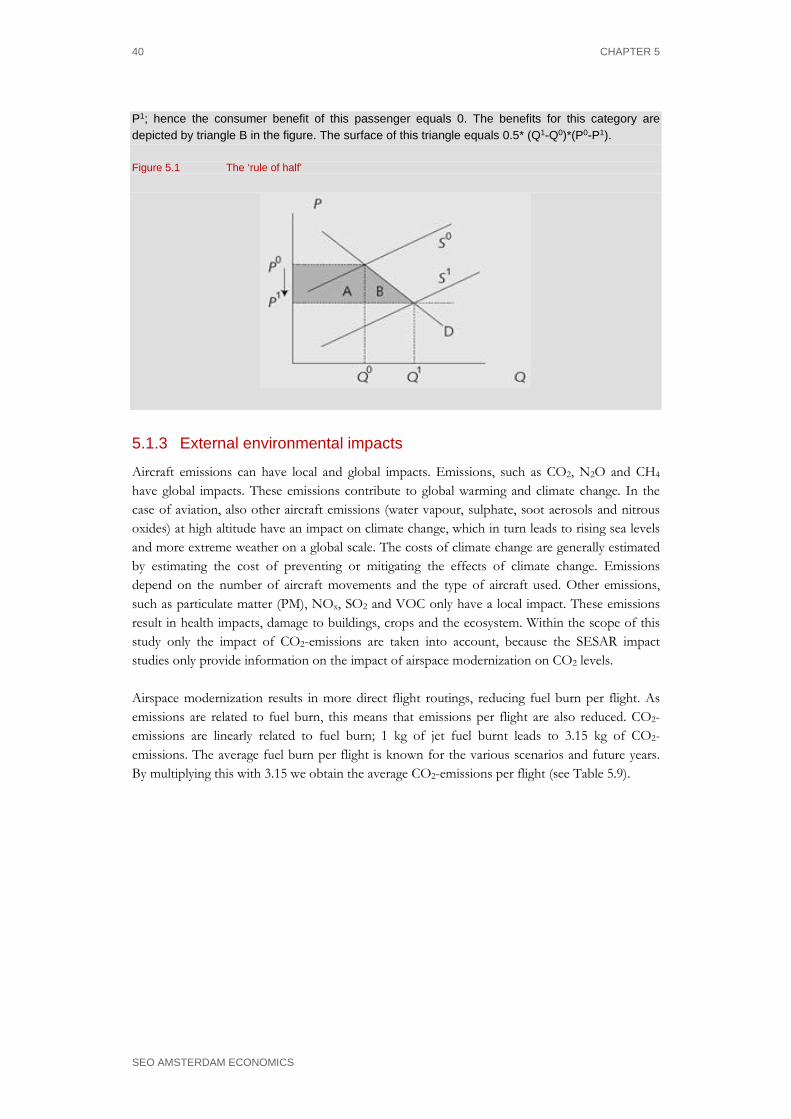
40 CHAPTER 5
SEO AMSTERDAM ECONOMICS
P1; hence the consumer benefit of this passenger equals 0. The benefits for this category are depicted by triangle B in the figure. The surface of this triangle equals 0.5* (Q1-Q0)*(P0-P1). Figure 5.1 The ‘rule of half’
5.1.3 External environmental impacts
Aircraft emissions can have local and global impacts. Emissions, such as CO2, N2O and CH4 have global impacts. These emissions contribute to global warming and climate change. In the case of aviation, also other aircraft emissions (water vapour, sulphate, soot aerosols and nitrous oxides) at high altitude have an impact on climate change, which in turn leads to rising sea levels and more extreme weather on a global scale. The costs of climate change are generally estimated by estimating the cost of preventing or mitigating the effects of climate change. Emissions depend on the number of aircraft movements and the type of aircraft used. Other emissions, such as particulate matter (PM), NOx, SO2 and VOC only have a local impact. These emissions result in health impacts, damage to buildings, crops and the ecosystem. Within the scope of this study only the impact of CO2-emissions are taken into account, because the SESAR impact studies only provide information on the impact of airspace modernization on CO2 levels. Airspace modernization results in more direct flight routings, reducing fuel burn per flight. As emissions are related to fuel burn, this means that emissions per flight are also reduced. CO2-emissions are linearly related to fuel burn; 1 kg of jet fuel burnt leads to 3.15 kg of CO2-emissions. The average fuel burn per flight is known for the various scenarios and future years. By multiplying this with 3.15 we obtain the average CO2-emissions per flight (see Table 5.9).

WELFARE IMPACTS OF AIRSPACE MODERNIZATION 41
SEO AMSTERDAM ECONOMICS
Table 5.9 CO2-emissions per flight (in kg) in the various scenarios, 2012-2035
Year Scenario
Baseline Airspace Modernization
Maximizing Connectivity Benefits
2012 15,120 15,120 15,120
2015 15,120 15,120 15,120
2020 15,120 15,120 15,120
2025 15,120 14,792 14,792
2035 15,120 13,986 13,986
Source: SEO analysis
To monetize the impacts of aviation emissions on climate change, we use the latest values from a study commissioned by the European Commission (Ricardo-AEA, 2014). Based on a large number of different studies, this study recommends a value for € 90 per ton of CO2.21 The societal costs of CO2-esmissions per flight are presented in Table 5.10.
Table 5.10 Societal cost of CO2-emissions per flight (in euros) in the various scenarios, 2012-2035
Year Scenario
Baseline Airspace Modernization
Maximizing Connectivity Benefits
2012 1,361 1,361 1,361
2015 1,361 1,361 1,361
2020 1,361 1,361 1,361
2025 1,361 1,331 1,331
2035 1,361 1,259 1,259
Source: Ricardo-AEA (2014); SEO analysis
There are signs that the costs related to global warming are non-linear and the impacts may be more severe over the longer-term (CE Delft 2008). Some studies therefore assume an increase in the cost of CO2-emissions over time, by using a smaller discount rate. We follow a similar approach (see Appendix E).
5.1.4 Wider economic benefits
Direct user benefits generate wider benefits for the economy. The direct user benefits for aviation users caused by airspace modernization will to a large extent be passed on to other sectors of the economy. As a result, businesses and households that do not use aviation may still benefit from airspace modernization, for example because companies pass on lower transport costs to end users via lower prices. Companies may also benefit from higher profits and – as a result – will invest more. Hence, direct user benefits may have wider (or indirect) impacts outside the aviation industry itself. However, not all these wider benefits are additional benefits. When there are no market imperfections and no cross-border impacts, the wider economic benefits will be equal to the direct benefits. In this case, there are no additional or external wider/indirect economic impacts. 21 The societal cost of emitting a ton of CO2 is much larger than the price of an Emission allowance,
because many allowances are distributed for free.
42 CHAPTER 5
SEO AMSTERDAM ECONOMICS
There may be additional wider economic benefits in case of market imperfections22. Important sources of additional wider economic effects are the agglomeration effects. Connectivity growth in an airport region may lead to a higher density of activities in that region. Concentration of economic activities in itself can reduce (spatial) market imperfections and result in higher productivity measured in GDP/capita, for example because of knowledge spill-overs, a pooled labour market and consumption variety.
The empirical evidence on the additional of wider economic benefits of aviation growth is scarce. As Forsyth (2013, p.15) puts it: “[..] there is an externality present. There is a problem of measuring how large this externality is”. According to a review of studies on investments in transport infrastructure, Rouwendal (2012) concludes that there are indications that additional indirect effects can be substantial (positive but also negative) in case of imperfect competition but that “[..] the question about the importance of additional indirect effects is still open and it is therefore unclear what level of generality can be attached to them” (Rouwendal 2012, p.5).23 In this study, we rely on the guidelines by the CPB Netherlands Bureau for Economic Policy analysis that additional wider effects are between 0-30 percent of the impacts of aviation users (Elhorst et al. 2004)24. We use 15 percent of the users travelling on a business motive, as business travel and not leisure travel is likely to generate additional welfare impacts elsewhere in the economy.
5.2 Results: consumer benefits In this section, we present the estimated consumer benefits for European passengers in 2025 and 2035. The results show the estimated consumer benefits in the ‘Airspace Modernization’ scenario compared to the ‘Baseline’ scenario, as well as the consumer benefits accrued in the ‘Maximizing Connectivity Benefits’ scenario compared to the ‘Baseline’. Results are broken down by the different components of the welfare benefits as outlined in section 5.1.1.
5.2.1 Per passenger benefits
Table 5.11 presents the total number of return trips made by European OD passengers in 2025 and 2035, as well as the estimated benefits per passenger, in the ‘Maximizing Connectivity Benefits’ and ‘Airspace Modernization’ scenario. We note that per passenger benefits are much higher in 2035 than in 2025. This is due to the lower connectivity levels, higher ANSP costs, longer travel times and larger unaccommodated
22 As Vickerman (2007a) puts it, by the additional wider economic benefits “[..] we mean all economic
benefits which are not captured in the direct user benefits of the type which are normally analysed in a well-constructed transport cost-benefit analysis after allowing for environmental and other directly imposed external costs”.
23 Some researchers (Forsyth 2013) therefore argue that a combination of a welfare/CBA approach with Computable General Equilibrium modelling could be a way to overcome the lack of insight into the wider economic benefits. Yet, such exercises are cumbersome, data-demanding and generally outside the scope of project evaluations.
24 The 0-30% guideline is based on a number of studies on the additional wider economic benefits: Mott MacDonald (2006) 17 percent; MVA (2006) 30-50 percent; Elhorst & Oosterhaven (2008) -1 to +38 percent; SACTRA (1999) 6 perent; Venables & Gasiorek (1999) 30-50 percent.
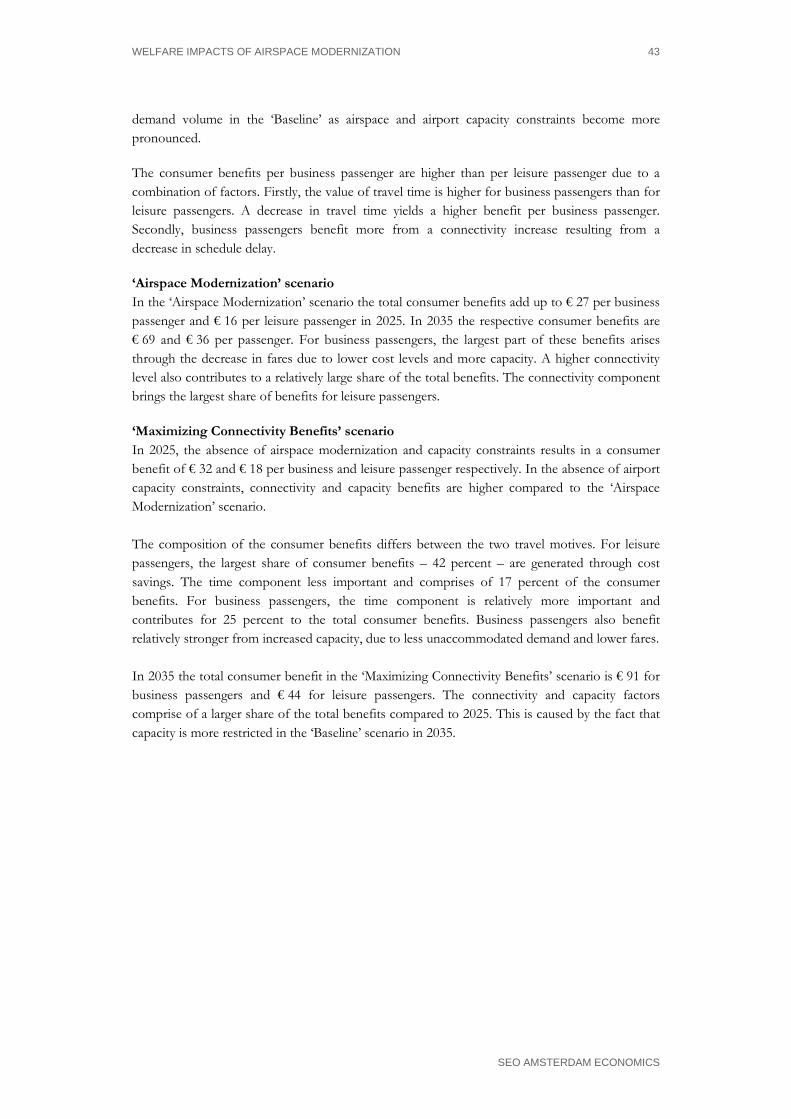
WELFARE IMPACTS OF AIRSPACE MODERNIZATION 43
SEO AMSTERDAM ECONOMICS
demand volume in the ‘Baseline’ as airspace and airport capacity constraints become more pronounced.
The consumer benefits per business passenger are higher than per leisure passenger due to a combination of factors. Firstly, the value of travel time is higher for business passengers than for leisure passengers. A decrease in travel time yields a higher benefit per business passenger. Secondly, business passengers benefit more from a connectivity increase resulting from a decrease in schedule delay.
‘Airspace Modernization’ scenario In the ‘Airspace Modernization’ scenario the total consumer benefits add up to € 27 per business passenger and € 16 per leisure passenger in 2025. In 2035 the respective consumer benefits are € 69 and € 36 per passenger. For business passengers, the largest part of these benefits arises through the decrease in fares due to lower cost levels and more capacity. A higher connectivity level also contributes to a relatively large share of the total benefits. The connectivity component brings the largest share of benefits for leisure passengers.
‘Maximizing Connectivity Benefits’ scenario In 2025, the absence of airspace modernization and capacity constraints results in a consumer benefit of € 32 and € 18 per business and leisure passenger respectively. In the absence of airport capacity constraints, connectivity and capacity benefits are higher compared to the ‘Airspace Modernization’ scenario. The composition of the consumer benefits differs between the two travel motives. For leisure passengers, the largest share of consumer benefits – 42 percent – are generated through cost savings. The time component less important and comprises of 17 percent of the consumer benefits. For business passengers, the time component is relatively more important and contributes for 25 percent to the total consumer benefits. Business passengers also benefit relatively stronger from increased capacity, due to less unaccommodated demand and lower fares. In 2035 the total consumer benefit in the ‘Maximizing Connectivity Benefits’ scenario is € 91 for business passengers and € 44 for leisure passengers. The connectivity and capacity factors comprise of a larger share of the total benefits compared to 2025. This is caused by the fact that capacity is more restricted in the ‘Baseline’ scenario in 2035.
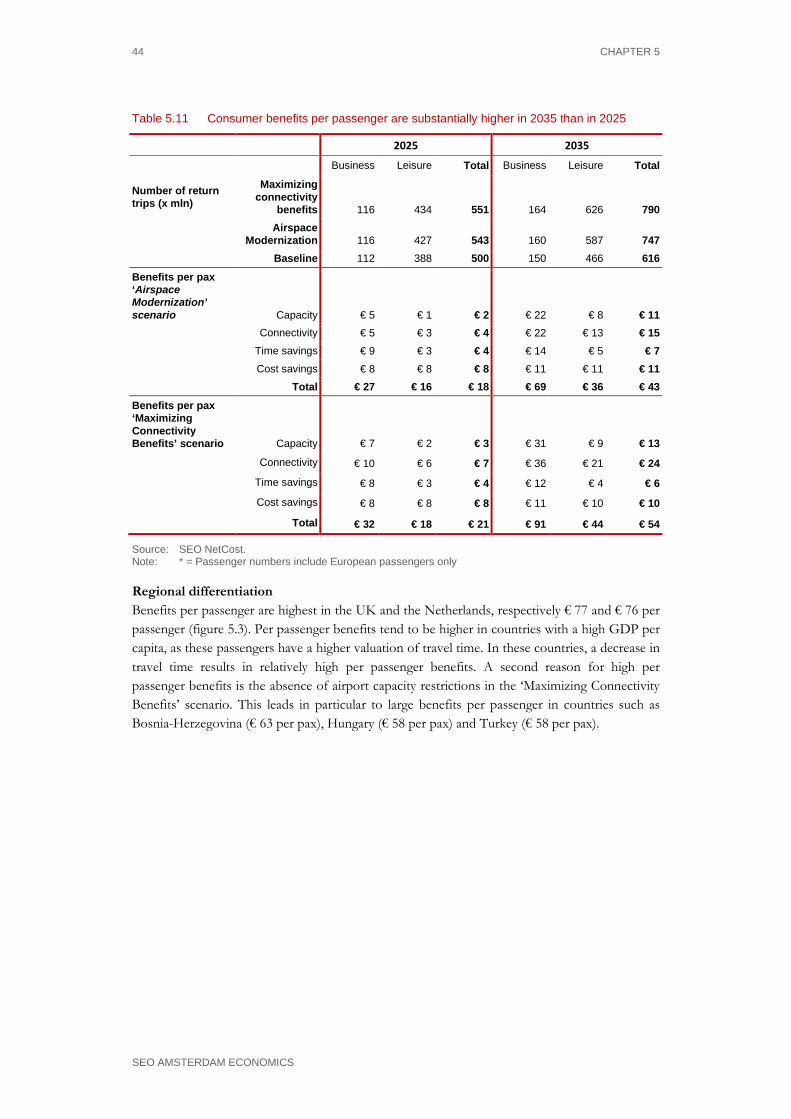
44 CHAPTER 5
SEO AMSTERDAM ECONOMICS
Table 5.11 Consumer benefits per passenger are substantially higher in 2035 than in 2025
2025 2035
Business Leisure Total Business Leisure Total
Number of return trips (x mln)
Maximizing connectivity
benefits 116 434 551 164 626 790
Airspace
Modernization 116 427 543 160 587 747 Baseline 112 388 500 150 466 616
Benefits per pax ‘Airspace Modernization’ scenario Capacity € 5 € 1 € 2 € 22 € 8 € 11
Connectivity € 5 € 3 € 4 € 22 € 13 € 15
Time savings € 9 € 3 € 4 € 14 € 5 € 7
Cost savings € 8 € 8 € 8 € 11 € 11 € 11
Total € 27 € 16 € 18 € 69 € 36 € 43
Benefits per pax ‘Maximizing Connectivity Benefits’ scenario Capacity € 7 € 2 € 3 € 31 € 9 € 13
Connectivity € 10 € 6 € 7 € 36 € 21 € 24
Time savings € 8 € 3 € 4 € 12 € 4 € 6
Cost savings € 8 € 8 € 8 € 11 € 10 € 10
Total € 32 € 18 € 21 € 91 € 44 € 54
Source: SEO NetCost. Note: * = Passenger numbers include European passengers only
Regional differentiation Benefits per passenger are highest in the UK and the Netherlands, respectively € 77 and € 76 per passenger (figure 5.3). Per passenger benefits tend to be higher in countries with a high GDP per capita, as these passengers have a higher valuation of travel time. In these countries, a decrease in travel time results in relatively high per passenger benefits. A second reason for high per passenger benefits is the absence of airport capacity restrictions in the ‘Maximizing Connectivity Benefits’ scenario. This leads in particular to large benefits per passenger in countries such as Bosnia-Herzegovina (€ 63 per pax), Hungary (€ 58 per pax) and Turkey (€ 58 per pax).

WELFARE IMPACTS OF AIRSPACE MODERNIZATION 45
SEO AMSTERDAM ECONOMICS
Figure 5.2 Benefits per passenger are highest in the UK and the Netherlands
Consumer welfare benefits per passenger in 2035 (undiscounted) (‘Maximizing Connectivity Benefits’ scenario)
Source: SEO NetCost
The composition of the consumer benefits also varies by country. Figure 5.3 breaks down the consumer benefits (excluding capacity effects) in a connectivity component, a time savings component and a cost savings component (as discussed in section 5.1.1), for the ‘Maximizing Connectivity Benefits’ scenario in 2035. In general, the connectivity component accounts for the largest share of the consumer benefits. The share of the connectivity component is higher for countries subject to airport capacity restrictions, with a high level of unaccommodated demand in the ‘Airspace Modernization’ scenario. Examples are Bosnia and Herzegovina, Hungary and Turkey25. The relative importance of the travel time component is higher for countries with a high GDP per capita, such as Norway and Switzerland. On the other hand, the cost component is more important for countries with lower GDP per capita levels, such as Bulgaria or Morocco.
25 The average return fares in Bosnia, Hungary and Turkey are €312, €328 and €293 respectively. To
illustrate the magnitude of the per passenger benefits: the total per passenger benefits account for respectively 20 percent, 18 percent and 20 percent of the average fares. However, the per passenger benefits are not only expressed in lower fares, but also in shorter travel times, less delays and less schedule delay.

46 CHAPTER 5
SEO AMSTERDAM ECONOMICS
Figure 5.3 Benefits from time savings are particularly high in large economies
Source: SEO NetCost Note: Consumer welfare benefits in 2035 are shown (undiscounted), excluding capacity effects (‘Maximizing
Connectivity Benefits’ scenario)
5.2.2 Total consumer welfare benefits
Table 5.12 and Figure 5.4 show the consumer benefits in 2025 and 2035 for European business and leisure passengers broken down into a connectivity, scarcity, time and cost savings component (see section 5.1.1).
‘Airspace Modernization’ scenario In the ‘Airspace Modernization’ scenario the total benefits are € 9.8 billion in 2025. Time and cost savings resulting from airspace modernization yield a respective benefit of € 2.4 billion and € 4.3 billion. In 2035 the total consumer benefits add up to € 32.5 billion. Again, the largest share of benefits arises through a connectivity increase and the growth in capacity. Benefits through time savings account for € 5.2 billion in total, benefits through cost savings add up to € 8.0 billion. Total consumer benefits in 2035 are substantially higher compared to 2025. The difference in total European return trips in 2035 in the ‘Airspace Modernization’ scenario with respect to the ‘Baseline’ scenario is 131 million, compared to a difference of only 43 million in 2025 (see Table 5.11). This strong relative demand difference means a much stronger decrease in fares due to more capacity.
‘Maximizing Connectivity Benefits’ scenario The total consumer benefits in the ‘Maximizing Connectivity Benefits’ scenario add up to €11.8 billion in 2025. While business passengers only account for 22 percent of the total traffic, the
0%10%20%30%40%50%60%70%80%90%
100%
Connectivity Time Savings Cost Savings
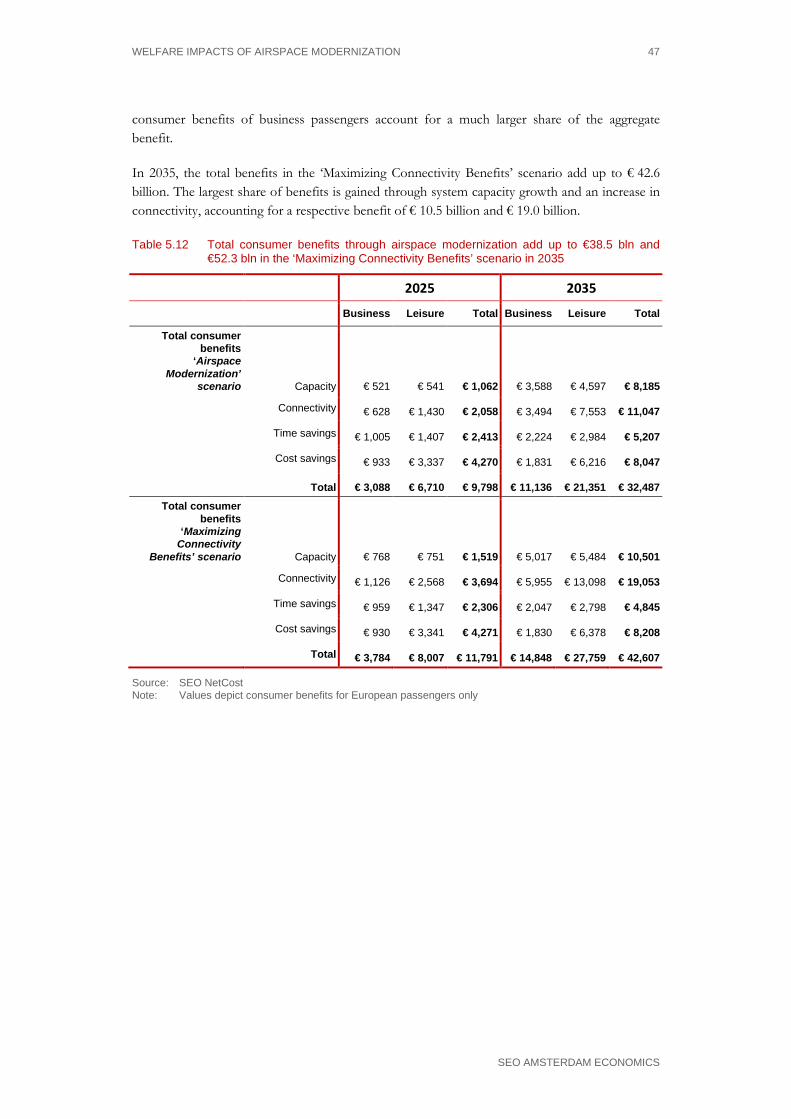
WELFARE IMPACTS OF AIRSPACE MODERNIZATION 47
SEO AMSTERDAM ECONOMICS
consumer benefits of business passengers account for a much larger share of the aggregate benefit.
In 2035, the total benefits in the ‘Maximizing Connectivity Benefits’ scenario add up to € 42.6 billion. The largest share of benefits is gained through system capacity growth and an increase in connectivity, accounting for a respective benefit of € 10.5 billion and € 19.0 billion.
Table 5.12 Total consumer benefits through airspace modernization add up to €38.5 bln and €52.3 bln in the ‘Maximizing Connectivity Benefits’ scenario in 2035
2025 2035
Business Leisure Total Business Leisure Total
Total consumer benefits
‘Airspace Modernization’
scenario Capacity € 521 € 541 € 1,062 € 3,588 € 4,597 € 8,185
Connectivity € 628 € 1,430 € 2,058 € 3,494 € 7,553 € 11,047
Time savings € 1,005 € 1,407 € 2,413 € 2,224 € 2,984 € 5,207
Cost savings € 933 € 3,337 € 4,270 € 1,831 € 6,216 € 8,047
Total € 3,088 € 6,710 € 9,798 € 11,136 € 21,351 € 32,487
Total consumer benefits
‘Maximizing Connectivity
Benefits’ scenario Capacity € 768 € 751 € 1,519 € 5,017 € 5,484 € 10,501
Connectivity € 1,126 € 2,568 € 3,694 € 5,955 € 13,098 € 19,053
Time savings € 959 € 1,347 € 2,306 € 2,047 € 2,798 € 4,845
Cost savings € 930 € 3,341 € 4,271 € 1,830 € 6,378 € 8,208
Total € 3,784 € 8,007 € 11,791 € 14,848 € 27,759 € 42,607
Source: SEO NetCost Note: Values depict consumer benefits for European passengers only
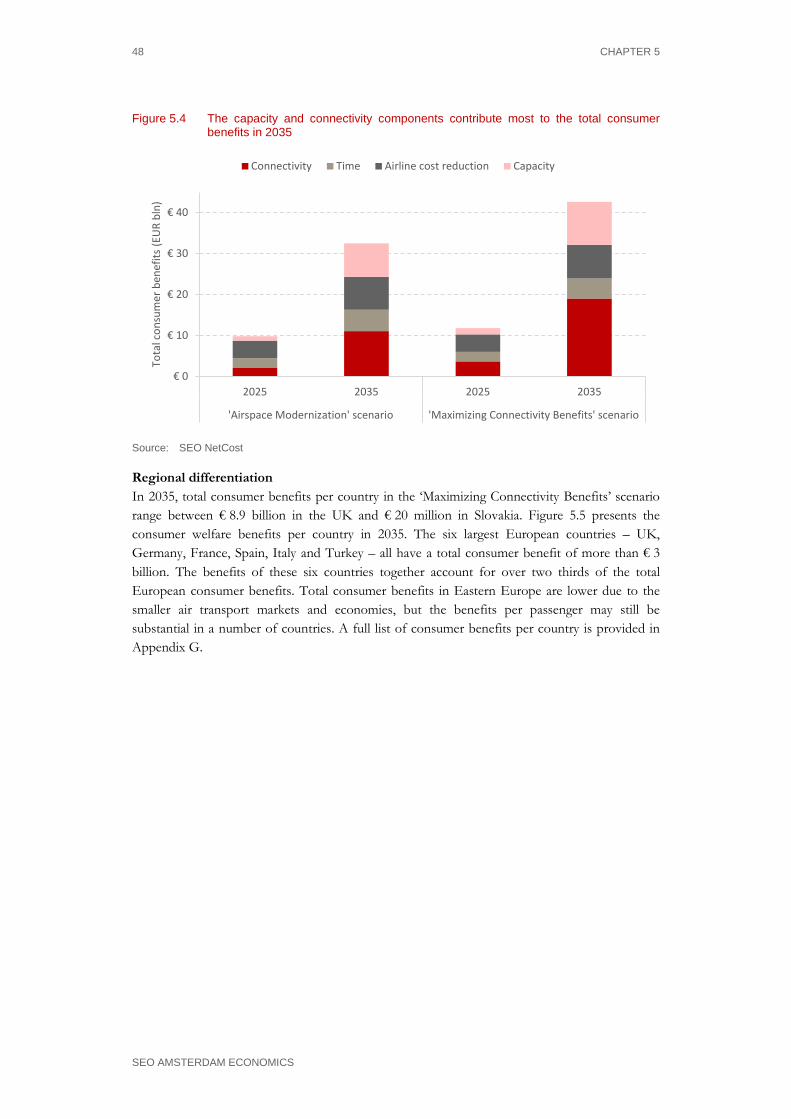
48 CHAPTER 5
SEO AMSTERDAM ECONOMICS
Figure 5.4 The capacity and connectivity components contribute most to the total consumer benefits in 2035
Source: SEO NetCost
Regional differentiation In 2035, total consumer benefits per country in the ‘Maximizing Connectivity Benefits’ scenario range between € 8.9 billion in the UK and € 20 million in Slovakia. Figure 5.5 presents the consumer welfare benefits per country in 2035. The six largest European countries – UK, Germany, France, Spain, Italy and Turkey – all have a total consumer benefit of more than € 3 billion. The benefits of these six countries together account for over two thirds of the total European consumer benefits. Total consumer benefits in Eastern Europe are lower due to the smaller air transport markets and economies, but the benefits per passenger may still be substantial in a number of countries. A full list of consumer benefits per country is provided in Appendix G.
€ 0
€ 10
€ 20
€ 30
€ 40
2025 2035 2025 2035
'Airspace Modernization' scenario 'Maximizing Connectivity Benefits' scenario
Tota
l con
sum
er b
enef
its (E
UR
bln)
Connectivity Time Airline cost reduction Capacity
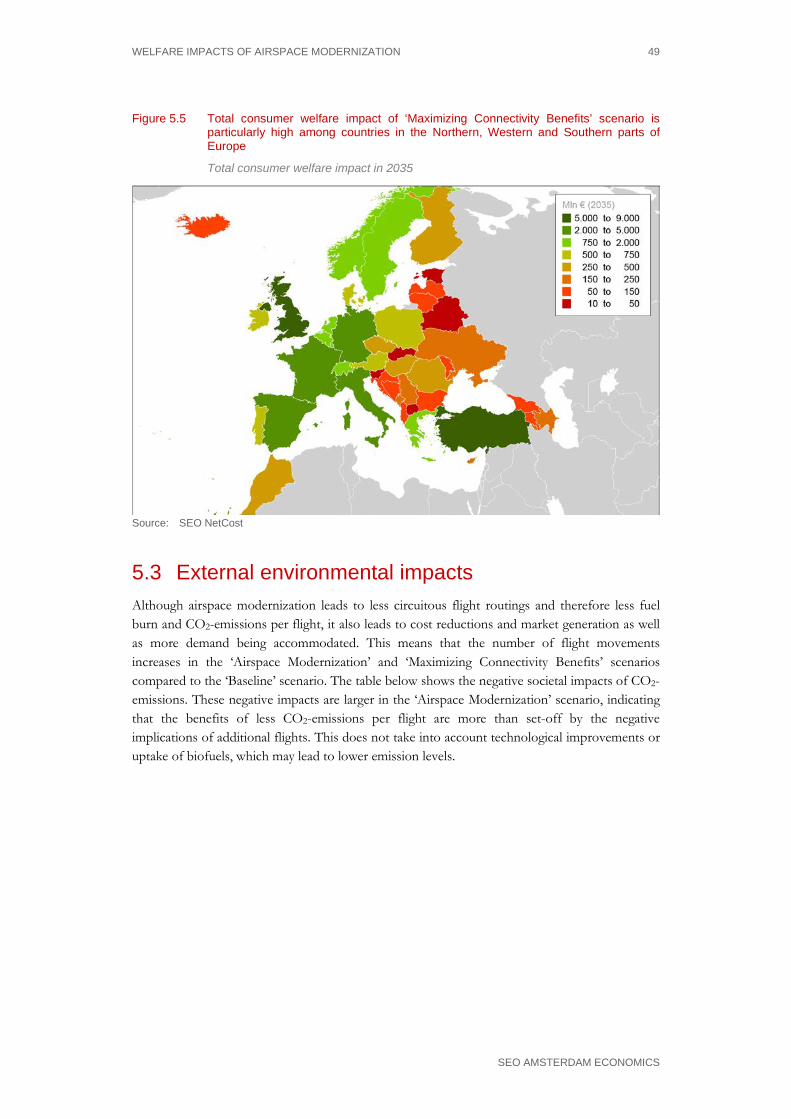
WELFARE IMPACTS OF AIRSPACE MODERNIZATION 49
SEO AMSTERDAM ECONOMICS
Figure 5.5 Total consumer welfare impact of ‘Maximizing Connectivity Benefits’ scenario is particularly high among countries in the Northern, Western and Southern parts of Europe
Total consumer welfare impact in 2035
Source: SEO NetCost
5.3 External environmental impacts Although airspace modernization leads to less circuitous flight routings and therefore less fuel burn and CO2-emissions per flight, it also leads to cost reductions and market generation as well as more demand being accommodated. This means that the number of flight movements increases in the ‘Airspace Modernization’ and ‘Maximizing Connectivity Benefits’ scenarios compared to the ‘Baseline’ scenario. The table below shows the negative societal impacts of CO2-emissions. These negative impacts are larger in the ‘Airspace Modernization’ scenario, indicating that the benefits of less CO2-emissions per flight are more than set-off by the negative implications of additional flights. This does not take into account technological improvements or uptake of biofuels, which may lead to lower emission levels.
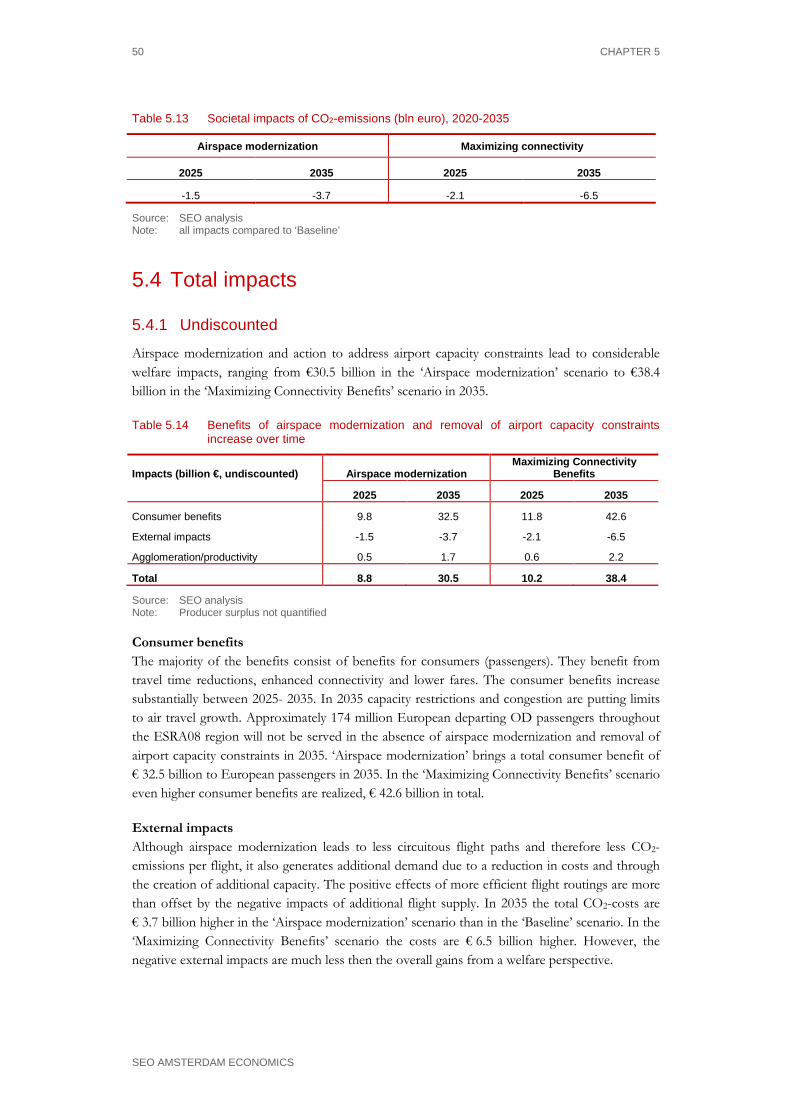
50 CHAPTER 5
SEO AMSTERDAM ECONOMICS
Table 5.13 Societal impacts of CO2-emissions (bln euro), 2020-2035
Airspace modernization Maximizing connectivity
2025 2035 2025 2035
-1.5 -3.7 -2.1 -6.5
Source: SEO analysis Note: all impacts compared to ‘Baseline’
5.4 Total impacts
5.4.1 Undiscounted
Airspace modernization and action to address airport capacity constraints lead to considerable welfare impacts, ranging from €30.5 billion in the ‘Airspace modernization’ scenario to €38.4 billion in the ‘Maximizing Connectivity Benefits’ scenario in 2035.
Table 5.14 Benefits of airspace modernization and removal of airport capacity constraints increase over time
Impacts (billion €, undiscounted) Airspace modernization Maximizing Connectivity
Benefits
2025 2035 2025 2035
Consumer benefits 9.8 32.5 11.8 42.6
External impacts -1.5 -3.7 -2.1 -6.5
Agglomeration/productivity 0.5 1.7 0.6 2.2
Total 8.8 30.5 10.2 38.4
Source: SEO analysis Note: Producer surplus not quantified
Consumer benefits The majority of the benefits consist of benefits for consumers (passengers). They benefit from travel time reductions, enhanced connectivity and lower fares. The consumer benefits increase substantially between 2025- 2035. In 2035 capacity restrictions and congestion are putting limits to air travel growth. Approximately 174 million European departing OD passengers throughout the ESRA08 region will not be served in the absence of airspace modernization and removal of airport capacity constraints in 2035. ‘Airspace modernization’ brings a total consumer benefit of € 32.5 billion to European passengers in 2035. In the ‘Maximizing Connectivity Benefits’ scenario even higher consumer benefits are realized, € 42.6 billion in total.
External impacts Although airspace modernization leads to less circuitous flight paths and therefore less CO2-emissions per flight, it also generates additional demand due to a reduction in costs and through the creation of additional capacity. The positive effects of more efficient flight routings are more than offset by the negative impacts of additional flight supply. In 2035 the total CO2-costs are € 3.7 billion higher in the ‘Airspace modernization’ scenario than in the ‘Baseline’ scenario. In the ‘Maximizing Connectivity Benefits’ scenario the costs are € 6.5 billion higher. However, the negative external impacts are much less then the overall gains from a welfare perspective.
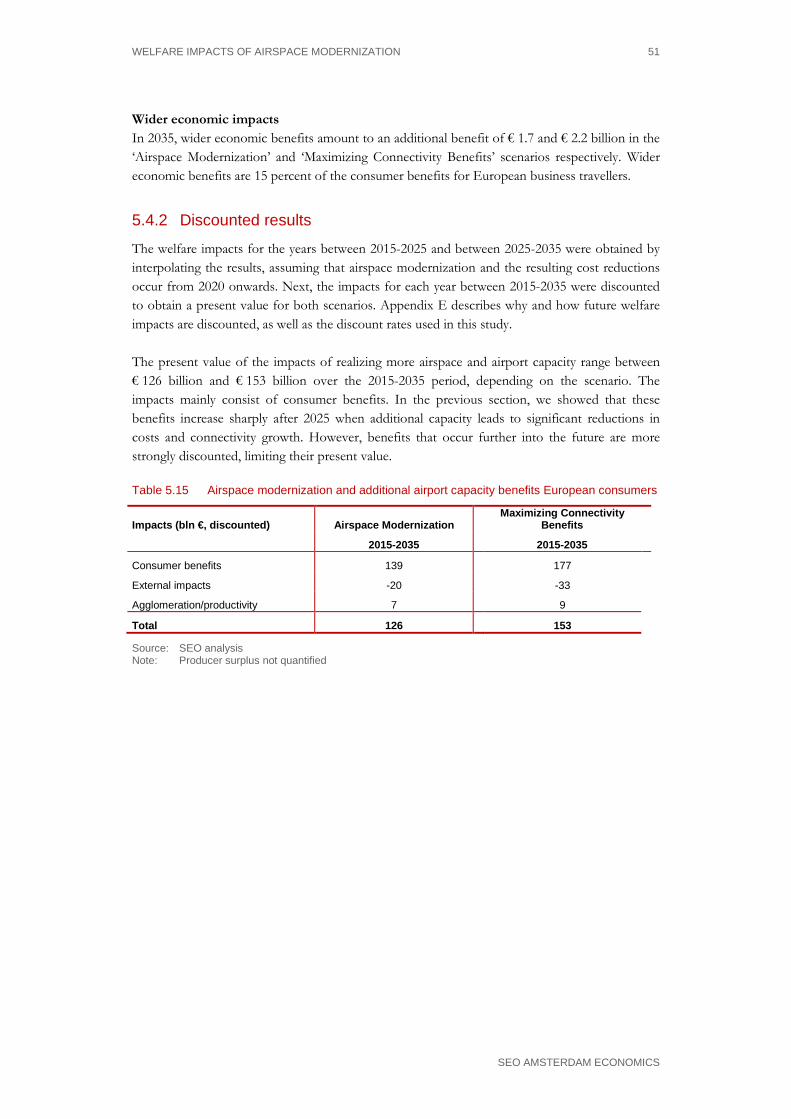
WELFARE IMPACTS OF AIRSPACE MODERNIZATION 51
SEO AMSTERDAM ECONOMICS
Wider economic impacts In 2035, wider economic benefits amount to an additional benefit of € 1.7 and € 2.2 billion in the ‘Airspace Modernization’ and ‘Maximizing Connectivity Benefits’ scenarios respectively. Wider economic benefits are 15 percent of the consumer benefits for European business travellers.
5.4.2 Discounted results
The welfare impacts for the years between 2015-2025 and between 2025-2035 were obtained by interpolating the results, assuming that airspace modernization and the resulting cost reductions occur from 2020 onwards. Next, the impacts for each year between 2015-2035 were discounted to obtain a present value for both scenarios. Appendix E describes why and how future welfare impacts are discounted, as well as the discount rates used in this study. The present value of the impacts of realizing more airspace and airport capacity range between € 126 billion and € 153 billion over the 2015-2035 period, depending on the scenario. The impacts mainly consist of consumer benefits. In the previous section, we showed that these benefits increase sharply after 2025 when additional capacity leads to significant reductions in costs and connectivity growth. However, benefits that occur further into the future are more strongly discounted, limiting their present value.
Table 5.15 Airspace modernization and additional airport capacity benefits European consumers
Impacts (bln €, discounted) Airspace Modernization Maximizing Connectivity
Benefits
2015-2035 2015-2035
Consumer benefits 139
177
External impacts -20
-33
Agglomeration/productivity 7
9
Total 126
153
Source: SEO analysis Note: Producer surplus not quantified

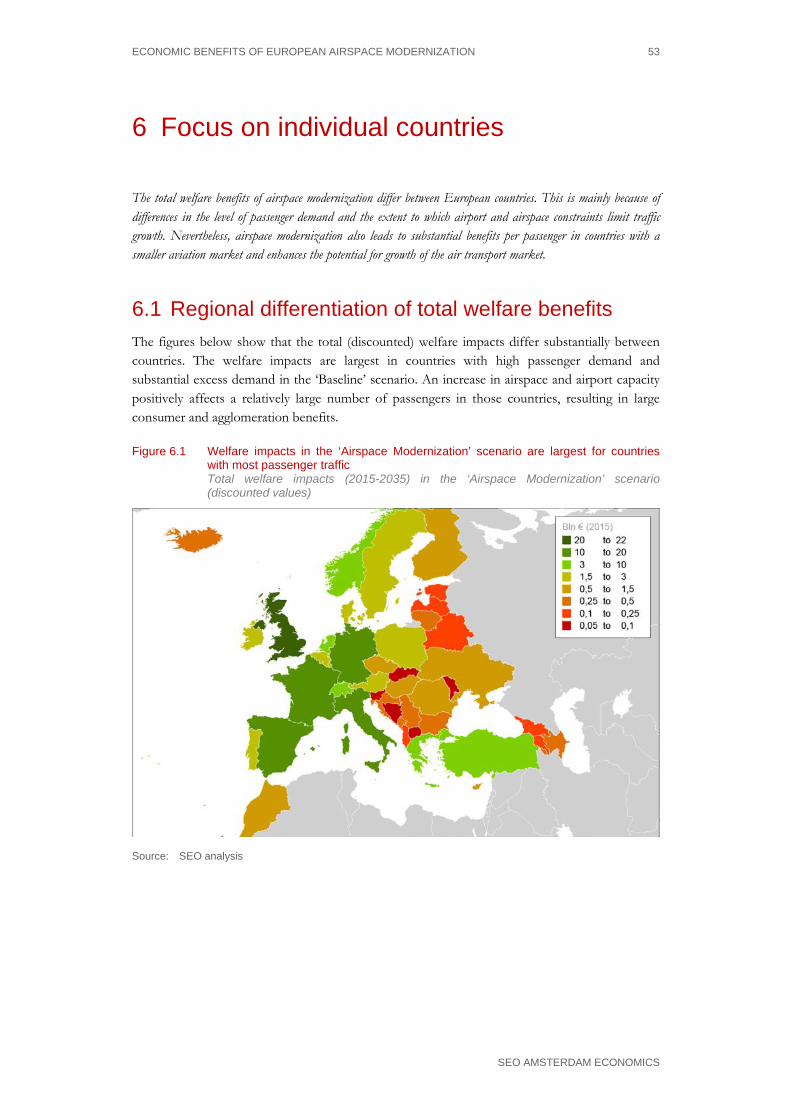
ECONOMIC BENEFITS OF EUROPEAN AIRSPACE MODERNIZATION 53
SEO AMSTERDAM ECONOMICS
6 Focus on individual countries
The total welfare benefits of airspace modernization differ between European countries. This is mainly because of differences in the level of passenger demand and the extent to which airport and airspace constraints limit traffic growth. Nevertheless, airspace modernization also leads to substantial benefits per passenger in countries with a smaller aviation market and enhances the potential for growth of the air transport market.
6.1 Regional differentiation of total welfare benefits The figures below show that the total (discounted) welfare impacts differ substantially between countries. The welfare impacts are largest in countries with high passenger demand and substantial excess demand in the ‘Baseline’ scenario. An increase in airspace and airport capacity positively affects a relatively large number of passengers in those countries, resulting in large consumer and agglomeration benefits.
Figure 6.1 Welfare impacts in the ‘Airspace Modernization’ scenario are largest for countries with most passenger traffic
Total welfare impacts (2015-2035) in the ‘Airspace Modernization’ scenario (discounted values)
Source: SEO analysis

54 CHAPTER 6
SEO AMSTERDAM ECONOMICS
Figure 6.2 Welfare impacts in the ‘Maximizing Connectivity Benefits’ scenario are largest for countries with high levels of passenger traffic that are faced with severe airport capacity restrictions
Total welfare impacts (2015-2035) in the ‘Maximizing Connectivity Benefits’ scenario (discounted values)
Source: SEO analysis
The welfare impacts are largest in the United Kingdom, Turkey, Germany, Italy, Spain and France. In the remainder of this chapter we describe the welfare benefits for these countries. In addition, we also zoom in on the benefits for Poland, to illustrate how the benefits strike down in a large European country with a smaller aviation market. Figure 6.3 summarizes the key results for the seven focus countries in the ‘Airspace Modernization’ scenario in 2035. The blue bars refer to the consumer welfare benefits in the horizon year 2035 (undiscounted). The yellow bars show the cumulative impacts of airspace modernization over the period 2015-2035, where annual impacts are discounted to the 2015 price level. These seven countries together comprise over two thirds of the total benefits in the ESRA08 region. A list of consumer benefits for all countries can be found in Appendix G. The largest consumer benefits in this scenario are found in the UK, which is Europe’s largest aviation market.
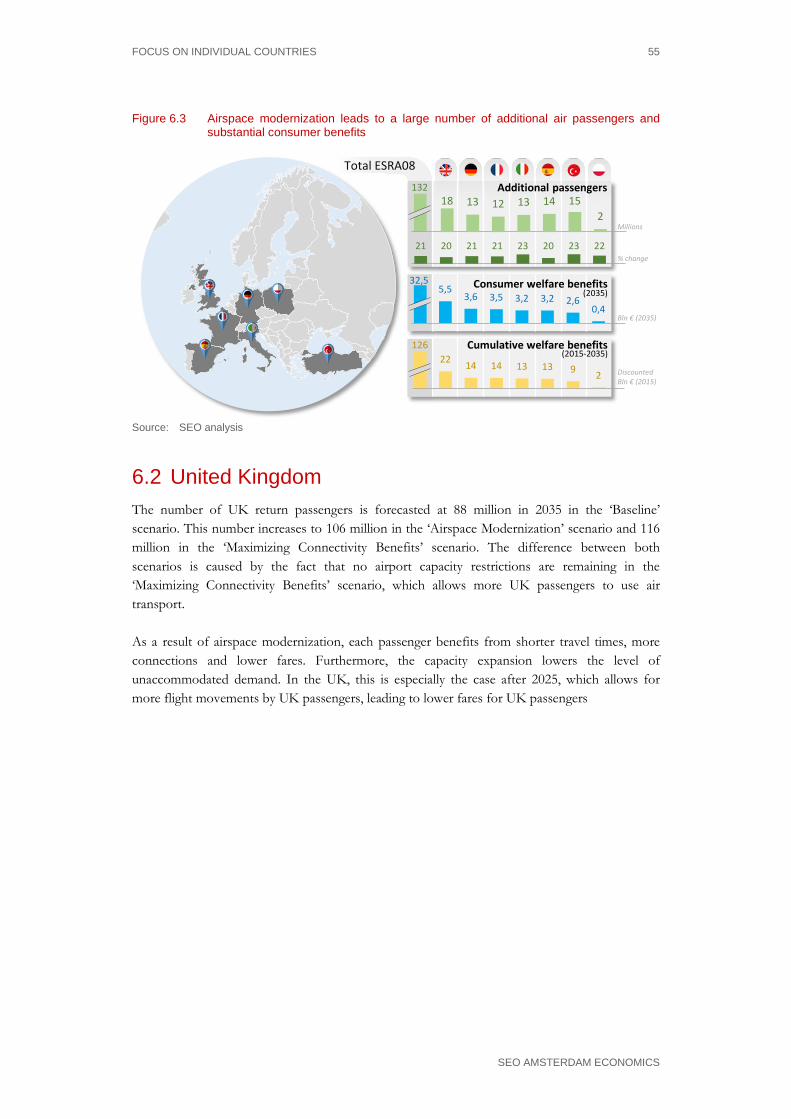
FOCUS ON INDIVIDUAL COUNTRIES 55
SEO AMSTERDAM ECONOMICS
Figure 6.3 Airspace modernization leads to a large number of additional air passengers and substantial consumer benefits
Total ESRA08
132
32,55,5
3,6 3,5 3,2 3,2 2,60,4
Consumer welfare benefits
Cumulative welfare benefits
Millions
Additional passengers
% change
Bln € (2035)
12622 14 14 13 13 9 2
(2015-2035)
DiscountedBln € (2015)
18 13 12 13 14 152
21 20 21 21 23 20 23 22
(2035)
Source: SEO analysis
6.2 United Kingdom The number of UK return passengers is forecasted at 88 million in 2035 in the ‘Baseline’ scenario. This number increases to 106 million in the ‘Airspace Modernization’ scenario and 116 million in the ‘Maximizing Connectivity Benefits’ scenario. The difference between both scenarios is caused by the fact that no airport capacity restrictions are remaining in the ‘Maximizing Connectivity Benefits’ scenario, which allows more UK passengers to use air transport. As a result of airspace modernization, each passenger benefits from shorter travel times, more connections and lower fares. Furthermore, the capacity expansion lowers the level of unaccommodated demand. In the UK, this is especially the case after 2025, which allows for more flight movements by UK passengers, leading to lower fares for UK passengers
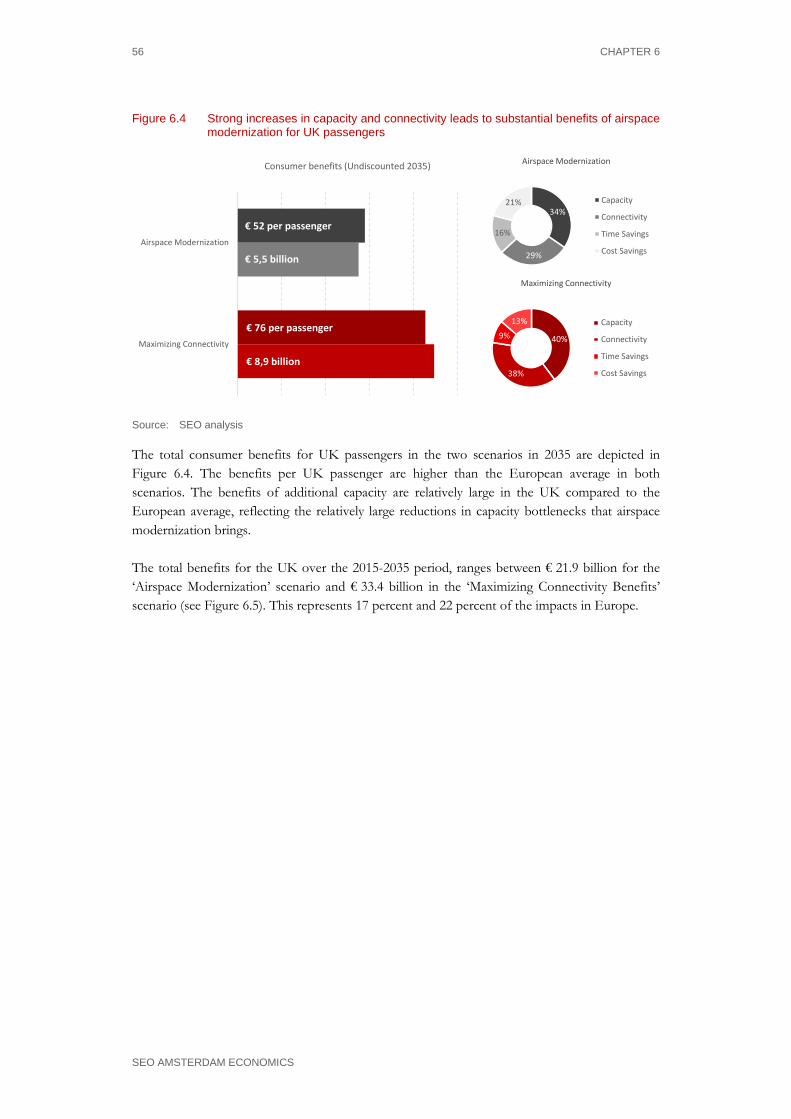
56 CHAPTER 6
SEO AMSTERDAM ECONOMICS
Figure 6.4 Strong increases in capacity and connectivity leads to substantial benefits of airspace modernization for UK passengers
0 10 20 30 40 50 60 70 80 90
0 2 4 6 8 10
Maximizing Connectivity
Airspace Modernization
Consumer benefits (Undiscounted 2035)
€ 76 per passenger
€ 8,9 billion
€ 52 per passenger
€ 5,5 billion
34%
29%
16%
21%
Airspace Modernization
Capacity
Connectivity
Time Savings
Cost Savings
40%
38%
9%
13%
Maximizing Connectivity
Capacity
Connectivity
Time Savings
Cost Savings
Source: SEO analysis
The total consumer benefits for UK passengers in the two scenarios in 2035 are depicted in Figure 6.4. The benefits per UK passenger are higher than the European average in both scenarios. The benefits of additional capacity are relatively large in the UK compared to the European average, reflecting the relatively large reductions in capacity bottlenecks that airspace modernization brings. The total benefits for the UK over the 2015-2035 period, ranges between € 21.9 billion for the ‘Airspace Modernization’ scenario and € 33.4 billion in the ‘Maximizing Connectivity Benefits’ scenario (see Figure 6.5). This represents 17 percent and 22 percent of the impacts in Europe.
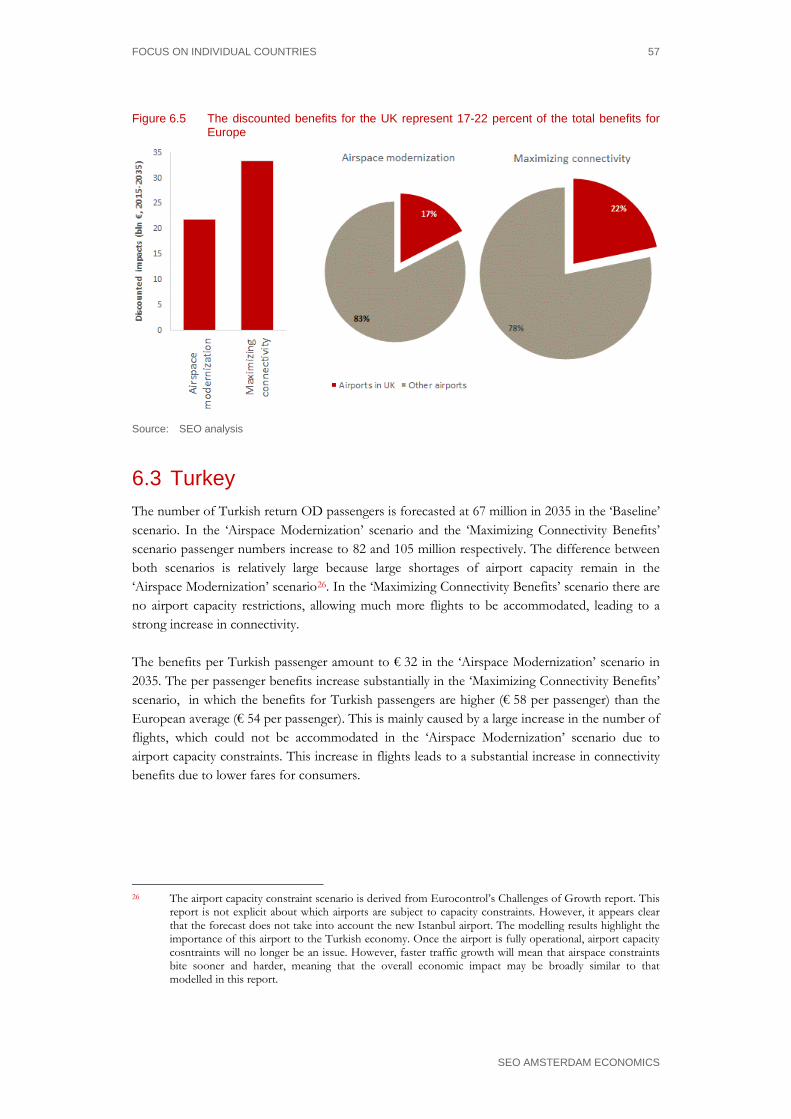
FOCUS ON INDIVIDUAL COUNTRIES 57
SEO AMSTERDAM ECONOMICS
Figure 6.5 The discounted benefits for the UK represent 17-22 percent of the total benefits for Europe
Source: SEO analysis
6.3 Turkey The number of Turkish return OD passengers is forecasted at 67 million in 2035 in the ‘Baseline’ scenario. In the ‘Airspace Modernization’ scenario and the ‘Maximizing Connectivity Benefits’ scenario passenger numbers increase to 82 and 105 million respectively. The difference between both scenarios is relatively large because large shortages of airport capacity remain in the ‘Airspace Modernization’ scenario26. In the ‘Maximizing Connectivity Benefits’ scenario there are no airport capacity restrictions, allowing much more flights to be accommodated, leading to a strong increase in connectivity. The benefits per Turkish passenger amount to € 32 in the ‘Airspace Modernization’ scenario in 2035. The per passenger benefits increase substantially in the ‘Maximizing Connectivity Benefits’ scenario, in which the benefits for Turkish passengers are higher (€ 58 per passenger) than the European average (€ 54 per passenger). This is mainly caused by a large increase in the number of flights, which could not be accommodated in the ‘Airspace Modernization’ scenario due to airport capacity constraints. This increase in flights leads to a substantial increase in connectivity benefits due to lower fares for consumers.
26 The airport capacity constraint scenario is derived from Eurocontrol’s Challenges of Growth report. This
report is not explicit about which airports are subject to capacity constraints. However, it appears clear that the forecast does not take into account the new Istanbul airport. The modelling results highlight the importance of this airport to the Turkish economy. Once the airport is fully operational, airport capacity cosntraints will no longer be an issue. However, faster traffic growth will mean that airspace constraints bite sooner and harder, meaning that the overall economic impact may be broadly similar to that modelled in this report.
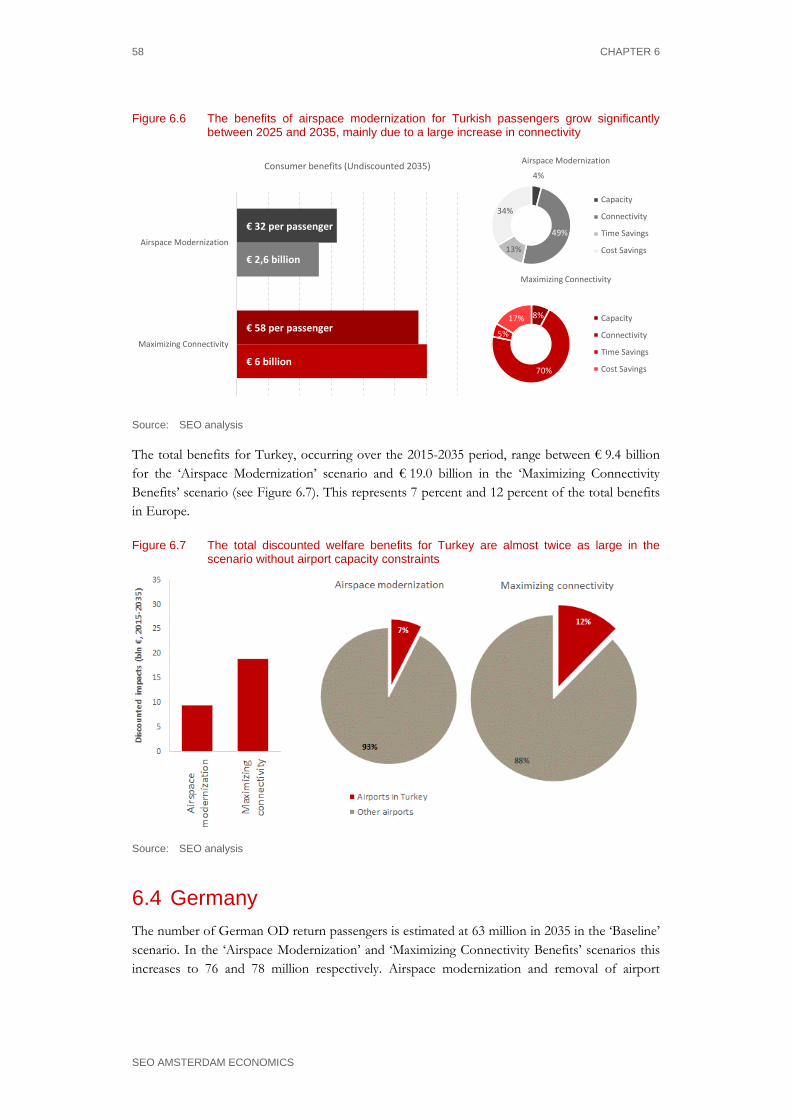
58 CHAPTER 6
SEO AMSTERDAM ECONOMICS
Figure 6.6 The benefits of airspace modernization for Turkish passengers grow significantly between 2025 and 2035, mainly due to a large increase in connectivity
0 10 20 30 40 50 60 70
0 1 2 3 4 5 6 7
Maximizing Connectivity
Airspace Modernization
Consumer benefits (Undiscounted 2035)4%
49%
13%
34%
Airspace Modernization
Capacity
Connectivity
Time Savings
Cost Savings
8%
70%
5%
17%
Maximizing Connectivity
Capacity
Connectivity
Time Savings
Cost Savings
€ 58 per passenger
€ 6 billion
€ 32 per passenger
€ 2,6 billion
Source: SEO analysis
The total benefits for Turkey, occurring over the 2015-2035 period, range between € 9.4 billion for the ‘Airspace Modernization’ scenario and € 19.0 billion in the ‘Maximizing Connectivity Benefits’ scenario (see Figure 6.7). This represents 7 percent and 12 percent of the total benefits in Europe.
Figure 6.7 The total discounted welfare benefits for Turkey are almost twice as large in the scenario without airport capacity constraints
Source: SEO analysis
6.4 Germany The number of German OD return passengers is estimated at 63 million in 2035 in the ‘Baseline’ scenario. In the ‘Airspace Modernization’ and ‘Maximizing Connectivity Benefits’ scenarios this increases to 76 and 78 million respectively. Airspace modernization and removal of airport
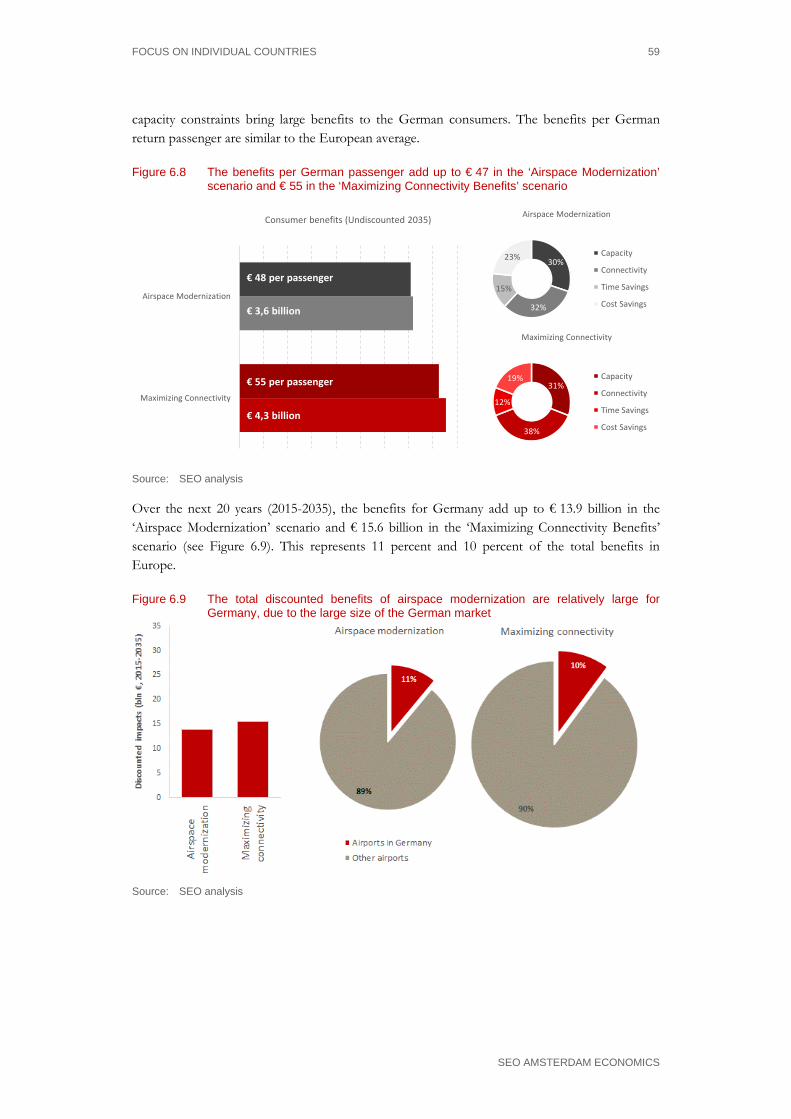
FOCUS ON INDIVIDUAL COUNTRIES 59
SEO AMSTERDAM ECONOMICS
capacity constraints bring large benefits to the German consumers. The benefits per German return passenger are similar to the European average.
Figure 6.8 The benefits per German passenger add up to € 47 in the ‘Airspace Modernization’ scenario and € 55 in the ‘Maximizing Connectivity Benefits’ scenario
0 10 20 30 40 50 60
0 0,5 1 1,5 2 2,5 3 3,5 4 4,5
Maximizing Connectivity
Airspace Modernization
Consumer benefits (Undiscounted 2035)
30%
32%
15%
23%
Airspace Modernization
Capacity
Connectivity
Time Savings
Cost Savings
31%
38%
12%
19%
Maximizing Connectivity
Capacity
Connectivity
Time Savings
Cost Savings
€ 55 per passenger
€ 4,3 billion
€ 48 per passenger
€ 3,6 billion
Source: SEO analysis
Over the next 20 years (2015-2035), the benefits for Germany add up to € 13.9 billion in the ‘Airspace Modernization’ scenario and € 15.6 billion in the ‘Maximizing Connectivity Benefits’ scenario (see Figure 6.9). This represents 11 percent and 10 percent of the total benefits in Europe.
Figure 6.9 The total discounted benefits of airspace modernization are relatively large for Germany, due to the large size of the German market
Source: SEO analysis
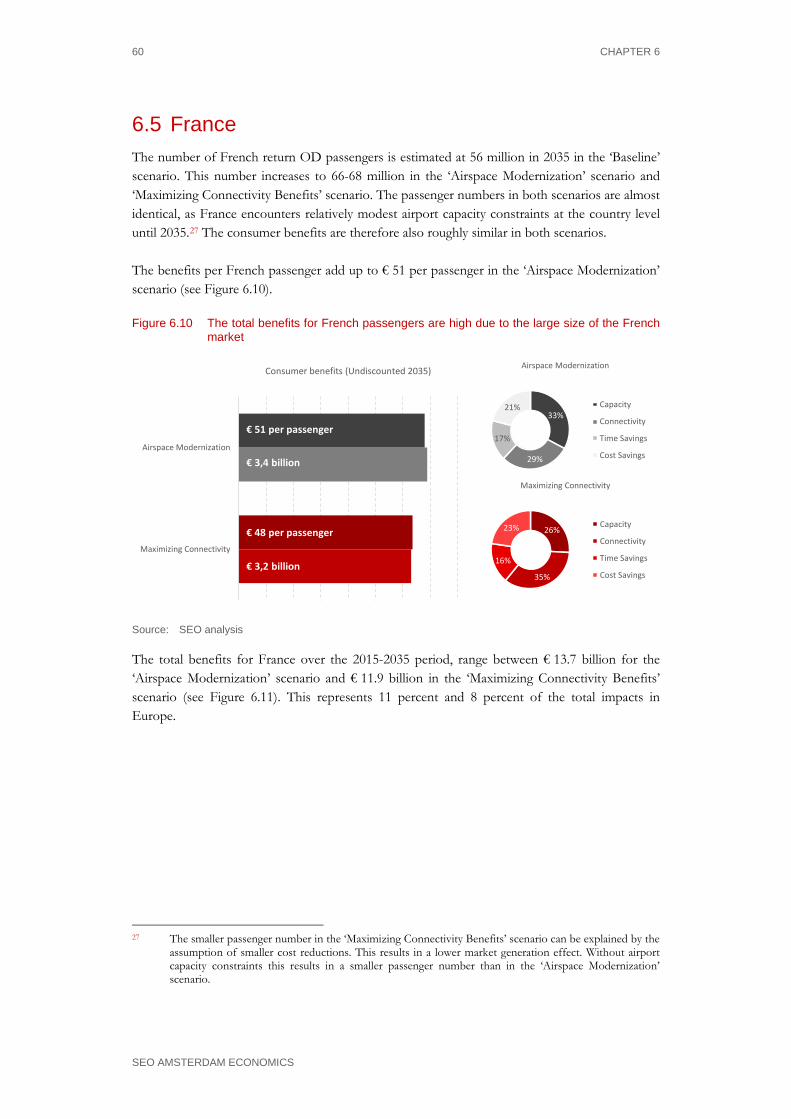
60 CHAPTER 6
SEO AMSTERDAM ECONOMICS
6.5 France The number of French return OD passengers is estimated at 56 million in 2035 in the ‘Baseline’ scenario. This number increases to 66-68 million in the ‘Airspace Modernization’ scenario and ‘Maximizing Connectivity Benefits’ scenario. The passenger numbers in both scenarios are almost identical, as France encounters relatively modest airport capacity constraints at the country level until 2035.27 The consumer benefits are therefore also roughly similar in both scenarios. The benefits per French passenger add up to € 51 per passenger in the ‘Airspace Modernization’ scenario (see Figure 6.10).
Figure 6.10 The total benefits for French passengers are high due to the large size of the French market
0 10 20 30 40 50 60
0 0,5 1 1,5 2 2,5 3 3,5 4
Maximizing Connectivity
Airspace Modernization
Consumer benefits (Undiscounted 2035)
33%
29%
17%
21%
Airspace Modernization
Capacity
Connectivity
Time Savings
Cost Savings
26%
35%
16%
23%
Maximizing Connectivity
Capacity
Connectivity
Time Savings
Cost Savings
€ 48 per passenger
€ 3,2 billion
€ 51 per passenger
€ 3,4 billion
Source: SEO analysis
The total benefits for France over the 2015-2035 period, range between € 13.7 billion for the ‘Airspace Modernization’ scenario and € 11.9 billion in the ‘Maximizing Connectivity Benefits’ scenario (see Figure 6.11). This represents 11 percent and 8 percent of the total impacts in Europe.
27 The smaller passenger number in the ‘Maximizing Connectivity Benefits’ scenario can be explained by the
assumption of smaller cost reductions. This results in a lower market generation effect. Without airport capacity constraints this results in a smaller passenger number than in the ‘Airspace Modernization’ scenario.
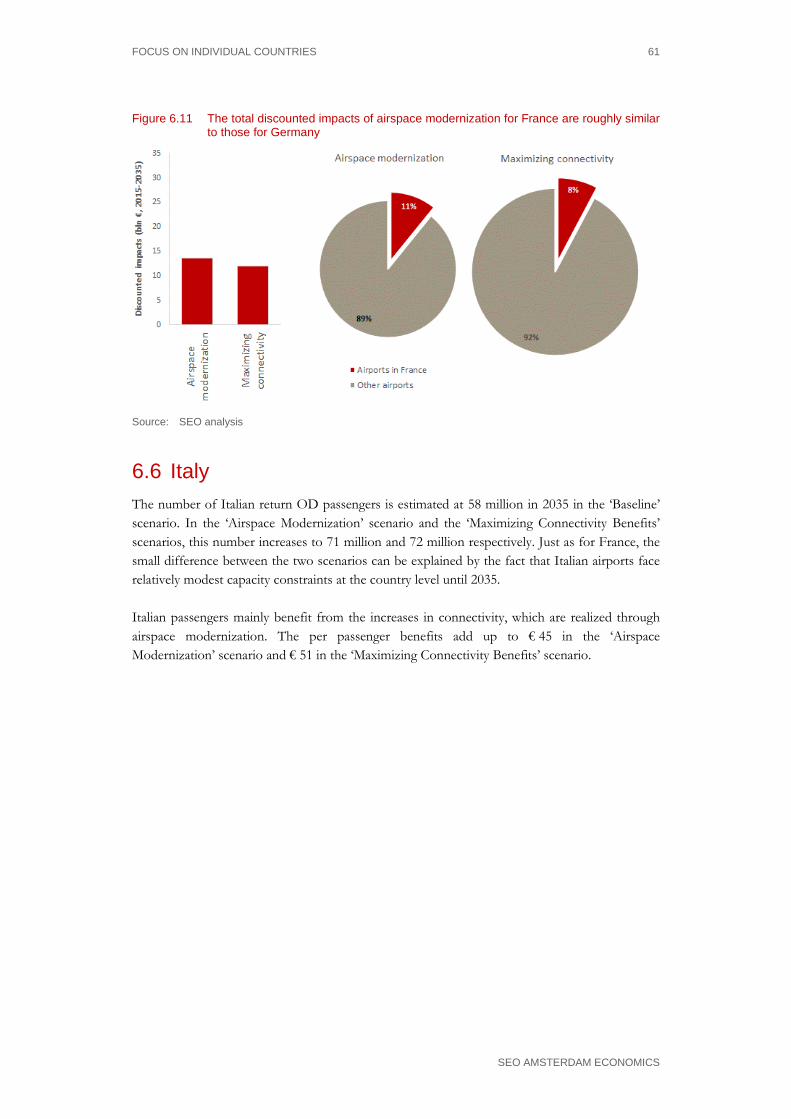
FOCUS ON INDIVIDUAL COUNTRIES 61
SEO AMSTERDAM ECONOMICS
Figure 6.11 The total discounted impacts of airspace modernization for France are roughly similar to those for Germany
Source: SEO analysis
6.6 Italy The number of Italian return OD passengers is estimated at 58 million in 2035 in the ‘Baseline’ scenario. In the ‘Airspace Modernization’ scenario and the ‘Maximizing Connectivity Benefits’ scenarios, this number increases to 71 million and 72 million respectively. Just as for France, the small difference between the two scenarios can be explained by the fact that Italian airports face relatively modest capacity constraints at the country level until 2035. Italian passengers mainly benefit from the increases in connectivity, which are realized through airspace modernization. The per passenger benefits add up to € 45 in the ‘Airspace Modernization’ scenario and € 51 in the ‘Maximizing Connectivity Benefits’ scenario.

62 CHAPTER 6
SEO AMSTERDAM ECONOMICS
Figure 6.12 Connectivity increases are the largest source of benefits for Italian passengers
0 10 20 30 40 50 60
0 0,5 1 1,5 2 2,5 3 3,5 4
Maximizing Connectivity
Airspace Modernization
Consumer benefits (Undiscounted 2035)
25%
33%18%
24%
Airspace Modernization
Capacity
Connectivity
Time Savings
Cost Savings
23%
41%
15%
21%
Maximizing Connectivity
Capacity
Connectivity
Time Savings
Cost Savings
€ 51 per passenger
€ 3,7 billion
€ 45 per passenger
€ 3,2 billion
Source: SEO analysis
The present value of all impacts occurring over the 2015-2035 period, ranges between € 13.0 billion and € 14.1 billion for the ‘Airspace Modernization’ and the ‘Maximizing Connectivity Benefits’ scenarios (see Figure 6.13).
Figure 6.13 The total discounted impacts of airspace modernization for Italy are roughly similar to those for Germany and France
Source: SEO analysis
6.7 Spain The number of Spanish return passengers in 2035 is estimated at 69 million in the ‘Baseline’ scenario. This increases to 83 million in both airspace modernization scenarios. In Spain, relatively modest airport capacity constraints are present until 2035. As a result, the benefits for Spanish passengers are largely similar in both scenarios.
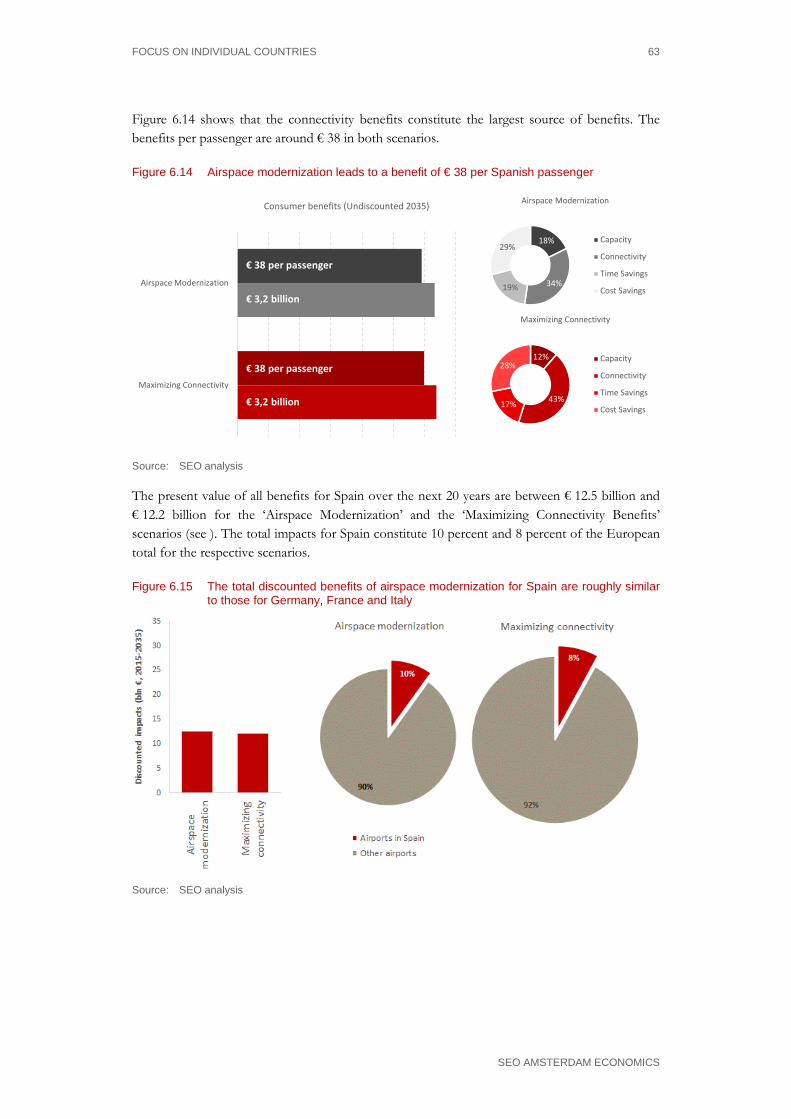
FOCUS ON INDIVIDUAL COUNTRIES 63
SEO AMSTERDAM ECONOMICS
Figure 6.14 shows that the connectivity benefits constitute the largest source of benefits. The benefits per passenger are around € 38 in both scenarios.
Figure 6.14 Airspace modernization leads to a benefit of € 38 per Spanish passenger
0 5 10 15 20 25 30 35 40 45
0 0,5 1 1,5 2 2,5 3 3,5
Maximizing Connectivity
Airspace Modernization
Consumer benefits (Undiscounted 2035)
18%
34%19%
29%
Airspace Modernization
Capacity
Connectivity
Time Savings
Cost Savings
12%
43%17%
28%
Maximizing Connectivity
Capacity
Connectivity
Time Savings
Cost Savings
€ 38 per passenger
€ 3,2 billion
€ 38 per passenger
€ 3,2 billion
Source: SEO analysis
The present value of all benefits for Spain over the next 20 years are between € 12.5 billion and € 12.2 billion for the ‘Airspace Modernization’ and the ‘Maximizing Connectivity Benefits’ scenarios (see ). The total impacts for Spain constitute 10 percent and 8 percent of the European total for the respective scenarios.
Figure 6.15 The total discounted benefits of airspace modernization for Spain are roughly similar to those for Germany, France and Italy
Source: SEO analysis
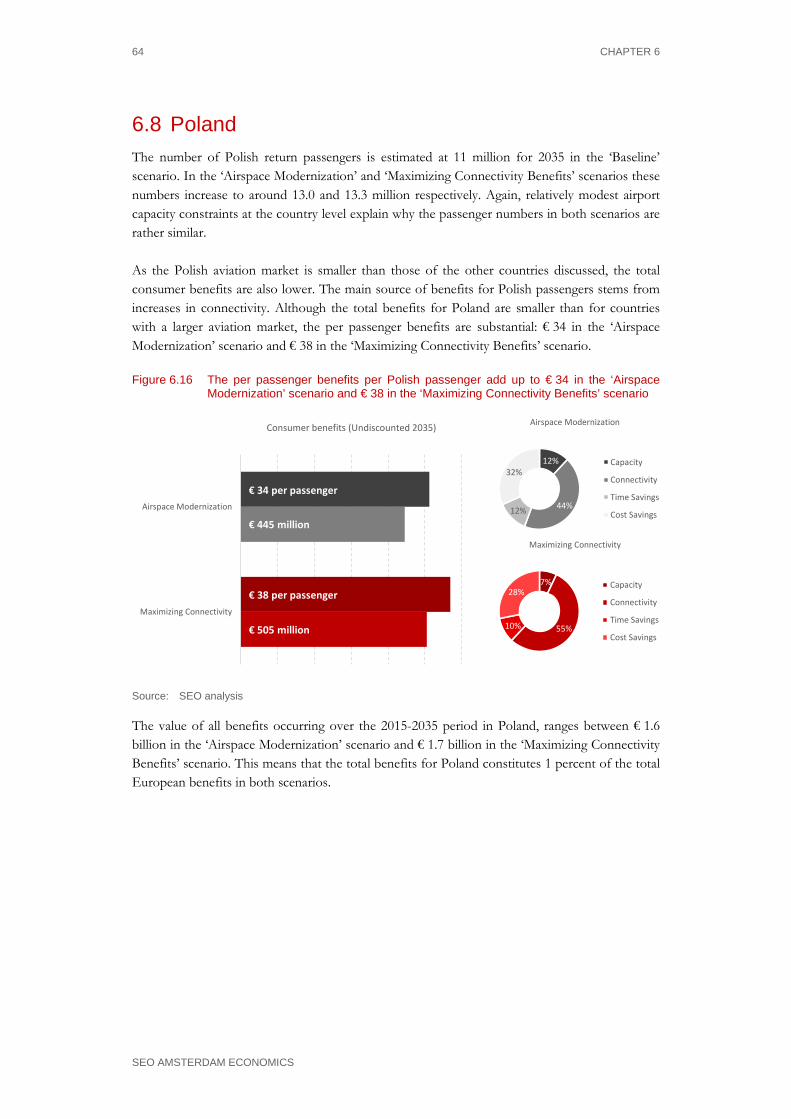
64 CHAPTER 6
SEO AMSTERDAM ECONOMICS
6.8 Poland The number of Polish return passengers is estimated at 11 million for 2035 in the ‘Baseline’ scenario. In the ‘Airspace Modernization’ and ‘Maximizing Connectivity Benefits’ scenarios these numbers increase to around 13.0 and 13.3 million respectively. Again, relatively modest airport capacity constraints at the country level explain why the passenger numbers in both scenarios are rather similar. As the Polish aviation market is smaller than those of the other countries discussed, the total consumer benefits are also lower. The main source of benefits for Polish passengers stems from increases in connectivity. Although the total benefits for Poland are smaller than for countries with a larger aviation market, the per passenger benefits are substantial: € 34 in the ‘Airspace Modernization’ scenario and € 38 in the ‘Maximizing Connectivity Benefits’ scenario.
Figure 6.16 The per passenger benefits per Polish passenger add up to € 34 in the ‘Airspace Modernization’ scenario and € 38 in the ‘Maximizing Connectivity Benefits’ scenario
Source: SEO analysis
The value of all benefits occurring over the 2015-2035 period in Poland, ranges between € 1.6 billion in the ‘Airspace Modernization’ scenario and € 1.7 billion in the ‘Maximizing Connectivity Benefits’ scenario. This means that the total benefits for Poland constitutes 1 percent of the total European benefits in both scenarios.
0 5 10 15 20 25 30 35 40
0 100 200 300 400 500 600
Maximizing Connectivity
Airspace Modernization
Consumer benefits (Undiscounted 2035)
12%
44%12%
32%
Airspace Modernization
Capacity
Connectivity
Time Savings
Cost Savings
7%
55%10%
28%
Maximizing Connectivity
Capacity
Connectivity
Time Savings
Cost Savings
€ 38 per passenger
€ 505 million
€ 34 per passenger
€ 445 million

FOCUS ON INDIVIDUAL COUNTRIES 65
SEO AMSTERDAM ECONOMICS
Figure 6.17 The total benefit for Poland over the period 2015-2035 constitutes 1 percent of the European total
Source: SEO analysis

ECONOMIC BENEFITS OF EUROPEAN AIRSPACE MODERNIZATION 67
SEO AMSTERDAM ECONOMICS
7 Economic contribution of airspace modernization
Airspace modernization results in € 245 billion of additional GDP by 2035. If remaining airport infrastructure capacity constraints are removed as well, the GDP benefit will be maximized to € 301 billion in 2035. Total employment will increase by 0.4 percent in case of airspace modernization and 0.5 percent if any remaining airport capacity constraints are removed. In addition, trade, tourism, labour productivity, R&D and innovation will be positively affected. In this chapter, we discuss the changes in the economic contribution resulting from airspace modernization and reduction of capacity constraints under the economic contribution approach. More specifically, we estimate the macro impact on GDP and employment. Furthermore, we consider the catalytic economic impact in terms of productivity growth (GDP/capita), tourism, R&D/innovation, trade and investment.
7.1 Methodology There are different techniques for measuring the economic impact of airports. A frequently applied method is input-output analysis (I/O), which uses exogeneously determined multipliers. As such, I/O (partially) neglects the role of transport infrastructure as an intermediate good that leads to an increase of productivity and to cost savings at the downstream level (Malina & Wollersheim 2007), as well as labour market effects. One of the benefits of econometric analysis over I/O is that the former method measures the net, additional impacts28. A fixed-effects panel data model has been used to estimate the macro-economic impacts and wider catalytic impacts of air transport. Panel data models allow comparing the effects of change in air transport on the regional economy around the same airport. The model analyses effects within airports over time, rather than analyzing effects between different airports. It is widely acknowledged that there is a two-way correspondence between air travel and economic growth. The relationship is bi-directional. We use time-lag variables to correct for causality issues in the model. To isolate the causal effect of air travel on GDP growth, we estimate the impact of a change in air passengers in the year t-1 on the change in total GDP in year t. It is highly unlikely that GDP growth in a certain year impacts the growth in air travel in an earlier point in time. Hence, we estimate the effect of a change in air passengers or connectivity in a certain year on the change in the dependent economic variable in the year thereafter. We refer to Appendix I for a further discussion of the model. Log-values of the dependent variables and passenger numbers are used in our models. Therefore, the resulting coefficients can be interpreted as elasticities. For example, in a regression with GDP
28 An approach that was also put forward by Button and Yuan (2011).
68 CHAPTER 7
SEO AMSTERDAM ECONOMICS
as the dependent variable, a coefficient of 0.1 for passenger numbers implies that a 10 percent increase in passengers in one year results in a 1 percent increase in GDP in the subsequent year. The total GDP effect gives an indication of aggregate economic growth resulting from air travel increase. Total GDP around the airport can increase through an increase in productivity and economic output, as well as through additional employment associated with aviation growth. The regression of air travel on employment shows to what extent the total employment level increases after an increase in air travel. Transitions in the labour market are not captured in the variable, as these transitions do not have an effect on the total number of employed people. Therefore, the linkage found between air passengers and total employment gives an indication of net employment effects. We have applied the estimated coefficients to the forecast growth figures in the three scenarios to estimate the economic impact in each respective scenario. Appendix I provides a technical description of the model and data used.
7.2 Macro-economic contribution of airspace modernization and removal of airport capacity constraints
This section presents the macro-economic impact of airspace modernization and the removal of airport capacity constraints. Airspace modernization leads to a stronger passenger increase in comparison to the ‘Baseline’ scenario, resulting from lower time, operational, delay and fuel costs, increased connectivity and the absence of airspace capacity restrictions. Figure 7.1 shows the total number of European passengers departing from European airports in 2035. These benefits altogether increase the total number of European air passengers in the European air transport system. In the ‘Airspace Modernization’ scenario, the total number of European return OD passengers increases by 132 million in 2035. This is a 21.4 percent increase with respect to the ‘Baseline’ scenario. In the absence of capacity constraints at airports, another 43 million European return OD passengers can be served, this is a 28.3 increase with respect to the ‘Baseline’ scenario. From the results of our panel data regression it follows that a 1 percent increase in air passengers leads to a 0.032 percent in total employment in the region around the airport. The effect of a similar increase on total GDP is 0.120 percent29. However, it is very likely that the marginal GDP impact of an increase in air connectivity decreases in the future. An additional flight in a market which already has excellent connectivity will lead to less economic benefits than an air service to a new destination. This is also underlined by Bilotkach (2015), who shows that the number of 29 There results are in similar ranges as those of other studies. For example, PWC (2015) finds that a 1
percent growth in passengers results in a 0.1 percent GDP growth using econometric analysis. Poort (2000) using a three-stage least squares regression finds that a 1% growth in passenger enplanements leads to a 0.17 percent GDP growth in Europe. For employment, Bilotkach (2015) reports that a 1% growth in passengers leads to a 0.013 percent growth in employment in US metropolitan areas, using a panel data approach.
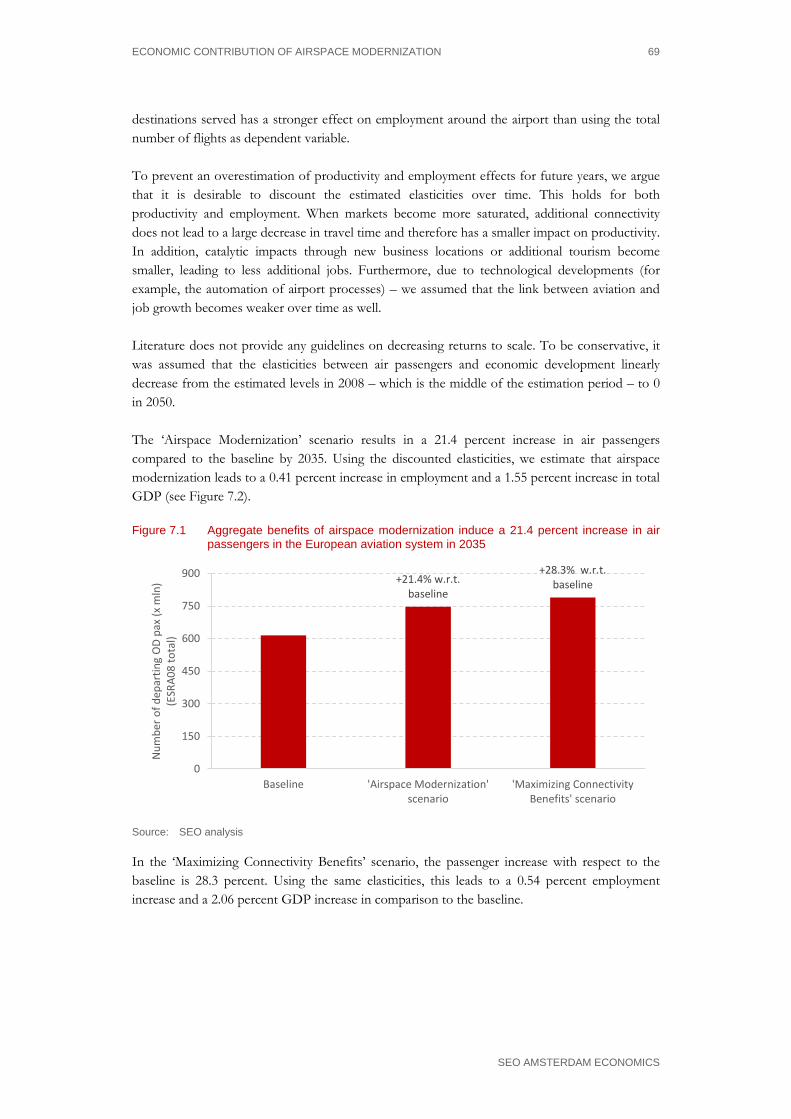
ECONOMIC CONTRIBUTION OF AIRSPACE MODERNIZATION 69
SEO AMSTERDAM ECONOMICS
destinations served has a stronger effect on employment around the airport than using the total number of flights as dependent variable. To prevent an overestimation of productivity and employment effects for future years, we argue that it is desirable to discount the estimated elasticities over time. This holds for both productivity and employment. When markets become more saturated, additional connectivity does not lead to a large decrease in travel time and therefore has a smaller impact on productivity. In addition, catalytic impacts through new business locations or additional tourism become smaller, leading to less additional jobs. Furthermore, due to technological developments (for example, the automation of airport processes) – we assumed that the link between aviation and job growth becomes weaker over time as well. Literature does not provide any guidelines on decreasing returns to scale. To be conservative, it was assumed that the elasticities between air passengers and economic development linearly decrease from the estimated levels in 2008 – which is the middle of the estimation period – to 0 in 2050. The ‘Airspace Modernization’ scenario results in a 21.4 percent increase in air passengers compared to the baseline by 2035. Using the discounted elasticities, we estimate that airspace modernization leads to a 0.41 percent increase in employment and a 1.55 percent increase in total GDP (see Figure 7.2).
Figure 7.1 Aggregate benefits of airspace modernization induce a 21.4 percent increase in air passengers in the European aviation system in 2035
Source: SEO analysis
In the ‘Maximizing Connectivity Benefits’ scenario, the passenger increase with respect to the baseline is 28.3 percent. Using the same elasticities, this leads to a 0.54 percent employment increase and a 2.06 percent GDP increase in comparison to the baseline.
+21.4% w.r.t. baseline
+28.3% w.r.t. baseline
0
150
300
450
600
750
900
Baseline 'Airspace Modernization'scenario
'Maximizing ConnectivityBenefits' scenario
Num
ber o
f dep
artin
g O
D pa
x (x
mln
) (E
SRA0
8 to
tal)

70 CHAPTER 7
SEO AMSTERDAM ECONOMICS
Figure 7.2 Airspace modernization leads to a 0.41 percent increase in net employment and 1.55 percent increase in total GDP
Source: SEO analysis
7.2.1 Impact on employment related to aviation
Our analysis demonstrates a positive effect of the increase in air passengers on total net employment. This net employment effect is a combination of direct, indirect, induced and catalytic employment impacts. A higher passenger number increases the number of jobs at and around the airport, while there are also catalytic employment effects resulting from increased business activity in the region around the airport. Estimating absolute net employment effects in 2035 would require an estimation of the total employment level in the economy in that year. Given the uncertainties regarding labour productivity and technological development, such a forecast would be surrounded with significant uncertainty and is therefore out of the scope of this study. To give an indication of the number of jobs created in these scenarios, we have applied the discounted employment elasticities from Figure 7.2 to the 2014 employment figures at the country level in Europe.30 With the remark that the results from our analysis focus on a 100-kilometre region around the airport rather than a country level, we apply these elasticities to country level data to give an indication of the employment effect of airspace modernization for each country.31
30 Employment data is only available for the EU28 region, Norway, Switzerland and Turkey. Therefore the
estimated employment figures do not include other countries in the ESRA08 region. 31 The rationale for using country level data rather than regional data is that the 100-kilometre region
around an airport often stretches over more than one country. It is difficult to allocate the employment effects over these different countries. The underlying assumption for the analysis at country level is that every part of Europe is within the 100-kilometre catchment area of at least one airport. For areas covered by more than one airport, the analysis at a country level might be an underestimation of the effect.
1,55%
0,41%
2,06%
0,54%
0,0% 0,5% 1,0% 1,5% 2,0% 2,5%
Total GDP
Employment
% increase
'Maximizing Connectivity Benefits' scenario 'Airspace Modernization' scenario
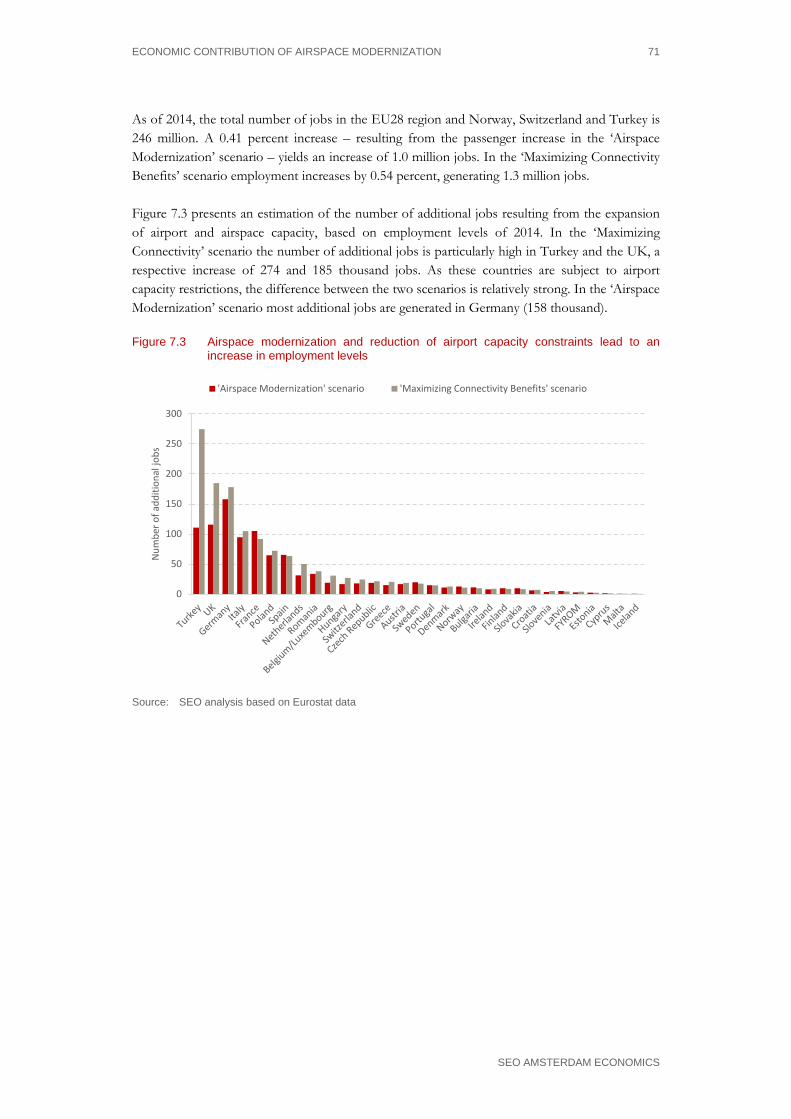
ECONOMIC CONTRIBUTION OF AIRSPACE MODERNIZATION 71
SEO AMSTERDAM ECONOMICS
As of 2014, the total number of jobs in the EU28 region and Norway, Switzerland and Turkey is 246 million. A 0.41 percent increase – resulting from the passenger increase in the ‘Airspace Modernization’ scenario – yields an increase of 1.0 million jobs. In the ‘Maximizing Connectivity Benefits’ scenario employment increases by 0.54 percent, generating 1.3 million jobs. Figure 7.3 presents an estimation of the number of additional jobs resulting from the expansion of airport and airspace capacity, based on employment levels of 2014. In the ‘Maximizing Connectivity’ scenario the number of additional jobs is particularly high in Turkey and the UK, a respective increase of 274 and 185 thousand jobs. As these countries are subject to airport capacity restrictions, the difference between the two scenarios is relatively strong. In the ‘Airspace Modernization’ scenario most additional jobs are generated in Germany (158 thousand).
Figure 7.3 Airspace modernization and reduction of airport capacity constraints lead to an increase in employment levels
Source: SEO analysis based on Eurostat data
0
50
100
150
200
250
300
Num
ber o
f add
ition
al jo
bs
'Airspace Modernization' scenario 'Maximizing Connectivity Benefits' scenario
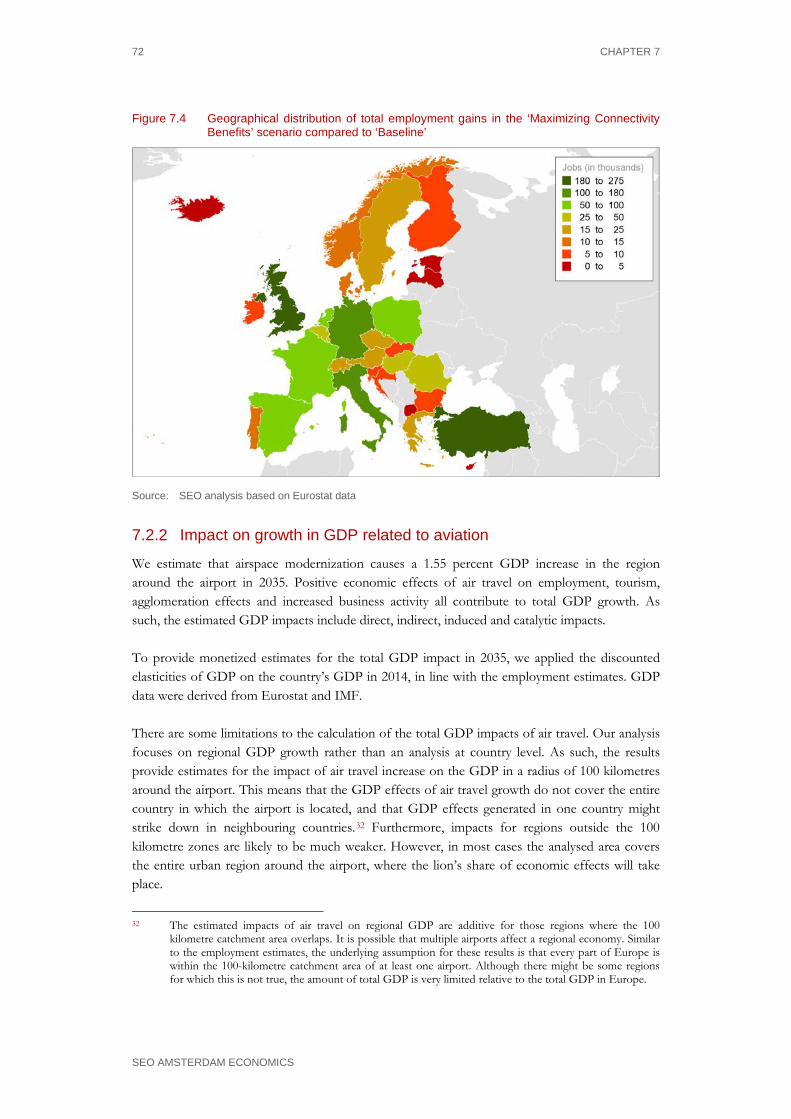
72 CHAPTER 7
SEO AMSTERDAM ECONOMICS
Figure 7.4 Geographical distribution of total employment gains in the ‘Maximizing Connectivity Benefits’ scenario compared to ‘Baseline’
Source: SEO analysis based on Eurostat data
7.2.2 Impact on growth in GDP related to aviation
We estimate that airspace modernization causes a 1.55 percent GDP increase in the region around the airport in 2035. Positive economic effects of air travel on employment, tourism, agglomeration effects and increased business activity all contribute to total GDP growth. As such, the estimated GDP impacts include direct, indirect, induced and catalytic impacts. To provide monetized estimates for the total GDP impact in 2035, we applied the discounted elasticities of GDP on the country’s GDP in 2014, in line with the employment estimates. GDP data were derived from Eurostat and IMF. There are some limitations to the calculation of the total GDP impacts of air travel. Our analysis focuses on regional GDP growth rather than an analysis at country level. As such, the results provide estimates for the impact of air travel increase on the GDP in a radius of 100 kilometres around the airport. This means that the GDP effects of air travel growth do not cover the entire country in which the airport is located, and that GDP effects generated in one country might strike down in neighbouring countries.32 Furthermore, impacts for regions outside the 100 kilometre zones are likely to be much weaker. However, in most cases the analysed area covers the entire urban region around the airport, where the lion’s share of economic effects will take place.
32 The estimated impacts of air travel on regional GDP are additive for those regions where the 100
kilometre catchment area overlaps. It is possible that multiple airports affect a regional economy. Similar to the employment estimates, the underlying assumption for these results is that every part of Europe is within the 100-kilometre catchment area of at least one airport. Although there might be some regions for which this is not true, the amount of total GDP is very limited relative to the total GDP in Europe.
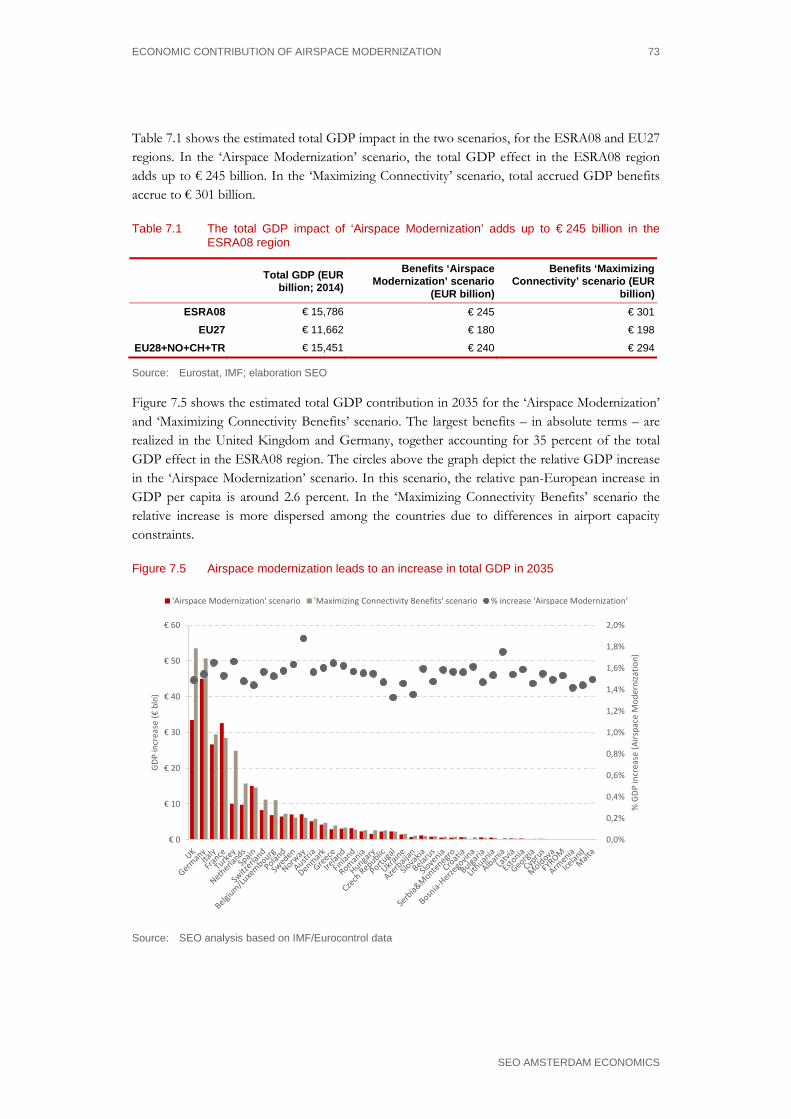
ECONOMIC CONTRIBUTION OF AIRSPACE MODERNIZATION 73
SEO AMSTERDAM ECONOMICS
Table 7.1 shows the estimated total GDP impact in the two scenarios, for the ESRA08 and EU27 regions. In the ‘Airspace Modernization’ scenario, the total GDP effect in the ESRA08 region adds up to € 245 billion. In the ‘Maximizing Connectivity’ scenario, total accrued GDP benefits accrue to € 301 billion.
Table 7.1 The total GDP impact of ‘Airspace Modernization’ adds up to € 245 billion in the ESRA08 region
Total GDP (EUR
billion; 2014)
Benefits ‘Airspace Modernization’ scenario
(EUR billion)
Benefits ‘Maximizing Connectivity’ scenario (EUR
billion) ESRA08 € 15,786 € 245 € 301
EU27 € 11,662 € 180 € 198
EU28+NO+CH+TR € 15,451 € 240 € 294
Source: Eurostat, IMF; elaboration SEO
Figure 7.5 shows the estimated total GDP contribution in 2035 for the ‘Airspace Modernization’ and ‘Maximizing Connectivity Benefits’ scenario. The largest benefits – in absolute terms – are realized in the United Kingdom and Germany, together accounting for 35 percent of the total GDP effect in the ESRA08 region. The circles above the graph depict the relative GDP increase in the ‘Airspace Modernization’ scenario. In this scenario, the relative pan-European increase in GDP per capita is around 2.6 percent. In the ‘Maximizing Connectivity Benefits’ scenario the relative increase is more dispersed among the countries due to differences in airport capacity constraints.
Figure 7.5 Airspace modernization leads to an increase in total GDP in 2035
Source: SEO analysis based on IMF/Eurocontrol data
0,0%
0,2%
0,4%
0,6%
0,8%
1,0%
1,2%
1,4%
1,6%
1,8%
2,0%
€ 0
€ 10
€ 20
€ 30
€ 40
€ 50
€ 60%
GDP
incr
ease
(Airs
pace
Mod
erni
zatio
n)
GDP
incr
ease
(€bl
n)
'Airspace Modernization' scenario 'Maximizing Connectivity Benefits' scenario % increase 'Airspace Modernization'
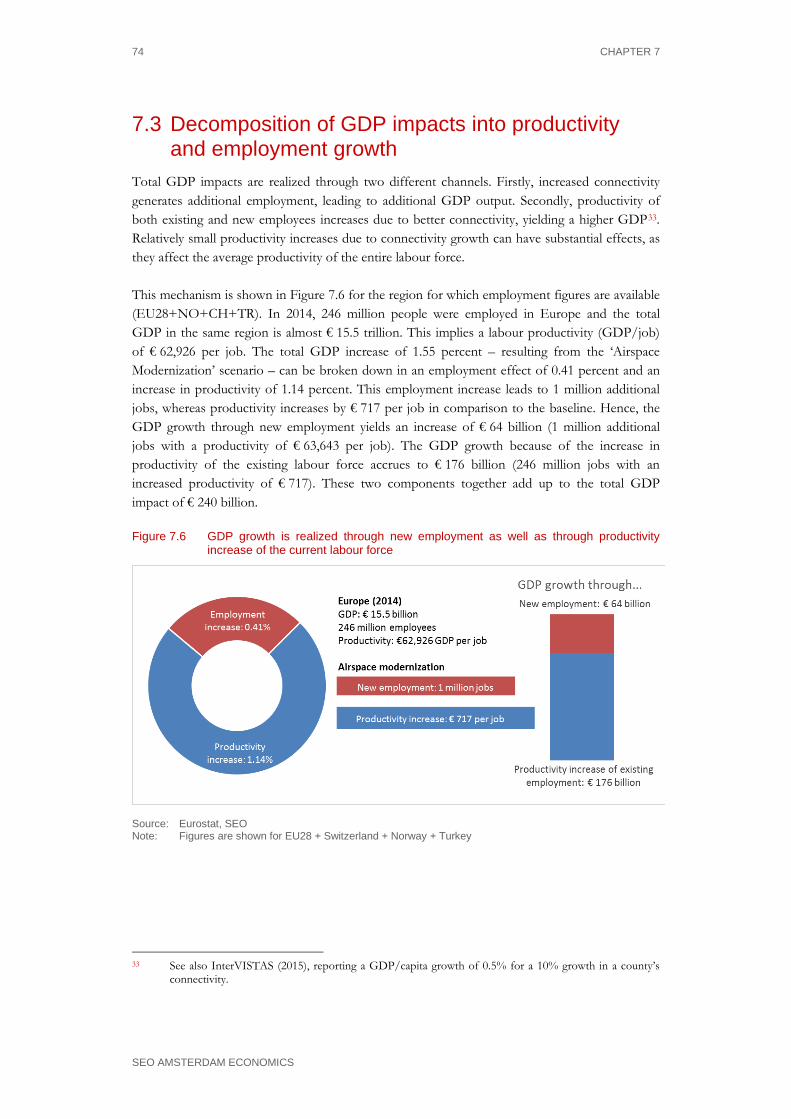
74 CHAPTER 7
SEO AMSTERDAM ECONOMICS
7.3 Decomposition of GDP impacts into productivity and employment growth
Total GDP impacts are realized through two different channels. Firstly, increased connectivity generates additional employment, leading to additional GDP output. Secondly, productivity of both existing and new employees increases due to better connectivity, yielding a higher GDP33. Relatively small productivity increases due to connectivity growth can have substantial effects, as they affect the average productivity of the entire labour force. This mechanism is shown in Figure 7.6 for the region for which employment figures are available (EU28+NO+CH+TR). In 2014, 246 million people were employed in Europe and the total GDP in the same region is almost € 15.5 trillion. This implies a labour productivity (GDP/job) of € 62,926 per job. The total GDP increase of 1.55 percent – resulting from the ‘Airspace Modernization’ scenario – can be broken down in an employment effect of 0.41 percent and an increase in productivity of 1.14 percent. This employment increase leads to 1 million additional jobs, whereas productivity increases by € 717 per job in comparison to the baseline. Hence, the GDP growth through new employment yields an increase of € 64 billion (1 million additional jobs with a productivity of € 63,643 per job). The GDP growth because of the increase in productivity of the existing labour force accrues to € 176 billion (246 million jobs with an increased productivity of € 717). These two components together add up to the total GDP impact of € 240 billion.
Figure 7.6 GDP growth is realized through new employment as well as through productivity increase of the current labour force
Source: Eurostat, SEO Note: Figures are shown for EU28 + Switzerland + Norway + Turkey
33 See also InterVISTAS (2015), reporting a GDP/capita growth of 0.5% for a 10% growth in a county’s
connectivity.
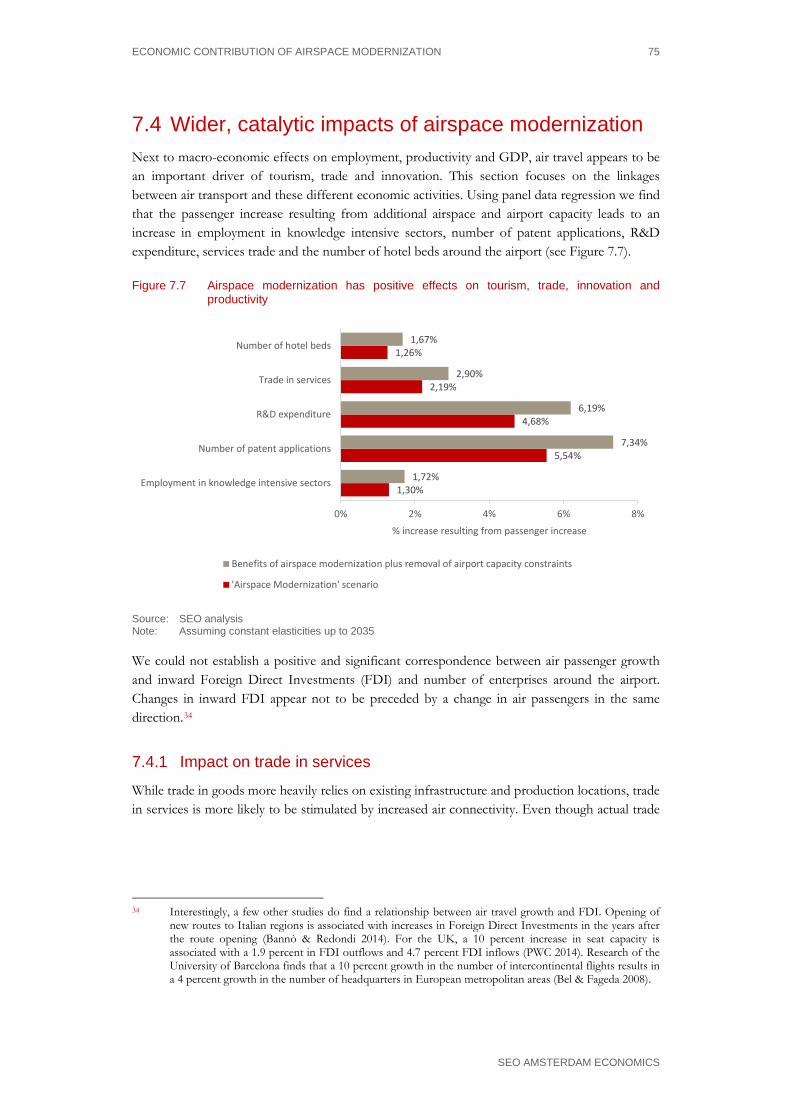
ECONOMIC CONTRIBUTION OF AIRSPACE MODERNIZATION 75
SEO AMSTERDAM ECONOMICS
7.4 Wider, catalytic impacts of airspace modernization Next to macro-economic effects on employment, productivity and GDP, air travel appears to be an important driver of tourism, trade and innovation. This section focuses on the linkages between air transport and these different economic activities. Using panel data regression we find that the passenger increase resulting from additional airspace and airport capacity leads to an increase in employment in knowledge intensive sectors, number of patent applications, R&D expenditure, services trade and the number of hotel beds around the airport (see Figure 7.7).
Figure 7.7 Airspace modernization has positive effects on tourism, trade, innovation and productivity
Source: SEO analysis Note: Assuming constant elasticities up to 2035
We could not establish a positive and significant correspondence between air passenger growth and inward Foreign Direct Investments (FDI) and number of enterprises around the airport. Changes in inward FDI appear not to be preceded by a change in air passengers in the same direction.34
7.4.1 Impact on trade in services
While trade in goods more heavily relies on existing infrastructure and production locations, trade in services is more likely to be stimulated by increased air connectivity. Even though actual trade
34 Interestingly, a few other studies do find a relationship between air travel growth and FDI. Opening of
new routes to Italian regions is associated with increases in Foreign Direct Investments in the years after the route opening (Bannò & Redondi 2014). For the UK, a 10 percent increase in seat capacity is associated with a 1.9 percent in FDI outflows and 4.7 percent FDI inflows (PWC 2014). Research of the University of Barcelona finds that a 10 percent growth in the number of intercontinental flights results in a 4 percent growth in the number of headquarters in European metropolitan areas (Bel & Fageda 2008).
1,30%
5,54%
4,68%
2,19%
1,26%
1,72%
7,34%
6,19%
2,90%
1,67%
0% 2% 4% 6% 8%
Employment in knowledge intensive sectors
Number of patent applications
R&D expenditure
Trade in services
Number of hotel beds
% increase resulting from passenger increase
Benefits of airspace modernization plus removal of airport capacity constraints
'Airspace Modernization' scenario
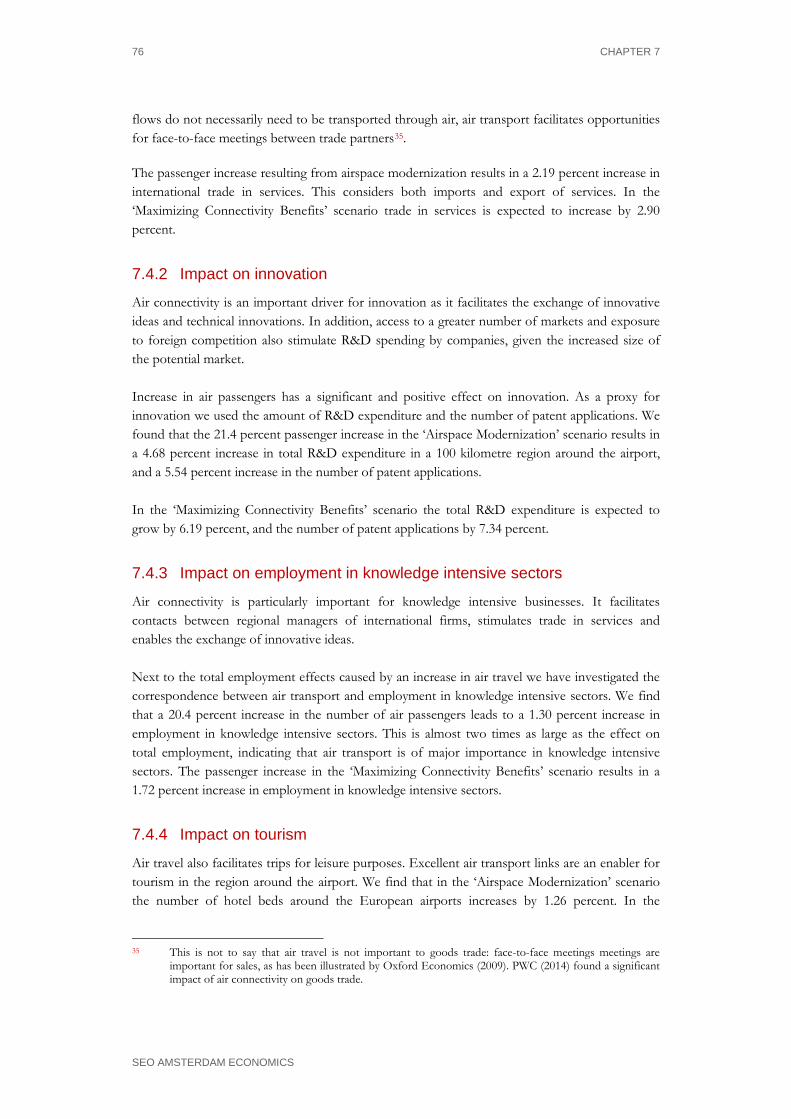
76 CHAPTER 7
SEO AMSTERDAM ECONOMICS
flows do not necessarily need to be transported through air, air transport facilitates opportunities for face-to-face meetings between trade partners35.
The passenger increase resulting from airspace modernization results in a 2.19 percent increase in international trade in services. This considers both imports and export of services. In the ‘Maximizing Connectivity Benefits’ scenario trade in services is expected to increase by 2.90 percent.
7.4.2 Impact on innovation
Air connectivity is an important driver for innovation as it facilitates the exchange of innovative ideas and technical innovations. In addition, access to a greater number of markets and exposure to foreign competition also stimulate R&D spending by companies, given the increased size of the potential market. Increase in air passengers has a significant and positive effect on innovation. As a proxy for innovation we used the amount of R&D expenditure and the number of patent applications. We found that the 21.4 percent passenger increase in the ‘Airspace Modernization’ scenario results in a 4.68 percent increase in total R&D expenditure in a 100 kilometre region around the airport, and a 5.54 percent increase in the number of patent applications. In the ‘Maximizing Connectivity Benefits’ scenario the total R&D expenditure is expected to grow by 6.19 percent, and the number of patent applications by 7.34 percent.
7.4.3 Impact on employment in knowledge intensive sectors
Air connectivity is particularly important for knowledge intensive businesses. It facilitates contacts between regional managers of international firms, stimulates trade in services and enables the exchange of innovative ideas. Next to the total employment effects caused by an increase in air travel we have investigated the correspondence between air transport and employment in knowledge intensive sectors. We find that a 20.4 percent increase in the number of air passengers leads to a 1.30 percent increase in employment in knowledge intensive sectors. This is almost two times as large as the effect on total employment, indicating that air transport is of major importance in knowledge intensive sectors. The passenger increase in the ‘Maximizing Connectivity Benefits’ scenario results in a 1.72 percent increase in employment in knowledge intensive sectors.
7.4.4 Impact on tourism
Air travel also facilitates trips for leisure purposes. Excellent air transport links are an enabler for tourism in the region around the airport. We find that in the ‘Airspace Modernization’ scenario the number of hotel beds around the European airports increases by 1.26 percent. In the
35 This is not to say that air travel is not important to goods trade: face-to-face meetings meetings are
important for sales, as has been illustrated by Oxford Economics (2009). PWC (2014) found a significant impact of air connectivity on goods trade.
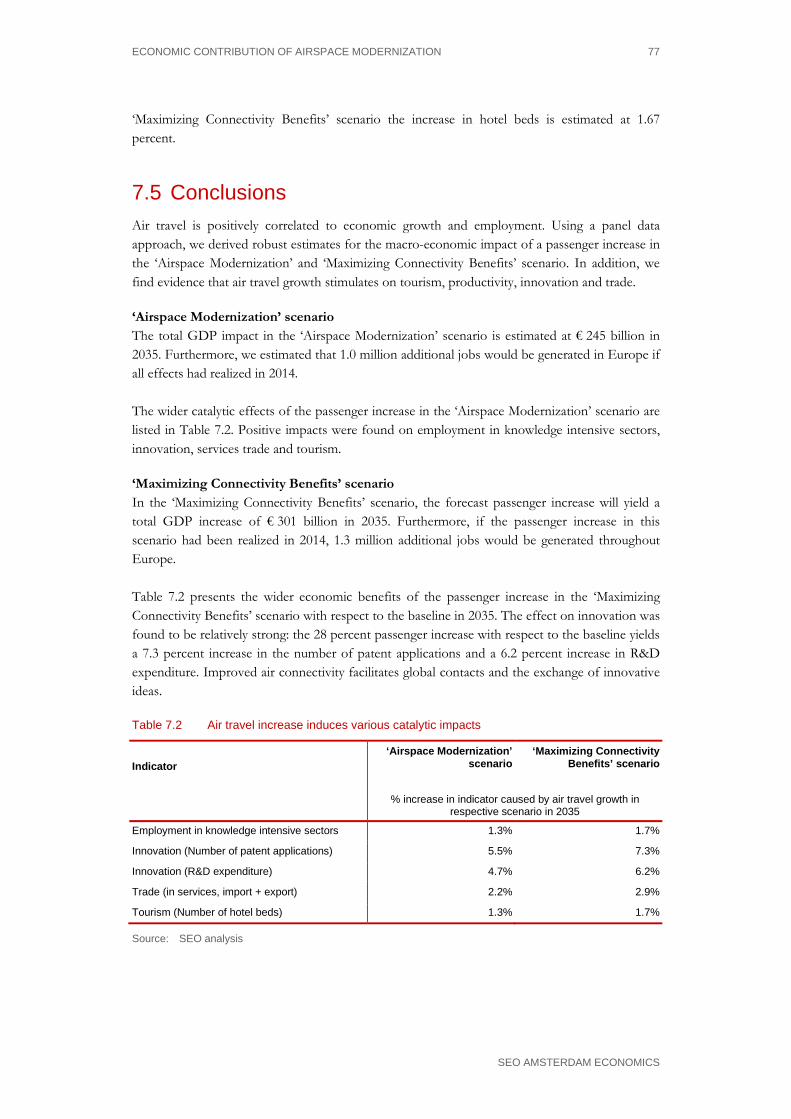
ECONOMIC CONTRIBUTION OF AIRSPACE MODERNIZATION 77
SEO AMSTERDAM ECONOMICS
‘Maximizing Connectivity Benefits’ scenario the increase in hotel beds is estimated at 1.67 percent.
7.5 Conclusions Air travel is positively correlated to economic growth and employment. Using a panel data approach, we derived robust estimates for the macro-economic impact of a passenger increase in the ‘Airspace Modernization’ and ‘Maximizing Connectivity Benefits’ scenario. In addition, we find evidence that air travel growth stimulates on tourism, productivity, innovation and trade.
‘Airspace Modernization’ scenario The total GDP impact in the ‘Airspace Modernization’ scenario is estimated at € 245 billion in 2035. Furthermore, we estimated that 1.0 million additional jobs would be generated in Europe if all effects had realized in 2014. The wider catalytic effects of the passenger increase in the ‘Airspace Modernization’ scenario are listed in Table 7.2. Positive impacts were found on employment in knowledge intensive sectors, innovation, services trade and tourism.
‘Maximizing Connectivity Benefits’ scenario In the ‘Maximizing Connectivity Benefits’ scenario, the forecast passenger increase will yield a total GDP increase of € 301 billion in 2035. Furthermore, if the passenger increase in this scenario had been realized in 2014, 1.3 million additional jobs would be generated throughout Europe. Table 7.2 presents the wider economic benefits of the passenger increase in the ‘Maximizing Connectivity Benefits’ scenario with respect to the baseline in 2035. The effect on innovation was found to be relatively strong: the 28 percent passenger increase with respect to the baseline yields a 7.3 percent increase in the number of patent applications and a 6.2 percent increase in R&D expenditure. Improved air connectivity facilitates global contacts and the exchange of innovative ideas.
Table 7.2 Air travel increase induces various catalytic impacts
Indicator ‘Airspace Modernization’
scenario
‘Maximizing Connectivity Benefits’ scenario
% increase in indicator caused by air travel growth in respective scenario in 2035
Employment in knowledge intensive sectors 1.3% 1.7%
Innovation (Number of patent applications) 5.5% 7.3%
Innovation (R&D expenditure) 4.7% 6.2%
Trade (in services, import + export) 2.2% 2.9%
Tourism (Number of hotel beds) 1.3% 1.7%
Source: SEO analysis


ECONOMIC BENEFITS OF EUROPEAN AIRSPACE MODERNIZATION 79
SEO AMSTERDAM ECONOMICS
8 Conclusions
Aviation facilitates global contacts, mobility and trade. A superior connectivity performance minimizes travel costs for passengers, business and shippers. It generates agglomeration economies, productivity gains, trade, R&D and foreign direct investment in the wider economy. However, the European air transport system is not operating at its optimum level. Modernization of European airspace is progressing slowly and airport capacity is expected to fall short of demand growth. The analysis presented in this report show the substantial economic benefits of the modernization of European airspace and capacity growth at airports in line with the underlying demand. The total present value of benefits from airspace modernization was estimated at € 126 billion, compared to a scenario without airspace modernization. If also remaing airport capacity constraints were addressed, the present value would rise to € 153 billion. These benefits are driven by more passengers that are able to travel by air, less capacity constraints shorter travel times, less delays, lower airline operating costs, lower fares and more efficient ANSPs. Airspace modernization may result in an additional GDP contribution of € 245 billion. If remaining airport capacity constraints were also addressed, this number would rise to € 301 billion. Airspace modernization and action to address airport capacity bottlenecks are key in order to enable air transport to deliver maximum value as an enabler of the European economy. If airspace modernization is not taken forward and airport capacity fails to keep up with demand, the substantial foregone economic benefits will act as a brake on European competitiveness and growth as Europe’s air connectivity fails to keep pace with those countries and regions that see air transport as a strategic priority. This would be to the detriment of consumers and businesses alike, with the impacts felt through lower trade, investment, productivity and employment.

ECONOMIC BENEFITS OF EUROPEAN AIRSPACE MODERNIZATION 81
SEO AMSTERDAM ECONOMICS
Literature
ACI Europe & SEO (2015). 2015 Airport Industry Connectivity Report. In partnership with SEO Aviation Economics.
Allroggen, F., Malina, R. (2014). Do the regional growth effects of air transport differ among
airports? Journal of Air Transport Management (37), 1-4. Allroggen, F., Wittman, M., & Malina, R. (2015). How Air Transport Connects The World: A
New Metric of Air Connectivity and Its Evolution Between 1990 And 2012. MIT International Center for Air Transportation. ICAT-2015-01.
Bannò, M., & Redondi, R. (2014). Air connectivity and foreign direct investments: economic
effects of the introduction of new routes. European Transport Research Review, 6(4), 355-363.
Baruffaldi, S. H. (2015). Three essays on the role of proximity in science and innovation (Doctoral
dissertation, École Polytechnique Fédérale de Lausanne). Bel, G., & Fageda, X. (2008). Getting there fast: globalization, intercontinental flights and
location of headquarters. Journal of Economic Geography, 8(4), 471-495. Belenkiy, M., & Riker, D. (2012). Face-to-face exports the role of business travel in trade
promotion. Journal of travel research, 51(5), 632-639. Bilotkach, V. (2015). Are airports engines of economic development? A dynamic panel data
approach. Urban Studies, 52(9), 1577-1593. Boeing (2015). Current Market Outlook 2015-2034. Boeing Commercial Airplanes, Seattle. Brueckner, J. K. (2003). Airline Traffic and Urban Economic Development. Urban Studies, 40(8),
1455-1469. Burghouwt, G., de Wit, J., Veldhuis, J., & Matsumoto, H. (2009). Air network performance and
hub competitive position: Evaluation of primary airports in East and South-East Asia. Journal of Airport Management, 3(4), 384-400.
Burghouwt, G. (2013). Airport capacity expansion strategies in the era of airline multi-hub
networks. International Transport Forum Discussion Paper 2013-5. Button, K., & Neiva, R. (2014). Economic efficiency of European air traffic control systems.
Journal of Transport Economics and Policy (JTEP), 48(1), 65-80.
82
SEO AMSTERDAM ECONOMICS
Button, K. & Yuan, J. (2013). Airfreight Transport and Economic Development: An Examination of Causality. Urban Studies, 50(2), 329-340.
Buxbaum, J., Whittome, M. & Czech, C. (2013). Statements and facts concerning the alleged low performance of European ATM. 2 December 2013. http://www.kolloquium-flugfuehrung.de/wp/wp-content/uploads/2013/12/Performance_EUR_DLR_1-01.pdf
CAA (2005). Airport regulation: price control review and consultation on policy issues. CE Delft (2008). Handbook on estimation of external costs in the transport sector. Produced
within the study Internalisation Measures and Policies for All external Cost of Transport (IMPACT). Version 1.1. Delft, February 2008.
CE Delft (2011). External costs for transport in Europe. Update study for 2008. Delft,
November 2011. Elhorst, J.P., A. Heyman, C. Koopmans & J. Oosterhaven (2004). Indirecte effecten
infrastructuurprojecten. Aanvulling op de Leidraad OEI. December 2004. Elhorst, J.P. and Oosterhaven, J. (2008). Integral cost-benefit analysis of Maglev projects under
market imperfections. Journal of Transport and Land Use 1(1), 65-87. Eurocontrol & FAA (2012). Comparison of air traffic-management related operational
performance: U.S./ Europe. Eurocontrol (2013). Challenges of Growth 2013. Task 4: European Air Traffic in 2035.
STATFOR, June 2013. Eurocontrol (2013b). Market segments in European air traffic 2013. Eurocontrol (2013c). Standard Inputs for EUROCONTROL Cost Benefit Analyses. Edition
Number 6.0. September 2013. Eurocontrol (2014). CODA digest. All-causes delay and cancellations to air transport in Europe –
2014. Eurocontrol (2015). Eurocontrol Seven-Year Forecast. Flight Movements and Service Units
2015-2021. STATFOR, February 2015. Eurocontrol (2015b). Monthly network operations report. Analysis September 2015. Forsyth, P. (2013). Airport capacity for Sydney. OECD/ITF Discussion paper no. 2013-02. Forsyth, P. (2014). Using CBA and CGE in investment and policy evaluation: a synthesis.
Working paper, March 2014.
LITERATURE 83
SEO AMSTERDAM ECONOMICS
Frontier Economics (2014). Impact of airport expansion options on competition and choice. A report prepared for Heathrow Airport Ltd, April 2014.
Gillen, D. W., Morrison, W. G. & Stewart, C. (2008). Air Travel Demand Elasticities: Concepts,
Issues and Measurement. Green, R. K. (2007). Airports and Economic Development. Real Estate Economics, 35(1), 91-112. Heemskerk, L. and J. Veldhuis (2006a). Measuring Airline Network Quality: Analytical
Framework. ATRS Conference paper. Heemskerk, L. and J. Veldhuis (2006b). Measuring Airline Network Quality: Applications and
Results. ATRS Conference paper. HM Treasury (2011). The Green Book. Appraisal and Evaluation in Central Government. July
2011. Hovhannisyan, N., & Keller, W. (2010). International business travel: an engine of innovation?.
Journal of Economic Growth, 20(1), 75-104. IATA (2007a). Estimating Air Travel Demand Elasticities. Report prepared by InterVISTAS
Consulting Inc. IATA (2007b). Aviation Economic Benefits. Report prepared by InterVISTAS Consulting Inc. IATA (2013). Inefficiency in European airspace. IATA Economic Briefing, December 2013. InterVISTAS (2015). Economic impact European airports. A critical catalyst to economic
growth. Prepared for ACI Europe, January 2015. Koopmans, C. & P. Rietveld (2013). Long-term impacts of mega-projects: the discount rate. In:
Priemus, H., Van Wee, B. (eds.) International handbook on mega-projects, Edward Elgar Publishing Ltd, 313-332.
Malina, R. & C. Wollersheim (2007). Measuring the regional economic impact of airports: a
comparative analysis of different methodological approaches, Proceedings of the 11th Annual World Conference of the Air Transport Research Society, Berkeley, USA., June 21-24 2007.
Mukkala, K. & Tervo, H. (2012). Air transportation and regional growth: which way does the
causality run? ESRA 2012 Congress, 21-25 August 2012, Bratislava, Slovakia. Mott MacDonald (2006). PRISM input to Eddington study. M6 hard shoulder running test.
Impact on the economy. March 2006.
84
SEO AMSTERDAM ECONOMICS
NEXTOR (2010). Total delay impact study. A Comprehensive Assessment of the Costs and Impacts of Flight Delay in the United States. Final report- October 2010.
Oxford Economics U.S.A. (2009). The return on investment of U.S. business travel. September
2009. Poort, J. P. (2000). Hub- of spokestad? Regionaal-economische effecten van luchthavens.
NYFER, Breukelen. PRC (2015). Performance review report. An assessment of air traffic management in Europe
during the calendar year 2014. PWC (2014). Airports Commission. 2. Economy: wider impacts assessment. November 2014. Ricardo-AEA (2014). Update of the Handbook on External Costs of Transport. Final Report.
January 2014. Rouwendal, J. (2012). Indirect effects in cost-benefit analysis. Journal of Cost-Benefit Analysis
3(1) 1-27. SACTRA (1999). Transport and the economy: full report. SESAR (2009). European Air Traffic Management Master Plan. Edition 1, 30 March 2009. SESAR (2015). European ATM Master Plan. 2015 Edition. Draft version, July 2015. SESAR JU (2011). Assessing the macroeconomic impact of SESAR. Final report. June 2011. Starkie, D. (2004). Testing the regulatory model: the expansion of Stansted Airport. Fiscal Studies
25(4), 389-413. Sultana, J. (2015). The network manager perspective. SES vision workshop, 5 May 2015. University of Westminster (2015). The cost of passenger delay to airlines in Europe. Consultation
document. Venables, A.J. and Gasiorek, M. (1999). The welfare implications of transport investments in the
presence of market failure. Report to the standing advisory committee on trunk road assessment. Department of the Environment, Transport and the Regions: London.
Veldhuis, J. and Lieshout, R. (2009). Estimating the Attractiveness of Airlines and Airports on a
Route Base Level. Working Paper, SEO Economic Research. Vickerman, R. (2007a). Recent evolution of research into the wider economic benefits of
transport infrastructure investments. OECD/ITF Discussion paper no. 2007-9.
LITERATURE 85
SEO AMSTERDAM ECONOMICS
Vickerman, R. (2007b). Cost-benefit analysis and large-scale infrastructure projects: state of the art and challenges. Environment and Planning B 34, 598-610.
United Nations Conference on Trade And Development (UNCTAD):
http://unctadstat.unctad.org/wds/ReportFolders/reportFolders.aspx . Accessed 12-10-2015.
Weitzman, M.L. (1998). Why the far-distant future should be discounted at its lowest possible rate. Journal of Environmental Economics and Management, 36(3), 201-208.
Weitzman, M.L. (2009). On modelling and interpreting the economics of catastrophic climate
change. Review of Economics and Statistics, 91(1), 1-19. World Trade Organisation (WTO):
hhtp://stat.wto.org/StatisticalProgram/WSDBStatProgramSeries.aspx. Accessed 12-10-2015
Zhuang, J., Liang, Z., Lin, T. & De Guzman, F. (2007). Theory and Practice in the Choice of
Social Discount Rate for Cost-Benefit Analysis: A Survey. Asian Development Bank, May 2007.


ECONOMIC BENEFITS OF EUROPEAN AIRSPACE MODERNIZATION 87
SEO AMSTERDAM ECONOMICS
Glossary
ANS Air Navigation Service ANSP Air Navigation Service Provider ATC Air Traffic Control ATFM Air Traffic Flow Management ATM Air Traffic Management CBA Cost-Benefit Analysis CH4 Methane CNU NetScan Connectivity Units CO2 Carbon Dioxide EC European Commission ESRA Eurocontrol Statistical Reference Area FAB Functional Airspace Block FABEC Functional Airspace Block Europe Central FRA Free Route Airspace FDI Foreign Direct Investment GDP Gross Domestic Product IFR Instrumental Flight Rules KPI Key Performance Indicators LCC Low Cost Carrier N2O Nitrous Oxide NEFAB North European Functional Airspace Block NMOC Network Management Operations Centre NOx Nitrogen NPV Net Present Value OAG Official Airline Guide OD Origin - Destination P Price PAX Passengers PaxIS IATA Passenger Intelligence Service PM Particulate Matter PPP Purchasing Power Parity Q Demand R&D Research and Development RPK Revenue Passenger Kilometres S Supply SCBA Social Cost Benefit Analysis SES Single European Sky SESAR Single European Sky ATM Research SESAR JU Single European Sky ATM Research Joint Undertaking SESAR ATM Single European Sky ATM Research Air Traffic Management SO2 Sulfur Dioxide TMA Terminal Control Area VOC Volatile Organic Compounds

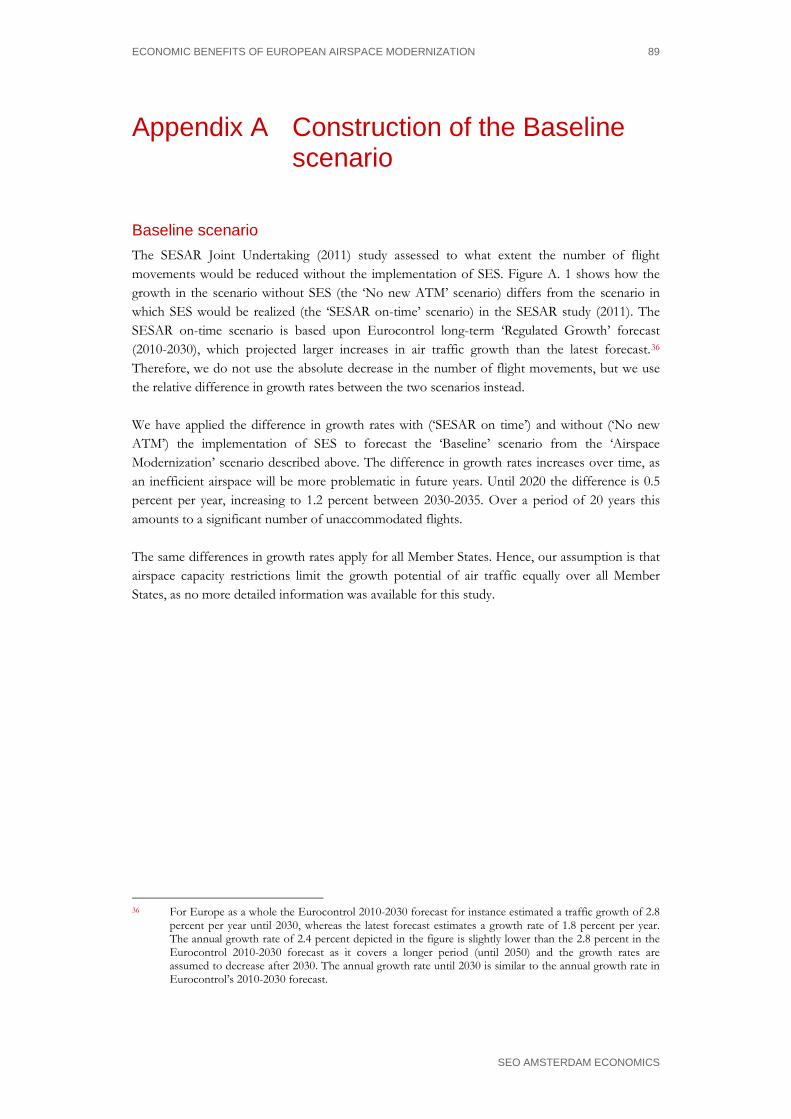
ECONOMIC BENEFITS OF EUROPEAN AIRSPACE MODERNIZATION 89
SEO AMSTERDAM ECONOMICS
Appendix A Construction of the Baseline scenario
Baseline scenario The SESAR Joint Undertaking (2011) study assessed to what extent the number of flight movements would be reduced without the implementation of SES. Figure A. 1 shows how the growth in the scenario without SES (the ‘No new ATM’ scenario) differs from the scenario in which SES would be realized (the ‘SESAR on-time’ scenario) in the SESAR study (2011). The SESAR on-time scenario is based upon Eurocontrol long-term ‘Regulated Growth’ forecast (2010-2030), which projected larger increases in air traffic growth than the latest forecast.36 Therefore, we do not use the absolute decrease in the number of flight movements, but we use the relative difference in growth rates between the two scenarios instead. We have applied the difference in growth rates with (‘SESAR on time’) and without (‘No new ATM’) the implementation of SES to forecast the ‘Baseline’ scenario from the ‘Airspace Modernization’ scenario described above. The difference in growth rates increases over time, as an inefficient airspace will be more problematic in future years. Until 2020 the difference is 0.5 percent per year, increasing to 1.2 percent between 2030-2035. Over a period of 20 years this amounts to a significant number of unaccommodated flights. The same differences in growth rates apply for all Member States. Hence, our assumption is that airspace capacity restrictions limit the growth potential of air traffic equally over all Member States, as no more detailed information was available for this study.
36 For Europe as a whole the Eurocontrol 2010-2030 forecast for instance estimated a traffic growth of 2.8
percent per year until 2030, whereas the latest forecast estimates a growth rate of 1.8 percent per year. The annual growth rate of 2.4 percent depicted in the figure is slightly lower than the 2.8 percent in the Eurocontrol 2010-2030 forecast as it covers a longer period (until 2050) and the growth rates are assumed to decrease after 2030. The annual growth rate until 2030 is similar to the annual growth rate in Eurocontrol’s 2010-2030 forecast.
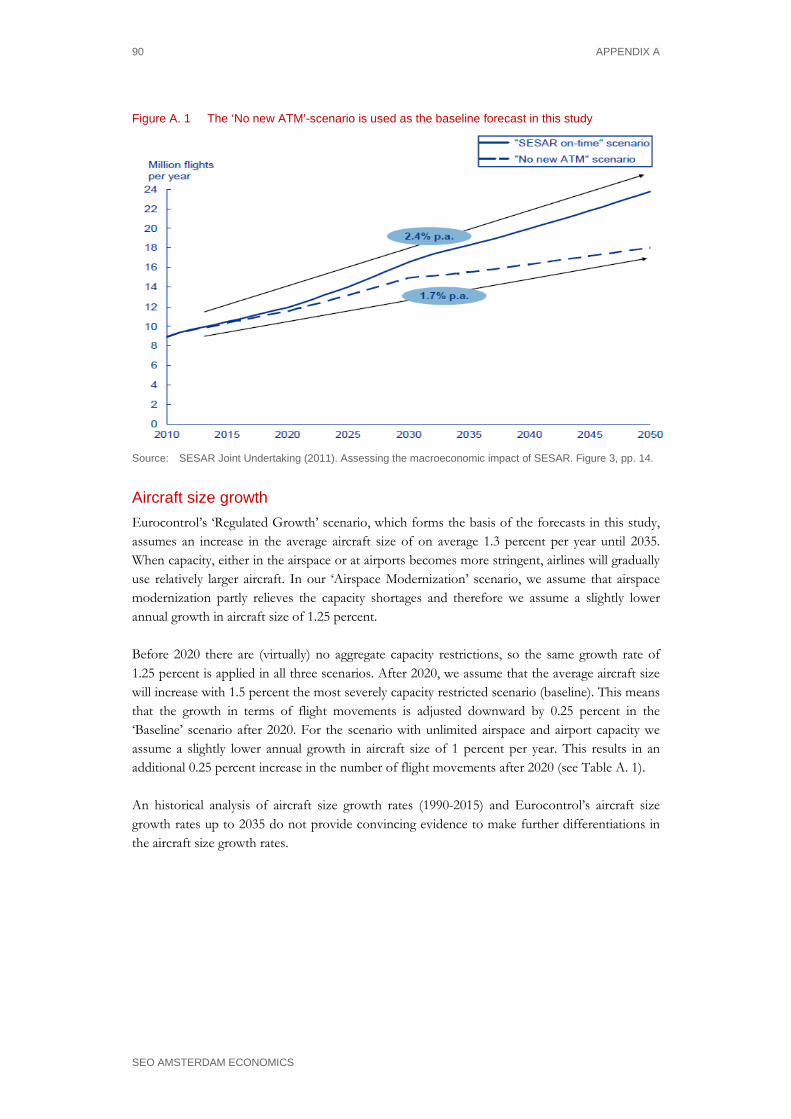
90 APPENDIX A
SEO AMSTERDAM ECONOMICS
Figure A. 1 The ‘No new ATM’-scenario is used as the baseline forecast in this study
Source: SESAR Joint Undertaking (2011). Assessing the macroeconomic impact of SESAR. Figure 3, pp. 14.
Aircraft size growth Eurocontrol’s ‘Regulated Growth’ scenario, which forms the basis of the forecasts in this study, assumes an increase in the average aircraft size of on average 1.3 percent per year until 2035. When capacity, either in the airspace or at airports becomes more stringent, airlines will gradually use relatively larger aircraft. In our ‘Airspace Modernization’ scenario, we assume that airspace modernization partly relieves the capacity shortages and therefore we assume a slightly lower annual growth in aircraft size of 1.25 percent. Before 2020 there are (virtually) no aggregate capacity restrictions, so the same growth rate of 1.25 percent is applied in all three scenarios. After 2020, we assume that the average aircraft size will increase with 1.5 percent the most severely capacity restricted scenario (baseline). This means that the growth in terms of flight movements is adjusted downward by 0.25 percent in the ‘Baseline’ scenario after 2020. For the scenario with unlimited airspace and airport capacity we assume a slightly lower annual growth in aircraft size of 1 percent per year. This results in an additional 0.25 percent increase in the number of flight movements after 2020 (see Table A. 1). An historical analysis of aircraft size growth rates (1990-2015) and Eurocontrol’s aircraft size growth rates up to 2035 do not provide convincing evidence to make further differentiations in the aircraft size growth rates.

CONSTRUCTION OF THE BASELINE SCENARIO 91
SEO AMSTERDAM ECONOMICS
Table A. 1 Aircraft size increases stronger when capacity is restricted
Scenario Annual growth in aircraft size
2014-2020 2020-2035 Baseline 1.25% 1.50% Airspace modernization 1.25% 1.25% Maximizing connectivity 1.25% 1.00%
Source: SEO analysis

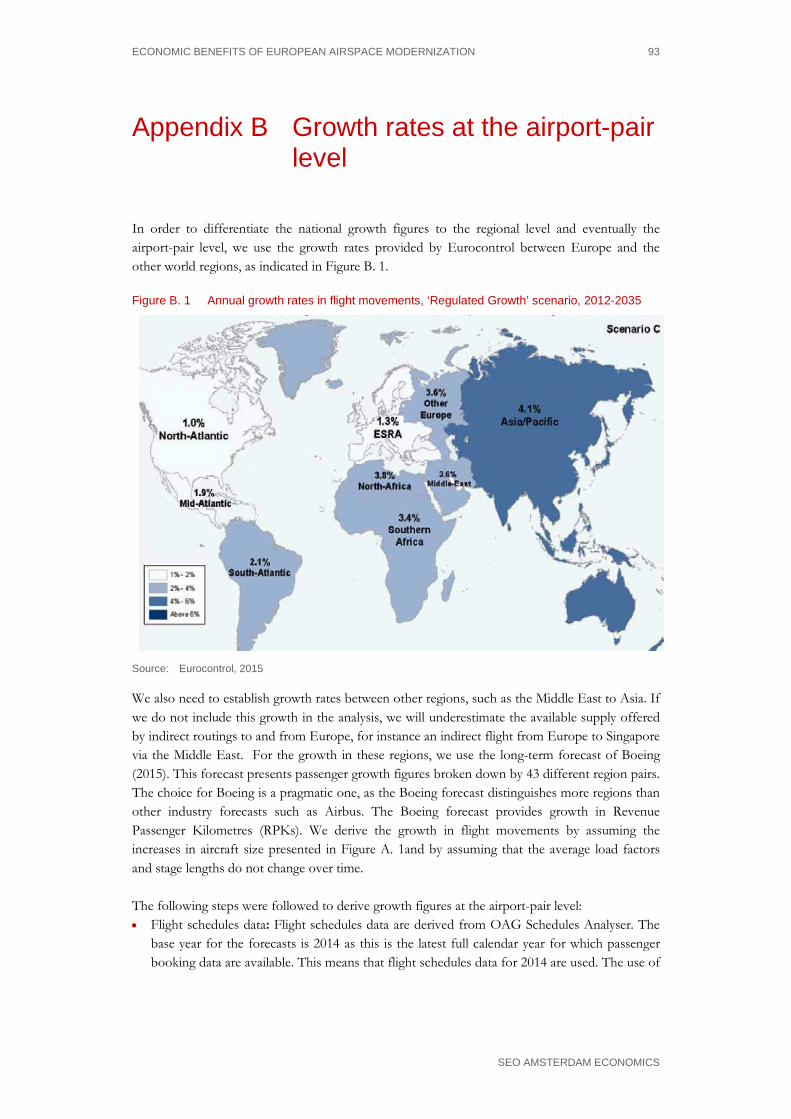
ECONOMIC BENEFITS OF EUROPEAN AIRSPACE MODERNIZATION 93
SEO AMSTERDAM ECONOMICS
Appendix B Growth rates at the airport-pair level
In order to differentiate the national growth figures to the regional level and eventually the airport-pair level, we use the growth rates provided by Eurocontrol between Europe and the other world regions, as indicated in Figure B. 1.
Figure B. 1 Annual growth rates in flight movements, ‘Regulated Growth’ scenario, 2012-2035
Source: Eurocontrol, 2015
We also need to establish growth rates between other regions, such as the Middle East to Asia. If we do not include this growth in the analysis, we will underestimate the available supply offered by indirect routings to and from Europe, for instance an indirect flight from Europe to Singapore via the Middle East. For the growth in these regions, we use the long-term forecast of Boeing (2015). This forecast presents passenger growth figures broken down by 43 different region pairs. The choice for Boeing is a pragmatic one, as the Boeing forecast distinguishes more regions than other industry forecasts such as Airbus. The Boeing forecast provides growth in Revenue Passenger Kilometres (RPKs). We derive the growth in flight movements by assuming the increases in aircraft size presented in Figure A. 1and by assuming that the average load factors and stage lengths do not change over time. The following steps were followed to derive growth figures at the airport-pair level: • Flight schedules data: Flight schedules data are derived from OAG Schedules Analyser. The
base year for the forecasts is 2014 as this is the latest full calendar year for which passenger booking data are available. This means that flight schedules data for 2014 are used. The use of

94 APPENDIX B
SEO AMSTERDAM ECONOMICS
scheduled data in combination with passenger booking data implies that our results relate to scheduled passenger traffic. We do not take into account non-scheduled traffic (such as business aviation or military aviation) or all-cargo flights.
• The worldwide aviation network for 2014 is the basis of our forecasting analysis. All commercial scheduled passenger flights are included at the airport-pair level, containing information on aircraft type, seat capacity, frequency and flight time.
• We extrapolate the network of 2014 to 2035, using the various growth rates, at the most detailed regional level available. The extrapolation results in a network in the year of the forecast horizon.
• Next, we sum the flight frequencies to the country level to obtain the total number of flights for each of the ESRA08 Member States. However, this number differs from the number based on the Eurocontrol forecasts. From the two forecasts we derive scaling factors for each country.
• These scaling factors are then applied to the projected frequencies for each airport-pair. This results in differentiated growth rates for airport-pairs, yet the total growth rates for each ESRA08 Member State corresponds to the growth rates derived above (see Appendix F).
ECONOMIC BENEFITS OF EUROPEAN AIRSPACE MODERNIZATION 95
SEO AMSTERDAM ECONOMICS
Appendix C NetCost model
The NetCost model has been used to calculate consumer benefits. The model uses OAG schedule data for all direct and indirect alternatives to determine generalized costs and market shares for individual markets. The NetCost model was first presented in Heemskerk and Veldhuis (2006a, 2006b) and developed by Veldhuis and Lieshout (2009). NetCost has been used to compute generalized travel costs in the three different scenarios. NetCost allows to compute the average decrease in travel costs per passenger and welfare impacts. Welfare effects are determined using a four-step approach: 1. Construct airline networks in the ‘Baseline’, ‘Airspace Modernization’ and ‘Maximizing
Connectivity Benefits’ scenarios for 2025 and 2035, based on OAG schedule data and passenger growth forecasts as described in chapter 3.
2. Determine generalized travel costs and consumer utility in each scenario using the NetCost price model.
3. Using price elasticities for business and leisure, compute the change in generalized travel costs between the baseline and reference scenario. This results in total consumer welfare benefits per passenger.
4. Break down the consumer benefits into time savings, cost savings, connectivity and capacity components.
Construction of future airline networks Using the passenger forecasts as described in chapter 3, the 2014 airline network has been extrapolated to the horizon years. For each European airport, a network for 2025 and 2035 has been forecasted. These networks are created by increasing the seat capacity offered in 2014 in line with annual passenger growth rates in the respective scenarios, taking into account aircraft size growth figures for each scenario. The NetCost model also requires a ‘beyond-network’ for the horizon years to incorporate indirect travel alternatives to final destinations. This ‘beyond-network’ consists of all destinations that can be reached from Europe with a connection at an intermediate hub airport. Direct and indirect travel alternatives are used to determine the competition level in an OD market, which is an input variable for the fare model. For the extrapolation of the beyond network growth figures from non-European airports are also required. For these airports we apply growth figures as published by Boeing (2015).
Calculating generalized travel costs and consumer value Generalized travel costs comprise of a fare, time and frequency component (Figure C. 1). Time costs are calculated using Values of Travel Time for each European country for business and leisure passengers, multiplied by the travel time of the respective route alternative. For indirect connections an average transfer time of 2.5 hours is assumed. The frequency component denotes costs resulting from schedule delay. Schedule delay is the difference between the departure time preferred by the passenger and the actual departure time.
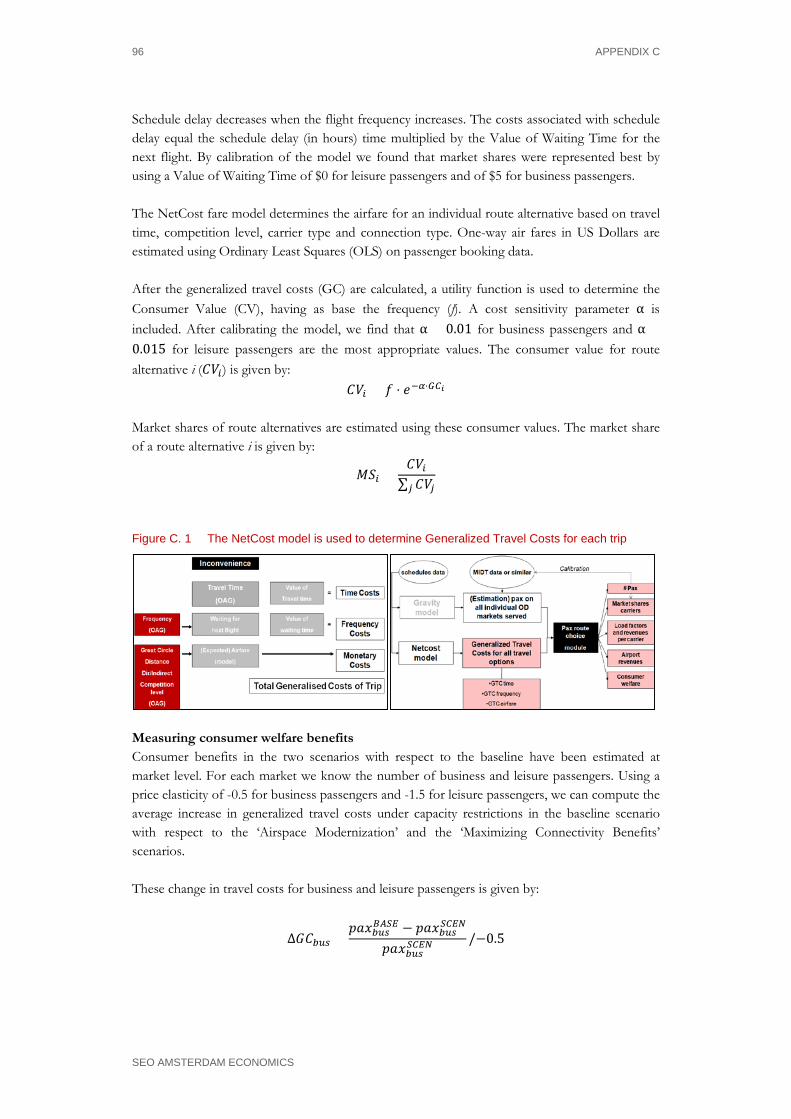
96 APPENDIX C
SEO AMSTERDAM ECONOMICS
Schedule delay decreases when the flight frequency increases. The costs associated with schedule delay equal the schedule delay (in hours) time multiplied by the Value of Waiting Time for the next flight. By calibration of the model we found that market shares were represented best by using a Value of Waiting Time of $0 for leisure passengers and of $5 for business passengers. The NetCost fare model determines the airfare for an individual route alternative based on travel time, competition level, carrier type and connection type. One-way air fares in US Dollars are estimated using Ordinary Least Squares (OLS) on passenger booking data. After the generalized travel costs (GC) are calculated, a utility function is used to determine the Consumer Value (CV), having as base the frequency (f). A cost sensitivity parameter α is included. After calibrating the model, we find that α = 0.01 for business passengers and α =0.015 for leisure passengers are the most appropriate values. The consumer value for route alternative i (𝐶𝐶𝑉𝑉𝑖𝑖) is given by:
𝐶𝐶𝑉𝑉𝑖𝑖 = 𝑓𝑓 ⋅ 𝑒𝑒−𝛼𝛼⋅𝐺𝐺𝐶𝐶𝑖𝑖 Market shares of route alternatives are estimated using these consumer values. The market share of a route alternative i is given by:
𝑀𝑀𝑆𝑆𝑖𝑖 =𝐶𝐶𝑉𝑉𝑖𝑖∑ 𝐶𝐶𝑉𝑉𝑗𝑗𝑗𝑗
Figure C. 1 The NetCost model is used to determine Generalized Travel Costs for each trip
Measuring consumer welfare benefits Consumer benefits in the two scenarios with respect to the baseline have been estimated at market level. For each market we know the number of business and leisure passengers. Using a price elasticity of -0.5 for business passengers and -1.5 for leisure passengers, we can compute the average increase in generalized travel costs under capacity restrictions in the baseline scenario with respect to the ‘Airspace Modernization’ and the ‘Maximizing Connectivity Benefits’ scenarios. These change in travel costs for business and leisure passengers is given by:
∆𝐺𝐺𝐶𝐶𝑏𝑏𝑏𝑏𝑏𝑏 =𝑝𝑝𝑝𝑝𝑥𝑥𝑏𝑏𝑏𝑏𝑏𝑏𝐵𝐵𝐵𝐵𝐵𝐵𝐵𝐵 − 𝑝𝑝𝑝𝑝𝑥𝑥𝑏𝑏𝑏𝑏𝑏𝑏𝐵𝐵𝐶𝐶𝐵𝐵𝑆𝑆
𝑝𝑝𝑝𝑝𝑥𝑥𝑏𝑏𝑏𝑏𝑏𝑏𝐵𝐵𝐶𝐶𝐵𝐵𝑆𝑆 /−0.5
NETCOST MODEL 97
SEO AMSTERDAM ECONOMICS
∆𝐺𝐺𝐶𝐶𝑙𝑙𝑙𝑙𝑖𝑖𝑏𝑏 =𝑝𝑝𝑝𝑝𝑥𝑥𝑙𝑙𝑙𝑙𝑖𝑖𝑏𝑏𝐵𝐵𝐵𝐵𝐵𝐵𝐵𝐵 − 𝑝𝑝𝑝𝑝𝑥𝑥𝑙𝑙𝑙𝑙𝑖𝑖𝑏𝑏𝐵𝐵𝐶𝐶𝐵𝐵𝑆𝑆
𝑝𝑝𝑝𝑝𝑥𝑥𝑙𝑙𝑙𝑙𝑖𝑖𝑏𝑏𝐵𝐵𝐶𝐶𝐵𝐵𝑆𝑆 /−1.5
The difference in generalized travel costs between the two scenarios gives us the welfare gain per passenger in each market. We compute the total consumer welfare benefit for each OD market by applying the rule of half: the welfare gain per passenger is multiplied by the number of OD-passengers in the respective market in the baseline scenario. The number of new passengers – which do not travel in the baseline scenario but do travel in the less constrained scenario – is multiplied by half of the welfare gain per passenger.
Breaking down consumer benefits into different components Using NetCost, the average generalized travel costs per passenger can be computed for all three scenarios, for each individual OD market. These generalized cost changes denote the combined consumer welfare effects through connectivity increases, time savings and cost savings. Effects of individual components can be determined by calculating consumer values separately while only applying one of the three components of the benefits. These generalized costs savings may not add up to the total consumer benefits measured in the previous step. In a capacity constraint scenario, the number of passengers might be limited through capacity constraints, while demand given the cost level would be higher. In this case, fares will increase. When capacity increases through airspace modernization or airport capacity expansion, passengers will also benefit from a decrease in fares. The values are given by subtracting the generalized cost changes from the connectivity, time and cost savings from the total generalized cost change. These are referred to as ‘capacity effects’ in the report.

ECONOMIC BENEFITS OF EUROPEAN AIRSPACE MODERNIZATION 99
SEO AMSTERDAM ECONOMICS
Appendix D Values of Time
For the European Union, we use the values of time from the harmonized guidelines for evaluating costs and benefits of transport investments and policies (HEATCO, 2004). These guidelines were commissioned by the European Commission and provide for each EU Member State the values of times for air passengers. Separate values are given for leisure and business passengers.37 The values were converted to current price levels using consumer price indices for each Member State provided by Eurostat. For the countries that do not belong to the EU, we estimate the values of time for leisure and business passengers based on the formula given by the ‘Handbook on estimation of external costs in the transport sector’ (CE Delft, 2008), which was commissioned by the European Commission:
𝑉𝑉𝑝𝑝𝑉𝑉𝑉𝑉𝑒𝑒 𝑜𝑜𝑓𝑓 𝑇𝑇𝑇𝑇𝑇𝑇𝑒𝑒 𝑐𝑐𝑐𝑐𝑏𝑏𝑐𝑐𝑐𝑐𝑐𝑐𝑐𝑐,𝑚𝑚𝑐𝑐𝑐𝑐𝑖𝑖𝑚𝑚𝑙𝑙 = 𝑉𝑉𝑝𝑝𝑉𝑉𝑉𝑉𝑒𝑒 𝑜𝑜𝑓𝑓 𝑇𝑇𝑇𝑇𝑇𝑇𝑒𝑒 𝐵𝐵𝐸𝐸,𝑚𝑚𝑐𝑐𝑐𝑐𝑖𝑖𝑚𝑚𝑙𝑙 × �𝐺𝐺𝐺𝐺𝐺𝐺 𝑝𝑝𝑙𝑙𝑐𝑐 𝑐𝑐𝑐𝑐𝑝𝑝𝑖𝑖𝑐𝑐𝑐𝑐 𝑖𝑖𝑐𝑐 𝐺𝐺𝐺𝐺𝐺𝐺 𝑐𝑐𝑐𝑐𝑐𝑐𝑐𝑐𝑐𝑐𝑐𝑐𝑐𝑐
𝐺𝐺𝐺𝐺𝐺𝐺 𝑝𝑝𝑙𝑙𝑐𝑐 𝑐𝑐𝑐𝑐𝑝𝑝𝑖𝑖𝑐𝑐𝑐𝑐 𝑖𝑖𝑐𝑐 𝐺𝐺𝐺𝐺𝐺𝐺 𝐸𝐸𝐸𝐸�1.0
This formula takes the average 𝑉𝑉𝑝𝑝𝑉𝑉𝑉𝑉𝑒𝑒 𝑜𝑜𝑓𝑓 𝑇𝑇𝑇𝑇𝑇𝑇𝑒𝑒 𝐵𝐵𝐸𝐸,𝑚𝑚𝑐𝑐𝑐𝑐𝑖𝑖𝑚𝑚𝑙𝑙 in all EU Member States for both travel motives and corrects it for the relative size of a country’s GDP per capita in purchasing-power-parities (PPPs) (𝐺𝐺𝐺𝐺𝐺𝐺 𝑝𝑝𝑒𝑒𝑝𝑝 𝑐𝑐𝑝𝑝𝑝𝑝𝑇𝑇𝑐𝑐𝑝𝑝 𝑇𝑇𝑖𝑖 𝐺𝐺𝐺𝐺𝐺𝐺 𝑐𝑐𝑐𝑐𝑏𝑏𝑐𝑐𝑐𝑐𝑐𝑐𝑐𝑐) compared to the EU average (𝐺𝐺𝐺𝐺𝐺𝐺 𝑝𝑝𝑒𝑒𝑝𝑝 𝑐𝑐𝑝𝑝𝑝𝑝𝑇𝑇𝑐𝑐𝑝𝑝 𝑇𝑇𝑖𝑖 𝐺𝐺𝐺𝐺𝐺𝐺 𝐵𝐵𝐸𝐸). The average value of time in the EU is given by the HEATCO study mentioned above for both business and leisure passengers. These valuations were also converted to current levels using Eurostat consumer price indices. The GDP per capita values (in PPPs) for individual countries and for the EU as a whole are given by IMF’s World Economic Outlook Database. To obtain the average value of time on a specific travel alternative, one calculates the weighted average value of time based on the distribution of OD passengers according to their nationality. The actual distribution of passengers was not available for this study. Therefore, we assume that half of the OD passengers on a travel alternative consists of passengers that are citizens of the origin country and the other half consists of passengers of the destination country. As we estimate the welfare impacts for European consumers, the values of time for non-Europeans are not relevant.
37 For leisure passengers a further distinction is made into passengers commuting over short and long
distance and non-commuting passengers over short and long distance. In this study short distance is defined as a travel distance below 50 kilometres. We take the values for non-commuting passengers travelling long distance, as most leisure passengers are non-commuting and all air trips are longer than 50 kilometres.

ECONOMIC BENEFITS OF EUROPEAN AIRSPACE MODERNIZATION 101
SEO AMSTERDAM ECONOMICS
Appendix E Discounting
Comparing costs and benefits occurring at different points in time is not simply a matter of adding or subtracting. It is generally believed that the further a benefit or cost is pushed into the future, the less it is worth today. This consideration needs to be incorporated into calculations of net benefits. The process of reducing the value of benefits or costs occurring in the future is called discounting. This is generally done by multiplying costs or benefits by a fractional number depending on how far in the future they occur. Discounted values from each year of a project’s life are added up to calculate the project’s net present value. Costs or benefits occurring further in the future are discounted more heavily while those occurring closer to the present are discounted less heavily. Most countries (and the EU) have a proscribed discount rate, in order to prevent comparisons between policy options being obscured by the impact of different discount rates. The discount rate is usually based on a rate of interest. Over the last decades discount rates used in SCBA have generally declined. The discount rate in the UK was reduced from 6 to 3.5 percent in 2003. Germany reduced its social discount rate from 4 to 3 percent in 2004 and France reduced its rate from 8 to 4 percent in 2005. This reflects falling interest rates, as most countries use the rate at which they borrow money as the basis for calculating discount rates (Koopmans & Rietveld 2013). The European Commission and Eurocontrol (2013c) recommend using a social discount rate of 4 percent. Many environmental effects, especially climate change impacts, occur in the very long run. Over such long periods of time, much is uncertain about the impacts, but also about the appropriate discount rate (Koopmans & Rietveld 2013). Weitzman (2009) indicates that long-term climate risks are very hard to assess, but they are potentially so large that they might have a stronger impact than discounting using standard discount rates. Weitzman (1998) also shows that in case of uncertainty about the discount rate, the lowest rate is the most appropriate. Some countries apply discount rates that decrease over time, which corresponds to incorporating increased risk. In the United Kingdom the rate falls steady from 3.5 percent in the first 30 years to 1 percent for effects that occur more than 300 years into the future (HM Treasury 2011). According to the EU, “such a reducing rate better reflects individuals' perceptions, uncertainties about the economy in the future and the concerns that constant-rate discounting shifts unfair burdens of social cost onto future generations”. The US Environmental Agency recommends that for intergenerational discounting, a rate of 2–3 percent is used (Zhuang et al. 2007). CE Delft (2011) uses a 3 percent discount rate for CO2-emissions. We apply the discount rate of 4 percent recommended by the EC and Eurocontrol for all impacts, except the environmental effects. Because of their long-term and uncertain impacts we shall apply a lower rate of 3 percent for the CO2-effects, which corresponds to values used by the US Environmental Agency (Zhuang et al., 2007) and CE Delft (2011).

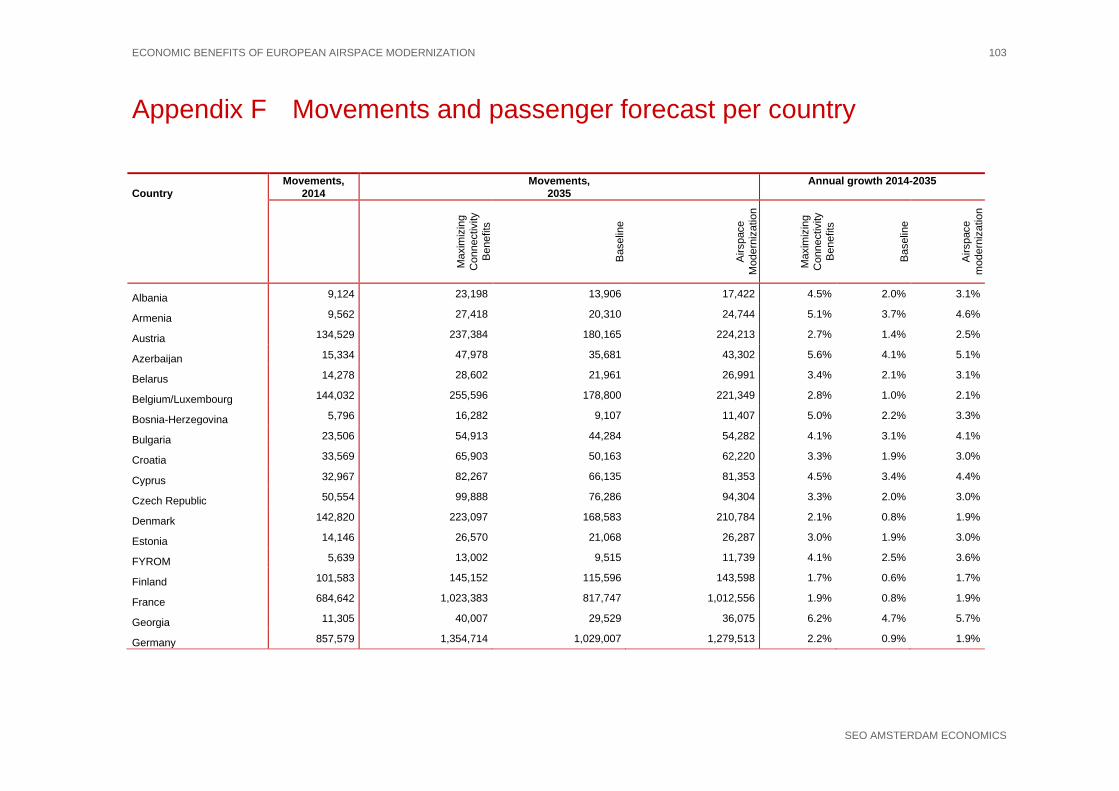
ECONOMIC BENEFITS OF EUROPEAN AIRSPACE MODERNIZATION 103
SEO AMSTERDAM ECONOMICS
Appendix F Movements and passenger forecast per country
Country Movements,
2014 Movements,
2035 Annual growth 2014-2035
Max
imiz
ing
Con
nect
ivity
B
enef
its
Bas
elin
e
Airs
pace
M
oder
niza
tion
Max
imiz
ing
Con
nect
ivity
B
enef
its
Bas
elin
e
Airs
pace
m
oder
niza
tion
Albania 9,124 23,198 13,906 17,422 4.5% 2.0% 3.1%
Armenia 9,562 27,418 20,310 24,744 5.1% 3.7% 4.6%
Austria 134,529 237,384 180,165 224,213 2.7% 1.4% 2.5%
Azerbaijan 15,334 47,978 35,681 43,302 5.6% 4.1% 5.1%
Belarus 14,278 28,602 21,961 26,991 3.4% 2.1% 3.1%
Belgium/Luxembourg 144,032 255,596 178,800 221,349 2.8% 1.0% 2.1%
Bosnia-Herzegovina 5,796 16,282 9,107 11,407 5.0% 2.2% 3.3%
Bulgaria 23,506 54,913 44,284 54,282 4.1% 3.1% 4.1%
Croatia 33,569 65,903 50,163 62,220 3.3% 1.9% 3.0%
Cyprus 32,967 82,267 66,135 81,353 4.5% 3.4% 4.4%
Czech Republic 50,554 99,888 76,286 94,304 3.3% 2.0% 3.0%
Denmark 142,820 223,097 168,583 210,784 2.1% 0.8% 1.9%
Estonia 14,146 26,570 21,068 26,287 3.0% 1.9% 3.0%
FYROM 5,639 13,002 9,515 11,739 4.1% 2.5% 3.6%
Finland 101,583 145,152 115,596 143,598 1.7% 0.6% 1.7%
France 684,642 1,023,383 817,747 1,012,556 1.9% 0.8% 1.9%
Georgia 11,305 40,007 29,529 36,075 6.2% 4.7% 5.7%
Germany 857,579 1,354,714 1,029,007 1,279,513 2.2% 0.9% 1.9%
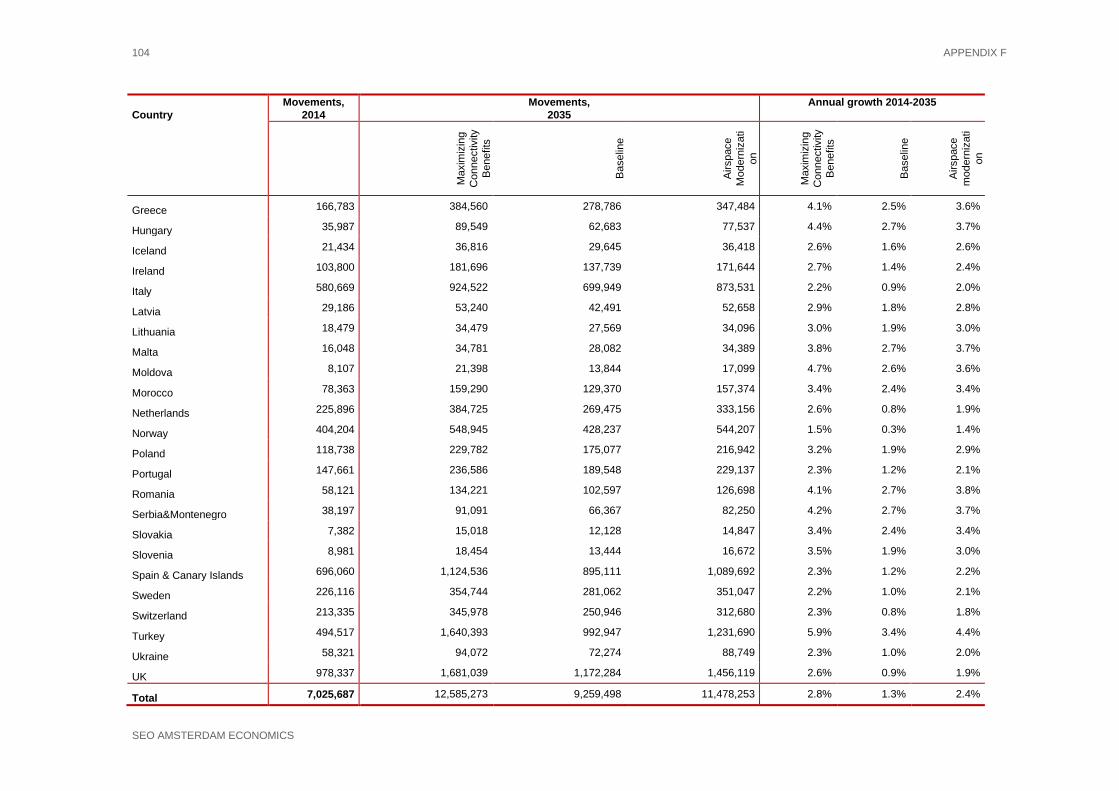
104 APPENDIX F
SEO AMSTERDAM ECONOMICS
Country Movements,
2014 Movements,
2035 Annual growth 2014-2035
Max
imiz
ing
Con
nect
ivity
B
enef
its
Bas
elin
e
Airs
pace
M
oder
niza
tion
Max
imiz
ing
Con
nect
ivity
B
enef
its
Bas
elin
e
Airs
pace
m
oder
niza
tion
Greece 166,783 384,560 278,786 347,484 4.1% 2.5% 3.6%
Hungary 35,987 89,549 62,683 77,537 4.4% 2.7% 3.7%
Iceland 21,434 36,816 29,645 36,418 2.6% 1.6% 2.6%
Ireland 103,800 181,696 137,739 171,644 2.7% 1.4% 2.4%
Italy 580,669 924,522 699,949 873,531 2.2% 0.9% 2.0%
Latvia 29,186 53,240 42,491 52,658 2.9% 1.8% 2.8%
Lithuania 18,479 34,479 27,569 34,096 3.0% 1.9% 3.0%
Malta 16,048 34,781 28,082 34,389 3.8% 2.7% 3.7%
Moldova 8,107 21,398 13,844 17,099 4.7% 2.6% 3.6%
Morocco 78,363 159,290 129,370 157,374 3.4% 2.4% 3.4%
Netherlands 225,896 384,725 269,475 333,156 2.6% 0.8% 1.9%
Norway 404,204 548,945 428,237 544,207 1.5% 0.3% 1.4%
Poland 118,738 229,782 175,077 216,942 3.2% 1.9% 2.9%
Portugal 147,661 236,586 189,548 229,137 2.3% 1.2% 2.1%
Romania 58,121 134,221 102,597 126,698 4.1% 2.7% 3.8%
Serbia&Montenegro 38,197 91,091 66,367 82,250 4.2% 2.7% 3.7%
Slovakia 7,382 15,018 12,128 14,847 3.4% 2.4% 3.4%
Slovenia 8,981 18,454 13,444 16,672 3.5% 1.9% 3.0%
Spain & Canary Islands 696,060 1,124,536 895,111 1,089,692 2.3% 1.2% 2.2%
Sweden 226,116 354,744 281,062 351,047 2.2% 1.0% 2.1%
Switzerland 213,335 345,978 250,946 312,680 2.3% 0.8% 1.8%
Turkey 494,517 1,640,393 992,947 1,231,690 5.9% 3.4% 4.4%
Ukraine 58,321 94,072 72,274 88,749 2.3% 1.0% 2.0%
UK 978,337 1,681,039 1,172,284 1,456,119 2.6% 0.9% 1.9%
Total 7,025,687 12,585,273 9,259,498 11,478,253 2.8% 1.3% 2.4%
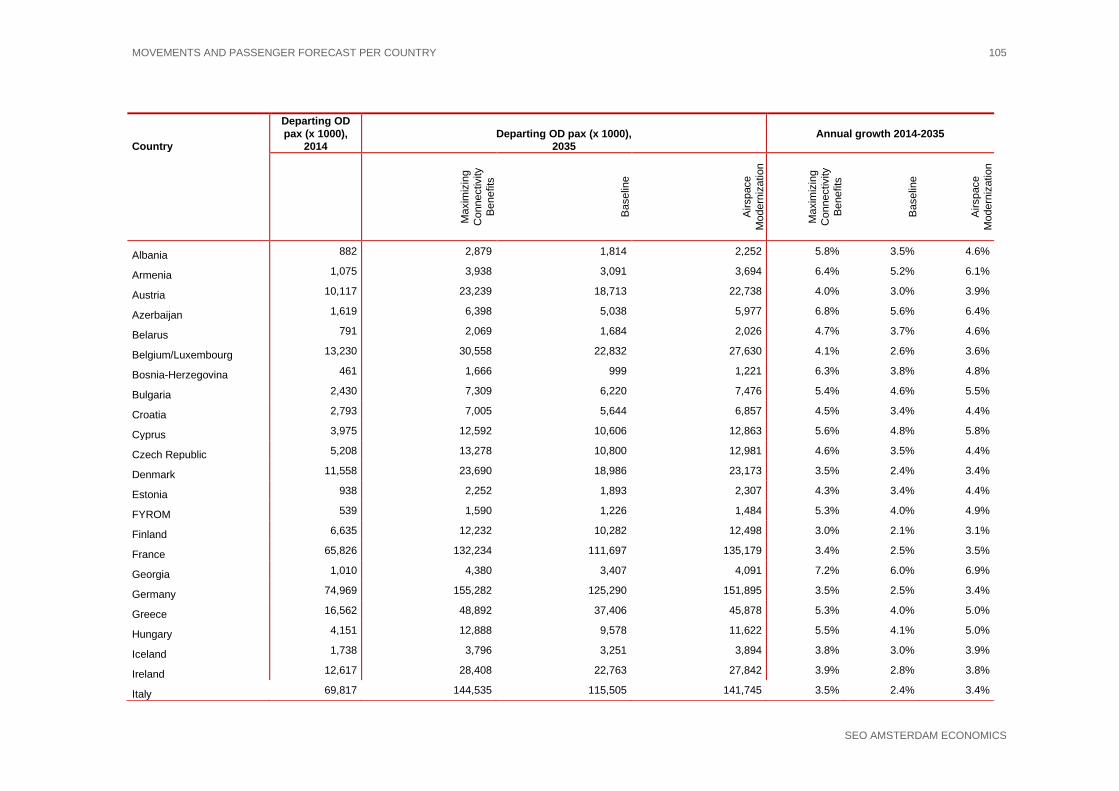
MOVEMENTS AND PASSENGER FORECAST PER COUNTRY 105
SEO AMSTERDAM ECONOMICS
Country
Departing OD pax (x 1000),
2014 Departing OD pax (x 1000),
2035 Annual growth 2014-2035
Max
imiz
ing
Con
nect
ivity
B
enef
its
Bas
elin
e
Airs
pace
M
oder
niza
tion
Max
imiz
ing
Con
nect
ivity
B
enef
its
Bas
elin
e
Airs
pace
M
oder
niza
tion
Albania 882 2,879 1,814 2,252 5.8% 3.5% 4.6%
Armenia 1,075 3,938 3,091 3,694 6.4% 5.2% 6.1%
Austria 10,117 23,239 18,713 22,738 4.0% 3.0% 3.9%
Azerbaijan 1,619 6,398 5,038 5,977 6.8% 5.6% 6.4%
Belarus 791 2,069 1,684 2,026 4.7% 3.7% 4.6%
Belgium/Luxembourg 13,230 30,558 22,832 27,630 4.1% 2.6% 3.6%
Bosnia-Herzegovina 461 1,666 999 1,221 6.3% 3.8% 4.8%
Bulgaria 2,430 7,309 6,220 7,476 5.4% 4.6% 5.5%
Croatia 2,793 7,005 5,644 6,857 4.5% 3.4% 4.4%
Cyprus 3,975 12,592 10,606 12,863 5.6% 4.8% 5.8%
Czech Republic 5,208 13,278 10,800 12,981 4.6% 3.5% 4.4%
Denmark 11,558 23,690 18,986 23,173 3.5% 2.4% 3.4%
Estonia 938 2,252 1,893 2,307 4.3% 3.4% 4.4%
FYROM 539 1,590 1,226 1,484 5.3% 4.0% 4.9%
Finland 6,635 12,232 10,282 12,498 3.0% 2.1% 3.1%
France 65,826 132,234 111,697 135,179 3.4% 2.5% 3.5%
Georgia 1,010 4,380 3,407 4,091 7.2% 6.0% 6.9%
Germany 74,969 155,282 125,290 151,895 3.5% 2.5% 3.4%
Greece 16,562 48,892 37,406 45,878 5.3% 4.0% 5.0%
Hungary 4,151 12,888 9,578 11,622 5.5% 4.1% 5.0%
Iceland 1,738 3,796 3,251 3,894 3.8% 3.0% 3.9%
Ireland 12,617 28,408 22,763 27,842 3.9% 2.8% 3.8%
Italy 69,817 144,535 115,505 141,745 3.5% 2.4% 3.4%
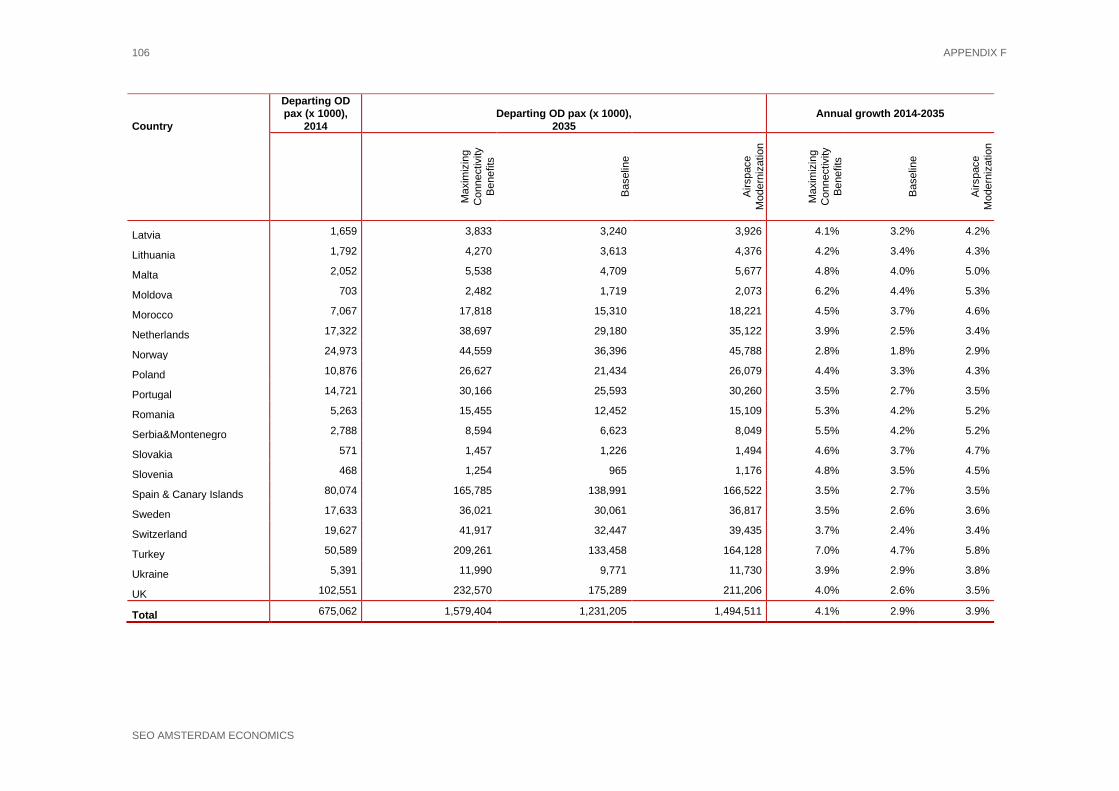
106 APPENDIX F
SEO AMSTERDAM ECONOMICS
Country
Departing OD pax (x 1000),
2014 Departing OD pax (x 1000),
2035 Annual growth 2014-2035
Max
imiz
ing
Con
nect
ivity
B
enef
its
Bas
elin
e
Airs
pace
M
oder
niza
tion
Max
imiz
ing
Con
nect
ivity
B
enef
its
Bas
elin
e
Airs
pace
M
oder
niza
tion
Latvia 1,659 3,833 3,240 3,926 4.1% 3.2% 4.2%
Lithuania 1,792 4,270 3,613 4,376 4.2% 3.4% 4.3%
Malta 2,052 5,538 4,709 5,677 4.8% 4.0% 5.0%
Moldova 703 2,482 1,719 2,073 6.2% 4.4% 5.3%
Morocco 7,067 17,818 15,310 18,221 4.5% 3.7% 4.6%
Netherlands 17,322 38,697 29,180 35,122 3.9% 2.5% 3.4%
Norway 24,973 44,559 36,396 45,788 2.8% 1.8% 2.9%
Poland 10,876 26,627 21,434 26,079 4.4% 3.3% 4.3%
Portugal 14,721 30,166 25,593 30,260 3.5% 2.7% 3.5%
Romania 5,263 15,455 12,452 15,109 5.3% 4.2% 5.2%
Serbia&Montenegro 2,788 8,594 6,623 8,049 5.5% 4.2% 5.2%
Slovakia 571 1,457 1,226 1,494 4.6% 3.7% 4.7%
Slovenia 468 1,254 965 1,176 4.8% 3.5% 4.5%
Spain & Canary Islands 80,074 165,785 138,991 166,522 3.5% 2.7% 3.5%
Sweden 17,633 36,021 30,061 36,817 3.5% 2.6% 3.6%
Switzerland 19,627 41,917 32,447 39,435 3.7% 2.4% 3.4%
Turkey 50,589 209,261 133,458 164,128 7.0% 4.7% 5.8%
Ukraine 5,391 11,990 9,771 11,730 3.9% 2.9% 3.8%
UK 102,551 232,570 175,289 211,206 4.0% 2.6% 3.5%
Total 675,062 1,579,404 1,231,205 1,494,511 4.1% 2.9% 3.9%
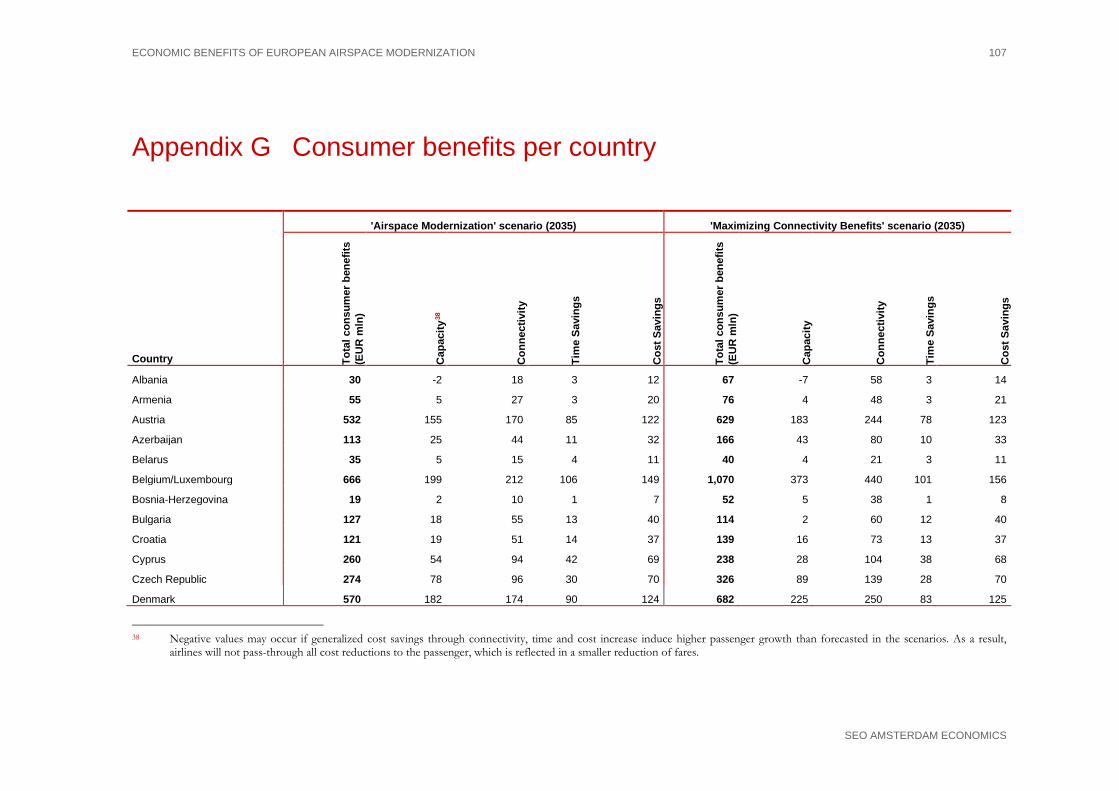
ECONOMIC BENEFITS OF EUROPEAN AIRSPACE MODERNIZATION 107
SEO AMSTERDAM ECONOMICS
Appendix G Consumer benefits per country
'Airspace Modernization' scenario (2035) 'Maximizing Connectivity Benefits' scenario (2035)
Country Tota
l con
sum
er b
enef
its
(EU
R m
ln)
Cap
acity
38
Con
nect
ivity
Tim
e Sa
ving
s
Cos
t Sav
ings
Tota
l con
sum
er b
enef
its
(EU
R m
ln)
Cap
acity
Con
nect
ivity
Tim
e Sa
ving
s
Cos
t Sav
ings
Albania 30 -2 18 3 12 67 -7 58 3 14
Armenia 55 5 27 3 20 76 4 48 3 21
Austria 532 155 170 85 122 629 183 244 78 123
Azerbaijan 113 25 44 11 32 166 43 80 10 33
Belarus 35 5 15 4 11 40 4 21 3 11
Belgium/Luxembourg 666 199 212 106 149 1,070 373 440 101 156
Bosnia-Herzegovina 19 2 10 1 7 52 5 38 1 8
Bulgaria 127 18 55 13 40 114 2 60 12 40
Croatia 121 19 51 14 37 139 16 73 13 37
Cyprus 260 54 94 42 69 238 28 104 38 68
Czech Republic 274 78 96 30 70 326 89 139 28 70
Denmark 570 182 174 90 124 682 225 250 83 125
38 Negative values may occur if generalized cost savings through connectivity, time and cost increase induce higher passenger growth than forecasted in the scenarios. As a result,
airlines will not pass-through all cost reductions to the passenger, which is reflected in a smaller reduction of fares.
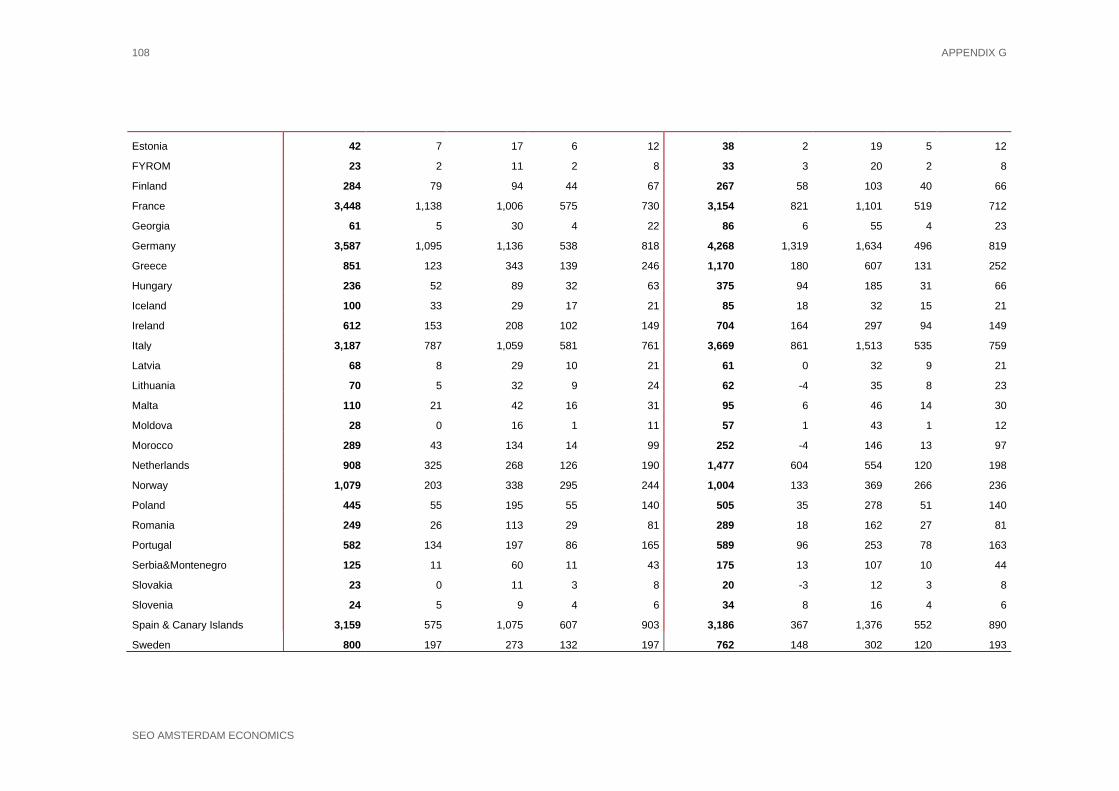
108 APPENDIX G
SEO AMSTERDAM ECONOMICS
Estonia 42 7 17 6 12 38 2 19 5 12
FYROM 23 2 11 2 8 33 3 20 2 8
Finland 284 79 94 44 67 267 58 103 40 66
France 3,448 1,138 1,006 575 730 3,154 821 1,101 519 712
Georgia 61 5 30 4 22 86 6 55 4 23
Germany 3,587 1,095 1,136 538 818 4,268 1,319 1,634 496 819
Greece 851 123 343 139 246 1,170 180 607 131 252
Hungary 236 52 89 32 63 375 94 185 31 66
Iceland 100 33 29 17 21 85 18 32 15 21
Ireland 612 153 208 102 149 704 164 297 94 149
Italy 3,187 787 1,059 581 761 3,669 861 1,513 535 759
Latvia 68 8 29 10 21 61 0 32 9 21
Lithuania 70 5 32 9 24 62 -4 35 8 23
Malta 110 21 42 16 31 95 6 46 14 30
Moldova 28 0 16 1 11 57 1 43 1 12
Morocco 289 43 134 14 99 252 -4 146 13 97
Netherlands 908 325 268 126 190 1,477 604 554 120 198
Norway 1,079 203 338 295 244 1,004 133 369 266 236
Poland 445 55 195 55 140 505 35 278 51 140
Romania 249 26 113 29 81 289 18 162 27 81
Portugal 582 134 197 86 165 589 96 253 78 163
Serbia&Montenegro 125 11 60 11 43 175 13 107 10 44
Slovakia 23 0 11 3 8 20 -3 12 3 8
Slovenia 24 5 9 4 6 34 8 16 4 6
Spain & Canary Islands 3,159 575 1,075 607 903 3,186 367 1,376 552 890
Sweden 800 197 273 132 197 762 148 302 120 193
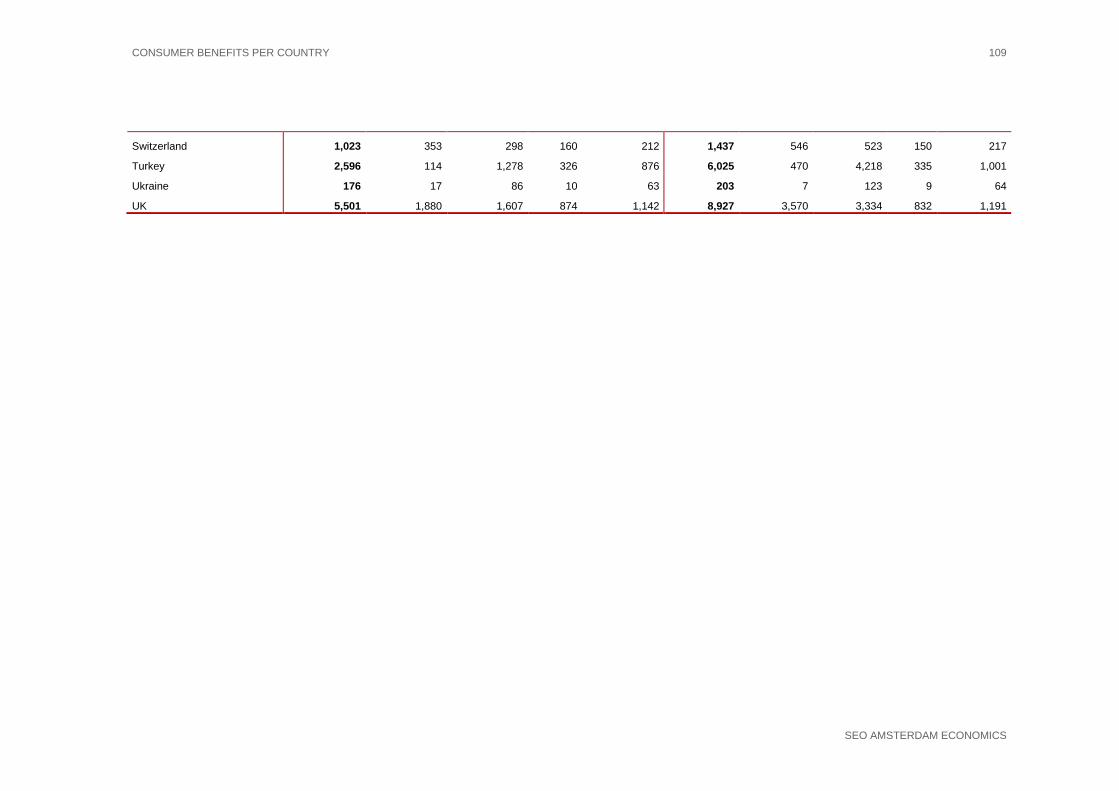
CONSUMER BENEFITS PER COUNTRY 109
SEO AMSTERDAM ECONOMICS
Switzerland 1,023 353 298 160 212 1,437 546 523 150 217
Turkey 2,596 114 1,278 326 876 6,025 470 4,218 335 1,001
Ukraine 176 17 86 10 63 203 7 123 9 64
UK 5,501 1,880 1,607 874 1,142 8,927 3,570 3,334 832 1,191

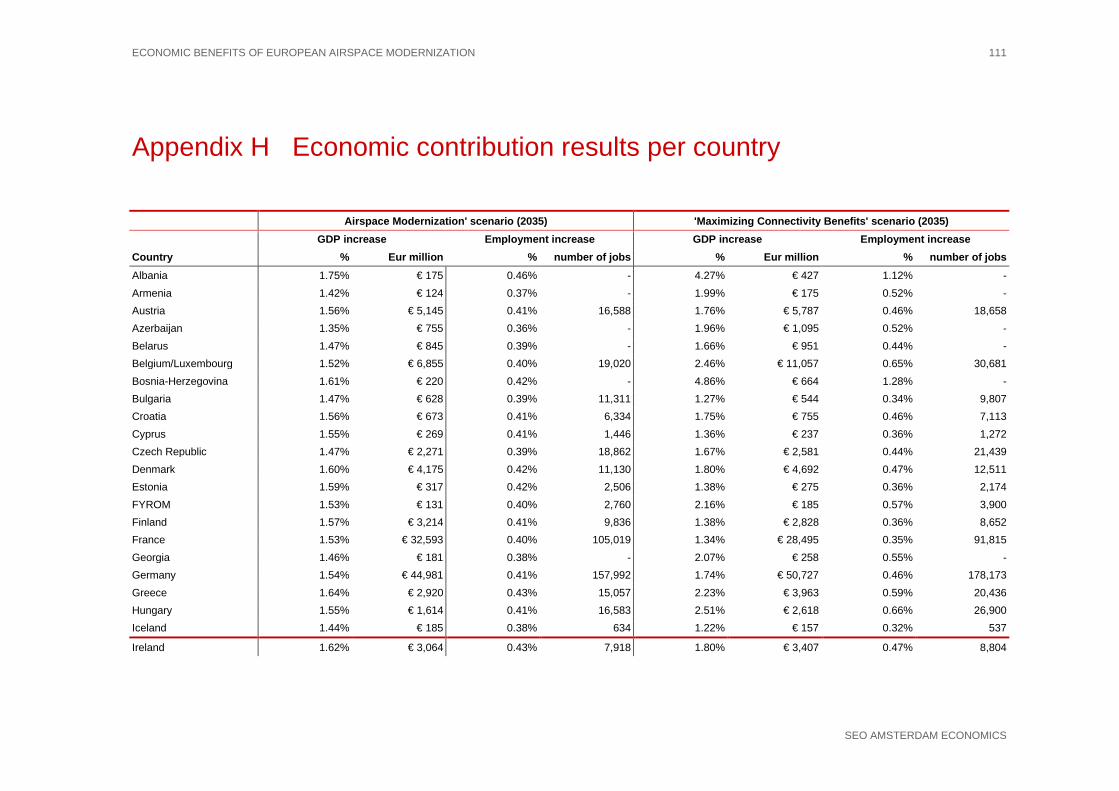
ECONOMIC BENEFITS OF EUROPEAN AIRSPACE MODERNIZATION 111
SEO AMSTERDAM ECONOMICS
Appendix H Economic contribution results per country
Airspace Modernization' scenario (2035) 'Maximizing Connectivity Benefits' scenario (2035)
GDP increase Employment increase GDP increase Employment increase
Country % Eur million % number of jobs % Eur million % number of jobs Albania 1.75% € 175 0.46% - 4.27% € 427 1.12% - Armenia 1.42% € 124 0.37% - 1.99% € 175 0.52% - Austria 1.56% € 5,145 0.41% 16,588 1.76% € 5,787 0.46% 18,658 Azerbaijan 1.35% € 755 0.36% - 1.96% € 1,095 0.52% - Belarus 1.47% € 845 0.39% - 1.66% € 951 0.44% - Belgium/Luxembourg 1.52% € 6,855 0.40% 19,020 2.46% € 11,057 0.65% 30,681 Bosnia-Herzegovina 1.61% € 220 0.42% - 4.86% € 664 1.28% - Bulgaria 1.47% € 628 0.39% 11,311 1.27% € 544 0.34% 9,807 Croatia 1.56% € 673 0.41% 6,334 1.75% € 755 0.46% 7,113 Cyprus 1.55% € 269 0.41% 1,446 1.36% € 237 0.36% 1,272 Czech Republic 1.47% € 2,271 0.39% 18,862 1.67% € 2,581 0.44% 21,439 Denmark 1.60% € 4,175 0.42% 11,130 1.80% € 4,692 0.47% 12,511 Estonia 1.59% € 317 0.42% 2,506 1.38% € 275 0.36% 2,174 FYROM 1.53% € 131 0.40% 2,760 2.16% € 185 0.57% 3,900 Finland 1.57% € 3,214 0.41% 9,836 1.38% € 2,828 0.36% 8,652 France 1.53% € 32,593 0.40% 105,019 1.34% € 28,495 0.35% 91,815 Georgia 1.46% € 181 0.38% - 2.07% € 258 0.55% - Germany 1.54% € 44,981 0.41% 157,992 1.74% € 50,727 0.46% 178,173 Greece 1.64% € 2,920 0.43% 15,057 2.23% € 3,963 0.59% 20,436 Hungary 1.55% € 1,614 0.41% 16,583 2.51% € 2,618 0.66% 26,900 Iceland 1.44% € 185 0.38% 634 1.22% € 157 0.32% 537
Ireland 1.62% € 3,064 0.43% 7,918 1.80% € 3,407 0.47% 8,804

112 APPENDIX H
SEO AMSTERDAM ECONOMICS
Italy 1.65% € 26,636 0.43% 94,725 1.83% € 29,479 0.48% 104,836 Latvia 1.54% € 363 0.41% 5,219 1.33% € 314 0.35% 4,507 Lithuania 1.53% € 559 0.40% - 1.32% € 481 0.35% - Malta 1.49% € 119 0.39% 698 1.28% € 102 0.34% 597 Moldova 1.49% € 89 0.39% - 3.23% € 193 0.85% - Morocco 1.38% € 0 0.36% - 1.19% € 0 0.31% - Netherlands 1.48% € 9,794 0.39% 31,222 2.37% € 15,712 0.62% 50,087 Norway 1.88% € 7,082 0.49% 12,523 1.63% € 6,153 0.43% 10,879 Poland 1.57% € 6,468 0.41% 64,593 1.76% € 7,234 0.46% 72,243 Portugal 1.33% € 2,299 0.35% 14,839 1.30% € 2,252 0.34% 14,538 Romania 1.55% € 2,326 0.41% 33,675 1.75% € 2,630 0.46% 38,076 Serbia&Montenegro 1.56% € 571 0.41% - 2.16% € 789 0.57% - Slovakia 1.59% € 1,203 0.42% 9,846 1.37% € 1,035 0.36% 8,471 Slovenia 1.58% € 590 0.42% 3,718 2.17% € 810 0.57% 5,097 Spain & Canary Islands 1.44% € 14,989 0.38% 65,202 1.40% € 14,587 0.37% 63,455 Sweden 1.63% € 7,036 0.43% 19,768 1.44% € 6,206 0.38% 17,434 Switzerland 1.56% € 8,268 0.41% 17,965 2.12% € 11,217 0.56% 24,372 Turkey 1.66% € 9,993 0.44% 110,533 4.13% € 24,812 1.09% 274,437 Ukraine 1.46% € 1,433 0.38% - 1.65% € 1,624 0.43% - UK 1.49% € 33,503 0.39% 115,545 2.38% € 53,518 0.63% 184,575
ECONOMIC BENEFITS OF EUROPEAN AIRSPACE MODERNIZATION 113
SEO AMSTERDAM ECONOMICS
Appendix I Regression results
Data used In order to provide robust estimates for the wider economic benefits of air transport, standardized catchment area data for a large set of European airports are used. These data are obtained from the SEO Catchment Area Database, which contains time series data of key economic and social indicators of the catchment areas of all European airports in buffers of 50, 100 and 150 kilometres for the period 2004-2012.
We provide estimates for the effect of a change in air transport on employment and GDP. Besides, we are interested in the wider catalytic impacts of improved connectivity and passenger growth: • Tourism. Access to air transport is important for the development of inbound tourism.
Inbound tourists generate value added effects, income effects and employment effects. Tourism is measured by the number of available hotel beds;
• Investment. It is assumed that air transport, due to its reducing effect on transport costs, increases the likelihood of FDI exchange between connected regions. FDI leads to increases in local demand for labour, for instance to build up new production capacity and to increase the production of goods and services. Investment is measured by the size of inward FDI;
• Labour productivity. Better access to markets may increase production rates, introduce new production techniques and/or more efficient suppliers and therefore labour productivity. Labour productivity is measured in GDP per capita;
• Innovation. Improvements in international mobility enhance the exchange, development and diffusion of innovative ideas, of technical progress and of product and process innovations. In this study, we measure innovation as the number of patent applications as well as through the amount of total R&D expenditure.
• Trade in services. Face-to-face meetings between business partners – which are facilitated by aviation – are often used to facilitate trade. Such meetings play a crucial role in making sales and delivering sales and support. In many industries it is important to reach a client rapidly and cost-effectively. Face-to-face meetings remain essential in many cases, despite the availability of other forms of communication such as videoconferencing.
Data on GDP, hotel beds, employment and employment in knowledge intensive sectors are obtained from Eurostat. These variables are included in the SEO Catchment Area Database, where we computed aggregate values in a certain radius around the airport. For FDI and trade in services we used data at a national level, for the period 2004-2012. FDI data was derived from UNCTAD (United Nations Conference on Trade and Development). Trade in commercial services was obtained from the WTO (World Trade Organisation). In our regression models we select airports with more than 1 million passengers in at least one of the years in the sample (2004-2012). This selection of airports consists of 202 airports, together comprising of 95 percent of the European passenger traffic. The results from this analysis are used to quantify the wider economic impacts of the relative passenger increase attributable to airspace modernization and expansion of airport capacity.
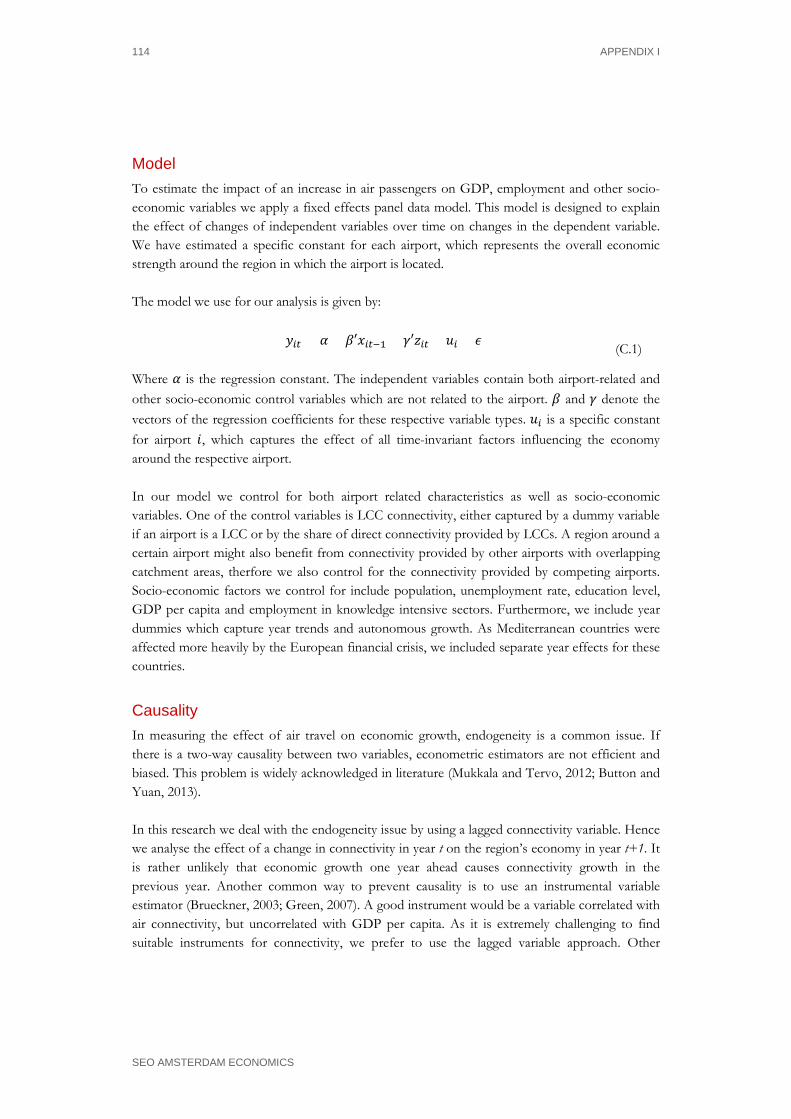
114 APPENDIX I
SEO AMSTERDAM ECONOMICS
Model To estimate the impact of an increase in air passengers on GDP, employment and other socio-economic variables we apply a fixed effects panel data model. This model is designed to explain the effect of changes of independent variables over time on changes in the dependent variable. We have estimated a specific constant for each airport, which represents the overall economic strength around the region in which the airport is located. The model we use for our analysis is given by:
𝑦𝑦𝑖𝑖𝑐𝑐 = 𝛼𝛼 + 𝛽𝛽′𝑥𝑥𝑖𝑖𝑐𝑐−1 + 𝛾𝛾′𝑧𝑧𝑖𝑖𝑐𝑐 + 𝑉𝑉𝑖𝑖 + 𝜖𝜖
(C.1)
Where 𝛼𝛼 is the regression constant. The independent variables contain both airport-related and other socio-economic control variables which are not related to the airport. 𝛽𝛽 and 𝛾𝛾 denote the vectors of the regression coefficients for these respective variable types. 𝑉𝑉𝑖𝑖 is a specific constant for airport 𝑇𝑇, which captures the effect of all time-invariant factors influencing the economy around the respective airport. In our model we control for both airport related characteristics as well as socio-economic variables. One of the control variables is LCC connectivity, either captured by a dummy variable if an airport is a LCC or by the share of direct connectivity provided by LCCs. A region around a certain airport might also benefit from connectivity provided by other airports with overlapping catchment areas, therfore we also control for the connectivity provided by competing airports. Socio-economic factors we control for include population, unemployment rate, education level, GDP per capita and employment in knowledge intensive sectors. Furthermore, we include year dummies which capture year trends and autonomous growth. As Mediterranean countries were affected more heavily by the European financial crisis, we included separate year effects for these countries.
Causality In measuring the effect of air travel on economic growth, endogeneity is a common issue. If there is a two-way causality between two variables, econometric estimators are not efficient and biased. This problem is widely acknowledged in literature (Mukkala and Tervo, 2012; Button and Yuan, 2013). In this research we deal with the endogeneity issue by using a lagged connectivity variable. Hence we analyse the effect of a change in connectivity in year t on the region’s economy in year t+1. It is rather unlikely that economic growth one year ahead causes connectivity growth in the previous year. Another common way to prevent causality is to use an instrumental variable estimator (Brueckner, 2003; Green, 2007). A good instrument would be a variable correlated with air connectivity, but uncorrelated with GDP per capita. As it is extremely challenging to find suitable instruments for connectivity, we prefer to use the lagged variable approach. Other

REGRESSION RESULTS 115
SEO AMSTERDAM ECONOMICS
studies use dynamic panel data models such as the vector autoregressive model (VAR) or generalized method of moments (GMM) (Button and Yuan (2013), Bilotkach (2015)). There are various studies which estimated the impact of aviation on employment and GDP growth. To place our results in perspective with other findings from literature, a list of more or less comparable econometric studies is provided in the table below. Paper Key result Poort (2000) 10 percent passenger increase leads to 1.7 percent GDP growth
Brueckner (2003) 10 percent passenger increase leads to a 1 percent increase in service related employment
IATA (2007) 10 percent increase in connectivity per capita leads to a 0.07 percent increase in labour productivity
Green (2007) 10 percent increase in boardings per capita leads to 0.3 percent population growth and 0.3 percent employment growth
Sellner and Nagl (2010) 10 percent increase in boardings per capita leads to 0.14 percent GDP growth
PWC (2014) 10 percent increase in seat capacity leads to a 1 percent increase in real GDP InterVISTAS (2015) 10 percent increase in connectivity / GDP increases GDP per capita by 0.5 percent
Bilotkach (2015) 10 percent increase in the number of flights leads to a 0.1 percent increase in average wage; 10 percent increase in number of destinations leads to 0.13 percent increase in employment and 0.1 percent increase in the number of business establishments
Results Table I. 1 shows the regression estimates for the macro-economic impacts of air travel. Our results indicate that a 10 percent increase in air passengers leads to a 0.3 percent increase in employment and a 1.2 percent increase in GDP in the subsequent year. These results are on the high side compared to other studies listed above. However it should be noted that our analysis focuses on results in a radius of 100 kilometres around the airport, whereas most studies accounted for the European continent are conducted at country level (Sellner and Nagl 2010; PWC 2014; InterVISTAS 2015). It is likely that the impact of air travel on GDP is stronger in the metropolitan area around the airport, than the impact of air passengers in a certain country on the country’s economy as a whole.

116 APPENDIX I
SEO AMSTERDAM ECONOMICS
Table I. 1
Employment GDP total Airport variables (1 year lag)
Passengers 0.0315* 0.1197***
Airport is LCC base -0.0229** Connectivity provided by other airports 0.0237 0.0511***
Control variables
Population -0.0101 0.4224*
Unemployment rate -0.1118
Share of population with tertiary education 0.0106 -0.0013
GDP per capita -0.0538*** Year effects (2005 = reference) 0.0171*** 0.0524***
2007 0.0430*** 0.1116***
2008 0.0432** 0.0890***
2009 0.0163 -0.0009
2010 0.0063 0.0851***
2011 -0.0017 0.1222***
2012 -0.0031 0.1827***
Year effects x Mediterranean countries 0.0309 -0.0063
2007 0.0304 -0.0252**
2008 0.0282 0.006
2009 0.0106 0.0641***
2010 0.0142 -0.0098
2011 0.0118 -0.0480*
2012 -0.0318 -0.1104***
Constant 6.6279*** 5.5590***
Number of observations 1473 1407
Number of airports 202 190
R² (within) 0.1155 0.5037
Table I. 2 shows the estimates for other socio-economic factors, which are influenced by air travel growth. Positive and significant impacts were found for productivity, employment in knowledge intensive sectors, number of patent applications, R&D expenditure, trade in services and the number of hotelbeds. No significant relationship between air passengers and FDI could be established.

REGRESSION RESULTS 117
SEO AMSTERDAM ECONOMICS
Table I. 2
GDP per
capita
Employment in
knowledge intensive
sectors
Number of patent
applications
R&D expenditur
e
Trade in services
Number of hotelbeds Inward FDI
Airport variables (1 year lag)
Passengers 0.0913*** 0.0608** 0.2594** 0.2189** 0.1025*** 0.0590*** 0.0304
Airport is LCC base -0.0399** -0.0255 -0.0075
Share of direct connectivity
provided by LCC 0.0739**
Connectivity provided by other
airports 0.0414** 0.0594*** -0.0234 0.0704 0.0006 0.0333*** 0.018
Control variables
Population -0.5297** 0.04 -1.082 -0.374 -0.0876*** 0.8176*** -0.0648
Unemployment rate 0.4037 -1.3594 -1.2301** -1.0327*** 0.2584** 0.212
Share of population with tertiary
education 0.0076** 0.0248*** 0.0066*** 0.0097
GDP per capita -0.0585* 0.2589 0.1042 0.0145 0.1277* 0.4852***
Employment in knowledge
intensive sectors -0.7242* 2.1238 0.1235
Year effects (2005 = reference) 0.0580*** 0 -0.0342 0.0637 0.1109*** 0.0279*** 0.2337***
2007 0.1112*** 0.0154 -0.0237 0.2056*** 0.2762*** 0.0272* 0.4137***
2008 0.1306*** 0.1022*** -0.0151 -0.1009 0.3495*** 0.0420** 0.2831***
2009 0.0846*** 0.1025** 0.0252 0.1445 0.1978*** 0.0820*** 0.4005***
2010 0.1266*** 0.0973** 0.0129 0.0946 0.2557*** 0.0956*** 0.4099***
2011 0.1531*** 0.0873 -0.1152 0.2448* 0.3500*** 0.0970*** 0.4208***
2012 0.2084*** 0.0889 (omitted) 0.2032 0.3542*** (omitted) 0.4681***
Year effects x Mediterranean
countries -0.0176** 0.0681*** 0.0409 -0.1373 -0.0067 -0.0333*** -0.0137
2007 -0.0328*** 0.0970*** -0.2129** -0.1288 -0.0019 -0.0399*** 0.0182
2008 -0.0439*** 0.0938** 0.1377 0.1649 0.0760*** -0.0524*** 0.0546
2009 -0.0337** 0.0553 0.0356 -0.0159 0.0917*** -0.0920*** 0.0481
2010 -0.0558*** 0.1139** 0.0788 0.0317 0.0575** -0.0898*** -0.0259
2011 -0.0955*** 0.1267** -0.0712 -0.0439 0.0571** -0.0896*** -0.0312
2012 -0.2775*** 0.0486 (omitted) -0.0795 0.0237 (omitted) -0.0342
Constant 12.2464*** 4.1858*** 6.9535 3.5963 24.4063*** 2.1663 7.0020***
Number of observations 1478 1342 1114 1084 1154 1225 1425
Number of airports 202 202 195 191 198 184 186
R² (within) 0.2934 0.3633 0.1073 0.1711 0.8116 0.6121 0.6189