Economic Assessment and SWOT Analysis for California City ... · PDF fileSWOT ANALYSIS ....
27
FEBRUARY 2017 ECONOMIC ASSESSMENT & SWOT ANALYSIS CALIFORNIA CITY, CA DRAFT
Transcript of Economic Assessment and SWOT Analysis for California City ... · PDF fileSWOT ANALYSIS ....
FEBRUARY 2017
ECONOMIC ASSESSMENT & SWOT ANALYSIS CALIFORNIA CITY, CA
DRAFT
PREPARED FOR: CALIFORNIA CITY, CA DRAFT
ECONOMIC ASSESSMENT & SWOT ANALYSIS PAGE | I
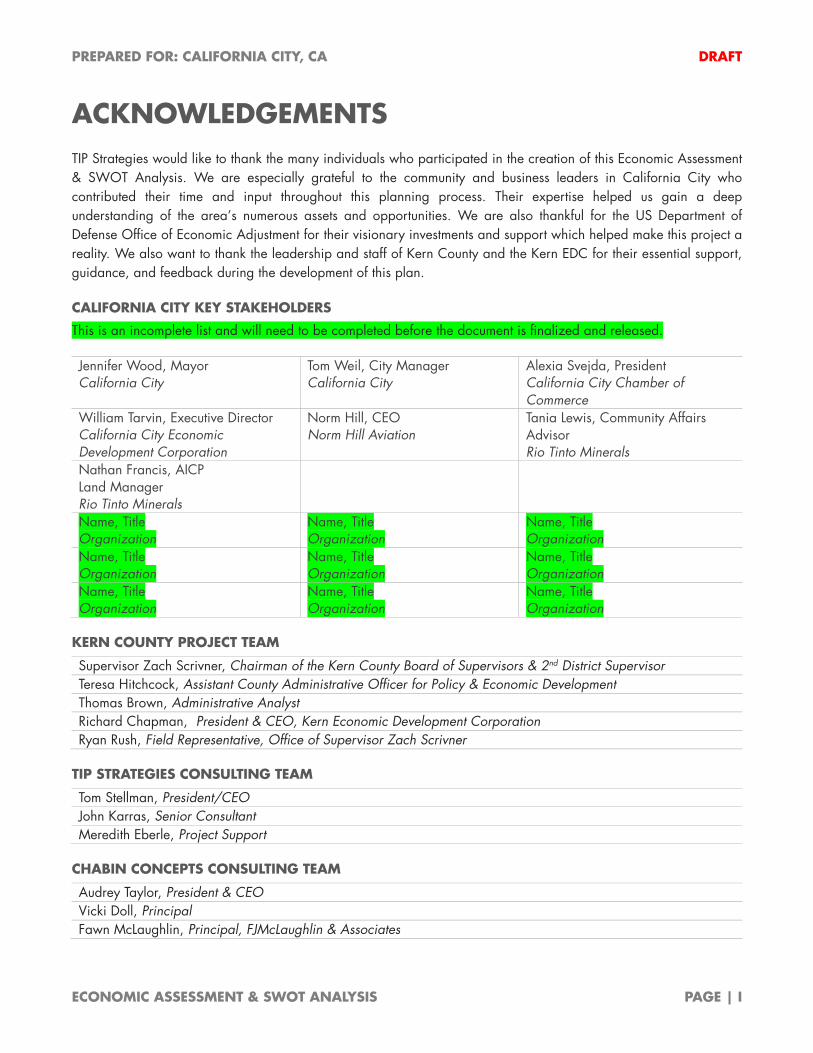
ACKNOWLEDGEMENTS TIP Strategies would like to thank the many individuals who participated in the creation of this Economic Assessment & SWOT Analysis. We are especially grateful to the community and business leaders in California City who contributed their time and input throughout this planning process. Their expertise helped us gain a deep understanding of the area’s numerous assets and opportunities. We are also thankful for the US Department of Defense Office of Economic Adjustment for their visionary investments and support which helped make this project a reality. We also want to thank the leadership and staff of Kern County and the Kern EDC for their essential support, guidance, and feedback during the development of this plan.
CALIFORNIA CITY KEY STAKEHOLDERS
This is an incomplete list and will need to be completed before the document is finalized and released.
KERN COUNTY PROJECT TEAM
TIP STRATEGIES CONSULTING TEAM
CHABIN CONCEPTS CONSULTING TEAM
Jennifer Wood, Mayor California City
Tom Weil, City Manager California City
Alexia Svejda, President California City Chamber of Commerce
William Tarvin, Executive Director California City Economic Development Corporation
Norm Hill, CEO Norm Hill Aviation
Tania Lewis, Community Affairs Advisor Rio Tinto Minerals
Nathan Francis, AICP Land Manager Rio Tinto Minerals
Name, Title Organization
Name, Title Organization
Name, Title Organization
Name, Title Organization
Name, Title Organization
Name, Title Organization
Name, Title Organization
Name, Title Organization
Name, Title Organization
Supervisor Zach Scrivner, Chairman of the Kern County Board of Supervisors & 2nd District Supervisor Teresa Hitchcock, Assistant County Administrative Officer for Policy & Economic Development Thomas Brown, Administrative Analyst Richard Chapman, President & CEO, Kern Economic Development Corporation Ryan Rush, Field Representative, Office of Supervisor Zach Scrivner
Tom Stellman, President/CEO John Karras, Senior Consultant Meredith Eberle, Project Support
Audrey Taylor, President & CEO Vicki Doll, Principal Fawn McLaughlin, Principal, FJMcLaughlin & Associates
PREPARED FOR: CALIFORNIA CITY, CA DRAFT
ECONOMIC ASSESSMENT & SWOT ANALYSIS PAGE | II
CONTENTS ECONOMIC ASSESSMENT & SWOT ANALYSIS .......................................................................................... 1
SWOT ANALYSIS .................................................................................................................................. 1 BUSINESS, INDUSTRY, & EMPLOYMENT TRENDS ..................................................................................... 3 WORKFORCE TRENDS & CHARACTERISTICS ......................................................................................... 14 COMMUTING PATTERNS ..................................................................................................................... 19
Image Credits: Central Park, California City, California by Craig Dietrich via Wikimedia Commons (CC BY 2.0).
CALIFORNIA CITY, CA DRAFT
ECONOMIC ASSESSMENT & SWOT ANALYSIS PAGE | 1
ECONOMIC ASSESSMENT & SWOT ANALYSIS To provide a foundation for the planning process, TIP conducted an assessment of demographic and economic factors that impact California City’s competitiveness. Our economic assessment provides a quantitative understanding of the demographic and economic trends impacting the community. Except where specified, the data in this section is for the 93505 ZIP Code, which covers California City.
SWOT ANALYSIS
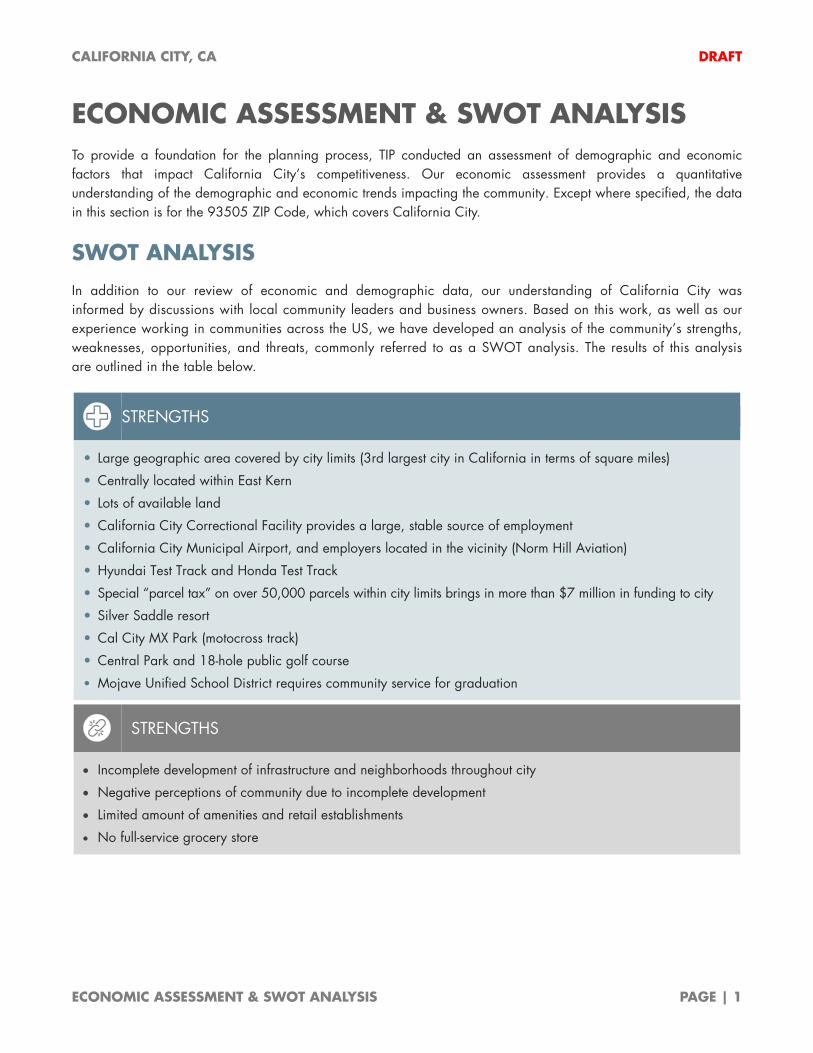
In addition to our review of economic and demographic data, our understanding of California City was informed by discussions with local community leaders and business owners. Based on this work, as well as our experience working in communities across the US, we have developed an analysis of the community’s strengths, weaknesses, opportunities, and threats, commonly referred to as a SWOT analysis. The results of this analysis are outlined in the table below.
STRENGTHS
• Large geographic area covered by city limits (3rd largest city in California in terms of square miles)
• Centrally located within East Kern
• Lots of available land
• California City Correctional Facility provides a large, stable source of employment
• California City Municipal Airport, and employers located in the vicinity (Norm Hill Aviation)
• Hyundai Test Track and Honda Test Track
• Special “parcel tax” on over 50,000 parcels within city limits brings in more than $7 million in funding to city
• Silver Saddle resort
• Cal City MX Park (motocross track)
• Central Park and 18-hole public golf course
• Mojave Unified School District requires community service for graduation
STRENGTHS
• Incomplete development of infrastructure and neighborhoods throughout city
• Negative perceptions of community due to incomplete development
• Limited amount of amenities and retail establishments
• No full-service grocery store
CALIFORNIA CITY, CA DRAFT
ECONOMIC ASSESSMENT & SWOT ANALYSIS PAGE | 2
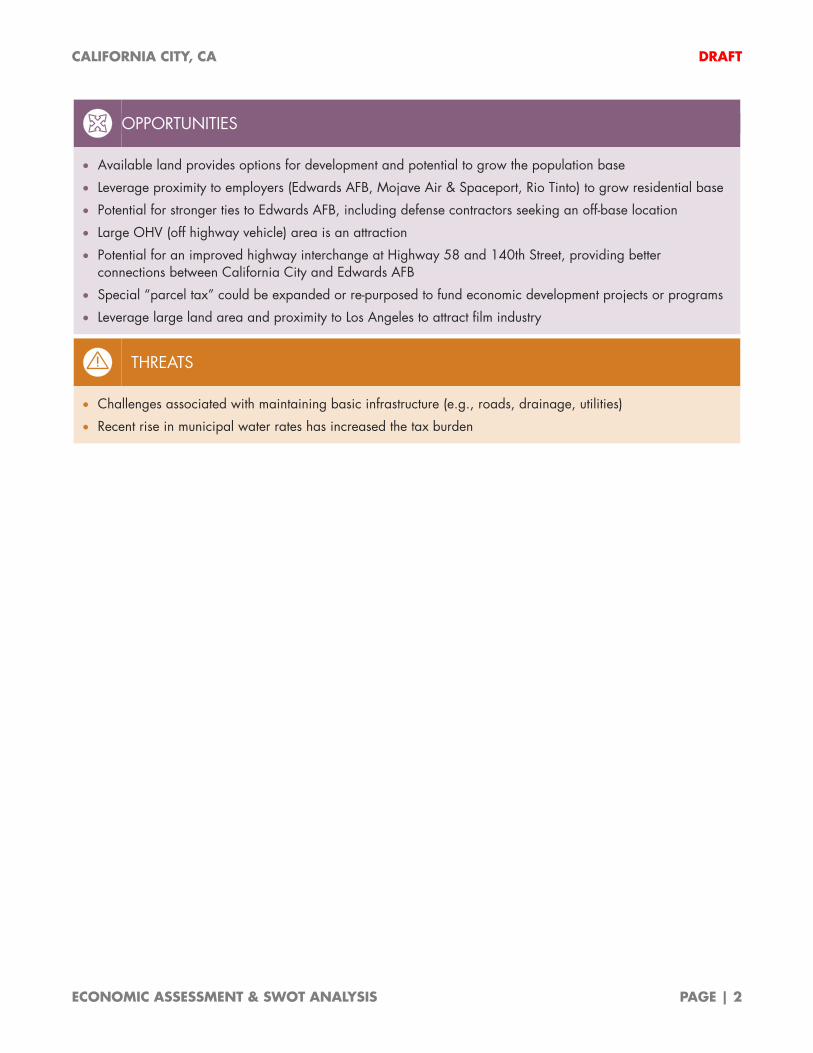
OPPORTUNITIES
• Available land provides options for development and potential to grow the population base
• Leverage proximity to employers (Edwards AFB, Mojave Air & Spaceport, Rio Tinto) to grow residential base
• Potential for stronger ties to Edwards AFB, including defense contractors seeking an off-base location
• Large OHV (off highway vehicle) area is an attraction
• Potential for an improved highway interchange at Highway 58 and 140th Street, providing better connections between California City and Edwards AFB
• Special “parcel tax” could be expanded or re-purposed to fund economic development projects or programs
• Leverage large land area and proximity to Los Angeles to attract film industry
THREATS
• Challenges associated with maintaining basic infrastructure (e.g., roads, drainage, utilities)
• Recent rise in municipal water rates has increased the tax burden
CALIFORNIA CITY, CA DRAFT
ECONOMIC ASSESSMENT & SWOT ANALYSIS PAGE | 3
BUSINESS, INDUSTRY, & EMPLOYMENT TRENDS
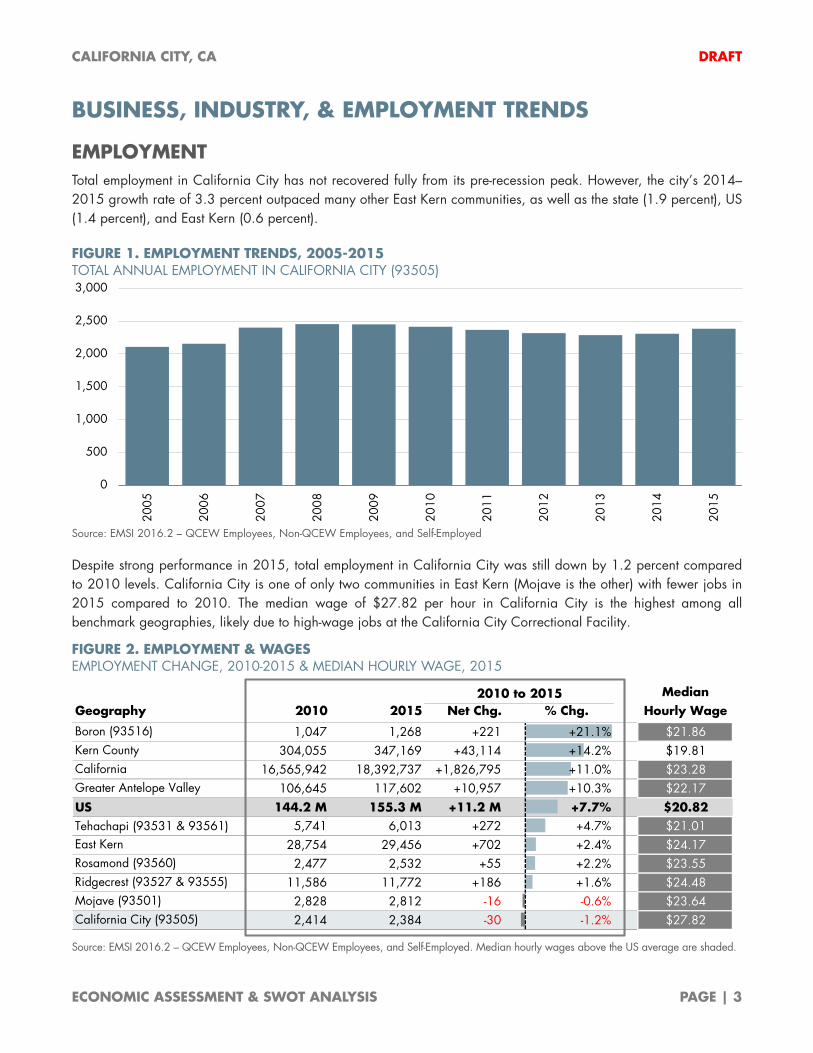
EMPLOYMENT Total employment in California City has not recovered fully from its pre-recession peak. However, the city’s 2014–2015 growth rate of 3.3 percent outpaced many other East Kern communities, as well as the state (1.9 percent), US (1.4 percent), and East Kern (0.6 percent).
FIGURE 1. EMPLOYMENT TRENDS, 2005-2015 TOTAL ANNUAL EMPLOYMENT IN CALIFORNIA CITY (93505)
Source: EMSI 2016.2 – QCEW Employees, Non-QCEW Employees, and Self-Employed
Despite strong performance in 2015, total employment in California City was still down by 1.2 percent compared to 2010 levels. California City is one of only two communities in East Kern (Mojave is the other) with fewer jobs in 2015 compared to 2010. The median wage of $27.82 per hour in California City is the highest among all benchmark geographies, likely due to high-wage jobs at the California City Correctional Facility.
FIGURE 2. EMPLOYMENT & WAGES EMPLOYMENT CHANGE, 2010-2015 & MEDIAN HOURLY WAGE, 2015
Source: EMSI 2016.2 – QCEW Employees, Non-QCEW Employees, and Self-Employed. Median hourly wages above the US average are shaded.
0
500
1,000
1,500
2,000
2,500
3,000
2005
2006
2007
2008
2009
2010
2011
2012
2013
2014
2015
Median Geography 2010 2015 Net Chg. % Chg. Hourly Wage
Boron (93516) 1,047 1,268 +221 +21.1% $21.86Kern County 304,055 347,169 +43,114 +14.2% $19.81California 16,565,942 18,392,737 +1,826,795 +11.0% $23.28Greater Antelope Valley 106,645 117,602 +10,957 +10.3% $22.17US 144.2 M 155.3 M +11.2 M +7.7% $20.82Tehachapi (93531 & 93561) 5,741 6,013 +272 +4.7% $21.01East Kern 28,754 29,456 +702 +2.4% $24.17Rosamond (93560) 2,477 2,532 +55 +2.2% $23.55Ridgecrest (93527 & 93555) 11,586 11,772 +186 +1.6% $24.48Mojave (93501) 2,828 2,812 -16 -0.6% $23.64California City (93505) 2,414 2,384 -30 -1.2% $27.82
2010 to 2015
CALIFORNIA CITY, CA DRAFT
ECONOMIC ASSESSMENT & SWOT ANALYSIS PAGE | 4
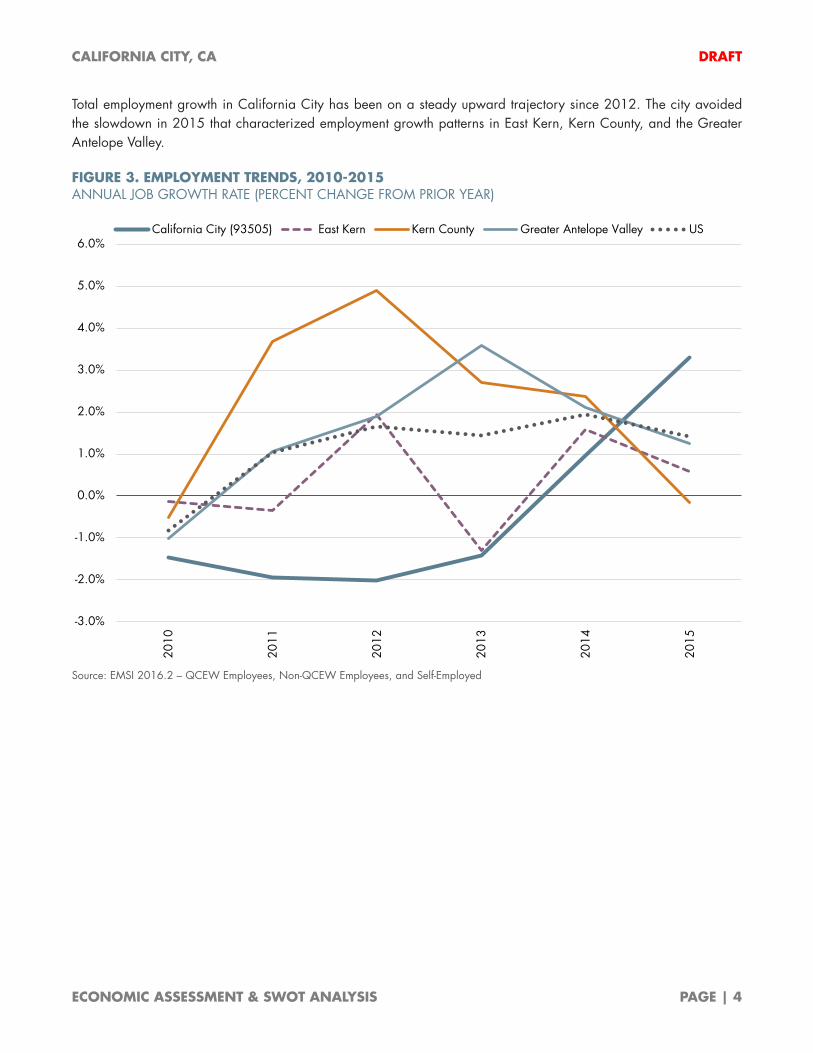
Total employment growth in California City has been on a steady upward trajectory since 2012. The city avoided the slowdown in 2015 that characterized employment growth patterns in East Kern, Kern County, and the Greater Antelope Valley.
FIGURE 3. EMPLOYMENT TRENDS, 2010-2015 ANNUAL JOB GROWTH RATE (PERCENT CHANGE FROM PRIOR YEAR)
Source: EMSI 2016.2 – QCEW Employees, Non-QCEW Employees, and Self-Employed
-3.0%
-2.0%
-1.0%
0.0%
1.0%
2.0%
3.0%
4.0%
5.0%
6.0%
2010
2011
2012
2013
2014
2015
California City (93505) East Kern Kern County Greater Antelope Valley US
CALIFORNIA CITY, CA DRAFT
ECONOMIC ASSESSMENT & SWOT ANALYSIS PAGE | 5
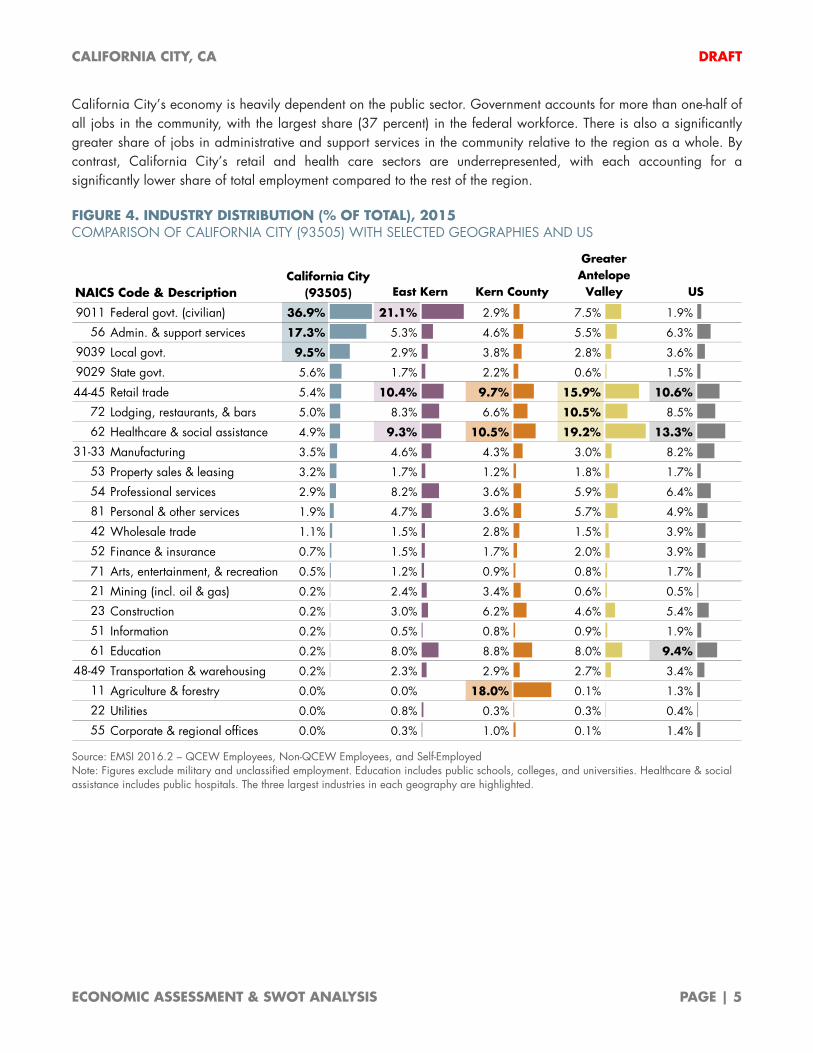
California City’s economy is heavily dependent on the public sector. Government accounts for more than one-half of all jobs in the community, with the largest share (37 percent) in the federal workforce. There is also a significantly greater share of jobs in administrative and support services in the community relative to the region as a whole. By contrast, California City’s retail and health care sectors are underrepresented, with each accounting for a significantly lower share of total employment compared to the rest of the region.
FIGURE 4. INDUSTRY DISTRIBUTION (% OF TOTAL), 2015 COMPARISON OF CALIFORNIA CITY (93505) WITH SELECTED GEOGRAPHIES AND US
Source: EMSI 2016.2 – QCEW Employees, Non-QCEW Employees, and Self-Employed Note: Figures exclude military and unclassified employment. Education includes public schools, colleges, and universities. Healthcare & social assistance includes public hospitals. The three largest industries in each geography are highlighted.
NAICS Code & Description East Kern Kern County
Greater Antelope
Valley US
9011 Federal govt. (civilian) 36.9% 21.1% 2.9% 7.5% 1.9%
56 Admin. & support services 17.3% 5.3% 4.6% 5.5% 6.3%
9039 Local govt. 9.5% 2.9% 3.8% 2.8% 3.6%
9029 State govt. 5.6% 1.7% 2.2% 0.6% 1.5%
44-45 Retail trade 5.4% 10.4% 9.7% 15.9% 10.6%
72 Lodging, restaurants, & bars 5.0% 8.3% 6.6% 10.5% 8.5%
62 Healthcare & social assistance 4.9% 9.3% 10.5% 19.2% 13.3%
31-33 Manufacturing 3.5% 4.6% 4.3% 3.0% 8.2%
53 Property sales & leasing 3.2% 1.7% 1.2% 1.8% 1.7%
54 Professional services 2.9% 8.2% 3.6% 5.9% 6.4%
81 Personal & other services 1.9% 4.7% 3.6% 5.7% 4.9%
42 Wholesale trade 1.1% 1.5% 2.8% 1.5% 3.9%
52 Finance & insurance 0.7% 1.5% 1.7% 2.0% 3.9%
71 Arts, entertainment, & recreation 0.5% 1.2% 0.9% 0.8% 1.7%
21 Mining (incl. oil & gas) 0.2% 2.4% 3.4% 0.6% 0.5%
23 Construction 0.2% 3.0% 6.2% 4.6% 5.4%
51 Information 0.2% 0.5% 0.8% 0.9% 1.9%
61 Education 0.2% 8.0% 8.8% 8.0% 9.4%
48-49 Transportation & warehousing 0.2% 2.3% 2.9% 2.7% 3.4%
11 Agriculture & forestry 0.0% 0.0% 18.0% 0.1% 1.3%
22 Utilities 0.0% 0.8% 0.3% 0.3% 0.4%
55 Corporate & regional offices 0.0% 0.3% 1.0% 0.1% 1.4%
California City (93505)

CALIFORNIA CITY, CA DRAFT
ECONOMIC ASSESSMENT & SWOT ANALYSIS PAGE | 6
Location quotient (LQ) analysis can provide an understanding of an area’s relative strengths. The three most concentrated sectors in California City are government: federal government (with an LQ of 19.99), state government (3.99), and local government (2.72). The community also has above-average concentrations of employment in administrative and support services jobs (2.55) and real estate (1.87). The California City Correctional Facility’s role as the primary economic driver in the community is visible in this data. There may be an opportunity to develop locally serving businesses, such as retail, restaurants, and personal services, given California City’s low LQ scores in these sectors relative to the region, and the availability of higher-paying jobs in the community.
FIGURE 5. CONCENTRATION OF EMPLOYMENT BY SECTOR, 2015 LOCATION QUOTIENT (LQ) ANALYSIS BY MAJOR INDUSTRY SECTOR, US=1.00
Source: EMSI 2016.2 – QCEW Employees, Non-QCEW Employees, and Self-Employed Note: Figures exclude military and unclassified employment. Education includes public schools, colleges, and universities. Healthcare & social assistance includes public hospitals. LQs greater than 1.25 are presumed to show competitive advantage and are highlighted.
NAICS Code & Description East Kern Kern County
Greater Antelope
Valley US
9011 Federal govt. (civilian) 19.99 11.23 1.55 4.03 1.00
9029 State govt. 3.99 1.19 1.58 0.38 1.00
9039 Local govt. 2.72 0.81 1.08 0.77 1.00
56 Admin. & support services 2.55 0.81 0.71 0.85 1.00
53 Property sales & leasing 1.87 1.03 0.72 1.07 1.00
72 Lodging, restaurants, & bars 0.62 1.02 0.82 1.26 1.00
44-45 Retail trade 0.53 1.05 0.96 1.51 1.00
54 Professional services 0.43 1.20 0.53 0.90 1.00
31-33 Manufacturing 0.41 0.52 0.51 0.35 1.00
62 Healthcare & social assistance 0.37 0.70 0.79 1.44 1.00
81 Personal & other services 0.35 0.90 0.70 1.15 1.00
71 Arts, entertainment, & recreation 0.32 0.72 0.58 0.53 1.00
42 Wholesale trade 0.26 0.38 0.70 0.37 1.00
51 Information 0.21 0.30 0.50 0.49 1.00
52 Finance & insurance 0.19 0.37 0.42 0.51 1.00
48-49 Transportation & warehousing 0.09 0.70 0.89 0.78 1.00
23 Construction 0.06 0.50 1.05 0.86 1.00
61 Education 0.02 0.85 0.94 0.85 1.00
11 Agriculture & forestry 0.00 0.02 14.89 0.07 1.00
21 Mining (incl. oil & gas) 0.00 4.93 6.15 1.31 1.00
22 Utilities 0.00 2.23 0.87 0.81 1.00
55 Corporate & regional offices 0.00 0.20 0.67 0.07 1.00
California City (93505)
LOCATION QUOTIENT (LQ) ANALYSIS is a statistical technique used to suggest areas of relative advantage based on a region’s employment base. LQs are calculated as an industry’s share of total local employment divided by the same industry’s share of employment at the national level. If the local industry and national industry are perfectly proportional, the LQ will be 1.00. LQs greater than 1.25 are presumed to indicate a comparative advantage; those below 0.75 suggest areas of weakness but may also point to opportunities for expansion or attraction.
CALIFORNIA CITY, CA DRAFT
ECONOMIC ASSESSMENT & SWOT ANALYSIS PAGE | 7
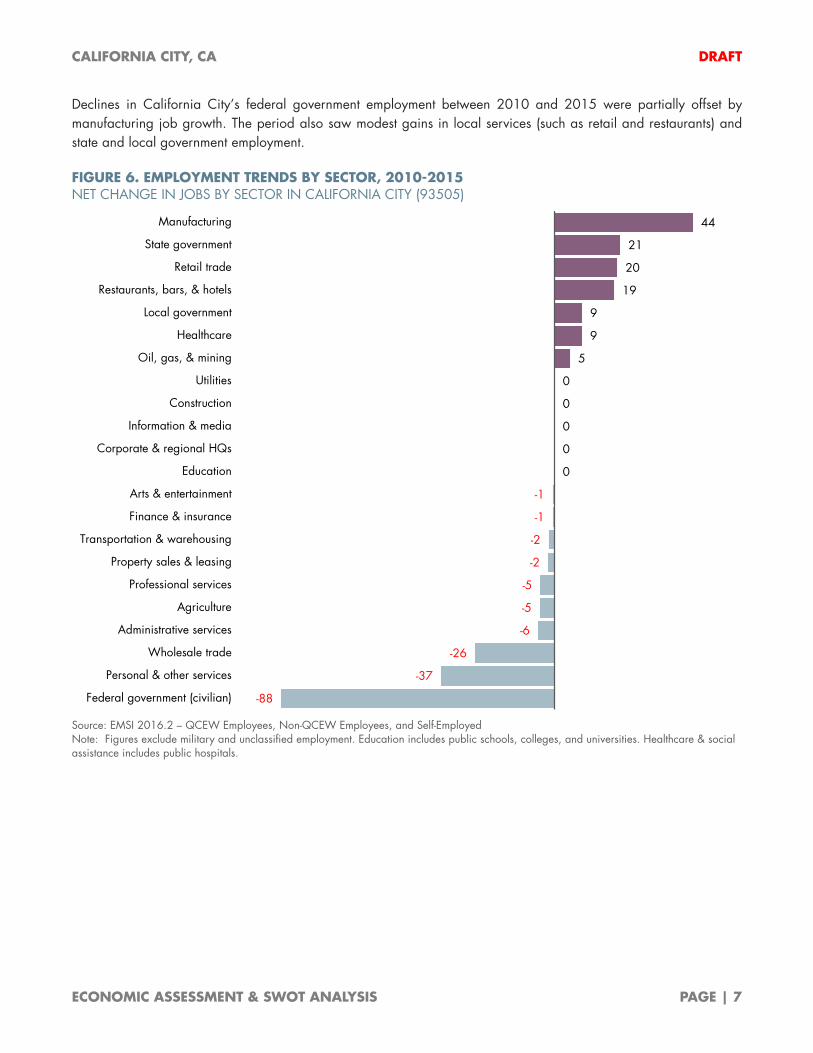
Declines in California City’s federal government employment between 2010 and 2015 were partially offset by manufacturing job growth. The period also saw modest gains in local services (such as retail and restaurants) and state and local government employment.
FIGURE 6. EMPLOYMENT TRENDS BY SECTOR, 2010-2015 NET CHANGE IN JOBS BY SECTOR IN CALIFORNIA CITY (93505)
Source: EMSI 2016.2 – QCEW Employees, Non-QCEW Employees, and Self-Employed Note: Figures exclude military and unclassified employment. Education includes public schools, colleges, and universities. Healthcare & social assistance includes public hospitals.
44
21
20
19
9
9
5
0
0
0
0
0
-1
-1
-2
-2
-5
-5
-6
-26
-37
-88
Manufacturing
State government
Retail trade
Restaurants, bars, & hotels
Local government
Healthcare
Oil, gas, & mining
Utilities
Construction
Information & media
Corporate & regional HQs
Education
Arts & entertainment
Finance & insurance
Transportation & warehousing
Property sales & leasing
Professional services
Agriculture
Administrative services
Wholesale trade
Personal & other services
Federal government (civilian)
CALIFORNIA CITY, CA DRAFT
ECONOMIC ASSESSMENT & SWOT ANALYSIS PAGE | 8
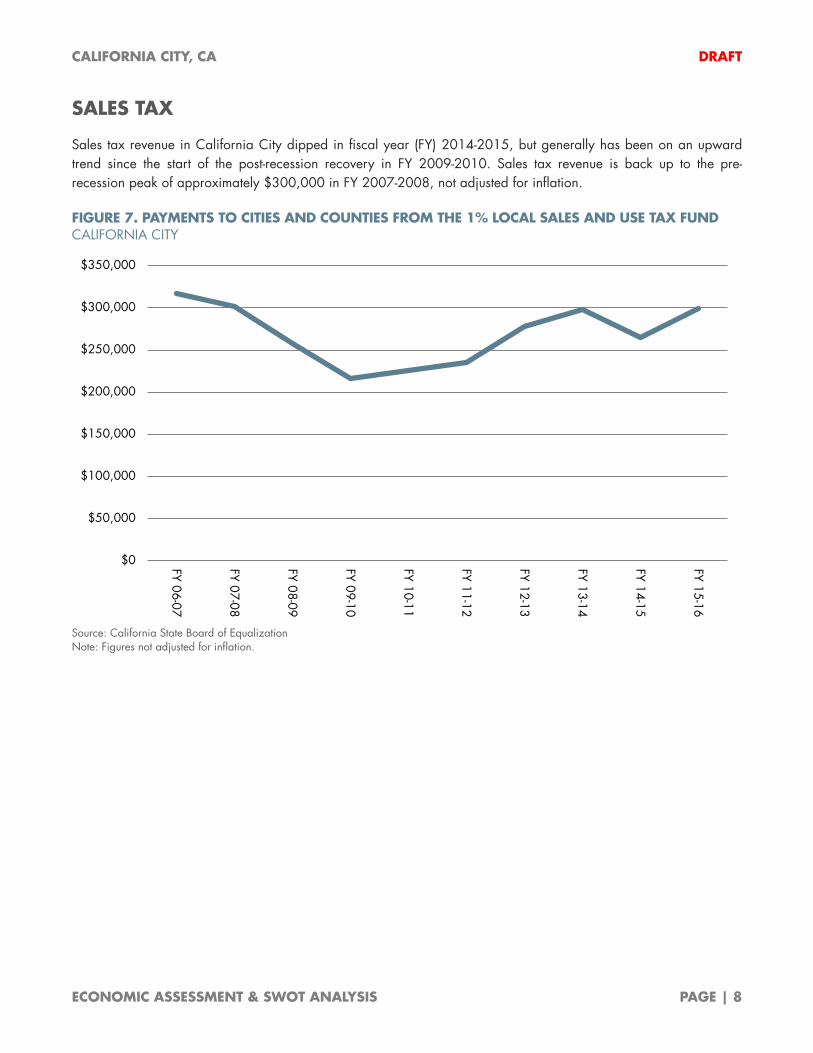
SALES TAX
Sales tax revenue in California City dipped in fiscal year (FY) 2014-2015, but generally has been on an upward trend since the start of the post-recession recovery in FY 2009-2010. Sales tax revenue is back up to the pre-recession peak of approximately $300,000 in FY 2007-2008, not adjusted for inflation.
FIGURE 7. PAYMENTS TO CITIES AND COUNTIES FROM THE 1% LOCAL SALES AND USE TAX FUND CALIFORNIA CITY
Source: California State Board of Equalization Note: Figures not adjusted for inflation.
$0
$50,000
$100,000
$150,000
$200,000
$250,000
$300,000
$350,000
FY 06-07
FY 07-08
FY 08-09
FY 09-10
FY 10-11
FY 11-12
FY 12-13
FY 13-14
FY 14-15
FY 15-16
CALIFORNIA CITY, CA DRAFT
ECONOMIC ASSESSMENT & SWOT ANALYSIS PAGE | 9
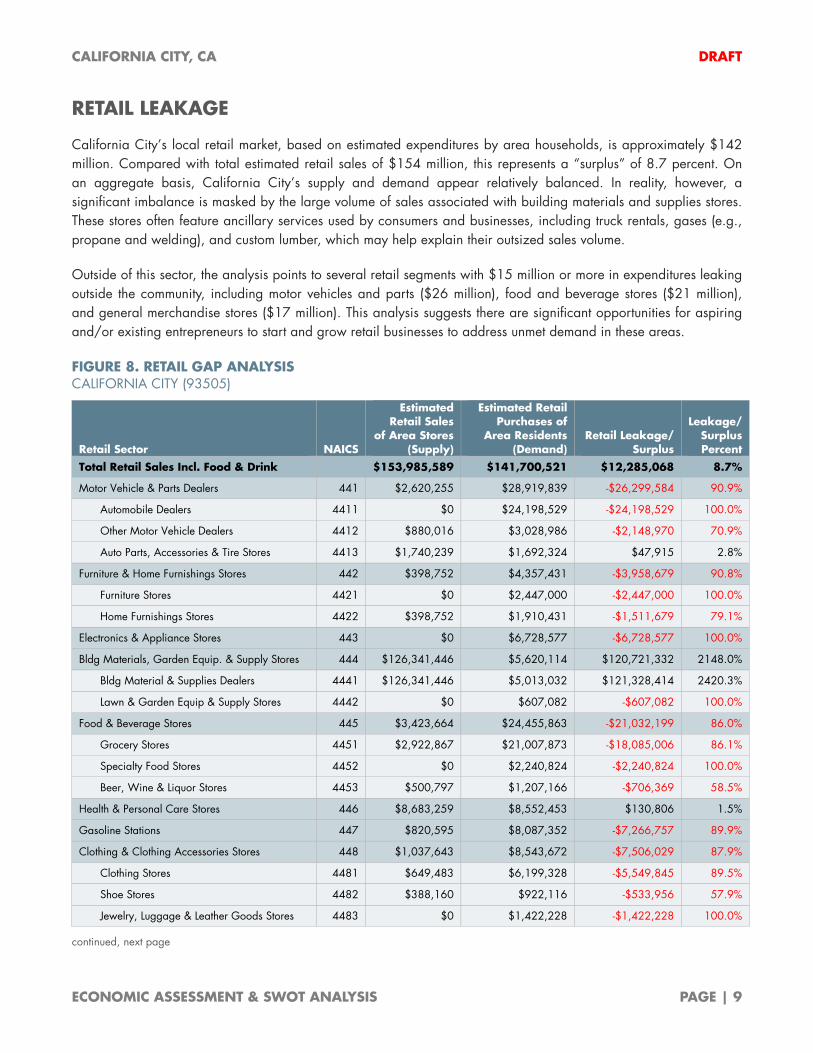
RETAIL LEAKAGE
California City’s local retail market, based on estimated expenditures by area households, is approximately $142 million. Compared with total estimated retail sales of $154 million, this represents a “surplus” of 8.7 percent. On an aggregate basis, California City’s supply and demand appear relatively balanced. In reality, however, a significant imbalance is masked by the large volume of sales associated with building materials and supplies stores. These stores often feature ancillary services used by consumers and businesses, including truck rentals, gases (e.g., propane and welding), and custom lumber, which may help explain their outsized sales volume.
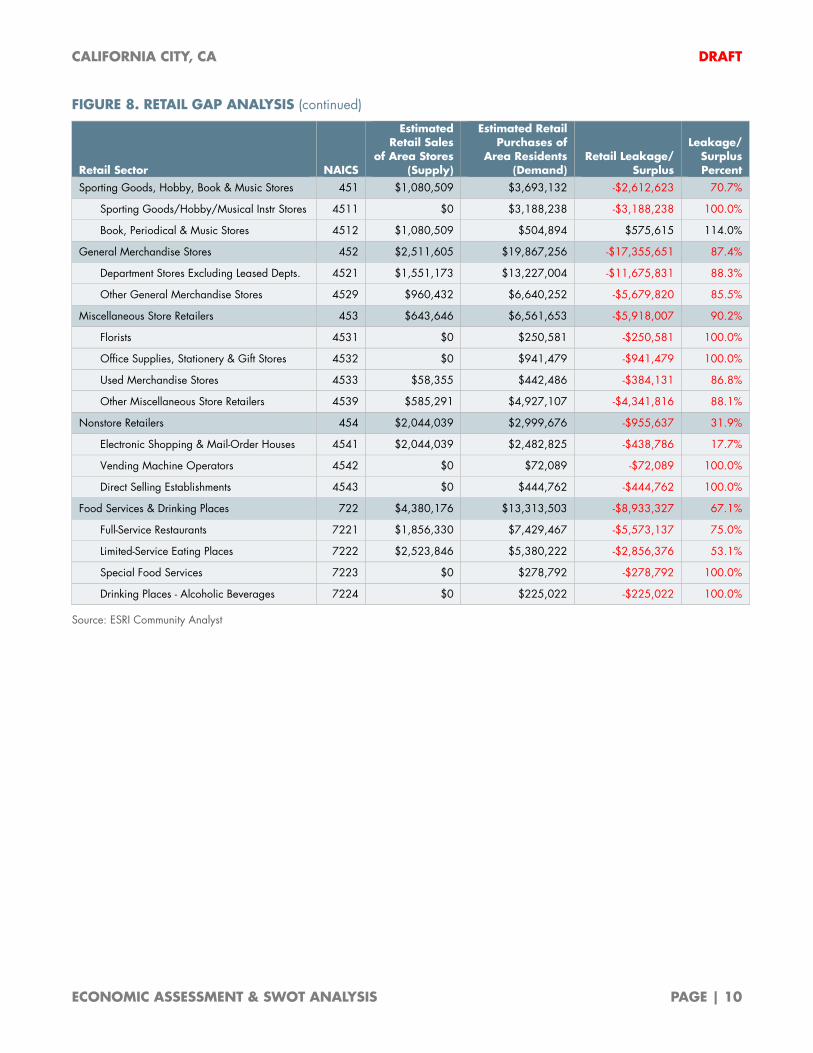
Outside of this sector, the analysis points to several retail segments with $15 million or more in expenditures leaking outside the community, including motor vehicles and parts ($26 million), food and beverage stores ($21 million), and general merchandise stores ($17 million). This analysis suggests there are significant opportunities for aspiring and/or existing entrepreneurs to start and grow retail businesses to address unmet demand in these areas.
FIGURE 8. RETAIL GAP ANALYSIS CALIFORNIA CITY (93505)
Retail Sector NAICS
Estimated Retail Sales
of Area Stores (Supply)
Estimated Retail Purchases of
Area Residents (Demand)
Retail Leakage/ Surplus
Leakage/ Surplus Percent
Total Retail Sales Incl. Food & Drink $153,985,589 $141,700,521 $12,285,068 8.7%
Motor Vehicle & Parts Dealers 441 $2,620,255 $28,919,839 -$26,299,584 90.9%
Automobile Dealers 4411 $0 $24,198,529 -$24,198,529 100.0%
Other Motor Vehicle Dealers 4412 $880,016 $3,028,986 -$2,148,970 70.9%
Auto Parts, Accessories & Tire Stores 4413 $1,740,239 $1,692,324 $47,915 2.8%
Furniture & Home Furnishings Stores 442 $398,752 $4,357,431 -$3,958,679 90.8%
Furniture Stores 4421 $0 $2,447,000 -$2,447,000 100.0%
Home Furnishings Stores 4422 $398,752 $1,910,431 -$1,511,679 79.1%
Electronics & Appliance Stores 443 $0 $6,728,577 -$6,728,577 100.0%
Bldg Materials, Garden Equip. & Supply Stores 444 $126,341,446 $5,620,114 $120,721,332 2148.0%
Bldg Material & Supplies Dealers 4441 $126,341,446 $5,013,032 $121,328,414 2420.3%
Lawn & Garden Equip & Supply Stores 4442 $0 $607,082 -$607,082 100.0%
Food & Beverage Stores 445 $3,423,664 $24,455,863 -$21,032,199 86.0%
Grocery Stores 4451 $2,922,867 $21,007,873 -$18,085,006 86.1%
Specialty Food Stores 4452 $0 $2,240,824 -$2,240,824 100.0%
Beer, Wine & Liquor Stores 4453 $500,797 $1,207,166 -$706,369 58.5%
Health & Personal Care Stores 446 $8,683,259 $8,552,453 $130,806 1.5%
Gasoline Stations 447 $820,595 $8,087,352 -$7,266,757 89.9%
Clothing & Clothing Accessories Stores 448 $1,037,643 $8,543,672 -$7,506,029 87.9%
Clothing Stores 4481 $649,483 $6,199,328 -$5,549,845 89.5%
Shoe Stores 4482 $388,160 $922,116 -$533,956 57.9%
Jewelry, Luggage & Leather Goods Stores 4483 $0 $1,422,228 -$1,422,228 100.0%
continued, next page
CALIFORNIA CITY, CA DRAFT
ECONOMIC ASSESSMENT & SWOT ANALYSIS PAGE | 10
FIGURE 8. RETAIL GAP ANALYSIS (continued)
Retail Sector NAICS
Estimated Retail Sales
of Area Stores (Supply)
Estimated Retail Purchases of
Area Residents (Demand)
Retail Leakage/ Surplus
Leakage/ Surplus Percent
Sporting Goods, Hobby, Book & Music Stores 451 $1,080,509 $3,693,132 -$2,612,623 70.7%
Sporting Goods/Hobby/Musical Instr Stores 4511 $0 $3,188,238 -$3,188,238 100.0%
Book, Periodical & Music Stores 4512 $1,080,509 $504,894 $575,615 114.0%
General Merchandise Stores 452 $2,511,605 $19,867,256 -$17,355,651 87.4%
Department Stores Excluding Leased Depts. 4521 $1,551,173 $13,227,004 -$11,675,831 88.3%
Other General Merchandise Stores 4529 $960,432 $6,640,252 -$5,679,820 85.5%
Miscellaneous Store Retailers 453 $643,646 $6,561,653 -$5,918,007 90.2%
Florists 4531 $0 $250,581 -$250,581 100.0%
Office Supplies, Stationery & Gift Stores 4532 $0 $941,479 -$941,479 100.0%
Used Merchandise Stores 4533 $58,355 $442,486 -$384,131 86.8%
Other Miscellaneous Store Retailers 4539 $585,291 $4,927,107 -$4,341,816 88.1%
Nonstore Retailers 454 $2,044,039 $2,999,676 -$955,637 31.9%
Electronic Shopping & Mail-Order Houses 4541 $2,044,039 $2,482,825 -$438,786 17.7%
Vending Machine Operators 4542 $0 $72,089 -$72,089 100.0%
Direct Selling Establishments 4543 $0 $444,762 -$444,762 100.0%
Food Services & Drinking Places 722 $4,380,176 $13,313,503 -$8,933,327 67.1%
Full-Service Restaurants 7221 $1,856,330 $7,429,467 -$5,573,137 75.0%
Limited-Service Eating Places 7222 $2,523,846 $5,380,222 -$2,856,376 53.1%
Special Food Services 7223 $0 $278,792 -$278,792 100.0%
Drinking Places - Alcoholic Beverages 7224 $0 $225,022 -$225,022 100.0%
Source: ESRI Community Analyst
CALIFORNIA CITY, CA DRAFT
ECONOMIC ASSESSMENT & SWOT ANALYSIS PAGE | 11
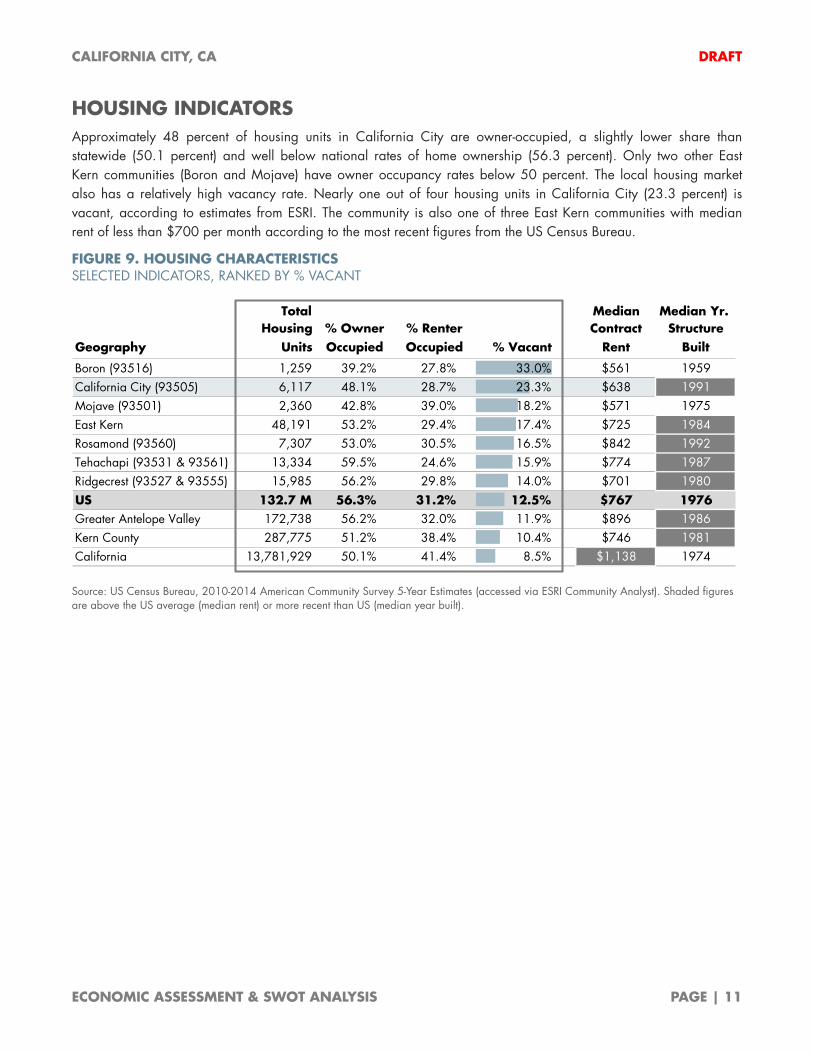
HOUSING INDICATORS Approximately 48 percent of housing units in California City are owner-occupied, a slightly lower share than statewide (50.1 percent) and well below national rates of home ownership (56.3 percent). Only two other East Kern communities (Boron and Mojave) have owner occupancy rates below 50 percent. The local housing market also has a relatively high vacancy rate. Nearly one out of four housing units in California City (23.3 percent) is vacant, according to estimates from ESRI. The community is also one of three East Kern communities with median rent of less than $700 per month according to the most recent figures from the US Census Bureau.
FIGURE 9. HOUSING CHARACTERISTICS SELECTED INDICATORS, RANKED BY % VACANT
Source: US Census Bureau, 2010-2014 American Community Survey 5-Year Estimates (accessed via ESRI Community Analyst). Shaded figures are above the US average (median rent) or more recent than US (median year built).
Total Median Median Yr. Housing % Owner % Renter Contract Structure
Geography Units Occupied Occupied % Vacant Rent Built
Boron (93516) 1,259 39.2% 27.8% 33.0% $561 1959California City (93505) 6,117 48.1% 28.7% 23.3% $638 1991Mojave (93501) 2,360 42.8% 39.0% 18.2% $571 1975East Kern 48,191 53.2% 29.4% 17.4% $725 1984Rosamond (93560) 7,307 53.0% 30.5% 16.5% $842 1992Tehachapi (93531 & 93561) 13,334 59.5% 24.6% 15.9% $774 1987Ridgecrest (93527 & 93555) 15,985 56.2% 29.8% 14.0% $701 1980US 132.7 M 56.3% 31.2% 12.5% $767 1976Greater Antelope Valley 172,738 56.2% 32.0% 11.9% $896 1986Kern County 287,775 51.2% 38.4% 10.4% $746 1981California 13,781,929 50.1% 41.4% 8.5% $1,138 1974
CALIFORNIA CITY, CA DRAFT
ECONOMIC ASSESSMENT & SWOT ANALYSIS PAGE | 12
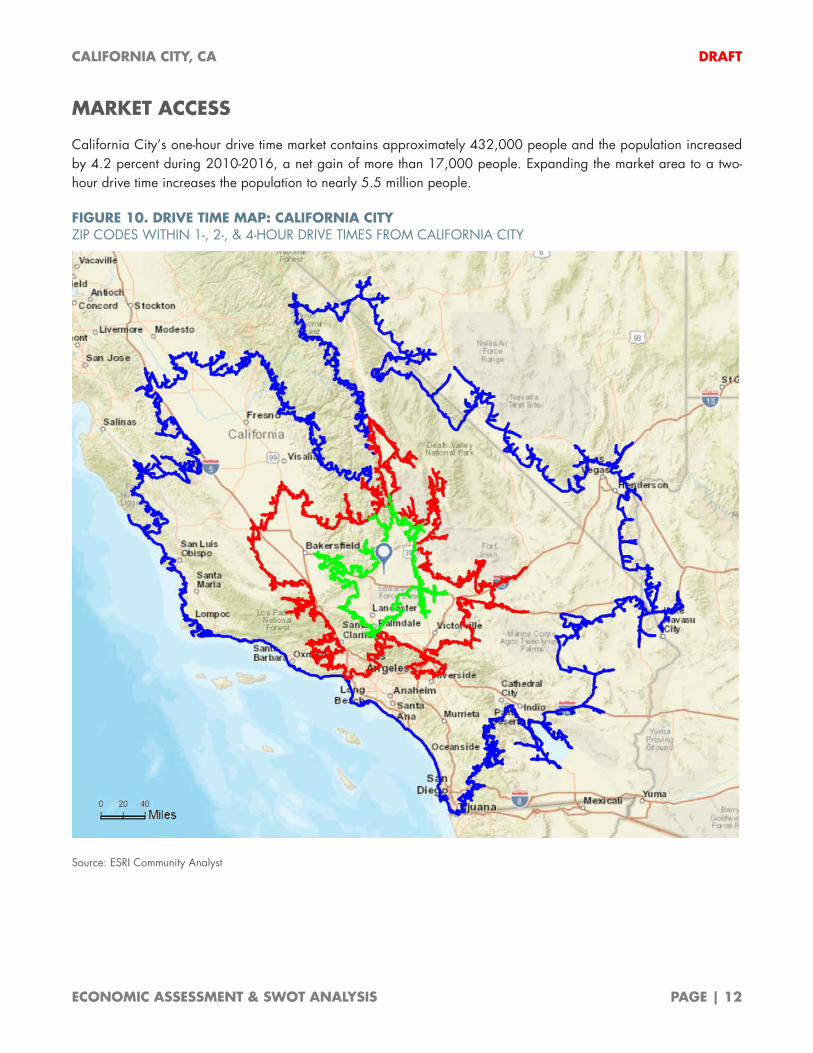
MARKET ACCESS
California City’s one-hour drive time market contains approximately 432,000 people and the population increased by 4.2 percent during 2010-2016, a net gain of more than 17,000 people. Expanding the market area to a two-hour drive time increases the population to nearly 5.5 million people.
FIGURE 10. DRIVE TIME MAP: CALIFORNIA CITY ZIP CODES WITHIN 1-, 2-, & 4-HOUR DRIVE TIMES FROM CALIFORNIA CITY
Source: ESRI Community Analyst
CALIFORNIA CITY, CA DRAFT
ECONOMIC ASSESSMENT & SWOT ANALYSIS PAGE | 13
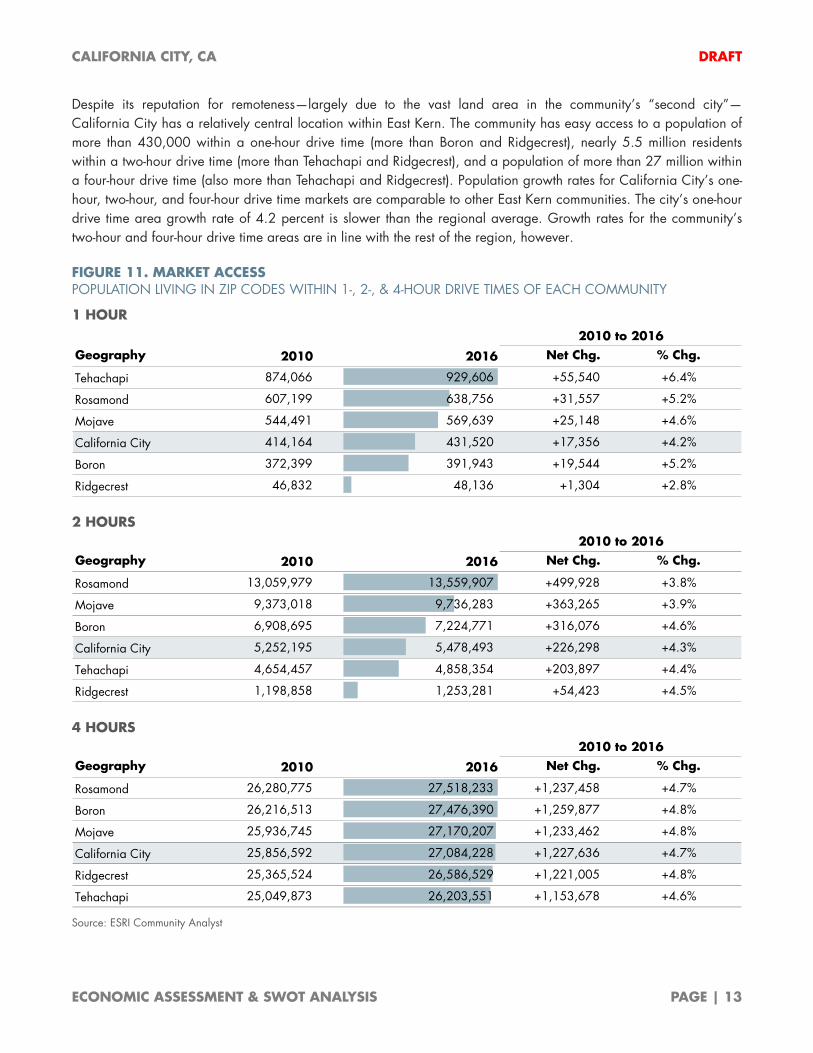
Despite its reputation for remoteness—largely due to the vast land area in the community’s “second city”—California City has a relatively central location within East Kern. The community has easy access to a population of more than 430,000 within a one-hour drive time (more than Boron and Ridgecrest), nearly 5.5 million residents within a two-hour drive time (more than Tehachapi and Ridgecrest), and a population of more than 27 million within a four-hour drive time (also more than Tehachapi and Ridgecrest). Population growth rates for California City’s one-hour, two-hour, and four-hour drive time markets are comparable to other East Kern communities. The city’s one-hour drive time area growth rate of 4.2 percent is slower than the regional average. Growth rates for the community’s two-hour and four-hour drive time areas are in line with the rest of the region, however.
FIGURE 11. MARKET ACCESS POPULATION LIVING IN ZIP CODES WITHIN 1-, 2-, & 4-HOUR DRIVE TIMES OF EACH COMMUNITY
1 HOUR
2 HOURS
4 HOURS
Source: ESRI Community Analyst
Geography Net Chg. % Chg.
Tehachapi 874,066 929,606 +55,540 +6.4%
Rosamond 607,199 638,756 +31,557 +5.2%
Mojave 544,491 569,639 +25,148 +4.6%
California City 414,164 431,520 +17,356 +4.2%
Boron 372,399 391,943 +19,544 +5.2%
Ridgecrest 46,832 48,136 +1,304 +2.8%
2010 2016
2010 to 2016
Geography Net Chg. % Chg.
Rosamond 13,059,979 13,559,907 +499,928 +3.8%
Mojave 9,373,018 9,736,283 +363,265 +3.9%
Boron 6,908,695 7,224,771 +316,076 +4.6%
California City 5,252,195 5,478,493 +226,298 +4.3%
Tehachapi 4,654,457 4,858,354 +203,897 +4.4%
Ridgecrest 1,198,858 1,253,281 +54,423 +4.5%
2010 2016
2010 to 2016
Geography Net Chg. % Chg.
Rosamond 26,280,775 27,518,233 +1,237,458 +4.7%
Boron 26,216,513 27,476,390 +1,259,877 +4.8%
Mojave 25,936,745 27,170,207 +1,233,462 +4.8%
California City 25,856,592 27,084,228 +1,227,636 +4.7%
Ridgecrest 25,365,524 26,586,529 +1,221,005 +4.8%
Tehachapi 25,049,873 26,203,551 +1,153,678 +4.6%
2010 2016
2010 to 2016
CALIFORNIA CITY, CA DRAFT
ECONOMIC ASSESSMENT & SWOT ANALYSIS PAGE | 14
WORKFORCE TRENDS & CHARACTERISTICS
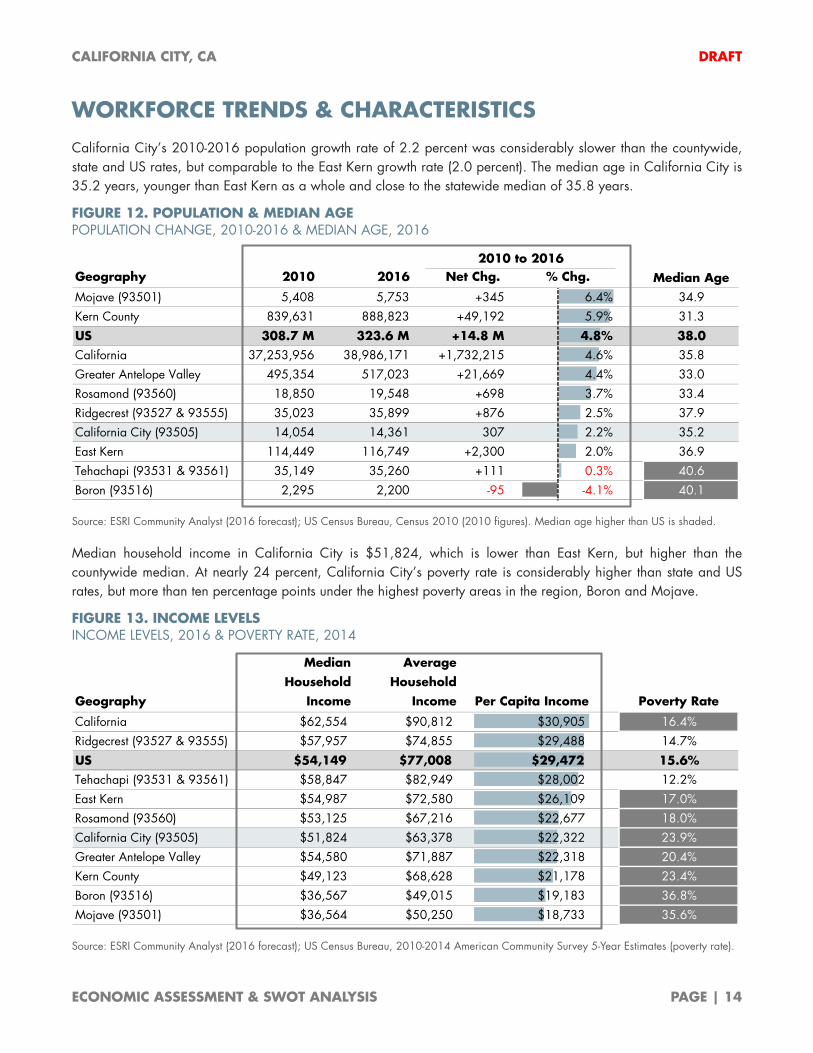
California City’s 2010-2016 population growth rate of 2.2 percent was considerably slower than the countywide, state and US rates, but comparable to the East Kern growth rate (2.0 percent). The median age in California City is 35.2 years, younger than East Kern as a whole and close to the statewide median of 35.8 years.
FIGURE 12. POPULATION & MEDIAN AGE POPULATION CHANGE, 2010-2016 & MEDIAN AGE, 2016
Source: ESRI Community Analyst (2016 forecast); US Census Bureau, Census 2010 (2010 figures). Median age higher than US is shaded.
Median household income in California City is $51,824, which is lower than East Kern, but higher than the countywide median. At nearly 24 percent, California City’s poverty rate is considerably higher than state and US rates, but more than ten percentage points under the highest poverty areas in the region, Boron and Mojave.
FIGURE 13. INCOME LEVELS INCOME LEVELS, 2016 & POVERTY RATE, 2014
Source: ESRI Community Analyst (2016 forecast); US Census Bureau, 2010-2014 American Community Survey 5-Year Estimates (poverty rate).
Geography 2010 2016 Net Chg. % Chg.
Mojave (93501) 5,408 5,753 +345 6.4% 34.9Kern County 839,631 888,823 +49,192 5.9% 31.3
US 308.7 M 323.6 M +14.8 M 4.8% 38.0California 37,253,956 38,986,171 +1,732,215 4.6% 35.8Greater Antelope Valley 495,354 517,023 +21,669 4.4% 33.0Rosamond (93560) 18,850 19,548 +698 3.7% 33.4Ridgecrest (93527 & 93555) 35,023 35,899 +876 2.5% 37.9California City (93505) 14,054 14,361 307 2.2% 35.2East Kern 114,449 116,749 +2,300 2.0% 36.9Tehachapi (93531 & 93561) 35,149 35,260 +111 0.3% 40.6Boron (93516) 2,295 2,200 -95 -4.1% 40.1
2010 to 2016Median Age
Median AverageHousehold Household
Geography Income Income Per Capita Income Poverty Rate
California $62,554 $90,812 $30,905 16.4%Ridgecrest (93527 & 93555) $57,957 $74,855 $29,488 14.7%
US $54,149 $77,008 $29,472 15.6%Tehachapi (93531 & 93561) $58,847 $82,949 $28,002 12.2%East Kern $54,987 $72,580 $26,109 17.0%Rosamond (93560) $53,125 $67,216 $22,677 18.0%California City (93505) $51,824 $63,378 $22,322 23.9%Greater Antelope Valley $54,580 $71,887 $22,318 20.4%Kern County $49,123 $68,628 $21,178 23.4%Boron (93516) $36,567 $49,015 $19,183 36.8%Mojave (93501) $36,564 $50,250 $18,733 35.6%
CALIFORNIA CITY, CA DRAFT
ECONOMIC ASSESSMENT & SWOT ANALYSIS PAGE | 15
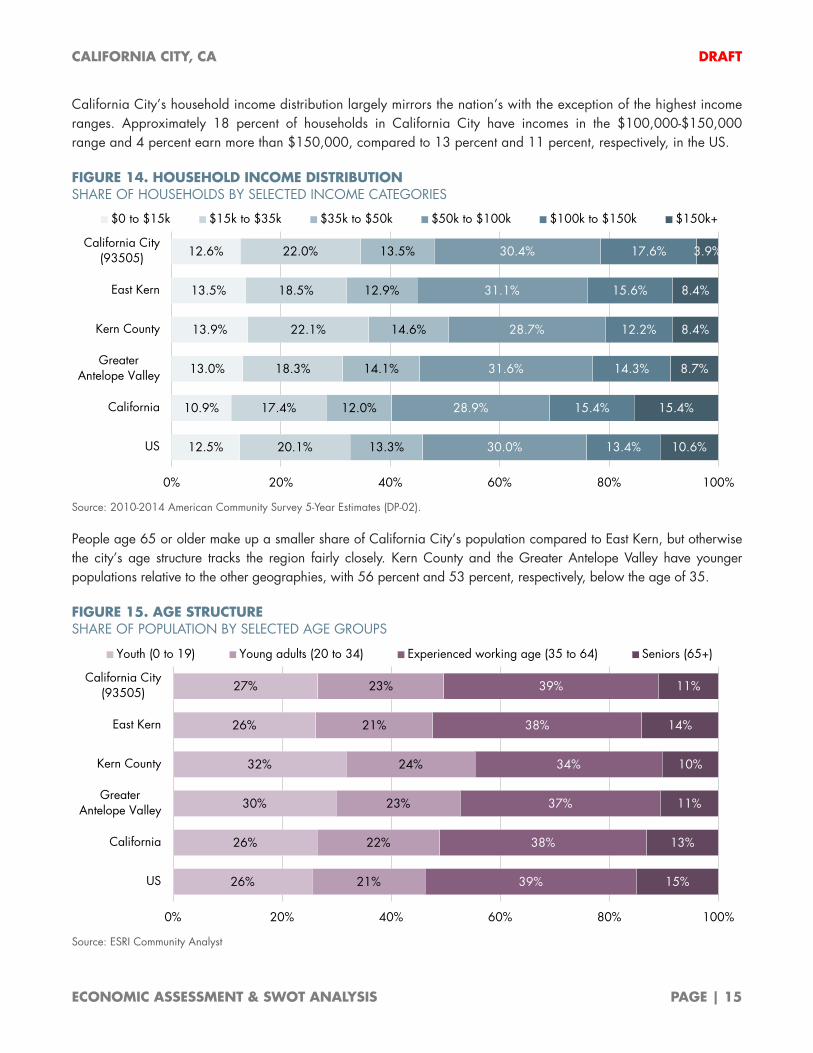
California City’s household income distribution largely mirrors the nation’s with the exception of the highest income ranges. Approximately 18 percent of households in California City have incomes in the $100,000-$150,000 range and 4 percent earn more than $150,000, compared to 13 percent and 11 percent, respectively, in the US.
FIGURE 14. HOUSEHOLD INCOME DISTRIBUTION SHARE OF HOUSEHOLDS BY SELECTED INCOME CATEGORIES
Source: 2010-2014 American Community Survey 5-Year Estimates (DP-02).
People age 65 or older make up a smaller share of California City’s population compared to East Kern, but otherwise the city’s age structure tracks the region fairly closely. Kern County and the Greater Antelope Valley have younger populations relative to the other geographies, with 56 percent and 53 percent, respectively, below the age of 35.
FIGURE 15. AGE STRUCTURE SHARE OF POPULATION BY SELECTED AGE GROUPS
Source: ESRI Community Analyst
12.5%
10.9%
13.0%
13.9%
13.5%
12.6%
20.1%
17.4%
18.3%
22.1%
18.5%
22.0%
13.3%
12.0%
14.1%
14.6%
12.9%
13.5%
30.0%
28.9%
31.6%
28.7%
31.1%
30.4%
13.4%
15.4%
14.3%
12.2%
15.6%
17.6%
10.6%
15.4%
8.7%
8.4%
8.4%
3.9%
0% 20% 40% 60% 80% 100%
US
California
GreaterAntelope Valley
Kern County
East Kern
California City(93505)
$0 to $15k $15k to $35k $35k to $50k $50k to $100k $100k to $150k $150k+
26%
26%
30%
32%
26%
27%
21%
22%
23%
24%
21%
23%
39%
38%
37%
34%
38%
39%
15%
13%
11%
10%
14%
11%
0% 20% 40% 60% 80% 100%
US
California
GreaterAntelope Valley
Kern County
East Kern
California City(93505)
Youth (0 to 19) Young adults (20 to 34) Experienced working age (35 to 64) Seniors (65+)
CALIFORNIA CITY, CA DRAFT
ECONOMIC ASSESSMENT & SWOT ANALYSIS PAGE | 16
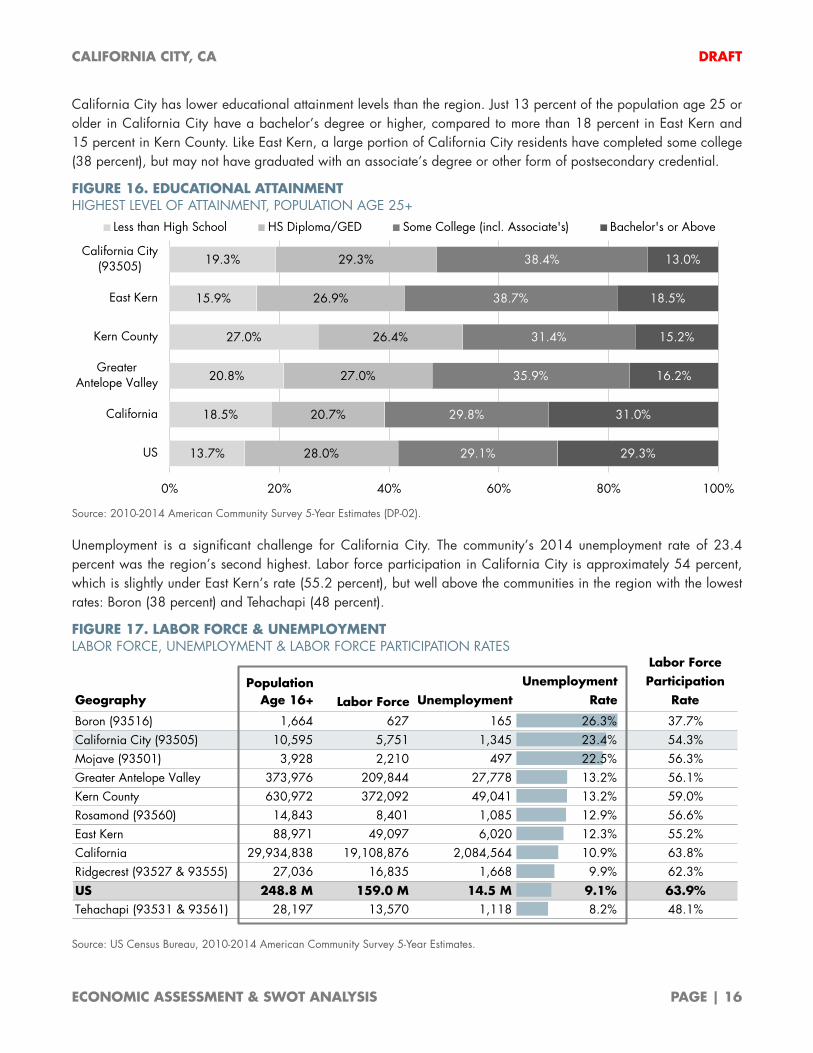
California City has lower educational attainment levels than the region. Just 13 percent of the population age 25 or older in California City have a bachelor’s degree or higher, compared to more than 18 percent in East Kern and 15 percent in Kern County. Like East Kern, a large portion of California City residents have completed some college (38 percent), but may not have graduated with an associate’s degree or other form of postsecondary credential.
FIGURE 16. EDUCATIONAL ATTAINMENT HIGHEST LEVEL OF ATTAINMENT, POPULATION AGE 25+
Source: 2010-2014 American Community Survey 5-Year Estimates (DP-02).
Unemployment is a significant challenge for California City. The community’s 2014 unemployment rate of 23.4 percent was the region’s second highest. Labor force participation in California City is approximately 54 percent, which is slightly under East Kern’s rate (55.2 percent), but well above the communities in the region with the lowest rates: Boron (38 percent) and Tehachapi (48 percent).
FIGURE 17. LABOR FORCE & UNEMPLOYMENT LABOR FORCE, UNEMPLOYMENT & LABOR FORCE PARTICIPATION RATES
Source: US Census Bureau, 2010-2014 American Community Survey 5-Year Estimates.
13.7%
18.5%
20.8%
27.0%
15.9%
19.3%
28.0%
20.7%
27.0%
26.4%
26.9%
29.3%
29.1%
29.8%
35.9%
31.4%
38.7%
38.4%
29.3%
31.0%
16.2%
15.2%
18.5%
13.0%
0% 20% 40% 60% 80% 100%
US
California
GreaterAntelope Valley
Kern County
East Kern
California City(93505)
Less than High School HS Diploma/GED Some College (incl. Associate's) Bachelor's or Above
Labor Force
Population Unemployment ParticipationGeography Age 16+ Labor Force Unemployment Rate Rate
Boron (93516) 1,664 627 165 26.3% 37.7%California City (93505) 10,595 5,751 1,345 23.4% 54.3%Mojave (93501) 3,928 2,210 497 22.5% 56.3%Greater Antelope Valley 373,976 209,844 27,778 13.2% 56.1%Kern County 630,972 372,092 49,041 13.2% 59.0%Rosamond (93560) 14,843 8,401 1,085 12.9% 56.6%East Kern 88,971 49,097 6,020 12.3% 55.2%California 29,934,838 19,108,876 2,084,564 10.9% 63.8%Ridgecrest (93527 & 93555) 27,036 16,835 1,668 9.9% 62.3%US 248.8 M 159.0 M 14.5 M 9.1% 63.9%Tehachapi (93531 & 93561) 28,197 13,570 1,118 8.2% 48.1%
CALIFORNIA CITY, CA DRAFT
ECONOMIC ASSESSMENT & SWOT ANALYSIS PAGE | 17
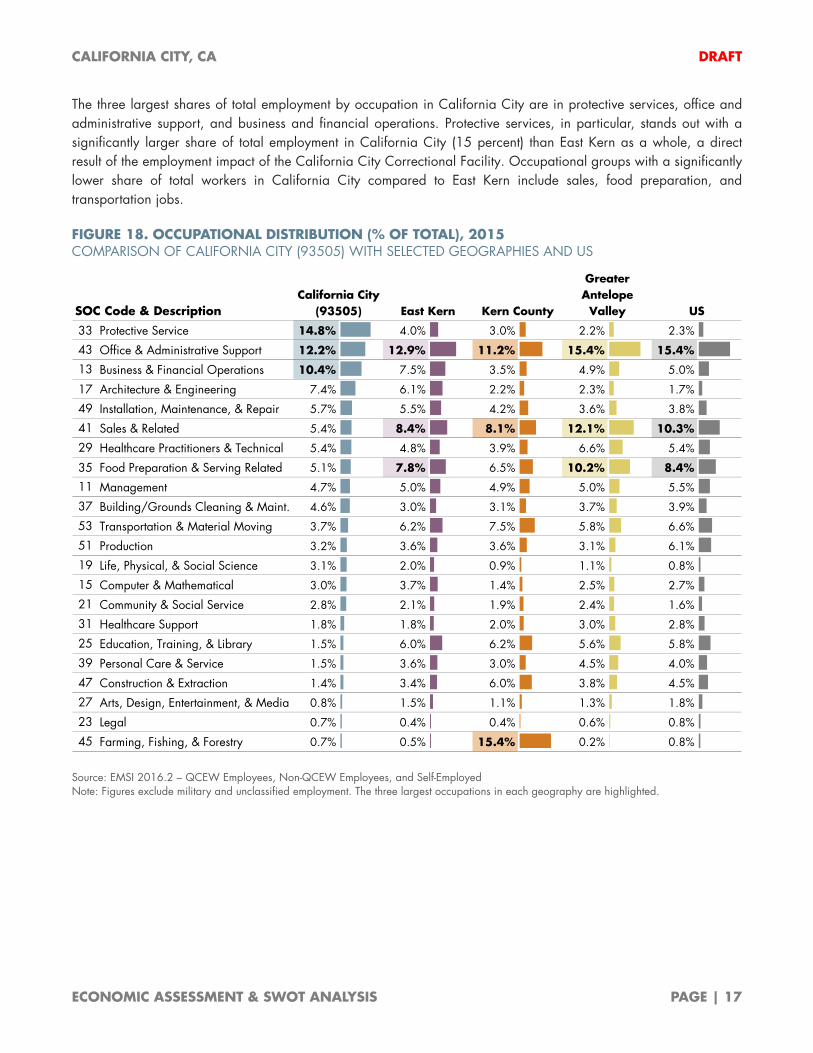
The three largest shares of total employment by occupation in California City are in protective services, office and administrative support, and business and financial operations. Protective services, in particular, stands out with a significantly larger share of total employment in California City (15 percent) than East Kern as a whole, a direct result of the employment impact of the California City Correctional Facility. Occupational groups with a significantly lower share of total workers in California City compared to East Kern include sales, food preparation, and transportation jobs.
FIGURE 18. OCCUPATIONAL DISTRIBUTION (% OF TOTAL), 2015 COMPARISON OF CALIFORNIA CITY (93505) WITH SELECTED GEOGRAPHIES AND US
Source: EMSI 2016.2 – QCEW Employees, Non-QCEW Employees, and Self-Employed Note: Figures exclude military and unclassified employment. The three largest occupations in each geography are highlighted.
SOC Code & Description
33 Protective Service 14.8% 4.0% 3.0% 2.2% 2.3%
43 Office & Administrative Support 12.2% 12.9% 11.2% 15.4% 15.4%
13 Business & Financial Operations 10.4% 7.5% 3.5% 4.9% 5.0%
17 Architecture & Engineering 7.4% 6.1% 2.2% 2.3% 1.7%
49 Installation, Maintenance, & Repair 5.7% 5.5% 4.2% 3.6% 3.8%
41 Sales & Related 5.4% 8.4% 8.1% 12.1% 10.3%
29 Healthcare Practitioners & Technical 5.4% 4.8% 3.9% 6.6% 5.4%
35 Food Preparation & Serving Related 5.1% 7.8% 6.5% 10.2% 8.4%
11 Management 4.7% 5.0% 4.9% 5.0% 5.5%
37 Building/Grounds Cleaning & Maint. 4.6% 3.0% 3.1% 3.7% 3.9%
53 Transportation & Material Moving 3.7% 6.2% 7.5% 5.8% 6.6%
51 Production 3.2% 3.6% 3.6% 3.1% 6.1%
19 Life, Physical, & Social Science 3.1% 2.0% 0.9% 1.1% 0.8%
15 Computer & Mathematical 3.0% 3.7% 1.4% 2.5% 2.7%
21 Community & Social Service 2.8% 2.1% 1.9% 2.4% 1.6%
31 Healthcare Support 1.8% 1.8% 2.0% 3.0% 2.8%
25 Education, Training, & Library 1.5% 6.0% 6.2% 5.6% 5.8%
39 Personal Care & Service 1.5% 3.6% 3.0% 4.5% 4.0%
47 Construction & Extraction 1.4% 3.4% 6.0% 3.8% 4.5%
27 Arts, Design, Entertainment, & Media 0.8% 1.5% 1.1% 1.3% 1.8%
23 Legal 0.7% 0.4% 0.4% 0.6% 0.8%
45 Farming, Fishing, & Forestry 0.7% 0.5% 15.4% 0.2% 0.8%
California City (93505) East Kern Kern County
Greater Antelope
Valley US
CALIFORNIA CITY, CA DRAFT
ECONOMIC ASSESSMENT & SWOT ANALYSIS PAGE | 18
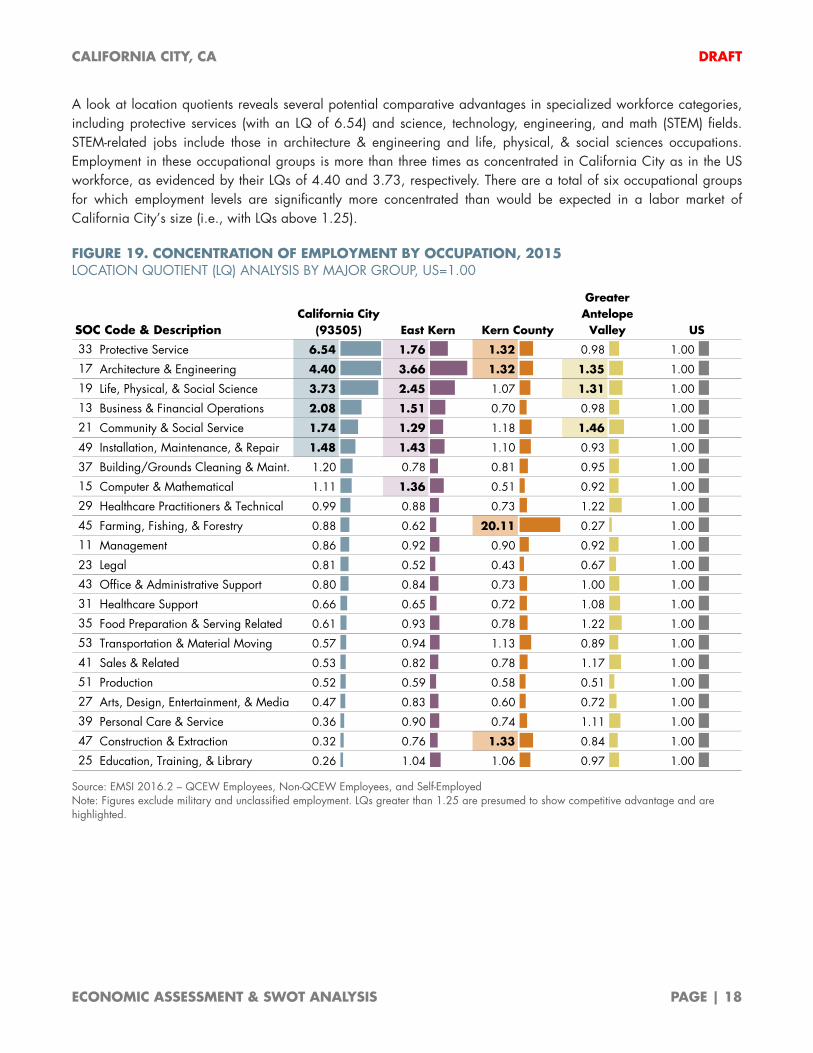
A look at location quotients reveals several potential comparative advantages in specialized workforce categories, including protective services (with an LQ of 6.54) and science, technology, engineering, and math (STEM) fields. STEM-related jobs include those in architecture & engineering and life, physical, & social sciences occupations. Employment in these occupational groups is more than three times as concentrated in California City as in the US workforce, as evidenced by their LQs of 4.40 and 3.73, respectively. There are a total of six occupational groups for which employment levels are significantly more concentrated than would be expected in a labor market of California City’s size (i.e., with LQs above 1.25).
FIGURE 19. CONCENTRATION OF EMPLOYMENT BY OCCUPATION, 2015 LOCATION QUOTIENT (LQ) ANALYSIS BY MAJOR GROUP, US=1.00
Source: EMSI 2016.2 – QCEW Employees, Non-QCEW Employees, and Self-Employed Note: Figures exclude military and unclassified employment. LQs greater than 1.25 are presumed to show competitive advantage and are highlighted.
SOC Code & Description33 Protective Service 6.54 1.76 1.32 0.98 1.00
17 Architecture & Engineering 4.40 3.66 1.32 1.35 1.00
19 Life, Physical, & Social Science 3.73 2.45 1.07 1.31 1.00
13 Business & Financial Operations 2.08 1.51 0.70 0.98 1.00
21 Community & Social Service 1.74 1.29 1.18 1.46 1.00
49 Installation, Maintenance, & Repair 1.48 1.43 1.10 0.93 1.00
37 Building/Grounds Cleaning & Maint. 1.20 0.78 0.81 0.95 1.00
15 Computer & Mathematical 1.11 1.36 0.51 0.92 1.00
29 Healthcare Practitioners & Technical 0.99 0.88 0.73 1.22 1.00
45 Farming, Fishing, & Forestry 0.88 0.62 20.11 0.27 1.00
11 Management 0.86 0.92 0.90 0.92 1.00
23 Legal 0.81 0.52 0.43 0.67 1.00
43 Office & Administrative Support 0.80 0.84 0.73 1.00 1.00
31 Healthcare Support 0.66 0.65 0.72 1.08 1.00
35 Food Preparation & Serving Related 0.61 0.93 0.78 1.22 1.00
53 Transportation & Material Moving 0.57 0.94 1.13 0.89 1.00
41 Sales & Related 0.53 0.82 0.78 1.17 1.00
51 Production 0.52 0.59 0.58 0.51 1.00
27 Arts, Design, Entertainment, & Media 0.47 0.83 0.60 0.72 1.00
39 Personal Care & Service 0.36 0.90 0.74 1.11 1.00
47 Construction & Extraction 0.32 0.76 1.33 0.84 1.00
25 Education, Training, & Library 0.26 1.04 1.06 0.97 1.00
California City (93505) East Kern Kern County
Greater Antelope
Valley US
CALIFORNIA CITY, CA DRAFT
ECONOMIC ASSESSMENT & SWOT ANALYSIS PAGE | 19
COMMUTING PATTERNS
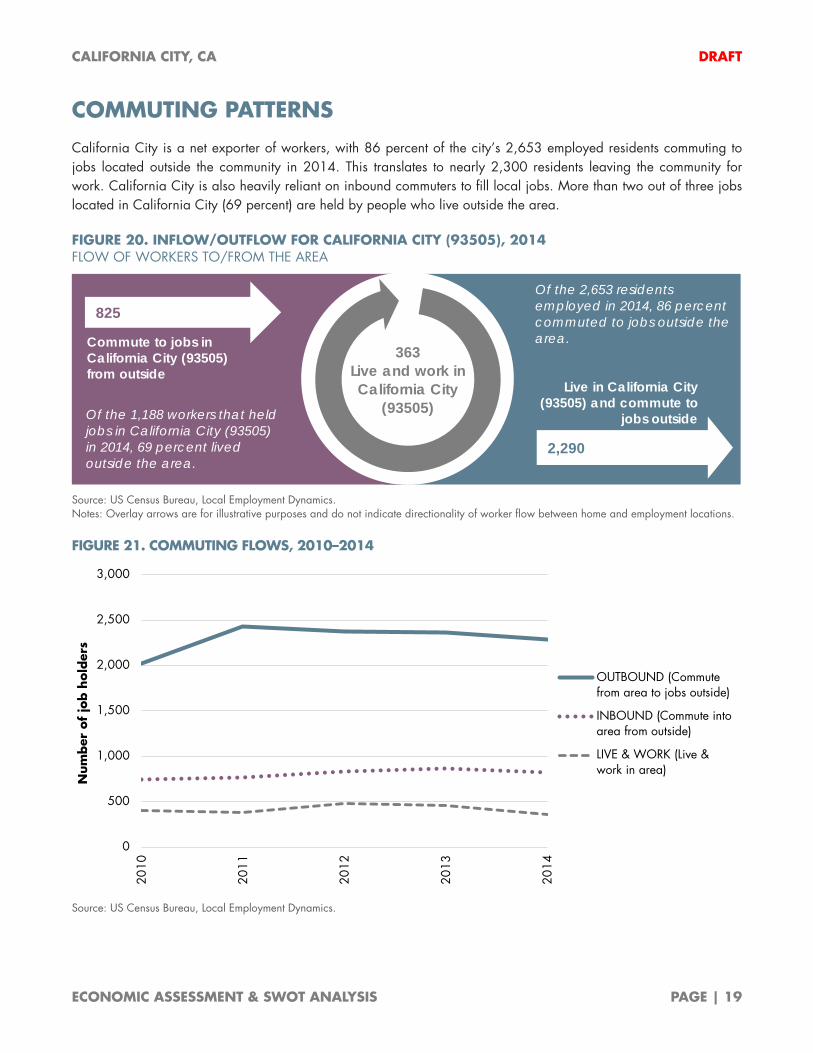
California City is a net exporter of workers, with 86 percent of the city’s 2,653 employed residents commuting to jobs located outside the community in 2014. This translates to nearly 2,300 residents leaving the community for work. California City is also heavily reliant on inbound commuters to fill local jobs. More than two out of three jobs located in California City (69 percent) are held by people who live outside the area.
FIGURE 20. INFLOW/OUTFLOW FOR CALIFORNIA CITY (93505), 2014 FLOW OF WORKERS TO/FROM THE AREA
Source: US Census Bureau, Local Employment Dynamics. Notes: Overlay arrows are for illustrative purposes and do not indicate directionality of worker flow between home and employment locations.
FIGURE 21. COMMUTING FLOWS, 2010–2014
Source: US Census Bureau, Local Employment Dynamics.
0
500
1,000
1,500
2,000
2,500
3,000
2010
2011
2012
2013
2014
Num
ber
of
job h
old
ers
OUTBOUND (Commutefrom area to jobs outside)
INBOUND (Commute intoarea from outside)
LIVE & WORK (Live &work in area)
363 Live and work in California City
(93505)
825
Commute to jobs in California City (93505) from outside
Of the 1,188 workers that held jobs in California City (93505) in 2014, 69 percent lived outside the area.
2,290
Live in California City (93505) and commute to
jobs outside
Of the 2,653 residents employed in 2014, 86 percent commuted to jobs outside the area.
CALIFORNIA CITY, CA DRAFT
ECONOMIC ASSESSMENT & SWOT ANALYSIS PAGE | 20
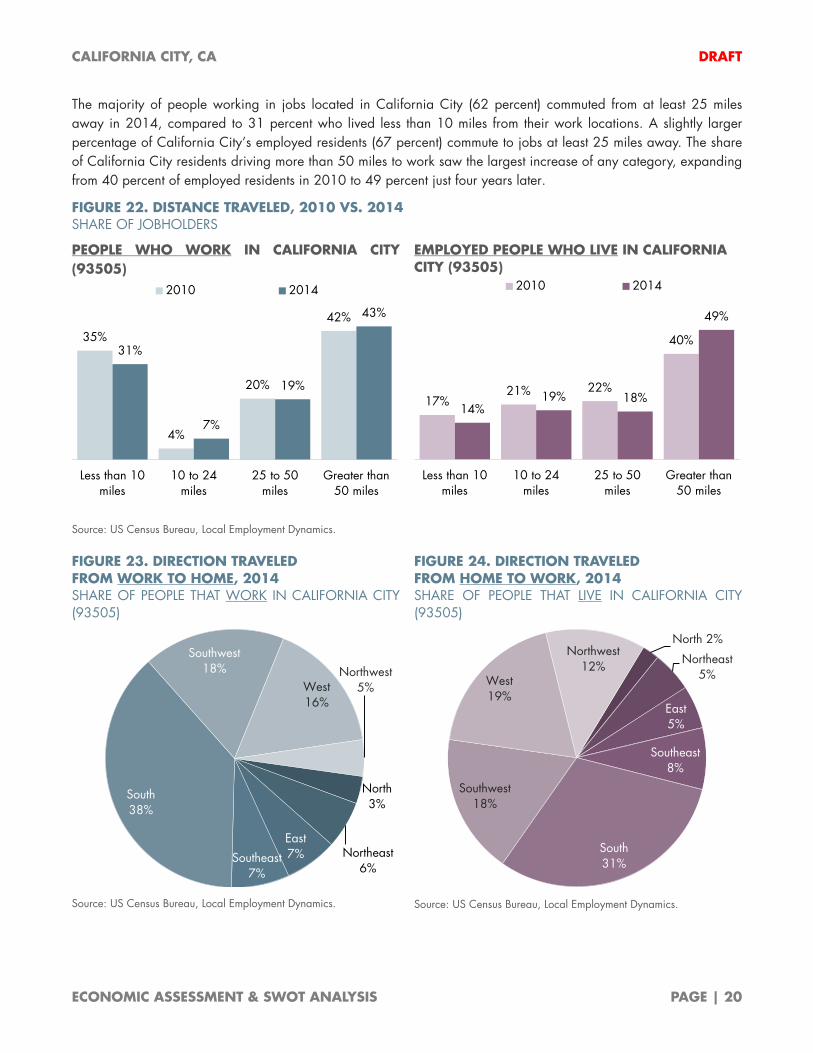
The majority of people working in jobs located in California City (62 percent) commuted from at least 25 miles away in 2014, compared to 31 percent who lived less than 10 miles from their work locations. A slightly larger percentage of California City’s employed residents (67 percent) commute to jobs at least 25 miles away. The share of California City residents driving more than 50 miles to work saw the largest increase of any category, expanding from 40 percent of employed residents in 2010 to 49 percent just four years later.
FIGURE 22. DISTANCE TRAVELED, 2010 VS. 2014 SHARE OF JOBHOLDERS
PEOPLE WHO WORK IN CALIFORNIA CITY (93505)
EMPLOYED PEOPLE WHO LIVE IN CALIFORNIA CITY (93505)
Source: US Census Bureau, Local Employment Dynamics.
FIGURE 23. DIRECTION TRAVELED FROM WORK TO HOME, 2014 SHARE OF PEOPLE THAT WORK IN CALIFORNIA CITY (93505)
Source: US Census Bureau, Local Employment Dynamics.
FIGURE 24. DIRECTION TRAVELED FROM HOME TO WORK, 2014 SHARE OF PEOPLE THAT LIVE IN CALIFORNIA CITY (93505)
Source: US Census Bureau, Local Employment Dynamics.
35%
4%
20%
42%
31%
7%
19%
43%
Less than 10miles
10 to 24miles
25 to 50miles
Greater than50 miles
2010 2014
17%21% 22%
40%
14%19% 18%
49%
Less than 10miles
10 to 24miles
25 to 50miles
Greater than50 miles
2010 2014
North3%
Northeast6%
East7%Southeast
7%
South38%
Southwest18%
West16%
Northwest5%
North 2%
Northeast5%
East5%
Southeast8%
South31%
Southwest18%
West19%
Northwest12%
CALIFORNIA CITY, CA DRAFT
ECONOMIC ASSESSMENT & SWOT ANALYSIS PAGE | 21
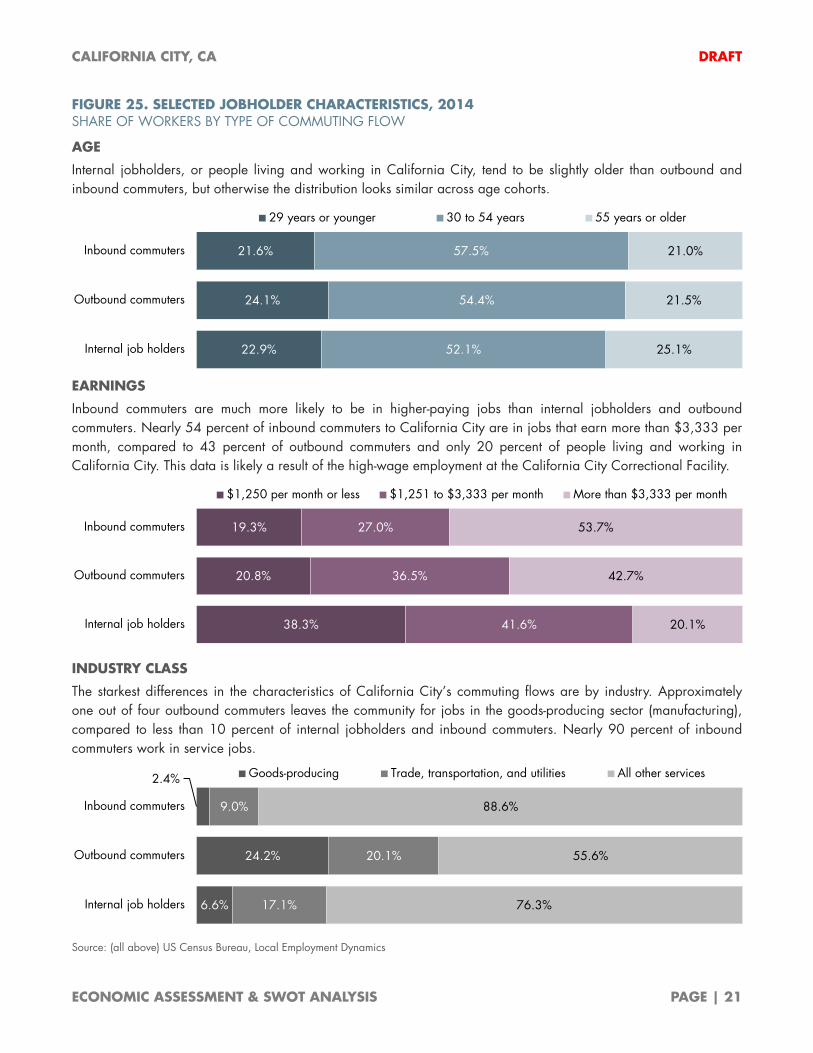
FIGURE 25. SELECTED JOBHOLDER CHARACTERISTICS, 2014 SHARE OF WORKERS BY TYPE OF COMMUTING FLOW
AGE
Internal jobholders, or people living and working in California City, tend to be slightly older than outbound and inbound commuters, but otherwise the distribution looks similar across age cohorts.
EARNINGS
Inbound commuters are much more likely to be in higher-paying jobs than internal jobholders and outbound commuters. Nearly 54 percent of inbound commuters to California City are in jobs that earn more than $3,333 per month, compared to 43 percent of outbound commuters and only 20 percent of people living and working in California City. This data is likely a result of the high-wage employment at the California City Correctional Facility.
INDUSTRY CLASS
The starkest differences in the characteristics of California City’s commuting flows are by industry. Approximately one out of four outbound commuters leaves the community for jobs in the goods-producing sector (manufacturing), compared to less than 10 percent of internal jobholders and inbound commuters. Nearly 90 percent of inbound commuters work in service jobs.
Source: (all above) US Census Bureau, Local Employment Dynamics
22.9%
24.1%
21.6%
52.1%
54.4%
57.5%
25.1%
21.5%
21.0%
Internal job holders
Outbound commuters
Inbound commuters
29 years or younger 30 to 54 years 55 years or older
38.3%
20.8%
19.3%
41.6%
36.5%
27.0%
20.1%
42.7%
53.7%
Internal job holders
Outbound commuters
Inbound commuters
$1,250 per month or less $1,251 to $3,333 per month More than $3,333 per month
6.6%
24.2%
2.4%
17.1%
20.1%
9.0%
76.3%
55.6%
88.6%
Internal job holders
Outbound commuters
Inbound commuters
Goods-producing Trade, transportation, and utilities All other services
CALIFORNIA CITY, CA DRAFT
ECONOMIC ASSESSMENT & SWOT ANALYSIS PAGE | 22
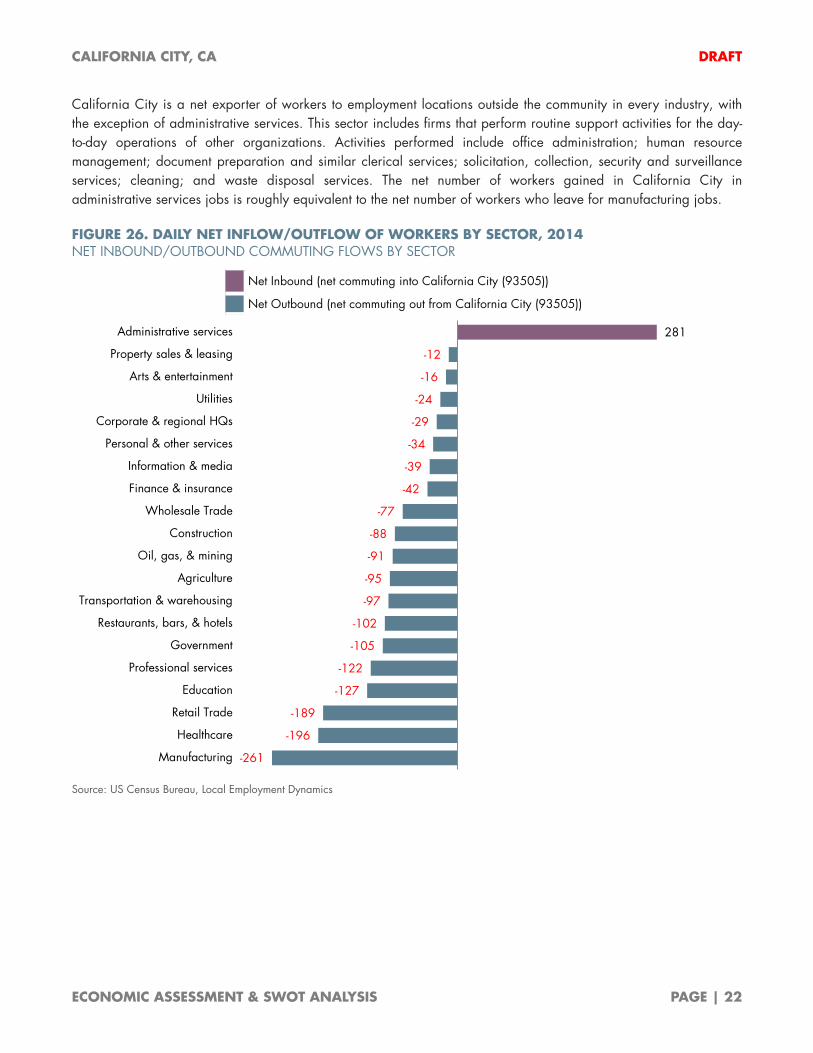
California City is a net exporter of workers to employment locations outside the community in every industry, with the exception of administrative services. This sector includes firms that perform routine support activities for the day-to-day operations of other organizations. Activities performed include office administration; human resource management; document preparation and similar clerical services; solicitation, collection, security and surveillance services; cleaning; and waste disposal services. The net number of workers gained in California City in administrative services jobs is roughly equivalent to the net number of workers who leave for manufacturing jobs.
FIGURE 26. DAILY NET INFLOW/OUTFLOW OF WORKERS BY SECTOR, 2014 NET INBOUND/OUTBOUND COMMUTING FLOWS BY SECTOR
Source: US Census Bureau, Local Employment Dynamics
Net Inbound (net commuting into California City (93505))
Net Outbound (net commuting out from California City (93505))
-261
-196
-189
-127
-122
-105
-102
-97
-95
-91
-88
-77
-42
-39
-34
-29
-24
-16
-12
281
Manufacturing
Healthcare
Retail Trade
Education
Professional services
Government
Restaurants, bars, & hotels
Transportation & warehousing
Agriculture
Oil, gas, & mining
Construction
Wholesale Trade
Finance & insurance
Information & media
Personal & other services
Corporate & regional HQs
Utilities
Arts & entertainment
Property sales & leasing
Administrative services
CALIFORNIA CITY, CA DRAFT
ECONOMIC ASSESSMENT & SWOT ANALYSIS PAGE | 23
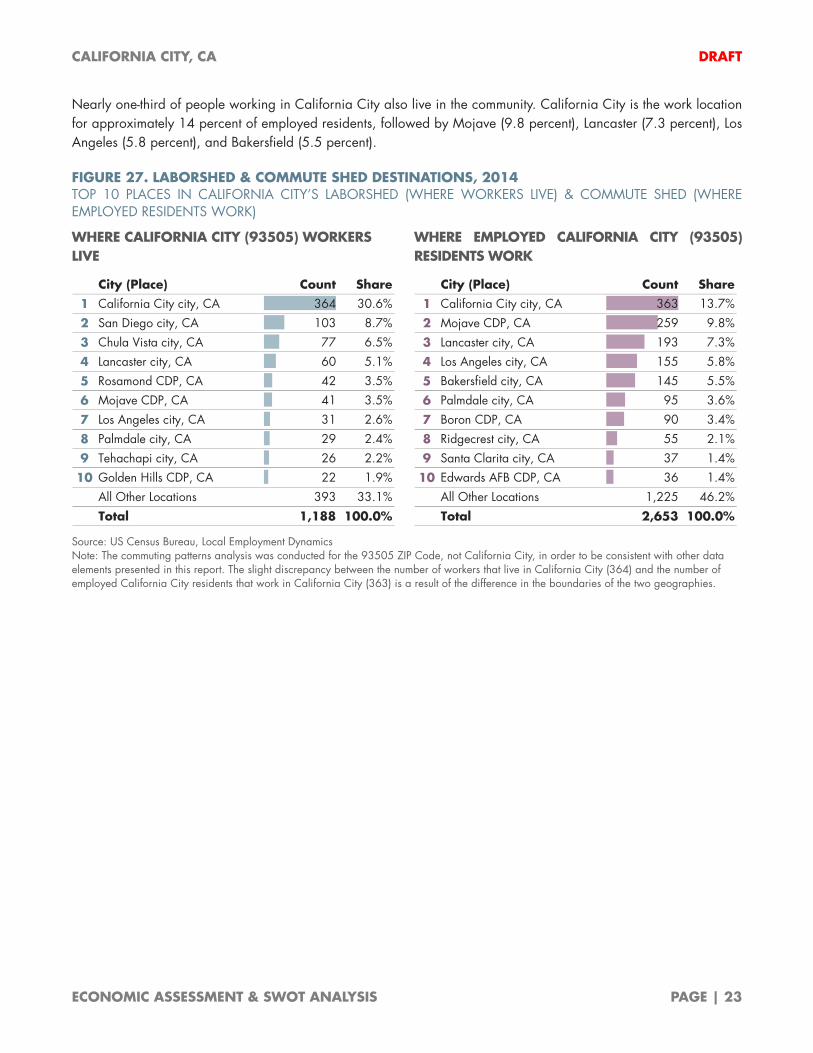
Nearly one-third of people working in California City also live in the community. California City is the work location for approximately 14 percent of employed residents, followed by Mojave (9.8 percent), Lancaster (7.3 percent), Los Angeles (5.8 percent), and Bakersfield (5.5 percent).
FIGURE 27. LABORSHED & COMMUTE SHED DESTINATIONS, 2014 TOP 10 PLACES IN CALIFORNIA CITY’S LABORSHED (WHERE WORKERS LIVE) & COMMUTE SHED (WHERE EMPLOYED RESIDENTS WORK)
WHERE CALIFORNIA CITY (93505) WORKERS LIVE
WHERE EMPLOYED CALIFORNIA CITY (93505) RESIDENTS WORK
Source: US Census Bureau, Local Employment Dynamics Note: The commuting patterns analysis was conducted for the 93505 ZIP Code, not California City, in order to be consistent with other data elements presented in this report. The slight discrepancy between the number of workers that live in California City (364) and the number of employed California City residents that work in California City (363) is a result of the difference in the boundaries of the two geographies.
City (Place) Count Share1 California City city, CA 364 30.6%
2 San Diego city, CA 103 8.7%
3 Chula Vista city, CA 77 6.5%
4 Lancaster city, CA 60 5.1%
5 Rosamond CDP, CA 42 3.5%
6 Mojave CDP, CA 41 3.5%
7 Los Angeles city, CA 31 2.6%
8 Palmdale city, CA 29 2.4%
9 Tehachapi city, CA 26 2.2%
10 Golden Hills CDP, CA 22 1.9%All Other Locations 393 33.1%
Total 1,188 100.0%
City (Place) Count Share1 California City city, CA 363 13.7%
2 Mojave CDP, CA 259 9.8%
3 Lancaster city, CA 193 7.3%
4 Los Angeles city, CA 155 5.8%
5 Bakersfield city, CA 145 5.5%
6 Palmdale city, CA 95 3.6%
7 Boron CDP, CA 90 3.4%
8 Ridgecrest city, CA 55 2.1%
9 Santa Clarita city, CA 37 1.4%
10 Edwards AFB CDP, CA 36 1.4%All Other Locations 1,225 46.2%
Total 2,653 100.0%