The environmental, social and economic impacts associated ...

The economic and social impacts of tourism in the Far North Queensland planning region Prepared by the Planning Information and Forecasting Unit An investigation into the economic and social impacts of tourism in Far North Queensland
The economic and social impacts of tourism in Far North Queensland planning region 2 -
Contents 1 Introduction 4
1.1 Background 4
1.2 The study area 4
1.3 Methods and data sources 5
1.4 Summary 7
2 Size of the tourism industry 8
2.1 Significance of the tourist population in the region 8
2.2 Source of visitors—tropical North Queensland tourism region 10
2.3 Length of stay—tropical North Queensland tourism region 11
2.4 Seasonality in paid accommodation—tropical North Queensland 11
2.5 Main activities of visitors—tropical North Queensland tourism region 12
2.6 Backpackers 12
2.7 Mode of transport 13
3 Economic contribution of the tourism industry 14
3.1 Visitor expenditure—tropical North Queensland tourism region 14
3.2 Estimated contribution to Gross Regional Product— tropical North Queensland tourism region 15
3.3 Estimated contribution to regional employment— Far North Queensland planning region 16
4 Tourism influences on housing stock 19
4.1 Composition of housing stock 19
4.2 Visitor housing types 21

The economic and social impacts of tourism in Far North Queensland planning region 3 -
5 Social and economic profile of visitors compared with usual residents 23
5.1 Introduction 23
5.2 Age structure 23
5.3 Occupation 27
5.4 Income 28
6 Conclusion 30
6.1 Distinctive characteristics of the Far North Queensland planning region 30
6.2 Character of different areas of the region 30
6.3 Differences between tourists and usual residents 30
6.4 Social and economic impacts of tourism 31
6.5 Implications for regional planning 31
Appendix
Visitors by urban centre, locality and balance of sub-region, Far North Queensland planning region, September 2006 33
References 34

The economic and social impacts of tourism in Far North Queensland planning region 4 -
1 Introduction 1.1 Background Far North Queensland is one of the premier tourist destinations in Australia. Situated in an attractive coastal location with a lush rainforest environment, including the elevated area to the immediate west of Cairns, the region has a diverse and well-established tourism industry. The tourism industry is highly significant to planning for the future needs and sustainability of the region.
Planning for the future must acknowledge a number of local impacts from the operation of the tourism industry. These include the economic contribution of the tourism industry to the local economy, the impacts of tourism based activities on the physical environment, as well as the influence of tourism on the social environment through the types of jobs that are available, the mix of housing stock that is built and the differences in social structure that result from urban development associated with tourism. To effectively plan for the future needs of both residents and visitors to the region, it is vital to obtain a clear understanding of tourism’s current impacts in the area.
This report addresses the economic and social impacts of tourism in the region. The objective is to increase the understanding of the effects of tourism and distinguish between the needs of visitors to and needs of permanent residents.
There are already a number of reports on the characteristics and future expectations of tourism in Far North Queensland. However, most of these reports are not organised to directly address the area encompassed by the Far North Queensland planning region of the Department of Infrastructure and Planning. This report draws on the information available, and seeks to generate and analyse specific information where possible for the planning region.
1.2 The study area The planning region comprises the Cairns, Cassowary Coast and the Tablelands Regional Councils and the Wujal Wujal and Yarrabah Aboriginal Shire Councils. However, as these only formally came into existence during 2008, the information on which this report is based is for the prior local government areas of the City of Cairns and the Shires of Atherton, Cardwell, Douglas, Eacham, Herberton, Johnstone, Mareeba, Wujal Wujal and Yarrabah. Information is limited for the last two shires, which were created from Aboriginal communities in 2002. In this report, where information prior to this date is the most recent available, they are included in information for the relevant local governments of which they formed part, namely Douglas and Cairns respectively.
The tourism regional boundaries are changing as a result of changes in administrative areas. In this report, data relating to the tropical North Queensland tourism region is extensively used. However, this includes shires in the Cape York–Carpentaria area that are not in the planning region. Similarly, the planning region forms only part of Far North Queensland statistical division of the Australian Bureau of Statistics, which is commonly used as a region for statistical purposes, and it also crosses several boundaries of the Bureau’s Aboriginal regions.

The economic and social impacts of tourism in Far North Queensland planning region 5 -
Please note Figure 3 refers to the Australian Bureau of Statistics’ definition of the tropical North Queensland tourism region. This includes the Far North Queensland planning region and the Shires of Aurukun, Cook, Croydon, Etheridge and Torres.
In this report ‘the region’ or FNQ planning region is the Far North Queensland planning region, as defined on page four. Use of information relating to any other regional entity is clearly defined in each case.
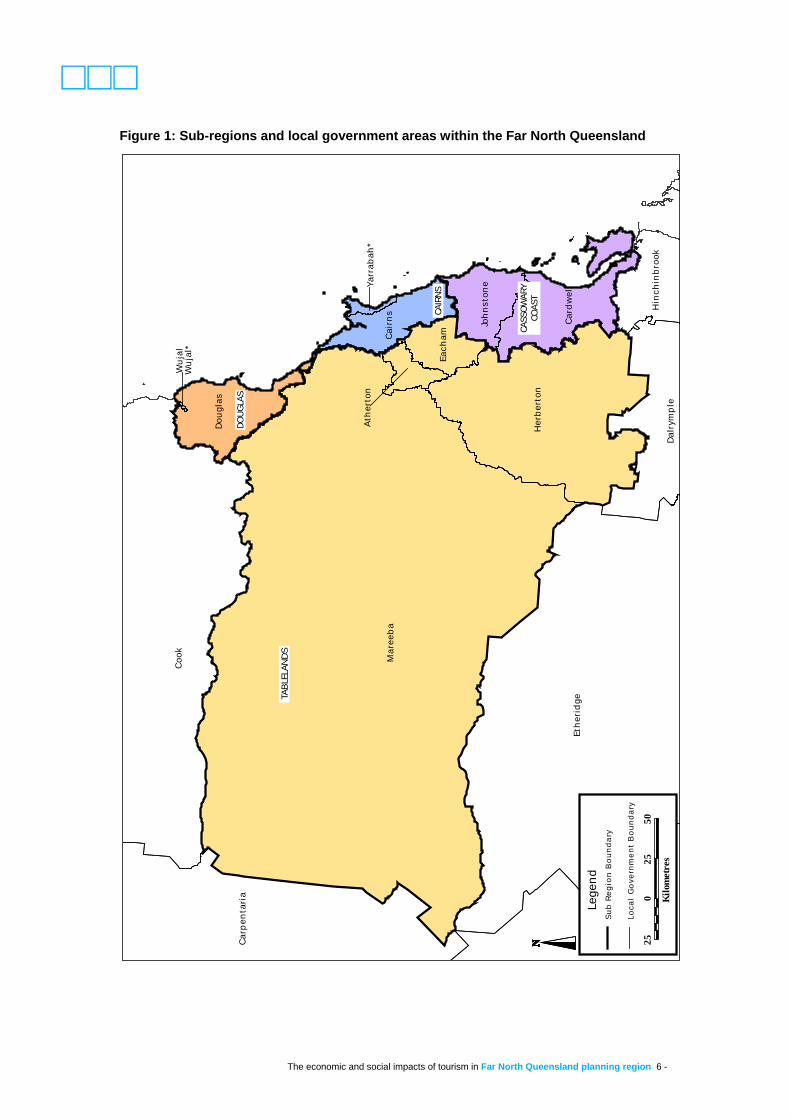
As far as possible, sub-regional information is also provided. For this purpose, five sub-regional areas have been utilised. The former local government areas of Cairns City and Douglas Shire have been designated as separate sub-regions, as the implications of tourism are significantly different. The new regional councils of Cassowary Coast and Tablelands have been treated as sub-regional entities, while the two Aboriginal councils have been treated as a fifth sub-regional grouping. These equate to the sub-regions in the report prepared by the Planning Information and Forecasting Unit entitled Far North Queensland region: demographic profile, to which readers are directed for demographic and housing information and projections. The composition of the subregions is shown in Figure 1.
1.3 Methods and data sources This report combines information from the Census of Population and Housing and other studies to present the social and economic impacts of tourism in the region. The methods include comparison over time, comparison with other areas in Queensland and comparison of areas within the region. The source data include:
• Queensland Tourism data and Tourism Australia data, especially the report Tropical North Queensland—regional update, year ended December 2006
• Australian Bureau of Statistics’ Census of Population and Housing, 2001 and 2006
• Tourism Queensland (2007), Travel Expenditure by Domestic and International Visitors, year ended December 2006
• Tourism Research Australia (2007), International and domestic visitor survey Australia, year ended March 2007 (unpublished material)
• Queensland Government, Office of Economic and Statistical Research’s estimates of visitor expenditure and gross regional product (GRP)
• Studies by local economic development agencies and groups.
The economic and social impacts of tourism in Far North Queensland planning region 6 -
Figure 1: Sub-regions and local government areas within the Far North Queensland
Ath
erto
n
Cai
rns
Car
pen
tari
a
Coo
k
Eth
erid
geCa
rdw
ell
Joh
nst
one
Her
ber
ton
Each
am
Yarr
abah
*
Dou
glas
Wu
jal
Wu
jal*
Mar
eeb
a
Hin
chin
bro
ok
Dal
rym
ple
CR
OYD
ON
Lege
ndLe
gend
Lege
ndLe
gend
Lege
ndLe
gend
Lege
ndLe
gend
Lege
ndSu
bRe
gion
Bou
ndar
ySu
bRe
gion
Bou
ndar
ySu
bRe
gion
Bou
ndar
ySu
bRe
gion
Bou
ndar
ySu
bRe
gion
Bou
ndar
ySu
bRe
gion
Bou
ndar
ySu
bRe
gion
Bou
ndar
ySu
bRe
gion
Bou
ndar
ySu
bRe
gion
Bou
ndar
y
Loca
lG
over
nmen
tB
ound
ary
Loca
lG
over
nmen
tB
ound
ary
Loca
lG
over
nmen
tB
ound
ary
Loca
lG
over
nmen
tB
ound
ary
Loca
lG
over
nmen
tB
ound
ary
Loca
lG
over
nmen
tB
ound
ary
Loca
lG
over
nmen
tB
ound
ary
Loca
lG
over
nmen
tB
ound
ary
Loca
lG
over
nmen
tB
ound
ary
250
2550
Kilo
met
res
CAIR
NS
DOUG
LAS
TABL
ELAN
DS
CASS
OWAR
YCO
AST
The economic and social impacts of tourism in Far North Queensland planning region 7 -
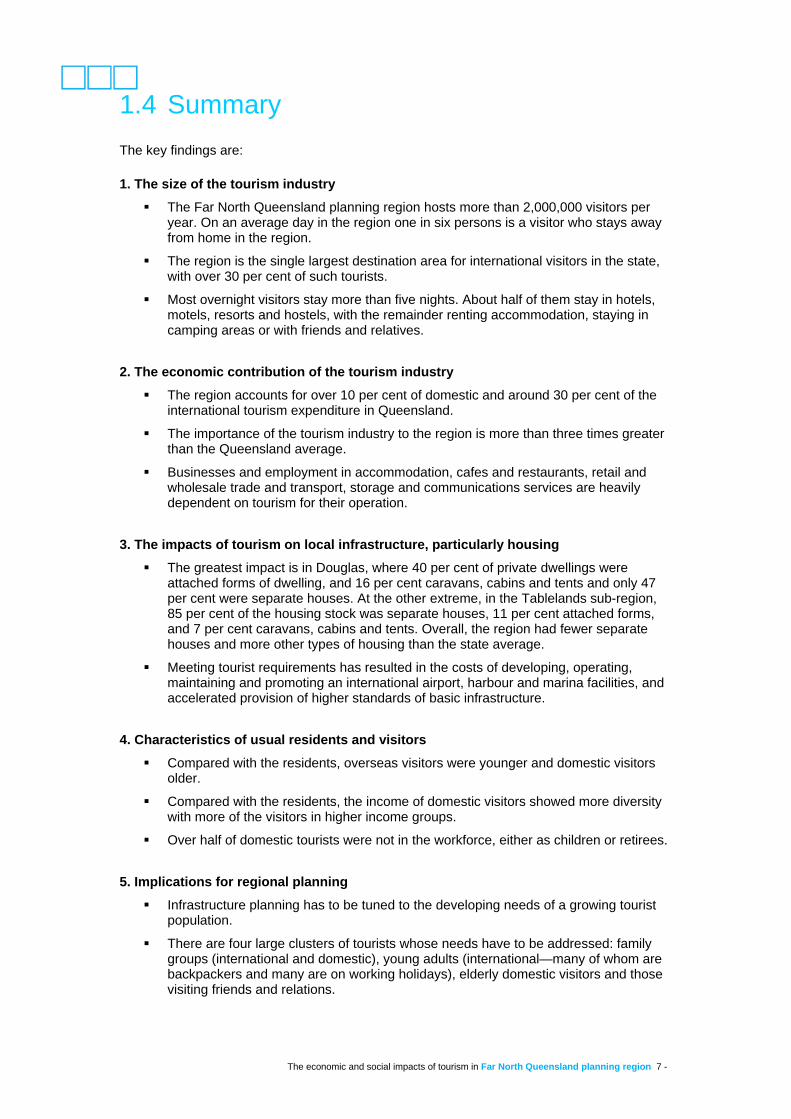
1.4 Summary The key findings are: 1. The size of the tourism industry
The Far North Queensland planning region hosts more than 2,000,000 visitors per year. On an average day in the region one in six persons is a visitor who stays away from home in the region.
The region is the single largest destination area for international visitors in the state, with over 30 per cent of such tourists.
Most overnight visitors stay more than five nights. About half of them stay in hotels, motels, resorts and hostels, with the remainder renting accommodation, staying in camping areas or with friends and relatives.
2. The economic contribution of the tourism industry
The region accounts for over 10 per cent of domestic and around 30 per cent of the international tourism expenditure in Queensland.
The importance of the tourism industry to the region is more than three times greater than the Queensland average.
Businesses and employment in accommodation, cafes and restaurants, retail and wholesale trade and transport, storage and communications services are heavily dependent on tourism for their operation.
3. The impacts of tourism on local infrastructure, particularly housing
The greatest impact is in Douglas, where 40 per cent of private dwellings were attached forms of dwelling, and 16 per cent caravans, cabins and tents and only 47 per cent were separate houses. At the other extreme, in the Tablelands sub-region, 85 per cent of the housing stock was separate houses, 11 per cent attached forms, and 7 per cent caravans, cabins and tents. Overall, the region had fewer separate houses and more other types of housing than the state average.
Meeting tourist requirements has resulted in the costs of developing, operating, maintaining and promoting an international airport, harbour and marina facilities, and accelerated provision of higher standards of basic infrastructure.
4. Characteristics of usual residents and visitors
Compared with the residents, overseas visitors were younger and domestic visitors older.
Compared with the residents, the income of domestic visitors showed more diversity with more of the visitors in higher income groups.
Over half of domestic tourists were not in the workforce, either as children or retirees.
5. Implications for regional planning
Infrastructure planning has to be tuned to the developing needs of a growing tourist population.
There are four large clusters of tourists whose needs have to be addressed: family groups (international and domestic), young adults (international—many of whom are backpackers and many are on working holidays), elderly domestic visitors and those visiting friends and relations.

The economic and social impacts of tourism in Far North Queensland planning region 8 -
The different subregions have different characteristics of visitors and the planning needs vary geographically as well as by demographic and economic type.
2 Size of the tourism industry 2.1 Significance of the tourist population in the
region Tourists are an important group in the daily life of the region. They added 19 per cent to the usual resident population counted in the 2006 census—68 per cent in the case of the Douglas sub-region. The impact is summarised in Table 1 and Figure 2. Table 1: Persons recorded at the 2006 Census in the Far North Queensland planning region
Category
Cai
rns
Dou
glas
C
asso
war
y C
oast
Ta
blel
ands
A
borig
inal
co
unci
ls
Planning region
Visitors 26,528 6,971 3,716 3,189 67 40,471 From overseas 11,798 2,728 784 508 0 15,818 From interstate 8,349 3,542 1,498 944 0 14,333 From Queensland 6,381 701 1,434 1,737 67 10,320
Usual residents 127,438 10,193 27,786 40,910 2,699 209,026 Aged 0–4 years 9,214 650 1,674 2,521 376 14,435 Resident in SLA five years previously 60,289 5,792 18,103 24,639 2,086 110,909 Moved into SLA in last five years 45,743 2,811 5,808 10,085 201 64,648 Residence five years before not stated (a) 12,192
940
2,201
3,665
36
19,034
Source: ABS, 2006 Census of population and housing, Tables B04, B38 and P03– Relevant local government areas Note: (a) includes rounding adjustments

The economic and social impacts of tourism in Far North Queensland planning region 9 -
Figure 2: Structure of recorded population, FNQPR, 2006
0
10
20
30
40
50
60
70
80
Cairns
Dougla
s
Casso
wary C
oast
Tablel
ands
Aborig
inal C
ounc
ils
Region
Area
Perc
enta
ge
Overseas visitors
Domestic visitors
Recent migrants
Age 0-4 years
Resident 5 years or longer
Not stated
The impact varies across the region. Overall, 53 per cent of usual residents in September 2006 were residents for five years or more. However, this varied sub-regionally, with the highest levels in the Aboriginal councils (77 per cent), lower levels in the Cassowary Coast (65 per cent), Tablelands (60 per cent) and Douglas (57 per cent), while Cairns at 47 per cent had a majority of its usual residents relative newcomers. Visitors made up 16 per cent of those counted at the Census in 2006. Again, there were great sub-regional differences, with the Aboriginal councils having only 2 per cent of their recorded population being visitors, the Tablelands 8 per cent and the Cassowary Coast 12 per cent, while Cairns recorded 21 per cent as visitors and Douglas 68 per cent. Seventy-five per cent of the overseas visitors, 58 per cent of the interstate visitors and 62 percent of the Queensland visitors were counted in Cairns, for Douglas the comparable proportions were 17, 25 and 7 per cent. Together, these two subregions had 83 per cent of the visitors counted in the region. This refers basically to where visitors were on Census night, so no allowance is made for day tripping from these two areas to the rest of the region. The localised distribution of visitors is shown in the Appendix. There are several elements of relevance to be noted.
89 per cent of the region’s visitors stayed in the urban centres and localities, with 11 per cent in other areas, which house 18 per cent of the usual resident population. This is heavily influenced by the importance of Cairns.
18 per cent of visitors to Douglas, 27 per cent of those visiting the Cassowary Coast,
and 49 per cent of those in Tablelands were recorded outside the urban centres and localities.
There was a marked concentration in the location of visitors. Four centres—Cairns,
Cairns Northern Beaches, Port Douglas and Craiglie—stand out from the others, each recording more than 1,000 visitors recorded on Census night 2006, twice the level of the next highest centre. Within this group, the Cairns urban centre recorded almost 21,000 or 52 per cent of the total visitors staying in the region on that night.
The economic and social impacts of tourism in Far North Queensland planning region 10 -
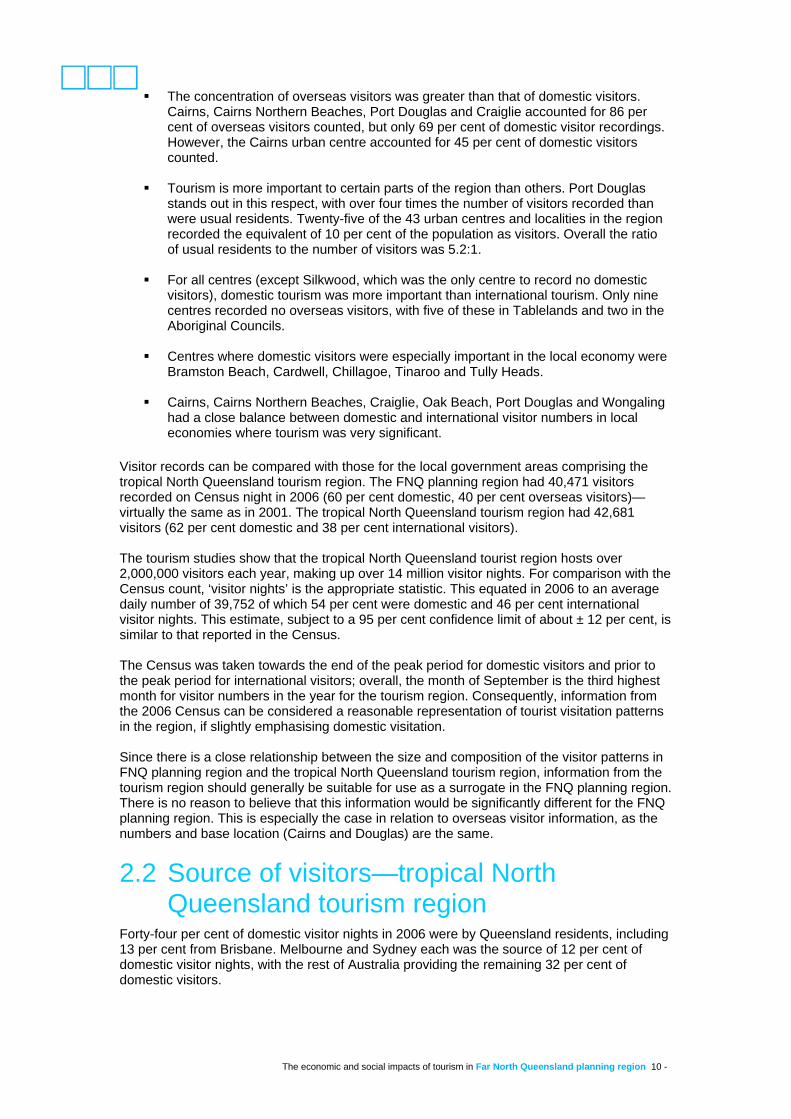
The concentration of overseas visitors was greater than that of domestic visitors. Cairns, Cairns Northern Beaches, Port Douglas and Craiglie accounted for 86 per cent of overseas visitors counted, but only 69 per cent of domestic visitor recordings. However, the Cairns urban centre accounted for 45 per cent of domestic visitors counted.
Tourism is more important to certain parts of the region than others. Port Douglas
stands out in this respect, with over four times the number of visitors recorded than were usual residents. Twenty-five of the 43 urban centres and localities in the region recorded the equivalent of 10 per cent of the population as visitors. Overall the ratio of usual residents to the number of visitors was 5.2:1.
For all centres (except Silkwood, which was the only centre to record no domestic
visitors), domestic tourism was more important than international tourism. Only nine centres recorded no overseas visitors, with five of these in Tablelands and two in the Aboriginal Councils.
Centres where domestic visitors were especially important in the local economy were
Bramston Beach, Cardwell, Chillagoe, Tinaroo and Tully Heads.
Cairns, Cairns Northern Beaches, Craiglie, Oak Beach, Port Douglas and Wongaling had a close balance between domestic and international visitor numbers in local economies where tourism was very significant.
Visitor records can be compared with those for the local government areas comprising the tropical North Queensland tourism region. The FNQ planning region had 40,471 visitors recorded on Census night in 2006 (60 per cent domestic, 40 per cent overseas visitors)—virtually the same as in 2001. The tropical North Queensland tourism region had 42,681 visitors (62 per cent domestic and 38 per cent international visitors). The tourism studies show that the tropical North Queensland tourist region hosts over 2,000,000 visitors each year, making up over 14 million visitor nights. For comparison with the Census count, ‘visitor nights’ is the appropriate statistic. This equated in 2006 to an average daily number of 39,752 of which 54 per cent were domestic and 46 per cent international visitor nights. This estimate, subject to a 95 per cent confidence limit of about ± 12 per cent, is similar to that reported in the Census. The Census was taken towards the end of the peak period for domestic visitors and prior to the peak period for international visitors; overall, the month of September is the third highest month for visitor numbers in the year for the tourism region. Consequently, information from the 2006 Census can be considered a reasonable representation of tourist visitation patterns in the region, if slightly emphasising domestic visitation. Since there is a close relationship between the size and composition of the visitor patterns in FNQ planning region and the tropical North Queensland tourism region, information from the tourism region should generally be suitable for use as a surrogate in the FNQ planning region. There is no reason to believe that this information would be significantly different for the FNQ planning region. This is especially the case in relation to overseas visitor information, as the numbers and base location (Cairns and Douglas) are the same.
2.2 Source of visitors—tropical North Queensland tourism region
Forty-four per cent of domestic visitor nights in 2006 were by Queensland residents, including 13 per cent from Brisbane. Melbourne and Sydney each was the source of 12 per cent of domestic visitor nights, with the rest of Australia providing the remaining 32 per cent of domestic visitors.
The economic and social impacts of tourism in Far North Queensland planning region 11 -
Holiday and leisure activities were the main reason for visiting for 60 per cent of domestic visitor nights, with 20 per cent visiting friends and relations and 16 per cent business related. The main sources of international visitor nights in the region in 2006 were the United Kingdom (23 per cent), Japan (15 per cent), USA (8 per cent), Germany (7 per cent) and the rest of Europe (20 per cent). The region was visited by 39 per cent of the state’s overseas visitors in 2006, with 80 per cent coming primarily for holiday and leisure activities, and 8 per cent visiting friends or relations.
2.3 Length of stay—tropical North Queensland tourism region
In 2006, the average length of stay for domestic visitors was 4.9 days, with 5.6 days on average for those on holiday for leisure activities, 3.8 days for those visiting friends and relations and 4.1 days for business visitors. International visitors had an average length of stay of 7.8 days.
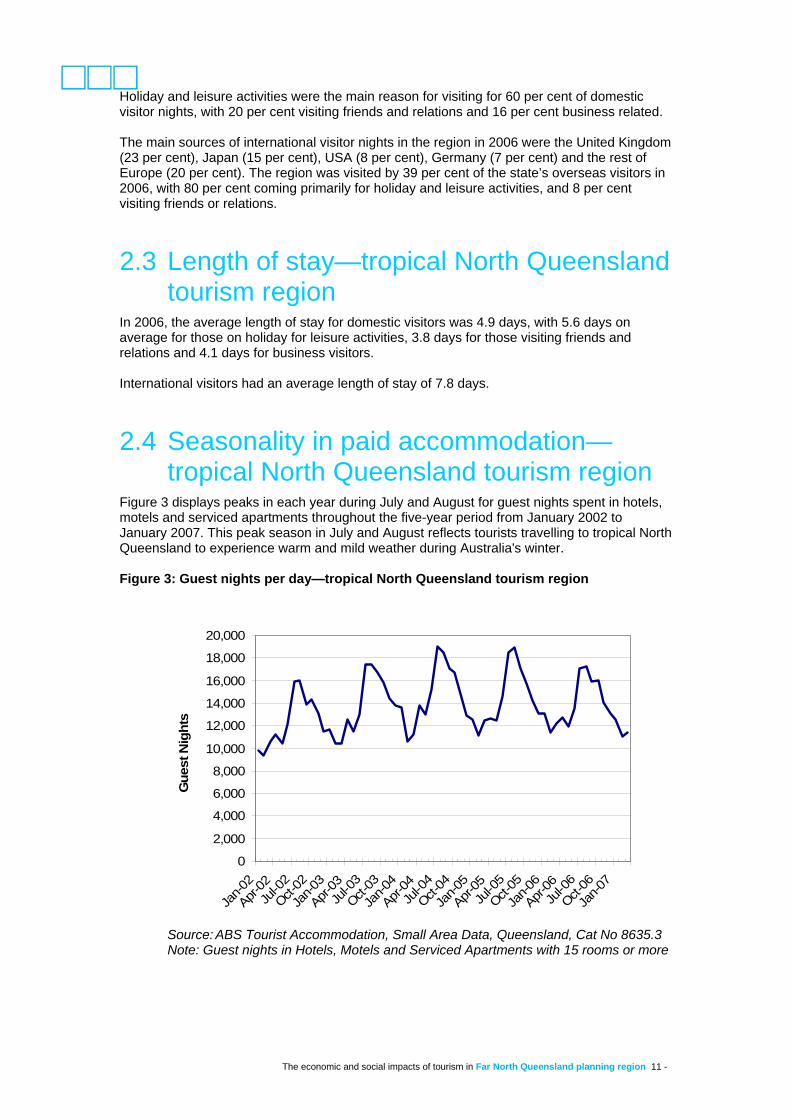
2.4 Seasonality in paid accommodation—tropical North Queensland tourism region
Figure 3 displays peaks in each year during July and August for guest nights spent in hotels, motels and serviced apartments throughout the five-year period from January 2002 to January 2007. This peak season in July and August reflects tourists travelling to tropical North Queensland to experience warm and mild weather during Australia's winter. Figure 3: Guest nights per day—tropical North Queensland tourism region
0
2,000
4,000
6,000
8,000
10,000
12,000
14,000
16,000
18,000
20,000
Jan-0
2
Apr-02Ju
l-02
Oct-02
Jan-0
3
Apr-03Ju
l-03
Oct-03
Jan-0
4
Apr-04Ju
l-04
Oct-04
Jan-0
5
Apr-05Ju
l-05
Oct-05
Jan-0
6
Apr-06Ju
l-06
Oct-06
Jan-0
7
Gue
st N
ight
s
Source: ABS Tourist Accommodation, Small Area Data, Queensland, Cat No 8635.3 Note: Guest nights in Hotels, Motels and Serviced Apartments with 15 rooms or more

The economic and social impacts of tourism in Far North Queensland planning region 12 -
The peak, measured as average guest nights per day in July and August, increased from 16,000 in 2002 to 17,400 in 2003, and to 18,700 in 2004 and 2005, but fell back to 17,200 guest nights per day in 2006. Contributing factors for this fall in peak season guest nights in 2006 may have included rising petrol prices in Australia making travel in Australia more expensive and a stronger Australian dollar making overseas holidays more affordable. Smaller, although noticeable peaks also appeared in November to January, over the Christmas school holiday period each year and in April during the Easter school holiday period. The number of guest nights recorded in tropical North Queensland during the June school holiday time was always larger than in May each year. On each side of the July and August peak in Figure 3, the month of June and the period August to November can be interpreted as shoulder seasons. The low season was during the cyclone prone months of February and March, with February consistently presenting the lowest number of guest nights per day. The weather during this low season in tropical North Queensland is characterised by a high level of humidity and high temperatures.
2.5 Main activities of visitors—tropical North Queensland tourism region
Holidaying is the main purpose given by those visiting the region. The main activities reported by domestic visitors were eating out at restaurants (58 per cent), general sightseeing (38 per cent), visiting friends and relatives (38 per cent), going to the beach (32 per cent), shopping (31 per cent), bushwalking and rainforest walks (17 per cent) and visiting national parks (17 per cent). Overseas visitors reported that their most popular activities were eating out, especially at restaurants and cafes (90 per cent), going shopping for pleasure (82 per cent), going to the beach (62 per cent), going to markets (48 per cent) and visiting national and state parks (47 per cent). While the appeal of the natural attractions is high in both this region and in the Whitsundays, there is a greater focus on urban recreational activity in Far North Queensland than in the Whitsundays. This reflects the focus of tourism in Cairns and Douglas, where major urban and internal resort attractions influence perceptions. Day tripping is a significant component of the Cairns tourist experience, especially to the Douglas subregion, the Atherton Tablelands and the Malanda area. The region forms an integrated holiday experience, providing variety of choice in a relatively contained area. Additionally, a slight majority of domestic visitors came by road while virtually all overseas visitors came by air. Consequently, there are about 20,000 additional cars on the roads from tourists and a high usage of commercial vehicles for transport within the region. This is significant from a planning perspective as planning for maintenance and expansion of road infrastructure will need to reflect the demand from the tourism sector.
2.6 Backpackers Backpackers form a very significant component of the tourist population in the region. Conversely, the region forms a major component of the backpacker market in Australia. Backpackers are a niche market of considerable importance both to the region and the nation as a whole. The key concepts for backpackers are unstructured activities, freedom and spontaneity. Planning and pre-purchasing is minimal, so expenditure by backpackers tends to be localised.

The economic and social impacts of tourism in Far North Queensland planning region 13 -
International backpackers stay in an area much longer than other visitors, with an average stay in Queensland of 29 nights (in Australia as a whole, staying 68–72 nights). Their expenditure per person is over twice that of other visitors. The main sources of backpackers coming to Australia are the United Kingdom (29 per cent in 2004), Germany (11 per cent), the rest of Europe (24 per cent) and the USA (10 per cent). The gender balance is almost even. In 2004, 72 per cent of international backpackers and 20 per cent of domestic backpackers travelled alone, 12 and 16 per cent respectively travelled as members of a couple, and 15 and 36 per cent respectively travelled with friends or relatives without children. Young age groups predominate—in 2002–03 48 per cent of international backpackers were aged 15–24 years and 36 per cent were aged 25–34 years. Among domestic backpackers the comparable proportions were 39 per cent and 25 per cent. Two-thirds of backpackers are in their twenties. This was markedly different from the non-backpacker visitors, both international and domestic, who had a more even spread across the age structure. In 2006, 226,000 or 41 per cent of international backpackers in Australia visited tropical North Queensland, as did 5 per cent of domestic backpackers. Overall, 90 per cent of backpackers to the region are international. Specialist backpacker hostels are the preferred form of accommodation, with one in five international backpackers and three-quarters of domestic backpackers staying in such accommodation. However, most backpackers spend the majority of their visit to the region in other forms of accommodation, either rented or staying with relatives or friends. Backpackers, because of their longer period of visitation and their mobility do not have the same seasonal variations as domestic visitors (international backpackers pass through an average of six regions of Australia during their visit, compared with two for other international visitors). International backpackers are therefore important for local accommodation establishments and tourist related services and facilities because they assist in smoothing out seasonal variations.
2.7 Mode of transport In the year ending March 2007, 788,000 domestic visitors drove into the tropical North Queensland region, in contrast to 757,000 domestic visitors deciding to fly. The total number of domestic visitors travelling into the tropical North Queensland region was 1,499,000 by the year ending March 2007. International visitors who drove into the tropical North Queensland region exceeded 113,000 persons, in comparison to almost 377,000 international visitors choosing to take their journey by aircraft. In the year ending March 2007, international visitors arriving in the tropical North Queensland region totalled in excess of 562,00 persons. In all, around 2.1 million visitors travelled into the tropical North Queensland region in the year ending March 2007. Of these, 900,500 drove in contrast to 1,100,900 deciding to travel by aircraft. Visitor access to the region by air and over land was close to equally important. Visitors travelling to the region by other means of transport are not specifically represented in the unpublished source material.

The economic and social impacts of tourism in Far North Queensland planning region 14 -
3 Economic contribution of the tourism industry
3.1 Visitor expenditure—tropical North Queensland tourism region
In 2006, the tropical North Queensland tourism region’s visitor expenditure accounted for 13 per cent of all domestic visitor expenditure in Queensland and 28 per cent of all international visitor expenditure in Queensland. Domestic visitors spent $1.2 billion and international visitors spent $892 million. As an indicator of the importance of tourism to Far North Queensland, the combined value of visitor expenditure in the region in the year ending December 2006 was $2.1 billion (expenditure excludes package expenditure). Domestic visitors in the tropical North Queensland tourism region had an average expenditure per night of $158 in 2006, compared with $133 for international visitors. Per visit, domestic visitors spent $781, whereas international visitors spent $1,038. Less money spent per visit by domestic visitors than by international visitors can be attributed to the shorter length of stay of domestic visitors compared with international visitors to the tropical North Queensland region in 2006. Limited information is available at sub-regional level, but the release of tourism profiles for local government areas in regional Australia in March 2008 provides some information. Spending by international tourists is concentrated in Cairns (92 per cent) and Douglas (7 per cent) and very low in the Cassowary Coast and Tablelands. Estimated spending by domestic visitors is over 60 per cent in Cairns, about one-quarter in Douglas, and about 5–8 per cent in each of Cassowary Coast and Tablelands. A study by the Office of Social and Economic Research in the Queensland Treasury assessed visitor expenditure by the type of visitor for 1998–99. The results are shown in Table 2.
Table 2: Visitor expenditure levels by source of visitor, tropical North Queensland, 1998–99
Source of visitors
Domestic day visits
($m)
Domestic overnight
visits ($m)
International visits
($m)
Total
($m)
Share of total
(%)Residents visiting within the region
119 97 - 217 10.5
Visitors from other Queensland regions
13 263 - 277 13.4
Visitors from interstate 3 591 - 594 28.8International visitors - - 835 835 40.5Sub-total: visitors to the region
135 952 835 1,922 93.1
Before/after expenditure of residents travelling interstate, overseas and to other Queensland regions
0 52 89 141 6.9
Total 136 1,004 924 2,064 100.0Share (%) 6.6 48.6 44.8 100.0
Source: OESR: The contribution of Visitor expenditure to the Queensland regional economies 1998–99

The economic and social impacts of tourism in Far North Queensland planning region 15 -
This table reinforces the ongoing significance of international visitors, but also emphasises the importance of local residents as a source of tourism expenditure—over 10 per cent of total expenditure in the region. The region’s population size is large enough to generate large scale tourism expenditure (estimated at $217 million in 1998–99) in its own right. This impact is also directly felt in the proportion of visitors staying with friends and relatives (26 per cent of domestic visitors and 7 per cent of international visitors—see also Table 8 below). In 1998–99 the estimated total visitor expenditure in the Tropical North Queensland region was $2.06 billion including before and after travel expenditure.
3.2 Estimated contribution to Gross Regional Product—tropical North Queensland tourism region
Tourism is important to the region’s economy, with around one-seventh of all economic activity being related to tourism. A study by the Office of Social and Economic Research in the Queensland Treasury assessed the size and importance of the sector to the tropical North Queensland tourism region in 1998–99.
Table 3: Tourism industry’s share of Gross Regional Product of the tropical North Queensland tourism region, 1998–1999
Industry category
Tourism GRP($m)
Total GRP($m)
Tourism share of industry
GRP (%)
Industry share of tourism
GRP(%)
Agriculture, forestry and fishing 9 430 2.1 1.0
Mining 0 371 0 0
Manufacturing 27 362 7.4 3.1
Electricity, gas and water 0 143 0.1 0
Construction 0 452 0 0
Retail and wholesale trade 142 564 25.2 16.4
Accommodation, cafes and restaurants 197 255 77.0 22.6
Transport, storage and communications 221 670 32.9 25.4Finance, insurance, property and business services 14 597 2.3 1.6Government administration, defence, education, health and community services 43 876 4.9 4.9Cultural, recreational, personal and other services 43 208 20.6 4.9Ownership of buildings 25 487 5.1 2.9
GRP at factor cost 720 5,416 13.3 Net taxes 150 646 23.3 17.3
Total GRP 870 6,062 14.4 100.0Source: OESR: The contribution of Visitor Expenditure to the Queensland Regional Economies 1998-99

The economic and social impacts of tourism in Far North Queensland planning region 16 -
The Gross Regional Product of the tropical North Queensland tourism region is greater than that for the FNQ planning region, as it includes significant mining areas in the Cape York Peninsula that are not in the planning region. The effect of excluding these areas would be to raise the shares for the industry categories in the planning region slightly, as most of the tourist expenditure (including over 95 per cent of the international visitor expenditure) is within this region. However, the general pattern of expenditure would remain the same. As shown in Table 3, tourism accounted for about 15 per cent of the Gross Regional Product. The major impact was in relation to the categories of:
accommodation, cafes and restaurants (77 per cent tourism-related) transport, storage and communications (33 per cent tourism-related)
retail and wholesale trade (25 per cent)
cultural, recreational, personal and other services (20 per cent).
Almost two-thirds of the impact on the Gross Regional Product was on the transport, storage and communications, accommodation, cafes and restaurants and retail and wholesale trade categories. The tourism Gross Regional Product had a comparable share of the total Gross Regional Product in Sunshine Coast (16.0 per cent) and Gold Coast (14.5 per cent) but was higher than the other tourism regions.
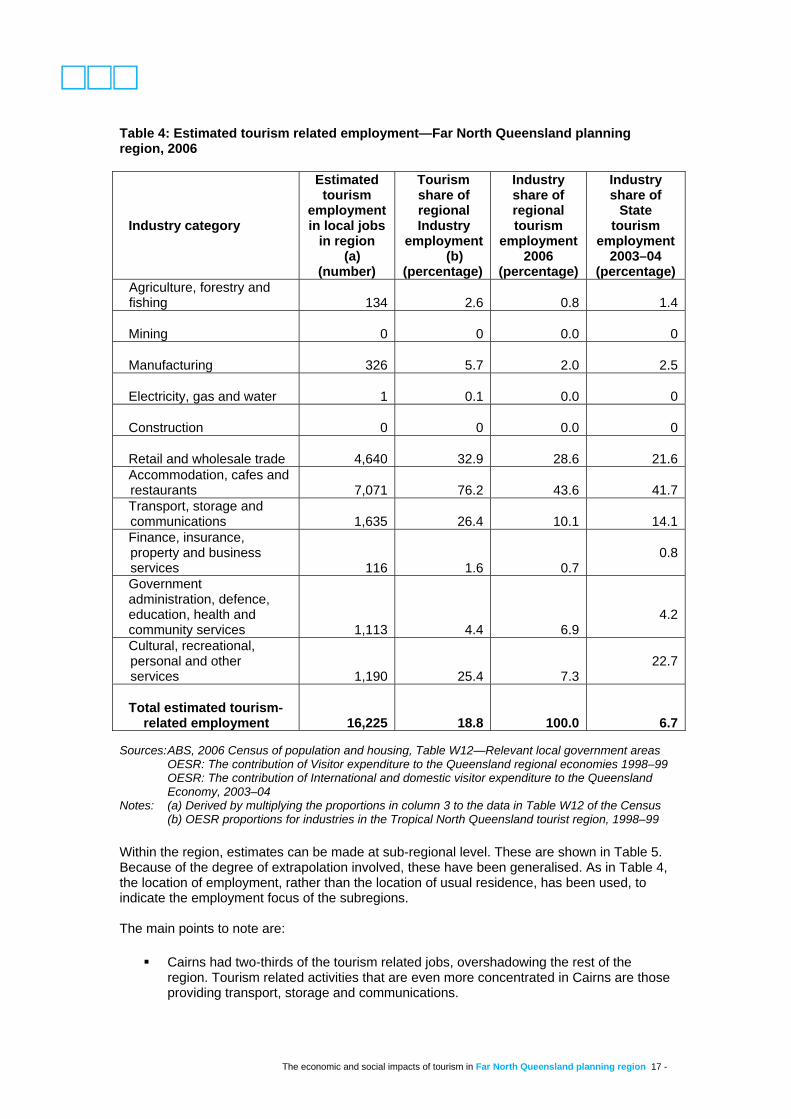
3.3 Estimated contribution to regional employment—Far North Queensland planning region
A study by the Office of Social and Economic Research in the Queensland Treasury assessed the impact on employment for 1998–99. As the employment relationships found for the tourism region are closely aligned with those for the FNQ planning region, estimations of the employment impact have been made for the planning region. As the region has a large population, the number of jobs is similar to that of the usual residence workforce, with only a slight net leakage out of the region (associated with fly in–fly out employment in Cape York, where there are more people working there than the usual resident workforce). Table 4 shows the estimated employment in tourism based jobs in the region. The main points to note are:
About 16,000 jobs depend directly on tourism for a living, about 20 per cent of the jobs in the planning region.
This level is approximately three times the overall significance of tourism in state
employment.
The structure of tourism’s impact is different from the state distribution. There is a greater impact on retail and wholesale trade, but lesser relative shares in most other industries, notably cultural, recreational, personal and other services.
The economic and social impacts of tourism in Far North Queensland planning region 17 -
Table 4: Estimated tourism related employment—Far North Queensland planning region, 2006
Industry category
Estimated tourism
employment in local jobs
in region (a)
(number)
Tourism share of regional Industry
employment(b)
(percentage)
Industry share of regional tourism
employment 2006
(percentage)
Industry share of
State tourism
employment 2003–04
(percentage) Agriculture, forestry and fishing 134 2.6 0.8 1.4 Mining 0 0 0.0 0 Manufacturing 326 5.7 2.0 2.5 Electricity, gas and water 1 0.1 0.0 0 Construction 0 0 0.0 0 Retail and wholesale trade 4,640 32.9 28.6 21.6Accommodation, cafes and restaurants 7,071 76.2 43.6 41.7Transport, storage and communications 1,635 26.4 10.1 14.1Finance, insurance, property and business services 116 1.6 0.7
0.8
Government administration, defence, education, health and community services 1,113 4.4 6.9
4.2
Cultural, recreational, personal and other services 1,190 25.4 7.3
22.7
Total estimated tourism-
related employment 16,225 18.8
100.0 6.7 Sources: ABS, 2006 Census of population and housing, Table W12—Relevant local government areas OESR: The contribution of Visitor expenditure to the Queensland regional economies 1998–99
OESR: The contribution of International and domestic visitor expenditure to the Queensland Economy, 2003–04
Notes: (a) Derived by multiplying the proportions in column 3 to the data in Table W12 of the Census (b) OESR proportions for industries in the Tropical North Queensland tourist region, 1998–99 Within the region, estimates can be made at sub-regional level. These are shown in Table 5. Because of the degree of extrapolation involved, these have been generalised. As in Table 4, the location of employment, rather than the location of usual residence, has been used, to indicate the employment focus of the subregions. The main points to note are:
Cairns had two-thirds of the tourism related jobs, overshadowing the rest of the region. Tourism related activities that are even more concentrated in Cairns are those providing transport, storage and communications.

The economic and social impacts of tourism in Far North Queensland planning region 18 -
Douglas had a major focus on accommodation, cafes and restaurants, with two-thirds of local tourism related employment in this category, with comparatively little development of other sectors.
Tablelands and the Cassowary Coast had a focus on retailing and accommodation,
cafes and restaurants, with limited impact in other categories.
Tourism was not significant in the Aboriginal council areas.
Table 5: Estimated tourism related employment, subregions of the Far North Queensland planning region, by work location, 2006
Industry category C
airn
s Dou
glas
Cas
sow
ary
Coa
st
Tab
lela
nds
Abo
rigin
al
coun
cils
Region
Primary industry 25 (a) 50 50
(a) 125
Secondary industry 200 25 75 50
(a) 325
Retail and wholesale trade 3,175 225 525725
(a) 4,650
Accommodation, cafes and restaurants 4,625 1,050 650
725
(a) 7,075
Transport, storage and communication services 1,215 125 125
150
(a) 1,625
Cultural, recreational, personal and other services 800 75 125
175
(a) 1,200
Other 825 50 125
200
50 1225
Total
10,850 1,550 1675
2100
50 16,225
Sources: ABS, 2006 Census of population and housing, Table W12—relevant local government areas OESR: The contribution of visitor expenditure to the Queensland regional economies 1998–99
Notes: Estimates rounded to nearest 25. Totals may not add as cell rounding has been used. (a) fewer than 13
The business surveys in Queensland show that about 40 per cent of businesses in the planning region are considered tourism related. This is shown in Table 6. However it is worth noting that these businesses are not entirely dependent on tourism as they also service a resident catchment. Table 6: Percentage of local businesses that are tourism related sub-region, Far North Queensland planning region, 2006
Area
Percentage
Cairns 39 Douglas 41 Cassowary Coast 54 Tablelands (a) 45 Aboriginal Councils 0 Planning region (a) 42
Sources: Tourism Australia: Tourism profiles for Local Government Areas in regional Australia, 2008—relevant local government areas
Space-Time Research: Yellow Pages business counts, 2006

The economic and social impacts of tourism in Far North Queensland planning region 19 -
Note: (a) Includes estimated data for areas not covered by the survey
4 Tourism influences on housing stock
4.1 Composition of housing stock The large number of tourists visiting the region has a significant effect on the composition of housing stock within the region. The Australian Bureau of Statistics identifies two basic categories of dwellings. Private dwellings are self-contained housing units, non-private dwellings are not. Private dwellings are further classified as to the type of dwelling, with separate houses being the dominant type in Queensland. Attached dwellings include flats, units, apartments and town houses. ‘Other’ is made up largely of caravans, cabins, tents, boats and living quarters attached to non-residential buildings. Non-private dwellings include hotels, motels, hostels and boarding houses and private hotels, as well as the range of institutional living accommodation forms, such as hospitals, boarding schools, residential halls, aged persons facilities (not self contained), nursing homes and prisons. In 2006, FNQ planning region had a total of almost 90,000 private dwellings occupied by Australians. In addition, there were over 9,000 vacant dwellings. No count is reported on private dwellings occupied by international visitors. This is a problem for assessing the impact of tourism, as 56 per cent of these visitors were recorded in private dwellings—as shown in Table 10 in section 4.2 below. A summary of the situation is set out in Table 7. Table 7: Distribution of private dwellings by sub-region, Far North Queensland planning region, 2006
Area
Separate houses
Attached dwellings
Other dwellings
Total private
dwellings (a)
Unoccupied as
percentage of all
dwellings Cairns
Number Percentage
38,29866.2
17,57930.4
1,9603.4
57,870 100 8.8
Douglas Number
Percentage 3,153
45.93,014
43.969110.1
6,865 100 15.9
Cassowary Coast
Number Percentage
9,90678.9
1,53412.2
1,1038.8
12,551 100 10.8
Tablelands Number
Percentage 15,605
87.01,320
7.41017
5.717,946
100 9.7
Region Number
Percentage 69,565
71.023,447
23.94,938
5.098,002
100 9.6
Queensland
Percentage 75.4 21.8 2.7 100 9.2 Source: ABS, 2001 Census of population and housing, Table P31—Queensland relevant Local
Government Areas; and unpublished ABS data Note: (a) includes ‘not stated’, in all areas less than 0.11 per cent of the total stock

The economic and social impacts of tourism in Far North Queensland planning region 20 -
The main points to note are:
Of the private dwellings counted, 71 per cent were separate houses. This proportion was lower than the statewide situation (75 per cent).
There were major differences at sub-regional level. The Aboriginal councils had 94
per cent of their stock as detached houses, Tablelands had 87 per cent and the Cassowary Coast 79 per cent. These are levels comparable to many rural regions across the state.
Cairns had 65 per cent as separate houses, while Douglas had only a minority of its
stock (46 per cent) as separate houses, although these formed the largest single segment of its stock. These are comparable with other tourism oriented areas such as Gold Coast City, Whitsunday Shire and Noosa Shire.
The attached housing proportion in the region is slightly higher than that in the state
as a whole. Again, there were clear sub-regional differences, with Douglas having 44 per cent of its stock in this form. Cairns at 30 per cent was also well above the state average. However, the proportions in Cassowary Coast and Tablelands were below 10 per cent. There were no dwellings of this form recorded in the Aboriginal councils.
‘Other’ types of private dwellings are mainly caravans, cabins, houseboats and tents,
once again closely associated with tourism, in particular domestic tourism. The region had almost twice the statewide proportion in this category, with all sub-regions above the state average. These forms of dwelling were especially important in Douglas and Cassowary Coast, where they comprised about 10 per cent of the stock. In Cairns, while absolute figures are the highest of the subregions, the well established major urban aggregation means that proportionately the effect is lessened and localised.
The proportion of unoccupied dwellings was highest in Douglas, but only Cairns and
the Aboriginal councils had levels below the state average. Overall, Cairns had 59 per cent of the region’s housing stock (see Table 8). However, the sub-region had lower proportions of the separate house and ‘other’ stock (55 and 40 per cent respectively), and higher shares of the townhouse and unit stock (75 per cent). Douglas had 7 per cent of the total stock, less than 5 per cent of the separate houses, but 13 per cent of the attached dwellings and 14 percent of the other types of dwelling. The other sub-regions had one-third of the region’s stock, but 40 per cent of the separate houses and 46 per cent of the other types. Vacant accommodation roughly followed the overall pattern, but Douglas had a significantly higher share than it did of the overall stock.

The economic and social impacts of tourism in Far North Queensland planning region 21 -
Table 8: Distribution of private dwellings among the sub-region, Far North Queensland planning region, 2001 (percentage distribution) Private dwelling type
Cairns
Douglas Cassowary Coast
Tablelands Aboriginal councils
Region
Separate house 55.1 4.5 14.2 22.4 3.7 100.0Attached dwelling 75.0 12.9 6.5 5.6 0 100.0Other 39.7 14.0 22.3 20.6 3.4 100.0All private dwellings 59.0 7.0 12.8 18.3 2.8 100.0Unoccupied 54.4 11.6 14.4 18.6 1.1 100.0 Source: ABS, 2006 Census of population and housing, Table T18—Queensland and relevant local government areas
4.2 Visitor housing types Accommodation use by visitors is quite varied across the region. Information for the tropical North Queensland tourism region is set out in Table 9. This refers to the year as a whole, while Census data is a snapshot at one date in the year.
Table 9: Type of accommodation used by visitors to the tropical North Queensland tourism region, 2006 (percentage distribution) Type of accommodation Domestic visitors Overseas visitors Hotel, resort and motel 35 32 Backpacker and hostel 25 Rented house and apartment 9 15 Property of friends or relations 29 10 Caravan and camping 8 Other 18 18 Total 100 100 Source: Tourism Queensland: tropical north Queensland Region—regional update, year ended December 2006
This emphasises the importance of private dwelling types (as defined in the Census) for tourism. Two-thirds of domestic visitors and over 40 per cent of international visitors were not accommodated in the resort, hotel, motel and hostel types of accommodation. The main points to note are that:
hotels, resorts, motels and hostels were likely to be used by similar numbers of domestic and overseas visitors
about 10 per cent of visitors were in rented houses or flats and about the same proportion were in cabins and camping areas
as tourist numbers fluctuate through the year, rental accommodation especially will also vary in the extent to which it is available for residents
backpacker accommodation was significant for international visitors, although the proportion (25 per cent) was well below that experienced in the Whitsundays.
These proportions (especially those for international visitors) are a reasonable guide for the FNQ planning region.
The economic and social impacts of tourism in Far North Queensland planning region 22 -
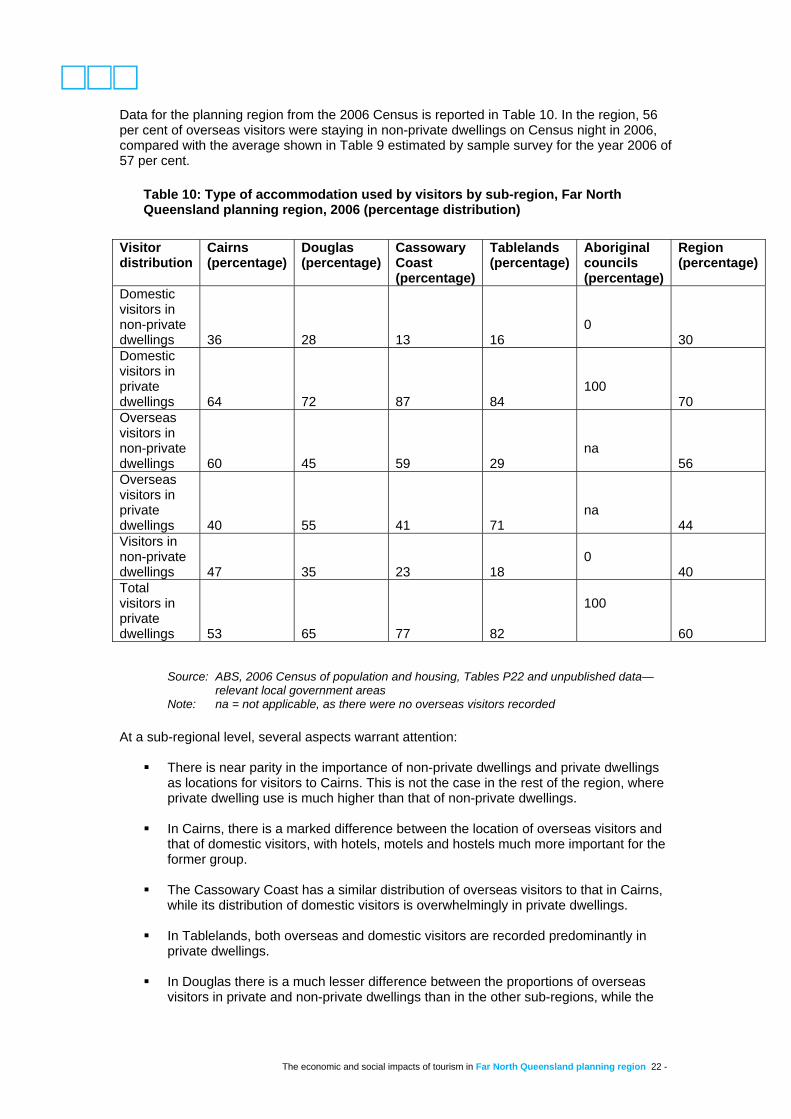
Data for the planning region from the 2006 Census is reported in Table 10. In the region, 56 per cent of overseas visitors were staying in non-private dwellings on Census night in 2006, compared with the average shown in Table 9 estimated by sample survey for the year 2006 of 57 per cent.
Table 10: Type of accommodation used by visitors by sub-region, Far North Queensland planning region, 2006 (percentage distribution)
Source: ABS, 2006 Census of population and housing, Tables P22 and unpublished data—
relevant local government areas Note: na = not applicable, as there were no overseas visitors recorded
At a sub-regional level, several aspects warrant attention:
There is near parity in the importance of non-private dwellings and private dwellings as locations for visitors to Cairns. This is not the case in the rest of the region, where private dwelling use is much higher than that of non-private dwellings.
In Cairns, there is a marked difference between the location of overseas visitors and
that of domestic visitors, with hotels, motels and hostels much more important for the former group.
The Cassowary Coast has a similar distribution of overseas visitors to that in Cairns,
while its distribution of domestic visitors is overwhelmingly in private dwellings.
In Tablelands, both overseas and domestic visitors are recorded predominantly in private dwellings.
In Douglas there is a much lesser difference between the proportions of overseas
visitors in private and non-private dwellings than in the other sub-regions, while the
Visitor distribution
Cairns (percentage)
Douglas (percentage)
Cassowary Coast (percentage)
Tablelands (percentage)
Aboriginal councils (percentage)
Region (percentage)
Domestic visitors in non-private dwellings 36 28 13 16
0
30 Domestic visitors in private dwellings 64 72 87 84
100
70 Overseas visitors in non-private dwellings 60 45 59 29
na
56 Overseas visitors in private dwellings 40 55 41 71
na
44 Visitors in non-private dwellings 47 35 23 18
0
40 Total visitors in private dwellings 53 65 77 82
100
60

The economic and social impacts of tourism in Far North Queensland planning region 23 -
difference for domestic visitors was intermediate between the situation in Cairns and the other sub-regions.
The Aboriginal councils had no visitors in their non-private dwellings.
The significance of private dwellings reflects the availability of rental self-contained accommodation, the differing importance of staying with friends and relatives across the region, and the significance of caravans, both locally provided and brought to the region by tourists themselves. The region has been subject to European settlement for 150 years and has built up relationships with other parts of the country, so staying with friends and relatives is a significant component in domestic tourism, as it is in many coastal regions of Queensland.
5 Social and economic profile of visitors compared with usual residents
5.1 Introduction Age distribution information is available for usual residents, Australian visitors and overseas visitors as at the 2006 Census. For other characteristics, a comparison can be made between those of Australian visitors and local residents, by comparing the numbers recorded in the basic community profile with those shown in the place of enumeration profile for the same areas. The basic community profile is based on the usual residence of respondents, including persons reallocated to their home local government area from where they were located on the Census night, so that the number of Australian visitors obtained by this residual method is only an approximation of the actual number.
5.2 Age structure The age structure of visitors varies by source and, in turn, is different for the resident population. This is set out in Table 11. Table 12 provides a more generalised comparison between the age structures of the visitor population.

The economic and social impacts of tourism in Far North Queensland planning region 24 -
Table 11: Age structure of residents, domestic visitors and overseas visitors, Far North Queensland planning region, 2006 (percentage distribution)
Age group (years) Cairns Douglas Cassowary Coast
Tablelands Aboriginal councils
Region State
0–14 Usual residents Australian visitors Overseas visitors
22.7 8.8 10.5
19.8 9.7 12.8
22.1 8.8 10.3
21.8 14.9 11.8
37.2 27.1 0
22.5 9.7 10.9
21.3 10.7 11.1
15–24 Usual residents Australian visitors Overseas visitors
12.7 9.7 26.0
10.7 5.1 16.9
11.1 7.9 25.8
10.0 10.6 27.6
18.9 20.8 0
12.0 8.9 24.5
13.7 13.1 26.4
25–34 Usual residents Australian visitors Overseas visitors
14.8 13.1 21.4
14.6 14.0 15.8
10.3 10.8 23.6
9.5 10.3 17.3
13.7 14.6 0
13.1 12.6 20.4
13.4 11.7 17.8
35–44 Usual residents Australian visitors Overseas visitors
16.5 13.4 12.7
16.9 13.4 14.7
14.6 11.4 11.0
14.0 9.3 12.4
14.5 16.7 0
15.7 12.6 13.0
14.8 9.6 11.0
45–54 Usual residents Australian visitors Overseas visitors
16.5 15.2 13.6
16.9 12.9 21.0
14.6 14.0 13.3
14.0 12.7 11.8
14.5 14.6 0
15.7 14.4 14.8
14.8 11.2 11.5
55–64 Usual residents Australian visitors Overseas visitors
10.2 18.9 8.9
12.9 23.3 12.0
12.3 24.2 6.6
14.3 21.6 9.3
4.1 3.1 0
11.3 20.6 9.3
11.2 18.7 10.1
65–74 Usual residents Australian visitors Overseas visitors
5.0 13.5 4.9
6.4 15.5 5.3
8.4 15.8 6.6
9.1 14.5 7.9
1.5 3.1 0
6.3 14.2 5.1
6.6 16.3 8.0
75 and over Usual residents Australian visitors Overseas visitors
3.5 7.5 2.0
3.2 6.2 1.6
5.5 7.1 2.8
6.1 6.2 2.0
0.8 0 0
4.2 7.1 2.0
5.2 8.7 4.1
Total Usual residents Australian visitors Overseas visitors
100 100 100
100 100 100
100 100 100
100 100 100
100 100 100
100 100 100
100 100 100
Source: ABS, 2006 Census of population and housing, Tables B22 and P22—relevant local
government areas The main features of the usual resident age distribution are:
The usual residence age structure for the region in 2006 was similar to that for the state as a whole, with slightly lower proportions of elderly and slightly higher proportions of those of the age likely to have young children.
All sub-regions had lower than average proportions of 15–24 year olds, and close to
average proportions of children, except in the Aboriginal councils, where the proportions in both cases were well above the state averages.
Cairns and Douglas had higher than average proportions of 25–44 year olds, while
Cassowary Coast and Tablelands had lower than average proportions of 15–34 year olds. The Aboriginal councils had only 6 per cent of their usual residents 55 years of age or older, compared to regional and state averages of 22 per cent.
The economic and social impacts of tourism in Far North Queensland planning region 25 -
The regional age distribution of Australian visitors varied from the distribution of such visitors statewide. The main differences are:
there were lesser proportions of younger persons (under 25 years) there were larger proportions of those aged 25–64 years, and fewer elderly
overall, 35 per cent of domestic visitors to the region were aged 45–64 years, and 25
per cent aged 25–44 years
in terms of 10-year age groups, the largest across the region (except in the Aboriginal councils) was the 55–64 years age group
in all sub-regions, the proportion of domestic visitors aged over 64 years was lower
than was the average statewide experience
the main difference at sub-regional level was the experience of the Aboriginal councils, where the distribution was close to that of their usual residence population, probably reflecting a pattern of visiting friends and relations, rather than tourism.
Overseas visitors to the region differed from the statewide pattern also. The main differences are:
forty-eight per cent of overseas visitors were concentrated in the 25–54 age group, compared with 39 per cent for the state as a whole
there were few elderly, with proportions falling across the region in age groups over
54 years
the concentration was of younger adults, especially in Cairns, Cassowary Coast and Tablelands
overseas visitors to Douglas split into one-third 15–34 years, one-third 35–54 years,
and the remainder in other age groups Overall, the major differences are shown in Table 12, with the regional situation shown in Figure 4.

The economic and social impacts of tourism in Far North Queensland planning region 26 -
Table 12: Major differences in the age structure of domestic visitors and overseas visitors, Far North Queensland planning region, 2001 (percentage distribution)
Age group (years)
Cairns Douglas Cassowary Coast Tablelands Aboriginal councils
Region State
0–14 Australian visitors Overseas visitors
9 11
10 13
9 10
15 12
27 0
10 11
11 11
15–34 Australian visitors Overseas visitors
23 47
19 33
19 49
21 45
35 0
22 45
25 44
35–54 Australian visitors Overseas visitors
29 26
26 35
25 24
22 24
31 0
27 28
21 28
55–74 Australian visitors Overseas visitors
32 14
39 17
40 17
36 13
6 0
35 14
35 18
Source: ABS, 2006 Census of population and housing, Table P22—relevant local government
areas Australian and overseas visitor populations each had a minor proportion of families with children travelling, but that the Australian visitors were predominantly older adults while the overseas visitors were predominantly younger adults. This reinforces the information in Table 8, with most of the domestic visitors not staying in hotel or resort sector of accommodation, with significant numbers either staying with friends or relatives or in their own caravans or tents.
Source: ABS, 2006 Census of Population and Housing, Tables B41, B44, P39 and P42
Figure 4: Comparative age structure of usual residents, domestic visitors and overseas visitors, FNQPR, 2006
0
5
10
15
20
25
30
35
40
45
50
0-14 years 15-34 years 35-54 years 55-74 years 75 years andover
Age group
Perc
enta
ge
Usual residents Domestic visitors Overseas visitors

The economic and social impacts of tourism in Far North Queensland planning region 27 -
5.3 Occupation The 2006 Census provides limited information on the distribution of occupations among the visitor population. Using the residual method outlined above, a comparison can be made between the occupational structure of the usual resident population and the approximate occupational distribution of Australian visitors. Information is only shown for areas that have a sufficiently large usual resident population, or where the visitor population recorded is a major proportion of the number recorded in the basic community profile. In practice, this meant that only three sub-regions could be separately reported—Cairns, Douglas and the Cassowary Coast—with aggregate data for the others (see Table 13). However, these figures should be used with caution, as they are only an approximate guide to the actual situation with respect to visitors. Table 13: Comparison of the occupational structure of usual residents and domestic visitors, Far North Queensland planning region, 2006 (estimated percentage distribution of those aged 15 years or more) Occupational group
Population Region Cairns Douglas Cassowary Coast
Managers and professionals
Usual residents Domestic visitors
17 18
17 17
17 26
15 12
Technicians and tradespersons
Usual residents Domestic visitors
10 3
11 2
11 4
9 7
Community and personal services
Usual residents Domestic visitors
6 2
7 2
9 4
4 1
Clerical and sales Usual residents Domestic visitors
14 8
16 8
13 12
10 6
Machine operators, drivers and labourers
Usual residents Domestic visitors
12 2
11 2
14 2
16 4
Occupation not stated or inadequately described
Usual residents Domestic visitors
1 1
1 1
1 1
1 0
Unemployed Usual residents Domestic visitors
3 1
3 2
2 1
3 1
Not in the labour force
Usual residents Domestic visitors
28 48
25 47
23 39
33 59
Not stated Usual residents Domestic visitors
9 16
10 20
10 12
8 9
Total aged 15 years or more
Usual residents Domestic visitors
100 100
100 100
100 100
100 100
Source: Estimated from ABS, 2006 Census of population and housing, Tables B41, B44, P39 and P42—relevant local government areas Note: Estimates for domestic visitors are approximate only The main purpose of this table is to emphasise the major role of retirement in domestic tourism. About half the domestic visitors over 15 years of age were not in the labour force, a much higher level than in the regional community. This was accentuated away from Cairns and Douglas. Since 41 per cent of domestic visitors were 55 years or older, many were retired and not counted in the employed workforce. The domestic visitors who were employed had a different distribution from the usual residents. While the proportion classified as managers and professionals was comparable among the domestic visitors and in the usual resident population in the region, this was not the case for any other major group. There was a notable lack of blue collar workers in the visitor stream.

The economic and social impacts of tourism in Far North Queensland planning region 28 -
The occupational distribution in Cairns of domestic visitors is generally close to the regional one, to which it contributes the major share. Douglas has higher proportions of managers and professionals among its visitors, while the impact of retired persons is less. The rest of the region is dominated by retiree movements.
5.4 Income The 2006 Census provides limited information on the distribution of income among the visitor population. Using the residual method outlined above, a comparison can be made between the income distribution of the usual resident population and the approximate income distribution of Australian visitors. However, these figures should be used with caution, as they are only an approximate guide to the actual situation with respect to visitors. Figure 5 shows the general situation at regional level, while Table 14 provides greater detail. Table 14: Comparison of the reported individual income distribution of usual residents and domestic visitors, Far North Queensland planning region, 2006 (estimated percentage of the population aged 15 years and older)
Income per week
Group Cairns Douglas Cassowary Coast
Tablelands Aboriginal councils
Regional total
Less than $250
Usual residents Domestic visitors
22 21
20 16
27 23
31 41
61 (a)
25 21
$250–399 Usual residents Domestic visitors
12 14
13 10
15 17
16 15
13 (a)
13 13
$400–599 Usual residents Domestic visitors
16 12
19 12
18 14
16 13
12 (a)
16 12
$600–799 Usual residents Domestic visitors
13 8
15 10
11 10
10 16
7 (a)
12 9
$800–999 Usual residents Domestic visitors
9 8
8 9
7 9
8 6
2 (a)
8 7
$1,000 or more
Usual residents Domestic visitors
16 18
12 30
11 15
10 2
2 (a)
14 20
Not stated Usual residents Domestic visitors
12 21
12 13
11 12
12 7
3 (a)
12 18
Total Usual residents Domestic visitors
100 100
100 100
100 100
100 100
100 100
100 100
Source: ABS, 2006 Census of population and housing, Tables B16 and P16—relevant local government areas Notes: (a) estimates unreliable. Estimates for domestic visitors are approximate only

The economic and social impacts of tourism in Far North Queensland planning region 29 -
Source: ABS, 2006 Census of population and housing, Tables B16 and P16—relevant local government areas Note: No data is shown for domestic visitors to the Aboriginal councils, as estimates are unreliable.
The main differences reflect the employment situation outlined above. At the regional level, one-third of domestic tourists reported a regular personal income of less than $400 per week, although this does not allow for the combined income of tourist parties. At the other extreme, one in five domestic tourists in the region had a reported weekly income exceeding $1,000. At sub-regional level, the patterns varied. Tourism was not significant in the Aboriginal councils. Tablelands had the highest proportion of low income visitors, and the lowest proportion of high income visitors (2 per cent over $1,000 per week). The other extreme was Douglas, which has the lowest proportion of low income visitors and the highest proportion of high income visitors (30 per cent reporting over $1,000 per week). The other two sub-regions were in between these two extremes, with the Cairns visitors having higher incomes than the Cassowary Coast.
Figure 5: Declared individual income of usual residents and domestic visitors aged 15 years and older, FNQPR, 2006
0 10 20 30 40 50 60 70 80
Usual residents - regional total
Domestic visitors - regional total
Usual residents - Abor. Councils
Usual residents - Tablelands
Domestic visitors - Tablelands
Usual residents - Cass. Coast
Domestic visitors - Cass. Coast
Usual residents - Douglas
Domestic visitors - Douglas
Usual residents - Cairns
Domestic visitors - Cairns
Res
pond
ents
by
loca
tion
Percentage
Less than $400 $400-$799 $800 and higher

The economic and social impacts of tourism in Far North Queensland planning region 30 -
6 Conclusion 6.1 Distinctive characteristics of the Far North
Queensland planning region Tourism has an impact on industry, employment, family and age structure. Although many coastal local government areas in Queensland are affected by tourism, few are affected as much as the newly created Cairns Regional Council. The economic importance of the tourism industry to the region has been estimated to be more than three times the state average. With more than 2,000,000 visitors per year, the region accounts for 28 per cent of the expenditure of international visitors to the state and 13 per cent of that of domestic visitors (Tourism Queensland, 2007). On an average day, one person in six in the region is a visitor. The demand for accommodation, cafes and restaurants, in particular, is reflected in the high proportion of people employed in these types of service industries. Other service related industry sectors, such as retailing, transport and storage were also important for employment in the region.
6.2 Character of different areas of the region This report utilises four sub-regions to indicate internal variation within the region. The Cairns sub-region, corresponding to the previous City of Cairns, is the dominant centre of the region, in population, economic, social and cultural matters. It also is the main focus for tourism. The Douglas sub-region, focused on Port Douglas and the Daintree areas, has developed a separate mix of tourism infrastructure, leading to a localised pattern of tourism services and characteristics of visitors. The Tablelands sub-region is attractive to day trippers from the two coastal centres and to the self-contained driving tourists, who carry their own accommodation. The Cassowary Coast has components of both the Tablelands pattern of tourism and the early stages of resort development like Douglas. There is effectively no reported tourism industry in the Aboriginal councils.
6.3 Differences between tourists and usual residents
The social and economic profile of visitors differs considerably from that of usual residents. Beyond this, the characteristics of domestic tourists show pronounced differences from those of international visitors. While overseas visitors tended to be young adults, travelling either as couples or alone, domestic visitors had a concentration in the 55–74 age group. Compared with usual residents, the income of domestic visitors was more concentrated in higher income groups. Within the region, domestic visitors to the Tablelands and Cassowary Coast sub-regions were predominantly low income earners, reflecting the focus on those of retirement age. Douglas had a lower proportion of low income visitors and 30 per cent of their domestic visitors had an income of over $1,000 per week in 2006. A majority of domestic visitors to the region as a whole reported incomes of less than $600 per week, with over 40 per cent of those that declared an income receiving less than $400 per week. While tourists and usual residents had similar proportions of persons employed in managerial and professional occupations, there were much lower proportions of persons in lower white collar and especially in blue collar occupations among the tourists than the local residents. Additionally, half the adult domestic tourists indicated that they were not in the workforce.

The economic and social impacts of tourism in Far North Queensland planning region 31 -
6.4 Social and economic impacts of tourism Socially, the region has a sufficiently large resident population to support a level of diversity comparable to that statewide. Both domestic and overseas visitors had similar low proportions of school and pre-school age children, but beyond this small family-based component, international visitors tended to be young adults while domestic visitors were predominantly elderly. Tourism is very important to the region’s economy, with 15 per cent of the Gross Regional Product related to the tourism industry. Employment also benefited from the need to service tourist requirements, with 20 per cent of local jobs directly related to tourism. Tourism has also impacted on local infrastructure, notably tourist related facilities such as marinas and harbours, as well as the international airport. There is an increased demand and need for good quality roads and signage. The accommodation impact of resorts, hotels, motels and backpacker hostels is obvious, but the majority of domestic tourists and over 40 per cent of international visitors stay in other less obvious housing forms, as well as facilities for driving holidays such as camping areas, caravan parks, cabins and informal temporary stays on roadsides and with local residents.
6.5 Implications for regional planning Tourism permeates the landscape of the region and the lifestyles of its residents. With one in six persons in the region at any time being a tourist, visitors have a major impact on the provision and use of facilities and services, far beyond what use of resident population numbers would suggest. Planning has to take into account the direct implications of these numbers and their specific needs. At regional level, the number of domestic and overseas tourists has been similar overall for some time. As their age and travel unit structures are quite different, the result is a continuing and growing demand for a wide spread of types of facilities, disproportionate to that generated by the resident population. The high proportion of visitors staying with friends and relatives also has a social impact and spreads the visibility and impact of tourists region-wide. At a basic level, many domestic tourists are on driving holidays, which means that road usage is disproportionate to that to be expected from the local population, both in terms of demand and maintenance. As indicated, signage requirements are elevated compared with other areas of the state. Housing needs are also increased, as most visitors do not stay in hotels, motels, resorts or hostels—although these are also a high priority, with special planning needs. The main points noted above were that:
hotels, resorts and motels were likely to be used by similar numbers of domestic and overseas visitors
about 10 per cent of visitors were in rented houses or flats, and about the same proportion were in cabins and camping areas
as tourist numbers fluctuate through the year, rental accommodation especially will also vary in the extent to which it is available for residents
backpacker accommodation was significant for the international visitors
over one-quarter of domestic visitors stay for at least part of their holiday period with friends or relations
The consequence is a variable and extensive demand for provision of a wide range of accommodation. This mix varies significantly at sub-regional level and planning has to account for this.

The economic and social impacts of tourism in Far North Queensland planning region 32 -
Census employment data shows that one in five jobs for local residents are directly related to tourism, predominantly in accommodation, cafes and restaurants, retailing, transport services and cultural, recreational and personal services. In addition, there are significant numbers of visitors on working holidays, mainly but not restricted to backpackers. The local employment market is partially dependent on these and appropriate jobs have to be considered in planning for the region. At the same time, most domestic visitors are not in the workforce—mainly children or older, retired persons. The proportion of such visitors (60 per cent) is twice that present in the resident population. Inland areas have large proportions of low income visitors, while the high income visitors concentrate in Cairns and the Douglas sub-regions. This is only partially mitigated by the extent of day tripping from these nodes into the hinterland, as this does not generate accommodation income. Specialist infrastructure costs in the region resulting from tourist demand are high, compared with most areas of Queensland. Maintenance and promotion of an international airport and harbour and marina facilities (and access to them) are the most obvious. However, there are additional costs (beyond meeting local demand) to be planned, to meet tourist expectations of the standard of provision of local services and amenity. Recent forecasts from the Tourism Forecasting Committee suggest that arrivals to Australia will increase by 4.8 per cent each year between 2006 and 2016 compared with growth of 2.9 per cent over the decade to 2006. The economic value of this inbound tourism is also expected to increase, with growth of 4.7 per cent each year projected. Naturally, this growth in overseas arrivals to Australia will have a flow-on effect to regions like Far North Queensland where overseas visitors comprise a significant component of the tourism industry. In contrast, domestic forecasts, also produced by the Tourism Forecasting Committee, suggest that the number of domestic visitor nights in Queensland will ease over the next two years. These forecasts suggest a decline from around 74,800 in 2008 to 72,500 in 2010. This pattern is expected to be followed by steady annual increases to reach around 74,400 by 2016 (approximately the same as achieved in 2005). The volatility in the tourism market is ameliorated to some degree by the differences between the domestic and overseas markets. However, planning for the impacts of tourism does need to take into account the variable nature of the industry and be flexible enough to withstand the cycles of demand reflected by different travel patterns from domestic and overseas tourists on a year-to-year basis. Tourism is a major factor in the development of the region—planning that is sensitive to both its needs and the implications for residents will continue to be fundamental to the continued wellbeing of all affected.

The economic and social impacts of tourism in Far North Queensland planning region 33 -
Appendix Visitors by urban centre, locality and balance of subregion, Far North Queensland planning region, September 2006 Centre
Sub-region
Domestic visitors
Overseas visitors
Total visitors
Usual residents
Babinda Cairns 52 4 56 1,167 Bramston Beach Cairns 99 6 105 177 Cairns Cairns 11,119 9,715 20,834 98,349 Cairns Northern Beaches Cairns 2,773 1,861 4,634 15,494 Gordonvale Cairns 162 9 171 4,420 Smithfield Cairns 213 98 311 3,074 Cairns balance Cairns 312 105 417 4,757 Cooya Beach Douglas 34 0 34 597 Craiglie Douglas 665 472 1,137 2,539 Mossman Douglas 162 63 225 1,741 Newell Douglas 62 14 76 383 Oak Beach Douglas 21 67 88 161 Port Douglas Douglas 2,450 1,599 4,049 948 Wonga Beach Douglas 77 0 77 747 Douglas balance Douglas 772 513 1,285 3,077 Bingal Bay Cassowary Coast 50 15 65 402 Cardwell Cassowary Coast 326 57 383 1,252 El Arish Cassowary Coast 6 3 9 230 Flying Fish Point Cassowary Coast 119 20 139 715 Innisfail Cassowary Coast 425 58 483 8,261 Johnstone South Cassowary Coast 15 0 15 481 Mission Beach Cassowary Coast 324 86 410 516 Mission Beach South Cassowary Coast 260 67 327 688 Mourilyan Cassowary Coast 9 3 12 424 Silkwood Cassowary Coast 0 6 6 324 Tully Cassowary Coast 137 47 184 2,458 Tully Heads Cassowary Coast 142 11 153 458 Wongaling Cassowary Coast 302 196 498 991 Cassowary Coast balance Cassowary Coast 817 215 1,032 10,586 Atherton Tablelands 395 81 476 6,247 Chillagoe Tablelands 52 0 52 226 Dimbulah Tablelands 16 0 16 381 Herberton Tablelands 47 5 52 974 Kairi Tablelands 30 0 30 193 Kuranda Tablelands 83 27 110 1,610 Malanda Tablelands 48 11 59 1,008 Mareeba Tablelands 279 17 296 6,806 Millaa Millaa Tablelands 33 11 44 290 Mount Garnet Tablelands 26 0 26 457 Ravenshoe Tablelands 97 4 101 909 Tinaroo Tablelands 171 12 183 268 Tolga Tablelands 36 5 41 843 Yungaburra Tablelands 83 42 125 932 Tablelands balance Tablelands 1,285 293 1,578 19,766 Wujal Wujal Aboriginal councils 16 0 16 324 Yarrabah Aboriginal councils 50 0 50 2,372 Aboriginal Councils balance Aboriginal councils 1 0 1 3 Total Region 24,653 15,818 40,471 20,9026

Source: ABS, 2006 Census of population and housing, Tables B01 and PO3 (Urban centre and locality profile) and PO3 (Local Government Area profiles)
References Australian Bureau of Statistics, 2001 Census of population and housing Australian Bureau of Statistics, 2006 Census of population and housing Australian Bureau of Statistics, Tourist accommodation, Small Area Data, Queensland, Cat No 8635.3 Ipalawatte, C (2004): TRA niche market report number 4, Backpackers in Australia, 2003, Tourism Research Australia, Tourism Australia, Canberra Queensland Treasury, Office of Economic and Social Research, The contribution of visitor expenditure to the Queensland regional economies 1998–99 Queensland Treasury, Office of Economic and Social Research, The contribution of international and domestic visitor expenditure to the Queensland economy, 2003–04 Queensland Treasury, Office of Economic and Social Research, FNQ 2025 Planning area economic profile 2008 Tourism Queensland (2007), Travel expenditure by domestic and international visitors, year ended December 2006 Tourism Research Australia (2007), International and domestic visitor survey Australia, year ended March 2007 (unpublished material) Tourism Research Australia (2008), Tourism profiles for Local Government Areas in regional Australia—Queensland