Economic and Social Criteria and Indicators · Economic and Social Criteria and Indicators Southern...
64
Economic and Social Criteria and Indicators Southern Region A project undertaken as part of the NSW Comprehensive Regional Assessments Final Report - March 2000
Transcript of Economic and Social Criteria and Indicators · Economic and Social Criteria and Indicators Southern...
Economic and Social Criteria and IndicatorsSouthern Region
A project undertaken as part of the NSW Comprehensive Regional AssessmentsFinal Report - March 2000


ECONOMIC ANDSOCIAL CRITERIA AND
INDICATORS
SOUTHERN REGION
Hassall & Associates Pty Ltd
A project undertaken forthe Joint Commonwealth NSW Regional Forest Agreement Steering Committee
as part of theNSW Comprehensive Regional Assessments
NS27/ES

For more information and for information on access to data contact the:
Resource and Conservation Division, Department of Urban Affairs and Planning
GPO Box 3927SYDNEY NSW 2001
Phone: (02) 9228 3166Fax: (02) 9228 4967
Forests Taskforce, Department of the Prime Minister and Cabinet
3-5 National CircuitBARTON ACT 2600
Phone: 1800 650 983Fax: (02) 6271 5511
© Crown copyright March 2000New South Wales GovernmentCommonwealth Government
ISBN 1 74029 148 4
This project has been jointly funded by the New South Wales and Commonwealth Governments andmanaged through the Resource and Conservation Division, Department of Urban Affairs and Planning,and the Forests Taskforce, Department of the Prime Minister and Cabinet.
The project has been overseen and the methodology has been developed through the Economic andSocial Technical Committee which includes representatives from the New South Wales andCommonwealth Governments and stakeholder groups.
DisclaimerWhile every reasonable effort has been made to ensure that this document is correct at the time ofprinting, the State of New South Wales, its agents and employees, and the Commonwealth of Australia, itsagents and employees, do not assume any responsibility and shall have no liability, consequential orotherwise, of any kind, arising from the use of or reliance on any of the information contained in thisdocument.

1. CONTENTS
Project summary
1. INTRODUCTION 11.1 Introduction 11.2 Background to the CRA/RFA Process 11.3 Study Area 21.4 Methodology 21.5 Data 3
2. CRITERIA AND INDICATORS 42.1 Introduction 42.2 Purpose and Characteristics of Performance Indicators 42.3 The Montreal Process 62.4 Indicators From the Regional Framework 82.5 Summary and Conclusions 11
3. DATA SOURCES 123.1 Introduction 123.2 Literature Review 123.3 Appropriate Data Sources 133.4 Summary and Conclusions 23
4. INDICATORS 244.1 Introduction 244.2 category a indicators 274.3 Category B Indicators 374.4 conclusions 48
5. FURTHER RECOMMENDATIONS 505.1 Introduction 505.2 gap analysis 505.3 Recommendations 53
6. REFERENCES 54
7. ABBREVIATIONS USED IN THIS REPORT 56


PROJECT SUMMARY
This report describes a project undertaken as part of the comprehensive regionalassessments of forest in New South Wales. The comprehensive regional assessments(CRAs) provide the scientific basis on which the State and Commonwealth Governmentswill sign regional forest agreements (RFAs) for major forest areas of New South Wales.These agreements will determine the future of these forests, providing a balance betweenconservation and ecologically sustainable use of forest resources.
Project Objective/s
The objective of this study was to develop regionally based economic and socialindicators to facilitate monitoring and management of the Southern ComprehensiveRegional Assessment (CRA).
Methods
The study required a review and update of the literature. Discussions with State andCommonwealth agencies were also undertaken to identify appropriate data sources for theassignment. Following identification of data sources recommendations have been madeconcerning the categories for the various indicators identified by the Montreal ProcessImplementation Group (MIG) report “A framework of regional (sub-national) levelcriteria and indicators of sustainable forest management in Australia”, 1998.
Key results and products
■ Five Category A indicators have been identified, covering:
■ Production and Consumption, Recreation and Tourism, Cultural, Social and SpiritualNeeds and Values and Employment and Community Needs
■ Six Category B indicators have been identified, covering:
■ Production and Consumption, Investment in the Forest Sector, Cultural, Social andSpiritual Needs and Values Employment and Community Needs and IndigenousParticipation and Management
■ A central body is required to monitor and develop an overview report for theindicators. This role would best be performed by a central agency, as it will permit amore strategic recommendation and response to any changes demonstrated by theindicators.
■ Clear objectives for the indicators are required before targets can be set, which in turnare fundamental to interpretation and reporting.


March 2000 Economic and Social Criteria and Indicators: Southern CRA Region
1
1. INTRODUCTION
1.1 INTRODUCTION
The purpose of the study was to develop regionally based economic and social indicators tofacilitate monitoring and management in the Southern Comprehensive Regional Assessment(CRA) region. The indicators, as identified in “A Framework of Regional (Sub-national) LevelCriteria and Indicators of Sustainable Forest Management in Australia” (MontrealImplementation Group, August 1998), were assessed to determine their application to theSouthern CRA, data sources were identified for appropriate indicators and recommendationsmade for implementation and further development.
This report was commissioned by NSW National Parks and Wildlife Service (NSW NPWS) andis jointly managed with the Resource and Conservation Division (RACD) of the Department ofUrban Affairs and Planning (DUAP). Hassall & Associates completed this analysis for theproject managers in March 2000.
1.2 BACKGROUND TO THE CRA/RFA PROCESS
RACD has been established to review forestry issues in New South Wales and to provide adviceto the State Government for the development of its forestry and conservation policies andreforms. A key activity of RACD is the co-ordination of CRAs on forested land, to facilitate theestablishment of Regional Forest Agreements (RFAs).
The CRAs provide the scientific basis on which the State and Commonwealth Governments willsign RFAs for major forest areas of New South Wales. These agreements will determine thefuture of these forests, providing a balance between conservation and ecologically sustainableuse of forest resources. The economic and social components of the CRA process involvesconsideration of the commercial values (such as timber, tourism, grazing, apiary) as well as theconservation values (such as species diversity) derived from State forests and evaluating thesocio-economic and long term ecological impact of the alternative uses of these resources.
The Southern CRA is the fourth region to be assessed in New South Wales: CRAs have beenundertaken for the Eden and Upper and Lower North-East areas of New South Wales.
1.3 OBJECTIVES OF THE PROJECT
The objectives of the report are to:
■ develop from the criteria and indicators specified in the document “A Framework ofRegional (Sub-National) Level Criteria and Indicators of Sustainable Forest Managementin Australia” (Montreal Implementation Group, August 1998), relevant regional basedeconomic and social indicators to enable monitoring and assist decision makers in assessingthe outcomes (as associated with the Southern region RFA) of forest management inachieving ecologically sustainable forest management (ESFM);

Economic and Social Indicators: Southern CRA Region March 2000
2
■ recommend mechanisms for measuring, monitoring and reporting on each indicator andwhere appropriate, recommend specific target levels for each of the criteria and indicatorssuggested;
■ identify government and non-government sources of data, including data format, frequencyof collection and associated costs of using the data for annual ESFM reporting requirementsas specified in the Forest Agreements;
■ provide recommendations on standardised definitions, confidentiality requirements andappropriate methodologies to ensure consistency across recommended indicators; and
■ provide discussion of issues arising in implementing any recommended indicators, includingpotential indicator gaps, confidentiality of data, reporting of information and potentialcorrelation between indicators.
1.4 STUDY AREA
The Southern CRA region encompasses 20 local government areas (LGAs). The region itself isdivided into three sub-divisions:
■ coastal
■ western tablelands
■ northern tablelands
Table 1a lists the local government areas that are included as part of each sub-division.
TABLE 1A LOCAL GOVERNMENT AREAS WITHIN EACH SUB-DIVISION
Sub-divisionCoastal Western Tablelands Northern TablelandsWingecarribee Tumbarumba GoulburnKiama Gundagai GunningEurobodalla Holbrook CrookwellCooma-Monaro Tumut MulwareeTallaganda Yass Yarrowlumla “A”Shoalhaven Snowy River OberonYarrowlumla “B”Queanbeyan
1.5 METHODOLOGY
Consistent with the project brief, the project methodology is outlined below:
■ to undertake desk-top based research to extend and refine the outcomes reported in previousCRA/RFA work and by the Montreal Implementation Group;
■ to consult relevant representatives on the ESFM and Economic and Social TechnicalCommittee and other experts where necessary to assist in the formulation of relevantregional indicators;
■ to recommend both immediately implementable (Category A) and potentially implementable(Category B) indicators for the Southern CRA region; and
■ to recommend appropriate definitions, data and information sources and mechanisms tofacilitate the measurement and reporting of indicators.

March 2000 Economic and Social Indicators: Southern CRA Region
3
1.6 DATA
Data identification was an important component of this assignment, as the indicators need totake into account what data is available. Relevant organisations and agencies which supplieddata that was either directly or indirectly incorporated into the development of the indicatorsincluded:
■ Resource and Conservation Division, Department of Urban Affairs and Planning
■ Australian Bureau of Statistics
■ Bureau of Tourism Research
■ Tourism Forecasting Council
■ New South Wales National Parks and Wildlife Service
■ State Forests of NSW
■ Tourism NSW
■ NSW Heritage Office
■ Forest Products Association
■ WorkCover NSW
An extensive listing of references that were used as part of this study is included within section6 of this report.

Economic and Social Indicators: Southern CRA Region March 2000
4
2. CRITERIA ANDINDICATORS
2.1 INTRODUCTION
The purpose of this section is to provide background information concerning Criterion 6 of theMontreal Process Agreement. Criterion 6 is defined as the ‘Maintenance and enhancement oflong term multiple socio-economic benefits to meet the needs of societies’. This studyencompasses a general discussion of the purpose and characteristics of performance indicators,an overview of the Montreal Process and presentation of the (categorised) indicators that havebeen identified by the regional framework.
2.2 PURPOSE AND CHARACTERISTICS OF PERFORMANCEINDICATORS
Performance measurement has two equally important purposes – accountability anddevelopment. Accountability refers to proving efficiency and effectiveness against statedobjectives. Land management agencies must be accountable to the State central agencies inrelation to State policies, priorities and budgets, to the Federal government in relation tonational programs and funding and the general community in relation to the expenditure ofpublic money and the achievement of positive social, economic and environmental outcomes.
Development refers to improving efficiency and effectiveness. To achieve continuousimprovement, regular monitoring of inputs, process, outputs and outcomes is required. Acomprehensive and integrated performance indicator system provides the mechanism to achievethis.
The Victorian Department of Treasury and Finance (1996) lists the desirable characteristics ofperformance measures. That is, they:
■ reduce performance to a quantifiable unit of measure;
■ measure performance using at least one of the following criteria:
− quantity
− quality
− timeliness
− cost
■ never use quantity in isolation - in most cases more than one measure should be used for theone output;

March 2000 Economic and Social Indicators: Southern CRA Region
5
■ are relevant, realistic and simple;
■ assist in decision making;
■ provide information for internal and external reporting; and
■ provide a basis for establishing targets.
Oakes (1986) as cited in Wyatt (1994) argues that indicators must provide at least one of thefollowing:
■ information that describes performance in achieving desirable conditions and outcomes - theindicator is thus linked to the goals of the system and provides a benchmark for measuringprogress;
■ information about features known through research to be linked to desired outcomes; suchindicators have a predictive value because when they change, other changes can be expectedto follow;
■ information that describes central features of a system in order to understand how a systemworks;
■ information that is problem-oriented; and
■ information that is policy relevant: indicators should describe conditions of particularconcern to policy makers and be amenable to change by policy decisions.
Indicators are part of a performance measurement system that also includes establishing targetsand benchmarking. Targets and benchmarks allow agencies to better assess their ownperformance and learn from others. ‘Benchmarking provides the conceptual framework tointegrate best practice and performance indicators into a vital quality assurance system’(Wyatt, 1994). Indicators that can best be used for benchmarking/comparisons over time aregenerally expressed as ratios or percentages. For example:
■ maintenance expenditure per visitor or per hectare;
■ maintenance expenditure: capital improved value;
■ return on investment;
■ occupancy;
■ percentage of energy from renewable sources;
■ percentage decrease in solid waste; and
■ percentage of satisfied customers.
In addition to these quantitative measures, indicators that require qualitative responses are validand useful, particularly in areas where processes or outcomes are difficult or expensive toquantify.
The Tourism Optimisation Management Model, developed in 1996 by Manidis RobertsConsultants for Kangaroo Island and the South Australian Tourism Commission, proposes anindicator framework to monitor and quantify the key economic, marketing, environmental,socio-cultural and experiential benefits and impacts of tourism activity (McArthur, 1997). Foreach component (economic, marketing, environmental, socio-cultural and experiential), themodel defines:■ optimal conditions;
■ indicators of those conditions;

Economic and Social Indicators: Southern CRA Region March 2000
6
■ an acceptable range for each indicator;
■ a monitoring method and details for each indicator;
■ areas of responsibility; and
■ a timeframe for the collection and review of the data.
The model also proposes a process for action if the indicator data falls outside the acceptablerange. This involves exploring cause-and-effect relationships, identifying indicator resultsrequiring responses from land management agencies, the tourism industry, local government orelsewhere, identifying indicator results that were out of anyone’s control and, where necessaryand appropriate, developing options for action and improvement and revising targets andagreements.
In summary, the following questions provide a useful guide for determining the relevance andappropriateness of performance indicators:
■ will the selected indicator lead to the collection of appropriate, valid and reliable data?
■ is the raw data able to be collected, analysed and interpreted at an appropriate scale?
■ is the indicator feasible in terms of the time, costs and expertise required for data collectionand reporting?
■ are the indicators able to be used for decision-making?
■ will the indicators be readily understood by broad audiences?
■ is a target or acceptable range able to be established for each indicator?
■ does the indicator measure enduring features that can be compared across time?
■ are they able to be used for benchmarking?
■ does the use of the performance indicator lead to an over-emphasis on 'getting the rightfigures' at the risk of a negative impact on overall performance? (Oakes, 1986 as cited inWyatt, 1994 and Treasury and Finance, 1996).
2.3 THE MONTREAL PROCESS
Considerable work has already been undertaken at a national and international level on thedevelopment of performance indicators relating to forest management. In September 1993,Canada convened an International Seminar of Experts on Sustainable Development of Borealand Temperate Forests. This seminar focussed specifically on the development of criteria andindicators (C&I) for the conservation and sustainable management of forests and began what isnow called the Montreal Process.
This initiative led to the formation of the Montreal Process Working Group, with representativesfrom twelve countries including Australia. The Montreal Process Working Group wasestablished with the specific purpose of developing and implementing internationally agreedcriteria and indicators. At the sixth meeting of the Group in Santiago, Chile, in February 1995,the member countries endorsed a statement of political commitment known as the "SantiagoDeclaration", including a comprehensive framework of seven criteria and 67 indicators.
The seven criteria describe the broad forest values that society seeks to maintain, while theindicators provide measures of change in these criteria over time. The criteria agreed by theMontreal Process are:

March 2000 Economic and Social Indicators: Southern CRA Region
7
Criterion 1 Conservation of biological diversity
Criterion 2 Maintenance of productive capacity of forest ecosystems
Criterion 3 Maintenance of ecosystem health and vitality
Criterion 4 Conservation and maintenance of soil and water resources
Criterion 5 Maintenance of forest contribution to global carbon cycles
Criterion 6 Maintenance and enhancement of long term multiple socio-economic benefits tomeet the needs of societies
Criterion 7 Legal, institutional and economic framework for forest conservation andsustainable management
It is Criterion 6 that contains indicators relevant to this study. Table 2a lists these indicators.
TABLE 2A CRITERION 6 – MONTREAL PROCESS WORKING GROUP SOCIO-ECONOMICINDICATORS
6.1 Production and Consumption6.1a Value and volume of wood and wood products production, including value added through downstream processing;6.1b Value and quantities of production of non-wood forest products;6.1c Supply and consumption of wood and wood products, including consumption per capita;6.1d Value of wood and non-wood products production as percentage of GDP;6.1e Degree of recycling of forest products; and6.1f Supply and consumption/use of non-wood products.
6.2 Recreation and Tourism6.2a Area and per cent of forest land available for general recreation and tourism;6.2b Number, range and use of recreation/tourism activities available in a given region; and6.2c Number of visits per annum.
6.3 Investment in the Forest Sector6.3a Value of Investment, including investment in forest growing, forest health and management, planted forests, wood processing, recreation and tourism;6.3b Level of expenditure on research and development, and education;6.3c Extension and use of new and improved technologies; and6.3d Rates of Return on Investment.
6.4 Cultural, Social and Spiritual Needs and Values6.4a Area and percent of forest land managed in relation to the total area of forest land to protect the range of cultural, social and spiritual needs and values; and6.4b Non-consumptive use forest values.
6.5 Employment and Community Needs6.5a Direct and indirect employment in the forest sector and forest sector employment as a proportion of total employment;6.5b Average wage rates and injury rates in major employment categories within the forest sector;6.5c Viability and adaptability to changing economic conditions, of forest dependent communities, including Indigenous communities; and6.5d Area and percent of forest land used for subsistence purposes.
Source: Montreal Process Working Group
The first report by countries against these indicators, the First Approximation Report, waspresented at the Eleventh World Forestry Congress in Antalya, Turkey in October 1997.
In July 1996 the Ministerial Council on Forestry, Fisheries and Aquaculture agreed to endorsethe use of the Montreal Process criterion and indicators in the Regional Forest Agreement(RFA) process. It was agreed that a framework of regional indicators based on the MontrealProcess indicators be developed for use in the RFA process.

Economic and Social Indicators: Southern CRA Region March 2000
8
The Montreal Process Implementation Group for Australia (MIG), a Commonwealth-State bodychaired by Agriculture, Fisheries, Forestry – Australia (AFFA) (formerly the Department ofPrimary Industries and Energy), was given prime responsibility for coordinating progress ondomestic implementation of the international criteria and indicators and developing theframework of regional indicators. The MIG process included two major stakeholder meetings, aseries of seminars, expert workshops and a public comment period and resulted in the documentA framework of regional (sub-national) level criteria and indicators of sustainable forestmanagement in Australia. The framework of regional indicators was released in August 1998.Principles recognised in the development and implementation of the indicators include: theprecautionary principle, inter-generational equity, public participation, transparency and accessto information, international good citizenship, user pays, and industry and regionaldevelopment.
The regional framework provides regions with a guideline for a phased approach to theimplementation of sustainability indicators. It also provides for the collection of information at ascale which can be aggregated to a national level in a transparent and credible way, for reportingagainst the Montreal Process criteria and indicators. However, while many of the indicators canbe readily measured, others require further research, development, refinement and improvement.
The regional framework also recognises:
‘that in implementing the indicators at a regional level there is a need to develop objectives,targets and standards in accordance with management requirements and objectives againstwhich trends in indicators can be measured’ and
‘for each region, in accordance with RFA processes (where appropriate) and in consultationwith stakeholders, it will be necessary to address each criterion and utilise a common sub-set ofindicators for reporting, and to select additional indicators appropriate to management intent.Modification of some indicators may be necessary to address regional issues, match Statelegislative requirements etc. It will also be necessary to determine an appropriate timeframe formeasuring and reporting, and negotiate responsibilities for collection of, and reporting on,data. This will be a fundamental factor in determining the cost of the arrangements.’(Commonwealth of Australia, 1998)
2.4 INDICATORS FROM THE REGIONAL FRAMEWORK
Under the regional framework, the Montreal indicators were modified for regional applicationin six sub-sections, being:
■ 6.1 Production and consumption;
■ 6.2 Recreation and tourism;
■ 6.3 Investment in the forest sector;
■ 6.4 Cultural, social and spiritual needs and values;
■ 6.5 Employment and community needs; and
■ 6.6 Indigenous participation and management.
Within each sub-section, a series of indicators were developed. The regional frameworkclassified indicators as either Category A, B or C, or other (deemed to not have a high priorityfor implementation). Category A indicators can be reported against immediately, Category Bindicators can be measured, but methodological or resourcing issues need resolution prior to

March 2000 Economic and Social Indicators: Southern CRA Region
9
their measurement and Category C are those indicators where significant research anddevelopment is required prior to implementation. The focus of this assessment is Category Aand B indicators.
Table 2c details the classifications for the criterion six indicators, as specified in the regionalframework.

March 2000 Economic and Social Criteria and Indicators: Southern CRA Region
10
TABLE 2C REGIONAL FRAMEWORK – INDICATORS AND CATEGORIESFRAMEWORK INDICATORS Cat. A Cat. B Cat. C Other6.1 Production and Consumption
6.1a Value and volume of wood and wood products production, including value added through downstream processing6.1b Value and quantities of production of non-wood forest products6.1c Supply and consumption of wood and wood products, including consumption per capita6.1d Value of wood and non-wood products production as percentage of regional value of production6.1e Degree of recycling of forest products6.1f Supply and consumption/use of non-wood products
6.2 Recreation and Tourism6.2a Area and percent of forest land available for general recreation and tourism6.2b Number, range and use of recreation/tourism activities available in a given region6.2c Number of visits per annum6.2d Proportion of forest sites available for recreation and tourism which are impacted unacceptable by visitors
6.3 Investment in the Forest Sector6.3a Value of Investment, including investment in forest growing, forest health and management, planted forests, woodprocessing, recreation and tourism6.3b Level of expenditure on research and development, and education6.3c Extension and use of new and improved technologies6.3d Rates of Return on Investment
6.4 Cultural, Social and Spiritual Needs and Values6.4a (i) Area and percent of forest land in defined tenures, management regimes and zonings which are formallymanaged in a manner which protect Indigenous peoples’ cultural, social, religious and spiritual values, including non-consumptive appreciation of the country6.4a (ii) Proportion of places of non-Indigenous cultural value in forests formally managed to protect those values6.4b Non-consumptive use forest values
6.5 Employment and Community Needs6.5a Direct and indirect employment in the forest sector and forest sector employment as a proportion of totalemployment6.5b Average wage rates and injury rates in major employment categories within the forest sector6.5c (i) Viability and adaptability to changing social and economic conditions of forest dependent communities6.5c (ii) Viability and adaptability of forest dependent Indigenous communities6.5d Area of land available and accessible for Indigenous people to exercise their inherent rights to meet subsistenceor individual and family cultural and spiritual needs
6.6 Indigenous Participation and Management6.6a Extent to which the management framework maintains and enhances Indigenous values including customary,traditional and native title use by Indigenous peoples and for Indigenous participation in forest management
Source: A Framework of Regional (sub-national) Level Criteria and Indicators of Sustainable Forest Management in Australia, 1998

March 2000 Economic and Social Criteria and Indicators: Southern CRA Region
11
The regional framework has identified the following indicators as being Category A and B:
Category A
■ 6.2c Number of visits per annum
■ 6.5a Direct and indirect employment in the forest sector and forest sector employment as aproportion of total employment (direct)
Category B
■ 6.1a Value and volume of wood and wood products production, including value addedthrough downstream processing
■ 6.3a Value of investment, including investment in forest growing, forest health andmanagement, planted forests, wood processing, recreation and tourism
■ 6.4a (i) Area and percent of forest land in defined tenures, management regimes and zoningswhich are formally managed in a manner which protect Indigenous peoples’ cultural, social,religious and spiritual values, including non-consumptive appreciation of the country
■ 6.4a (ii) Proportion of places of non-Indigenous cultural value in forests formally managedto protect those values.
■ 6.5a Direct and indirect employment in the forest sector and forest sector employment as aproportion of total employment (indirect)
■ 6.6a Extent to which the management framework maintains and enhances Indigenous valuesincluding customary, traditional and native title use by Indigenous peoples and forIndigenous participation in forest management.
2.5 SUMMARY AND CONCLUSIONS
This section has provided an overview of the purpose and characteristics of performanceindicators. The desirable characteristics and attributes of indicators were discussed in order toprovide a generic guide for determining the relevance and appropriateness of performanceindicators. The development of indicators under the Montreal Process was examined, with aparticular focus on relevant socio-economic indicators. A discussion was also provided of thedevelopment of indicators under the regional framework. It is these indicators that are the focusof the present study.
Using this understanding of indicators, the following section examines identified data sourcesthat are available to assist in the development and ongoing monitoring of relevant regionalbased economic and social indicators. Each sub-section of the regional framework is examinedseparately.
The regional framework classified a number of the Criterion 6 indicators in Categories A and B.This report built on the framework recommendations in locating data sources for all potentialCategory A and B indicators. Thus, in some instances framework Category B and C indicatorshave been identified as either Category A or B indicators.

Economic and Social Indicators: Southern CRA Region March 2000
12
3. DATA SOURCES
3.1 INTRODUCTION
This section details the data identification process, the primary aim of which is to aid in thedevelopment of Category A and B indicators. However, the data search was not restricted tofinding data that was only applicable to those indicators identified under the regional frameworkas either Category A or B. Rather, the approach adopted sought to identify what data isavailable for the development of all of the indicators in Criterion 6. In this way, opportunitiesfor indicators to move from being Category C to either B or A were identified. The format,frequency of collection and associated costs of using these data sources for annual ESFMreporting requirements were also examined.
3.2 LITERATURE REVIEW
Comprehensive Regional Assessments have been, or are currently being undertaken for theUpper North East, Lower North East, Eden and Southern regions. The following reportscontributed to these assessments and were reviewed as part of this assessment:
■ A Framework of Regional (sub-national) Level Criteria and Indicators of Sustainable ForestManagement in Australia, 1998;
■ Regional Impact Assessment, UNE CRA Region, 1999;
■ A Report on Forest Wood Resources for the UNE/LNE CRA Regions, 1999;
■ Social Assessment Report, Southern CRA, 2000;
■ Forest Based Industries Development Opportunities, 1999;
■ Tourism and Recreation Study, Southern CRA, 1999;
■ Regional Report of Upper North New South Wales, Socio-economic attributes, 1996;
■ Regional Economic Impact Assessment for the Tumut RFA Sub-Division, 1999;
■ Regional Economic Impact Assessment for the Southern RFA Region, 1999; and
■ Sawmill Survey Southern Region CRA, 1999.

March 2000 Economic and Social Indicators: Southern CRA Region
13
3.3 APPROPRIATE DATA SOURCES
The following section outlines the appropriate sources of data that are available to assist in thedevelopment of relevant regional economic and social indicators to enable monitoring and assistin the assessment of outcomes of forest management processes. Appropriate data sources foreach of the six sub-sections developed under the regional framework are discussed in turn.
3.3.1 Production and Consumption
The indicators in the production and consumption sub-section of the regional framework coverthe supply-side and demand-side issues associated with wood and non-wood production.Potential data sources identified include:
State Forests of NSW
State Forests of NSW primarily collect information on their operations, rather than informationon the operations of private operators. In particular, information pertaining to the value andvolume/quantity of wood and non-wood products is collected on a regional basis. The valueinformation is based on the royalty associated with the products: these royalties are collated forannual production of both wood and non-wood products, by product category, i.e. hardwood,softwood, apiary and various sub-categories. Being collected on a regional basis, thisinformation can be readily aggregated to the RFA level.
The regional offices of State Forests of NSW also collect information on the returns of thevarious sawmill operations in their respective regions. Under their licensing requirements, StateForests of NSW also collects information on the volume of wood production by private forestoperators. There is, however, no data validation process undertaken for this information, so theaccuracy of this information may be questionable.
Information collected by State Forests of NSW is collected annually and is provided free ofcharge. State Forests of NSW would be an appropriate information source for volume and valueof wood and non-wood products information.
Australian Bureau of Agricultural and Resource Economics
In 1997 the Australian Bureau of Agricultural and Resource Economics (ABARE) conducted asurvey of hardwood sawmills utilising crown resources in the Southern CRA / RFA region.Mills were also revisited in 1999 to up-date data previously collected.
Surveys were used as the primary instrument to inform modelling work undertaken by ABAREas part of the economic impact assessment work associated with the RFA process for theSouthern region. Information collected was utilised in building the FORUM model, which wasused to assist in predicting potential economic impacts associated with land tenure changes.
ABARE collected information on volume of product, costs of production and unit prices ofoutputs for the sawmills surveyed. To ensure the confidentiality of data collected is maintained,ABARE have only publicly released information relating to wood product volumes.
It would be costly to resurvey the sawmill operators on an annual basis and it is unlikely that theFORUM model will be up-dated on a regular basis. Due to original confidentiality restrictions

Economic and Social Indicators: Southern CRA Region March 2000
14
associated with the collection of data, it is also uncertain whether this information would beuseful for monitoring purposes.
Forest Products Association (FPA)
In 1997/98 the FPA undertook surveys of a number of the sawmills in the Southern RFA region.These surveys were undertaken to inform the FPA of the current state of the region’s timberindustry and to assist in the broader CRA process. The FPA collected information on volume ofproduct, costs of production and unit prices of outputs for the sawmills surveyed. Although theFPA has not publicly released the information collected during its survey work, this informationcontributed to the CRA process, via its use under strict confidentiality provisos, in a number ofSouthern region CRA assessment projects.
On this basis, the Centre for Regional Economics (CARE) and Gillespie Economics utilised theFPA results, in conjunction with a number of other sources of information and utilising specificwood volume and tenure information, to develop a series of models that assessed the potentialdirect and regional economic impacts associated with a change in land tenure as a result of theRFA decision. The impacts are presented in terms of level of employment, value of grossoutput, income and value added. The model would not be a good predictor of direct andregional economic impacts over time, as detailed below.
It would be costly to resurvey the sawmill operators on an annual basis, however, without thesurvey it is not possible to employ input-output analysis to determine regional economicimpacts associated with changes to the forestry sector, as the royalty information only details asmall proportion of total forest sector revenue. Royalties are not appropriate measures of totalsector revenue as they fail to identify production, particularly value added production. Thesurvey measures both State Forests of NSW and private forest production without this the valueand volume information collected is limited to State Forests of NSW operations.
Potentially, the survey could be conducted very five years to update model calibration, however,whenever there is significant structural change in the industry the survey will need to berevisited, i.e. following the RFA decision.
Australian Bureau of Statistics (ABS)
Between 1976-77 and 1996-97 the ABS undertook annual surveys of agricultural commoditiesthat were collated in their AgStats database. AgStats detailed the value of production of thevarious agricultural sectors. Unfortunately, post 1996-97 the ABS has decided to revise thisinformation every five years, in the Agricultural Commodity Survey, and furthermore thissurvey no longer collects information on the value of production.
Therefore, the AgStats database could be employed to develop a baseline for the value ofproduction. However, data can no longer be obtained from AgStats on the value of productionin future years. Furthermore, even if the ABS continued to collect value of productioninformation the five yearly collection frequency would cause a significant time lag inresponding to any changes.
3.3.2 Recreation and Tourism
The indicators in the recreation and tourism sub-section of the regional framework cover suchissues as: area of recreational land; number of visitors; types of use; and visitor impact. Potentialdata sources identified include:

March 2000 Economic and Social Indicators: Southern CRA Region
15
NSW National Parks and Wildlife Service
The district offices of the NSW NPWS collect information on the level of visitation for anumber of individual national parks. These and other estimates were collated for the SouthernCRA Tourism and Recreation Study. This information could be collected in future years and isprovided free of charge.
The NSW NPWS advise that visitation numbers, particularly for some of the smaller parks maysometimes be estimates and not actual values.
The NSW NPWS Act 1974 requires that a plan of management be prepared for each nationalpark. This document outlines how the park will be managed in the years ahead. Themanagement plan details the location of the national park and provides details on any restrictedareas within the park, where visitation may not occur. An area may be classified as beingrestricted because it has: difficult access; been set aside for research and education; endangeredflora and fauna, etc. However, it is difficult to provide a precise estimate of the exact area orproportion of total park area that is available for tourism and recreation purposes.
The NSW NPWS has undertaken surveys of a number of its parks to gauge the activitiesundertaken by visitors in national parks. However, these surveys are not commissioned on arepeat basis, rather they tend to be one-off evaluations that contribute to the development offacilities in individual parks. Therefore, the information in these surveys can be employed togain an understanding of the recreational uses for national parks, but the information is notnecessarily region specific, or prepared on a regular, repeat basis because of the cost ofsurveying.
NSW NPWS is currently developing better techniques for the collation of data within the CRAregions that should facilitate the collection of information on visitation, and recreation andtourism uses for national parks estate. Visitation information is provided free of charge.
State Forests of NSW
The district personnel of State Forests of NSW can provide estimates of total visitation to StateForests of NSW (similar to National Parks estimates). However, their information is lesscomprehensive than that provided for National Parks estate, with visitation for some smallerState forests being estimated using visitation to other State forests (that have similar size,location, facilities, attributes, access, etc,) as a proxy. The information is currently collated on aregion by region basis, therefore mechanisms need to be established to centralise the collation ofcollected data. Furthermore, formal collection techniques need to be established for variousparts to improve the validity of the data, ie reduce estimation.
As with National Parks estate, it is difficult to develop a precise estimate of the area and percentof forest land that is available for recreation and tourism. The First Approximation Report forthe Montreal Process states that, “in principle, all public forested lands except scientificreserves, cultural areas or where operations preclude it, are available for general recreationand tourism.” This report estimates that Australia-wide, 79% of State Forest land is accessiblefor recreation purposes (Montreal Process Working Group, 1999).
State Forests of NSW are currently developing better techniques for the collation of informationwithin the CRA regions that should facilitate the collection of information on visitation, andrecreation and tourism uses for State Forest land. Visitation information provided by StateForests of NSW is free of charge.
Economic and Social Indicators: Southern CRA Region March 2000
16
Tourism NSW
Tourism NSW collects and collates a significant amount of information on domestic andinternational tourism to and within New South Wales, including volume of tourism (visits andvisitor nights), origin of visits, purpose of visit, transport used, seasonality impacts,accommodation used and expenditure.
Tourism NSW can provide information on international and domestic tourism within thedistinct tourism regions of New South Wales. Tourism regions that are located within theSouthern CRA region are:
■ South Coast
■ Illawarra
■ Blue Mountains/Hawkesbury
■ Snowy Mountains
■ Southern Tablelands
■ Murray
■ Riverina
■ Central West
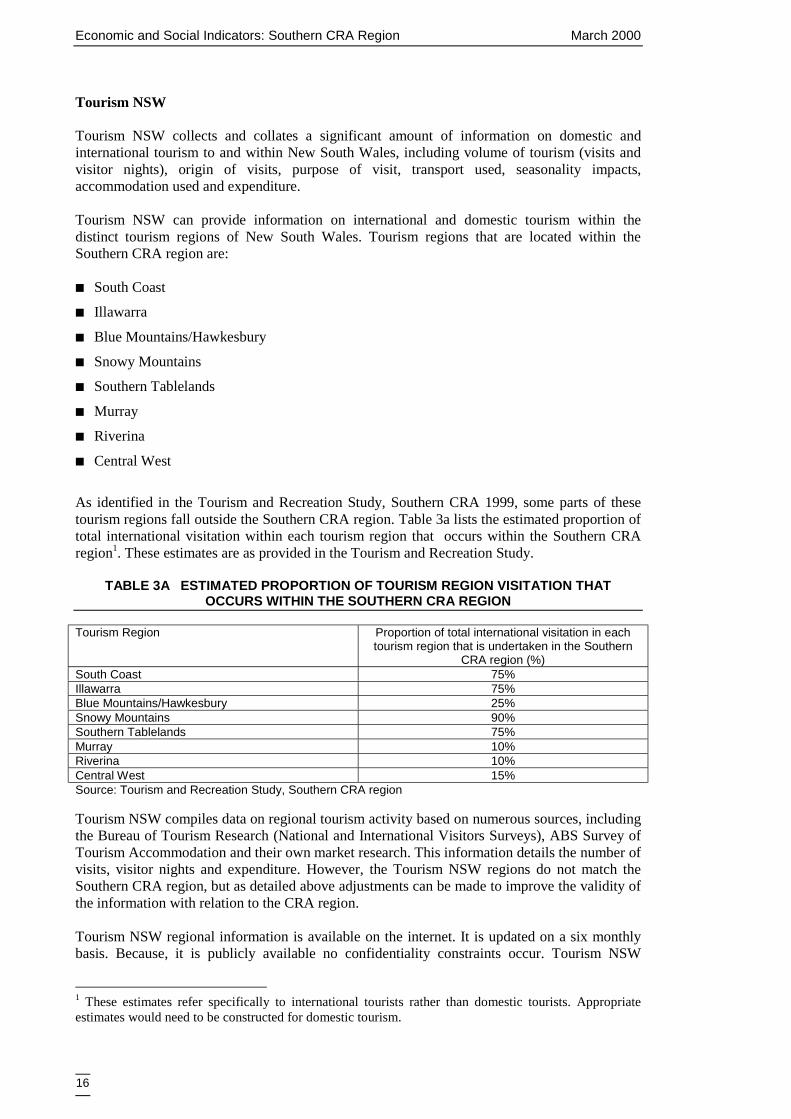
As identified in the Tourism and Recreation Study, Southern CRA 1999, some parts of thesetourism regions fall outside the Southern CRA region. Table 3a lists the estimated proportion oftotal international visitation within each tourism region that occurs within the Southern CRAregion1. These estimates are as provided in the Tourism and Recreation Study.
TABLE 3A ESTIMATED PROPORTION OF TOURISM REGION VISITATION THATOCCURS WITHIN THE SOUTHERN CRA REGION
Tourism Region Proportion of total international visitation in eachtourism region that is undertaken in the Southern
CRA region (%)South Coast 75%Illawarra 75%Blue Mountains/Hawkesbury 25%Snowy Mountains 90%Southern Tablelands 75%Murray 10%Riverina 10%Central West 15%Source: Tourism and Recreation Study, Southern CRA region
Tourism NSW compiles data on regional tourism activity based on numerous sources, includingthe Bureau of Tourism Research (National and International Visitors Surveys), ABS Survey ofTourism Accommodation and their own market research. This information details the number ofvisits, visitor nights and expenditure. However, the Tourism NSW regions do not match theSouthern CRA region, but as detailed above adjustments can be made to improve the validity ofthe information with relation to the CRA region.
Tourism NSW regional information is available on the internet. It is updated on a six monthlybasis. Because, it is publicly available no confidentiality constraints occur. Tourism NSW
1 These estimates refer specifically to international tourists rather than domestic tourists. Appropriateestimates would need to be constructed for domestic tourism.

March 2000 Economic and Social Indicators: Southern CRA Region
17
advise that where more detailed information is required a fee for service applies, it is notenvisaged that additional information is required.
Bureau of Tourism Research
The two major sources of information produced by the Bureau of Tourism Research (BTR) arethe:
■ National Visitor Survey (NVS); and
■ International Visitor Survey (IVS).
The National Visitor Survey provides a profile on the domestic traveller – where they go, whatreasons they have for travelling, what transport and accommodation they use, what they dowhile travelling and the expenditure associated with their trips (Bureau of Tourism Research,1999). The NVS is produced annually and the information contained within is widely available.The inception of the NVS was January 1998: it superseded the Domestic Tourism Monitor.
The International Visitor Survey is designed to provide a profile of the characteristics, travelbehaviour and expenditure of international tourists in Australia. The survey was first conductedin 1969 and then intermittently throughout the 1970s. A survey has been conducted every yearsince 1981, with the exceptions of 1982 and 1987 (Bureau of Tourism Research, 1998). Themain results of the IVS are published on a quarterly basis by the BTR, and the data is readilyaccessible.
In addition to producing the NVS and IVS, the BTR also evaluates the contribution of tourismto the national economy, produces analytical studies examining tourism niche markets andopportunities and provide forecasts and technical advice to the Tourism Forecasting Council.
Like Tourism NSW general tourism information is available free of charge on the internet,however, more specific data searches are undertaken on a fee for service basis.
As Tourism NSW incorporates NVS and IVS survey results in their regional tourism statistics itis not necessary to individually source information from the BTR.
Tourism Forecasting Council
The Tourism Forecasting Council develops international and domestic tourism forecasts forAustralia. These forecasts are made using single equation models currently in use, although byMay 2000, the Council is aiming for the simultaneous release of inbound, domestic andoutbound long-term forecasts. Given the focus of the Tourism Forecasting Council onforecasting future trends in key tourism parameters, this data source is not particularly relevantwithin this study.
Tourism and Recreation Study, Southern CRA 1999
Hassall and Associates as part of the Tourism and Recreation Study for the Southern CRAundertook a commercial tourism and recreation industry survey. There is no plan to reproducethis survey in future years to assess changes to the commercial tourism and recreation industry.
3.3.3 Investment in the Forest Sector
Indicators in the investment in the forest sub-section of the regional framework cover suchissues as: value of investment; research and development expenditure; new and improvedtechnologies; and rates of return on investment. Potential data sources identified include:
Economic and Social Indicators: Southern CRA Region March 2000
18
Forest Based Industries Development Opportunities, Southern CRA 1999
There is limited information available on investment in the Forest Sector. The Forest BasedIndustries Development Opportunities, Southern CRA 1999 report detailed a number ofinvestments that were either already committed to the region, or which will be committed to theregion in future years.
The primary source of this information was the Southern Regional Forest Forum workshop.This workshop/forum included forestry stakeholders from the Southern CRA region.Prospective forest based industry opportunities identified during this workshop were:
1. Extended Timber Resources2. Extended Timber Processing3. New Uses of Timber and Residues4. Non-Timber Forest Produce5. Aboriginal and Heritage – tourism and education6. Forest Based Recreation7. Forest Industry Infrastructure
In addition, the study also detailed the potential business developments based on investmentscale categories:
■ key investment (>$5 million);
■ commercial loan ($1 - $5 million);
■ private loan ($100,000 to $1 million); and
■ cash or grant (<$100,000).
Finally, the study makes mention of the various opportunities and constraints associated withthe different investment options.
Beyond local information there is no point source for information on investment in the region.Therefore, in order for this information to be identified, an annual forum of key stakeholderswould need to be convened to identify any changes in investment.
The cost of convening the workshop on an annual basis would be quite significant, rendering itinappropriate. However, it might be more appropriate to convene a workshop every few years toupdate any progress in investment details.
The Department of Urban Affairs and Planning (DUAP) and Local Councils
The Department of Urban Affairs and Planning collects information on all major projectdevelopments, particularly those which require Environmental Impact Statements. Otherwise,all developments require a development approval (DA) from the local council, so any newinvestment in the region could be identified either through the Department of Urban Affairs andPlanning, or through the local councils. Unfortunately, we have not identified a point sourcewhere all of this information is available, so significant research would be required to identifynew investment in the Southern CRA region. The cost associated with researching andcollecting this information would not be insignificant. The only other possibility would be todevelop a central point of collation where all local and State government developmentinformation is collected and collated.

March 2000 Economic and Social Indicators: Southern CRA Region
19
NSW National Parks and Wildlife Service and State Forests of NSW
Both of these organisations record their capital and recurrent expenditures, but thedisaggregation of their capital and recurrent expenditure according to their different activities isdifficult to identify. NSW NPWS does identify employee time spent on various tasks. However,it is more difficult to determine what portion of capital expenditure (eg a building or vehicle) isdedicated to tourism, conservation, management, etc tasks.
The outcome of the RFA process will impact on investment, ie if State Forests of NSW landchanges tenure to become National Parks estate this will likely change the investment profile,priorities and the quantum of investment.
Were this information available at a disaggregated level it would provide an indication of theinvestment objectives of these agencies.
State Forests of NSW have also indicated that investment is a function of the stage ofdevelopment of a park with new parks having a higher investment demand and mature parksneeding less investment. This also applies to National Parks estate, as newly acquired parksrequire significant infrastructure expenditure, whereas older parks already have necessaryinfrastructure.
Further investigation of these data sources for the measurement of investment is necessary.
3.3.4 Cultural, Social and Spiritual Needs and Values
NSW NPWS and State Forests of NSW are required under Section 170 of their Acts to maintaina heritage register for all sites that are located within their land. Therefore, the NSW NPWS, theNSW Heritage Office and State Forests of NSW each have registers of the Indigenous siteswithin their boundaries.
NSW National Parks and Wildlife Service
The NSW NPWS consults regularly with Aboriginal communities to ensure that as manyAboriginal sites as possible are preserved. Sections 86, 90 & 91 of the NSW National Parks andWildlife Act, 1974, provide for the protection and preservation of all Aboriginal relics andplaces throughout New South Wales. The NSW NPWS is also responsible for the maintenanceof all recorded Aboriginal Sites in New South Wales. To this end the NSW NPWS maintainsthe ‘Aboriginal Sites Register’, which is a geographical information system (GIS) of all the sitesin New South Wales. The GIS system is able to identify the area of forest estate (National Parksand State forests) that is currently identified as containing aboriginal heritage. The informationin the register is updated every three months to include any newly identified sites, or to updateinformation on existing sites.
The only constraint is that NSW NPWS is not the custodian of the information, it is simply thecollator of the information. For information to be made publicly accessible, approval needs to beobtained from Local Aboriginal Land Councils. This process can only be bypassed by aministerial direction.
NSW NPWS have indicated that the extraction of information from the Aboriginal SitesRegister would cost between $1,000 and $2,500. This does not include the cost associated withobtaining Land Council approval.
Following the National Parks and Wildlife Amendment (Aboriginal Ownership) Act 1996provision was made for the return of a number of National Park’s estates of special cultural

Economic and Social Indicators: Southern CRA Region March 2000
20
significance to their traditional Aboriginal owners. Co-management structures are beingnegotiated for estates that are to be returned, this will enhance the preservation of Indigenousvalues.
NSW Heritage Office
The NSW Heritage Office has a database, “State Heritage Inventory”, of all the heritage sitesthat are located throughout NSW, at LGA level. The State Heritage Inventory (SHI) is anelectronic database of over 17 500 statutory listed heritage items in New South Wales protectedby heritage schedules to local environmental plans (LEPs), regional environmental plans (REPs)or by the State Heritage Register.
Most items currently in the Inventory are historic buildings, but the SHI also includes:
■ historical archaeological sites;
■ maritime archaeological sites;
■ industrial sites;
■ urban landscapes, parks and gardens, and building surrounds;
■ private and civic buildings;
■ heritage items owned by State government agencies;
■ natural heritage: protected natural areas such as forests, wetlands and mountains, which mayinclude rare or endangered native birds, plants and animals;
■ Movable heritage: industrial machinery, transport vehicles, furniture, art and items that arepart of heritage collections; and
■ Aboriginal heritage - reflecting the rich legacy of the first Australians and their importantplace in the State’s history (also refer to the Aboriginal Sites Register maintained by theNSW NPWS).
The State Heritage Register locations are updated weekly, whereas the information on LEPsand REPs is updated every couple of months. The information on this database is independentof the information collected by the NSW NPWS and by State Forests of NSW, although theremay be some minor overlap.
The information in this database can be web accessed, at no fee. However, it is not possible tosort by Indigenous or non-Indigenous categories and it is also not possible to identify those sitesthat are located within forest areas. The separate identification of Indigenous and non-Indigenous heritage listings within forest areas currently would have to be manually processed.
The NSW Heritage SHI is particularly relevant to the identification of formally protected non-Indigenous sites. Whereas the NSW NPWS Aboriginal Sites Register is more appropriate forthe identification of formally protected Indigenous sites. Because, all Indigenous sites areprotected by law, whereas non-Indigenous sites require a heritage listing before they areprotected.
State Forests of NSW
The NSW NPWS is responsible for maintaining all Indigenous sites in NSW. However, StateForests of NSW are also implementing processes for the management of forests or parts offorests where local Aboriginal communities share responsibilities for cultural heritage. The firstsuch agreement is currently being negotiated in the Eden region.

March 2000 Economic and Social Indicators: Southern CRA Region
21
Furthermore, in order to assist in the preservation of sites State Forests of NSW have a databaseof all identified Indigenous sites on their estate.
All Indigenous sites on State Forests of NSW tenure are recorded in the NSW NPWS‘Aboriginal Sites Register’. Therefore, the NSW NPWS is a more appropriate point source forinformation on Indigenous heritage sites.
3.3.5 Employment and Community Needs
The indicators in the employment and community needs sub-section of the regional frameworkconsider such issues as: employment; injury and wage rates; viability and adaptability; area ofland available; and accessibility for Indigenous peoples. Potential data sources identifiedinclude:
Australian Bureau of Statistics (ABS)
The ABS maintains the Australian Business Register. The Australian Business Register is adatabase of all businesses in Australia employing wage and salary earners. It excludesbusinesses which do not employ any staff. The register records:
■ Main economic activity;
■ Geographic location; and
■ Employment size.
The information in the register is updated continuously, with most new businesses beingincluded in the register within one to six months of commencing employment of staff. The ABSalso advises that there is currently no source available to identify when businesses cease.
For the Southern CRA region it would cost between $340 and $410 (for each data extraction) toobtain the information from the ABS. The more expensive option provides a more detailedemployment breakdown.
The ABS also conducts a Census of Australian households every five years. Informationrelevant to employment and community needs is collected in the Census, including labour forcedetails and wage rates. The information from the Census can also be disaggregated for theSouthern CRA region. Whereas the Australian Business Register provides information from theemployers’ perspective, the census captures the employees’ perspective.
The ABS also collects information on wage rates as a supplement to the Labour Force survey.This supplementary survey takes place in August of each year. It is an employee only surveythat collects information on employee earnings and benefits. The results of the survey are thenweighted according to information from other ABS survey, including the Census, to calculateearnings. This earnings information can be disaggregated for the forestry sector by employmentcategory.
Employee earnings information is available on an annual basis in February. The cost associatedwith a special data request is around $200.

Economic and Social Indicators: Southern CRA Region March 2000
22
Forest Products Association
As discussed earlier (see Section 3.3.1), the Centre for Agricultural and Resource Economics(CARE) and Gillespie Economics utilised the FPA results, in conjunction with a number ofother sources of information and utilised specific wood volume and tenure information, todevelop a series of models that assessed the potential direct and regional economic impactsassociated with a change in land tenure as a results of potential RFA decisions. The impacts arepresented in terms of level of employment, value of gross output, income and value added.
As these models predict the potential changes resulting from a change in land tenure in the shortterm and as these models are based on survey results at one point in time, the use of thesemodels for monitoring purposes is limited. To overcome this, annual surveys would need to beundertaken. At present, such work is not scheduled
It would be costly to resurvey the sawmill operators on an annual basis, however, without thesurvey it is not possible to employ input-output analysis to determine regional economicimpacts associated with changes to the forestry sector, as the royalty information only details asmall proportion of total forest sector revenue. Royalties are not appropriate measures of totalsector revenue as they fail to identify production, particularly value added production. Thesurvey measures both State forest and private forest production without this the value andvolume information collected is limited to State Forests of NSW operations.
Potentially, the survey could be conducted very five years to update model calibration, however,whenever there is significant structural change in the industry the survey will need to berevisited, ie following the RFA decision.
WorkCover NSW
WorkCover collects injury claim statistics for all New South Wales. This information can beaggregated from post code data for the Southern CRA region. The injury claims can beidentified either at a more aggregated level for the forestry and logging sector or at a moredisaggregated level for forestry, logging and services to forestry sub-sectors. However, it ispossible that there may be confidentiality constraints associated with the information beingdisaggregated for forestry, logging and service sub-sectors. Also, the data can be identifiedunder different employment categories. Confidentiality constraints occur when less than fourrecords are available within each sub-sector.
WorkCover has quoted that injury information would cost $150 for extracting by employmentcategory, in the forestry sector for the Southern CRA region.
3.3.6 Indigenous Participation and Management
The indicator in the Indigenous Participation and Management sub-section of the regionalframework considers the extent of management framework which maintains and enhancesIndigenous values. Potential data sources identified include:
State Forests of NSW
All identified Indigenous sites are automatically protected by law. State Forests of NSW is alsoimplementing processes for the management of forests or parts of forests where localIndigenous communities share responsibility for the management of cultural heritage. This iscurrently occurring on a location by location basis and details can be provided by State Forestsof NSW offices on the status of agreements.

March 2000 Economic and Social Indicators: Southern CRA Region
23
Co-management agreements represents the highest level of Indigenous participation on DataForest tenure. They assist in the maintenance and enhancement of Indigenous values. The firstco-management agreement is currently being negotiated in the Eden region, which is outside ofthe Southern CRA region.
The details of co-management agreements may be subject to confidentiality restrictions withlocal land council approval being required for any information release.
NSW National Parks and Wildlife Service
Following the National Parks and Wildlife Amendment (Aboriginal Ownership) Act 1996provision was made for the return of a number of National Parks estates of special culturalsignificance to their traditional Aboriginal owners. Following return of these parks, they wouldbe managed by Aboriginal peoples in partnership with the Service and provision was also madefor the return of cultural property and ancestral remains to the rightful Aboriginal owners.
This co-management process signifies an enhancement of Indigenous values. The establishmentof co-management agreements will assist in the maintenance and enhancement of Indigenousvalues.
3.4 SUMMARY AND CONCLUSIONS
Numerous data sources have been identified under each of the sub-sections of the regionalframework. These identified sources provide the foundation for economic and social indicatorsto be developed to assist in the monitoring and assessment of forest management in achievingecologically sustainable forest management.
Based on this discussion, the following section outlines the indicators that can either beclassified as Category A or B indicators within the Southern CRA region.
Economic and Social Indicators: Southern CRA Region March 2000
24
4. INDICATORS
In this section, a list of indicators that can either be immediately quantified (Category A), orindicators that require further methodological or resourcing development (Category B) aredetailed. These indicators are developed in line with the requirement set forth in the study brief,namely they:
■ encompass both economic and social components; and
■ will enable monitoring and assist decision makers in assessing the outcomes of forestmanagement within the Southern CRA region in terms of achieving ecologically sustainableforest management.
4.1 INTRODUCTION
Based on the results of the data identification process (as outlined in the previous section), thefollowing section details the Category A and B indicators that have been identified for theSouthern CRA region. The categorisation of indicators builds upon the categories that werepreviously identified as part of the regional framework.
4.1.1 Category A Indicators
Category A are indicators that can be reported against immediately. The regional frameworkidentified two category A indicators:
■ 6.2c Number of Visits per annum. It is proposed that this definition is amended to read: 6.2cNumber of visits per annum to State Forests, National Parks and to the local region.
■ 6.5a Direct and indirect employment in the forest sector and forest sector employment as aproportion of total employment (direct). It is proposed that this definition is amended toread: 6.5a Direct employment in the forest sector and forest sector employment as aproportion of total employment
The data identification process indicated that appropriate data sources exist for both of theseindicators, so they can remain Category A indicators for the Southern CRA region analysis.
In addition, based on the results of the data identification process, three further indicators can beidentified as category A indicators for the Southern CRA region. It is proposed that the first ofthese additional Category A indicators has a minor definitional change in order for it to meet therequirements of Category A indicators. These three indicators are:

March 2000 Economic and Social Indicators: Southern CRA Region
25
■ 6.1a (original definition) Value and volume of wood and wood products production,including value added through downstream processing. It is proposed that this definition isamended to read: 6.1a Value and volume of wood production.; and
■ 6.4 a (i) Area and per cent of forest land in defined tenures, management regimes andzonings which are formally managed in a manner which protect Indigenous peoples’cultural, social, religious and spiritual values, including non-consumptive appreciation ofthe country.
■ 6.5b Average wage rates and injury rates in major employment categories within the forestsector.
4.1.2 Category B - Indicators
Category B indicators are able to be measured, however, they require either furthermethodological development or resourcing resolution before they can be finalised.
The regional framework identified six category B indicators:
■ 6.1a Value and volume of wood and wood products production, including value addedthrough downstream processing.
■ 6.3a Value of investment, including investment in forest growing, forest health andmanagement, planted forests wood processing, recreation and tourism.
■ 6.4a (ii) Proportion of places of non-Indigenous cultural value in forests formally managedto protect those values.
■ 6.5a Direct and indirect employment in the forest sector and forest sector employment as aproportion of total employment (indirect).
■ 6.6a Extent to which the management framework maintains and enhances Indigenous valuesincluding customary, traditional and native title use by Indigenous peoples and forIndigenous participation in forest management.
Based on the results of the data identification process, all of these indicators will remainCategory B indicators, except 6.1a (with definition change) and 6.4a which are proposed to beviable Category A indicators. In addition, a further category B indicator was identified as aresult of this study:
■ 6.1b Value and quantities of production of non-wood forest products.
Furthermore, 6.5b which was previously identified as a Category Other is proposed to be aviable Category A indicator.
Table 4a summarises the proposed Category A and B indicators as identified in this assessment,along with detailing the data sources as identified for each of the indicators.

Economic and Social Indicators: Southern CRA Region March 2000
26
TABLE 4A PROPOSED CATEGORY A AND B INDICATORS
FRAMEWORK INDICATORS Cat. A Cat. B Cat. C Data Sources6.1 Production and Consumption6.1a Value and volume of wood and woodproducts production, including value addedthrough downstream processing
State Forests ofNSW
6.1b Value and quantities of production ofnon-wood forest products
State Forests ofNSW
6.2 Recreation and Tourism6.2c Number of visits per annum NPWS, State
Forests of NSW,Tourism NSW,
BTR6.3 Investment in the Forest Sector6.3a Value of Investment, includinginvestment in forest growing, forest healthand management, planted forests, woodprocessing, recreation and tourism6.4 Cultural, Social and Spiritual Needs and Values
6.4a (i) Area and per cent of forest land indefined tenures, management regimes andzonings which are formally managed in amanner which protect Indigenous peoples’cultural, social, religious and spiritual values,including non-consumptive appreciation of thecountry
NSW NPWS
6.4a (ii) Proportion of places of non-Indigenous cultural value in forests formallymanaged to protect those values
NSW HeritageOffice
6.5 Employment and Community Needs6.5a Direct and indirect employment in theforest sector and forest sector employment asa proportion of total employment.
ABS, Surveys &Modelling
6.5b Average wage rates and injury rates inmajor employment categories within the forestsector.
(Cat. other)ABS, WorkCover
NSW
6.6 Indigenous Participation and Management6.6a Extent to which the managementframework maintains and enhancesIndigenous values including customary,traditional and native title use by Indigenouspeoples and for Indigenous participation inforest management
State Forests ofNSW, NSW
NPWS
From table 4a, it can be seen that indicator 6.1a and indicator 6.4a have moved from Category Bto Category A, indicator 6.1b has moved from Category C to Category B and indicator 6.5bhave moved from Category Other to Category A.

March 2000 Economic and Social Indicators: Southern CRA Region
27
4.2 CATEGORY A INDICATORS
The following section provides a comprehensive overview of the Category A indicatorsidentified for the Southern CRA region as part of this study. The overview of each indicatorprovides information pertaining to:
■ The framework definition of the indicator developed under the regional framework;
■ The standardised definition of the indicator (where alterations to the framework definitionwere made by Hassall & Associates);
■ The data sources that support the indicator;
■ Data fit to CRA boundaries
■ The frequency of collection of the data within the identified sources;
■ Format and data cost;
■ Any data gaps that exist within the present data collection mechanisms;
■ Any confidentiality provisions that govern the use of the data; and
■ The correlation that the indicator has with other indicators.
Furthermore, a discussion of definition, methodology, reporting, recommendations and targetlevels with relation to each of the indicators follows each tabular summary.
Finally, possible targets for Category A indicators are identified.
4.2.1 Sub-section 6.1 – Production and Consumption
Table 4b provides an overview of indicator 6.1a.
TABLE 4B – OVERVIEW OF INDICATOR 6.1AIndicator 6.1aFramework Definition Value and volume of wood and wood products production,
including value added through downstream processing.Standardised Definition Value and volume of wood production.Category Category AData Sources State Forests of NSW – production volumes and royalties for
both private and State Forests of NSW estate, fit to CRAboundaries.
Data Fit State Forests of NSW data is currently collected on a regionalbasis, however, they are developing techniques for collation at aCRA level.
Data Frequency AnnualData Format and Cost Database output (see discussion below)
There is no cost associated with the data, beyond thoseassociated with collation.
Data Gaps Sawmill operators – costsConfidentiality Requirements NilCorrelation with other Indicators Linked to 6.5a (Employment)Pitfalls No measurement of value added production
DefinitionClarification of definition.
■ The value of wood products would consist of the royalty return to State Forests of NSWfrom exploitation. Importantly, royalties only detail the return from exploitation, they do not

Economic and Social Indicators: Southern CRA Region March 2000
28
measure production or value added production, see section 4.3.1 for techniques to overcomethe short-comings of royalties as a value measure;
■ The volume of wood products would be measured in metres cubed (m3) by tree type. Thedetail on tree types measured will be determined by the ESFM’s objectives; and
■ State Forests of NSW should develop the definition of this indicator further followingestablishment of indicator objectives and targets.
Methodology
■ State Forests of NSW should implement a database system that measures, monitors andreports upon volume and value of wood production data specifically for the Southern CRAregion, this will facilitate indicator measurement;
■ The opportunity exists to develop a historical trend analysis on both volume and valueparameters using existing time series data; and
■ Following annual reporting, ongoing monitoring would ensure that the process of datacollection is achieving the stated objectives and opportunities to improve the adoptedmethodology are implemented.
Reporting
■ Reporting should occur against a number of major categories. These may includebreakdowns by individual species, by end use, by value of end use, etc; and
■ Reporting should be undertaken by State Forests of NSW.
Recommendations
■ A central agency should be established that coordinates data validation, measuring andmonitoring to ensure reliability and accuracy of this data; and
■ Efforts be made to more accurately assess the issue of royalties, including standardisation ofthe base against which royalties are measured. This would involve measures aimed atovercoming the present weakness in the data source, i.e., royalties do not identifyproduction, particularly value added production (see section 4.3.1);
■ State Forests of NSW have indicated that it is not appropriate for them to monitor the realvalues of production for both private and public forestry enterprise, as commerciallyconfident accounts from sawmills would need to be gathered, creating a conflict of interestbetween State Forests of NSW as a commercial supplier and also as a regulatory accountant.
Target Levels
The following target levels are indicative.
■ Volume should be in line with RFA agreement requirements; and
■ A potential target might be to maintain current real values, adjusted for consumer priceinflation. However, a reduction in value may result from resource access changes, which donot necessarily represent a worsening situation in the timber industry.

March 2000 Economic and Social Indicators: Southern CRA Region
29
4.2.2 Sub-section 6.2 – Recreation and Tourism
Table 4c provides an overview of indicator 6.2c.
TABLE 4C – OVERVIEW OF INDICATOR 6.2CIndicator 6.2cFramework Definition Number of visits per annumStandardised Definition Number of visits per annum to State Forests, National Parks and
to the local regionCategory Category AData Sources NSW NPWS – Visitor estimates
State Forests of NSW – Visitor estimatesTourism NSW – regional tourism estimatesBureau of Tourism Research – regional tourism estimates
Data Fit NSW NPWS and State Forest – Collected on a park by parkbasis.Tourism NSW data collected regionally, techniques of adjustmentare required to fit CRA region.
Data Frequency 6 monthly (Tourism NSW)Annual (State Forests of NSW and NSW NPWS)
Data Format and Cost NSW NPWS and State Forests of NSW data is not available froma point database, rather is provided on a park by park basis.There is no cost associated with NSW NPWS and State Forestdata, beyond collation costs.Tourism NSW data is web accessible at no cost
Data Gaps Private Forest visitationConfidentiality Requirements Nil – Tourism NSW, NSW NPWS and State Forests of NSW
Correlation with other Indicators Linked to 6.3a (Investment)Pitfalls Changes to visitation occur for often complex reasons, economy,
tastes, etc.
DefinitionClarification of definition.
■ Visits – To ensure consistency across the data sources an appropriate measure for visitationwould be the multiple of the number of visitors by the average period of stay;
■ The data is available to investigate visitation beyond number of visitors by average length ofstay, however, more detailed measures should only be considered where the objectives forthe indicator state that it is necessary; and
■ Central agency to develop definition following establishment of objectives and targets.
Methodology
■ NSW NPWS and SFNSW should institute a standardised mechanism for allowing theongoing collection/estimation of the number of visits associated with their tenured lands inthe Southern CRA region;
■ Tourism NSW should develop (using existing tourism regions data as a base) a SouthernCRA region specific database of tourism visitation, otherwise the central agency shoulddevelop mechanisms to make the data CRA specific;
■ The data should be measured upon a consistent unit, ie visitor days, which is a combinationof visitor nights and number of visits;
■ Data adjustments need to ensure identification of snowy winter tourism visitation, to ensurethat the tourism information is not biased by outside influences, ie skiing season;

Economic and Social Indicators: Southern CRA Region March 2000
30
■ Time Series data should be available for Tourism NSW, and to a certain extent from NSWNPWS and SFNSW to develop a baseline profile;
■ Information is not available for private forest visitation, so this indicator can only considervisitation to NSW NPWS and State Forests of NSW tenure; and
■ Following annual reporting, ongoing monitoring should ensure that the process of datacollection is achieving the stated objectives, and opportunities to improve the adoptedmethodology are implemented.
Reporting
■ Given there are three main data sources, reporting of this data should be made theresponsibility of a central agency. When reporting the agency should reflect upon anydifference between localised and regionalised changes; and
■ Reporting should be undertaken by a central agency.
Recommendations
■ A central agency should be established that coordinates data validation, measuring andmonitoring to ensure reliability and accuracy of this data.
■
Target Levels
The following target levels are indicative.
■ Growth in line with regional or state recreation and tourism trends. These will provide abenchmark for forest related tourism growth relative to local or state tourism growth rates;
■ Growth to be on a sustainable basis, mindful of precautionary principle and other relevantecologically sustainable development criteria. The issue of what is sustainable tourismwould need to be addressed by the agency coordinating this indicator; and
■ In the absence of sustainable tourism targets being identified, due to the complexity of theirmeasurement, it may be appropriate to simply monitor tourist visitation, with no explicittargets established.
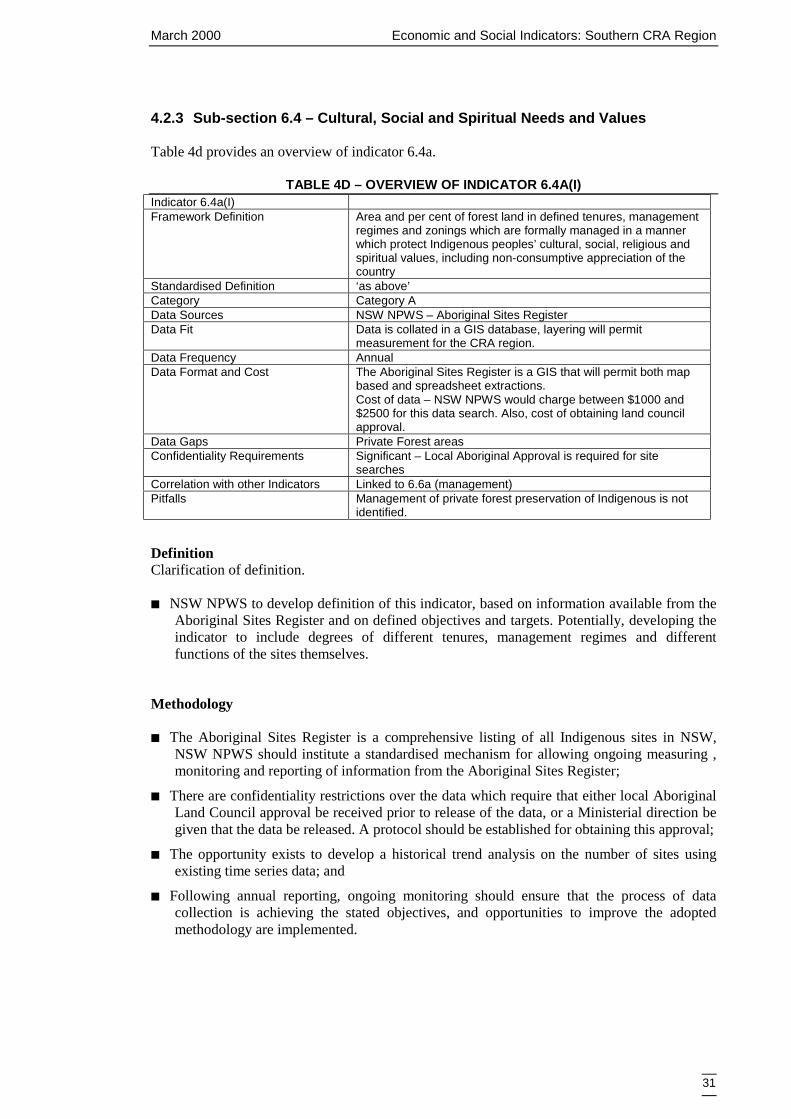
March 2000 Economic and Social Indicators: Southern CRA Region
31
4.2.3 Sub-section 6.4 – Cultural, Social and Spiritual Needs and Values
Table 4d provides an overview of indicator 6.4a.
TABLE 4D – OVERVIEW OF INDICATOR 6.4A(I)Indicator 6.4a(I)Framework Definition Area and per cent of forest land in defined tenures, management
regimes and zonings which are formally managed in a mannerwhich protect Indigenous peoples’ cultural, social, religious andspiritual values, including non-consumptive appreciation of thecountry
Standardised Definition ‘as above’Category Category AData Sources NSW NPWS – Aboriginal Sites RegisterData Fit Data is collated in a GIS database, layering will permit
measurement for the CRA region.Data Frequency AnnualData Format and Cost The Aboriginal Sites Register is a GIS that will permit both map
based and spreadsheet extractions.Cost of data – NSW NPWS would charge between $1000 and$2500 for this data search. Also, cost of obtaining land councilapproval.
Data Gaps Private Forest areasConfidentiality Requirements Significant – Local Aboriginal Approval is required for site
searchesCorrelation with other Indicators Linked to 6.6a (management)Pitfalls Management of private forest preservation of Indigenous is not
identified.
DefinitionClarification of definition.
■ NSW NPWS to develop definition of this indicator, based on information available from theAboriginal Sites Register and on defined objectives and targets. Potentially, developing theindicator to include degrees of different tenures, management regimes and differentfunctions of the sites themselves.
Methodology
■ The Aboriginal Sites Register is a comprehensive listing of all Indigenous sites in NSW,NSW NPWS should institute a standardised mechanism for allowing ongoing measuring ,monitoring and reporting of information from the Aboriginal Sites Register;
■ There are confidentiality restrictions over the data which require that either local AboriginalLand Council approval be received prior to release of the data, or a Ministerial direction begiven that the data be released. A protocol should be established for obtaining this approval;
■ The opportunity exists to develop a historical trend analysis on the number of sites usingexisting time series data; and
■ Following annual reporting, ongoing monitoring should ensure that the process of datacollection is achieving the stated objectives, and opportunities to improve the adoptedmethodology are implemented.

Economic and Social Indicators: Southern CRA Region March 2000
32
Reporting
■ Reporting should occur against a number of different categories. These may include size,type of site, historical importance, importance to contemporary Indigenous communities,etc; and
■ Reporting should be undertaken by NSW NPWS.
Recommendations
■ Investigate the potential for: approval for multiple extractions; or a technique to facilitateLand Council Approval; or a Ministerial directive providing access to site information. Onof these is necessary for the on-going monitoring of this indicator; and
■ A central agency should be established that coordinates the data validation process to ensurereliability and accuracy of this data, however, this will likely be prohibitively expensive;
Target Levels
The following target levels are indicative.
■ Registered sites in line with numbers in other similarly managed forest lands;
■ Definition development by NSW NPWS may result in additional targets, that consider thetenure classifications and functions of the sites themselves; and
■ Target levels should also coincide with any government objectives with relation topreservation and management of Indigenous heritage.

March 2000 Economic and Social Indicators: Southern CRA Region
33
4.2.4 Sub-section 6.5 – Employment and Community Needs
Table 4e provides an overview of indicator 6.5a.
TABLE 4E – OVERVIEW OF INDICATOR 6.5AIndicator 6.5aFramework Definition Direct and indirect employment in the forest sector and forest
sector employment as a proportion of total employmentStandardised Definition Direct employment in the forest sector and forest sector
employment as a proportion of total employmentCategory Category AData Sources ABS – Australian Business Register
ABS – Census DataData Frequency AnnualData Format and Cost The ABS information can be provided in spreadsheet format.
Australian Business Register - $300 - $400Census Data – Similar order of magnitude to Australian BusinessRegisterInput-Output model – dependent on scale of update the cost ofredeveloping the I-O tables would not be insignificant.
Data Gaps Census Data is only every five years.Indirect employment, not available, use CARE input-outputestimates as a proxy.
Confidentiality Requirements NilCorrelation with other Indicators Linked to 6.1a (Value and Volume of Production)Pitfalls Direct employment – limited detail of timber industry, particularly
with relation to overall employment mix.
DefinitionClarification of definition.
■ The “Regional Economic Impact Assessment for the Southern RFA Region, 1999” identifieddirect employment to include the following:
■ Direct = Supply and processing of timber;
■ See Section 4.3.4 for details on definition and measurement of indirect employment.
Methodology
■ A Central agency needs to establish an on-going arrangement with the Australian Bureau ofStatistics to measure, monitor and report on employment in the forest sector for theSouthern CRA region;
■ The opportunity exists to develop a historical trend analysis on the number of sites usingexisting time series data;
■ It is not possible to assess the impacts of changes in the forestry industry upon employmentthat is indirectly related to the forestry industry without an industry survey, however, CAREinput-output estimates could be employed as a proxy, as long as they are periodicallyredeveloped ;
■ The substitutability of resources from other areas needs to be reconsidered upon eachreporting of the indicator (assuming annual reporting), as dependent on the employmentsituation in the area under consideration the indirect impacts may vary. The implicationbeing that if indirect employment is resourced locally the multiplier effects are not as greatas if employment resources shift from other areas; and

Economic and Social Indicators: Southern CRA Region March 2000
34
■ Following annual reporting, ongoing monitoring should ensure that the process of datacollection is achieving the stated objectives, and opportunities to improve the adoptedmethodology are implemented.
Reporting
■ The data should be reported against various categories, including employment category, andforestry dependent and ancillary business;
■ Reporting should also consider the external factors that affect employment, eg sustainableforest management practices, cyclical nature of the economy and market changes over time;and
■ Reporting should be undertaken by a central agency.
Recommendations
■ A central agency should be established that coordinates data validation, measuring andmonitoring to ensure reliability and accuracy of this data; and
■ Census data is only available every five years and there is a significant time lag betweenundertaking the census and release of the data which renders it less than ideal, from a policyresponse perspective. Potentially, the Census data may be more appropriate to validate andcalibrate the results from the Australian Business Register database.
Target Levels
The following target level is indicative.
■ Difficult to set given on-going structural adjustment, technological change and externalfactors. Also, it is difficult to set a policy on employment given the significant privatedecision making process.

March 2000 Economic and Social Indicators: Southern CRA Region
35
Table 4f provides an overview of indicator 6.5b.
TABLE 4F – OVERVIEW OF INDICATOR 6.5BIndicator 6.5bFramework Definition Average wage rates and injury rates in major employment
categories within the forest sectorStandardised Definition ‘as above’Category Category AData Sources ABS – Employee Earnings, Benefits and Trade Union
Membership Survey – Special data requestWorkCover – Injury Claim Database
Data Fit ABS – Data can be disaggregated for the Southern CRA region,based on LGAs.WorkCover – Data can be disaggregated for the Southern CRAregion, based on postcodes.
Data Frequency ABS Survey is conducted in August, with results available inFebruaryWorkCover – to be confirmed
Data Format and Cost ABS – Spreadsheet format, minimum cost = $170 (special datarequest)WorkCover – Spreadsheet format, minimum cost = $150 (specialdata request)
Data Gaps Injury indicator only identifies officially settled claims, where aclaim has been settled otherwise they are not identified.
Confidentiality Requirements Work Cover is unable to provide information when less than fourclaims have been processed in a certain category.
Correlation with other Indicators Linked with 6.5a (Employment)Pitfalls Limited view of injury statistics, privately settled claims excluded.
DefinitionClarification of definition.
■ Major employment categories, as identified by the Australian Bureau of Statistics, caninclude part-time/full time, male, female (general level) or can include managers,professionals, tradespersons, clerical services, etc (detailed level). The detail in terms ofemployment categories would need to be developed following identification of objectives;and
■ The agency responsible for the measurement of this indicator should develop the definitionof this indicator based on objectives and targets for wage and injury rates.
■
Methodology
■ WorkCover NSW should establish an ongoing mechanism which measures, monitors andreports on injury rates in the Southern CRA region. Otherwise, a central agency needs toeither establish an on-going arrangement with WorkCover, or on an regular (eg annual)basis organise a data extraction for developing the indicator;
■ A central agency needs to establish an on-going arrangement with the Australian Bureau ofStatistics to measure, monitor and report on wage and injury rates in the forest sector for theSouthern CRA region. Otherwise, the central agency needs to report and monitor on thestatistics provided by the ABS;
■ WorkCover have indicated that injury rate information is only available at an aggregatedlevel, due to confidentiality constraints;
■ ABS information on wage rates is available at a more disaggregated level, similarconfidentiality restrictions exist for ABS data, but the size of the data set should eliminateany confidentiality problems;
Economic and Social Indicators: Southern CRA Region March 2000
36
■ The opportunity exists to develop a historical trend analysis on the number of sites usingexisting time series data; and
■ Following annual reporting, ongoing monitoring should ensure that the process of datacollection is achieving the stated objectives, and opportunities to improve the adoptedmethodology are implemented.
Reporting
■ The data should be reported against various categories, particularly major employmentcategories; and
■ Reporting should be undertaken by a central agency.
Recommendations
■ A central agency should be established assume a role in coordinating a data validationprocess to ensure reliability and accuracy of this data;
Target Levels
The following target levels are indicative.
■ Maintenance of real, inflation adjusted, wage levels with adjustments for changes in jobdescriptions;
■ Wage and injury rates comparable with rural NSW average, or other comparable industries;and
■ Downward trend in injuries, consistent with technology changes and improving workplaces.
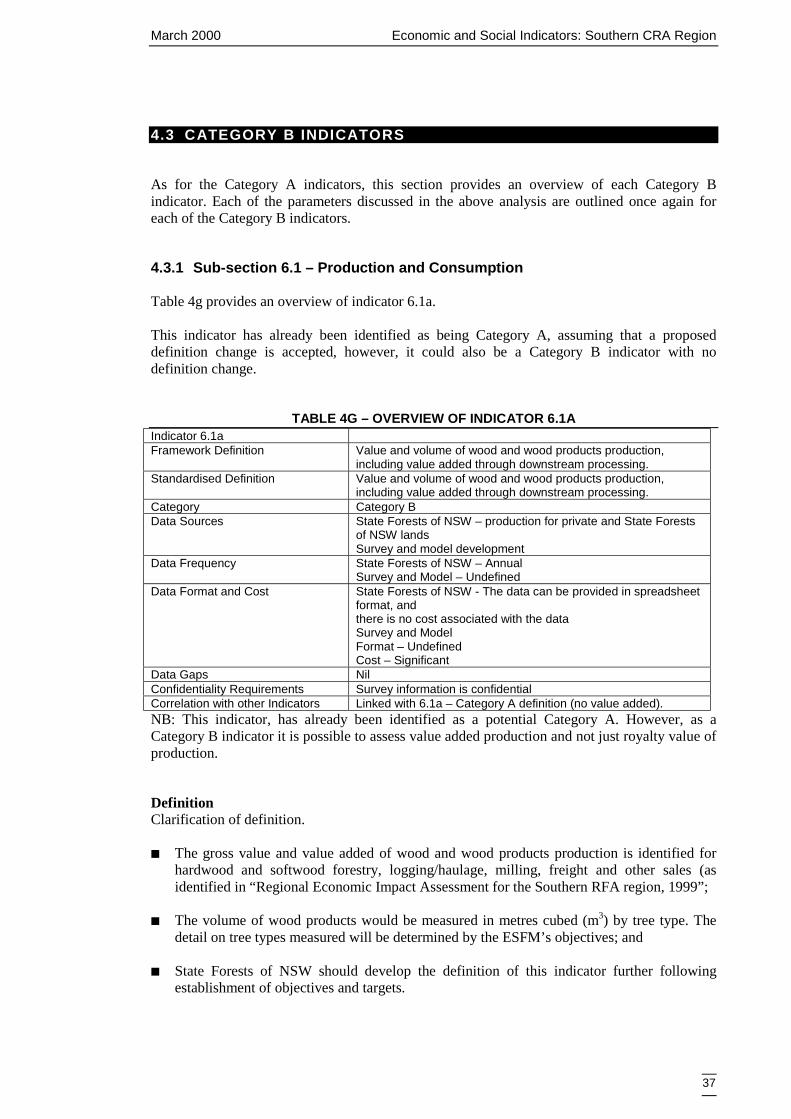
March 2000 Economic and Social Indicators: Southern CRA Region
37
4.3 CATEGORY B INDICATORS
As for the Category A indicators, this section provides an overview of each Category Bindicator. Each of the parameters discussed in the above analysis are outlined once again foreach of the Category B indicators.
4.3.1 Sub-section 6.1 – Production and Consumption
Table 4g provides an overview of indicator 6.1a.
This indicator has already been identified as being Category A, assuming that a proposeddefinition change is accepted, however, it could also be a Category B indicator with nodefinition change.
TABLE 4G – OVERVIEW OF INDICATOR 6.1AIndicator 6.1aFramework Definition Value and volume of wood and wood products production,
including value added through downstream processing.Standardised Definition Value and volume of wood and wood products production,
including value added through downstream processing.Category Category BData Sources State Forests of NSW – production for private and State Forests
of NSW landsSurvey and model development
Data Frequency State Forests of NSW – AnnualSurvey and Model – Undefined
Data Format and Cost State Forests of NSW - The data can be provided in spreadsheetformat, andthere is no cost associated with the dataSurvey and ModelFormat – UndefinedCost – Significant
Data Gaps NilConfidentiality Requirements Survey information is confidentialCorrelation with other Indicators Linked with 6.1a – Category A definition (no value added).
NB: This indicator, has already been identified as a potential Category A. However, as aCategory B indicator it is possible to assess value added production and not just royalty value ofproduction.
DefinitionClarification of definition.
■ The gross value and value added of wood and wood products production is identified forhardwood and softwood forestry, logging/haulage, milling, freight and other sales (asidentified in “Regional Economic Impact Assessment for the Southern RFA region, 1999”;
■ The volume of wood products would be measured in metres cubed (m3) by tree type. Thedetail on tree types measured will be determined by the ESFM’s objectives; and
■ State Forests of NSW should develop the definition of this indicator further followingestablishment of objectives and targets.

Economic and Social Indicators: Southern CRA Region March 2000
38
Methodology
■ As per Section 4.2.1 – Indicator 6.1a, except;
■ A central agency needs to establish a mechanism for surveying, model development andsubsequent reporting of value and value-added production for the Southern CRA region;
■ There is limited opportunity to develop time series comparisons, as the first survey wasundertaken in 1999; and
■ The substitutability of resources from other areas needs to be reconsidered upon eachreporting of the indicator (assuming annual reporting), as dependent on the employmentsituation in the area under consideration the indirect impacts may vary. The implicationbeing that if indirect employment is resourced locally the multiplier effects are not as greatas if employment resources shift from other areas.
Reporting
■ The results of the survey should be reported against the ESFM objectives; and
■ Reporting should be undertaken by a central agency.
Recommendations
■ A central agency should be established that coordinates data validation, measuring andmonitoring to ensure reliability and accuracy of this data;
■ There is no need to utilise royalties as a measure, rather the value of post sawmill productwill be available, permitting the identification of production and value added production;
■ The results of the FPA survey were provided under strict confidentiality provisos, theseconfidentiality requirements would also be required for future surveys. The confidentialityprovisos ensured that individual operators could not be identified from any publicly releaseddocumentation, this would apply to future surveys; and
■ State Forests of NSW have indicated that it is not appropriate for them to monitor the realvalues of production, as commercially confident accounts from sawmills would need to begathered, creating a conflict of interest between State Forests of NSW as a commercialsupplier and also as a regulatory accountant.

March 2000 Economic and Social Indicators: Southern CRA Region
39
Table 4h provides an overview of indicator 6.1b.
TABLE 4H – OVERVIEW OF INDICATOR 6.1BIndicator 6.1bFramework Definition Value and quantities of production of non-wood forest productsStandardised Definition ‘as above’Category Category BData Sources State Forests of NSW – production and royalties for State
Forests landsNSW NPWS – management of non-wood forest products, egapiary sites, tourism permits
Data Frequency State Forests of NSW – AnnualNSW NPWS – Annual
Data Format and Cost State Forests of NSWCost – Nil (data already collected)NSW NPWSCost – Nil (data already collected)
Data Gaps Private ForestsConfidentiality Requirements NilCorrelation with other Indicators Nil
DefinitionClarification of definition.
■ The value of non-wood forest products would consist of the royalty return to State Forestsof NSW from exploitation. Thus it is a gross return measure;
■ The units of measurement for non-wood products would include tonnes (gravel, sand, etc),hectares (grazing), sites (apiary), number (nursery seedlings), etc; and
■ A central agency should develop the definition of this indicator further followingestablishment of objectives and targets for the indicator.
Methodology
■ State Forests of NSW and NSW NPWS should implement database systems that measure,monitor and report upon value and volume data of non-wood forest production for theSouthern CRA region, this data is currently available for New South Wales as a whole, butState Forests of NSW indicated that significant development is required to disaggregate thedata for the Southern CRA region;
■ The opportunity exists to develop a historical trend analysis on both volume and valueparameters using existing time series data; and
■ Following annual reporting, ongoing monitoring should ensure that the process of datacollection is achieving the stated objectives, and opportunities to improve the adoptedmethodology are implemented.
Reporting
■ Reporting should occur against a number of major categories. These may include grazing,apiary, nursery, etc; and
■ Reporting should be undertaken by a central agency.

Economic and Social Indicators: Southern CRA Region March 2000
40
Recommendations
■ A central agency should be established that coordinates data validation, measuring andmonitoring to ensure reliability and accuracy of this data;
■ State Forests of NSW have indicated that it is not appropriate for them to monitor the realvalues of production for both private and public forestry enterprise, as commerciallyconfident accounts from sawmills would need to be gathered, creating a conflict of interestbetween State Forests of NSW as a commercial supplier and also as a regulatoryaccountant; and
■ Products could be broadly defined to include non-quantitative values, namely existence andbequeath values. The measurement of these could be considered as a further development ofthis indicator, recognising that tourism and cultural heritage indicators will likely correlatewith existence and bequeath values.

March 2000 Economic and Social Indicators: Southern CRA Region
41
4.3.2 Sub-section 6.3 – Investment in the Forest Sector
Table 4i provides an overview of indicator 6.3a.
TABLE 4I – OVERVIEW OF INDICATOR 6.3AIndicator 6.3aFramework Definition Value of Investment, including investment in forest growing,
forest health and management, planted forests, woodprocessing, recreation and tourism
Standardised Definition ‘as above’Category Category BData Sources Consultation
State and Regional DevelopmentDepartment of Urban Affairs and PlanningLocal Councils
Data Frequency UndefinedData Format and Cost Format – Undefined
Cost – Significant (cost of consultation & data gathering)Data Gaps UnknownConfidentiality Requirements UnknownCorrelation with other Indicators Employment, production and Investment could be correlated
In implementing a mechanism for measuring, monitoring and reporting with respect to thisindicator, the following outcomes should be achieved, ideally without budgetary constraint:
DefinitionClarification of definition.
■ The value of investment, would be a dollar value, however, it is important that the indicatorrecognise where investment is occurring, ie forest exploitation or preservation. Because, theindicator needs to identify whether investment is contributing to forest sustainability; and
■ A central agency should develop the definition of investment further followingmethodological development.
Methodology
■ A central agency (State and Regional Development) should establish a mechanism thatinvestigates, measure, monitors and reports on both current and potential investment. Thismechanism should draw upon information from State and Regional Development, theDepartment of Urban Affairs and Planning and Local Councils. Also, the investigationprocess would most likely involve a stakeholder forum being convened on a regular basis;
■ The establishment of a regular forum is a costly and slow process; and
■ Following annual reporting, ongoing monitoring should ensure that the process of datacollection is achieving the stated objectives, and opportunities to improve the adoptedmethodology are implemented.
Reporting
■ Reporting should occur against a number of major categories. These may include forestgrowing, forest health and management, planted forests, wood processing and forestryrelated recreation and tourism; and
■ Reporting should be undertaken by a central agency.

Economic and Social Indicators: Southern CRA Region March 2000
42
Recommendations
■ A central agency should be established that coordinates data validation, measuring andmonitoring to ensure reliability and accuracy of this data;
■ It would be difficult to develop a historical trend analysis, apart from employing ABSAustralian Business Register information which details the number of organisations and thesize of those organisations in the Southern CRA region; and
■ Information on potential/future investments is not easily identified, because proponents oftenprefer to disguise their ideas to potential competition in the market.

March 2000 Economic and Social Indicators: Southern CRA Region
43
4.3.3 Sub-section 6.4 – Cultural, Social and Spiritual Needs and Values
Table 4j provides an overview of indicator 6.4a(ii).
TABLE 4J – OVERVIEW OF INDICATOR 6.4A(II)Indicator 6.4a(ii)Framework Definition Proportion of places of non-Indigenous cultural value in forests
formally managed to protect those valuesStandardised Definition ‘as above’Category Category BData Sources NSW Heritage Office – State Heritage InventoryData Frequency Updated within three months of LEP or REPData Format and Cost Format – Web accessible Spreadsheet
Cost – NilData Gaps Unidentified sites, in forest areas are likely due to their limited
public exposure.Confidentiality Requirements NilCorrelation with other Indicators Potential correlation with Tourism and Recreation indicator.
In implementing a mechanism for measuring, monitoring and reporting with respect to thisindicator, the following outcomes should be achieved, ideally without budgetary constraint:
DefinitionClarification of definition.
■ Cultural value, for the purpose of this indicator has been identified as those sites which are ofsignificant enough value that they have achieved heritage listing; and
■ Following development of objectives and targets definitions should be further developed bythe central agency reporting on the indicator.
Methodology
■ NSW Heritage Office should implement a system of extraction from their database thatmeasures, monitors and reports upon the number and type of non-Indigenous places ofcultural value in forests;
■ The opportunity exists to develop a historical trend analysis on the number of heritageprotected non-Indigenous sites;
Reporting
■ Reporting should occur against a number of major categories. These may include type of site(man-made or natural), size of site, importance of site (State Register, LEP, etc);
■ NSW Heritage Office would need to ensure that any overlap between the NSW NPWSAboriginal Sites Register are eliminated, or explained;
■ Following annual reporting, ongoing monitoring should ensure that the process of datacollection is achieving the stated objectives, and opportunities to improve the adoptedmethodology are implemented; and
■ Reporting should be undertaken by a central agency.
Recommendations

Economic and Social Indicators: Southern CRA Region March 2000
44
■ A central agency should be established that coordinates data validation, measuring andmonitoring to ensure reliability and accuracy of this data; and
■ Development of objectives in terms of the preservation of sites of cultural, heritage valueneed to be detailed by the appropriate agency; and
■ Detailed assessment of heritage in the area should also be considered, which would includeliterature review of the area, detailed inventory, identified sites and assessment ofcommunity association with the sites.

March 2000 Economic and Social Indicators: Southern CRA Region
45
4.3.4 Sub-section 6.5 Employment and Community Needs
Table 4k provides an overview of indicator 6.5a.
TABLE 4K – OVERVIEW OF INDICATOR 6.5AIndicator 6.5aFramework Definition Direct and indirect employment in the forest sector and forest
sector employment as a proportion of total employmentStandardised Definition Direct and indirect employment in the forest sector and forest
sector employment as a proportion of total employmentCategory Category AData Sources ABS – Australian Business Register
ABS – Census DataSurvey and Model Development
Data Frequency ABS – AnnualSurvey and Model – Undefined
Data Format and Cost The ABS information can be provided in spreadsheet format.Australian Business Register - $300 - $400Census Data – Similar order of magnitude to Australian BusinessRegisterInput-Output model – dependent on scale of update the cost ofredeveloping tables needs to be assessed.
Data Gaps Census Data is only every five yearsConfidentiality Requirements Survey results are confidentialCorrelation with other Indicators Nil
NB: This indicator, has already been identified as a potential Category A. However, as aCategory B indicator it is possible to assess indirect employment.
In implementing a mechanism for measuring, monitoring and reporting with respect to thisindicator, the following outcomes should be achieved, ideally without budgetary constraint.
DefinitionClarification of definition.
■ The “Regional Economic Impact Assessment for the Southern RFA Region, 1999” identifieddirect employment to include the following:
■ Direct = Supply and processing of timber; and
■ Indirect = Further fabrication of timber products and forest dependent activities that are notrelated to local milling, eg visitation, apiary, mining.
■ Further development of the definition should occur following establishment of objectivesand targets.
Methodology
■ A Central agency needs to establish an on-going arrangement with the Australian Bureau ofStatistics to measure, monitor and report on employment in the forest sector for theSouthern CRA region;
■ Given that the first survey on the Southern CRA region was conducted in 1999 there islimited scope for establishing a historical time-series perspective;
■ The survey makes it possible (using I-O techniques) to assess the impacts of changes in theforestry industry on employment that is indirectly related to the forestry industry;
■ The substitutability of resources from other areas needs to be reconsidered upon eachreporting of the indicator (assuming annual reporting), as dependent on the employment
Economic and Social Indicators: Southern CRA Region March 2000
46
situation in the area under consideration the indirect impacts may vary. The implicationbeing that if indirect employment is resourced locally the multiplier effects are not as greatas if employment resources shift from other areas; and
■ As previous mentioned, Census data is only available every five years and there is significanttime lag between undertaking the census and release of the data which renders it asinappropriate for all purposes beyond validation/calibration; and
■ Following annual reporting, ongoing monitoring should ensure that the process of datacollection is achieving the stated objectives, and opportunities to improve the adoptedmethodology are implemented.
Reporting
■ Using the results of the survey process described in section 4.3.1. A central agency needs toestablish a mechanism reporting of direct and indirect employment for the Southern CRAregion;
■ The data should be reported against various categories, including employment category, andforestry dependent and ancillary business; and
■ Reporting should be undertaken by a central agency.
Recommendations
■ A central agency should be established that coordinates data validation, measuring andmonitoring to ensure reliability and accuracy of this data.
■

March 2000 Economic and Social Indicators: Southern CRA Region
47
4.3.5 Sub-section 6.6 – Indigenous Participation and Management
Table 4l provides an overview of indicator 6.6a.
TABLE 4L – OVERVIEW OF INDICATOR 6.6AIndicator 6.5aFramework Definition Extent to which the management framework maintains and
enhances Indigenous values including customary, traditional andnative title use by Indigenous peoples and for Indigenousparticipation in forest management.
Standardised Definition ‘as above’Category Category BData Sources NSW NPWS – Aboriginal Sites Registry
NSW NPWS – Co-management agreementsState Forests of NSW – Details of co-management agreementsLocal Aboriginal Land Councils
Data Frequency Registry – annualData Format and Cost Registry – GIS, mapping and spreadsheet outputData Gaps ?Confidentiality Requirements Aboriginal sites information requires local aboriginal bodies
approvalCorrelation with other Indicators Significant correlation with Indicator 6.4a(I).
In implementing a mechanism for measuring, monitoring and reporting with respect to thisindicator, the following outcomes should be achieved, ideally without budgetary constraint:
DefinitionClarification of definition.
■ Appropriate agencies (NSW NPWS, SFNSW) need to further refine this definition, based onthe different management frameworks that are being established; and
■ Participation - Beyond identification of aboriginal sites for their preservation (see indicator6.4 (i)) participation relates to Indigenous decision making responsibilities and rights,including the establishment of co-management agreement between Indigenous peoples andforest estates in the Southern CRA region.
Methodology
■ Aboriginal Sites Register – data availability, confidentiality and trend analysis is detailed insection 4.2.3. This would form the basis for the identification of indigenous association withsites located on NSW NPWS and SFNSW estates;
■ NSW NPWS and SFNSW are establishing co-management agreements with local aboriginalcommunities. The nature of these agreements and the potential for more agreements needsto be investigated;
■ Local Aboriginal Communities (Land Councils) should be consulted to assess potential forfurther establishment of agreements that protect their natural heritage and culture.Consultation should also address their current relationship with local forestry agencies toassess perceptions of their ability to participate in forest management.
■ SFNSW and NSW NPWS should be responsible for reporting on the establishment ofagreements with indigenous associations that relate to Indigenous participation in forestmanagement; and

Economic and Social Indicators: Southern CRA Region March 2000
48
■ Following annual reporting, ongoing monitoring should ensure that the process of datacollection is achieving the stated objectives, and opportunities to improve the adoptedmethodology are implemented.
Reporting
■ Reporting should occur against a number of different categories. These may include size,type of site, historical importance, type of management agreement, etc; and
■ Reporting should be undertaken by a central agency.
Recommendation
■ A central agency should be established that coordinates data validation, measuring andmonitoring to ensure reliability and accuracy of this data. This is particularly relevant toagency (NSW NPWS and SFNSW) details of consultation with Local Aboriginal LandCouncils; and
■ The central agency should compare the extent of Indigenous participation in forestmanagement between agencies (NSW NPWS and SFNSW). A cross agency comparisonwill identify where one or other of the agencies needs to alter its stance with relation toIndigenous forest management.
4.4 CONCLUSIONS
This report has identified appropriate data sources and application mechanism for Category Aand B indicators as identified under “Criterion 6 – Maintenance and enhancement of long termmultiple socio-economic benefits to meet the needs of societies” of the regional framework. Anumber of these indicators would be best left to appropriate agencies for development.However, certain indicators will rely on information from a number of different agencies, in thisinstance we advise that a central agency assume responsibility for the development of thatindicator.
Central Agency
We also recommend that the aforementioned central agency be responsible for the developmentof an overview report which both:a) details the results of Category A indicator measurement, monitors future measurement of
these indicators; andb) details the stage of development of the Category B indicators, prior to implementation and
post implementation reports on the values generated for these indicators.
The central agency would also be responsible for the standardisation of data across the differentindicators.
This role would be best performed by a central agency as it will permit a more strategicresponse to policy shifts that result from changes in the value of the indicators. Appropriatecentral agencies might include:
■ Department of Urban Affairs and Planning
■ NSW Premier’s Department

March 2000 Economic and Social Indicators: Southern CRA Region
49
■ State and Regional Development
Policy Response Problems
There are significant links and interdependences between various of the indicators andtherefore, any adjustments made in response to changes in one indicator must also be consideredin terms of the impact on other indicators. For instance, policy changes that impact uponproduction volumes will also impact on value of production, employment (direct and indirect),and wage and injury rates for the region.
Data Collection Timing
The data identified as being appropriate to the different indicators, particularly Category Aindicators is (at least) available on an annual basis, with some cross-check information oftenavailable every five years.
Confidentiality
There are confidentiality constraints associated with a number of the data sets. In particular, theconfidentiality constraints associated with obtaining information about sites of Indigenouscultural, social, religious and spiritual values represent the most significant constraint onindicator measurement. Information on Indigenous sites on an annual basis needs either aministerial directive or local land council approval. An agreement needs to be established tofacilitate the annual collection of data on Indigenous sites.
Economic and Social Indicators: Southern CRA Region March 2000
50
5. FURTHERRECOMMENDATIONS
5.1 INTRODUCTION
This section details a gap analysis of the indicators and also discusses some recommendationsthat were not within the project scope, but which would value add to the proposed indicators.
5.2 GAP ANALYSIS
Performance indicators are required for accountability and to guide management decisions.Indicators should therefore be developed for each general objective implied in Criterion 6, thatis:■ environmental sustainability;
■ social benefit;
■ economic benefit;
■ management efficiency.
(While these general objectives can be implied for Criterion 6, more work is required ondeveloping specific objectives for each indicator. This is discussed further later in this section).
Indicators should also report on a mix of inputs, processes, outputs and outcomes to facilitatemore meaningful analysis of cause and effect relationships in the management system.
Table 5A provides a tabular analysis of proposed Category A and B indicators in relation to thegeneral objectives above and each stage of the management process.
Environmental sustainability –the volume and value of production indicators (6.1a and b), alongwith indicator 6.2c all address the issue of environmental sustainability. With volume and valuebeing particularly appropriate to environmentally sustainable forest production levels, to beidentified as part of the ESFM process. Also, indicators in Criteria 1, 3 and 4 are more focussedon environmental sustainability and will complement these indicators.
Social benefit – there are process measures of social benefit in relation to respecting andinvolving Indigenous people but no way of assessing whether these processes lead to desiredoutcomes. However, this would be a complex task, probably beyond the scope of most agenciesin the medium term. The social benefits of employment are covered in indicators 6.5a and 6.5bwhich measure selected inputs, outputs and outcomes. There is a gap in relation to the socialbenefits of recreation and tourism, and with relation to community needs in terms of viabilityand adaptability of forest dependent communities.

March 2000 Economic and Social Indicators: Southern CRA Region
51
Economic benefit – there are adequate measures of economic benefit that cover a range ofinputs, outputs and outcomes. Indicator 6.3a covers investment in forest production, woodprocessing and recreation and tourism and indicator 6.5a covers employment in the forestsector, dependent on whether the category A indicator for 6.5a is measured or category B willdetermine the detail of economic benefit that is considered.
Management efficiency – there are adequate indicators which partly address this objective.

Economic and Social Indicators: Southern CRA Region March 2000
52
TABLE 5A- GAP ANALYSIS FOR PROPOSED CATEGORY A AND B INDICATORS
Management objectivesManagement stage/type of indicator
Indicator
En
viro
nm
enta
lsu
sta
ina
bili
ty
So
cial
ben
efit
Eco
nom
ic b
ene
fit
Ma
na
ge
me
nt
eff
icie
ncy
Inp
ut
Pro
cess
Ou
tpu
t
Ou
tco
me
6.1 Production and Consumption6.1a Value and volume of woodand wood products production,including value added throughdownstream processing
! ! * !
6.1b Value and quantities ofproduction of non-wood forestproducts
! ! * !
6.2 Recreation and Tourism6.2c Number of visits per annum * * * !6.3 Investment in the Forest Sector6.3a Value of investment, includinginvestment in forest growing, foresthealth and management, plantedforests, wood processing,recreation and tourism
! * !
6.4 Cultural, Social and Spiritual Needs and Values6.4a (i) Area and per cent of forestland in defined tenures,management regimes and zoningswhich are formally managed in amanner which protect Indigenouspeoples’ cultural, social, religiousand spiritual values, including non-consumptive appreciation of thecountry
* !
6.4a (ii) Proportion of places of non-Indigenous cultural value in forestsformally managed to protect thosevalues
* !
6.5 Employment and Community Needs6.5a Direct and indirectemployment in the forest sector andforest sector employment as aproportion of total employment
! ! * !
6.5b Average wage rates and injuryrates in major employmentcategories within the forest sector.
! ! !(wagerates)
!(injuryrates)
6.6 Indigenous Participation and Management6.6a Extent to which themanagement framework maintainsand enhances Indigenous valuesincluding customary, traditional andnative title use by Indigenouspeoples and for Indigenousparticipation in forest management
! !
Key:! denotes the indicator addresses this objective.* denotes that the indicator partly addresses this objective.

March 2000 Economic and Social Indicators: Southern CRA Region
53
5.3 RECOMMENDATIONS
This section discusses some recommendations that were not within the project scope, but whichwould value add to the proposed indicators.
5.3.1 Define Objectives
The indicators, as identified in the framework, and further developed in this report still lack anyclear development of their objectives. Further study is therefore required to develop theiruse/interpretation to decision makers.
5.3.2 Define Reporting
The reporting of the indicators will depend on their objectives. Further development of thereporting techniques would improve the application of information as derived from theindicators.
5.3.3 Targets, Baseline and Interpretability
Targets – There are currently few prescriptive targets that relate to the indicators that have beendefined in the Montreal Process. These targets would be determined by the statement ofobjectives for the different indicators, however, without defined objectives it is not possible tosensibly develop targets for the different indicators, for example:
The number of visitors to the region is an important indicator of the health of the local tourismmarket, but if tourism were to double in the region this would result in both benefits anddisbenefits flowing into the region. Benefits such as greater economic sustainability wouldresult, whereas disbenefits might include insufficient infrastructure to support demand (water,hospitals, electricity, etc).
Baseline/Benchmarking – The development of baselines/benchmarks at both a regional andstate level can improve the level of interpretation available from the different indicators. As,using the previous indicator, were visitation to double in this region, but triple in others thismight indicate that the region is not exploiting the market to its full potential.
Interpretability – The development of targets and baselines for the different indicators willimprove their interpretability to decision makers. When the level of interpretation is limited withregards to the proposed indicators their application in decision making processes is alsoconstrained.
5.3.4 Other
Criterion 7 –This study has not investigated the extent to which economic policies and measuressupport the conservation and sustainable management of forests.

Economic and Social Indicators: Southern CRA Region March 2000
54
6. REFERENCES
Comprehensive Regional Assessment Reports
Regional Impact Assessment, UNE CRA Region, 1999.
A Report on Forest Wood Resources for the UNE/LNE CRA Regions, 1999.
Social Assessment Report, Southern CRA, 2000.
Forest Based Industries Development Opportunities, 1999.
Tourism and Recreation Study, Southern CRA, 1999.
Regional Report of Upper North New South Wales, Socio-economic attributes, 1996
Regional Economic Impact Assessment for the Tumut RFA Sub-Division, 1999
Regional Economic Impact Assessment for the Southern RFA Region, 1999
Sawmill Survey Southern Region CRA 1999
Other References
A Framework of Regional (sub-national) Level Criteria and Indicators of Sustainable ForestManagement in Australia, 1998.
Australian-Leisure-Institute, (1993) Developing performance indicators: proceedings: a seminarconducted on the 4th June 1993 at the Australian Institute of Management.
Baker T, (1995) Key Performance Indicators Manual: A Practical Guide for the Best PracticeDevelopment Implementation and Use of KPIs. Pitman; South Melbourne
Biosis Research and The Grocor Group, (1998) Performance Indicators for the NSW NationalParks and Wildlife Service.
Commonwealth of Australia, (1998) A framework of regional (sub-national) level criteria andindicators of sustainable forest management in Australia. Commonwealth of Australia:Canberra
Department of Primary Industries and Energy (1998) Montreal process web site.www.affa.gov.au/agfor/forests/montreal/

March 2000 Economic and Social Indicators: Southern CRA Region
55
Department of Treasury and Finance, (1996) A Guide to Output Specification and PerformanceMeasurement.
Doolan B, Clare V and Saunders R, (1998) ‘Searching for Measures of Choice in Public LandRecreation’. IFPRA 18th World Congress/ 1st National Conference Parks and Leisure AustraliaConference Proceedings. PLA: Australia.
Engel C, (1994) ‘Performance Indicators in a Critical Sense – Do They Work?’Performance Information and the Management Cycle workshop proceedings 6 & 7 December1994.
Graefe AR, Kuss FR and Vaske (1990) Visitor Impact Management: The Planning Framework.Volume 2. National Parks and Conservation Association. Washington DC.
KPMG, (1997) Department of Natural Resources and Environment Purchaser/ProviderPerformance Management Framework for Parks Victoria; Overview
Lipscombe N (1993) ‘Recreation planning: where have all the frameworks gone?’ Proceedingsof Royal Australian Institute of Parks and Recreation National Conference Cairns September1993.
Loomis and Graefe (1992) Visitor Impact Management. The Planning Framework. VolumeTwo. National Parks and Conservation Association: Canada.
Manidis Roberts Consultants (1996) Tourism Optimisation Management Model for KangarooIsland, a model to monitor and manage tourism. South Australian Tourism Commission:Adelaide.
McArthur S, (1997) ‘Introducing a new, politically sensitive approach to monitoring andmanaging tourism’. Tread Lightly on the World, 1997 Tread Lightly Conference Proceedings,Tread Lightly Australia pp1-9.
National Parks Service (1996) ANZECC Benchmarking and Best Practice Program. NationalData Standards on Protected Areas Visitation. NPS, Victoria.
Roger James and Associates (1996) A Pilot Study Investigating Visitor Satisfaction at SelectedNational Parks. Volume I – Main Report
Stankey GH, Cole DN, Lucas RC, Petersen ME, Frissell SS, (1985) The Limits of AcceptableChange (LAC) System for Wilderness Planning, USDA Forest Service General TechnicalReport INT-76. Intermountain Forest and Range Experiment Station: Ogden.
Winston (1994) ‘Performance Indicators – Purpose and Meaning: An Integral Part ofPerformance Management’. AIC Conference Paper, Sydney.
Wyatt T, (1994) ‘Developing Performance Indicators to Improve quality Performance ineducation’. Performance Information and the Management Cycle workshop proceedings – 6 &7 December 1994, Sydney

Economic and Social Indicators: Southern CRA Region March 2000
56
7. ABBREVIATIONSUSED IN THIS REPORT
ABARE Australian Bureau of Agricultural and Resource EconomicsABS Australian Bureau of StatisticsAFFA Agriculture, Fisheries Forestry – AustraliaBTR Bureau of Tourism ResearchCRA Comprehensive Regional AssessmentDA Development ApplicationDUAP NSW Department of Urban Affairs and PlanningESFM Ecologically Sustainable Forest ManagementFPA Forest Products AssociationGIS Geographical Information SystemIVS International Visitor SurveyLEP Local Environmental PlanLGA Local Government AreaMIG Montreal Process Implementation GroupNSW NPWS NSW National Parks and Wildlife ServiceNVS National Visitor SurveyRACD Resource and Conservation Division of DUAPREP Regional Environmental PlanRFA Regional Forest AgreementSFNSW State Forests of New South WalesSHI State Heritage Inventory