Economic and Investment Outlook… · Economic and Investment Outlook Second Quarter 2018 The views...
35
Economic and Investment Outlook Second Quarter 2018 The views presented in this document are those of the Geneva Capital Management Investment Team at the time of writing and may not be reflective of views any time thereafter.
Transcript of Economic and Investment Outlook… · Economic and Investment Outlook Second Quarter 2018 The views...

Economic and Investment Outlook Second Quarter 2018
The views presented in this document are those of the Geneva Capital Management
Investment Team at the time of writing and may not be reflective of views any time thereafter.

1
Economic Outlook
Economic data continues to show improvement, not only domestically
but also globally, as evidenced by 4% Y/Y growth in global industrial
production, global manufacturing PMIs close to multi-year highs and
average unemployment across advanced economies at the lowest
levels since 1990. The U.S. economy continues to expand at a solid
pace (4th Q 2017 RGDP: 2.90%, 2017: 2.60%), and although it is still
early, the recently enacted Tax Cuts and Jobs Act of 2017 should
drive further expansion. An impressive number of American
corporations have used the proceeds from the tax bill to raise
employee wages, increase capital expenditures, raise dividends or
establish stock buyback programs. One of the most significant
features of the tax bill allows for the full and immediate expensing of
CapEx spending which is leading to a plethora of new projects and
capital spending.
Even though the direct impact of deregulation is difficult to measure,
the expectation for less regulation is becoming a self-fulfilling
prophecy in that it is translating into higher consumer and business
spending. This is observed in the multi-year highs in indices
measuring consumer sentiment, CEO confidence and small business
optimism. Since the recession, business owners and executives have
been cautious and CapEx investments have mostly gone towards
maintenance, barely keeping up with depreciation rates, and thus
impacting growth investment. Some may argue that demand in the
economy has been depressed, making growth investments
unnecessary. However, this only looks at one side of the equation as
supply-based capital investments, which due to the aforementioned
full write-off provisions become a more attractive use of cash, have a
multiplier effect on the economy, creating jobs and raising purchasing
power and consumption.
As it relates to the consumer, auto sales have plateaued at a 12.9M
annualized rate (domestic production) while housing starts have
edged lower to a 1.36M rate in February (-4.0% y/y) with permits at
1.30M, suggesting these growth rates will be maintained. A lack of
supply is negatively impacting growth and our forecast of 1.24M is in-
line with current conditions. Keep in mind that housing starts peaked in
2006 at 2.6M units, so we are well below peak production and likely to
remain so as labor shortages, tight inventory, soaring lumber prices,
home price appreciation and rising mortgage rates constraint this
critical industry. Over the next few years, however, growth rates in the
industry should be supported by demographics, specifically as
Millennials age we should see acceleration in household formation.
Another dynamic worth discussing is the labor market and its impact
on wage inflation. Just like CapEx, since the recession we have seen
muted wage growth. Even now that the unemployment rate is sitting at
cycle lows of 4.1%, average hourly earnings are still expanding at only
a 2.60% rate. This has allowed corporate profit margins to expand
from recession lows of ~7% to current levels of ~10% (S&P 500
margins). As this has happened, the ratio of corporate profits/GDP has
expanded from ~46% to over 50%, while the ratio of personal
wages/GDP has contracted from ~4% to just over 2%. We believe this
has reached unsustainable levels as workers will start demanding a
larger piece of the pie.
Continued on next page
Geneva Capital Management LLC is a subsidiary of Janus Henderson Group plc and serves as
investment adviser on certain products.
Janus Henderson is a trademark of Janus Henderson Investors. © Janus Henderson Investors. The name Janus Henderson
Investors includes HGI Group Limited, Henderson Global Investors (Brand Management) Sarl and Janus International Holding LLC.

2
Economic Outlook
This is not only supported by the timing of the cycle and the
diminishing returns of margin expansion at the expense of labor
costs, but also by tax reform, as competitive markets lead companies
to share a portion of tax savings with employees. Nonetheless, it will
take time for these dynamics to manifest in reported numbers as
inflation statistics show little change over the past twelve months with
the consumer core CPI running 1.80% y/y. With this in mind, although
with a positive bias, our initial 2018 headline CPI inflation forecast
remains in place at 2.60%.
A gradual improvement in CapEx investments and personal income
will be the main drivers of an elongation of this economic cycle.
Additionally, a more supportive stance from government spending,
which includes fiscal stimulus from the passage of the Bipartisan
Budget Act of 2018, means that the top three variables of GDP
growth (consumption, investment and government spending) will be
growing at the same or higher rates for a longer period of time. This
outlays our expectations for the direction of the U.S economy, but just
as important in determining sustainability is the magnitude of these
improvements. If the economy overheats there is a relatively high risk
of seeing a more aggressive Federal Reserve (Fed), leading to a
faster pace of interest rate increases. We believe this is unlikely as
there are some supply-side variables that will work as governing
factors on the magnitude of growth, in particular labor shortages in
important sectors of the economy such as housing and transportation.
This is in addition to the secular disinflationary pressures from
technology, particularly as innovation in automating technologies
continues to advance. As discussed in our last quarterly EIO, despite
the length of the recovery being one of the longest on record, the
same is not true for the magnitude of the recovery. For the
aforementioned reasons, we believe this environment is conducive to
a Goldilocks scenario of solid economic growth for longer.
Evaluating all of these variables and considering the lag until the
above-mentioned positive dynamics manifest in reported economic
numbers, our prior forecast for +2.60% RGDP growth in 2018
remains appropriate.
This is not to say there are not significant risks to this view, such as
an escalation of trade tensions between the U.S and its trading
partners. Although, the economic implications thus far are less severe
than the media would portray, the market volatility is reflecting the
concern of further U.S. restrictions on imports. Additionally, potential
penalties placed on China as a result of the ongoing investigation into
this country’s intellectual property practices, if severe, could lead to
retaliation and the start of a trade war.
Another source of risk is monetary policy divergence of major central
banks around the world. Recent improvements observed in the
economic data out of the EU and Japan, as well as the BoE path
towards monetary policy normalization, has allowed the Fed to
continue raising rates without causing appreciation in the U.S. dollar.
This is the opposite of what happened in 2015, when the ECB and
BOJ were easing at full strength, while the Fed was already on a
hiking path. This divergence caused the U.S. dollar to strengthen
against most currencies around the world, shocking many export-
based economies, in particular emerging markets. Despite a likely
end to its net asset purchases by the end of 2018, the ECB has
indicated caution in recent statements, expressing concerns about the
strength of the euro. It seems both the ECB and the BOJ are taking a
view of only raising rates until realized inflation, not projected inflation,
increases to their 2% target. If inflation data does not improve in the
EU and Japan, and it does in the U.S., it is worth looking out for a
repeat of what happened in 2015.
The views expressed are those of the portfolio managers and do not necessarily reflect the views of others in Janus Henderson's
organization. They are subject to change, and no forecasts can be guaranteed. The comments may not be relied upon as
recommendations, investment advice or an indication of trading intent.

3
Economic Outlook
Longer-term
While once in a generation tax cuts can foster enthusiasm for
accelerating economic growth, we try and exercise pragmatism in
formulating our longer-term GDP forecast. There are a plethora of
variables and exogenous factors which could impede growth, which is
why our team weighs the risks against the opportunities, analyzes
demographic and geographical economic trends and discusses the
health of the world’s largest economies and our trading partners. As we
gaze into our crystal ball, we conclude U.S. GDP growth will accelerate
driven by improving earnings at corporations, the initiation of a new
corporate CapEx cycle and an increasingly confident consumer, whom
may spend differently, but is spending nonetheless. In addition, initial
budget estimates for the U.S. government call for increased spending
nearly across the board, creating a fiscal tailwind in the forthcoming
years. While many are concerned with rising inflation, which we do
believe will transpire, we believe the probability is low in repeating the
type of inflation we endured during the 1970’s, due to global
competition and the disinflationary nature of technological change.
Modest inflation is healthy as it gives the economy some cushion to
avoid deflation, to which there is no antidote. Modest inflation will also
give a lift to interest rates, which will benefit those who save and
penalize those who have been profligate spenders. This will force the
government to address the rising imbalance between its assets and
liabilities and could instill a modicum of confidence in the citizens and
business owners that the U.S. will be able to service its long-term
obligations, which will have positive implications for our currency and
spending power.
Our largest trading partner, Europe, will continue to expand its
economy, but we believe the pace of acceleration will slow and the
second derivative will become stagnant as demographic and
immigration challenges befuddle politicians and mute growth. Offsetting
these impediments is structural change occurring in countries notorious
for onerous labor laws and unfriendly business environments. As the
largest economic bloc, healthy countries and companies in the
Eurozone tend to be supportive for global growth. In following the
theme of structural reforms, Japan’s reforms do appear to be creating
the foundation for sustainable inflation. Japan’s two decade recovery
from the boom of the 1980’s is a lesson of how difficult it is to achieve
escape velocity from deflationary forces. The wildcard in analyzing the
potential of our largest trading partners (and thus the largest
economies) is China and the battle lines drawn by President Trump
and President Xi in a potential trade war. Should a trade war escalate,
numerous industries and end markets will be impacted and our
forecast will need to be revisited. But, given the multi-year deceleration
in China’s economic growth and the fiscal profligateness of their
infrastructure spending in the 2000’s now manifesting in unhealthy
corporate balance sheets, a trade war and its associated impacts
would certainly be unwelcome. While growth has slowed, China is still
one of the fastest growing economies in the world and when combined
with other emerging economies, whose outlook is stable due to a
rebound in commodity prices, we feel comfortable with the health of the
developing world. Therefore, we are anticipating accelerating growth
for the U.S. from its current 2.3-2.5% to 2.5-3.0% into 2020. If the U.S.
can get its fiscal house in reasonable order (similar to the way
corporations have termed out their debt and improved their credit
metrics), we could envision the economy reaching even 3.5% on the
occasional quarter and seeing the cycle extend beyond 2020,which
would certainly be favorable for equity investors.
4
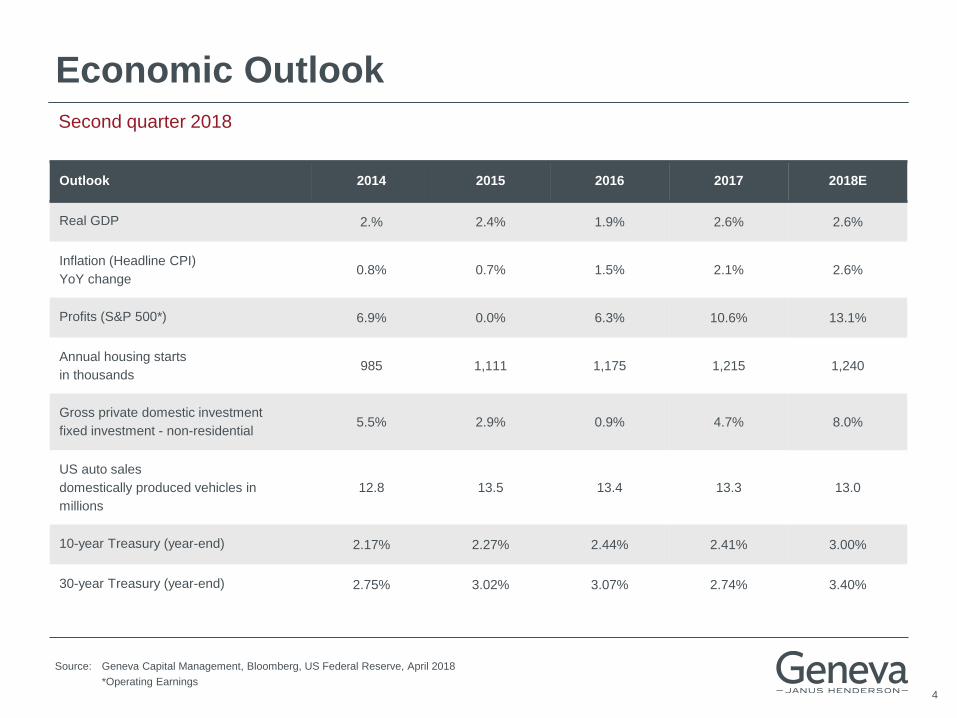
Economic Outlook
Second quarter 2018
Outlook 2014 2015 2016 2017 2018E
Real GDP 2.% 2.4% 1.9% 2.6% 2.6%
Inflation (Headline CPI)
YoY change 0.8% 0.7% 1.5% 2.1% 2.6%
Profits (S&P 500*) 6.9% 0.0% 6.3% 10.6% 13.1%
Annual housing starts
in thousands 985 1,111 1,175 1,215 1,240
Gross private domestic investment
fixed investment - non-residential 5.5% 2.9% 0.9% 4.7% 8.0%
US auto sales
domestically produced vehicles in
millions
12.8 13.5 13.4 13.3 13.0
10-year Treasury (year-end) 2.17% 2.27% 2.44% 2.41% 3.00%
30-year Treasury (year-end) 2.75% 3.02% 3.07% 2.74% 3.40%
Source: Geneva Capital Management, Bloomberg, US Federal Reserve, April 2018
*Operating Earnings
5 5
-10%
0%
10%
20%
30%
40%
50%
60%
1 6 11 16 21 26 31 36 41
4Q48
2Q53
3Q57
2Q60
4Q69
4Q73
1Q80
3Q81
3Q90
1Q01
4Q07
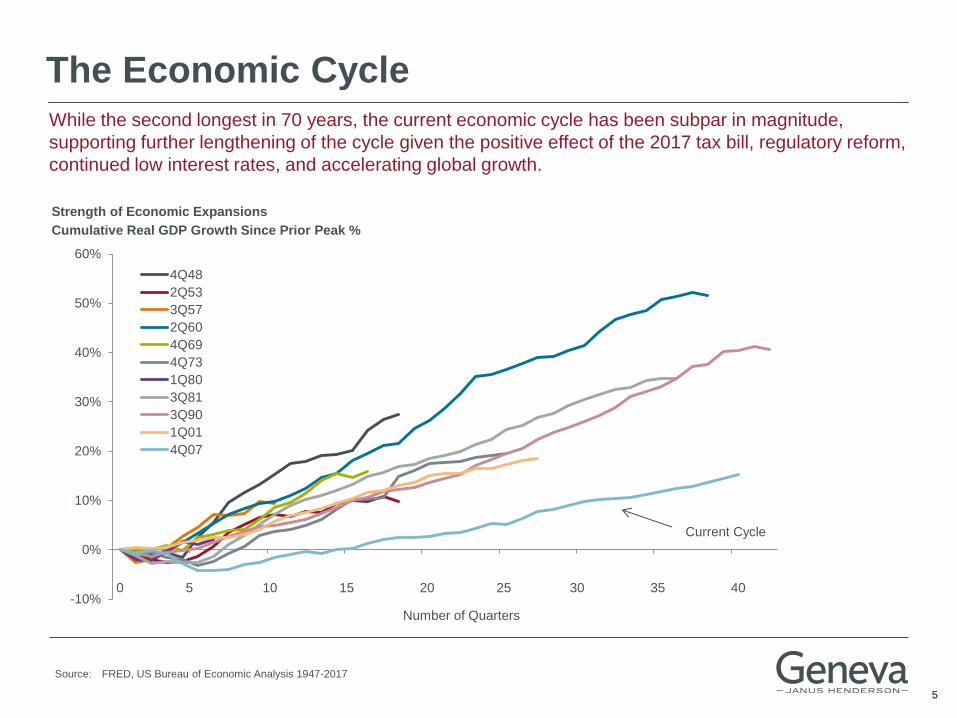
The Economic Cycle
Current Cycle
While the second longest in 70 years, the current economic cycle has been subpar in magnitude,
supporting further lengthening of the cycle given the positive effect of the 2017 tax bill, regulatory reform,
continued low interest rates, and accelerating global growth.
Source: FRED, US Bureau of Economic Analysis 1947-2017
Number of Quarters
Strength of Economic Expansions
Cumulative Real GDP Growth Since Prior Peak %
0 5 10 15 20 25 30 35 40

6 6
0%
5%
10%
15%
20%
25%
30%
00 02 04 06 08 10 12 14 16 18
62%
63%
64%
65%
66%
67%
68%
00 02 04 06 08 10 12 14 16 18
The Labor Force
Finding qualified employees is one of the biggest concerns of US employers.
Source: Bloomberg, as of 3/2018
US Labor Force Participation Rate: All Workers NFIB Small Business Single Most Important Problem
Percent Reporting Quality of Labor
Calendar Year Calendar Year

7 7
34%
36%
38%
40%
42%
44%
03 04 05 06 07 08 09 10 11 12 13 14 15 16 17 18 19
26%
27%
28%
29%
30%
31%
32%
Drivers of Household Formation
Millennials hitting milestones in life (home purchases, children, etc.) may extend the economic cycle.
Source: FRED, US Bureau of Economic Analysis, as of 3/2018
US Percentage of Young Adults (18-34) Living at Home
US Homeownership Rate Under 35
Calendar Year

8
-3%
-2%
-1%
0%
1%
2%
3%
4%
5%
6%
2000 2005 2010 2015
Inflation
Inflation remains benign despite higher wage and transportation costs.
% Change – Year to Year (Seasonally Adjusted, 1982-84=100)
Source: Bloomberg, as of 3/2018
CPI Urban Consumer SA CPI Urban Consumer Less Food and Energy SA

9 9
-30%
-20%
-10%
0%
10%
20%
30%
40%
50%
-6%
-4%
-2%
0%
2%
4%
6%
8%
10%
2011 2012 2013 2014 2015 2016 2017 2018
Inflation
Robust Spot Pricing Growth Supports +5-10% y/y Contractual
Truckload Pricing Growth in 2018
Source: Bloomberg, as of 3/2018, Internet Truckstop, Robert W. Baird estimates
Gro
wth
(%
yo
y)
Core Contractual Truckload Pricing Growth (L)
Van Spot Pricing (ex-fsc) Growth, 4-wk MA (R)
Van Spot Pricing (ex-fsc) Growth, 13-wk MA (R)
1.4
1.8
2.2
2.6
3.0
2011 2012 2013 2014 2015 2016 2017 2018
Longer term inflation concerns mount as wage and transportation cost trends are putting upward
pressure on the 2018-2019 inflation outlook.
Gro
wth
(%
yo
y)
Average Hourly Earnings: Total Private Industries
% Change - Year to Year (SA, $/hour)

10
Capital Spending, Capacity Utilization, Productivity
Non-Residential Fixed Investment (SAAR, $BN) vs. Non-Residential Fixed Investment Trend
Due to multi-year highs in indices measuring CEO and small business optimism, in addition to the 100%
write-off of CapEx spending, our forecast for gross private domestic fixed investment (non-residential)
has increased to +8% for 2018, versus +5% in 2017.
Source: Bloomberg, as of 2/2018
$-
$1,000
$2,000
$3,000
$4,000
$5,000
1947 1952 1957 1962 1967 1972 1977 1982 1987 1992 1997 2002 2007 2012 2017
Actual
Trend
11 11
-1%
0%
1%
2%
3%
4%
5%
1990 1995 2000 2005 2010 2015
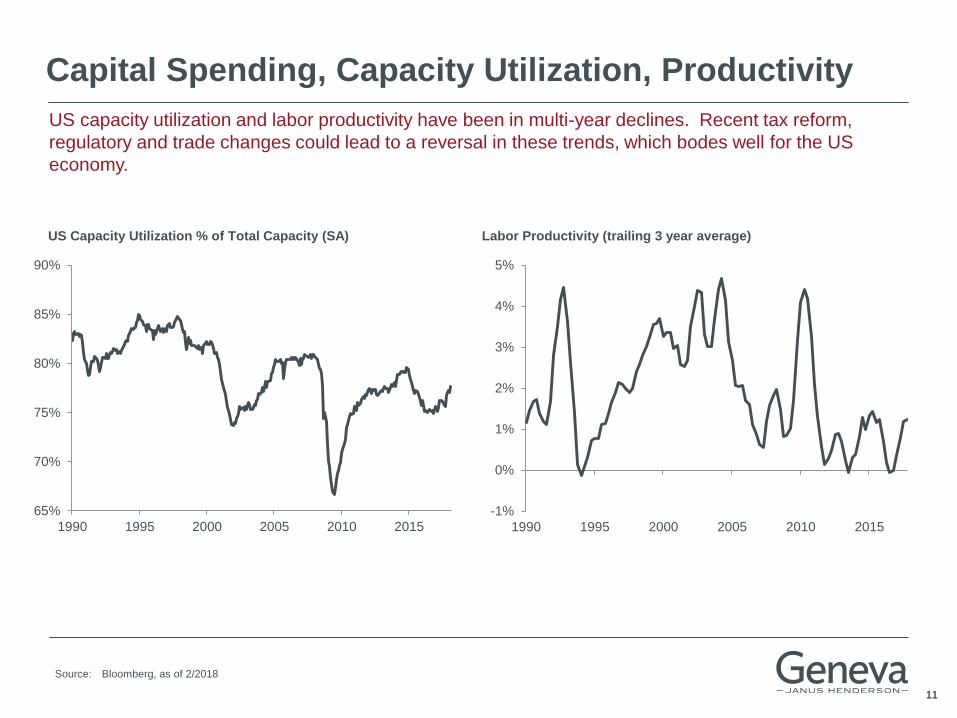
Capital Spending, Capacity Utilization, Productivity
Labor Productivity (trailing 3 year average)
US capacity utilization and labor productivity have been in multi-year declines. Recent tax reform,
regulatory and trade changes could lead to a reversal in these trends, which bodes well for the US
economy.
Source: Bloomberg, as of 2/2018
US Capacity Utilization % of Total Capacity (SA)
65%
70%
75%
80%
85%
90%
1990 1995 2000 2005 2010 2015

12 12
0.75
1.5
3
6
12
24
-3
2
7
12
17
22
1977 1982 1987 1992 1997 2002 2007 2012 2017 2022
Interest Rates
Core inflation trends play a large role in the Fed’s policy reaction function. With core inflation currently
running at 2.1% y/y, the Fed likely increases rates 3-4 times this year.
Official Rates and Core Inflation Trends are Strongly Correlated Across Time
Source: Federal Reserve Economic Data
Fed Funds Rate (L) U.S. Core CPI (R)
13 13
-300
-200
-100
0
100
200
300
400
1977 1982 1987 1992 1997 2002 2007 2012 2017
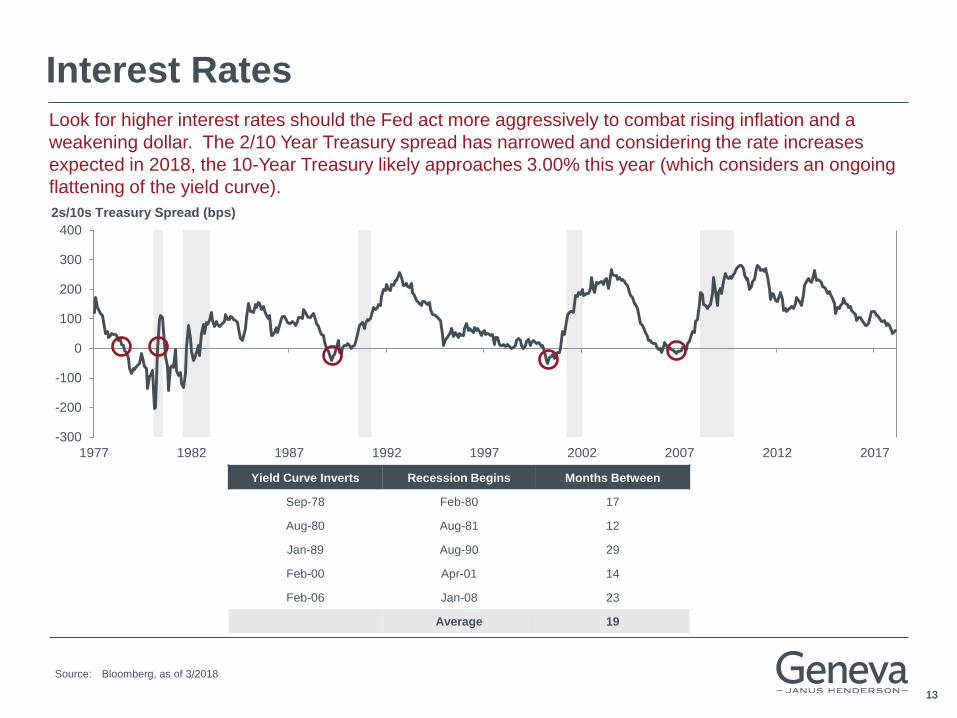
Interest Rates Look for higher interest rates should the Fed act more aggressively to combat rising inflation and a
weakening dollar. The 2/10 Year Treasury spread has narrowed and considering the rate increases
expected in 2018, the 10-Year Treasury likely approaches 3.00% this year (which considers an ongoing
flattening of the yield curve).
Source: Bloomberg, as of 3/2018
2s/10s Treasury Spread (bps)
Yield Curve Inverts Recession Begins Months Between
Sep-78 Feb-80 17
Aug-80 Aug-81 12
Jan-89 Aug-90 29
Feb-00 Apr-01 14
Feb-06 Jan-08 23
Average 19

14 14
If the first quarter is any indication as to what investors should expect
for 2018, then continued turbulence should be the base case.
Following 2017, which was a year comprised of low volatility coupled
with some of the highest returns in recent memory, 2018 thus far is a
reminder that investing involves risk and markets inevitably correct. In
early February, fear jolted equity markets and sent the VIX from its
2017 range of 10-12 to over 35 in a matter of hours. Investor’s feared
inflation was finally starting to manifest and the Fed would be forced to
raise rates more quickly than anticipated, which resulted in markets
tumbling over 10% in two weeks (S&P500). Markets oscillated over the
remaining half of the quarter ending slightly ahead of the February 8th
lows. Investors had to weigh positives, such as strong economic
growth and strong employment figures, against a backdrop of Fed rate
increases, a possible trade war with China and growing concern over
the FANG stocks. What we believe was clear through this period of
uncertainty is the importance of investing in high quality companies,
whom on average outperformed the market, and was a good reminder
that abnormally low volatility can’t last forever.
The first quarter was a favorable period for high quality growth with B+
or better rated companies (high quality) outperforming B or worse rated
companies (low quality) by 0.78%. Within the Russell Mid Cap Growth
Index, low beta outperformed high beta by over 3%, high growth
companies outperformed low growth. Within the Russell 2000 Growth
Index; low beta companies returned 3.2% versus -1.4% for high beta
companies – both of these Index stats indicate a positive tilt towards
high quality. Also providing a tailwind to high quality was the recent
economic data showing a strengthening U.S. economy, supporting
expectations that the Fed will continue to raise rates in 2018. We
believe all this points to a conducive market for active managers and
an even more attractive environment for high quality active managers.
For the quarter ended March 31, 2018 the Geneva U.S. Mid Cap
Growth strategy model returned 4.49% (gross of fees) versus 2.17%
for the Russell Mid Cap Growth Index, outperforming by 2.32%. The
outperformance was broad based and the strategy outperformed the
benchmark in nearly every sector. The top three contributing sectors
were producer durables, health care and technology which contributed
66bps, 60bps and 56bps, respectively. The strong performance in the
producer durables sector was the result of strong performance in
holdings such as CoStar Group, Copart and National Instruments. The
strong health care performance stemmed from our overweight position
in the sector, as well as strong stock selection. Lastly, the performance
in the technology sector was driven by strong performance in names
such as Red Hat, SS&C Technologies, Tyler and Intuit. At the
individual stock level the top performers were Abiomed, Red Hat and
Broadridge Financial Solutions, which contributed 101bps, 62bps and
50bps, respectively. Abiomed was strong as the company
preannounced exceptional results early in the quarter, followed by a
strong February report detailing 34% y/y revenue growth, a large
opportunity for further market penetration (currently less than 10%
penetrated) and impressive data supporting the effectiveness of the
Impella device. Red Hat reported an earnings beat late in December
and that momentum carried over into the first quarter. The company
beat on both the top and bottom line, highlighted by strength in the
RHEL business as well as emerging products, which grew 40% y/y.
The company’s focus on providing enterprise level support for open-
source software has them well positioned to benefit as companies
upgrade their IT and move to the cloud. Broadridge returned over 21%
on a better than expected earnings report and strength in the firm’s
event driven business.
Continued on next page
Investment Outlook
As of 3/31/18, Geneva US Mid Cap Growth strategy held 2.62% in Costar Group, Inc., 2.17% in Copart, Inc., 1.42% in National Instruments
Corp., 3.04% in Red Hat, Inc., 1.89% in SS&C Technologies, Inc., 2.47% in Tyler Technologies, Inc., 2.44% in Intuit, 2.61% in Abiomed,
Inc., and 2.74% in Broadridge Financial Solutions.
15 15
Detracting from performance at the sector level was consumer staples, which detracted 7bps from performance due to stock selection within the sector. At the individual stock level, the three greatest detractors were Dentsply Sirona, Beacon Roofing Supply and Cerner Corp which detracted 40bps, 28bps and 27bps from performance, respectively. Dentsply Sirona performance was weak as a slowdown in organic growth coupled with turnover in the management team pressured shares. Beacon Roofing was down over 15% but that was after seeing shares of the company increase roughly 65% in the prior four months. The company reported a mixed quarter in February with a strong revenue number, much of that due to reroofing as a result of hurricanes, but weakness in gross margins gave investors pause. Also detracting from performance were shares in Cerner which were down nearly 14% after the company reported disappointing results and lowered 2018 guidance due to a delay in a potential VA contract.
For the quarter ended March 31, 2018, the Geneva U.S. Small Cap Growth strategy model returned 5.89% (gross of fess) versus 2.28% for the Russell 2000 Growth Index, outperforming by 3.59%. Much like the Mid Cap Growth strategy, the outperformance was broad based with nearly every sector contributing to performance on the back of strong stock selection and a tailwind from a high quality market. At the sector level the top three contributors were health care, financial services and consumer discretionary which contributed 1.48%, 0.89% and 0.44%, respectively. The strong performance within the health care sector was due to excellent stock selection in the medical & dental instruments & supplies industry; the strategy is overweight this industry and the companies we own returned twice that of the benchmark which drove strong performance. At the stock level the top three contributors were Abiomed, Paycom Software and Tyler Technologies, who contributed 133bps, 77bps and 50bps, respectively. Abiomed was strong as the company preannounced exceptional results early in the quarter then then followed through in February by detailing 34% y/y revenue growth, a large opportunity for further market penetration (currently less than 10% penetrated) and impressive data supporting
the effectiveness of the Impella device. Paycom Software was strong on the back of another very impressive earnings report; the company beat on both the top and bottom line and continues to drive strong double-digit revenue growth. Shares of Tyler Technologies were solid even with reporting mixed earnings results. Despite an earnings beat, the company missed the top line expectations due to more customers selecting a SaaS delivery rather than on premise license, which in the short-term can be a headwind to revenue but is more profitable over the long-term. At a sector level, the only detractor from performance was consumer staples, which cost the strategy 2bps. At the stock level, the greatest detractors were Healthcare Services Group, Beacon Roofing Supply, and Natus Medical, which detracted 41bps, 30bps and 26bps, respectively. Healthcare services group was weak after reporting a mixed quarter; the company beat on the top line but missed on the bottom line and investors focused in on the DSO remaining elevated. Beacon Roofing was down over 15% but that was after seeing shares of the company increase roughly 65% in the prior four months. The company reported a mixed quarter in February with a strong revenue number, much of that due to reroofing as a result of hurricanes, but weakness in gross margins gave investors pause. Natus Medical reported a 10% top-line miss due to a slowdown in the Neurodiagnostic segment. The company also announced a reinvestment into new products, which is going to pressure margins and earnings. Lastly, management guided for 2% organic revenue growth in 2018, which was below investor expectations.
Looking towards the rest of the year, one of the interesting dynamics about the recently enacted Tax and Jobs Act is the competitive ramifications and the incentives it creates for management teams. At this point, it is fairly straight forward to calculate the tax savings that corporations will enjoy in the years to come. The challenge lies in figuring out the allocation of those savings to different stakeholders, such as to customers in the form of lower prices, employees in the form of higher wages, and shareholders in the form of higher cash flows and capital distributions as dividends or buybacks.
Investment Outlook
As of 3/31/18, Geneva US Mid Cap Growth strategy held 1.28% in Dentsply Sirona, Inc., 1.44% in Beacon Roofing Supply, Inc., and 1.67% in
Cerner Corp.. As of 3/31/18 Geneva US Small Cap Growth strategy held 2.71% in Abiomed, Inc., 2.92% in Paycom Software, Inc., 2.91% in
Tyler Technologies, Inc., 1.88% in Healthcare Services Group, Inc., 1.39% in Beacon Roofing Supply, Inc., and 0.71% in Nautilus, Inc.
16 16
Despite a peak in operating margins, we believe companies should experience a pickup in top line growth, which combined with lower taxes should translate into higher earnings growth in 2018. Beyond 2018, the second derivative of this earnings growth should decelerate optically as the impact from lower taxes laps over; however, the underpinnings for an acceleration in operating income growth in the forthcoming years are in place. This will vary company by company, as higher quality companies with stronger competitive advantages and returns on invested capital enjoy a higher level of discretion over how those dollars get distributed.
We do see upward pressure on inflation but not enough to derail the economy or pressure multiples. With inflation running below 2.5%, this should provide a nice boost to personal incomes and allow companies to pass through prices without negative implications on volume. As far as what higher interest rates mean for market multiples, a similar dynamic is in place – a moderate increase in interest rates is a positive economic indicator and, up to a point (which we will not see for a few more years), are positively correlated with stock valuation levels. There are two instances over the last two decades that support this argument. From the middle of 2004 through the middle of 2006, a two-year span in which the Fed raised rates from 1.25% to 5.25%, the stock market appreciated at a 10% annualized rate. Again in 1994, when the Fed aggressively increased interest rates, moving from 3% to 6% in only 15 months. That same year the S&P declined 1.5%, only to experience one of the strongest bull markets in history, with 23.5% annualized returns over the following six years.
At its core, the U.S. economy looks strong and the aforementioned tax cut should provide a tailwind to what was already a good economic backdrop. Investors have a never-ending litany of reasons to be pessimistic: trade war with China, central bank missteps, mid-term elections, and general geopolitical unrest, but concerns with such factors have always persisted, and investors need to remain focused on the fundamentals. As volatility persists and the Fed continues raising rates we believe, it will be a good environment for active managers, and in particular high quality active managers.
Continued on next page
Investment Outlook

17 17
Investment Outlook
Longer-term
Mark Twain once said, “The rumors of my death have been greatly
exaggerated,” in response to his obituary being published in a U.S.
paper whilst he took ill in London. As we read financial publications and
listen to the commentators on CNBC, we feel one could say the same
about this bull market; its demise has been greatly exaggerated. We
have held steadfast with our forecast, as ridiculous as it sounded when
we wrote in 2015, that we would approach 3000 on the S&P in 2017-
2018 and usurp that level in 2019. This forecast was predicated on
multiples remaining extended beyond historical averages due to lack of
“cheaper” investment alternatives and continued growth in global
economies, assisted by persistently low interest rates. While rates have
begun to move higher, our forecast was aided last year by the passing
of the largest corporate and individual tax cut in decades, which when
combined with U.S. Government fiscal stimulus and coordinated global
growth, creates upward pressure on equities.
From a style perspective, during a period of rising rates and less central
bank accommodation, we believe quality will outperform, as we
experienced in Q1 2018. Fundamentals do matter and those companies
that have been disciplined with their balance sheets and capital
deployment should be in a position to expand capacity and invest in
their businesses supporting a multi-year period of growth. One limiting
factor to economic growth in the U.S. is the availability of
quality/qualified workers. Business owners with creativity are beginning
to proactively approach high schools and target students who have a
strong work ethic but don’t necessarily want to go to college and accrue
all of its associated debts. Efficient markets tend to find a way to
alleviate structural impediments over time, but in the short term, labor
supply is a factor to consider. This might have negative short term
implications for margins, but long term benefits accruing to employee’s
income and aggregate demand levels. We are also watching the recent
trade developments intently as a trade war would certainly force us to
revisit our market outlook. However, assuming cooler heads prevail,
we continue to be constructive on the markets into 2020 when the next
major election cycle creates an element of uncertainty which is
impossible to predict, concurrent with a bulbous of corporate debt
maturities, which will force companies to refinance into a potentially
higher rate environment.
Stock ratings are provided by Standard & Poor’s and Bank of America Merrill Lynch U.S. Quantitative Strategy. Stock
rankings are assigned to all U.S. equity securities, which have the required 10 years of earnings and dividend history as
required by Standard & Poor’s.
Index returns illustrated do not include reimbursement of distributions. One cannot invest directly in an index.

18
*These potential returns are based on the projected yields discussed or presented herein. Actual returns may be more or less than projections
Geneva’s forecast of capital markets total returns – 12 months forward
30-day commercial
paper
2-year Treasury
note
10-year Treasury
note
30-year Treasury
note
S&P 500 at 8.5%
EPS growth
12-month return
potential* 2.25% 2.02% 0.87% -2.57% 10.08%
Level on 3/29/18 1.96% 2.27% 2.74% 2.97% 2,641
Source: Geneva Capital Management, Bloomberg, as of 3/2018
Investment Outlook
Second quarter 2018
19 19
8,823
5,235
4,681
500
1,000
1,500
2,000
2,500
3,000
3,500
4,000
4,500
5,000
4,500
5,000
5,500
6,000
6,500
7,000
7,500
8,000
8,500
9,000
9,500
1990 1992 1994 1996 1998 2000 2002 2004 2006 2008 2010 2012 2014 2016
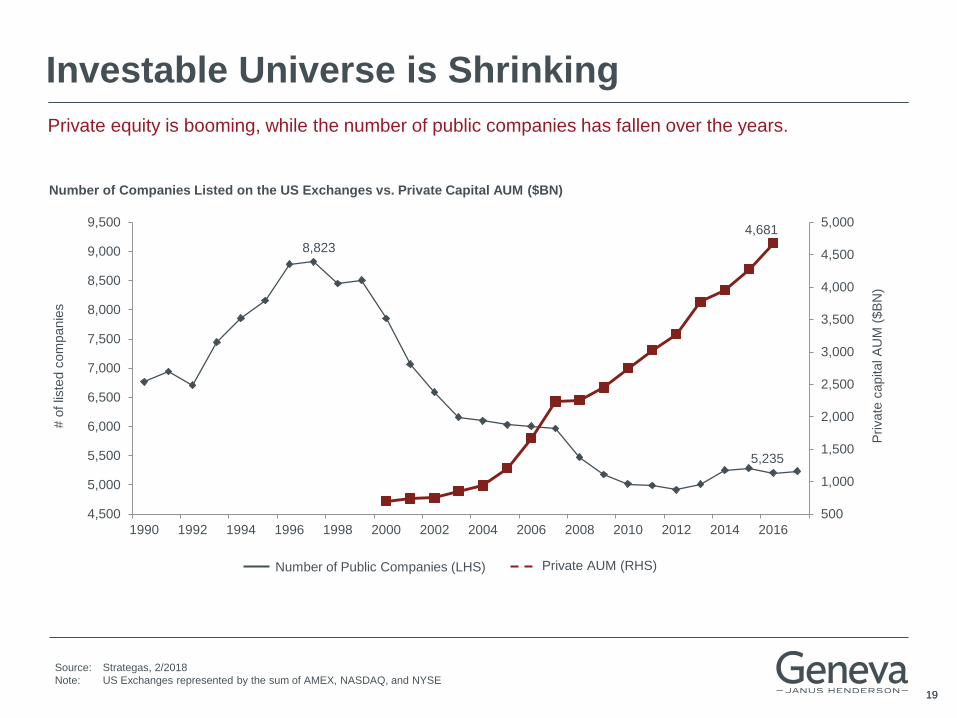
Investable Universe is Shrinking
Number of Companies Listed on the US Exchanges vs. Private Capital AUM ($BN)
# o
f lis
ted c
om
panie
s
Source: Strategas, 2/2018
Note: US Exchanges represented by the sum of AMEX, NASDAQ, and NYSE
Number of Public Companies (LHS) Private AUM (RHS)
Private
capital A
UM
($B
N)
Private equity is booming, while the number of public companies has fallen over the years.

20 20
0
100
200
300
400
500
600
700
20
02
20
03
20
04
20
05
20
06
20
07
20
08
20
09
20
10
20
11
20
12
20
13
20
14
20
15
20
16
20
17
0
500
1,000
1,500
2,000
2,500
20
02
20
03
20
04
20
05
20
06
20
07
20
08
20
09
20
10
20
11
20
12
20
13
20
14
20
15
20
16
20
17
Investable Universe is Shrinking
M&A and aggressive stock buybacks have contributed to a sharply reduced number of publicly-traded
shares in the US stock market.
Sources: Institute for Mergers, Acquisitions and Alliances, 2018
Bloomberg, as of 3/2018
US Mergers and Acquisitions, dollar amount US Buybacks (S&P 500 Index)
$ B
illio
ns
$ B
illio
ns

21 21
Valuation
Average Inflation, Treasury Yields, Valuation and Tax Rates by Decade
CPI Y/Y
% Change
S&P 500
Operating P/E (TTM)
10 Year
Treasury Yield
Dividend
Tax Rate
Capital Gains
Tax Rate
1950s 2.1 12.6 3.0 91.0 25.0
1960s 2.3 18.1 4.7 80.3 25.4
1970s 7.0 12.5 7.5 70.2 36.0
1980s 5.8 11.7 10.6 48.4 23.6
1990s 3.1 19.5 6.7 37.0 26.0
2000s 2.7 20.1 4.5 23.4 16.8
2010s 1.6 17.2 2.4 20.0 20.0
Average 3.5 16.0x 5.6 52.9 24.7
Current 2.1 20.6x 2.7 23.8 23.8
Given historically low levels of inflation, tax rates and interest rates, the current S&P 500 P/E multiple
seems appropriate.
Source: Strategas, 2/2018, Bloomberg, as of 3/2018

22 22
0
50
100
150
0
50
100
150
Valuation
Source: Strategas, as of 3/2018
March 2018
Median NTM P/E = 17.5x
March 2000
Median NTM P/E = 31.0x
Valuation levels of the market leaders are quite constrained versus the 2000 market top.
23 23
90
92
94
96
98
100
102
Jan-17 Feb-17 Mar-17 Apr-17 May-17 Jun-17 Jul-17 Aug-17 Sep-17 Oct-17 Nov-17 Dec-17 Jan-18 Feb-18 Mar-18
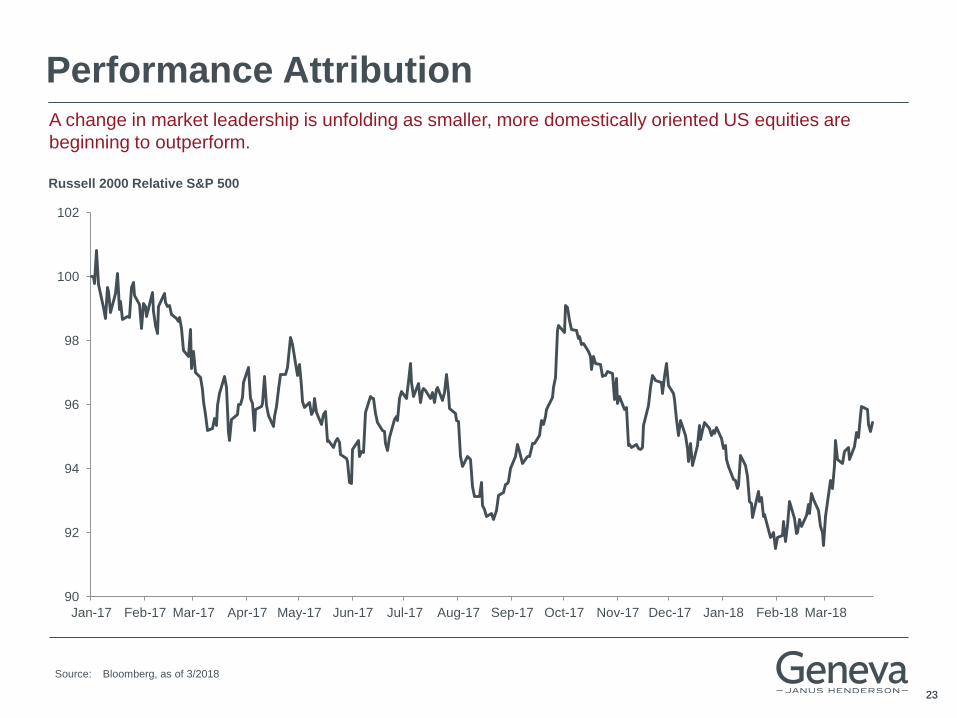
Performance Attribution
Russell 2000 Relative S&P 500
Source: Bloomberg, as of 3/2018
A change in market leadership is unfolding as smaller, more domestically oriented US equities are
beginning to outperform.

24 24
Performance Attribution Quality factors have outperformed over the last year as investors placed greater emphasis on
characteristics like low leverage and high returns on equity. Higher interest rates and inflation provide a
constructive backdrop for quality going forward.
Source: Bloomberg, as of 3/2018
Note: High (Low) factor data represents top (bottom) quintile stocks with highest (lowest) factor values.
Debt factor represents LTM debt/EBITDA and ROE factor represents LTM ROE, based on the Russell 3000 Index constituents.
1 year Quality Factor Performance
-10
-5
0
5
10
15
20
25
Mar-17 Jun-17 Sep-17 Dec-17 Mar-18
1 y
ear
retu
rn (
%)
Low Debt High Debt High ROE Low ROE

25 25
Tax Reform
Sector 5-yr Median
Effective Tax Rate (%)
Sales from
the U.S. (%)
Energy 35 57
Telecommunication Services 33 96
Industrials 32 62
Utilities 31 95
Consumer Discretionary 31 77
Consumer Staples 30 74
Financials 28 78
Materials 27 51
Health Care 26 82
Information Technology 24 41
Tax reform will have disparate effects on various economic sectors.
Source: Compustat, and Goldman Sachs Global Investment Research, as of 3/2018

26 26
Market Outlook We anticipate further appreciation in markets to come primarily from earnings growth as opposed to P/E
expansion. That said, given the current federal funds rate, multiple compression doesn’t seem to be a
significant risk in the near-term.
S&P 500 P/E Ratio vs. the Federal Funds Effective Rate
Source: Bloomberg, as of 3/2018
Note: Chart reflects quarterly data points from 1988 through March 2018 and annual data points from 1968-1987
0
5
10
15
20
25
30
35
0 2 4 6 8 10 12 14 16 18
P/E
US Federal Funds Effective Rate (%)

27 27
450
1215
Dec Mar Jun Sep Dec Mar Jun Sep Dec Mar Jun Sep Dec Mar Jun Sep Dec
-11.04%
-10.29%
Market Outlook
Source: Bloomberg, as of 3/2018
S&P 500 (1995 to 1998) – Log scale
-13.00%
-21.05% -13.84%
S&P 500 Daily Returns 50 Day Average 200 Day Average
We view the 2018/2019 market outlook as more similar to 1996-1998 than 2000.
1995 was an extremely
low volatility year
(similar to 2017)
There were 3 corrections of
greater than 10% in 1996 and
1997; each time the S&P 500
found support near the 200-
day moving average
The second correction
in 1997 (down 10% in
just 14 trading days) led
to volatile price action in
the following 4 months
1998 saw a sharp
correction that rapidly
exceeded 20%
1995 1996 1997 1998
500
600
700
800
900
1,000
1,200
1995 1996 1997 1998

28 28
Annual Disclosure Presentation
Page 1 of 3
US Small Cap Growth
Compliance Statement
Geneva Capital Management claims compliance with the Global Investment Performance Standards (GIPS®) and has prepared and presented this report in compliance with the
GIPS standards. Geneva Capital Management has been independently verified for the periods January 1, 1993 through December 31, 2017.
Verification assesses whether (1) the firm has complied with all the composite construction requirements of the GIPS standards on a firm-wide basis and (2) the firm's policies and
procedures are designed to calculate and present performance in compliance with the GIPS standards. The US Small Cap Growth composite has been examined for the periods
January 1, 1999 through December 31, 2017. The verification and performance examination reports are available upon request.
The Firm
Geneva Capital Management (formerly known as Henderson Geneva Capital Management) is a registered investment adviser and a wholly owned subsidiary of Janus Henderson
Group. On October 1, 2014 Henderson Global Investors Inc. acquired Geneva Capital Management LLC, and subsequently merged with Janus Capital Group Inc. on May 30, 2017
to form Janus Henderson Group.
Annual Performance Results 3 Year Ex-Post Standard Deviation
Total Firm Composite
Year
End
Assets
USD
(millions)
Assets
USD
(millions) Number of
Accounts
Composite
Gross
Composite
Net
Russell 2000®
Growth Russell 2000®
Composite
Dispersion Composite
Russell 2000®
Growth
Russell
2000®
2017 5,202 2,007 37 23.48% 22.79% 22.17% 14.65% 0.2% 11.87% 14.59% 13.91%
2016 5,327 1,982 47 11.84% 11.17% 11.32% 21.31% 0.1% 13.08% 16.67% 15.76%
2015 4,682 1,101 36 11.66% 10.93% -1.38% -4.41% 0.2% 12.33% 14.95% 13.96%
2014 4,892 882 37 -1.77% -2.41% 5.60% 4.89% 0.1% 11.40% 13.82% 13.12%
2013 6,695 1,011 36 45.18% 44.41% 43.30% 38.82% 0.4% 13.70% 17.27% 16.45%
2012 3,774 288 21 17.76% 17.15% 14.59% 16.35% 0.2% 17.39% 20.72% 20.20%
2011 2,609 173 14 1.44% 0.95% -2.91% -4.18% 0.2% 22.15% 24.31% 24.99%
2010 1,872 110 8 38.02% 37.39% 29.09% 26.85% 0.4%
3 Year Ex-Post Standard Deviation
Not Required Prior to 2011
2009 1,393 45 6 23.75% 23.22% 34.47% 27.17% N.A.
2008 979 28 Five or fewer -33.18% -33.49% -38.54% -33.79% N.A.
2007 1,579 9 Five or fewer 14.15% 13.69% 7.05% -1.57% N.A.
2006 1,355 6 Five or fewer 6.31% 5.90% 13.35% 18.37% N.A.
2005 1,073 5 Five or fewer 15.85% 15.39% 4.15% 4.55% N.A.
2004 815 4 Five or fewer 22.72% 22.22% 14.31% 18.33% N.A.
2003 693 3 Five or fewer 33.43% 32.89% 48.54% 47.25% N.A.
2002 531 2 Five or fewer -14.40% -14.71% -30.26% -20.48% N.A.
2001 537 1 Five or fewer 4.15% 3.67% -9.23% 2.49% N.A.
2000 514 1 Five or fewer 2.77% 2.30% -22.43% -3.02% N.A.
1999 470 1 Five or fewer 7.50% 7.13% 43.09% 21.26% N.A.
N.A. - Information is not statistically meaningful due to an insufficient number of portfolios in the composite for the entire year.

29 29
Annual Disclosure Presentation Composite Description
The US Small Cap Growth composite contains fully discretionary equity accounts invested in approximately 50-60 small capitalization growth securities whose market capitalization
ranges generally fall between $500 million to $3 billion at the time of purchase. Securities are selected using a “bottom-up” fundamental analysis of the company and supplemented
by “top-down” considerations of economic conditions. Prior to September 30, 2015, the composite was named Geneva Smallcap Composite. There is no minimum account size for
this composite. Prior to January 1, 2006, the minimum account size was $500,000. From January 1, 2004 through December 31, 2005, accounts were removed from the composite if
they fell more than 20% below the minimum account size. Beginning July 1, 2008, composite policy requires the temporary removal of any portfolio incurring a client initiated
significant cash inflow or outflow of 30% portfolio assets or greater. The temporary removal of such an account occurs at the beginning of the month in which the significant cash flow
occurs and the account re-enters the composite the last day of the month in which the cash flow takes place.
Composite Benchmark
For comparison purposes, the US Small Cap Growth composite is measured against the primary index Russell 2000® Growth Index and secondary Russell 2000® Index. The
Russell 2000® Growth Index measures the performance of the small-cap growth segment of the U.S. equity universe. It includes those Russell 2000® Index companies with higher
price-to-value ratios and higher forecasted growth values (Source: www.ftserussell.com). The Russell 2000® Index measures the performance of the small-cap segment of the U.S.
equity universe. The Russell 2000® is a subset of the Russell 3000® Index representing approximately 10% of the total market capitalization of that index. It includes approximately
2000 of the smallest securities based on a combination of their market cap and current index membership (Source: www.ftserussell.com). Performance results in presentations prior
to January 1, 2002 were measured against the S&P® 600 Index. From January 1, 2002 through January 1, 2008 performance results were primarily measured against the Russell
2000® Index. The benchmark was changed to be more representative of the composite strategy and style. Information regarding the S&P 600® Index is available upon request.
Fee Information
The annual fee schedule is 100 bps (1.00%) on the first $50 million, 90 bps (0.90%) on $50 to $100 million, and 80 bps (0.80%) on the balance over $100 million. Actual investment
advisory fees incurred by clients may vary.
Basis of Returns
Results are based on fully discretionary accounts under management, including those accounts no longer with the firm. Returns are presented gross and net of management fees
and include the reinvestment of all income. Net of fee performance was calculated using actual management fees. Prior to January 1, 2000, net returns were calculated using the
highest fee per the fee schedule in the ADV which was 1.0%. Past performance is not indicative of future results.
Composite Dispersion
The annual composite dispersion presented is an asset-weighted standard deviation calculated for the accounts in the composite the entire year.
GIPS Policies and Procedures
The Firm maintains a complete list of composite descriptions, which is available upon request. Policies for valuing portfolios, calculating performance, and preparing compliant
presentations are available upon request.
Composite Creation Date
The US Small Cap Growth composite creation date is January 1, 1999.
Composite Currency
The U.S. Dollar is the currency used to express performance.
Page 2 of 3

30 30
Annual Disclosure Presentation
Important information
Advisory services provided by Geneva Capital Management LLC, an SEC registered investment adviser. Geneva Capital Management LLC is an indirect wholly owned subsidiary of
Henderson Global Investors (North America) Inc. ("HGINA"), HGINA is an indirect wholly owned subsidiary of Janus Henderson Group plc, the ultimate parent of the global asset
management group, Janus Henderson Investors.
All investments involve risk, including loss of principal. Past performance is no guarantee of future results. Institutional separate accounts are subject to applicable account minimums.
The value of an investment and the income from it can fall as well as rise and you may not get back the amount originally invested. Geneva does not consider tax implications when
making investment decisions, the strategy is generally tax efficient due to Geneva's low turnover rate. Geneva will take specific steps to achieve tax efficiency if directed by the client.
Nothing in this document is intended to or should be construed as advice. This document is not a recommendation to sell or purchase any investment.
On occasion, we may utilize a broad-based, benchmark representatives ETF to gain exposure to a strategies market. We will do so in instances where we are managing the cadence
of direct investment opportunities or during times of market volatility. Any ETF holding will not account for more than a 5% holding and we envision using ETFs only opportunistically
and on a limited basis as investments in ETFs are subject to fund management fees.
Portfolio Management Changes
Effective July 10, 2017; Michelle Picard retired and left The Company. Jose Munoz has been promoted from Senior Analyst to Portfolio Manager.
Page 3 of 3
Fees are billed or charged to the account in arrears, at one quarter of the annual rate, on a quarterly basis or as applicable
based on the average month-end values for each of the three months comprising a quarter. Actual investment advisory fees
incurred by clients may vary.

31 31
Annual Disclosure Presentation
Page 1 of 3
US Mid Cap Growth
Total Firm Composite
Year
End
Assets
USD
(millions)
Assets
USD
(millions)
Number of
Accounts
Composite
Gross
Composite
Net
Russell
Midcap®
Growth
Russell
Midcap®
Composite
Dispersion Composite
Russell
Midcap®
Growth
Russell
Midcap®
2017 5,202 2,377 67 24.38% 23.82% 25.27% 18.52% 0.1% 10.61% 10.89% 10.36%
2016 5,327 2,299 108 3.08% 2.61% 7.33% 13.80% 0.2% 11.41% 12.18% 11.55%
2015 4,682 2,807 111 4.54% 4.08% -0.20% -2.44% 0.1% 11.13% 11.31% 10.85%
2014 4,892 3,247 128 5.90% 5.44% 11.90% 13.22% 0.2% 10.56% 10.87% 10.14%
2013 6,695 4,896 190 32.00% 31.46% 35.74% 34.76% 0.1% 13.69% 14.62% 14.03%
2012 3,774 2,860 168 11.51% 11.03% 15.81% 17.28% 0.2% 16.62% 17.91% 17.20%
2011 2,609 1,958 140 4.19% 3.73% -1.65% -1.55% 0.2% 18.86% 20.82% 21.55%
2010 1,872 1,297 119 30.83% 30.25% 26.38% 25.48% 0.4%
2009 1,393 928 96 36.89% 36.28% 46.29% 40.48% 0.4%
2008 979 618 96 -35.54% -35.86% -44.32% -41.46% 0.3%
2007 1,579 1,061 92 17.00% 16.50% 11.43% 5.60% 0.2%
2006 1,355 794 89 5.62% 5.15% 10.66% 15.26% 0.2%
2005 1,073 581 70 15.84% 15.39% 12.10% 12.65% 0.4%
2004 815 399 38 20.92% 20.47% 15.48% 20.22% 0.2%
2003 693 340 34 26.55% 26.10% 42.71% 40.06% 0.3%
2002 531 229 24 -14.05% -14.36% -27.41% -16.19% 0.4%
2001 537 244 24 -3.84% -4.18% -20.15% -5.62% 0.3%
2000 514 212 16 13.36% 13.00% -11.75% 8.25% 0.6%
1999 470 286 56 14.29% 13.19% 51.29% 18.23% 4.1%
1998 380 206 53 28.77% 27.56% 17.86% 10.09% 1.9%
1997 259 135 36 25.03% 23.85% 22.54% 29.01% 2.7%
1996 214 90 34 27.40% 26.20% 17.48% 19.00% 1.7%
1995 195 73 32 28.40% 27.20% 33.98% 34.45% 2.9%
1994 133 53 28 -0.50% -1.50% -2.16% -2.09% 1.3%
1993 120 28 26 5.02% 3.99% 11.19% 14.30% 1.6%
3 Year Ex-Post Standard Deviation
Not Required Prior to 2011
Annual Performance Results 3 Year Ex-Post Standard Deviation

32 32
Annual Disclosure Presentation
Compliance Statement
Geneva Capital Management claims compliance with the Global Investment Performance Standards (GIPS®) and has prepared and presented this report in compliance with the
GIPS® standards. Geneva Capital Management has been independently verified for the periods January 1, 1993 through December 31, 2017.
Verification assesses whether (1) the firm has complied with all the composite construction requirements of the GIPS® standards on a firm-wide basis and (2) the firm’s policies and
procedures are designed to calculate and present performance in compliance with the GIPS® standards. The US Midcap Growth composite has been examined for the periods
January 1, 1993 through December 31, 2017. The verification and performance examination reports are available upon request.
The Firm
Geneva Capital Management (formerly known as Henderson Geneva Capital Management) is a registered investment adviser and a wholly owned subsidiary of Janus Henderson
Group. On October 1, 2014 Henderson Global Investors Inc. acquired Geneva Capital Management LLC, and subsequently merged with Janus Capital Group Inc. on May 30, 2017
to form Janus Henderson Group.
Composite Description
The US Mid Cap Growth composite contains fully discretionary equity accounts invested in approximately 50-60 mid capitalization growth securities whose market capitalization
ranges generally fall between $2 billion to $15 billion at the time of purchase. Securities are selected using a “bottom-up” fundamental analysis of the company and supplemented by
“top-down” considerations of economic conditions. Prior to January 1, 2006, the composite was named Geneva Growth. Between January 1, 2006 and September 30, 2015 the
composite was named Geneva Midcap Growth Composite. The minimum account size for this composite is $500,000. As of January 1, 2004 accounts are removed annually if they
fall more than 20% below the minimum account size. Beginning January 1, 2006, composite policy requires the temporary removal of any portfolio incurring a client initiated
significant cash inflow or outflow of 30% portfolio assets or greater. The temporary removal of such an account occurs at the beginning of the month in which the significant cash flow
occurs and the account re-enters the composite the last day of the month in which the cash flow takes place. Prior to January 1, 2000, balanced portfolio segments were included in
this composite and performance reflects required total segment plus cash returns using a predetermined cash allocation percentage.
Composite Benchmark
For comparison purposes, the US Mid Cap Growth composite is measured against primary index Russell Midcap® Growth Index and secondary Russell Midcap® Index. The Russell
Midcap® Growth Index measures the performance of the mid-cap growth segment of the U.S. equity universe. It includes those Russell Midcap® Index companies with higher price-
to-book ratios and higher forecasted growth values (Source: www.ftserussell.com). The Russell Midcap® Index measures the performance of the mid-cap segment of the U.S. equity
universe. The Russell Midcap® is a subset of the Russell 1000® Index. It includes approximately 800 of the smallest securities based on a combination of their market cap and
current index membership. The Russell Midcap® represents approximately 31% of the total market capitalization of the Russell 1000® companies (Source: www.ftserussell.com).
Performance results in presentations prior to January 1, 2002 were measured against the S&P® 400. From January 1, 2002 through January 1, 2008 performance results were
primarily measured against the Russell Midcap® Index. The benchmark was changed to be more representative of the composite strategy and style. Information regarding the S&P
400® Index is available upon request.
Fee Information
The annual fee schedule for institutional clients is 75 bps (0.75%) on the first $100 million and 60 bps (0.60%) on the balance over $100 million. The annual fee schedule for retail
clients is 100 bps (1.00%) on the first $1.5 million, 85 bps (0.85%) on the next $8.5 million, and 70 bps (0.70%) on the balance over $10 million. Actual investment advisory fees
incurred by clients may vary.
Page 2 of 3

33 33
Annual Disclosure Presentation
Basis of Returns
Results are based on fully discretionary accounts under management, including those accounts no longer with the firm. Returns are presented gross and net of management fees
and include the reinvestment of all income. Net of fee performance was calculated using actual management fees. Prior to January 1, 2000, net returns were calculated using the
highest fee per the fee schedule in the ADV which was 1.0%. Past performance is not indicative of future results.
Composite Dispersion
The annual composite dispersion presented is an asset-weighted standard deviation calculated for the accounts in the composite the entire year.
GIPS Policies and Procedures
The Firm maintains a complete list of composite descriptions, which is available upon request. Policies for valuing portfolios, calculating performance, and preparing compliant
presentations are available upon request.
Composite Creation Date
The US Mid Cap Growth composite creation date is January 1, 1988.
Composite Currency
The U.S. Dollar is the currency used to express performance.
Important information
Advisory services provided by Geneva Capital Management LLC, an SEC registered investment adviser. Geneva Capital Management LLC is an indirect wholly owned subsidiary of
Henderson Global Investors (North America) Inc. ("HGINA"), HGINA is an indirect wholly owned subsidiary of Janus Henderson Group plc, the ultimate parent of the global asset
management group, Janus Henderson Investors.
All investments involve risk, including loss of principal. Past performance is no guarantee of future results. Institutional separate accounts are subject to applicable account minimums.
The value of an investment and the income from it can fall as well as rise and you may not get back the amount originally invested. Geneva does not consider tax implications when
making investment decisions, the strategy is generally tax efficient due to Geneva's low turnover rate. Geneva will take specific steps to achieve tax efficiency if directed by the client.
Nothing in this document is intended to or should be construed as advice. This document is not a recommendation to sell or purchase any investment.
On occasion, we may utilize a broad-based, benchmark representatives ETF to gain exposure to a strategies market. We will do so in instances where we are managing the cadence
of direct investment opportunities or during times of market volatility. Any ETF holding will not account for more than a 5% holding and we envision using ETFs only opportunistically
and on a limited basis as investments in ETFs are subject to fund management fees.
Portfolio Management Changes
Effective July 10, 2017; Michelle Picard retired and left The Company. Jose Munoz has been promoted from Senior Analyst to Portfolio Manager.
Page 3 of 3
Fees are billed or charged to the account in arrears, at one quarter of the annual rate, on a quarterly basis or as applicable
based on the average month-end values for each of the three months comprising a quarter. Actual investment advisory fees
incurred by clients may vary.

34 34
Economic and Investment Outlook
Geneva Capital Management (or “Firm”) prepares an Economic and Investment Outlook (“EIO”) on a quarterly basis. The purpose of the EIO is to communicate the
views and opinions held by the Firm’s Investment Team (“the Team") at a particular time regarding current and future economic and market trends. The views
expressed in the EIO may change as new information becomes available to the Team. Clients and prospects of the Firm may receive the EIO as a reference for
understanding the Firm’s intermediate and long-term outlook. This process has been in place since the inception of the Firm.
The EIO includes commentary, charts and graphs that are produced either internally or sourced from outside research organizations. The Firm carefully reviews all
external source material used in the EIO and believes the information to be reliable; however, we cannot guarantee the accuracy or completeness of external data.
Views expressed in the EIO should not be interpreted as a recommendation to buy or sell a particular security or type of securities and any forward looking views or
statements may not come to pass. Current and prospective clients may obtain additional information about the Firm in our Form ADV brochure. A copy is available
upon request.
Geneva Capital Management
100 E. Wisconsin Avenue
Suite 2550
Milwaukee, WI 53202
Telephone: (414) 224-6002
Fax: (414) 224-9503
www.genevacap.com
Important information
Advisory services provided by Geneva Capital Management LLC, an SEC registered investment adviser. Geneva Capital Management LLC is an indirect wholly
owned subsidiary of Henderson Global Investors (North America) Inc. ("HGINA"), HGINA is an indirect wholly owned subsidiary of Janus Henderson Group plc, the
ultimate parent of the global asset management group, Janus Henderson Investors.
All investments involve risk, including loss of principal. Past performance is no guarantee of future results. Institutional separate accounts are subject to applicable
account minimums. The value of an investment and the income from it can fall as well as rise and you may not get back the amount originally invested. Geneva
does not consider tax implications when making investment decisions, the strategy is generally tax efficient due to Geneva's low turnover rate. Geneva will take
specific steps to achieve tax efficiency if directed by the client. Nothing in this document is intended to or should be construed as advice. This document is not a
recommendation to sell or purchase any investment.
On occasion, we may utilize a broad-based, benchmark representatives ETF to gain exposure to a strategies market. We will do so in instances where we are
managing the cadence of direct investment opportunities or during times of market volatility. Any ETF holding will not account for more than a 5% holding and we
envision using ETFs only opportunistically and on a limited basis as investments in ETFs are subject to fund management fees.
Statement of Purpose
Fees are billed or charged to the account in arrears, at one quarter of the annual rate, on a quarterly basis or as applicable based on the
average month-end values for each of the three months comprising a quarter. Actual investment advisory fees incurred by clients may vary.
C-0418-16779 07-30-18 699-44-411667 04-18