Economic and financial trends - Danske...
39
www.danskeresearch.com Investment Research 25 June 2015 Nordic Outlook Economic and financial trends Denmark: Denmark’s recovery on a firm footing - We are at the start of a new upswing Sweden: An ambivalent and reactive Riksbank set to miss its target - We expect solid growth but Riksbank will be forced to act again Norway: The end is in sight - Oil investment now looks set to flatten out next year Finland: Signs of a slow recovery - New government struggles with both cyclical and structural problems
Transcript of Economic and financial trends - Danske...

www.danskeresearch.com
Investment Research
25 June 2015
Nordic OutlookEconomic and financial trends
� Denmark: Denmark’s recovery on a firm footing - We are at the start of a new upswing
� Sweden: An ambivalent and reactive Riksbank set to miss its target - We expect solid growth but Riksbank will be forced to act again
� Norway: The end is in sight - Oil investment now looks set to flatten out next year
� Finland: Signs of a slow recovery - New government struggles with both cyclical and structural problems

2 | 25 June 2015 www.danskeresearch.com
Nordic Outlook
Analysts
Editorial deadline 24 June 2015 Investment Research
Editor-in-Chief:
Steen Bocian
Chief Economist
+ 45 45 12 85 31
Macro economics:
Las Olsen Denmark +45 45 12 85 36 [email protected]
Mikael Olai Milhøj Denmark +45 45 12 76 07 [email protected]
Mark Thybo Naur Denmark +45 45 12 85 26 [email protected]
Roger Josefsson Sweden +46 (0)8-568 805 58 [email protected]
Frank Jullum Norway +47 85 40 65 40 [email protected]
Pasi Petteri Kuoppamäki Finland +358 (0)10 546 7715 [email protected]
Henna Mikkonen Finland +358 (0) 10 546 6619 [email protected]
This publication can be viewed at www.danskebank.com/danskeresearch
Statistical sources: Datastream, Macrobond Financial, OECD, IMF, National Institute of Social and Economic Research,
Statistics Denmark and other national statistical institutes as well as proprietary calculations.
Important disclosures and certifications are contained from page 38 of this report.

3 | 25 June 2015 www.danskeresearch.com
Nordic Outlook
Contents
Nordic Outlook At a glance 4
Denmark Denmark�s recovery on a firm footing 7
Forecast at a glance 13
Sweden An ambivalent and reactive Riksbank set to miss its target 14
Forecast at a glance 19
Norway The end is in sight 20
Forecast at a glance 26
Finland Signs of a slow recovery 27
Forecast at a glance 33
Global overview Reflation theme building 34
Economic forecast 36
Financial forecast 37
The Nordic Outlook is a quarterly publication that presents Danske Bank�s view on the economic outlook for
the Nordic countries. The semi-annual publication The Big Picture sets out our global economic outlook.

4 | 25 June 2015 www.danskeresearch.com
Nordic Outlook
Nordic Outlook At a glance A strong region The Nordic region still looks to be one of the strongest and most stable economic regions globally when we look at the prospects for the forthcoming years. We expect GDP growth in Sweden, Norway and Denmark to be around the level of 1.5-2.0% in 2015 and even above 2% in 2016. Only Finland is still cyclically weak and even though growth looks set to pick up the economy still looks very fragile. Growth in the Nordic region is likely to come from an expected continued strengthening of the overall European economy, but domestic challenges also seem limited, leaving room for growth in domestic demand.
We have only made quite small revisions to our economic forecasts for the Nordic countries compared to our latest edition of Nordic Outlook from March. The most significant change is that GDP growth in Norway seems to be more negatively affected by the lower oil price than what we expected. We now forecast growth in Norway of 1.5% in 2015, but seen in the light of the very significant decline in oil prices the Norwegian economy still looks strong as it benefits from strong consumer spending and the weaker NOK.
Impact from a Grexit not devastating The economic and financial situation in Greece is attracting attention as the risk of Greece leaving the eurozone has increased in recent months. Our base case is that the politicians in Europe will in the end strike a deal ensuring that Greece stays in the eurozone, but as the game of chicken between Greece and the rest of Europe intensifies we cannot rule out the risk of something going wrong. The Nordic region will not be significantly affected by a Grexit if that were to happen, in our view. Its trade with Greece is limited and the financial exposure is close to zero. If Greece does leave the euro we would expect to see a strengthening of NOK and SEK but less than in 2011/2012. DKK is pegged to the euro, thus the appreciation pressure we saw in January and February this year will probably re-emerge, but the peg is indisputable and the central bank would likely react accordingly. We expect the first line of defence to be FX intervention and that interest rates would only be lowered in an extreme case, which we do not expect. We expect the financial and economic turmoil following a Grexit to be limited as we expect a strong political response and that the ECB would do whatever it takes to stabilise the markets through additional QE.
Even though we expect the financial and economic impact of a Grexit to be limited in the Nordic region, it is important to stress that there is not a lot of experience to draw upon when it comes to currency areas splitting up, thus there is a risk of a more substantial economic and financial effect in Europe than what we expect. If European growth is more significantly affected, then Denmark and Finland will be the most vulnerable as the two economies are in a more fragile economic situation than Sweden and Norway. Also Finland and Denmark’s business cycles are more in sync with the rest of Europe than Sweden and Norway. That being said, a more significant strengthening of SEK and NOK if the European crisis gets worse than expected could pose a significant macroeconomic challenge to the central banks in Norway and Sweden. The impact on inflation would argue for lower interest rates giving an increased risk of unbalanced growth led by overheating housing markets.
Nordic GDP growth still looking strong
Source: National statistics offices, Danske Bank Markets
Low inflation � except in Norway
Source: National statistics offices, Danske Bank Markets
Insignificant exports to Greece...
Source: National statistics offices
...as are imports
Source: National statistics offices

5 | 25 June 2015 www.danskeresearch.com
Nordic Outlook
Non-standard Swedish monetary policy increases the risk of bubbles
Monetary policy is extreme in all western countries. It is also extreme in the
Nordic region where central bank rates are negative in three out of four
countries. Only Norway has a positive interest rate, but it is as low as 1%
despite the fact that Norway is running very close to full capacity in the
economy.
We expect additional monetary easing in Sweden only. In Norway and
Finland we expect interest rates to be left unchanged, and we do not expect
additional QE in Europe or Sweden. In Denmark, monetary policy might be
tightened slightly as the appreciation pressure has fallen in recent months.
When the financial uncertainty linked to Greece levels off we expect the
Danish central bank to be able to start normalising Danish rates slowly by
increasing Danish CD rates by 25 bp before yearend, leaving the interest rate
at minus 0.5% instead of the current minus 0.75%.
We expect Sweden to ease monetary policy further by lowering the interest
rate an additional 10 bp to minus 0.35% by the end of the year. Our
expectation of a lower Swedish rate is a consequence of the low inflation, and
as we do not expect inflation to increase as quickly as the Riksbank foresees,
thus we expect the Riksbank to react to ensure that inflation expectations are
anchored.
The very low interest rates are leading to an increased risk of unbalanced
growth and bubbles building up. We have long been concerned about the
Swedish housing market, and the continued sharp price increases driven by
the low short-term interest rates is only adding to that concern. The
Norwegian market has also been increasing rapidly. The rapid price growth
has so far been justified by strong income growth, but as income growth is
decelerating due to the lower oil price, one has to be worried if the housing
market continues to rise – we see a clear risk of this given the historically low
interest rates.
Denmark has long struggled with a weak housing market although house and
apartment prices have actually been increasing in the larger cities since 2012.
Over the last year price increases of apartments in Copenhagen and Aarhus
have started to accelerate and if this continues there is a risk of regional
bubbles in our view. The acceleration in the price development in the
Copenhagen and Aarhus markets is closely linked to the historically low
Danish interest rates.
One way to address the risk of bubbles in the housing market is macro
prudential initiatives. But so far Sweden has not had success in implementing
tighter regulation to deal with the risks linked to the housing market and the
increasing household debt. Meanwhile Norway is yet to see the desired
results from the tightening measures that have been implemented. So far it
seems as though the effect on the household sector is quite limited. The
challenge to the authorities in Denmark is that the pressure is not nationwide
– there are no strong regional macro prudential tools.
Extremely low policy rates
Source: National central banks
Inflation expectations below target in Sweden
Source: Prospera
Houses prices to drop in Sweden
Source: National statistics offices
Hot housing markets in Sweden and Norway
Source: National statistics offices

6 | 25 June 2015 www.danskeresearch.com
Nordic Outlook
New governments in Finland and Denmark
There has been a change in government in both Finland and Denmark. The
new Finnish government probably has a more challenging task ahead of it
than the Danish as it is being forced to tighten budgets quite substantially and
reform the retirement system. The Finnish government also aims at achieving
a “social contract” with the labour market unions in which annual working
hours would be extended, locally negotiated wage agreements encouraged
and income tax cut. The aim is to improve competitiveness by what could be
called an internal devaluation. The negotiations take place during the
summer, and could cause turmoil in the Finnish economy if a deal is not
struck.
On 18 June Danes also voted for a change in government. Although the
parliamentary situation may be challenging for the new Danish government
led by the liberal party, there is no reason to expect a major change in
economic policy as a consequence of the change in government. Denmark
has to run tight budgets to avoid large public deficits and this challenge does
not depend on the colour of the government.
It is not only in Finland that labour market negotiations will attract attention
in the forthcoming quarters. The next round of centralised wage negotiations
in Sweden starts at the beginning of 2016. As inflation expectations are
extremely low at the moment, the Riksbank is being forced to act to ensure
that inflation expectations are not too low compared to the Riksbank target
for inflation. This is the main reason for our forecast of a lower Riksbank rate
by the end of this year.
Government debt to exceed 60% limit in Finland
Source: Statistics Finland, Danske Bank
Limited room for more expansive fiscal policy in
Denmark
Source: Convergence Programme 2015
7 | 25 June 2015 www.danskeresearch.com
Nordic Outlook
Denmark Denmark�s recovery on a firm footing The economic recovery in Denmark is on a firm footing and the
country is now at the start of a new upswing. We expect the Danish
economy to grow by 1.7% this year, rising to 2.1% next year.
However, doing better is not synonymous with doing well, and the
economy still faces some challenges.
We expect economic growth will lift employment further. As
unemployment is already low, the risk of bottlenecks in the labour
market is very real. Hence, political initiatives may be needed to
ensure that economic growth is not slowed by a lack of resources.
The labour market is not our only concern when it comes to pressure
problems. The accommodative financial climate presents a real risk
of bubbles forming in the Danish economy, and the owner-occupier
apartment market is already red hot, so measures may be needed
here to let some air out of the balloon before it grows too large.
Since our previous forecast in March, the Danish central bank has
intervened to the tune of DKK69bn to counter a rise in EUR/DKK.
However, given the strong currency inflow at the start of the year, we
expect Danmarks Nationalbank will aim to reduce its reserves
further before a rate hike might be on the cards. We expect to see
two unilateral rate hikes in H2 15, which will raise the certificates of
deposit rate to minus 0.50% by the end of the year.
Seven consecutive quarters of positive growth The Danish economy is on the right track: Growth has been positive for
seven quarters in a row – the first time since the start of the millennium –
employment is rising and the housing market is recovering. As Denmark is a
small, open economy, growth has largely come on the back of the pick-up in
the euro area.
The Danish economy has developed more or less in line with our previous
forecast from March, so we have no reason to make any significant changes.
We continue to expect the Danish economy to improve in the coming years,
supported by a weaker krone (DKK), low interest rates and cheap oil. We
still forecast growth of 1.7% this year, rising to 2.1% next year. Whether or
not we are proved correct will to a large extent depend on the robustness of
European growth. The nascent recovery is still at a fragile stage and could
again be derailed, just as in 2010-11, when the European debt crisis erupted.
One should remember, however, that while the economy is doing better, that
is not synonymous with doing well. GDP in real terms, employment and
house prices are all at lower levels than prior to the crisis. The main reason
for the lag in the Danish economy is households still having high levels of
debt, which were accumulated during the latest upswing in the mid-2000s.
Changes from previous forecast
Source: Statistics Denmark, Danske Bank
We are at the start of a new upswing
Source: Statistics Denmark, Danske Bank
% y/y 2015 2016 2015 2016
GDP 1.7 2.1 1.7 2.1
Private consumption 1.9 1.9 1.6 2.0
Public consumption 1.0 0.3 0.7 0.2
Gross fixed investment 0.2 3.2 2.5 3.9
Exports 3.4 4.9 3.3 4.9
Imports 1.9 4.6 2.8 4.6
Gross unemployment (thousands) 125.1 116.8 128.1 122.4
Inflation 0.7 1.7 0.7 1.7
Government balance, % of GDP -1.0 -2.1 -2.4 -2.5
Current account, % of GDP 7.1 6.8 5.9 5.4
Current forecast Previous forecast

8 | 25 June 2015 www.danskeresearch.com
Nordic Outlook
Pressure on DKK eases further in recent months
Denmark and its EUR/DKK peg attracted an unaccustomed degree of
attention at the start of the year due to strong appreciation pressures on the
currency. The upward pressure prompted four rate cuts and intervention in
the FX market by Danmarks Nationalbank (DN), which lowered the
certificates of deposit rate to -0.75% and increased Denmark’s currency
reserves to almost 38% of GDP in February compared to 23.2% at the end of
2014. Pressure began to ease in late February, causing DN to increase the
central bank current account limits twice and to buy krone for DKK68.9bn in
all in April and May. Ordinarily, intervention to buy krone for DKK10-20bn
would result in a unilateral Danish rate hike, but the current situation is by no
means ordinary, and we expect that DN will prefer to reduce its currency
reserves further before a rate cut might be on the cards. The unresolved
situation with Greece is another reason for DN’s hesitancy at the moment.
We expect that Greece and its creditors will eventually reach an agreement,
which would mean an outflow of DKK. Given this, we estimate that DN will
hike rates twice by the end of the year, taking the certificates of deposit rate
up to -0.50%. Thus even if we are correct, policy rates will continue to be
extremely low and still a long way from the norm.
While slightly longer rates have corrected to some extent, in part due to better
economic key figures in Europe and rising inflation expectations, rates
generally remain low – and extremely low rates have consequences. First,
they put pressure on the bank system, as the banks have to place their money
with DN at a negative rate once they have used up their current account limit.
This means the banks have an incentive to ‘put their money to work’, which
can increase the probability of them taking on too much risk. Hence, credit
growth should come under increasing scrutiny in the coming years. Second,
very low interest rates increase the risk of asset bubbles in, for example, the
equity or housing markets – and indeed there has been an increasing focus on
the housing market of late. It is less than 10 years since the Danish economy
last experienced a housing market collapse and record-low interest rates have
stoked fears of a new bubble forming, especially in the Copenhagen
apartment market.
Housing market steams ahead in H1
While the Danish housing market has been undergoing a slow recovery over
the past few years, the pace of improvement has picked up in the first half of
this year. Figures from Statistics Denmark show that house and apartment
prices rose by 2.6% and 3.8%, respectively, between Q4 14 and Q1 15. We
have to go all the way back to 2006 to find similarly steep price increases
over a single quarter. Figures from property sales website Boligsiden and
estate agents home indicate that price growth has continued in Q2. The
pronounced increases in property prices are primarily due to extremely low
interest rates, which despite rising in recent weeks remain incredibly low
from a historical perspective. Low interest rates have made home financing
cheap, which has helped increase demand and therefore prices – as has labour
market growth. We expect house prices will continue to rise in the coming
years, though increases in interest rates will probably put a damper on the
most extreme examples. Nevertheless, we still expect to see solid price
appreciation of 7.1% this year and 5.8% next year. Hence the outlook is for
house prices to increase by more than nominal income growth would
indicate.
Extremely low policy rates in Denmark
Source: Danmarks Nationalbank, Danske Bank
FX reserves still very substantial
Source: Danmarks Nationalbank, Statistics Denmark
Mortgage rates still low in spite of correction
Note: Including trading margins; excluding administration fees
Source: Danske Bank Markets
House prices set to rise further
Source: Statistics Denmark, Danske Bank

9 | 25 June 2015 www.danskeresearch.com
Nordic Outlook
We do not currently see any reason to fear a bubble in the housing market though, as prices remain moderate. This is also supported by the continued absence of growth in household borrowing despite low interest rates. Housing bubbles usually go hand-in-hand with high lending growth, as was the case in the mid-2000s. However, the current appreciation trend in the housing market is not being driven by growing indebtedness among households. One important proviso, however, is that lending figures only cover the country as a whole, and so say nothing about regional differences.
Another item of good news for the Danish economy is that the housing market pick-up is no longer solely concentrated in and around the major urban conurbations. According to Housing Market Statistics (Boligmarkedsstatistikken), house prices in all regions except Bornholm were higher in Q1 15 compared to Q1 14. We expect that the nationwide improvement will continue in the coming years, though still with the Greater Copenhagen area as the main driving force. However, while things are generally going better in many parts of the country, we would underline that some areas remain very fragile, with house prices here still substantially below pre-crisis levels.
Furthermore, while price appreciation has spread, prices are clearly still rising fastest in Copenhagen and Aarhus. Given that apartment prices have now reached pre-crisis levels in these areas, it is worth considering the risk of localised bubbles. Prices beating their previous record do not define a bubble. Demand for housing in Copenhagen and Aarhus may also be driven by more fundamental factors – such as relocation and strong income growth. One way of putting apartment price growth into an economic perspective to assess the risk of bubble formation is to consider prices in terms of regional GDP growth. When doing this for Copenhagen, developments in H1 do give some grounds for concern – for while prices are still 14.5% from their peak in these terms, the gap has narrowed by around 10 percentage points since Q4 14. Hence the apartment market is running at full steam at the moment.
Moreover, whether or not a bubble exists in the economic sense can quickly become a theoretical discussion – what is important for an ordinary homebuyer is not to take on too much debt, believe in eternally rising prices or be blinded by incredibly low interest rates. We can certainly not rule out property prices starting to fall – especially in the major towns and cities – in a few years’ time when interest rates begin to normalise. If so, price falls could hit hard, regardless of whether or not there has been an actual bubble or not.
Weaker DKK a boon to Danish economy
Both the EUR and hence the DKK – due to the EUR/DKK peg – have
weakened very substantially since December 2014 and the effective DKK
exchange rate is now 3.6% below its level of last December. The pronounced
fall in the effective exchange rate has given Danish exporters a competitive
boost, as Danish goods have become relatively cheaper abroad. This has
already had a major impact, with Danish goods exports rising by 4.4% in the
course of Q1. Quarterly growth in goods exports has only exceeded this level
five times since the start of the 1990s. Service exports in constant prices fell
in Q1, though this was largely due to technicalities connected with a highly
fluctuating deflator. In current prices, service exports rose by 2.3% over the
quarter. Hence, exports have generally got off to a good start in 2015.
While the DKK has strengthened a little in May and June, we would have to
go back to the end of 2002 – apart from a brief period in 2012 – to find a
weaker krone. As we expect the DKK to remain weak for the immediate
Housing market pick-up spreading to more areas of
the country
Note: Bornholm not included in graph.
Source: DK Mortgage Banks� Fed., Danske Bank
Rising house prices not due to increased net
borrowing
Note: Data break September 2013
Source: Danmarks Nationalbank, Danske Bank
Apartment prices corrected for wages, inflation
and relocation approach peak
Note: Regional GDP figures for 14/15 extrapolated by correcting
nom. GDP growth nationwide with an excess growth of 0.8
percentage points. H1 apartment prices extrapolated using figures
from �Boligsiden�.
Source: Statistics Denmark, �Boligsiden�, Danske Bank
Marked weakening of effective DKK exchange rate
Source: Danmarks Nationalbank

10 | 25 June 2015 www.danskeresearch.com
Nordic Outlook
future and we forecast faster growth in our export markets, the outlook for
Danish exports is bright. We expect exports to grow 3.4% overall this year,
rising to 4.9% next year.
Consumption rising
Private consumption growth hit a six-year high in the six months around the
turn of the year. A sharp rise in heating consumption caused overall
consumption to increase by 1.2% in the final quarter of 2014, while a more
broadly based increase pushed consumption up a further 0.7% in Q1 this
year. Consumption is now 2.4% up on last year. Hence, a consumption
recovery is clearly under way, supported by rising real income, more people
in work, low interest rates and extremely high consumer confidence.
However, the recovery still does not resemble the strong, loan-financed
consumption upswing that has previously got the Danish economy going
after a crisis. In fact, the first two months of Q2 have seen a rather sharp fall
in Dankort (Danish debit card) transactions. Moreover, the increase in
heating consumption in Statistics Denmark’s figures has been from an
extremely low level in the early part of 2014 and is unlikely to recur. That is
why we have not really changed our forecast for private consumption, though
developments so far mean that some growth has been shifted from 2016 to
2015 when calculating the figures for the year as a whole.
Essentially, our position remains that consumption is being stymied by the
unusually large amount of debt owed by households. For households overall,
debt currently amounts to roughly three years’ income, which is the same as
in 2007. However, the value of owner-occupier dwellings has fallen from 4.2
to 3 years’ income, in other words, basically the same as the debt. Hence,
households still need to adjust their debt levels to the new house prices. We
have estimated that private consumption will more or less follow income
growth in the coming years, which means debt will be largely unchanged in
kroner terms. It is also quite possible that households could react to the
upswing by increasing debt levels and thus pushing consumption growth
higher. The relatively strong increase in house prices so far this year has
clearly made that possibility more likely. However, there is also a real chance
that some households will use rising income to pay off their debt and thus
dampen consumption growth relative to our expectations.
Another aspect of this story is that during the crisis households increased
their pension savings to more or less match the fall in housing wealth.
However, pension savings are tied up and most of it will be taxed when paid
out – plus there is solid evidence to suggest households look much more
closely at the equity in their homes rather than their pension wealth when
planning consumption.
Exports set to contribute to growth in coming years
Source: Statistics Denmark, Danske Bank
Heating consumption dragged private consumption
down in 2014
Source: Statistics Denmark and Danske Bank
Consumption recovery likely to be modest
Source: Statistics Denmark and Danske Bank
House prices have fallen, but not debt
Note: Not corrected for conversion of lump sum (capital) pensions.
Pension savings are excl. bank account savings. Data break in
2012.
Sources: Danmarks Nationalbank, Statistics Denmark, Realkredit
Danmark, own calculations
0
50
100
150
200
250
300
350
400
450
2000 2002 2004 2006 2008 2010 2012 2014
Debt Pension assets
Housing assets Other financial assets

11 | 25 June 2015 www.danskeresearch.com
Nordic Outlook
Prices rising faster
As we expected, inflation rose quite sharply in the opening months of the
year; from 0.1% in January to 0.6% at present – and the outlook is for the
upward trend to continue. The impact of the decline in the oil price will
gradually fall out of the statistic, which will instead be pulled higher by the
increase in the oil price since it bottomed out in January. The effect of the cut
in energy duties, which has lowered inflation by 0.2 percentage points, will
also disappear from 2016. Furthermore, the DKK weakening by 5% relative
to our trading partners between December 2014 and March 2015 will
increase import prices in Denmark, though the effect will be gradual and will
contribute to pushing inflation higher for an extended period. Underlying
inflationary pressures remain modest in Denmark, however, and as yet show
no signs of increasing. Wage growth is still modest, even though we expect it
to pick up slightly as employment increases. Real income does not look set to
experience the same solid growth in 2016, though rising employment will
help pull total household income higher.
Beware bottlenecks in the labour market
Employment has remained a bright spot in recent years. According to the
national accounts figures, the number of employed people rose by a further
5,400 from Q4 14 to Q1 15. Since bottoming out in Q2 13, total employment
has risen by 38,200 – the result of 44,600 new jobs being created in the
private sector, while the public sector has shed 5,400 jobs. Private sector
employment performing so well despite just modest GDP growth is in part
due to GDP growth being held down by less labour-intensive industries.
Hence, gross value added (GVA) in private sector non-farm and non-oil
industries has actually been positive every year since 2010 and showed
growth of 1.9% last year compared to total GDP growth of 1.1%.
We have been surprised by the pace of employment growth and now expect
more than 50,000 new jobs will be created between Q4 14 and Q4 16, taking
total employment to 2,830,000. We assume that job growth will mainly stem
from the private sector, but also expect public sector employment to rise
modestly, as this is assumed in the government’s economic policy.
Average gross unemployment fell to 126,600 or 4.8% of the labour force in
April this year. However, while gross unemployment has fallen, it has done
so at a somewhat slower pace than the pickup in employment. This is no bad
thing though, as it signals that the workforce is expanding. We forecast gross
unemployment to continue falling as employment rises, but still at a slower
pace, as we expect more people to enter the labour market due to improving
job prospects and as a result of various labour market reforms, such as the
changes to early retirement schemes. We forecast gross unemployment to fall
by a further 13,700 by the end of 2016. If we are correct, gross
unemployment will stand at 113,000 or 4.3% of the labour force, which is a
very low level of unemployment in historical terms. That employment
growth should come from the labour force means an increased risk of labour
market bottlenecks, as it is not certain the labour force can be expanded
relatively significantly in such a short space of time without creating regional
or professional bottlenecks. Hence, labour market flexibility should be a key
focus area in the coming quarters and years. It is worth pointing out here that
the normal warning signals such as wage pressure and pressure on the current
account are less effective at a time when there is labour immigration from the
rest of Europe and a structural surplus on the current account.
Inflation heading higher
Source: Statistics Denmark, Danske Bank
Solid growth in private sector non-farm and non-oil
industries explains employment growth in recent
years
Source: Statistics Denmark, Danske Bank
Higher economic growth will help lift employment
Source: Statistics Denmark, Danske Bank
Government has consistently overestimated
number of public sector employees
Source: Statistics Denmark, Economic Survey, Danske Bank

12 | 25 June 2015 www.danskeresearch.com
Nordic Outlook
No scope for fiscal easing
General elections held in Denmark on Thursday 18 June resulted in a win for
the ‘blue block’ – the centre-right parties. As we write, negotiations to form a
new government have only just begun, so we do not yet know what the
economic policy of the future government will be. A change of government
in Denmark often does not result in any great change to short-term economic
policy and we expect this will once again be the case. Naturally, economic
policy differs between the political parties, but the budget and EU rules limit
the scope of politicians to act in the short term. Hence, our forecast for the
coming years is not particularly affected by the shift in government, although
it naturally constitutes a source of uncertainty with respect to our estimates
for government finances next year.
Last year was the first year since the financial crisis kicked off that Denmark
had a budget surplus – of DKK34.6bn, or 1.8% of GDP. The surplus was in
particular due to the bringing forward of a tax on pension savings and
extraordinary income from the PAL (pension yield) tax. However, Denmark
looks set to have a budget deficit again this year and next. We do not expect
the deficit to exceed the EU limit of 3% of GDP, but significant deficits mean
there is little scope for fiscal easing in the coming years. We estimate
economic policy will be tightened slightly in the coming years, which fits
well with the state of the economy.
Labour shortages could soon be looming again
Source: Statistics Denmark, Danske Bank
Budget deficit close to � but below � EU limit
Source: Statistics Denmark, Danske Bank

13 | 25 June 2015 www.danskeresearch.com
Nordic Outlook
Denmark: Forecast at a glance
Sources: Danmarks Statistik, Nationalbanken, Macrobond Financial, Danske Bank
National account 2013 2013 2014 2015 2016
DKK bn (current prices)
Private consumption 890.2 0.0 0.6 1.9 1.9
Government consumption 504.0 -0.5 1.4 1.0 0.3
Gross fixed investment 345.7 1.0 3.7 0.2 3.2
- Business investment 205.6 3.4 1.1 2.0 5.3
- Housing investment 70.7 -5.0 6.5 -2.4 3.3
- Government investment 69.3 0.3 8.6 -1.9 -3.2
Growth contribution from inventories -0.2 -0.2 0.3 -0.4 0.1
Exports 1023.8 0.8 2.6 3.4 4.9
- Goods exports 626.9 1.8 -0.3 5.8 4.7
- Service exports 396.9 -0.8 7.1 -0.3 5.2
Imports 915.5 1.5 3.8 1.9 4.6
- Goods imports 574.9 3.6 2.3 3.2 4.3
- Service imports 340.6 -2.0 6.4 -0.3 5.1
Growth contribution from net exports -0.3 -0.3 -0.5 0.9 0.5
GDP 1886.4 -0.5 1.1 1.7 2.1
Economic indicators 2013 2014 2015 2016
Current account, DKK bn 136.0 120.9 140.0 140.0
- % of GDP 7.2 6.3 7.1 6.8
General government balance, DKK bn -20.0 34.6 -20.4 -44.1
- % of GDP -1.1 1.8 -1.0 -2.1
General government debt, DKK bn 849.8 867.9 762.5 776.9
- % of GDP 45.0 45.2 38.6 37.9
Employment (annual average, thousands) 2748.8 2768.3 2791.4 2818.9
Gross unemployment (annual average, thousands) 152.9 134.6 125.1 116.8
- % of total work force (DST definition) 5.8 5.1 4.7 4.4
Oil price - USD/barrel (annual average) 109 99 66 78
House prices, % y/y 2.7 3.4 7.1 5.8
Private sector wage level, % y/y 1.2 1.3 1.6 2.2
Consumer prices, % y/y 0.8 0.6 0.7 1.7
Financial figures 24/06/2015 +3 mths +6 mths +12 mths
Lending rate, % p.a. 0.05 0.05 0.05 0.05
Certificates of deposit rate, % p.a. -0.75 -0.60 -0.50 -0.50
2-yr swap yield, % p.a. 0.27 0.15 0.15 0.25
10-yr swap yield, % p.a. 1.50 1.45 1.55 1.85
EUR/DKK 7.460 7.455 7.455 7.455
USD/DKK 6.67 7.17 7.03 6.78
% y/y
Forecast

14 | 25 June 2015 www.danskeresearch.com
Nordic Outlook
Sweden An ambivalent and reactive Riksbank set to miss its target Thus far in 2015, most economic developments have been in line with
what we chiselled out in December last year. Growth is improving in the sense that it is becoming increasingly more balanced as stronger external demand and a weak SEK are pushing exports up, while domestic demand growth (id est, mainly consumption and housing investment) is coming back down from the unsustainably high growth rates of yesteryear.
Inflation seems to be bottoming out and is expected to rise during H2, mainly due to statistical base effects as previous year’s sharp fall in energy and interest rate related costs are dropped from the inflation calculations. However, albeit expecting a pronounced rise in inflation during autumn, our forecast pales compared to the Riksbank’s path forward where inflation is calculated to rise by 1.75 percentage point (p.p.) from August to December.
Albeit directionally in line with the Riksbank’s forecasts for the Swedish economy, the above developments will pose a near-term challenge to the Riksbank. After undershooting the inflation target for long and by far, confidence in the inflation target has clearly deteriorated which is why the Riksbank has set its aim on coming across as ‘inflation nutters’.
In Sweden, centralised wage negotiations are widespread, deciding the level of wage inflation for considerably more than three million workers out of a total of less than five million workers. (Of course, there is room for some wage drift but that has rarely been a major issue in Swedish wage formation, especially when controlling the local wage bargaining agreements common among engineers et alia.)
The next wage bargaining round is concluded in the beginning of 2016 and inflation and inflation expectations are at historically low levels. In addition, both unions and industry organisations have expressed previously unheard of doubts about using the inflation target as an anchor for negotiations. In other words, the Riksbank has only limited time to push up inflation (-expectations) and should be extremely responsive to indications of negative developments vis-à-vis its preferred path forward or continued low inflation expectations among labour market participants.
Taken together, we believe that the continued lowflation prevalent in
our forecast and an acute need to lift inflation expectations, will be
sufficient to make the Riksbank act again. In relation to earlier
expectations we have, nevertheless, chosen to postpone policy action
to December.
Risks are still tilted to the downside and to earlier rather than later
policy action. In particular, we fear a swift SEK appreciation could
bring the Riksbank to act, even in the very near term.
Changes from previous forecast
Source: Danske Bank
Swedish economy at a glance
Source: Statistics Sweden (SCB). Danske calculations
Same same but different
Source: SCB, Riksbank. Danske calculations
The Riksbank trigger?
Source: National Institute for Economic Research (KI), Macrobond
% y/y 2015 2016 2015 2016
GDP, calendar adjusted 2.1 2.1 2.1 2.1
Private consumption 2.0 2.0 2.0 1.8
Public consumption 1.6 1.1 1.2 1.5
Gross fixed investment 5.3 3.6 6.0 3.8
Exports 3.8 5.3 5.5 4.9
Imports 4.9 5.2 6.6 5.1
Unemployment rate 7.8 7.6 7.7 7.5
Inflation 0.2 1.5 0.3 1.2
Government balance, % of GDP -1.8 -0.9 -2.0 -1.0
Current account, % of GDP 5.4 5.4 5.6 5.7
Current forecast Previous forecast
Sweden

15 | 25 June 2015 www.danskeresearch.com
Nordic Outlook
The binarities of external demand
The Swedish economy is continuing to perform well in relation to most other
developed countries. However, in order to make demand composition more
balanced and to make economic policy long term sustainable, external
demand will have to pick up the pace in coming quarters. Danske Bank’s
international forecasts do forebode strong(er) growth in many of Sweden’s
main export markets. Details in the forecast, however, paint a less exuberant
image of the export outlook. The Swedish export industry consists mainly of
investment and input goods, while international demand growth currently
seems to be a function mainly of consumption goods and services. Indeed, in
2014, preliminary GDP data showed that service exports grew an impressive
7.2% y/y, with R&D and tourism being among the main contributing
industries. In the goods exporting industries, so called merchanting (exempli
gratia, tri-party trading) was the main contributor.
That said, external demand is ameliorating and as the improvement in
international demand progresses, we expect growth to increasingly come
from investments (and input) goods, which should enhance the Swedish
export outlook. In addition, at current levels, the SEK is weak against most
major currencies, lending additional support to a more benign export outlook
– especially for the Swedish input goods industry. Export orders have been
on the rise, over the past few months, and we take note of several leading
export companies having announced production increases during spring.
Also, despite the expected recoil in Q1 15, services exports should continue
on a strong note throughout the forecast horizon.
World market growth, id est the weighted import growth on Swedish export
markets, is calculated to gradually approach, and even exceed, 5% y/y at the
end of the forecast horizon. This implies that 2015 should mark the last year
with falling market shares for Swedish export industries, as Swedish export
growth is finally calculated to surpass market growth. Needless to say, given
renewed worries about Greece and recurrent skirmishes between the fighting
parties in Ukraine, risks to this forecast are tilted to the downside.
In quantitative terms, Swedish export growth is expected to rise 3.5 % y/y
(vol., cal. adj.) in 2015 and 5.0% y/y (vol., cal. adj.) in 2016.
Financial conditions to remain supportive
In line with developments in international financial markets, Sweden has
experienced a very high volatility in (longer-dated) interest rates and FX
markets during the first half of 2015. However, short-term interest rates are
fixed at low – even negative – levels due to the Riksbank’s repo rate
currently standing at -0.25%. The far below target inflation has made us, and
financial markets, believe that current low rates are here to stay for a longer
period of time. To be certain, we have a hard time identifying any near-term
risks that could push underlying inflation and short rates upwards and the
renewed volatility in the longer interest rate spectra and in FX markets, while
noteworthy, is apparently stuck in a wide but constructive range from a
Swedish standpoint.
Stock markets have risen strongly for a longer period of time which is why
we need to acknowledge some downside risks to our outlook. Partly due to
these risks, we expect the pace of gains to moderate and gradually align to
nominal GDP-growth.
GDP and investments growth on Swedish export
markets
Source: National Institute of Economic and Social Research
(NIESR), Macrobond. Danske calculations
World markets and Swedish exports
Source: NIESR, SCB, KI. Danske calculations
Financial conditions remain supportive
Source: Macrobond. Danske calculations

16 | 25 June 2015 www.danskeresearch.com
Nordic Outlook
Housing markets are taking out new highs by the day it seems and we have
long highlighted the risk of a major correction of 20-30%, where we believe a
fundamentally warranted price level is located. Simultaneously taking into
account an institutional lack of affordable housing, we have opted for a more
gradual, smoother, adjustment process with incomes rising and prices only
slowly dropping, eventually reaching a sustainable equilibrium a few years
hence.
Turning, lastly, to the fiscal situation, we do expect fiscal policy to become
less supportive to growth over the coming years as the fiscal targets, in
particular the surplus target, have become increasingly strained. The cyclical
improvement has not sufficed to restore government tax incomes to pre-crisis
trends or levels and a large influx of immigrants weigh on public
expenditures, even though the net economic impact on Sweden’s economy
may be positive. Views on the amount of saving necessary to restore the
surplus target is diverging but calculations from the semi-independent
National Institute for Economic Research suggests a need for structural
savings of close to SEK100bn over the coming years.
To sum up, despite increased volatility and in the presence of downside risks,
we expect financial and economic conditions to remain strongly supportive to
growth way past the forecast horizon.
Not only housing investments
Disregarding a temporary boost to R&D investments during the latter part of
last year, investments growth has been very weak in private sectors in the
wake of the financial crisis. The main exception, in particular over the past
couple of years, has been housing investments that have even increased some
25% y/y certain quarters! Investments have not been bad in service sectors
but far from what could have been expected when studying, exempli gratia,
growth in service industries (and exports). Public investments in various
infrastructure projects and other large scale projects instigated in the wake of
the crisis are now on a downward trajectory and we do not expect this trend
to shift much over the forecast horizon.
However, as capacity utilisation is increasing and as the export outlook firms
on the back of more benign international developments, we expect business
investments to finally pick up pace as well. Housing investment growth,
though, is expected to decelerate over the coming quarters. All in all,
investment growth is expected to reach 4.9 % y/y (vol., cal. adj.) this year
and to come in a tad lower, at 3.2% y/y (vol., cal. adj.), in 2016.
Frugal Swedish households
Last year, private consumption increased 2.5% y/y (vol., cal. adj.) and strong
consumption growth has been a trait of the Swedish economy ever since the
international financial crisis struck in 2008. This has many explanations,
lower tax burden, lower interest rate costs, increased wage share of GDP,
strong immigration, wealth effects from housing and stock markets etc.
However, this has also gone hand in hand with a very high savings ratio,
currently above 15% of disposable incomes, which has more than doubled
from 2008 until now. Most forecasters assume and have assumed that this
situation would ‘normalise’, meaning the savings ratio would/will decrease
and consumption – hence – increase as the labour market situation improves.
Asset prices are soaring, risks are building
Source: Macrobond
Fiscal policy is overly expansionary
Source: SCB, KI Danske bANK calculations
Domestic demand has driven Swedish GDP-growth
Source: SCB, KI Danske Bank calculations
High savings ratio remains the main upside risk
Source: SCB, KI. Danske Bank calculations

17 | 25 June 2015 www.danskeresearch.com
Nordic Outlook
Since the employment continues to be benign, wages are expected to increase
further and most evidence points towards continued decent demand growth,
the consumption outlook is almost by default only a question of how
optimistic you feel. Alas, we continue to foresee a high degree of uncertainty,
low to negative wealth effects, further fiscal contraction, low wage increases
and have all sorts of sombre views on the future, which is why our forecasts
for private consumption, albeit still respectable from a historical perspective,
imply a diminishing contribution to growth from consumption.
In numbers, in both 2015 and 2016, private consumption growth is forecasted
to come in at 1.9% y/y (vol., cal. adj.), suggesting, inter alia, a virtually
constant savings ratio in coming years.
Imports and GDP
Due to strong domestic demand, imports have been growing steadily over the
past years. Imported content is high also in exports, which is why we see no
reason to expect a dramatic change in import growth over the forecast
horizon. In 2015 imports are expected to grow 4.5% y/y (vol., cal. adj.) and
in 2016 we estimate an even higher import growth, 4.9% y/y (vol., cal. adj.).
Net exports will thus start to contribute strongly from now on and over the
forecast period, but leave, as year average a -0.3 p.p. y/y (vol., cal. adj.)
contribution on growth this year and a 0.2 p.p. (y/y) positive contribution to
growth in 2016.
Summing up the various components discussed above, we reach a GDP-
estimate somewhat below market consensus and the Riksbank but it is still
decent when comparing to other economies and post-crisis developments. It
is particularly pleasing to see a more balanced demand, as current domestic
developments would be unsustainable from a longer-term perspective given
the substantial (unsustainable) economic policy stimuli to domestic demand.
All in all, GDP is expected to come in at 2.1% y/y (vol., cal. adj.) in both
2015 and 2016 but, again, with a gradually improved composition.
Resource utilisation, inflation and the Riksbank
If only we could call it a Freudian slip but we are honestly and genuinely
uncertain about the future for resource utilisation and inflation and thus also
about the ‘Risk’bank. The unemployment rate is elevated and current
inflation is unarguably low. However, the explanation for the high
unemployment rate is not only an increased number of unemployed in the
wake of the financial crisis, but also due to a very strong influx of immigrants
with an unknown skill set and thus, perhaps, questionable employability on
Swedish labour markets. In this respect we are quite optimistic as many of
the jobs added after the crisis are to be found in the low-skilled service
sectors and an unusual high percentage of the new entrants have post-
secondary education.
High import content in exports
Source: SCB, KI. Danske Bank calculations
GDP, hours worked and productivity
Source: SCB, KI. Danske Bank calculations

18 | 25 June 2015 www.danskeresearch.com
Nordic Outlook
Together with a seemingly low utilisation of capital (i.e., machinery etc), our
belief is that resource utilisation is still low, despite us sporting a low
potential GDP-growth (of 1.5-1.75% y/y). The low resource utilisation
explains the low current inflation but the low potential growth implies that
even our below consensus forecasts of actual GDP will suffice to narrow the
output cap throughout the forecast horizon. It is only, however, late 2017 –
beyond the forecast horizon that the output gap reaches balance and we
foresee an underlying inflation closer to the inflation target.
In the near term and due to statistical base effects from the dramatic fall in
energy prices last autumn, we foresee a pronounced rise in inflation over the
coming months. In our forecast, (CPIF) inflation rises from -0.3% (in June)
to above 1½% y/y in January 2016. Thenceforth, inflation will again ebb – at
least in the medium term – as true inflation, wage inflation, is set to come in
all too low to produce the underlying inflationary impetus necessary to reach
the inflation target. Together with still weak pricing power in large parts of
the business sector, we believe that the inflation target is a long way hence, at
least when looking at core inflation measures. Overall, inflation is set to
average 0.2% y/y in 2015 and 1.3% y/y in 2016.
The Riksbank should be able to see through the energy-driven near-term rise
in inflation which we, to be sure, expect will be less dramatic than what the
Riksbank is forecasting. And with the Riksbank concentrating on its inflation
nutter credentials, particularly in the run up to the conclusion of the wage
negotiations, we expect the Riksbank will not be satisfied at all. In short, we
still expect the Riksbank to increase the monetary policy accommodation (a
10bp cut at the December meeting). It is a pity it is too late.
Under any circumstances, we continue to hold a strong SEK as the main risk
for early policy actions and we would also like to underline that
developments of external demand are key to forming an opinion on the future
of Swedish economic policy. In terms of domestic demand, economic policy
is already a success.
Resource utilization remains low
Source: SCB, KI. Danske calculations
�Lowflation� becoming a permanent trait of the
Swedish economy?
Source: SCB, Riksbank. Danske calculations
Sub zero rates and no thaw in sight
Source: Riksbank. Danske calculations

19 | 25 June 2015 www.danskeresearch.com
Nordic Outlook
Sweden: Forecast at a glance
Note: The national account figures relates to actual growth rates (i.e. not calendar adjusted or wda)
Source: Danske Bank
National account 2013 2013 2014 2015 2016
SEK bn (current prices)
Private consumption 1718.2 1.9 2.4 2.0 2.0
Government consumption 955.7 0.7 1.9 1.6 1.1
Gross fixed investment 674.2 -0.4 7.4 5.3 3.6
Growth contribution from inventories -4.4 0.0 0.2 0.1 0.0
Domestic demand 3348.1 1.0 3.4 2.7 2.1
Exports 1722.4 -0.2 3.3 3.8 5.3
Aggregate demand 3343.7 1.1 3.6 2.7 2.1
Imports 1516.4 -0.7 6.6 4.9 5.2
Growth contribution from net exports 206.1 0.2 -1.1 -0.3 0.2
GDP 3549.7 1.3 2.3 2.3 2.3
GDP, calendar adjusted 1.3 2.4 2.1 2.1
Economic indicators 2013 2014 2015 2016
Trade balance, SEK bn 142.2 123.5 107.3 121.4
- % of GDP 3.8 3.2 2.6 2.9
Current Account, SEK bn 260.4 224.9 220.7 228.3
- % of GDP 6.9 5.7 5.4 5.4
Public sector savings, SEK bn -45.3 -82.2 -73.0 -37.9
- % of GDP -1.2 -2.1 -1.8 -0.9
Public debt ratio, % of GDP* 38.7 43.9 44.5 44.8
Unemployment, % of labour force 8.0 7.9 7.8 7.6
Hourly wages, % y/y 1.9 2.8 2.8 2.5
Consumer prices, % y/y 0.0 -0.2 0.2 1.5
House prices, % y/y 3.6 5.0 -3.0 -2.0
* Maastricht definition
Financial figures +3 mths +6 mths +12 mths
Repo rate, % p.a. -0.25 -0.25 -0.35 -0.35
2-yr swap yield, % p.a. -0.04 0.05 0.00 0.00
10-yr swap yield, % p.a. 1.61 1.60 1.70 1.95
EUR/SEK 9.2 9.3 9.2 9.0
USD/SEK 8.2 8.9 8.7 8.2
24/06/2015
% y/y
Forecast

20 | 25 June 2015 www.danskeresearch.com
Nordic Outlook
Norway The end is in sight The decline in oil investment is now having a very clear impact on the
economy and there are some signs of second-round effects. The worst
is probably still to come, with higher unemployment and more
bankruptcies.
Oil investment now looks set to flatten out next year, which should
mean that the bottom is reached in the autumn.
A much weaker Norwegian krone has also offset much of the impact
of lower oil investment.
The central bank’s rate cuts are working as intended, with both
private consumption and housing investment on the increase.
Unemployment is set to increase but we believe it will be limited by
economic adaptation and a flexible labour market.
One unknown is the amount of excess capacity in the supply sector.
Norges Bank lowered its key rate again in June and is signalling a
good chance of further reductions but we believe interest rates have
hit the bottom.
The NOK should gradually strengthen again as oil investment
flattens out.
The wage model also appears to be working, as wage growth is
slowing without unemployment rising.
Beginning of the end
Growth in the Norwegian economy was surprisingly strong in Q1 but the fall
in oil investment since late 2013 is now beginning to affect oil-related
industries seriously. Nevertheless, we expect the downturn to be both mild
and short-lived.
For one thing, the Norwegian economy is actually relatively robust, even
against large swings in the oil price. The decline in the Norwegian krone that
has accompanied the slide in oil prices has given the export industry a lift.
The central bank’s rate cuts have also increased households’ purchasing
power and contributed to higher private consumption and housing demand,
so boosting housing investment. Together with expansionary fiscal policy
and continued positive bank lending policies, this has helped limit the
second-round effects of the fall in oil prices. Although unemployment has
begun to rise, the increase has not been as bad as many feared and has been
confined largely to oil-related industries and oil-dominated regions.
For another, oil prices have moved off the bottom and the oil investment
survey suggests oil investment will flatten out next year. This may mean that
the deterioration in the economy in the spring proves to be the beginning of
the end for the oil-driven downturn in Norway. This also has implications for
financial markets, as we believe interest rates have hit the bottom and that the
krone is set for a prolonged uptrend.
Changes from previous forecasts
Source: Danske Bank Markets
Growth slowing
Source: Statistics Norway, Danske Bank Markets
% y/y 2015 2016 2015 2016
GDP (mainland) 1.5 2.3 1.7 2.2
Private consumption 1.9 2.0 1.8 2.0
Public consumption 2.3 2.2 2.4 2.2
Gross fixed investment -1.8 1.9 -6.5 1.0
Exports 1.6 1.5 2.5 1.0
Imports 3.4 3.0 1.0 3.0
Unemployment (LFS) 4.0 3.8 3.7 3.7
Inflation 2.1 2.0 2.8 2.0
Current forecast Previous forecast
Norway

21 | 25 June 2015 www.danskeresearch.com
Nordic Outlook
Looking ahead two to three years, we still believe oil prices will have to
return to levels that will make the upcoming development of new fields in the
North Sea profitable. This is not, therefore, the start of a long-term decline in
the Norwegian oil sector but a short, sharp correction that will soon be
history.
Oil-related industries hit hard
Oil investment has been in decline since late 2013 and will probably continue
to fall through to spring 2016. This has put a dampener on economic
expansion but the slowdown appears to have gone largely as we expected in
March despite a deterioration in oil-related industries. It is very encouraging
that the second-round effects still seem to be moderate. Indeed, we are seeing
signs of consumption growth accelerating and of housing demand holding up
and helping push up housing investment. The weaker krone and continued
gradual global economic recovery have also meant that mainland exports are
still growing. Mainland GDP grew 0.5% q/q in Q1, more or less in line with
last year, but Norges Bank’s regional network survey is suggesting somewhat
weaker growth over the summer. We now expect mainland GDP to grow
1.5% this year, slightly less than forecast in Nordic Outlook: March 2015, 25
March.
Unemployment is beginning to rise but the increase is still confined to oil-
related industries and oil-dominated regions. Although employment has
stopped climbing, slower growth in labour supply will restrict the increase in
unemployment. This last factor seems to be due largely to net immigration
having fallen in response to the slacker labour market, which illustrates how
flexible the Norwegian labour market has become since the enlargement of
the EU in 2005.
The most important change since Nordic Outlook: March 2015 comes from
the oil investment survey. The oil companies have revised up their estimate
for this year slightly but we are still looking at a decrease in oil investment of
13%. On the other hand, the survey now suggests that oil investment will be
more or less unchanged in 2016, whereas we previously forecast a decrease
of 5% y/y. Besides pushing up our GDP forecast for 2016, this also removes
some of the downside risk to the Norwegian economy.
As mentioned above, the decline in oil investment since late 2013 is now
plain to see in activity in oil-related industries. New orders have dried up,
profitability has fallen and the focus is on cost cutting and downsizing. This
is now resulting in lower industrial production and a decrease in overall
business investment. One positive, though, is that the first contracts for the
new Johan Sverdrup oilfield have been awarded mainly to the Norwegian
supply sector.
We also expect oil prices to begin to climb after the summer, with the result
that oil investment should also stabilise gradually elsewhere in the world.
With several relatively large projects due to start up from late 2015, we
expect the fall in oil investment to be short-lived rather than mark the start of
a long-term decline in the Norwegian oil sector. Internal cost-cutting and
lower costs for rig hire have also pulled down breakeven levels for all
projects. This means the need for economic reorganisation will be limited,
which will decrease the downside risk for now.
Weaker growth over the summer
Source: Norges Bank
Oil investments will be more or less unchanged
next year
Source: Statistics Norway, Danske Bank Markets
We expect oil prices to climb further
Source: Macrobond
22 | 25 June 2015 www.danskeresearch.com
Nordic Outlook
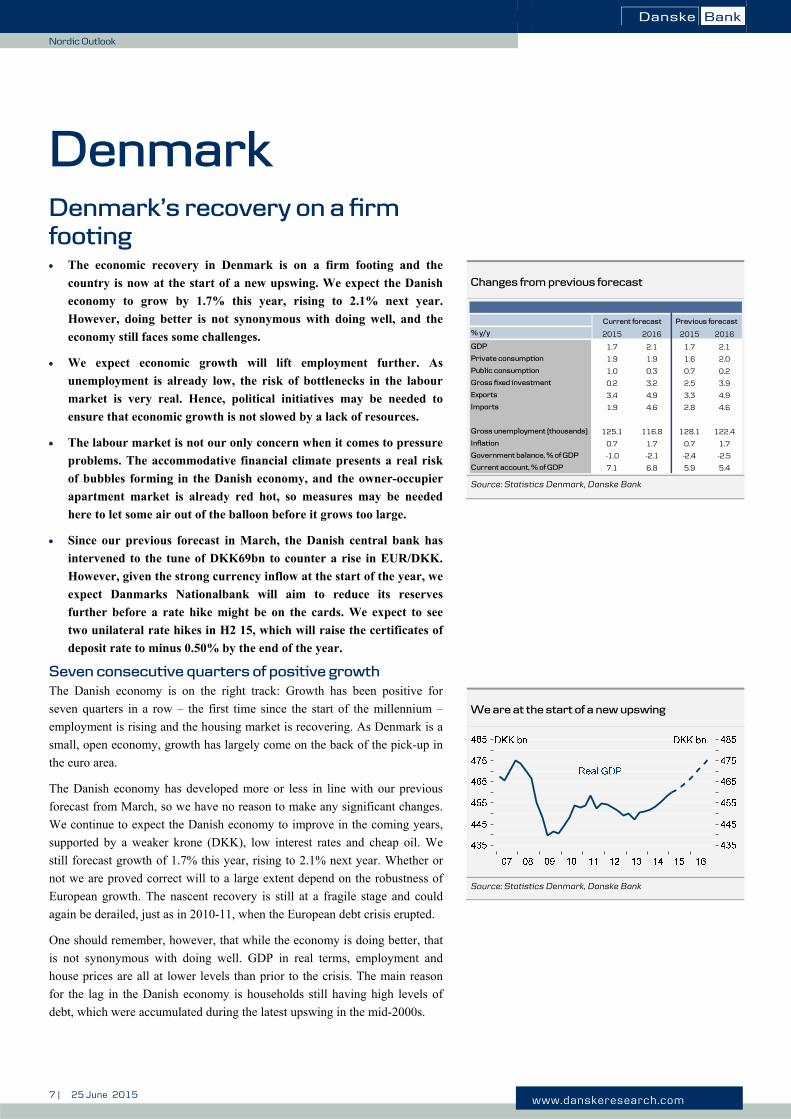
The krone has remained weak since Nordic Outlook: March 2015. Together
with slightly stronger global growth, this has boosted the export industry
through higher activity and profitability. Mainland exports grew 6% y/y in
Q1 and the (nominal) figures for April and May suggest that exports
improved somewhat further in Q2.
The downturn in oil-related industries nevertheless appears to be dominating
investment activity in the business sector. Although the manufacturing
investment survey suggests somewhat higher levels in that sector, there are
indications that investment in the service sector in particular is being hit by
the oil slowdown. Orders for commercial buildings, for example, have fallen.
Therefore, we still expect business investment to fall 1% this year but grow
again next year.
Although consumer confidence has fallen to levels last seen during the
financial crisis of 2008-09, growth in private consumption accelerated to
0.6% q/q in Q1 and April retail sales point to an even higher rate of growth in
Q2. While we suspect the April figures were on the high side due to the
timing of Easter, anecdotal evidence for May and June does not point to any
collapse. Therefore, we expect private consumption to grow 2.0% this year,
which is somewhat higher than we previously predicted. Our forecast for next
year is still 2.0%.
Higher unemployment and dwindling consumer confidence have not had any
negative impact on demand for housing either. Quite the opposite, it seems
that the housing market has tightened, with rising prices, falling time to sell
and higher turnover. Sales of new homes have also increased, pushing up
homebuilding activity. Housing investment climbed 0.9% q/q in Q1 and the
data for housing starts and orders suggest that this trend has continued into
Q2. This is entirely in line with our expectations and we still predict growth
in housing investment of 3% both this year and next.
Housing market on fire
The housing market remains tight. Although prices have slowed somewhat
over the past couple of months, time to sell is still falling and turnover is high
relative to the stock of unsold homes. The prospect of interest rates falling
further and remaining low for a long period may have affected price
expectations and pushed prices up more than the December rate cut alone
would warrant.
Lower rents in Oslo, combined with a sharp rise in prices for small city
centre apartments, could reflect a strong shift from renting to owning among
the under 30s. This would indicate that the shortage of housing is not as acute
as the rise in prices might suggest.
We are also seeing clear signs of homebuilding beginning to react positively
to rising prices. The trade reports that sales of new homes are up 32% on last
year and Statistics Norway’s data show a 28% increase in housing starts in
the first four months of this year.
We believe that an increase in the supply of homes will help dampen housing
price inflation later this year and into next year. The new mortgage rules may
also help rein in growth in demand somewhat but we do not think that they
will be enough to slow demand sufficiently.
Increase in orders set to boost housing investment
Source: Statistics Norway
Housing market stays warm
Source: Real Estate Norway

23 | 25 June 2015 www.danskeresearch.com
Nordic Outlook
On balance, we consider the risk of a serious downturn in the housing market
is still relatively limited in the short term despite weaker economic growth
and slightly higher unemployment. Lower real wage growth will be more
than offset by lower interest rates, with the result that households’ debt-
servicing capacity will actually improve.
Unemployment set to peak early next year; wage growth set to slow
Unemployment has risen slightly further than we expected in Nordic
Outlook: March 2015, 25 March. It is mainly in oil-related industries and oil-
dominated regions that the number of jobless is rising and the increase in
other regions and sectors has been limited to date. According to the
Norwegian Labour and Welfare Administration (NAV), for example, the
entire increase in registered unemployment over the past year has been in
Rogaland, the heart of the offshore industry.
The two sources of jobless data also paint rather different pictures: while the
NAV figures show an increase of around 5,000 people, Statistics Norway’s
labour force survey suggests an increase of almost 25,000. We normally set
most store by the NAV’s figures, which show the number of people actually
registered as unemployed, whereas the LFS numbers are survey based and
therefore will always be associated with more uncertainty. Historically, the
NAV statistics have also presented a much more stable and accurate picture
of developments in the labour market than the LFS. On the other hand, the
use of severance packages in the oil sector means that the LFS may be better
at capturing the rise in unemployment there.
Either way, the rise in unemployment is being tempered by overall economic
growth holding up relatively well to date thanks to stronger growth in other
sectors. The Norwegian labour market has also become very flexible since
the enlargement of the EU in 2005. Net immigration has fallen by more than
10,000 since last year, curbing growth in the labour supply and keeping
unemployment down. On top of this, many of the jobs that have disappeared
in the oil sector were held by temporary foreign workers who are now
heading home without showing up in any of the jobless data.
We expect unemployment to rise somewhat in H2 as the slowdown in oil-
related sectors intensifies. However, we also expect the decline in oil
investment to flatten out early next year, which may mean the weakest period
in the labour market is through to next summer. In this case, we believe
unemployment will peak in H1 next year.
As expected, the Norwegian wage model appears to be working. The national
talks led to very moderate increases. The fall in oil prices will also erode
profitability in many industries, which will affect the wages they pay.
Together with rising unemployment, this will probably result in low local pay
increases too. Therefore, we expect wage growth to end up around 2.7% this
year and 3.0% next year.
Rise in unemployment still moderate
Source: Statistics Norway

24 | 25 June 2015 www.danskeresearch.com
Nordic Outlook
Inflation holding up
Core inflation has held just below 2.5% over the past year but has fallen
somewhat lately despite higher imported inflation. This is probably because
the economic downturn has put a dampener on cost increases and squeezed
margins in the retail trade. The fall in inflation in March and April also
seemed to be linked to unusually weak movements in Norway’s ever-volatile
food prices and airfares. The May figures indicate a degree of normalisation,
with core inflation returning to 2.4% y/y.
We expect the underlying price drivers – lower wage growth and higher
productivity growth – to dampen domestic inflation further but the
deterioration in the krone in the spring will push up import prices over the
autumn and winter. Higher energy prices will also feed through gradually
into higher prices for both inputs and finished goods at importer level in
Norway. Therefore, we expect core inflation to hold around 2.25% y/y before
beginning to drift down towards 2.00% at the end of the year.
No more rate cuts; krone set to rally strongly
As expected, Norges Bank cut its key rate to 1.0% at the meeting on 18 June.
This was no surprise but the bank also signalled a significant chance of
further reductions, mainly because the growth outlook for the Norwegian
economy is weaker than previously thought. The latest regional network
survey results confirm that growth this year will probably be lower than
previously assumed and the bank also lowered its forecast for mainland GDP
next year despite an upward revision of the estimate for oil investment. The
change in the growth forecast for next year was due almost entirely to a
downward revision of private consumption despite unchanged projections of
real wage growth and unemployment.
It seems that the central bank is now much less worried about the risks to
financial stability from rapid growth in housing prices and credit. This is
probably a result of the government unveiling tougher new rules for banks’
mortgage lending. The Ministry of Finance has also announced that the
countercyclical capital buffer at banks is set to rise from 1.0% to 1.5%, partly
to ease the pressure in the housing market through tighter credit policies
and/or higher interest margins. However, when the buffer was first
introduced, it hit lending to businesses and had only a marginal impact on
lending to households, so this seems a very risky policy in the current
climate. Fortunately, it seems that banks are largely on course to meet higher
capital requirements, so with luck the effect will only be moderate.
Nevertheless, we believe that interest rates have now hit bottom and believe
that the growth outlook, even if it deteriorates, will not be as bad as Norges
Bank fears. We are also very doubtful whether the measures announced to
slow housing prices will work as intended. If they do not, growth in both
house prices and credit will be higher than the central bank is assuming.
Lower wage growth to ease upward pressure on
inflation
Source: Statistics Norway
Negative rates not on the cards
Source: Norges Bank, Danske Bank Markets

25 | 25 June 2015 www.danskeresearch.com
Nordic Outlook
In the short term, we expect the krone to remain relatively weak, due to
expectations of further rate cuts and limited liquidity over the summer
months. On a six-month view, however, we expect the data to show gradual
stabilisation of the Norwegian economy and continued pressure on the
housing market. We also expect oil prices to climb during the period. This
would exert upward pressure on the krone towards the end of this year and
into 2016.
In the longer term, we are setting great store by the oil investment survey
now suggesting that oil investment in the Norwegian sector will flatten out as
early as next year. If so, the downturn in the Norwegian oil sector is drawing
to a close and we can see both the cycle bottoming out and unemployment
peaking next spring. We would then be looking at a relatively prolonged
uptrend in the krone once the worst of the dust has settled.
NOK expected to appreciate
Source: Norges Bank, Danske Bank Markets
26 | 25 June 2015 www.danskeresearch.com
Nordic Outlook
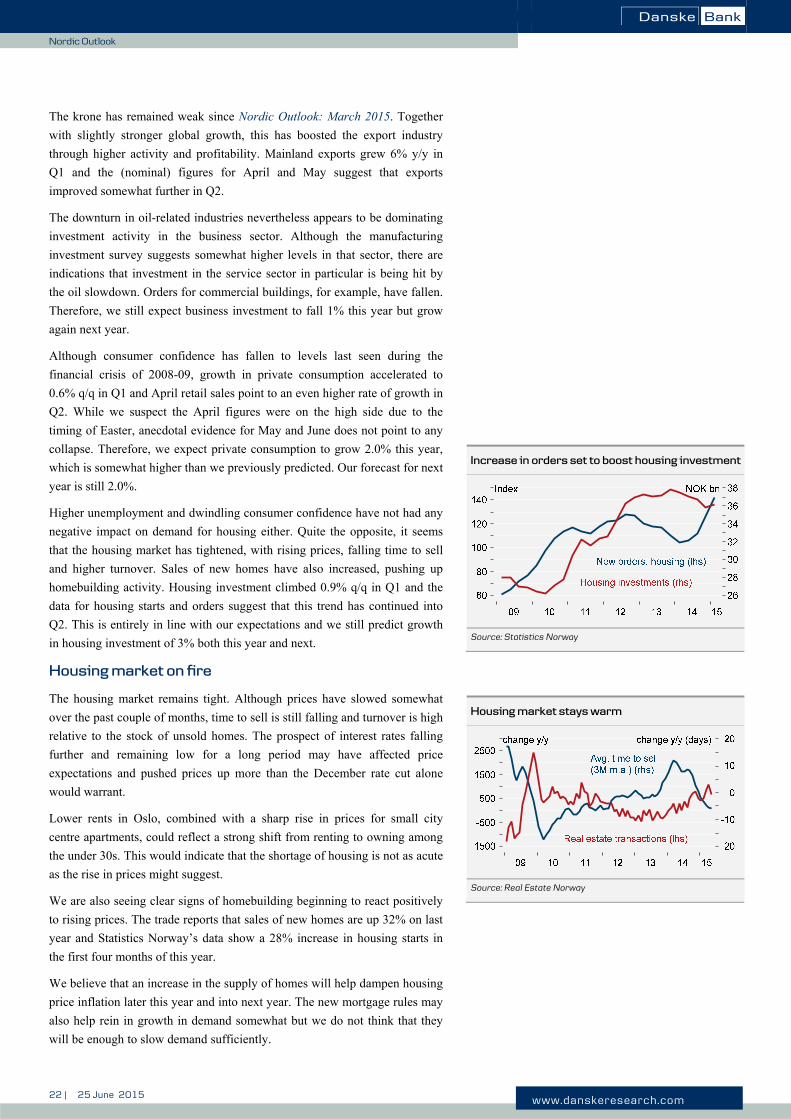
Norway: Forecast at a glance
Source: Danske Bank
National account 2013 2014 2015 2016
NOK bn (2012 prices)
Private consumption 1201.1 2.0 1.9 2.0
Public consumption 629.2 2.7 2.3 2.2
Gross fixed investment 704.8 0.6 -1.8 1.9
Petroleum activities 204.5 -1.7 -14.0 -2.5
Mainland Norway 492.2 1.7 0.5 4.4
Dwellings 149.2 -1.6 2.0 3.5
Enterprises 220.6 0.2 -2.0 1.5
General government 122.5 8.2 3.5 2.5
Mainland demand 2675.2 2.1 1.2 2.3
Growth contribution from stockbuilding 0.2 0.7 0.1
Exports 1168.5 2.7 1.6 1.5
Crude oil and natural gas 564.2 1.5 -1.0 0.0
Traditional goods 312.5 2.3 3.3 3.0
Imports 856.6 1.9 3.4 3.0
Traditional goods 508.1 -0.3 2.5 2.9
GDP 2987.2 2.2 1.5 1.9
GDP Mainland Norway 2347.2 2.2 1.5 2.3
Economic indicators 2014 2015 2016
Employment, % y/y 1.1 0.3 0.9
Labour force, % y/y 1.1 0.8 0.7
Unemployment (LFS), % 3.5 4.0 3.8
Annual wages, % y/y 3.1 2.7 3.0
Consumer prices, % y/y 2.0 2.1 2.0
Core inflation 2.4 2.5 2.2
Financial figures +3 mths +6 mths +12 mths
Repo rate, % p.a. 1.00 1.00 1.00 1.00
2-yr swap yield, % p.a. 1.26 1.30 1.30 1.40
10-yr swap yield, % p.a. 2.34 2.30 2.40 2.70
EUR/NOK 8.79 8.50 8.25 8.15
USD/NOK 7.86 8.17 7.78 7.41
24/06/2015
% y/y
Forecast

27 | 25 June 2015 www.danskeresearch.com
Nordic Outlook
Finland Signs of a slow recovery We have largely kept our forecast unchanged and expect Finnish
GDP to grow by 0.5% in 2015. Exports have grown disappointingly
slowly, but private consumption surprised on the upside in Q1. We
continue to expect modest growth in exports on the back of growth in
western markets, despite weak Russian demand.
The outlook for domestic demand continues to be dull. Household
purchasing power remains weak, due to unemployment and a
moderate wage agreement. A fall in consumer prices boosted private
consumption in early 2015, but the impact is unlikely to last.
Investment activity is also weak, but manufacturing capex shows
early signs of a recovery.
The new conservative three-party government is reform oriented and
fiscal policy will be tightened significantly. The government aims to
adjust public finances by a total of EUR10bn with a combination of
short-term and long-term measures. An investment package worth
EUR1.6bn will soften the negative blow from frontloaded
expenditure cuts, but growth is set to slow down in 2016. Failure to
carry out major reforms could put Finland on a slow growth path
and lead to a downgrade of sovereign ratings.
The government aims to achieve a ‘social contract’ in which annual
working hours would be extended, locally negotiated wage
agreements encouraged and income tax rates cut. Unit labour costs
should fall by 5% at least. The aim is to improve cost competitiveness
by an internal devaluation. Negotiations with the labour unions are
set to be tough this summer.
The housing market outlook is dull, and prices have decreased, but
trade volumes stabilised during the spring. Cautious supply of new
housing and low interest rates are helping to keep housing prices
relatively stable.
Thanks to manageable debt levels and low interest rates, the weak
GDP figures have not translated into a full-scale depression with
mass unemployment, bankruptcies and credit losses. Loan
performance has started to deteriorate recently, but from a very
strong position.
Despite a rising debt level, weak growth outlook and slow pace of
reforms, Finland continues to enjoy one of the lowest risk premiums
compared to Germany. Relative to other euro countries, Finnish
public finances are still among the best and the ECB’s expanded
asset purchase programme is large compared to the supply of bonds.
Changes relative to previous forecast
Source: Danske Bank Markets
% y/y 2015 2016 2015 2016
GDP 0.5 1.4 0.5 1.5
Private consumption 0.6 0.5 0.0 0.5
Public consumption 0.0 -0.5 0.0 0.0
Gross fixed investment -2.0 3.0 -1.5 3.0
Exports 2.0 4.0 3.0 4.0
Imports 1.0 2.5 1.5 2.5
Unemployment rate 9.2 9.0 9.0 8.8
Inflation 0.2 1.0 0.3 1.0
Government balance, % of GDP -3.1 -2.7 -2.7 -1.5
Current account, % of GDP -1.0 -0.7 -1.2 -0.7
Finland
Current forecast Previous forecast
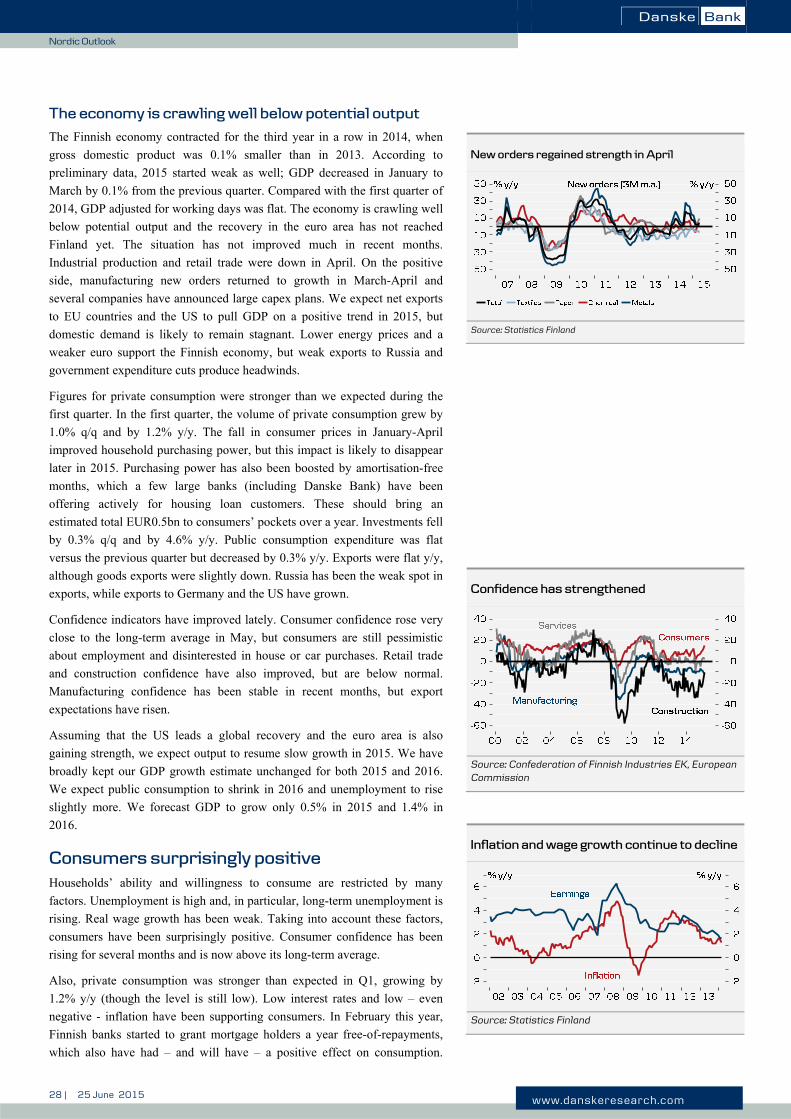
28 | 25 June 2015 www.danskeresearch.com
Nordic Outlook
The economy is crawling well below potential output
The Finnish economy contracted for the third year in a row in 2014, when
gross domestic product was 0.1% smaller than in 2013. According to
preliminary data, 2015 started weak as well; GDP decreased in January to
March by 0.1% from the previous quarter. Compared with the first quarter of
2014, GDP adjusted for working days was flat. The economy is crawling well
below potential output and the recovery in the euro area has not reached
Finland yet. The situation has not improved much in recent months.
Industrial production and retail trade were down in April. On the positive
side, manufacturing new orders returned to growth in March-April and
several companies have announced large capex plans. We expect net exports
to EU countries and the US to pull GDP on a positive trend in 2015, but
domestic demand is likely to remain stagnant. Lower energy prices and a
weaker euro support the Finnish economy, but weak exports to Russia and
government expenditure cuts produce headwinds.
Figures for private consumption were stronger than we expected during the
first quarter. In the first quarter, the volume of private consumption grew by
1.0% q/q and by 1.2% y/y. The fall in consumer prices in January-April
improved household purchasing power, but this impact is likely to disappear
later in 2015. Purchasing power has also been boosted by amortisation-free
months, which a few large banks (including Danske Bank) have been
offering actively for housing loan customers. These should bring an
estimated total EUR0.5bn to consumers’ pockets over a year. Investments fell
by 0.3% q/q and by 4.6% y/y. Public consumption expenditure was flat
versus the previous quarter but decreased by 0.3% y/y. Exports were flat y/y,
although goods exports were slightly down. Russia has been the weak spot in
exports, while exports to Germany and the US have grown.
Confidence indicators have improved lately. Consumer confidence rose very
close to the long-term average in May, but consumers are still pessimistic
about employment and disinterested in house or car purchases. Retail trade
and construction confidence have also improved, but are below normal.
Manufacturing confidence has been stable in recent months, but export
expectations have risen.
Assuming that the US leads a global recovery and the euro area is also
gaining strength, we expect output to resume slow growth in 2015. We have
broadly kept our GDP growth estimate unchanged for both 2015 and 2016.
We expect public consumption to shrink in 2016 and unemployment to rise
slightly more. We forecast GDP to grow only 0.5% in 2015 and 1.4% in
2016.
Consumers surprisingly positive Households’ ability and willingness to consume are restricted by many
factors. Unemployment is high and, in particular, long-term unemployment is
rising. Real wage growth has been weak. Taking into account these factors,
consumers have been surprisingly positive. Consumer confidence has been
rising for several months and is now above its long-term average.
Also, private consumption was stronger than expected in Q1, growing by
1.2% y/y (though the level is still low). Low interest rates and low – even
negative - inflation have been supporting consumers. In February this year,
Finnish banks started to grant mortgage holders a year free-of-repayments,
which also have had – and will have – a positive effect on consumption.
New orders regained strength in April
Source: Statistics Finland
Confidence has strengthened
Source: Confederation of Finnish Industries EK, European Commission
Inflation and wage growth continue to decline
Source: Statistics Finland

29 | 25 June 2015 www.danskeresearch.com
Nordic Outlook
More positive news from the world economy and the new government, which
was formed in May after elections, might also support consumer optimism.
The Russian slowdown has several implications for Finland. Russians are by
far the largest group of foreign citizens visiting Finland, as nearly 50% of
foreign tourists came from Russia in 2012. In particular, the retail trade,
hotels and local service businesses in Southeast Finland rely on Russian
consumers. Most recent statistics indicate that overnight stays by Russian
tourists fell by almost 50% y/y in Q1. The strengthening of the rouble seen
early in the year might soften the downturn.
The outlook for private consumption in 2015 is still quite weak, even if it
took us by surprise by growing in Q1. The latest data does not support the
view that growth should continue in Q2. Retail trade decreased by almost 3%
y/y in April. The registration of new cars also went down by 9.9% y/y in
May. Part of this weakness is explained by the planned tax change.
Household purchasing power is likely to remain flat at best due to
unemployment and a very moderate wage agreement announced on 15 June.
Most salaries will rise 0.43%, or at least EUR16 per month, in 2016.
Low interest rates and low inflation will help to sustain activity. Some
positive effect is also coming from the free-of-repayments campaign. We
expect private consumption to increase modestly by 0.6% in 2015 and 0.5%
in 2016.
Exports weak despite a growing global economy
Among euro area economies, Finland is a rare example of a country that has
not seen much real growth in exports in three years. In the first quarter of
2015, exports of goods decreased by 1.3% y/y as exports of services
increased by 3.5% y/y. Overall, total exports were flat. Exports to Germany
and the US have held up quite well, but exports to Sweden, the UK and
especially to Russia have decreased. The relative share of Russia has
decreased dramatically since the Ukrainian crisis and Russia is now the sixth-
largest export destination country.
Exports of goods have suffered long-term damage from the decline of Nokia
and forest industries. Nokia phones are now gone and that impact is
disappearing. Exports have also suffered from a high share of investment
goods, which have been in short demand globally, falling demand for
newsprint, and poor price competitiveness caused by wage increases between
2008-2012. The new government aims to achieve a ‘social contract’ in which
annual working hours are extended, locally negotiated wage agreements
encouraged, and income tax rates cut. Unit labour costs should fall by at least
5%. The wage agreements for 2015-2016 are very modest. The aim is to
improve cost competitiveness by way of internal devaluation.
The shorter-term outlook for the main Finnish export markets (Germany,
Sweden, the US) has remained relatively good, with Russia being an
exception. The weakening of the euro should help exports to the US. The
Swedish krona and Russian rouble have weakened even more, so there the
currency does not give any tailwind. Russia is slipping into a recession. We
expect Russian GDP and imports to fall significantly in 2015, which keeps
the export outlook poor. But if the Russian economy starts to recover later
this year as expected, the worst might be behind us by the end of this year.
Russian trade has been volatile in the past too. The collapse of trade with the
Soviet Union was a major reason behind the Finnish depression in the early
Trade with Russia is volatile
Source: Finnish Customs

30 | 25 June 2015 www.danskeresearch.com
Nordic Outlook
1990s. The Russian crisis in 1998 nearly halved Finnish exports to Russia,
but that time Finland did not suffer a recession, because other exports
performed well.
Poor manufacturing confidence and low order book levels suggest that
exports continue to perform modestly at best in 2015. However, the future-
looking export expectations in industry are surprisingly high. Assuming a
continued recovery in the euro area and a brighter global outlook, we expect
exports to rise by 2% in 2015. The negative impact from the Russian
recession should abate in 2016, which would allow Finnish exports to grow a
little faster, i.e by 4%. If pent-up investment demand is released in Europe
and Finland regains competitiveness through falling unit labour costs, exports
could grow relatively fast in the medium term.
Finland had a current account surplus from 1994 to 2010, but fell with the
trade balance into a small deficit in 2011. We expect a current account deficit
also in 2015-2016, driven by large net transfers. The cuts in development aid
planned by the new government should reduce the current account deficit a
bit. The trade balance has actually been balanced, thanks to falling imports.
The current account deficit is forecast to narrow to 1.0% of GDP in 2015.
Early signs of recovery in investments
After falling 5.1% in 2014, investments fell by 4.6% y/y or by 0.3% q/q in
Q1. Private investments declined by 3.8% and government investments by
7.3% y/y. Housing construction investments fell by 4.6%, while the volatile
machinery, equipment and transport equipment investments shrank by 5.3%
y/y. After the new national account system (ESA 2010), a new subsection
was added to investments: cultivated biological resources and intellectual
property products, which includes especially R&D activities. These
expenditures are significant – around the size of machinery, equipment and
transport equipment investments combined. R&D activities tend to be more
stable over business cycles, but these expenditures have suffered from Nokia-
related cuts in recent years. R&D recorded a 3% drop in Q1 15. Thus,
Finnish companies have cut investment in all forms of capital.
The future might be less bleak. Construction confidence has improved and
the number of building permits rose 4% y/y in Q1. Several companies have
announced large capex decisions in the past few weeks. These plans include
pulp and packaging material investments in the forest industry, which
continues to reduce capacity in printing paper. However these investments
will have direct effects only after 2015. An annual survey by the
Confederation of Finnish Industries (EK) shows that companies have
increased their investment plans significantly. The main factors behind the
lack of investment - uncertainty about growth outlook, Russian situation and
government policies – have diminished. Finance and other resources are
available. The new government pursues a business friendly policy.
We forecast investments to fall 2% in 2015, which would mark a fourth
consecutive year that fixed investments have shrunk. The last time
investments contracted for three successive years was in the early 1990s
recession. In 2016, increasing external demand and a recovery in the
construction sector is expected to turn investments into a 3% growth.
Export expectations very high
Source: Statistics Finland, European Commission
Investments have been shrinking
Source: Statistics Finland

31 | 25 June 2015 www.danskeresearch.com
Nordic Outlook
Housing market stabilising
Prices for old dwellings in Finland have been slowly declining during 2014
and the decline continued in the first quarter of 2015. In Q1 15 prices fell by -
0.2% q/q and by -1.1% y/y. High unemployment, the slowing economy and
weak purchasing power are the main factors behind the housing market
weakness. On the other hand, record low interest rates and declining margins
have been supportive. Also, the chronic lack of supply in growth centres,
especially in the Helsinki Metropolitan Area, supports the price level.
However, there are signs that the situation is stabilising. According to the
preliminary figures, house prices rose by 0.2% m/m in April. The number of
property transactions seems to be picking up after a long decline. Consumer
intentions to buy a dwelling have increased in 2015, even though the level is
still quite low. New mortgages were taken with EUR1.6bn in April, which is
the highest figure since 2012.
The debt-to-income ratio of Finnish households, although it has been slowly
increasing, is still well below that of other Nordic countries. Finnish
households are still able to amortise debt as the exceptionally low interest
rate transmits effectively in the Finnish housing market due to the high
percentage of variable rate loans.
Housing market conditions remain uncertain for 2015. The demand side is
being squeezed due to high unemployment and real wages stagnating. The
economic outlook is murky and the incentive to buy is falling as the share of
deductibility of housing loan interests in taxation is declining gradually. We
expect nominal prices to modestly decline by -1.0 % in 2015.
Despite the past price increases, we do not see excessive pricing in the
markets, risking a housing market collapse, as prices have generally risen in
line with earnings. The price-to-rent ratio is signalling a similar picture. A
major decline in house prices could be initiated only by much higher long-
term unemployment or surging interest rates, which both look unlikely
despite the lacklustre economic outlook.
Fiscal austerity and reforms ahead
The new conservative three party government led by prime minister Juha
Sipilä is reform-oriented and fiscal policy will be tightened significantly. The
government aims to adjust public finances by a total of EUR10bn with a
combination of short-term and long-term measures. An investment package
worth EUR1.6bn will soften the negative blow from frontloaded expenditure
cuts, but growth should slow down in 2016. Reforms in the production of
public services and the labour market are essential for the sustainability of
public finances and for raising the long-term growth potential. Bank of
Finland economists have recently estimated that without reforms potential
growth could get stuck close to 1% per annum.
The government also aims to achieve a ‘social contract’ with labour market
unions, in which annual working hours would be extended, locally negotiated
wage agreements encouraged and income tax rates cut. Unit labour costs
should fall by 5% at least. The aim is to improve cost competitiveness by an
internal devaluation. The government has promised a cut to income tax if an
agreement is reached. Negotiations with the unions take place this summer,
and the negotiations will not be easy. At worst, a general strike could happen.
At best, the Finnish economy regains competitiveness and potential growth
rises.
House prices in the Nordic countries
Source: National statistics offices

32 | 25 June 2015 www.danskeresearch.com
Nordic Outlook
Together with other business friendly reforms in the labour market, local
administration, production of social and health care and regulatory processes
the government could lift long-term growth. The success is contingent on
implementation, which will not be easy. Moody’s placed Finland on a
negative outlook recently and S&P has downgraded the sovereign rating to
AA+ already, but the reforms should satisfy rating agencies and Finland
continues to enjoy one of the lowest risk premiums compared to Germany.
Despite the expenditure cuts and modest recovery in the economy, the fiscal
deficit should go away slowly and debt should continue to accumulate into
the next decade. We forecast the debt ratio to reach 62% by the end of 2015.
Even if Finland was reprimanded for exceeding the deficit target in 2014 and
the debt is likely to exceed the 60% limit in 2015, it is unlikely to get into
problems with the EU Commission. Growth in debt has a background weak
grow, fiscal policy will be tightened, reforms are being planned and many
other countries have gotten away with large debts.
Long-term unemployment increasing worryingly
The seasonally adjusted unemployment rate rose to 9.6% in April. The
unemployment rate in Finland is thus lower than the eurozone average even if
the economic development in Finland has been poor. During the Finnish
depression in the early 90s the unemployment rate rose to almost 20%.
However, the official figure understates the poor labour market conditions, as
many jobseekers have become discouraged and stopped looking for a job.
This can be seen in the increasing share of the inactive population during the
last few years. Declining employment numbers, scarcity of new vacancies
and limited wage pressures indicate that the weakness is due to inadequate
demand and is not structural. What’s worrying is that the number of long-
term unemployed has increased, indicating that more and more of the
unemployed have been without a job for at least 12 months. For this segment
it is harder to find a new job and many of them will stay out of the workforce
for ever.
We forecast the average unemployment rate to be 9.2 % in 2015 and slowly
decline to 9.0% next year. As the economic and labour market conditions
improve 2016 and later, part of the population now outside of the labour
force will return to seek jobs, keeping the unemployment rate over 8% for
longer. There are already the first signs that the growth of disguised
unemployed has started to decline. The retirement wave which started in
2010 is likely to continue and the working age population should decrease
until the 2020s. This trend will put a ceiling on the number of employed
persons and dampen the growth potential markedly.
Debt level inching up in the absence of growth
% of GDP % of GDPPublic debt
Central government debt
Public deficit-8
8
24
40
56
-8
8
24
40
56
75 80 85 90 95 00 05 10
Source: Statistics Finland
Unemployment rate rising in Finland
Source: Statistics Finland, Eurostat

33 | 25 June 2015 www.danskeresearch.com
Nordic Outlook
Finland: Forecast at a glance
Source: Danske Bank
National account 2013 2014 2015 2016
EUR bn (current prices)
GDP 202.0 -1.3 -0.1 0.5 1.4
Imports 79.4 -1.6 -1.4 1.0 2.5
Exports 77.6 -0.7 -0.4 2.0 4.0
Consumption 161.3 -0.2 -0.1 0.4 0.2
- Private 111.2 -0.6 -0.2 0.6 0.5
- Public 50.2 0.6 0.2 0.0 -0.5
Investments 42.7 -5.3 -5.1 -2.0 3.0
Economic indicators 2013 2014 2015 2016
Unemployment rate, % 8.2 8.7 9.2 9.0
Earnings, % y/y 2.1 1.4 1.1 1.1
Inflation, % y/y 1.5 1.0 0.2 1.0
Housing prices, % y/y 1.6 -0.6 -1.0 1.5
Current account, EUR bn -3.6 -3.8 -2.0 -1.5
- % of GDP -1.8 -1.9 -1.0 -0.7
Public deficit, % of GDP -2.5 -3.2 -3.1 -2.7
Public debt/GDP, % of GDP 55.8 59.3 62.0 63.5
Financial figures +3 mths +6 mths +12 mths
Repo rate, % p.a. 0.05 0.05 0.05 0.05
2-yr swap yield, % p.a. 0.13 0.10 0.10 0.20
10-yr swap yield, % p.a. 1.18 1.20 1.30 1.60
EUR/USD 1.12 1.04 1.06 1.10
% y/y
24/06/2015
Forecast

34 | 25 June 2015 www.danskeresearch.com
Nordic Outlook
Global overview Reflation theme building With inflation picking up and global growth strengthening, a reflation
theme is brewing. Even though core inflation is expected to stay
moderate, the continued decline in unemployment amid higher inflation
is set to fuel a reflation story.
We look for global growth to improve following a very weak Q1, as the
US and China recover and the euro-area economy continues with decent
growth.
In our view potential growth has come down substantially in both the
developed and emerging markets. One implication is that the output gap
will likely close faster than consensus expects as it takes less growth to
lower unemployment.
The Fed is expected to raise interest rates in September. Although the
hiking path should be moderate, we believe it will be faster than what the
market is pricing. We expect the ECB to run the QE programme until
September 2016, but believe that the market focus on exit will increase in
early 2016.
From deflation fears back to reflation
A reflation theme is building in the global economy and financial markets as
global growth is set to recover alongside a fairly sharp rise in inflation in the
second half of the year. The latter is driven by a reversal from negative to
positive energy inflation, but will nevertheless reduce deflation fears and spur
some concern that it could feed into core inflation as slack in labour markets
is also coming down.
The tightening of labour markets could happen faster than expected due to a
general trend of lower productivity growth over the past years in combination
with a more adverse development in the labour force. Unless this changes
soon, it means it takes a lot less growth to reduce unemployment than before,
as evident from both the euro area and the US in the past years. Euro
unemployment has fallen by one percentage point since April 2014 from
12.1% to 11.1% with an average GDP growth rate of just 1%. In the US the
unemployment rate has declined steadily since 2010 based on economic
growth of only 2.2%. As growth in both the US and the euro area is expected
to pick up in 2016 to 2.6% and 2.0%, respectively, we could see slack being
used up quite fast and wage pressures emerge.
In the US, wage inflation is already showing signs of a pick-up. While we
look for a gradual Fed hiking cycle, the Fed may be challenged by rising
inflation pressures forcing them to tighten faster than expected. We believe
the market is pricing a too low path of Fed hikes as it looks for only 75bp per
year in 2016 and 2017. In the euro area, wage growth is still subdued but as
2016 progresses the focus may start to turn to a gradual increase in wage
pressures. It means the ECB will probably have to end the QE programme as
planned in September 2016.
GDP outlook: Continued global recovery
Source: Bloomberg, Danske Bank Markets
Repeat of 2014 - growth to pick up in Q2 and Q3
Source: Macrobond Financial, Danske Bank Markets
Inflation to rise as energy price growth turns positiv
Source: Macrobond Financial, Danske Bank Markets
% y/yD anske
B ank C o nsensusD anske
B ank C o nsensus
USA 2.2 2.5 2.7 2.8
Euro area 1.4 1.5 2.0 1.7
Japan 1.0 0.9 1.4 1.5
China 6.9 7.0 6.8 6.7
Global 3.4 3.5 3.8 3.8
2015 2016

35 | 25 June 2015 www.danskeresearch.com
Nordic Outlook
Global growth recovers
Following a disappointing first quarter, we look for rising growth in the US
and China in coming quarters. This is very much a repeat of 2014, where a
similar pattern was evident.
Several one-off factors contributed to the slow activity in the US in Q1: the
weather was unusually cold, hitting consumption; port strikes on the West
coast took a toll on exports; and, at the same time, there seem to have been
some seasonal adjustment issues pushing GDP lower. However, there are
increasing signs that the economy is recovering now: leading indicators are
picking up, jobless claims have declined, consumption indicators point to a
rebound and housing activity has been strong going into Q2. The big drag
from energy investments is likely to stay with us for some time, though.
Looking further ahead we expect growth to continue above trend with the
economy growing 2.6% in 2016 following 2% this year. We expect
consumers to drive the recovery, supported by low rates, healthy job gains,
rising wage growth and strong wealth gains from the housing market.
In China signs are accumulating that growth will recover somewhat in
coming quarters to around 7% from 5% in Q1. It follows the stimulus from
the Chinese authorities, and housing which normally turns first is starting to
rebound. Growth is expected to moderate again in the second half, though, as
China is still in a deleveraging process and the government is focusing more
on long-term sustainability and reforms than short-term growth.
Europe was the positive news at the beginning of 2015, with data surprising
to the upside and the economy growing at the fastest pace since 2011 in the
past two quarters. The economy has been pulled by stronger consumption and
investments while exports disappointed due to the weakness in the US and
China. Looking ahead we expect the recovery to continue, but growth may
moderate slightly as consumption growth is set to slow, with the effect from
lower oil prices reversing following the bottom in oil prices from EUR40 in
January to just below EUR60 in May. Export growth is set to strengthen,
though, with the US and China recovering and the weak euro improving
competitiveness. Investments will also be supported by low rates, credit
flowing again and a moderately positive outlook.
The Japanese economy has recovered from the VAT hike last year and had
the strongest growth in Q1 among the developed regions, rising 4%
annualised. Looking ahead we expect some moderation to around 1½% in the
rest of the year and in 2016 as the post-VAT rebound will fade again.
The main risk to the outlook stems from Greece, disruptive moves in
financial markets due to declining liquidity and geopolitical risks in the
Middle East that could cause a spike in oil prices.
Productivity growth has come down during the past
10 years
Source: Macrobond Financial, Danske Bank Markets
Labour markets are set to get tighter over the next
year
Source: Macrobond Financial, Danske Bank Markets
Real money growth points to robust euro recovery
Source: Macrobond Financial, Danske Bank Markets

36 | 25 June 2015 www.danskeresearch.com
Nordic Outlook
Economic forecast
Source: OECD and Danske Bank. 1) % y/y. 2) % contribution to GDP growth. 3) % of labour force. 4) % of GDP.
Macro forecast, Scandinavia
Denmark 2014 1.1 0.6 1.4 3.7 0.3 2.6 3.8 0.6 5.1 1.8 45.2 6.32015 1.7 1.9 1.0 0.2 -0.4 3.4 1.9 0.7 4.7 -1.0 38.6 7.12016 2.1 1.9 0.3 3.2 0.1 4.9 4.6 1.7 4.4 -2.1 37.9 6.8
Sweden 2014 2.3 2.4 1.9 7.4 0.2 3.3 6.6 -0.2 7.9 -2.1 43.9 5.72015 2.3 2.0 1.6 5.3 0.1 3.8 4.9 0.2 7.8 -1.8 44.5 5.42016 2.3 2.0 1.1 3.6 0.0 5.3 5.2 1.5 7.6 -0.9 44.8 5.4
Norway 2014 2.2 2.0 2.7 0.6 0.2 2.7 1.9 2.0 3.5 - - -2015 1.5 1.9 2.3 -1.8 0.7 1.6 3.4 2.1 4.0 - - -2016 2.3 2.0 2.2 1.9 0.1 1.5 3.0 2.0 3.8 - - -
Macro forecast, Euroland
Euroland 2014 0.9 1.0 0.6 1.1 -0.1 3.7 4.0 0.4 11.6 -2.6 92.0 2.52015 1.5 1.7 1.1 2.5 0.0 3.8 4.6 0.3 11.0 -2.1 94.1 2.62016 2.0 1.1 0.7 5.5 0.0 4.2 4.1 1.5 10.2 -1.7 92.8 2.5
Germany 2014 1.6 1.2 1.1 3.4 -0.1 3.8 3.3 0.8 5.0 0.2 74.5 7.12015 2.3 2.4 1.1 3.0 0.0 5.7 5.3 0.4 5.0 0.0 72.4 7.12016 2.6 1.6 0.8 6.8 0.0 4.9 5.3 2.1 4.7 0.2 69.6 6.7
France 2014 0.4 0.6 1.9 -1.6 -0.1 2.7 3.8 0.6 10.2 -4.4 95.5 -1.92015 0.7 1.1 1.0 -0.7 0.0 4.6 4.2 0.0 10.4 -4.5 98.1 -1.92016 1.0 0.8 0.4 3.1 0.0 3.4 4.0 1.3 10.2 -4.7 99.8 -2.2
Italy 2014 -0.4 0.3 -0.9 -3.2 0.3 2.4 1.6 0.2 12.7 -3.0 132.2 1.52015 0.5 0.8 0.5 -0.7 0.0 4.3 2.6 0.0 12.6 -2.7 133.8 1.52016 1.4 0.7 0.4 3.4 0.0 4.3 3.8 1.4 12.4 -2.2 132.7 1.8
Spain 2014 1.4 2.4 0.1 3.4 -0.1 4.2 7.6 -0.2 24.5 -5.6 98.1 0.52015 2.4 2.7 -0.7 5.3 0.0 5.1 5.8 -0.7 23.2 -4.5 101.2 0.72016 2.6 1.9 0.4 6.8 0.0 4.5 4.9 1.3 21.7 -3.7 100.6 0.9
Finland 2014 -0.1 -0.2 0.2 -5.1 - -0.4 -1.4 1.0 8.7 -3.2 59.3 -1.92015 0.5 0.6 0.0 -2.0 - 2.0 1.0 0.2 9.2 -3.1 62.0 -1.02016 1.4 0.5 -0.5 3.0 - 4.0 2.5 1.0 9.0 -2.7 63.5 -0.7
Macro forecast, Global
USA 2014 2.4 2.5 -0.2 5.3 0.0 3.2 4.0 1.6 6.2 -4.1 101.0 -2.32015 2.2 3.0 0.6 3.5 0.1 2.0 5.4 0.2 5.4 -2.9 104.0 -2.52016 2.7 2.9 0.9 5.1 -0.1 4.6 4.8 2.1 5.0 -2.6 103.0 -2.6
Japan 2014 -0.1 -1.4 0.3 2.6 0.1 8.4 7.4 2.4 3.6 -7.0 245.0 0.52015 1.0 0.0 0.9 0.8 0.2 7.6 5.0 1.0 3.3 -6.5 245.0 2.22016 1.4 1.4 1.2 1.2 -0.1 6.0 7.4 1.6 3.1 -6.2 246.0 2.0
China 2014 7.4 - - - - - - 2.0 4.3 -1.1 40.7 1.82015 6.8 - - - - - - 1.7 4.2 -0.8 41.8 2.42016 6.7 - - - - - - 2.3 4.2 -0.8 42.8 2.3
UK 2014 2.8 2.5 2.1 7.8 -0.2 0.6 2.2 1.5 6.2 -5.4 88.7 -4.82015 2.8 2.5 0.7 6.1 0.0 2.4 3.9 0.3 5.5 -4.6 90.1 -4.32016 2.8 2.3 -1.0 7.5 0.0 4.7 4.7 1.6 5.3 -3.6 91.0 -3.6
Year GDP 1
Private
cons.1Public
cons.1Fixed
inv.1Stock
build.2Current
acc.4Im-
ports1
Public
debt4
Public
budget4
Ex-
ports1
Infla-
tion1
Unem-
ploym.3
Ex-
ports1
Im-
ports1
Infla-
tion1
Unem-
ploym.3Public
budget4
Current
acc.4Public
debt4
Unem-
ploym.3Public
budget4
Public
debt4Year
Year GDP 1
Private
cons.1Public
cons.1Fixed
inv.1Stock
build.2
Current
acc.4GDP 1
Private
cons.1Public
cons.1Fixed
inv.1Stock
build.2Ex-
ports1
Im-
ports1
Infla-
tion1

37 | 25 June 2015 www.danskeresearch.com
Nordic Outlook
Financial forecast
Source: Danske Bank
Bond and money marketsCurrency
vs USDCurrency
vs DKK
USD 24-Jun - 666.9
+3m - 716.8
+6m - 703.3+12m - 677.7
EUR 24-Jun 111.9 746.0
+3m 104.0 745.5
+6m 106.0 745.5+12m 110.0 745.5
JPY 24-Jun 124.1 5.37
+3m 125.0 5.73
+6m 126.0 5.58+12m 127.0 5.34
GBP 24-Jun 157.5 1050.1
+3m 149.0 1065.0
+6m 151.0 1065.0+12m 155.0 1050.0
CHF 24-Jun 93.4 714.1
+3m 100.0 716.8
+6m 99.1 710.0+12m 100.0 677.7
DKK 24-Jun 666.9 -
+3m 716.8 -
+6m 703.3 -+12m 677.7 -
SEK 24-Jun 823.7 81.0
+3m 894.2 80.2
+6m 867.9 81.0+12m 818.2 82.8
NOK 24-Jun 786.0 84.8
+3m 817.3 87.7
+6m 778.3 90.4+12m 740.9 91.5
Equity Markets
Regional
Price trend12 mth.
Regional recommen-dations
USA (USD) Strong USD, muted earnings growth, expensive valuation 5-8% Underweight
Emerging markets (local curr) Commodity-related equities are pressured 0-5% Underweight
Japan Reflation, earnings growth, fair valuation 5-10% Overweight
Europe (ex. Nordics) Reflation, strong earnings growth, fair valuation 10-15% OverweightNordics Earnings growth, fair valuation 5-10% Overweight
CommoditiesAverage
Q1 Q2 Q3 Q4 Q1 Q2 Q3 Q4 2015 2016
NYMEX WTI 49 58 65 71 72 72 73 73 61 73
ICE Brent 55 64 70 76 77 77 78 78 66 78
Copper 5,808 5,750 6,000 6,250 6,400 6,550 6,700 6,850 5,952 6,625
Zinc 2,091 2,100 2,150 2,200 2,225 2,250 2,275 2,300 2,135 2,263
Nickel 14,410 14,500 15,500 16,500 17,000 17,500 18,000 18,500 15,227 17,750
Aluminium 1,813 1,800 1,875 1,950 2,000 2,050 2,100 2,150 1,860 2,075
Gold 1,219 1,209 1,199 1,189 1,179 1,179 1,179 1,179 1,204 1,179
Matif Mill Wheat (�/t) 190 190 209 208 208 206 204 202 199 205
Rapeseed (�/t) 360 360 381 361 360 356 352 340 366 352
CBOT Wheat (USd/bushel) 523 530 550 565 580 595 610 625 542 603
CBOT Corn (USd/bushel) 385 390 400 410 420 430 440 450 396 435CBOT Soybeans (USd/bushel) 990 1,000 1,000 975 1,000 1,025 1,050 1,050 991 1,031
0.28
-0.01
0.10
0.57
382
-0.25
-0.79
-
--
-0.05
-0.10
-0.05
0.62
0.871.45
-0.01
-0.01
0.20
0.15
Key int.rate
0.25
0.50
0.751.25
1.00
-0.85
0.05
0.05
0.100.10
0.50
1.00
-0.25
1.00
-0.35-0.35
0.05
0.75
10-yr swap yield
-0.21
0.05
0.050.05
3m interest rate
1.25
0.05
0.10
0.50
-0.75
0.05
-0.01
0.65
0.831.26
1.00
1.00
1.25
-0.85-0.85
-0.25
0.10
-0.20
0.20
1.30
0.15
0.150.25
-
--
-0.04
0.05
-0.30
1.652.00
1.30
1.551.95
-
-
1.30
0.00
-
1.40
0.00
1.261.29
1.25
-0.30
111.9
-
-
--
138.8
745.5
745.5745.5
921.4
879.3
815.0
930.0
825.0
920.0900.0
850.0
104.5
746.0
70.0
71.0
104.0
105.0110.0
104.0
106.0110.0
130.0
133.6139.7
Currencyvs EUR
2-yr swap yield
Risk profile3 mth.
Price trend3 mth.
2.70
2.48
2.85
0.92
0.13
0.15
1.17
-0.71
0.27
0.10
0.100.20
1.45
71.0
3.05
70.0
368
24-Jun
61
12,765
5,817
2,059
1,175
184
64
1,732
20162015
1.20
1.301.60
-
--
2.23
2.20
0.64
Medium 0-5%
985
524
1.18
1.701.95
2.34
2.30
2.40
2.302.60
0.41
-
--
2.70
1.551.85
1.45
1.61
1.60
1.50
Medium
Medium
Medium 0-8%
Medium 0-5%
0-5%
0-5%

38 | 25 June 2015 www.danskeresearch.com
Nordic Outlook
Disclosures This research report has been prepared by Danske Bank Markets, a division of Danske Bank A/S (‘Danske Bank’). The authors of this research report are listed on page 2.
Analyst certification
Each research analyst responsible for the content of this research report certifies that the views expressed in this research report accurately reflect the research analyst’s
personal view about the financial instruments and issuers covered by the research report. Each responsible research analyst further certifies that no part of the compensation
of the research analyst was, is or will be, directly or indirectly, related to the specific recommendations expressed in the research report.
Regulation
Danske Bank is authorised and subject to regulation by the Danish Financial Supervisory Authority and is subject to the rules and regulation of the relevant regulators in all
other jurisdictions where it conducts business. Danske Bank is subject to limited regulation by the Financial Conduct Authority and the Prudential Regulation Authority
(UK). Details on the extent of the regulation by the Financial Conduct Authority and the Prudential Regulation Authority are available from Danske Bank on request.
The research reports of Danske Bank are prepared in accordance with the Danish Society of Financial Analysts’ rules of ethics and the recommendations of the Danish
Securities Dealers Association.
Conflicts of interest
Danske Bank has established procedures to prevent conflicts of interest and to ensure the provision of high-quality research based on research objectivity and independence.
These procedures are documented in Danske Bank’s research policies. Employees within Danske Bank’s Research Departments have been instructed that any request that
might impair the objectivity and independence of research shall be referred to Research Management and the Compliance Department. Danske Bank’s Research Departments
are organised independently from and do not report to other business areas within Danske Bank.
Research analysts are remunerated in part based on the overall profitability of Danske Bank, which includes investment banking revenues, but do not receive bonuses or other
remuneration linked to specific corporate finance or debt capital transactions.
Financial models and/or methodology used in this research report
Calculations and presentations in this research report are based on standard econometric tools and methodology as well as publicly available statistics for each individual
security, issuer and/or country. Documentation can be obtained from the authors on request.
Risk warning
Major risks connected with recommendations or opinions in this research report, including a sensitivity analysis of relevant assumptions, are stated throughout the text.
Expected updates
Nordic Outlook is a quarterly forecast but new statistical data may give rise to changes in our views on individual economies.
Date of first publication
See the front page of this research report for the date of first publication.
General disclaimer This research has been prepared by Danske Bank Markets (a division of Danske Bank A/S). It is provided for informational purposes only. It does not constitute or form part
of, and shall under no circumstances be considered as, an offer to sell or a solicitation of an offer to purchase or sell any relevant financial instruments (i.e. financial
instruments mentioned herein or other financial instruments of any issuer mentioned herein and/or options, warrants, rights or other interests with respect to any such
financial instruments) (‘Relevant Financial Instruments’).
The research report has been prepared independently and solely on the basis of publicly available information that Danske Bank considers to be reliable. While reasonable
care has been taken to ensure that its contents are not untrue or misleading, no representation is made as to its accuracy or completeness and Danske Bank, its affiliates and
subsidiaries accept no liability whatsoever for any direct or consequential loss, including without limitation any loss of profits, arising from reliance on this research report.
The opinions expressed herein are the opinions of the research analysts responsible for the research report and reflect their judgement as of the date hereof. These opinions
are subject to change and Danske Bank does not undertake to notify any recipient of this research report of any such change nor of any other changes related to the
information provided in this research report.
This research report is not intended for retail customers in the United Kingdom or the United States.
This research report is protected by copyright and is intended solely for the designated addressee. It may not be reproduced or distributed, in whole or in part, by any recipient
for any purpose without Danske Bank’s prior written consent.
Disclaimer related to distribution in the United States This research report is distributed in the United States by Danske Markets Inc., a U.S. registered broker-dealer and subsidiary of Danske Bank, pursuant to SEC Rule 15a-6
and related interpretations issued by the U.S. Securities and Exchange Commission. The research report is intended for distribution in the United States solely to ‘U.S.
institutional investors’ as defined in SEC Rule 15a-6. Danske Markets Inc. accepts responsibility for this research report in connection with distribution in the United States
solely to ‘U.S. institutional investors’.
Danske Bank is not subject to U.S. rules with regard to the preparation of research reports and the independence of research analysts. In addition, the research analysts of
Danske Bank who have prepared this research report are not registered or qualified as research analysts with the NYSE or FINRA but satisfy the applicable requirements of a
non-U.S. jurisdiction.
Any U.S. investor recipient of this research report who wishes to purchase or sell any Relevant Financial Instrument may do so only by contacting Danske Markets Inc.
directly and should be aware that investing in non-U.S. financial instruments may entail certain risks. Financial instruments of non-U.S. issuers may not be registered with the
U.S. Securities and Exchange Commission and may not be subject to the reporting and auditing standards of the U.S. Securities and Exchange Commission.

D a n s k e B a n k , D a n s k e R e s e a r c h , H o l m e n s K a n a l 2 - 1 2 , D K - 1 0 9 2 C o p e n h a g e n K . P h o n e + 4 5 4 5 1 2 0 0 0 0 w w w. d a n s k e r e s e a r c h . co m
N o r way
C h i e f A n a l y s t & H e a d of F r a n k J u l l u m+ 4 7 8 5 4 0 6 5 4 0f j u @ d a n s k e b a n k . n o
J o s te i n T v e d t+ 4 7 2 3 1 3 9 1 8 4j t v @ d a n s k e b a n k . c o m
F i N l a N d
C h i e f A n a l y s t & H e a d of P a s i P e t te r i K u o p p a m ä k i+ 3 5 8 1 0 5 4 6 7 7 1 5p a k u @ d a n s k e b a n k . c o m
H e n n a P ä i v i k k i M i k ko n e n + 3 5 8 1 0 5 4 6 6 6 1 9h m i @ d a n s k e b a n k . c o m
i N t e r N at i o N a l M a c r o
C h i e f A n a l y s t & H e a d of A l l a n v o n M e h r e n + 4 5 4 5 1 2 8 0 5 5a l v o @ d a n s k e b a n k . d k
S i g n e P. R o e d - F r e d e r i k s e n + 4 5 4 5 1 2 8 2 2 9s r o e @ d a n s k e b a n k . d k
F l e m m i n g J e g b j æ r g N i e l s e n + 4 5 4 5 1 2 8 5 3 5f l e m m @ d a n s k e b a n k . d k
P e r n i l l e B o m h o l d t H e n n e b e r g+ 4 5 4 5 1 3 2 0 2 1p e r n i @ d a n s k e b a n k . d k
F i x e d i N c o M e r e s e a r c h
C h i e f A n a l y s t & H e a d of A r n e L o h m a n n R a s m u s s e n + 4 5 4 5 1 2 8 5 3 2a r r @ d a n s k e b a n k . d k
J e n s P e te r S ø r e n s e n+ 4 5 4 5 1 2 8 5 1 7 j e n s s r @ d a n s k e b a n k . d k
C h r i s t i n a E . Fa l c h + 4 5 4 5 1 2 7 1 5 2c h f a @ d a n s k e b a n k . d k
J a n We b e r Ø s te r g a a r d+ 4 5 4 5 1 3 0 7 8 9j a s t @ d a n s k e b a n k . d k
A n d e r s M ø l l e r L u m h o l t z+ 4 5 4 5 1 2 8 4 9 8a n d j r g @ d a n s k e b a n k . d k
H a n s R o a g e r J e n s e n+ 4 5 4 5 1 3 0 7 8 9h r o a @ d a n s k e b a n k . d k
A n d e r s Ve s te r g å r d F i s c h e r+ 4 5 4 5 1 3 6 6 4 1a f i s @ d a n s k e b a n k . d k
F x & c o M M o d i t i e s s t r at e g y
G l o b a l H e a d of F I C C R e s e a r c hT h o m a s H a r r+ 4 5 4 5 1 3 6 7 3 1th h a r @ d a n s k e b a n k . d k
C h r i s t i n K y r m e Tu x e n+ 4 5 4 5 1 3 7 8 6 7tu x @ d a n s k e b a n k . d k
M o r te n T h r a n e H e l t+ 4 5 4 5 1 2 8 5 1 8m o h e l @ d a n s k e b a n k . d k
J e n s N æ r v i g P e d e r s e n + 4 5 4 5 1 2 8 0 6 1j e n p e @ d a n s k e b a n k . d k
K r i s tof f e r K j æ r L o m h o l t+ 4 5 4 5 1 3 7 8 6 7k l o m @ d a n s k e b a n k . d k
d c M r e s e a r c h
C h i e f A n a l y s t & H e a d of T h o m a s M a r t i n H o v a r d+ 4 5 4 5 1 2 8 5 0 5 h o v a @ d a n s k e b a n k . d k
L o u i s L a n d e m a n+ 4 6 8 5 6 8 8 0 5 2 4l l a n @ d a n s k e b a n k . s e
J a ko b M a g n u s s e n + 4 5 4 5 1 2 8 5 0 3j a k j a @ d a n s k e b a n k . d k
M a d s R o s e n d a l+ 4 5 4 5 1 4 8 8 7 9m a d r o @ d a n s k e b a n k . d k
G a b r i e l B e r g i n+ 4 6 8 5 6 8 8 0 6 0 2g a b e @ d a n s k e b a n k . s e
B r i a n B ø r s t i n g+ 4 5 4 5 1 2 8 5 1 9b r b r @ d a n s k e b a n k . d k
L a r s H o l m+ 4 5 4 5 1 2 8 0 4 1l a h o @ d a n s k e b a n k . d k
B j ø r n K r i s t i a n R ø e d+ 4 7 8 5 4 0 7 0 7 2b r e d @ d a n s k e b a n k . co m
S v e r r e H o l b e k+ 4 5 4 5 1 4 8 8 8 2h o l b @ d a n s k e b a n k . d k
S ø r e n S ko v H a n s e n + 4 5 4 5 1 2 8 4 3 0s r h a @ d a n s k e b a n k . d k
N i k l a s R i p a+ 4 5 4 5 1 2 8 0 4 7n i r i @ d a n s k e b a n k . d k
O l a A a s n e s s H e l d a l+ 4 7 8 5 4 0 8 4 3 3 o l h @ d a n s k e b a n k . n o
H e n r i k R e n è A n d r e s e n + 4 5 4 5 1 3 3 3 2 7h e n a @ d a n s k e b a n k . d k
S o n d r e D a l e S to r m y r + 4 7 8 5 4 0 7 0 7 0s o s t @ d a n s k e b a n k . co m
Ø y v i n d M o s s i g e + 4 7 8 5 4 0 5 4 9 1o m s s @ d a n s k e b a n k . co m
K n u t - I v a r B a k k e n + 4 7 8 5 4 0 7 0 7 4k n b @ d a n s k e b a n k . co m
E m i l H j a l m a r s s o n+ 4 6 8 5 6 8 8 0 6 3 4e m i h @ d a n s k e b a n k . s e
L u k a s P l a t z e r+ 4 5 4 5 1 2 8 4 3 0l p l a @ d a n s k e b a n k . d k
d e N M a r k
C h i e f E c o n o m i s t & H e a d of S te e n B o c i a n+ 4 5 4 5 1 2 8 5 3 1s tb o @ d a n s k e b a n k . d k
L a s O l s e n + 4 5 4 5 1 2 8 5 3 6l a s o @ d a n s k e b a n k . d k
M i k a e l O l a i M i l h ø j+ 4 5 4 5 1 2 7 6 0 7m i l h @ d a n s k e b a n k . d k
s w e d e N
C h i e f A n a l y s t & H e a d of M i c h a e l B o s tr ö m+ 4 6 8 5 6 8 8 0 5 8 7m b o s @ d a n s k e b a n k . s e
R o g e r J o s e f s s o n+ 4 6 8 5 6 8 8 0 5 5 8 r j o s @ d a n s k e b a n k . s e
M i c h a e l G r a h n + 4 6 8 5 6 8 8 0 7 0 0m i k a @ d a n s k e b a n k . s e
C a r l M i l to n+ 4 6 8 5 6 8 8 0 5 9 8c a r m i @ d a n s k e b a n k . s e
M a r c u s S ö d e r b e r g+ 4 6 8 5 6 8 8 0 5 6 4m a r s d @ d a n s k e b a n k . s e
S te f a n M e l l i n+ 4 6 8 5 6 8 8 0 5 9 2m e l l @ d a n s k e b a n k . s e
S u s a n n e P e r n e b y+ 4 6 8 5 6 8 8 0 5 8 5s u p e @ d a n s k e b a n k . s e
e M e r g i N g M a r k e t s
V l a d i m i r M i k l a s h e v s k y + 3 5 8 ( 0 ) 1 0 5 4 6 7 5 2 2v l m i @ d a n s k e b a n k . co m
R o k a s G r a j a u s k a s+ 3 7 0 5 2 1 5 6 2 3 1r g r a @ d a n s k e b a n k . l t