Economic and Commodity Outlook ASFMRA Denver, Colorado October 30, 2009
140
2009 Economic and Commodity Outlook ASFMRA Denver, Colorado October 30, 2009
-
Upload
harding-vinson -
Category
Documents
-
view
45 -
download
2
description
Economic and Commodity Outlook ASFMRA Denver, Colorado October 30, 2009. THREE BIGGEST EVENTS of LAST TWO WEEKS. October 17,2009 Purdue 26 THE Ohio State 18. October 24,2009 Purdue 24 Illinois 14. October 24,2009 Iowa State 9 Nebraska 7. General Economy. Where are we headed…. - PowerPoint PPT Presentation
Transcript of Economic and Commodity Outlook ASFMRA Denver, Colorado October 30, 2009
2009
Economic and Commodity Outlook
ASFMRA
Denver, Colorado
October 30, 2009

2009
THREE BIGGEST
EVENTS of
LAST TWO WEEKS

2009
October 17,2009
Purdue 26
THE Ohio State 18

2009
October 24,2009
Purdue 24
Illinois 14
2009
October 24,2009
Iowa State 9
Nebraska 7

2009
General Economy
Where are we headed…

2009
CASH for CLUNKERS
was
A GOOD DEAL

2009
GOT a LOT of
OBAMA BUMPER STICKERS
OFF THE ROAD

2009
Economic Overview While some economic indicators are
hinting the recession is ending – it isn’t. Unemployment remains high with little sign
of improvement. Deflation continues. This will be the decade of Three Bubbles:
1. The High Tech Bubble of 2000.2. The Housing Bubble of 2005-06.3. The Commodity Price Bubble of 2008.

2009
Name this country…

2009
Richest in the world Largest military Center of world business and finance Strongest education system World center of innovation and invention Currency the world standard of value Highest standard of living

2009
ENGLAND
2009
In 1900
2009
1 of every 8 couples married in the U.S. last year met online
2009
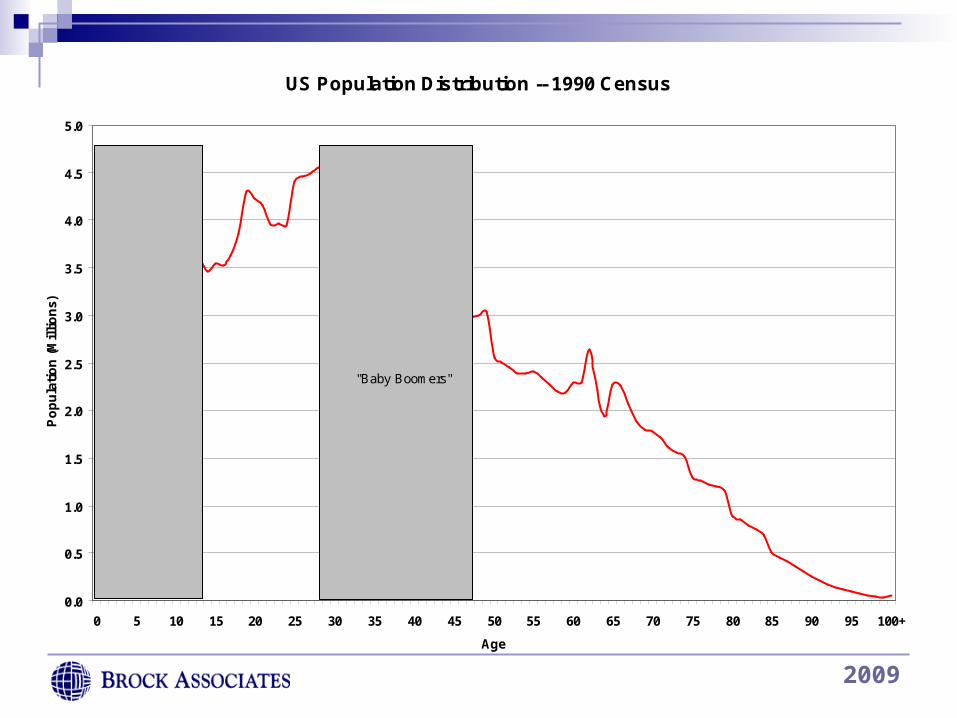
US Population Distribution -- 1990 Census
0.0
0.5
1.0
1.5
2.0
2.5
3.0
3.5
4.0
4.5
5.0
0 5 10 15 20 25 30 35 40 45 50 55 60 65 70 75 80 85 90 95 100+
Age
Po
pu
lati
on
(M
illi
on
s)
"Baby Boomers""Boomlet"
2009
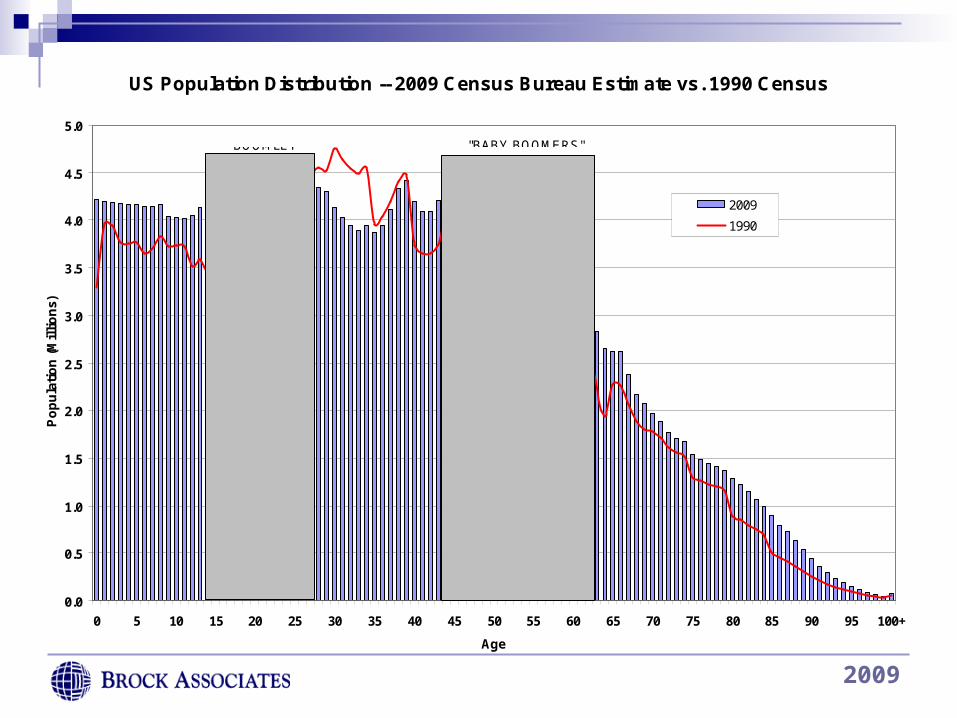
US Population Distribution -- 2009 Census Bureau Estimate vs. 1990 Census
0.0
0.5
1.0
1.5
2.0
2.5
3.0
3.5
4.0
4.5
5.0
0 5 10 15 20 25 30 35 40 45 50 55 60 65 70 75 80 85 90 95 100+
Age
Po
pu
lati
on
(M
illi
on
s)
2009
1990
"BABY BOOMERS""BOOMLET"
2009
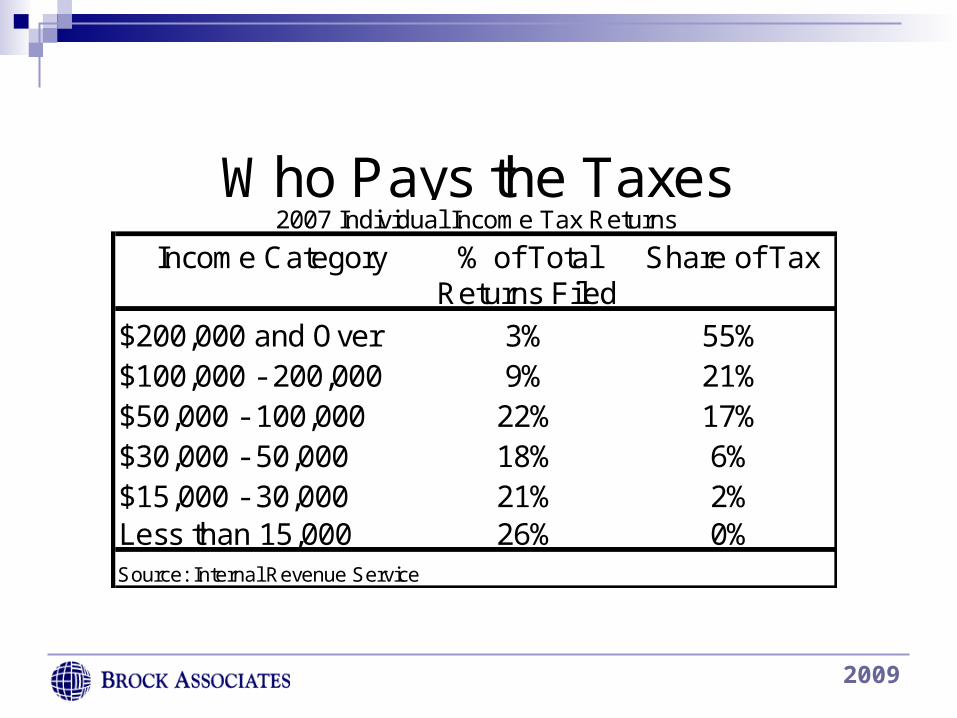
Income Category % of Total Share of TaxReturns Filed
$200,000 and Over 3% 55%$100,000 - 200,000 9% 21%$50,000 - 100,000 22% 17%$30,000 - 50,000 18% 6%$15,000 - 30,000 21% 2%Less than 15,000 26% 0%Source: Internal Revenue Service
Who Pays the Taxes2007 Individual Income Tax Returns
2009
2009
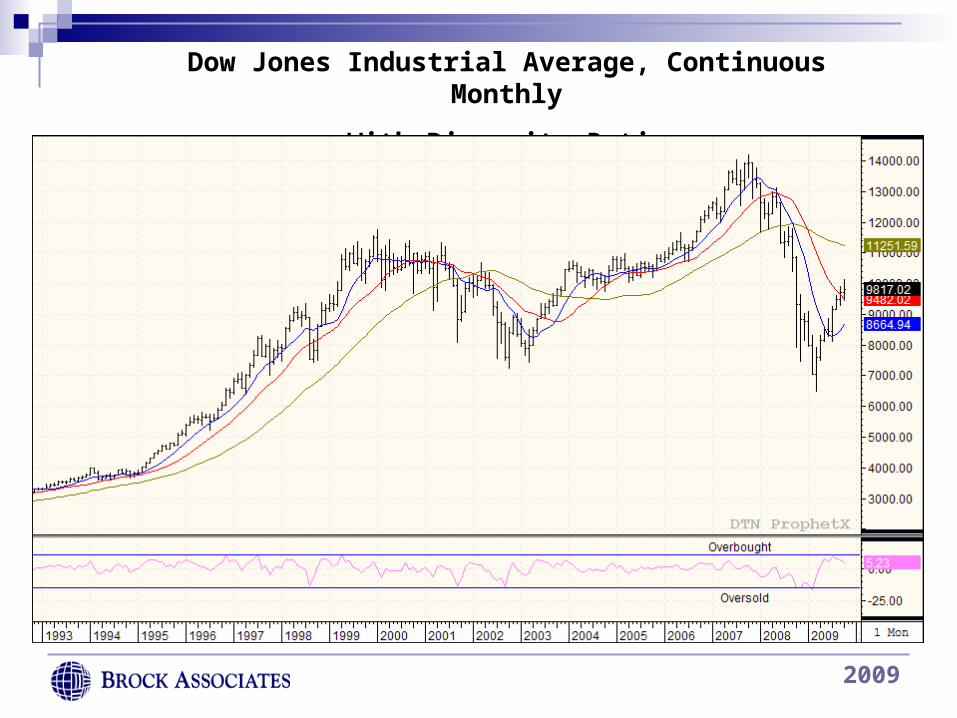
Dow Jones Industrial Average, Continuous Monthly
With Disparity Ratio

2009
Dow Jones Industrial Average, Daily
2009
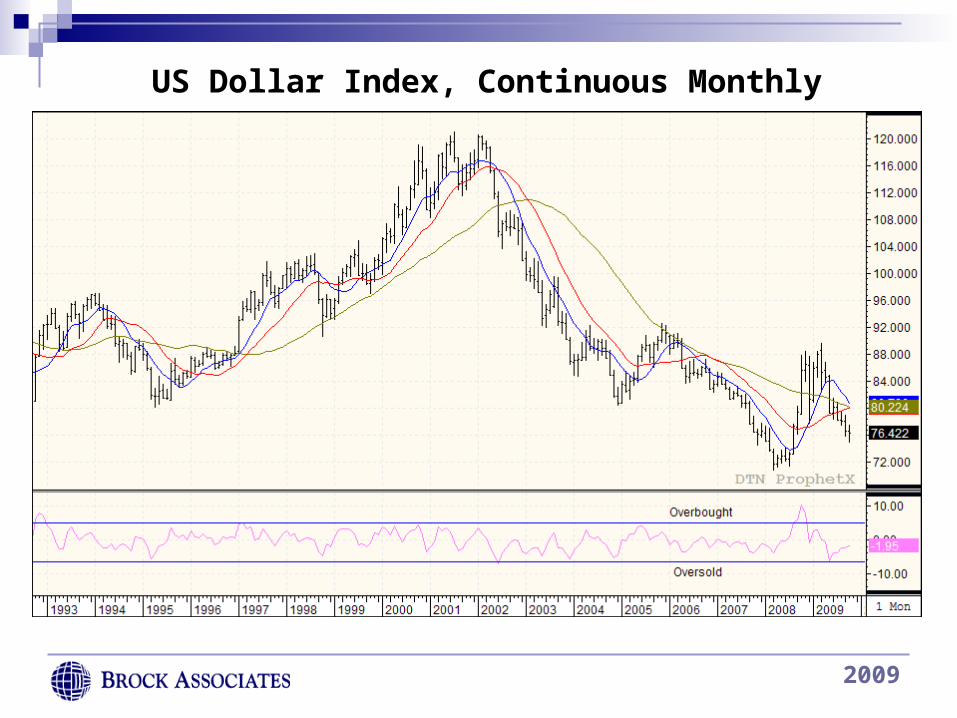
US Dollar Index, Continuous Monthly
2009
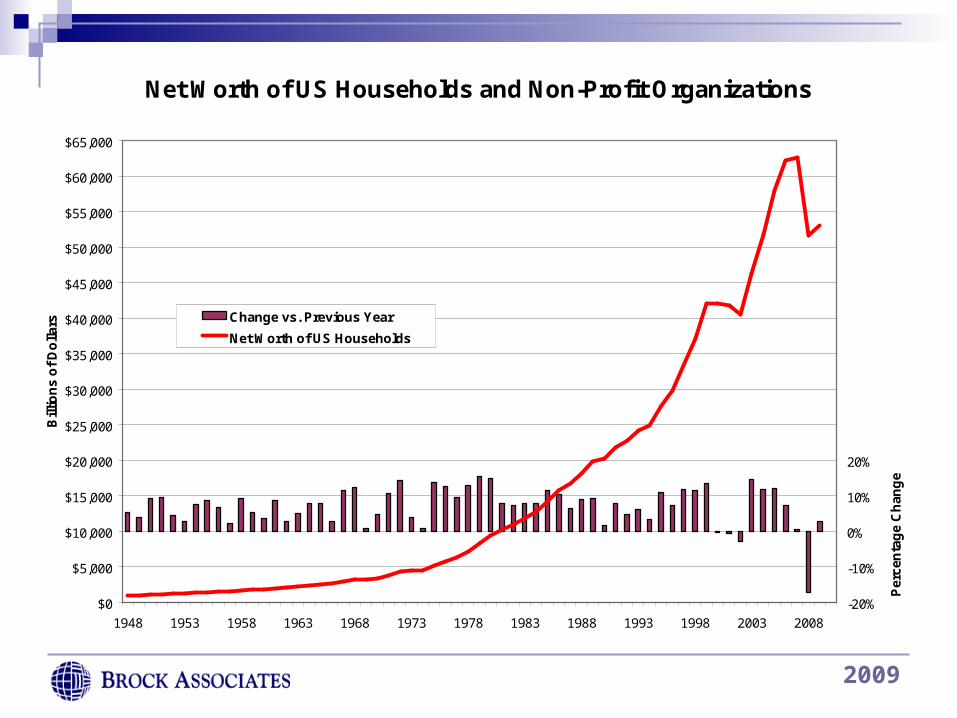
Net Worth of US Households and Non-Profit Organizations
$0
$5,000
$10,000
$15,000
$20,000
$25,000
$30,000
$35,000
$40,000
$45,000
$50,000
$55,000
$60,000
$65,000
1948 1953 1958 1963 1968 1973 1978 1983 1988 1993 1998 2003 2008
Bill
ion
s o
f D
olla
rs
-20%
-10%
0%
10%
20%
30%
40%
50%
60%
70%
80%
90%
100%
110%
Per
cen
tag
e C
han
ge
Change vs. Previous Year
Net Worth of US Households
Source: US Federal Reserve, Annual Data except 2009 through Second Quarter
2009
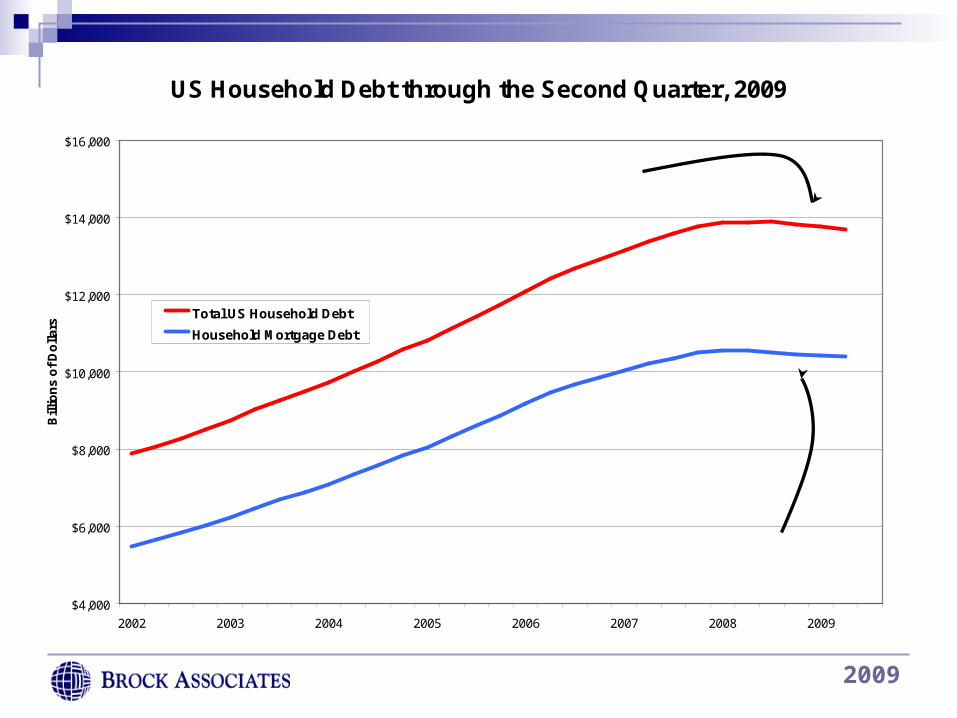
US Household Debt through the Second Quarter, 2009
$4,000
$6,000
$8,000
$10,000
$12,000
$14,000
$16,000
2002 2003 2004 2005 2006 2007 2008 2009
Bill
ion
s o
f D
olla
rs
Total US Household Debt
Household Mortgage Debt
Source: US Federal Reserve
The third quarter 2008 drop from $13.943 trillion to $13.914 trillion was the first quarterly decline in Total US Household Debt since the data began being recorded (1952). Total Household debt has now declined for four consecutive quarters, dropping by $181 billion dollars.
Total Household debt has declined for five consecutive quarters, dropping by $157.4 billion dollars.
2009
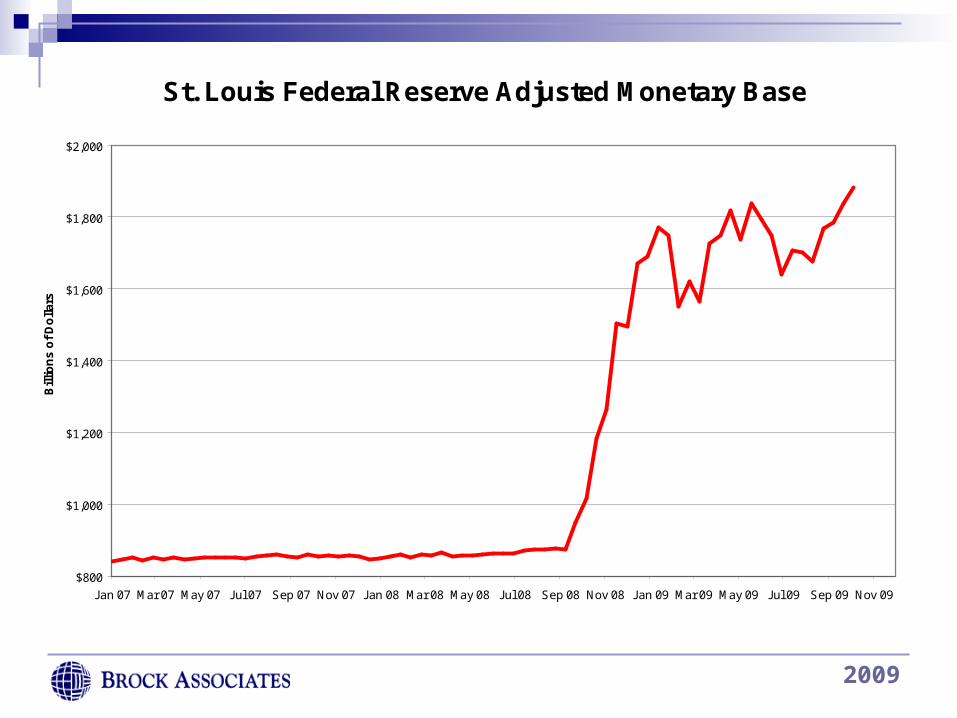
St. Louis Federal Reserve Adjusted Monetary Base
$800
$1,000
$1,200
$1,400
$1,600
$1,800
$2,000
Jan 07 Mar 07 May 07 Jul 07 Sep 07 Nov 07 Jan 08 Mar 08 May 08 Jul 08 Sep 08 Nov 08 Jan 09 Mar 09 May 09 Jul 09 Sep 09 Nov 09
Bil
lio
ns
of
Do
llar
s
2009
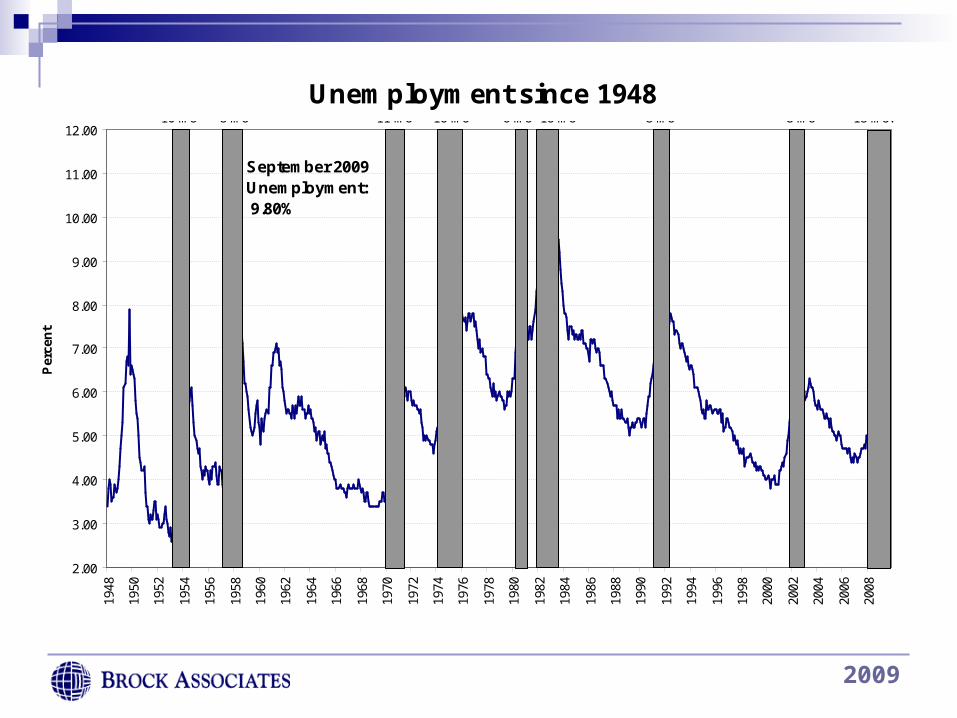
Unemployment since 1948
2.00
3.00
4.00
5.00
6.00
7.00
8.00
9.00
10.00
11.00
12.00
1948
1950
1952
1954
1956
1958
1960
1962
1964
1966
1968
1970
1972
1974
1976
1978
1980
1982
1984
1986
1988
1990
1992
1994
1996
1998
2000
2002
2004
2006
2008
Per
cen
t
September 2009 Unemployment: 9.80%
Source: Bureau of Labor Statistics Gray shaded area indicate recessions
8 mo8 mo6 mo 16 mo16 mo11 mo8 mo10 mo 18 mo?
2009
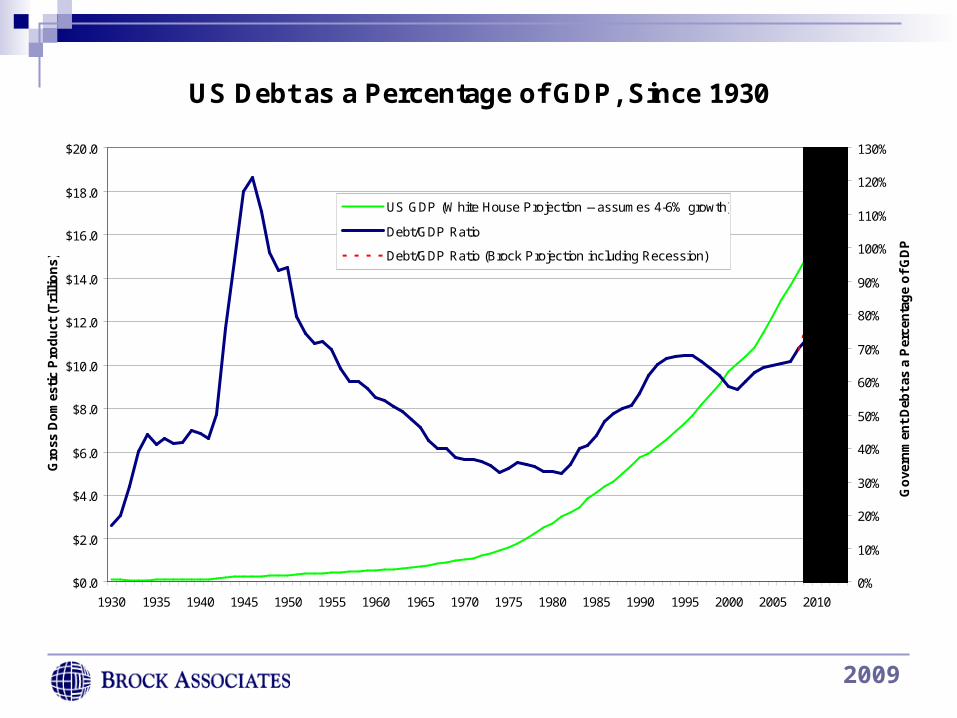
US Debt as a Percentage of GDP, Since 1930
$0.0
$2.0
$4.0
$6.0
$8.0
$10.0
$12.0
$14.0
$16.0
$18.0
$20.0
1930 1935 1940 1945 1950 1955 1960 1965 1970 1975 1980 1985 1990 1995 2000 2005 2010
Gro
ss D
om
esti
c P
rod
uct
(T
rill
ion
s)
0%
10%
20%
30%
40%
50%
60%
70%
80%
90%
100%
110%
120%
130%
Go
vern
men
t D
ebt
as a
Per
cen
tag
e o
f G
DP
US GDP (White House Projection -- assumes 4-6% growth)
Debt/GDP Ratio
Debt/GDP Ratio (Brock Projection including Recession)
Source: White House, US Treasury, Brock Associates estimates Brock Associates Projections
2009
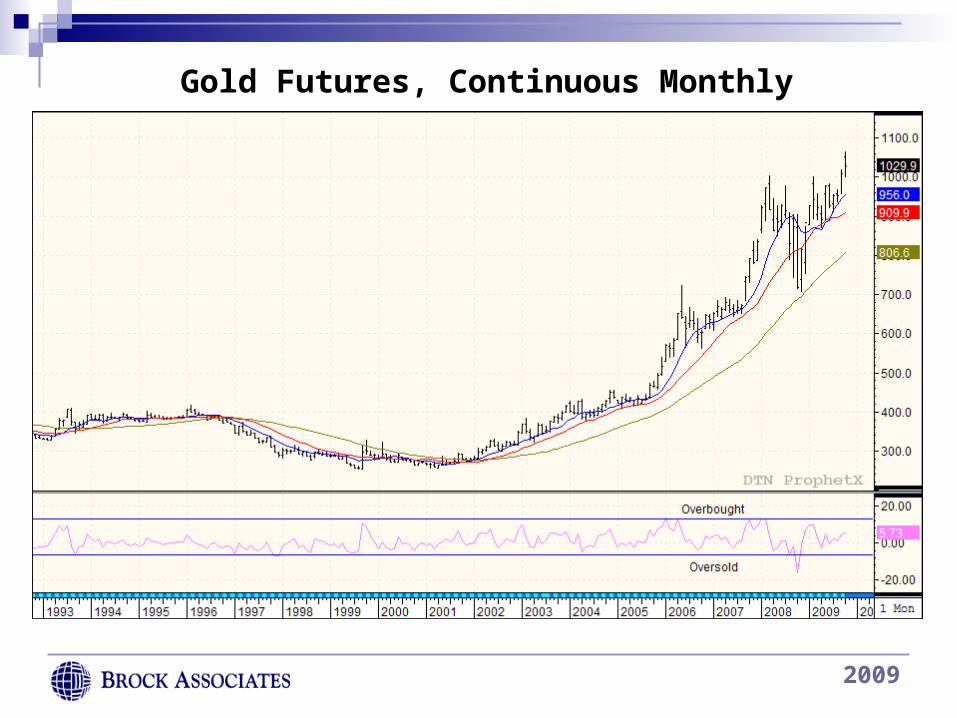
Gold Futures, Continuous Monthly
2009
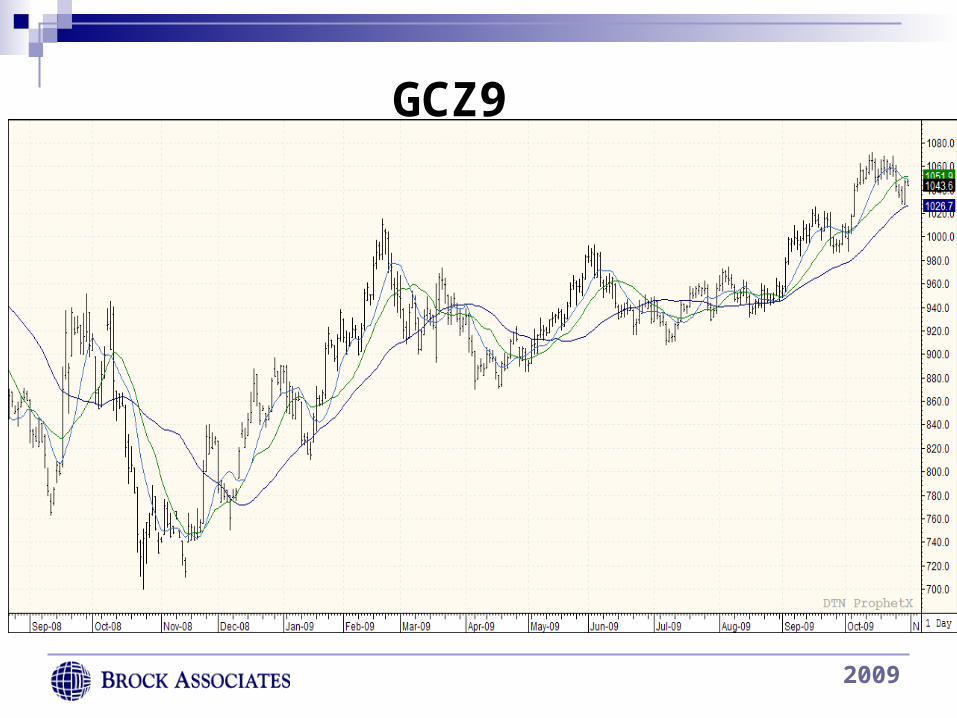
GCZ9
2009
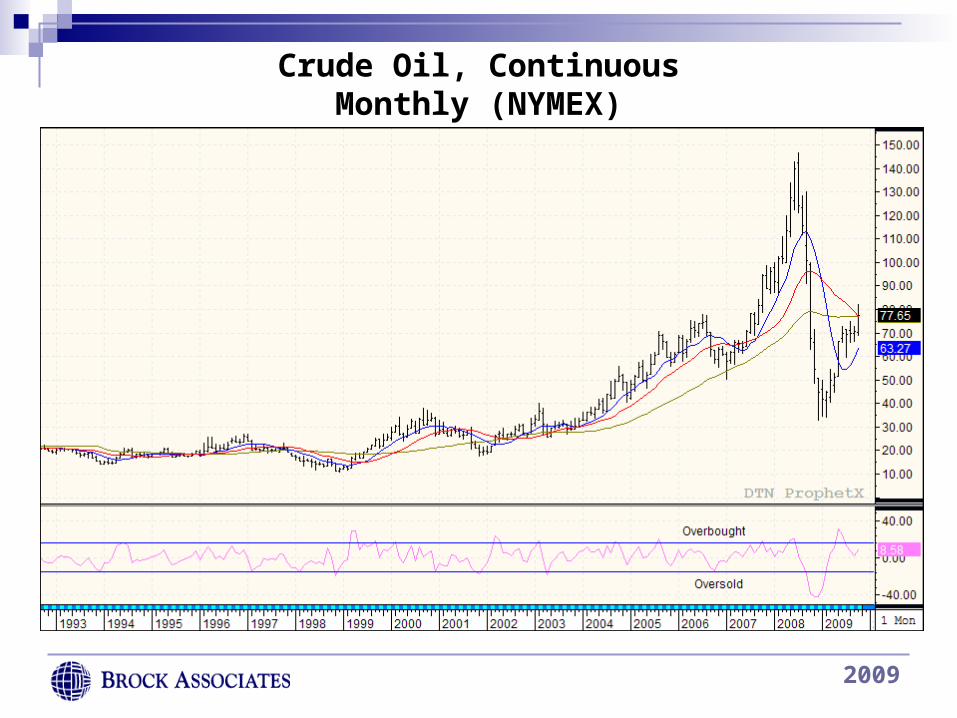
Crude Oil, Continuous Monthly (NYMEX)
2009
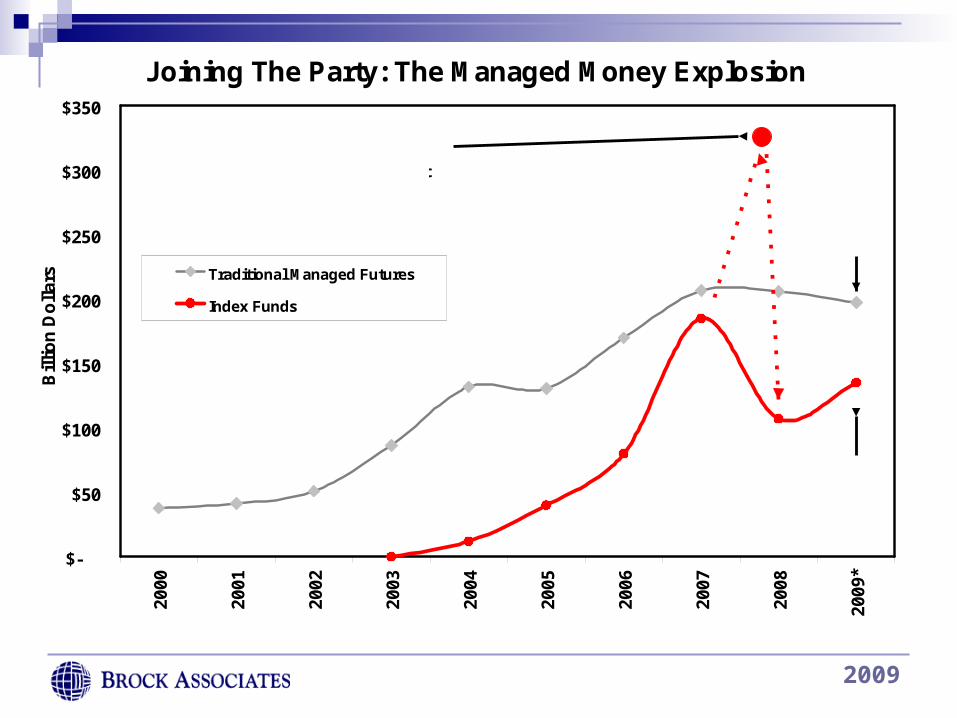
Joining The Party: The Managed Money Explosion
$-
$50
$100
$150
$200
$250
$300
$350
2000
2001
2002
2003
2004
2005
2006
2007
2008
2009
*
Bil
lio
n D
oll
ars Traditional Managed Futures
Index Funds
Source: The Barclay Group, Brock estimates
As of June 24, 2008$338 Billion wasunder management by index funds
$135.1 Billion as of October 20, 2009(Brock Estimate)
$197.3 Billionas of
October 20 2009
(Brock Estimate)
2009
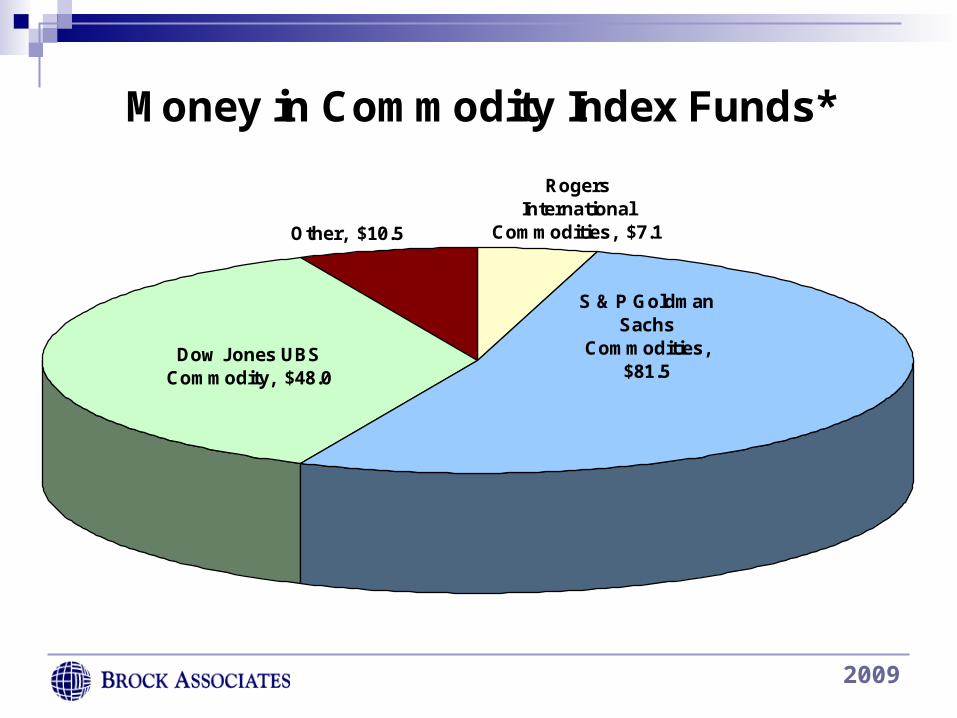
Money in Commodity Index Funds*
Rogers International
Commodities, $7.1 Other, $10.5
S & P Goldman Sachs
Commodities, $81.5
Dow Jones UBS Commodity, $48.0
*Figures are the industry's best estimate, as of October 20, 2009

2009
Commodity Index Funds
44.0%
66.9%
55.0%
39.0%
19.7%
13.8%
21.0%
22.5%
13.0%
3.0%
5.6%
6.7% 7.0%
12.2%
3.9%
21.0%
21.1%
9.8%
31.1%22.5% 20.0%
33.0%
0.0%
10.0%
20.0%
30.0%
40.0%
50.0%
60.0%
70.0%
80.0%
90.0%
100.0%
Rogers InternationalCommodities
S & P Goldman SachsCommodities
Dow Jones UBSCommodity
Deutsche Bank LiquidCommodity
Reuters/Jefferies CRB
Energy Grain Livestock Softs Metals
8.2%
2009
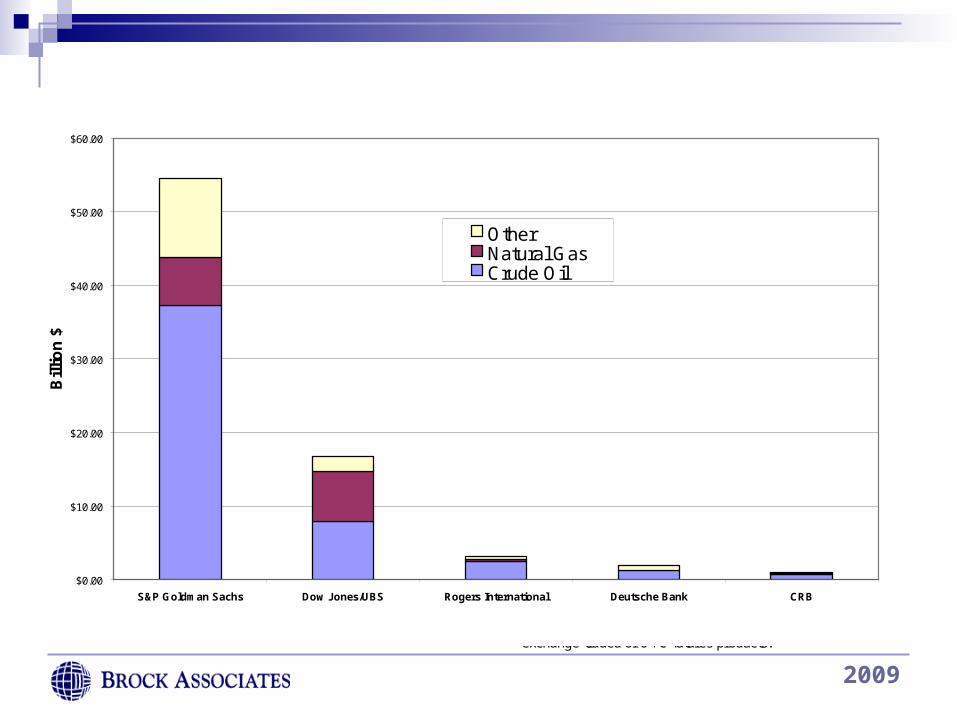
$0.00
$10.00
$20.00
$30.00
$40.00
$50.00
$60.00
S&P Goldman Sachs Dow Jones/UBS Rogers International Deutsche Bank CRB
Bil
lio
n $
OtherNatural GasCrude Oil
Index Fund Buying Power:Estimated Energy Market Holdings by Investments Tracking Major Indexes
Source: Brock Associates Estimates Estimate includes holdings of all energy index components and may include exchange-traded or OTC futures products.
2009
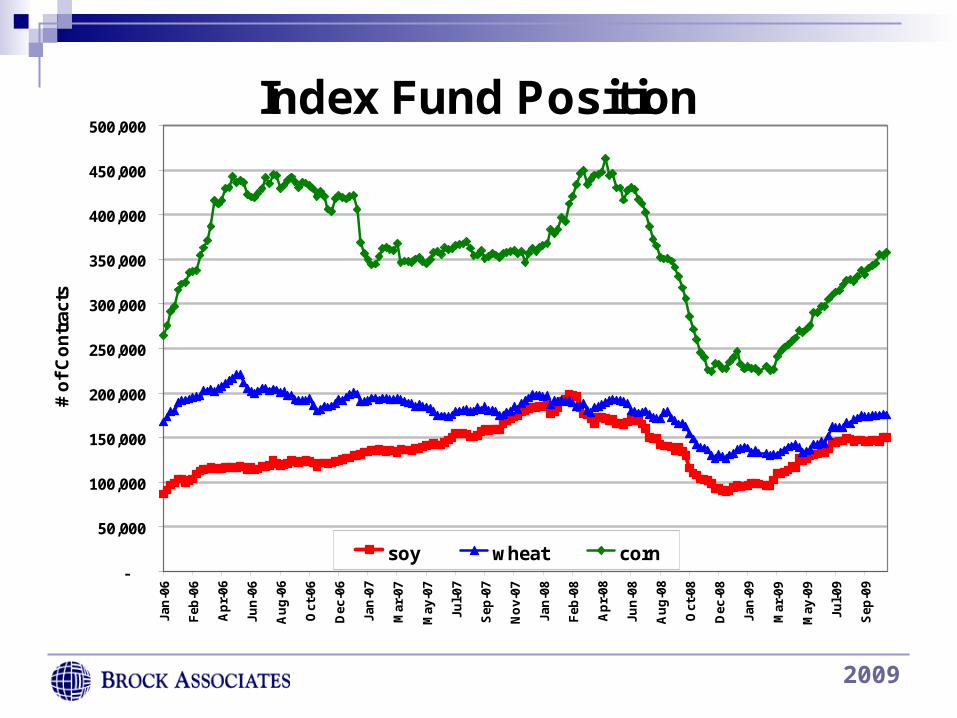
Index Fund Position
-
50,000
100,000
150,000
200,000
250,000
300,000
350,000
400,000
450,000
500,000
Jan
-06
Feb
-06
Ap
r-06
Jun
-06
Au
g-0
6
Oct
-06
Dec
-06
Jan
-07
Mar
-07
May
-07
Jul-
07
Sep
-07
No
v-07
Jan
-08
Feb
-08
Ap
r-08
Jun
-08
Au
g-0
8
Oct
-08
Dec
-08
Jan
-09
Mar
-09
May
-09
Jul-
09
Sep
-09
# o
f C
on
trac
ts
soy wheat corn

2009
Index Fund Net Position as % of Open Interest
0%
10%
20%
30%
40%
50%
Corn Ch. Wheat Soybeans Soy Oil Cattle Cotton Hogs KC Wheat
2009
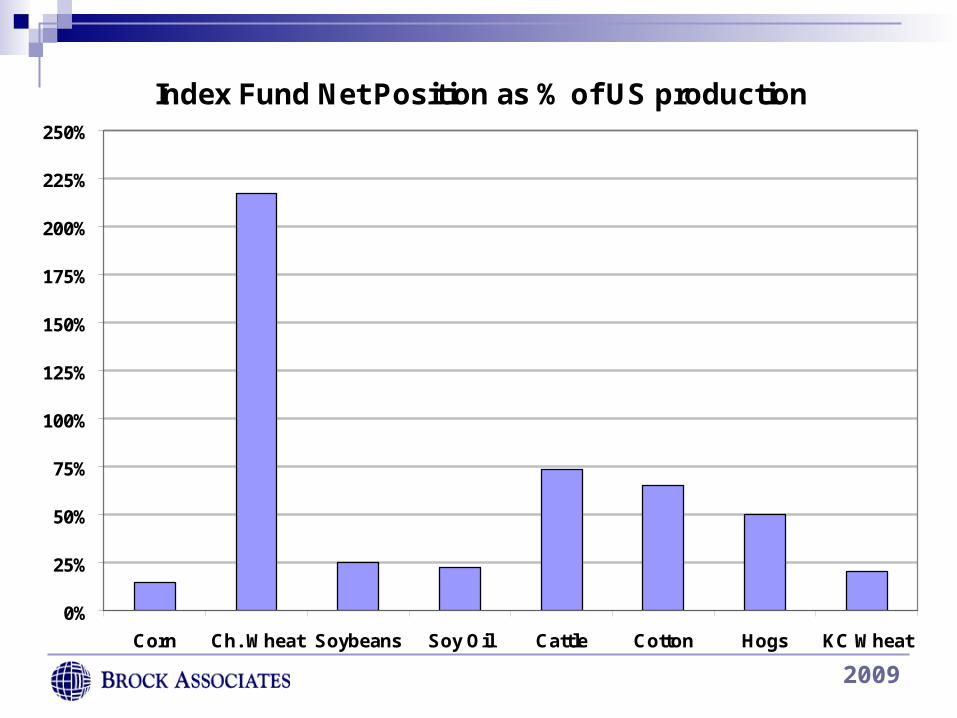
Index Fund Net Position as % of US production
0%
25%
50%
75%
100%
125%
150%
175%
200%
225%
250%
Corn Ch. Wheat Soybeans Soy Oil Cattle Cotton Hogs KC Wheat
2009
Agriculture Overview• Grain prices have likely bottomed for
this marketing year
• Livestock profits will improve
• Ethanol production will increase
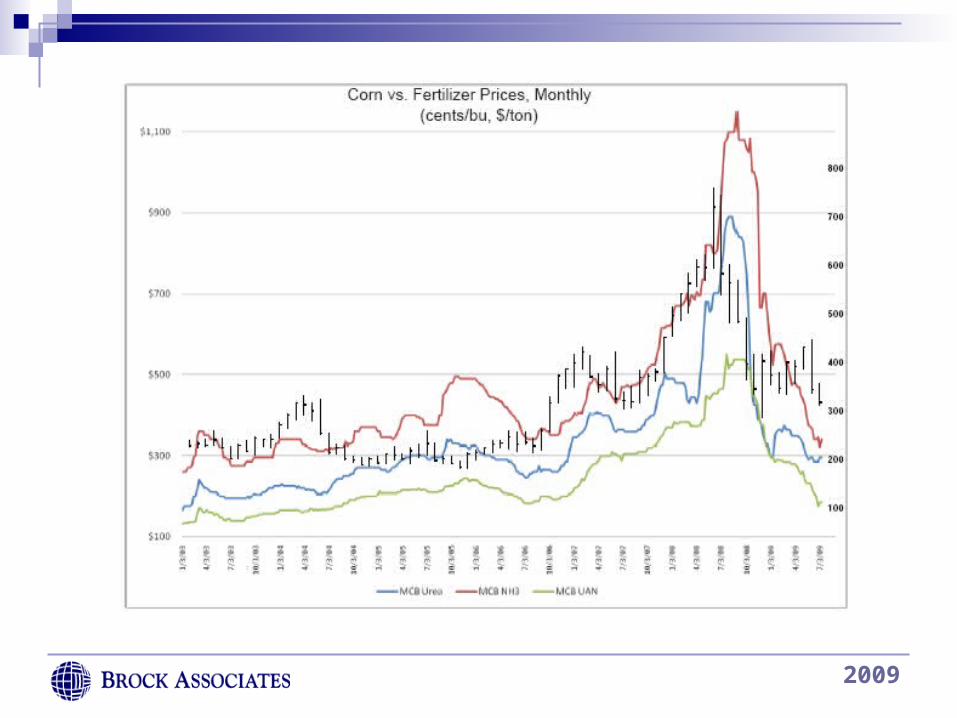
• Fertilizer supplies could get tight
• All ag commodity prices will be very volatile.
2009
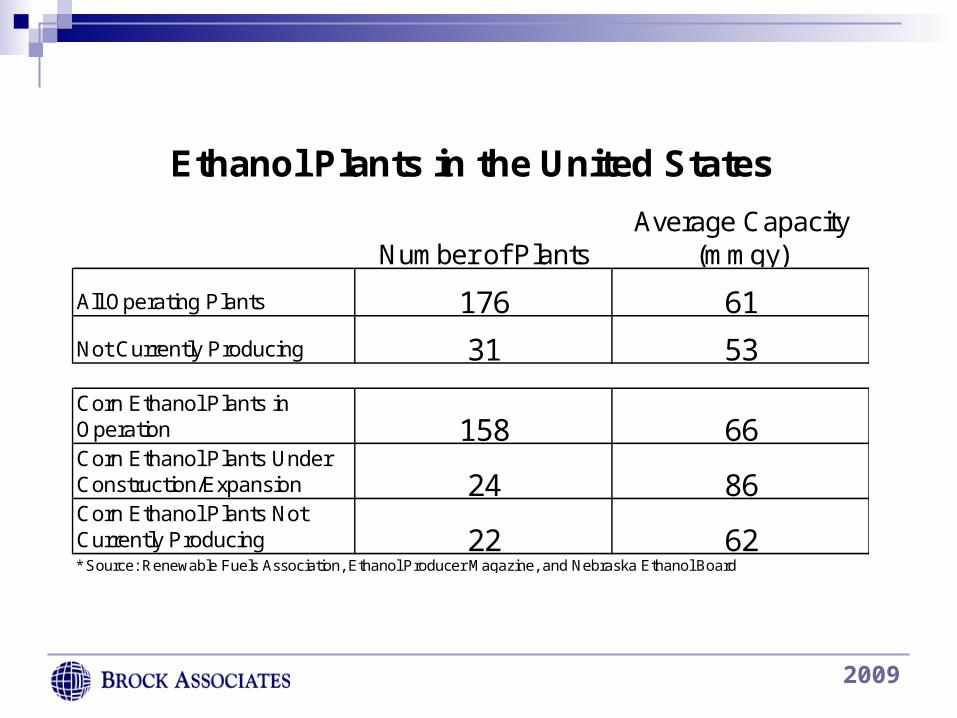
Number of PlantsAverage Capacity
(mmgy)
All Operating Plants 176 61
Not Currently Producing 31 53
Corn Ethanol Plants in Operation 158 66Corn Ethanol Plants Under Construction/Expansion 24 86Corn Ethanol Plants Not Currently Producing 22 62* Source: Renewable Fuels Association, Ethanol Producer Magazine, and Nebraska Ethanol Board
Ethanol Plants in the United States
2009
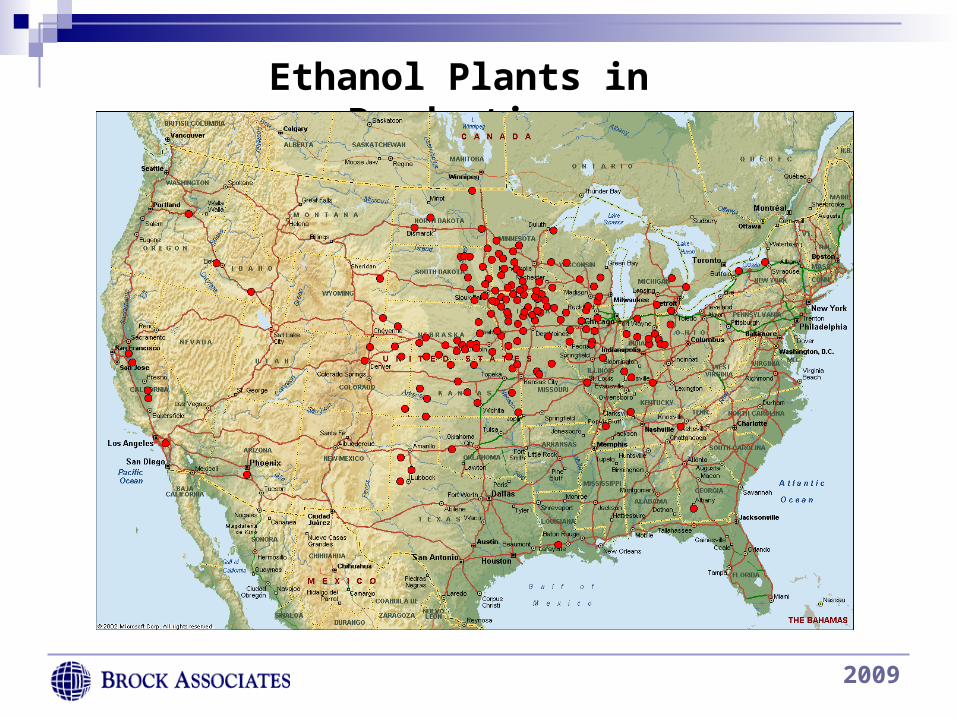
Ethanol Plants in Production
2009
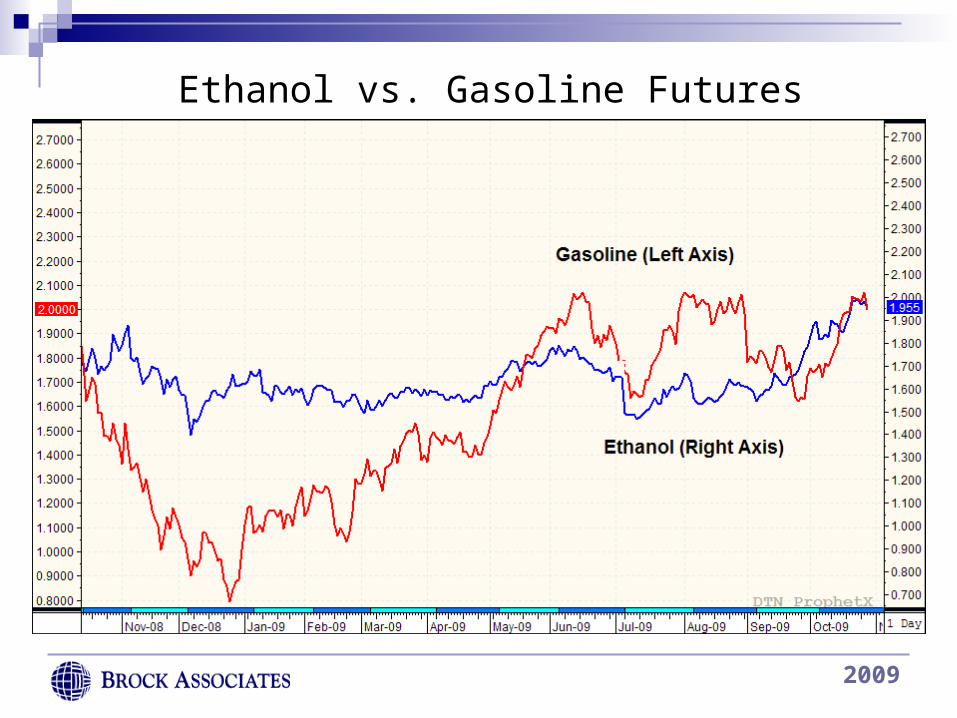
Ethanol vs. Gasoline Futures
2009
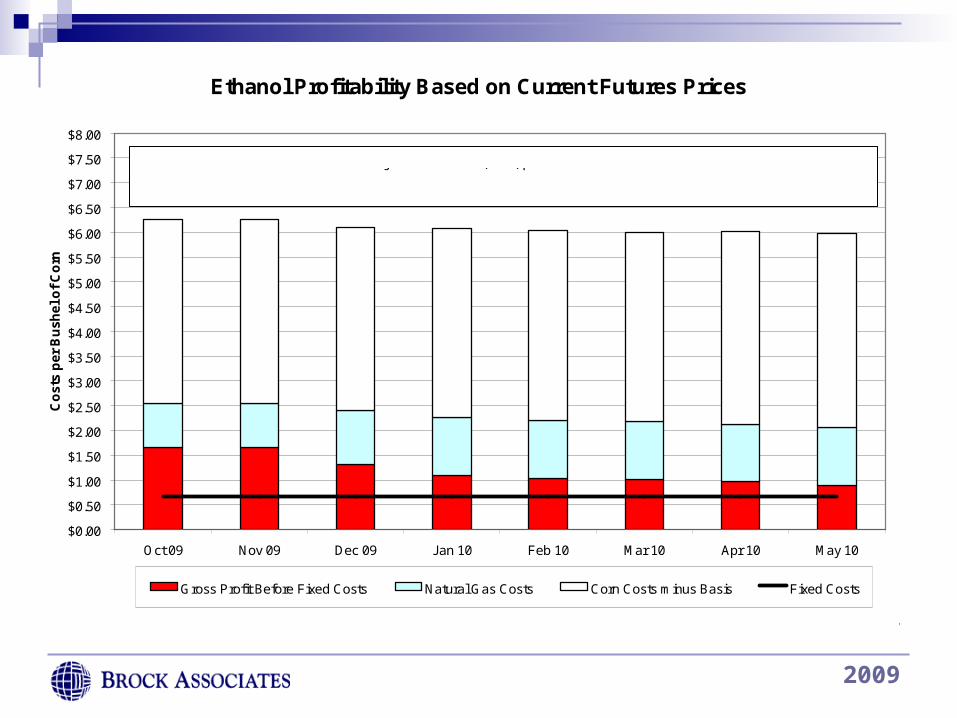
Ethanol Profitability Based on Current Futures Prices
$0.00
$0.50
$1.00
$1.50
$2.00
$2.50
$3.00
$3.50
$4.00
$4.50
$5.00
$5.50
$6.00
$6.50
$7.00
$7.50
$8.00
Oct 09 Nov 09 Dec 09 Jan 10 Feb 10 Mar 10 Apr 10 May 10
Co
sts
per
Bu
shel
of
Co
rn
Gross Profit Before Fixed Costs Natural Gas Costs Corn Costs minus Basis Fixed Costs
Gross profit must exceed Fixed Costs line to realize a net profit
Per Bushel of Corn
Basis calculated as current average of 30 Midwest delivery points,Fixed costs assumed to be 67 cents/bushel
Projected Net Profit (Loss) per bushel of corn
$0.976 $0.976 $0.634 $0.428 $0.363 $0.342 $0.288 $0.221
2009
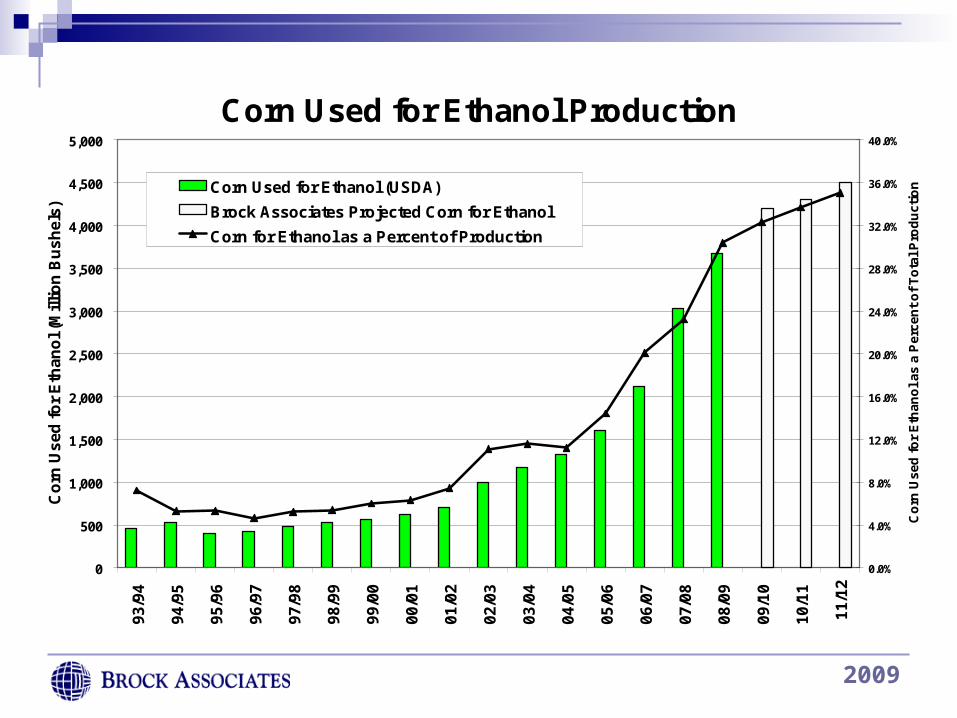
Corn Used for Ethanol Production
0
500
1,000
1,500
2,000
2,500
3,000
3,500
4,000
4,500
5,0009
3/9
4
94
/95
95
/96
96
/97
97
/98
98
/99
99
/00
00
/01
01
/02
02
/03
03
/04
04
/05
05
/06
06
/07
07
/08
08
/09
09
/10
10
/11
11
/12
Co
rn U
se
d f
or
Eth
ano
l (M
illi
on
Bu
sh
els
)
0.0%
4.0%
8.0%
12.0%
16.0%
20.0%
24.0%
28.0%
32.0%
36.0%
40.0%
Co
rn U
sed
fo
r E
than
ol
as
a P
erc
ent
of
To
tal
Pro
du
ctio
nCorn Used for Ethanol (USDA)
Brock Associates Projected Corn for Ethanol
Corn for Ethanol as a Percent of Production
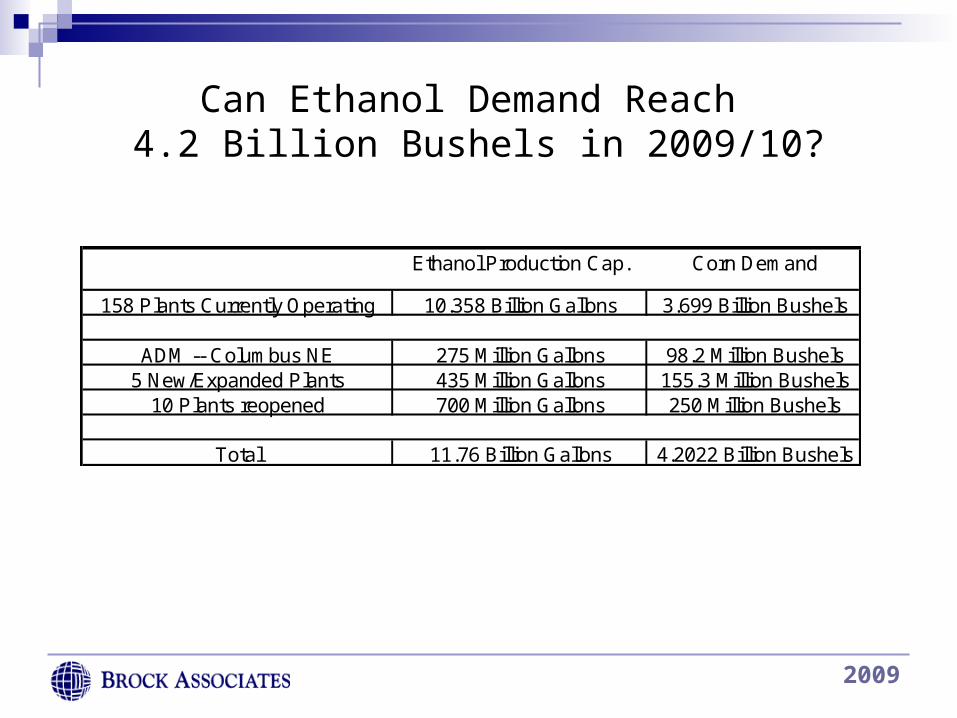
Brock 2009/10 Projection: 4,200 Million Bushels
2009
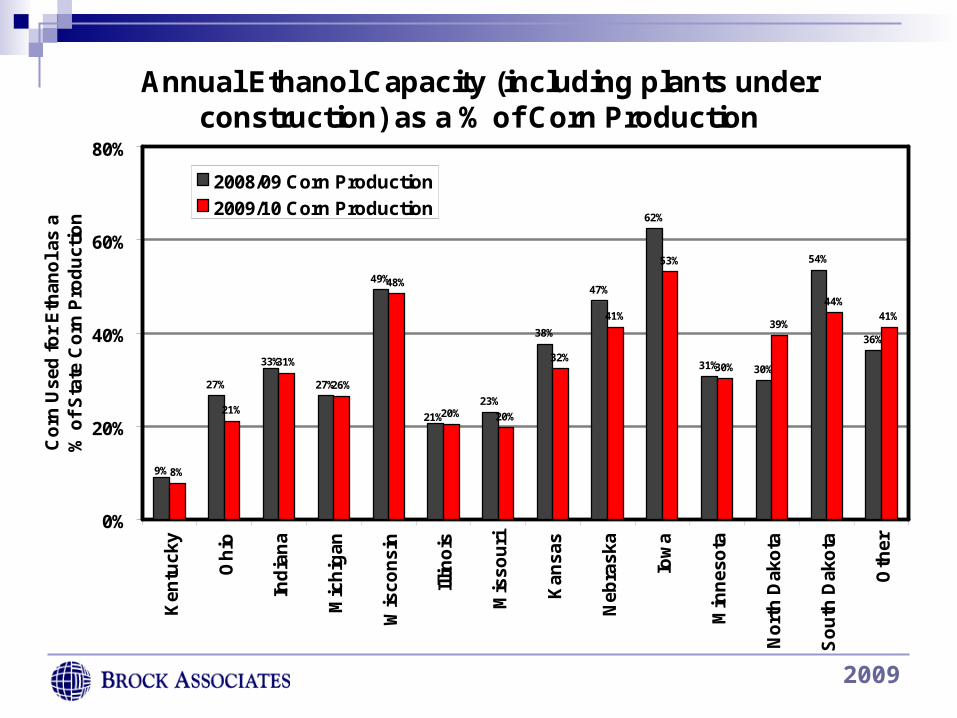
Annual Ethanol Capacity (including plants under construction) as a % of Corn Production
27% 27%
49%
23%
38%
47%
62%
31% 30%
54%
36%
8%
21%
31%
26%
48%
20% 20%
32%
41%
53%
30%
39%
44%41%
9%
33%
21%
0%
20%
40%
60%
80%K
entu
cky
Oh
io
Ind
ian
a
Mic
hig
an
Wis
con
sin
Illin
ois
Mis
sou
ri
Kan
sas
Neb
rask
a
Iow
a
Min
nes
ota
No
rth
Dak
ota
So
uth
Dak
ota
Oth
er
Co
rn U
sed
fo
r E
than
ol a
s a
% o
f S
tate
Co
rn P
rod
uct
ion
2008/09 Corn Production
2009/10 Corn Production
2009
Can Ethanol Demand Reach 4.2 Billion Bushels in 2009/10?
Ethanol Production Cap. Corn Demand
158 Plants Currently Operating 10.358 Billion Gallons 3.699 Billion Bushels
ADM -- Columbus NE 275 Million Gallons 98.2 Million Bushels5 New/Expanded Plants 435 Million Gallons 155.3 Million Bushels
10 Plants reopened 700 Million Gallons 250 Million Bushels
Total 11.76 Billion Gallons 4.2022 Billion Bushels
2009
2009
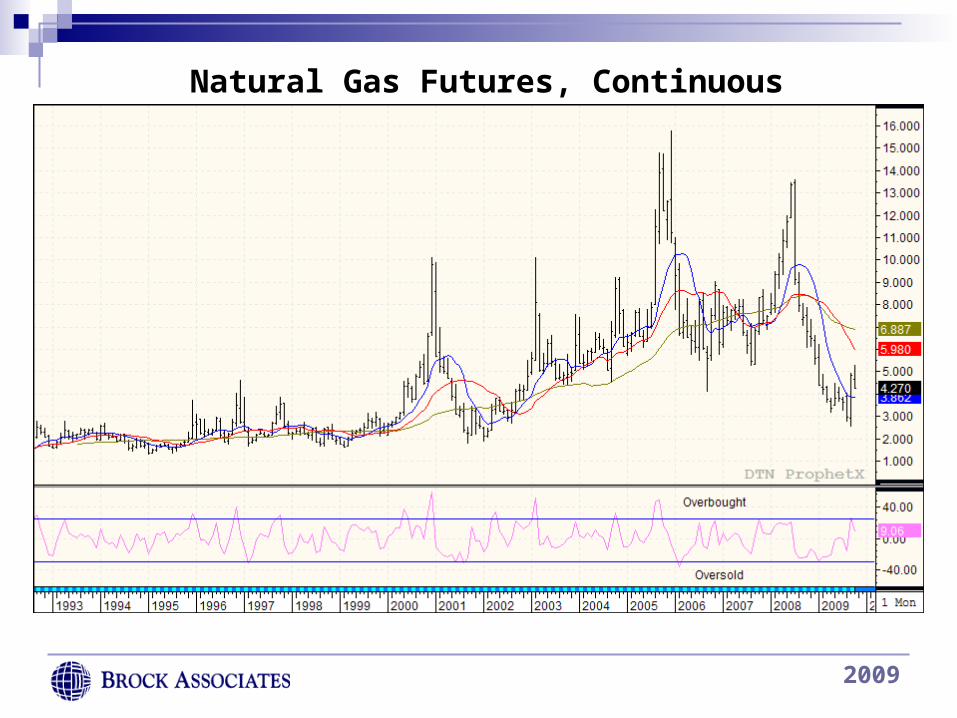
Natural Gas Futures, Continuous Monthly
2009
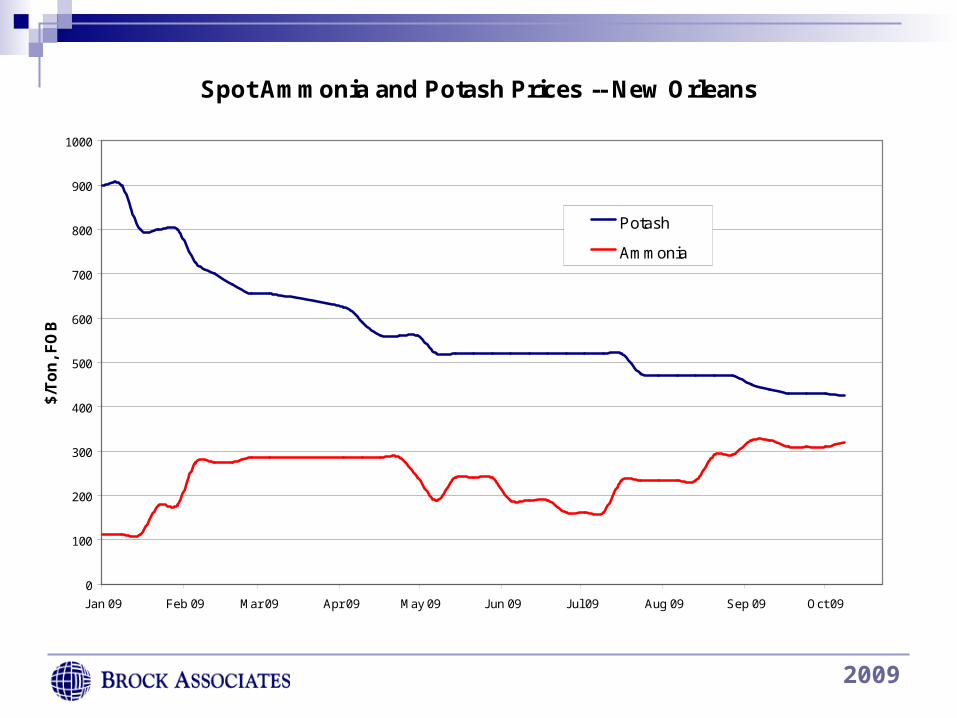
Spot Ammonia and Potash Prices -- New Orleans
0
100
200
300
400
500
600
700
800
900
1000
Jan 09 Feb 09 Mar 09 Apr 09 May 09 Jun 09 Jul 09 Aug 09 Sep 09 Oct 09
$/T
on
, F
OB
Potash
Ammonia
Source: Midwest Fertilizer Insight
2009
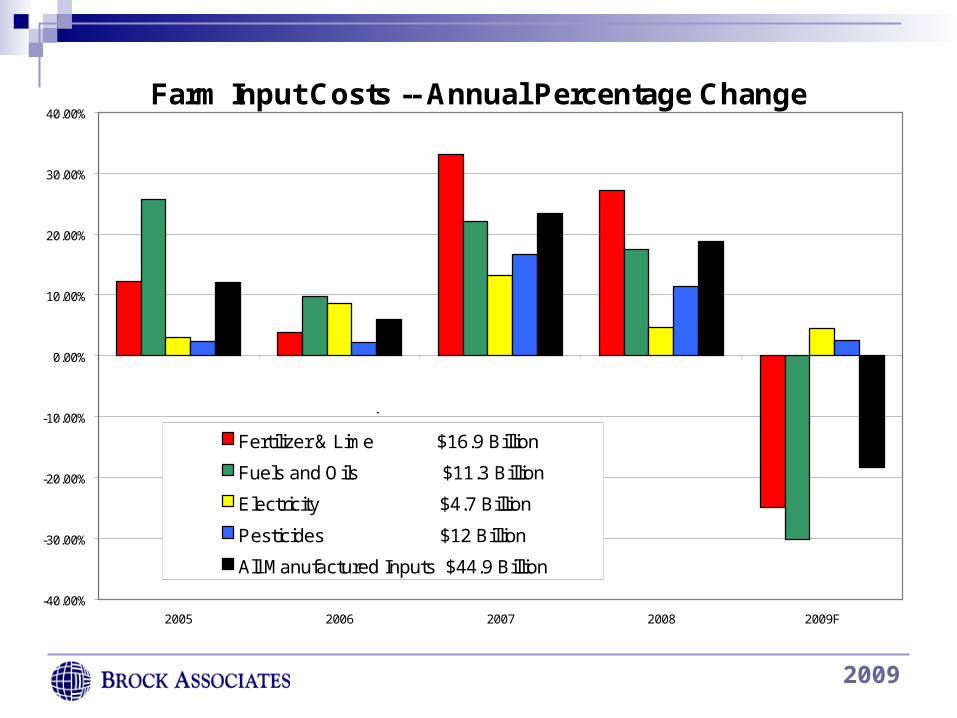
Farm Input Costs -- Annual Percentage Change
-40.00%
-30.00%
-20.00%
-10.00%
0.00%
10.00%
20.00%
30.00%
40.00%
2005 2006 2007 2008 2009F
Fertilizer & Lime $16.9 Billion
Fuels and Oils $11.3 Billion
Electricity $4.7 Billion
Pesticides $12 Billion
All Manufactured Inputs $44.9 Billion
2009 Total Expenditures
Source: USDA
2009
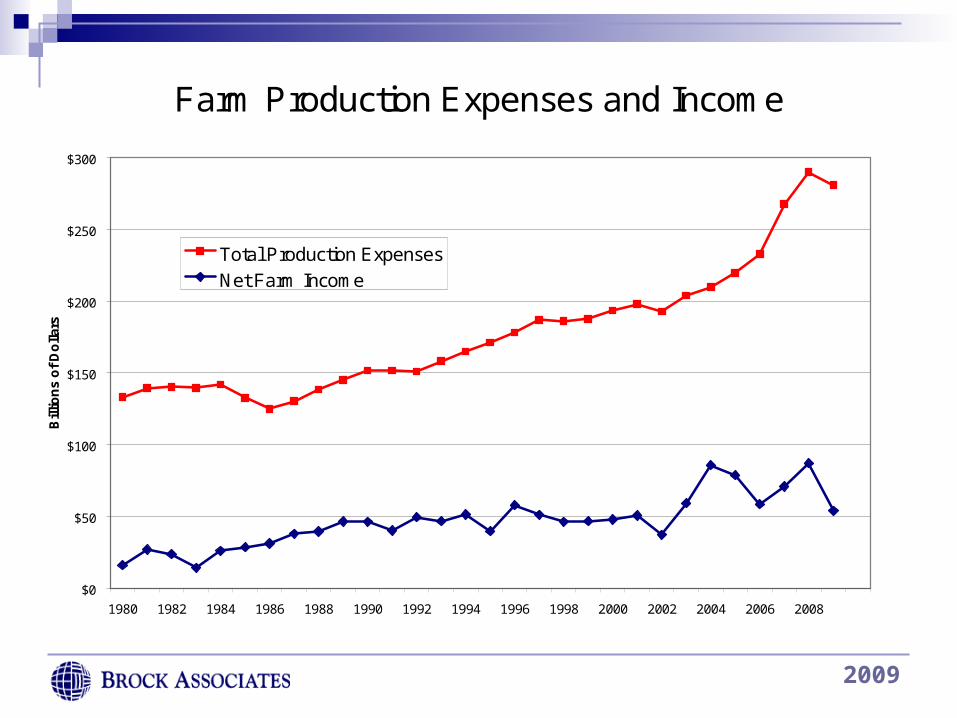
Farm Production Expenses and Income
$0
$50
$100
$150
$200
$250
$300
1980 1982 1984 1986 1988 1990 1992 1994 1996 1998 2000 2002 2004 2006 2008
Bill
ion
s o
f D
olla
rs
Total Production Expenses
Net Farm Income
Source: USDA
2009
2009
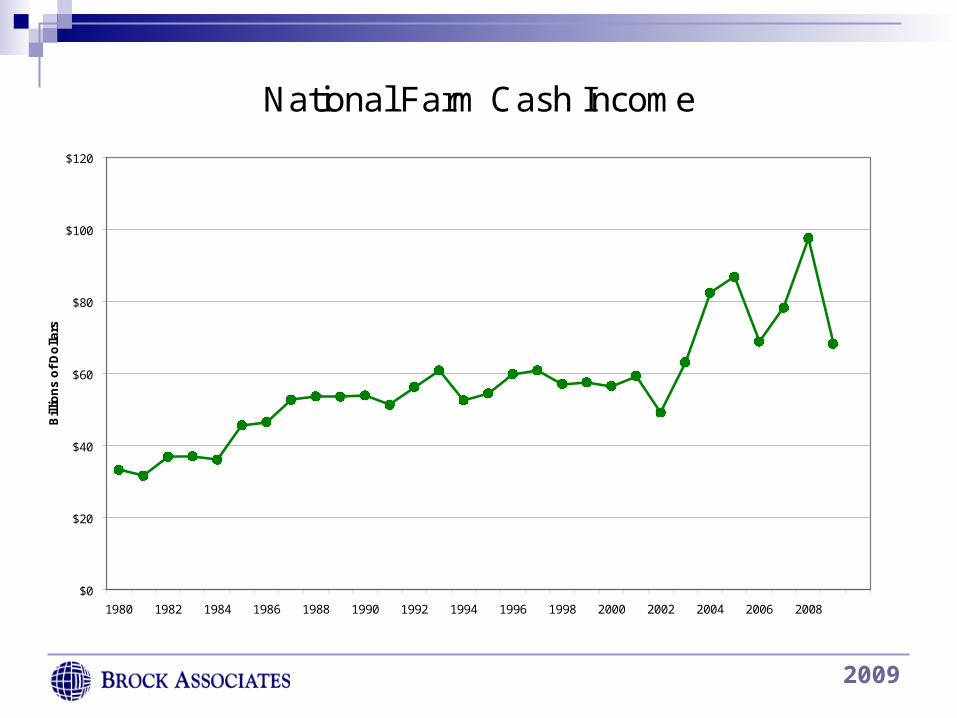
National Farm Cash Income
$0
$20
$40
$60
$80
$100
$120
1980 1982 1984 1986 1988 1990 1992 1994 1996 1998 2000 2002 2004 2006 2008
Bill
ion
s o
f D
olla
rs
Source: USDA
2009Proj
2009
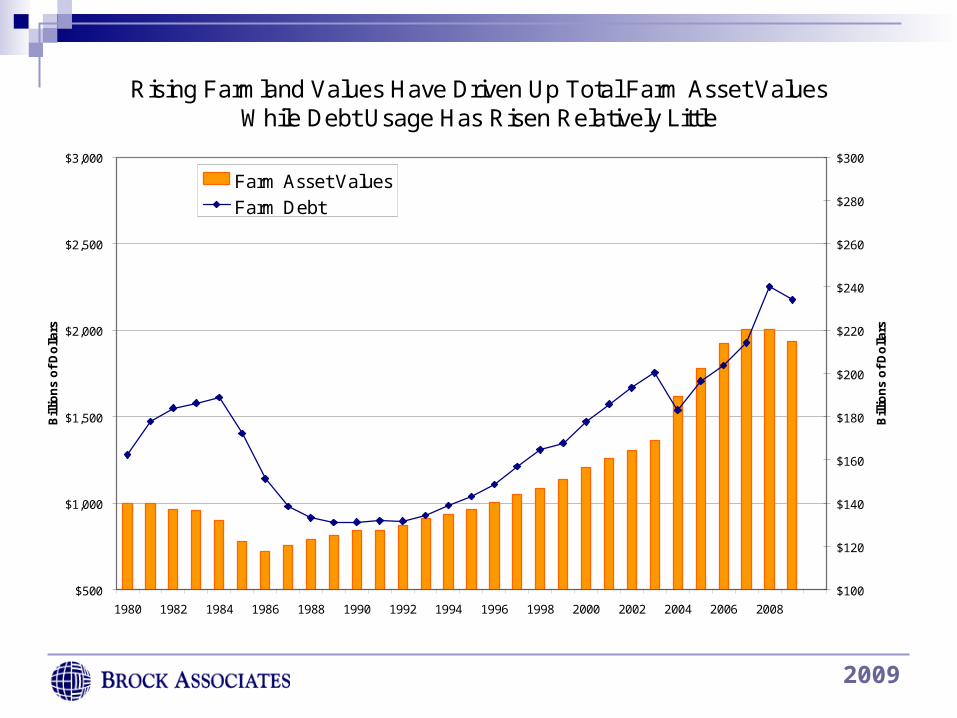
Rising Farmland Values Have Driven Up Total Farm Asset Values While Debt Usage Has Risen Relatively Little
$500
$1,000
$1,500
$2,000
$2,500
$3,000
1980 1982 1984 1986 1988 1990 1992 1994 1996 1998 2000 2002 2004 2006 2008
Bill
ion
s o
f D
olla
rs
$100
$120
$140
$160
$180
$200
$220
$240
$260
$280
$300
Bill
ion
s o
f D
olla
rs
Farm Asset Values
Farm Debt
Source: USDA
2009
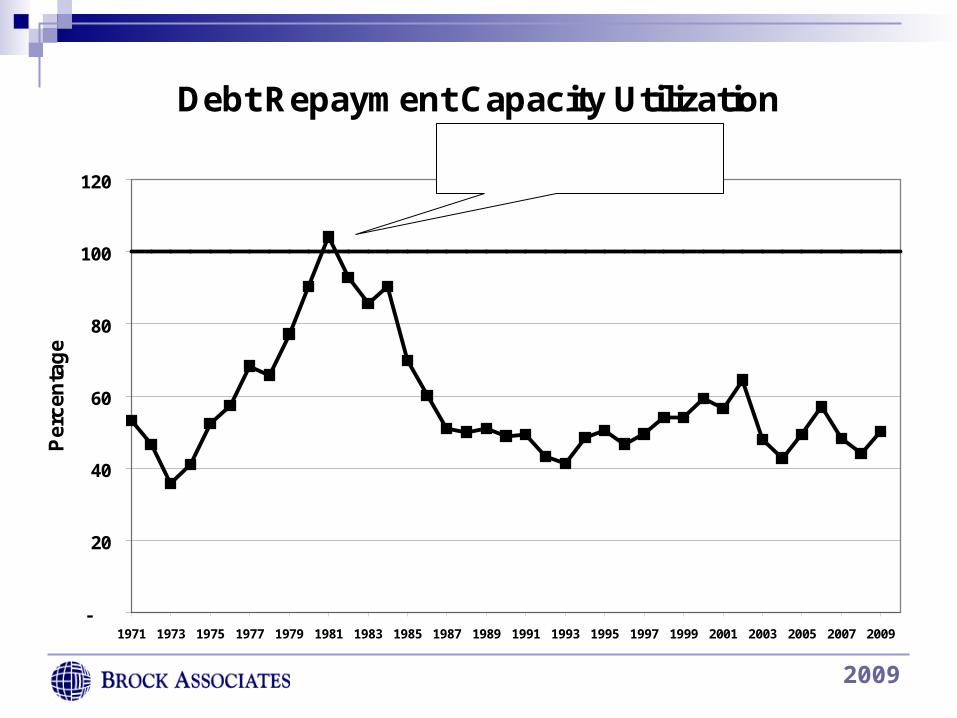
Debt Repayment Capacity Utilization
-
20
40
60
80
100
120
1971 1973 1975 1977 1979 1981 1983 1985 1987 1989 1991 1993 1995 1997 1999 2001 2003 2005 2007 2009
Per
cen
tag
e
Debt use exceeded repayment capacity during 1980-82
Source: Agriculture Income and Finance Outlook
2009
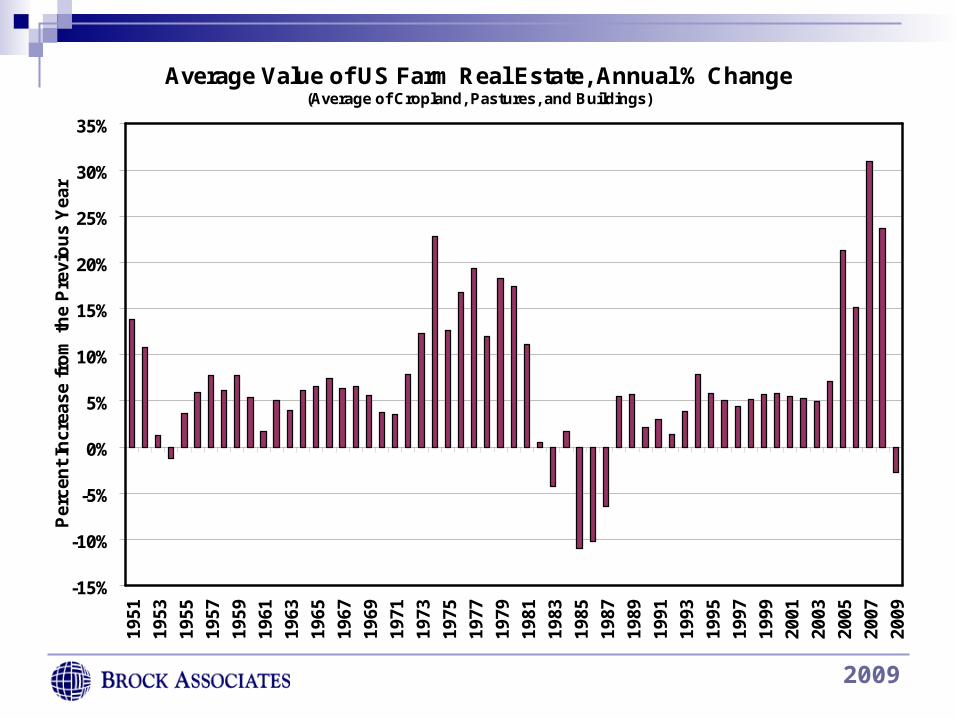
Average Value of US Farm Real Estate, Annual % Change(Average of Cropland, Pastures, and Buildings)
-15%
-10%
-5%
0%
5%
10%
15%
20%
25%
30%
35%19
51
1953
1955
1957
1959
1961
1963
1965
1967
1969
1971
1973
1975
1977
1979
1981
1983
1985
1987
1989
1991
1993
1995
1997
1999
2001
2003
2005
2007
2009
Per
cen
t In
crea
se f
rom
th
e P
revi
ou
s Y
ear
Source: USDA
2009
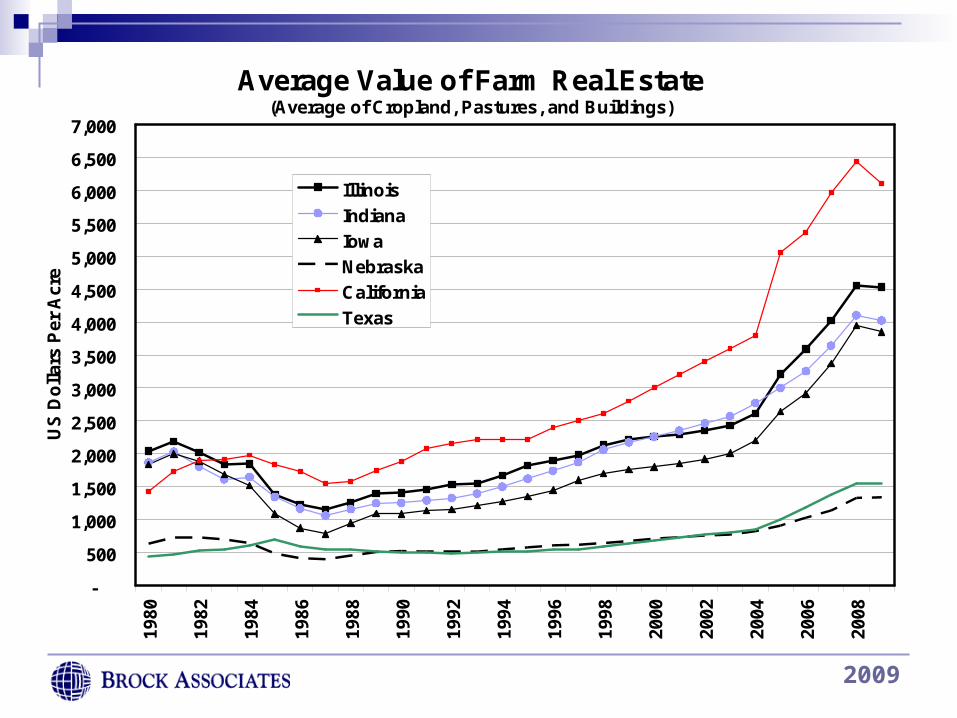
Average Value of Farm Real Estate(Average of Cropland, Pastures, and Buildings)
-
500
1,000
1,500
2,000
2,500
3,000
3,500
4,000
4,500
5,000
5,500
6,000
6,500
7,00019
80
1982
1984
1986
1988
1990
1992
1994
1996
1998
2000
2002
2004
2006
2008
US
Do
llar
s P
er A
cre
Illinois
Indiana
Iowa
Nebraska
California
Texas
Source: USDA, Brock Associates Estimates

2009
2009
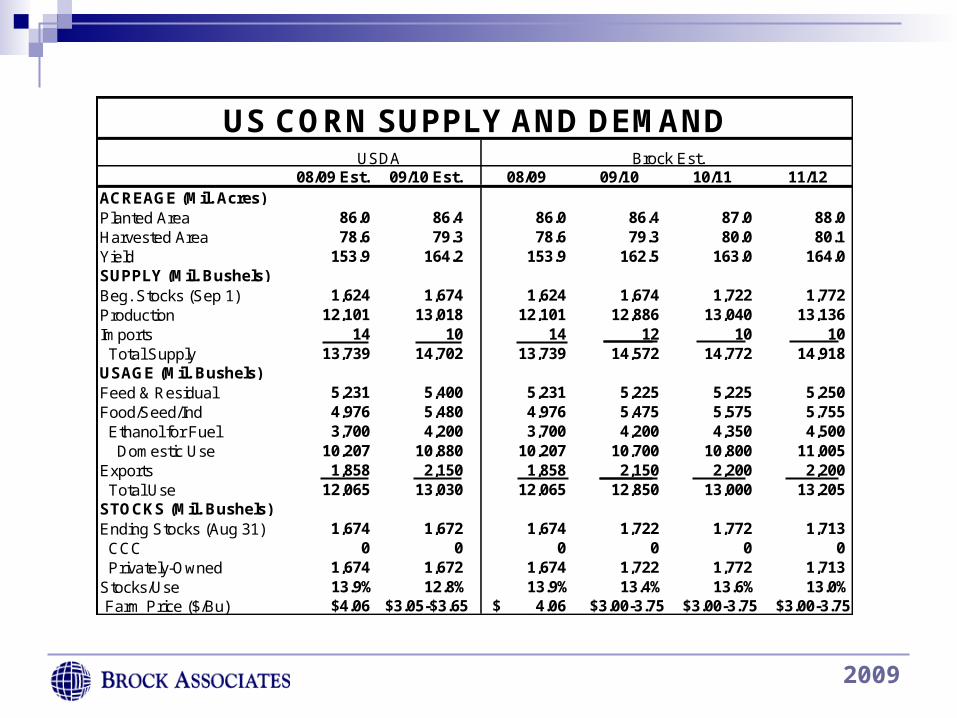
08/09 Est. 09/10 Est. 08/09 09/10 10/11 11/12ACREAGE (Mil. Acres)Planted Area 86.0 86.4 86.0 86.4 87.0 88.0Harvested Area 78.6 79.3 78.6 79.3 80.0 80.1Yield 153.9 164.2 153.9 162.5 163.0 164.0SUPPLY (Mil. Bushels)Beg. Stocks (Sep 1) 1,624 1,674 1,624 1,674 1,722 1,772Production 12,101 13,018 12,101 12,886 13,040 13,136Imports 14 10 14 12 10 10 Total Supply 13,739 14,702 13,739 14,572 14,772 14,918USAGE (Mil. Bushels)Feed & Residual 5,231 5,400 5,231 5,225 5,225 5,250Food/Seed/Ind 4,976 5,480 4,976 5,475 5,575 5,755 Ethanol for Fuel 3,700 4,200 3,700 4,200 4,350 4,500 Domestic Use 10,207 10,880 10,207 10,700 10,800 11,005Exports 1,858 2,150 1,858 2,150 2,200 2,200 Total Use 12,065 13,030 12,065 12,850 13,000 13,205STOCKS (Mil. Bushels)Ending Stocks (Aug 31) 1,674 1,672 1,674 1,722 1,772 1,713 CCC 0 0 0 0 0 0 Privately-Owned 1,674 1,672 1,674 1,722 1,772 1,713Stocks/Use 13.9% 12.8% 13.9% 13.4% 13.6% 13.0%Farm Price ($/Bu) $4.06 $3.05-$3.65 4.06$ $3.00-3.75 $3.00-3.75 $3.00-3.75
Brock Est.
US CORN SUPPLY AND DEMANDUSDA
2009
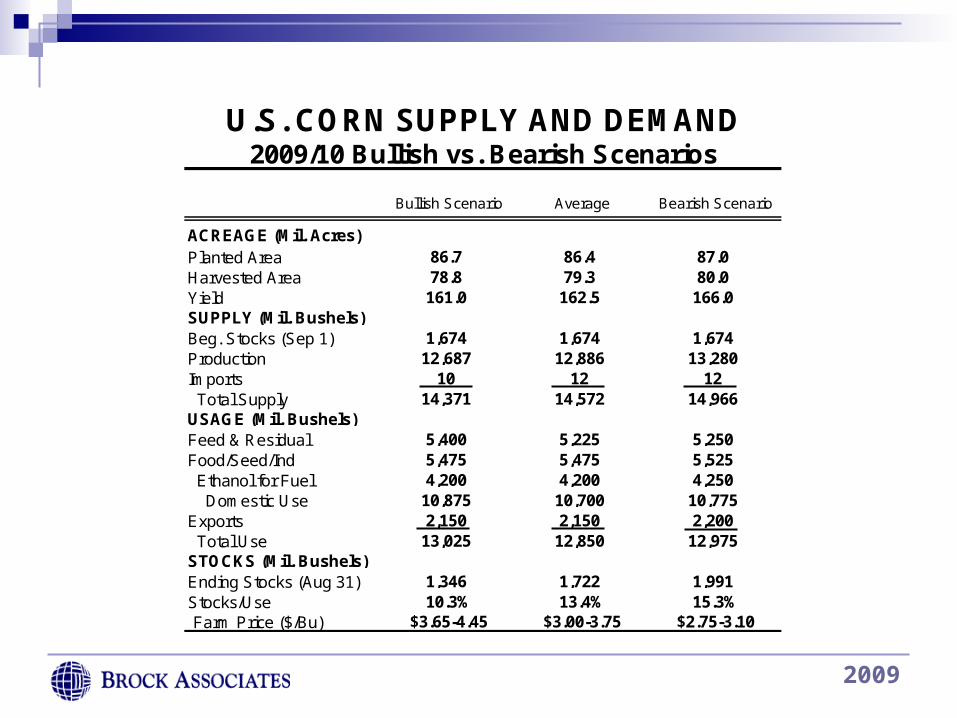
ACREAGE (Mil. Acres)Planted Area 86.7 86.4 87.0Harvested Area 78.8 79.3 80.0Yield 161.0 162.5 166.0SUPPLY (Mil. Bushels)Beg. Stocks (Sep 1) 1,674 1,674 1,674Production 12,687 12,886 13,280Imports 10 12 12 Total Supply 14,371 14,572 14,966USAGE (Mil. Bushels)Feed & Residual 5,400 5,225 5,250Food/Seed/Ind 5,475 5,475 5,525 Ethanol for Fuel 4,200 4,200 4,250 Domestic Use 10,875 10,700 10,775Exports 2,150 2,150 2,200 Total Use 13,025 12,850 12,975STOCKS (Mil. Bushels)Ending Stocks (Aug 31) 1,346 1,722 1,991Stocks/Use 10.3% 13.4% 15.3%Farm Price ($/Bu) $3.65-4.45 $3.00-3.75 $2.75-3.10
Average Bearish ScenarioBullish Scenario
U.S. CORN SUPPLY AND DEMAND2009/10 Bullish vs. Bearish Scenarios
2009
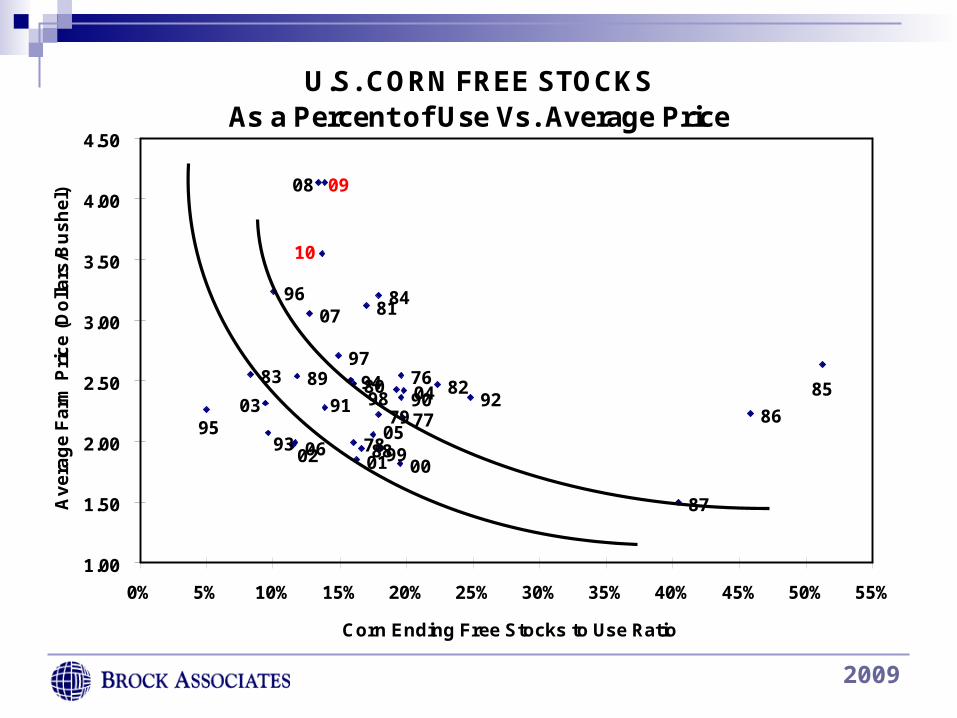
U.S. CORN FREE STOCKS As a Percent of Use Vs. Average Price
10
0908
07
0605
0403
02 01 0099
98
97
96
95
94
93
9291 9089
88
87
86
85
84
8382
81
80
79
7877
76
1.00
1.50
2.00
2.50
3.00
3.50
4.00
4.50
0% 5% 10% 15% 20% 25% 30% 35% 40% 45% 50% 55%
Corn Ending Free Stocks to Use Ratio
Av
era
ge
Fa
rm P
ric
e (
Do
llars
/Bu
sh
el)
2009
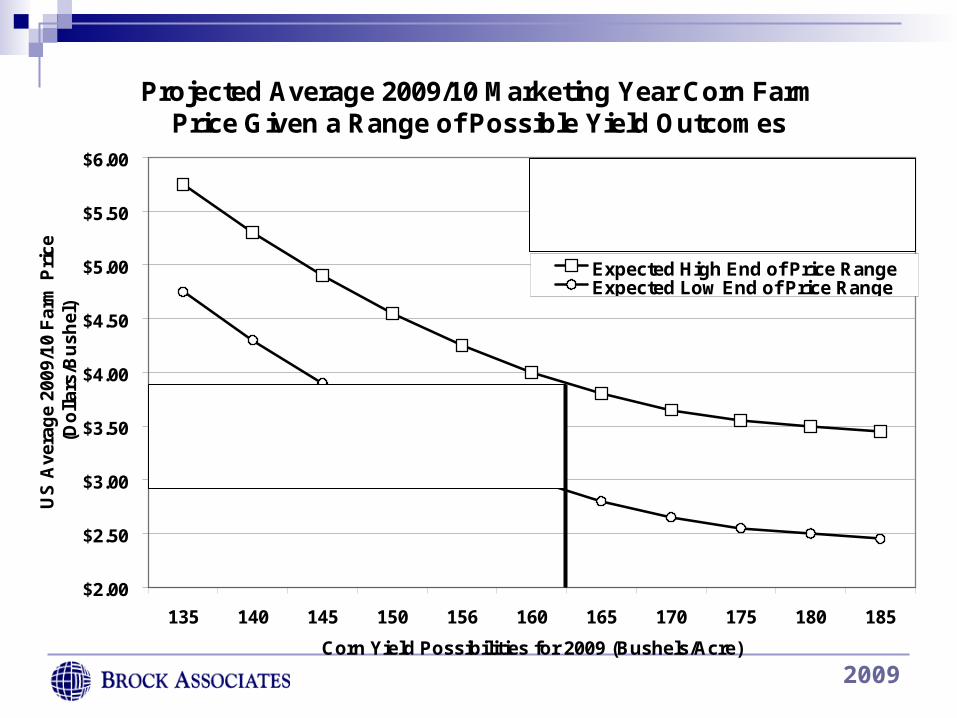
Projected Average 2009/10 Marketing Year Corn Farm Price Given a Range of Possible Yield Outcomes
$2.00
$2.50
$3.00
$3.50
$4.00
$4.50
$5.00
$5.50
$6.00
135 140 145 150 156 160 165 170 175 180 185
Corn Yield Possibilities for 2009 (Bushels/Acre)
US
Ave
rag
e 20
09/1
0 F
arm
Pri
ce
(Do
llar
s/B
ush
el)
Expected High End of Price RangeExpected Low End of Price Range
The average marketing year farm price is projected between $3.00 and $3.75 given the current Brock Associates acreage estimate of 86.4 million acres, yield estimate of 162.5 bushels/acre and 12,850 million bushel demand expectation.
2009
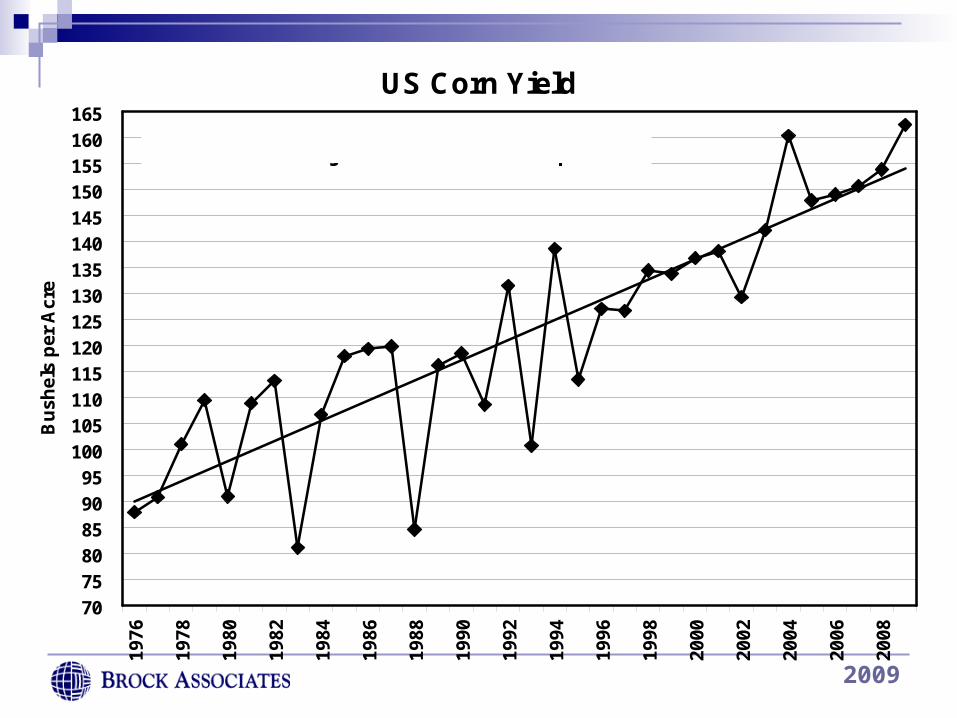
US Corn Yield
70
75
8085
90
95
100
105110
115
120
125130
135
140
145
150155
160
16519
76
1978
1980
1982
1984
1986
1988
1990
1992
1994
1996
1998
2000
2002
2004
2006
2008
Bu
shel
s p
er A
cre
Brock 2009/10 Projection: 162.5 Bushels per Acre
2009
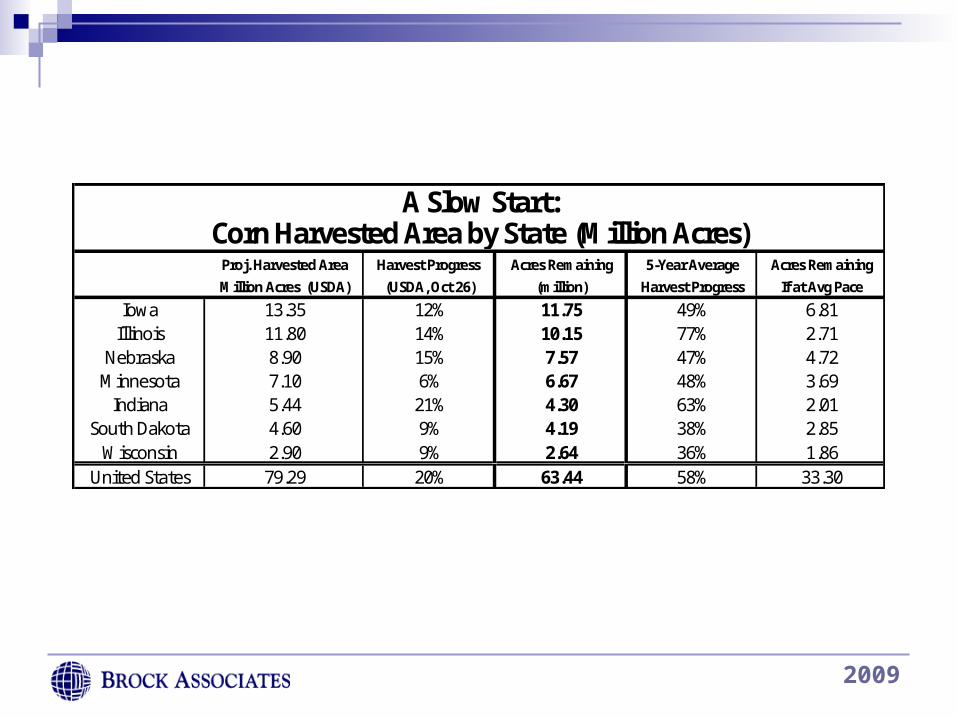
Proj. Harvested Area Harvest Progress Acres Remaining 5-Year Average Acres RemainingMillion Acres (USDA) (USDA, Oct 26) (million) Harvest Progress If at Avg Pace
Iowa 13.35 12% 11.75 49% 6.81Illinois 11.80 14% 10.15 77% 2.71
Nebraska 8.90 15% 7.57 47% 4.72Minnesota 7.10 6% 6.67 48% 3.69
Indiana 5.44 21% 4.30 63% 2.01South Dakota 4.60 9% 4.19 38% 2.85
Wisconsin 2.90 9% 2.64 36% 1.860.00United States 79.29 20% 63.44 58% 33.30
A Slow Start:Corn Harvested Area by State (Million Acres)
2009
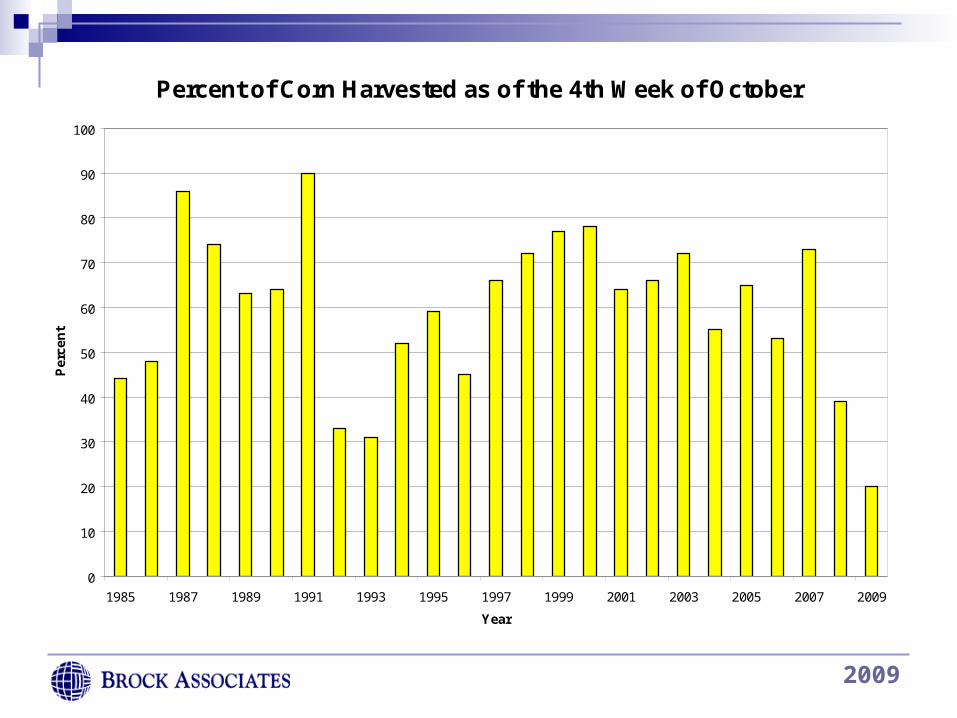
Percent of Corn Harvested as of the 4th Week of October
0
10
20
30
40
50
60
70
80
90
100
1985 1987 1989 1991 1993 1995 1997 1999 2001 2003 2005 2007 2009
Year
Per
cen
t
Source: USDA
2009
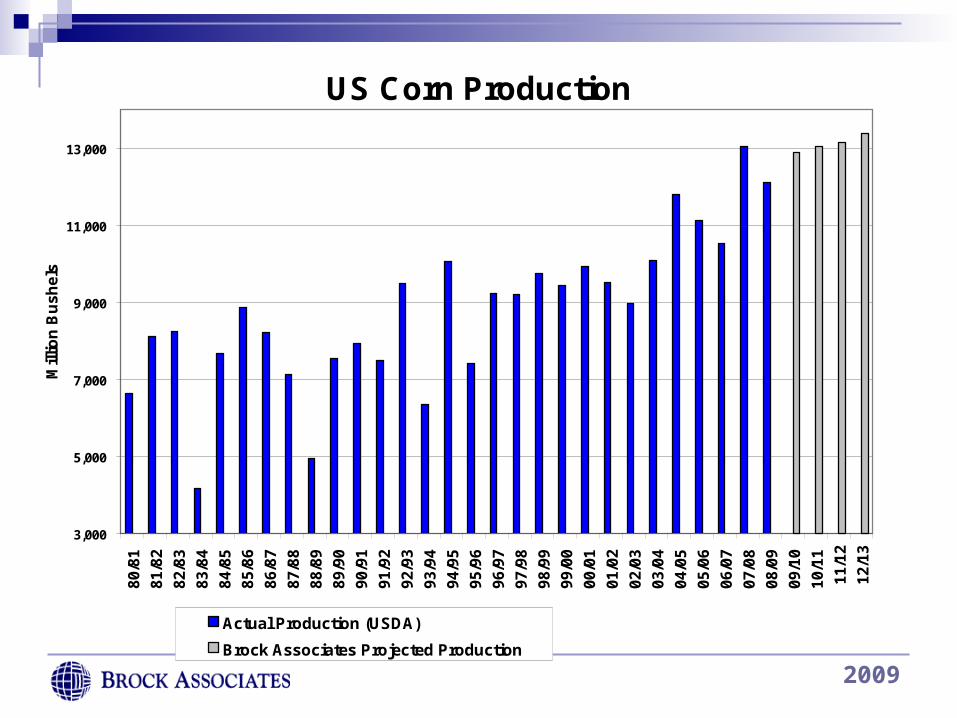
US Corn Production
3,000
5,000
7,000
9,000
11,000
13,0008
0/8
1
81/
82
82/
83
83/
84
84/
85
85/
86
86/
87
87/
88
88/
89
89/
90
90/
91
91/
92
92/
93
93/
94
94/
95
95/
96
96/
97
97/
98
98/
99
99/
00
00/
01
01/
02
02/
03
03/
04
04/
05
05/
06
06/
07
07/
08
08/
09
09/
10
10/
11
11/
12
12/
13
Mill
ion
Bu
sh
els
Actual Production (USDA)
Brock Associates Projected Production
Brock 2009/10 Projection: 12,886 Million Bushels
2009
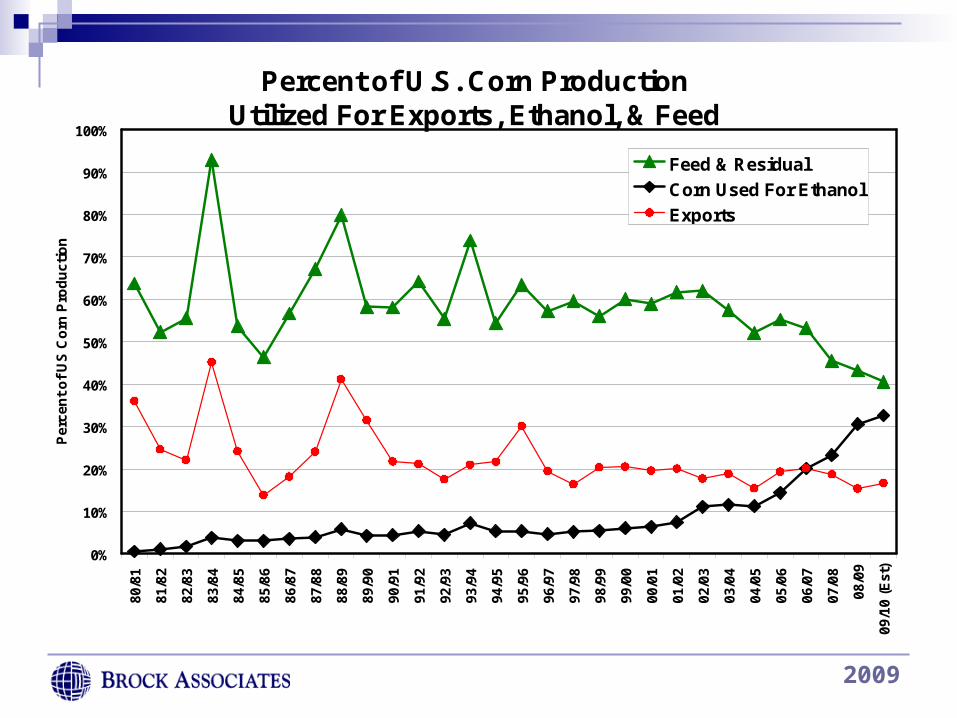
Percent of U.S. Corn Production Utilized For Exports, Ethanol, & Feed
0%
10%
20%
30%
40%
50%
60%
70%
80%
90%
100%80
/81
81/8
2
82/8
3
83/8
4
84/8
5
85/8
6
86/8
7
87/8
8
88/8
9
89/9
0
90/9
1
91/9
2
92/9
3
93/9
4
94/9
5
95/9
6
96/9
7
97/9
8
98/9
9
99/0
0
00/0
1
01/0
2
02/0
3
03/0
4
04/0
5
05/0
6
06/0
7
07/0
8
08/0
9
09/1
0 (E
st)
Per
cen
t o
f U
S C
orn
Pro
du
ctio
n
Feed & Residual
Corn Used For Ethanol
Exports

2009
Corn Ending Stocks
0
1,000
2,000
3,000
4,000
5,000
6,0008
0/8
1
81
/82
82
/83
83
/84
84
/85
85
/86
86
/87
87
/88
88
/89
89
/90
90
/91
91
/92
92
/93
93
/94
94
/95
95
/96
96
/97
97
/98
98
/99
99
/00
00
/01
01
/02
02
/03
03
/04
04
/05
05
/06
06
/07
07
/08
08
/09
09
/10
10
/11
11
/12
12
/13
Mil
lio
n B
us
he
ls
Actual Ending Stocks (USDA)
Brock Associates Projected Ending Stocks
Brock 2009/10 Projection: 1,722 Million Bushels
2009
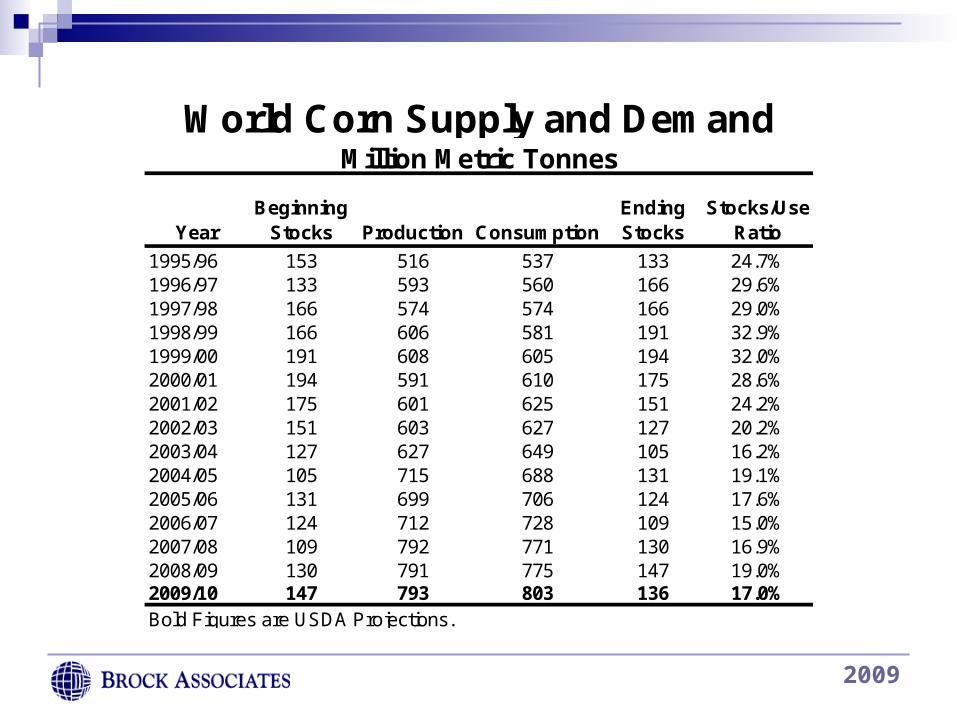
YearBeginning
Stocks Production ConsumptionEnding Stocks
Stocks/Use Ratio
1995/96 153 516 537 133 24.7%1996/97 133 593 560 166 29.6%1997/98 166 574 574 166 29.0%1998/99 166 606 581 191 32.9%1999/00 191 608 605 194 32.0%2000/01 194 591 610 175 28.6%2001/02 175 601 625 151 24.2%2002/03 151 603 627 127 20.2%2003/04 127 627 649 105 16.2%2004/05 105 715 688 131 19.1%2005/06 131 699 706 124 17.6%2006/07 124 712 728 109 15.0%2007/08 109 792 771 130 16.9%2008/09 130 791 775 147 19.0%2009/10 147 793 803 136 17.0%
World Corn Supply and DemandMillion Metric Tonnes
Bold Figures are USDA Projections.
2009
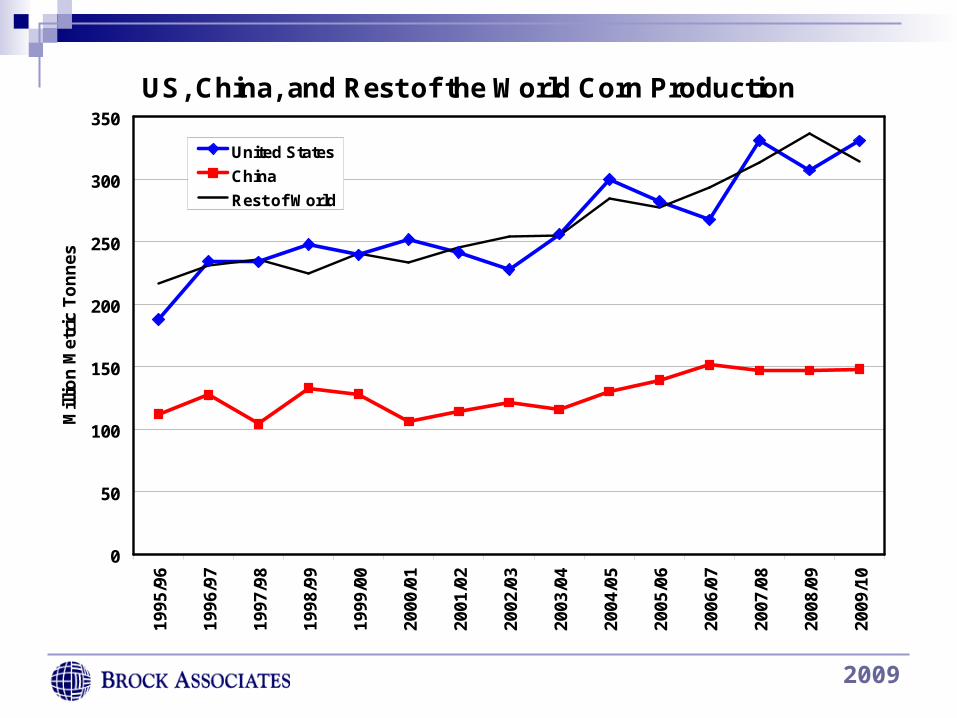
US, China, and Rest of the World Corn Production
0
50
100
150
200
250
300
350
1995
/96
1996
/97
1997
/98
1998
/99
1999
/00
2000
/01
2001
/02
2002
/03
2003
/04
2004
/05
2005
/06
2006
/07
2007
/08
2008
/09
2009
/10
Mil
lio
n M
etri
c T
on
nes
United States
China
Rest of World
2009
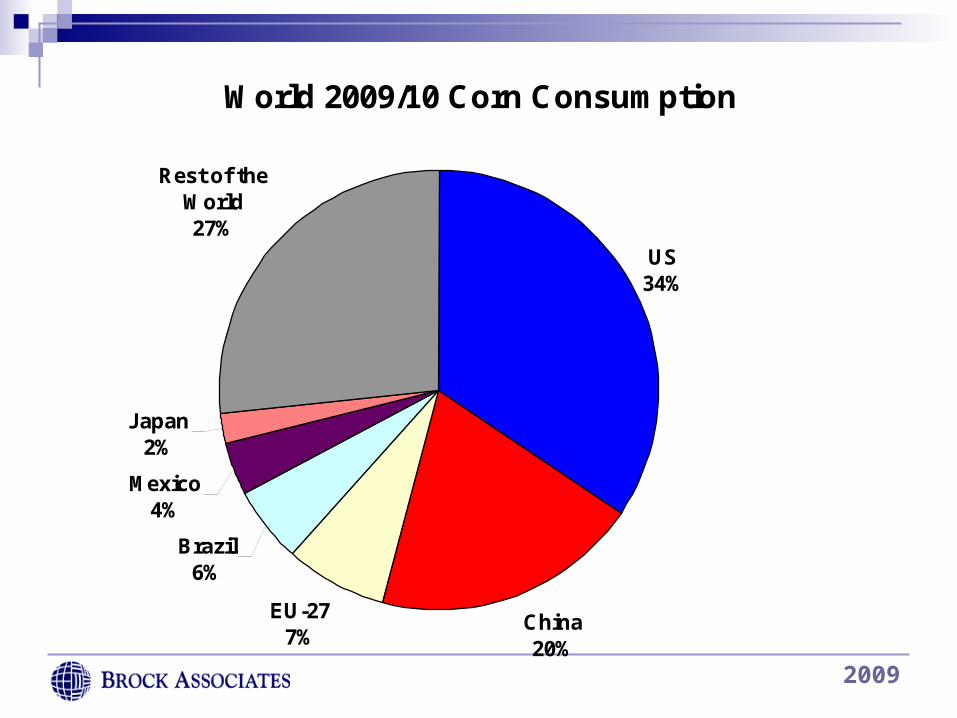
World 2009/10 Corn Consumption
US34%
China20%
EU-277%
Brazil6%
Mexico4%
Japan2%
Rest of the World27%
2009
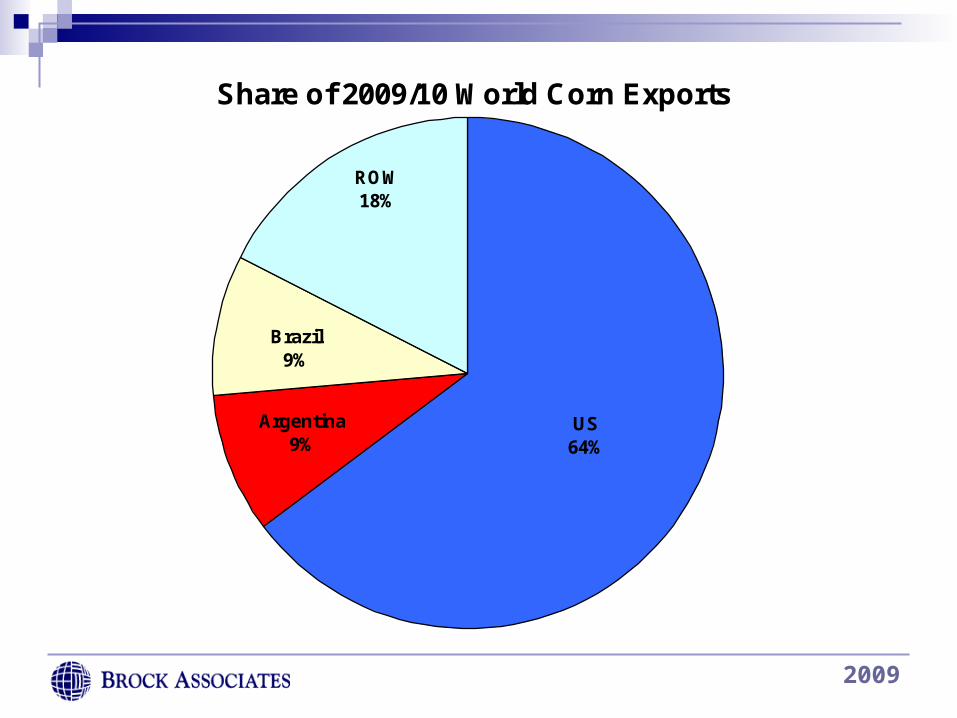
Share of 2009/10 World Corn Exports
US64%
Argentina9%
Brazil9%
ROW18%
2009
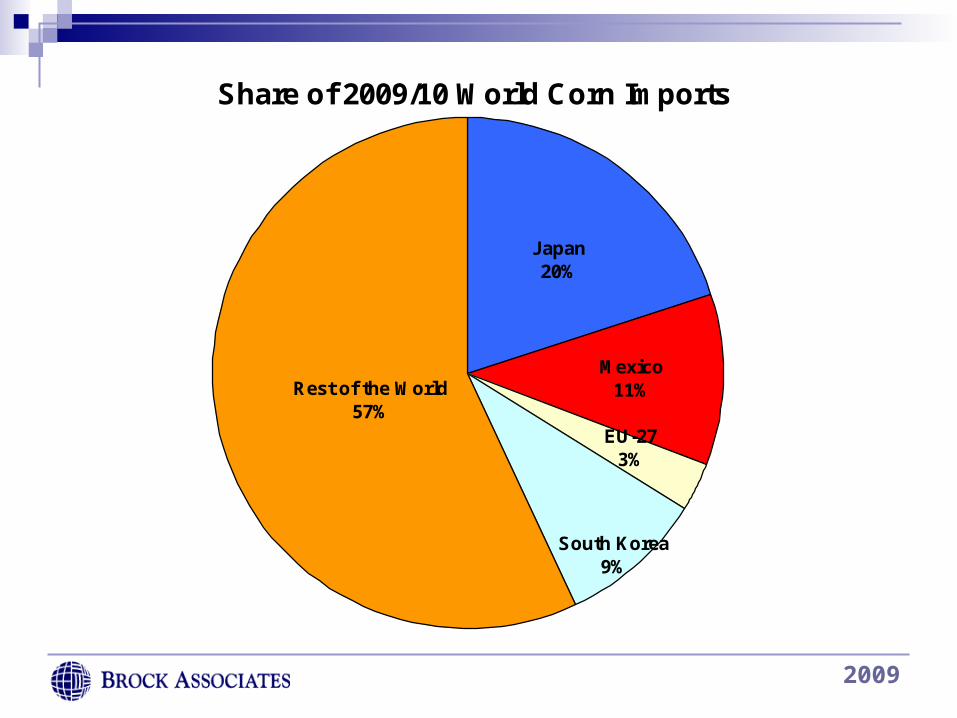
Share of 2009/10 World Corn Imports
Japan20%
Mexico11%
EU-273%
South Korea9%
Rest of the World57%
2009
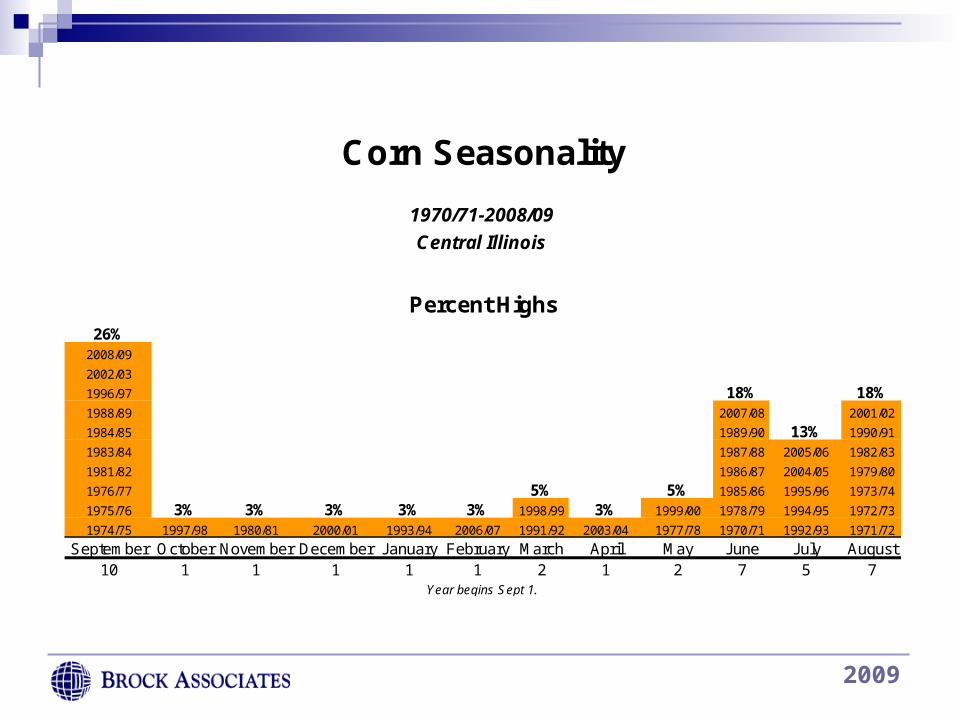
26%2008/09
2002/03
1996/97 18% 18%1988/89 2007/08 2001/02
1984/85 1989/90 13% 1990/91
1983/84 1987/88 2005/06 1982/83
1981/82 1986/87 2004/05 1979/80
1976/77 5% 5% 1985/86 1995/96 1973/74
1975/76 3% 3% 3% 3% 3% 1998/99 3% 1999/00 1978/79 1994/95 1972/73
1974/75 1997/98 1980/81 2000/01 1993/94 2006/07 1991/92 2003/04 1977/78 1970/71 1992/93 1971/72
September October November December January February March April May June July August10 1 1 1 1 1 2 1 2 7 5 7
Corn Seasonality
Percent Highs
1970/71-2008/09
Central Illinois
Year begins Sept 1.
2009
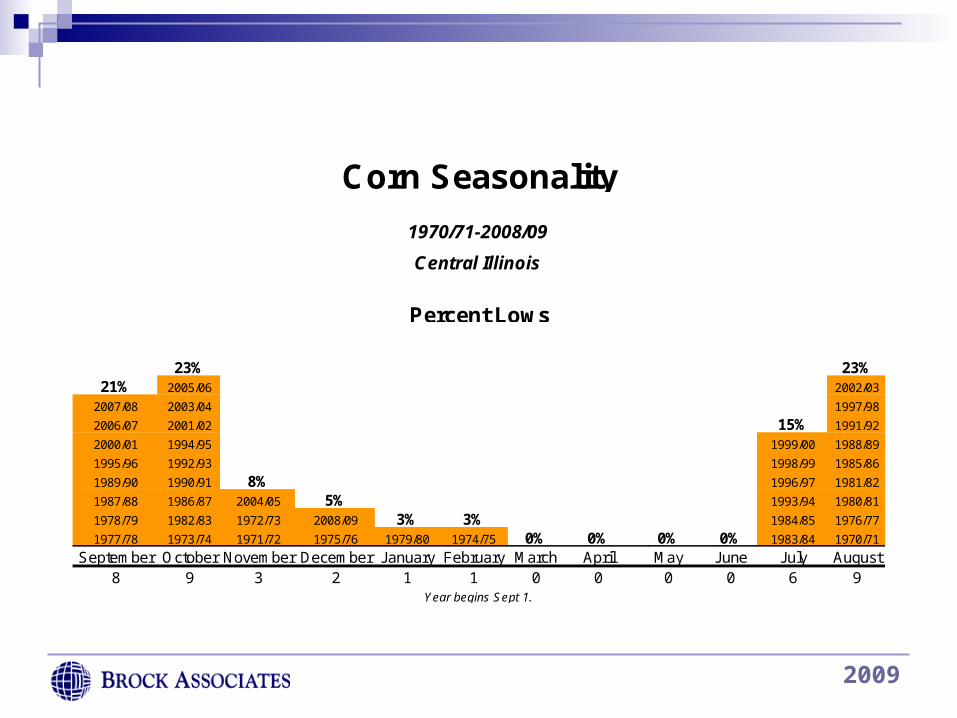
23% 23%21% 2005/06 2002/03
2007/08 2003/04 1997/98
2006/07 2001/02 15% 1991/92
2000/01 1994/95 1999/00 1988/89
1995/96 1992/93 1998/99 1985/86
1989/90 1990/91 8% 1996/97 1981/82
1987/88 1986/87 2004/05 5% 1993/94 1980/81
1978/79 1982/83 1972/73 2008/09 3% 3% 1984/85 1976/77
1977/78 1973/74 1971/72 1975/76 1979/80 1974/75 0% 0% 0% 0% 1983/84 1970/71
September October November December January February March April May June July August8 9 3 2 1 1 0 0 0 0 6 9
1970/71-2008/09
Year begins Sept 1.
Central Illinois
Percent Lows
Corn Seasonality
2009
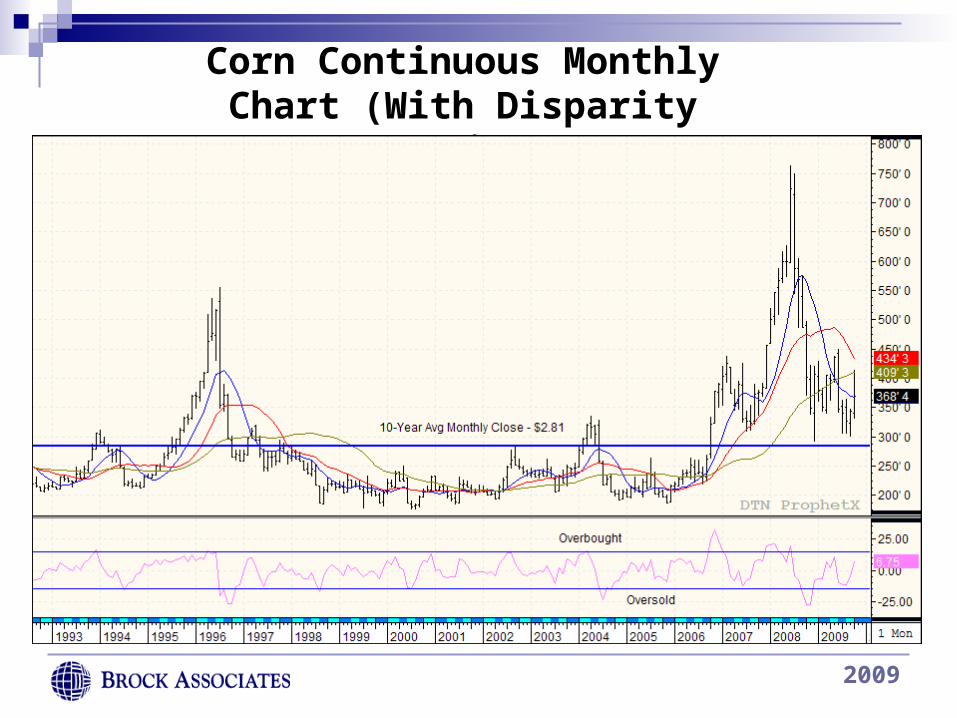
Corn Continuous Monthly Chart (With Disparity Ratio)
2009
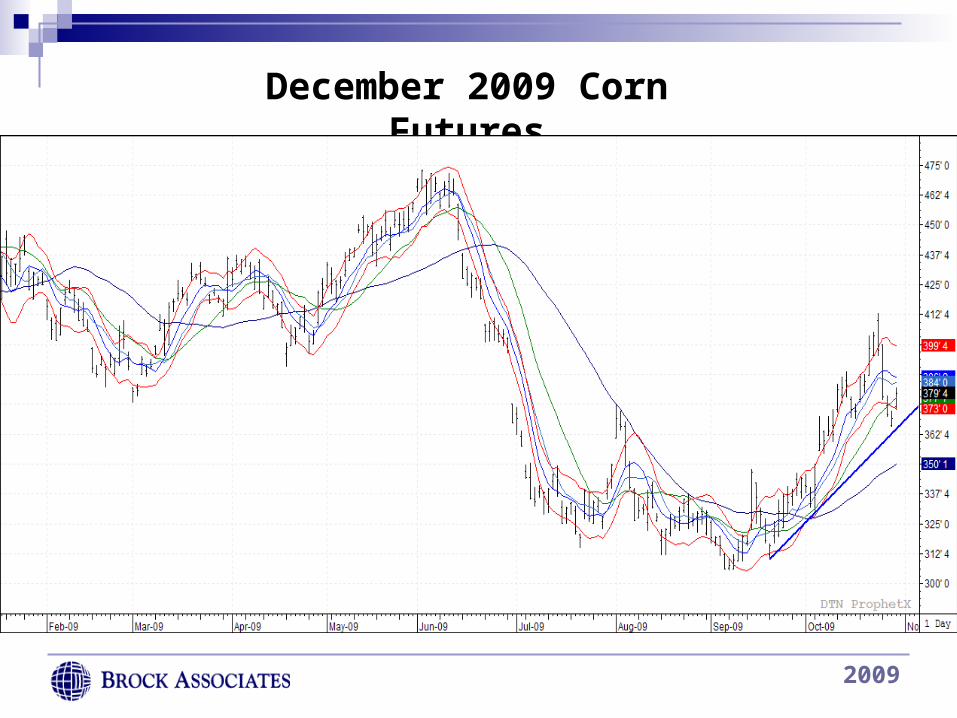
December 2009 Corn Futures
2009
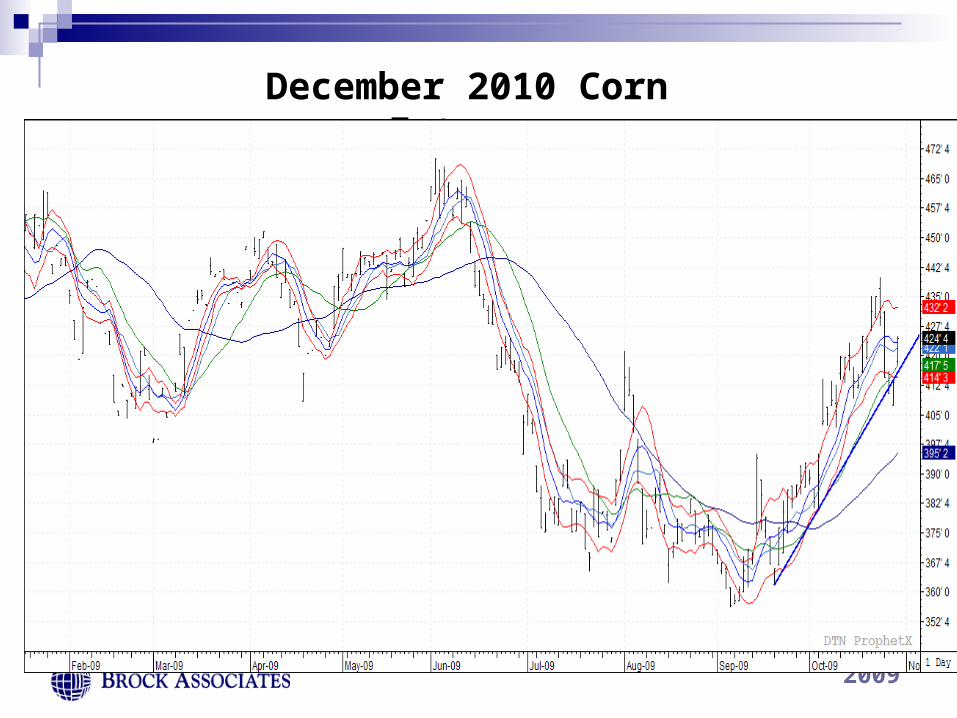
December 2010 Corn Futures
2009
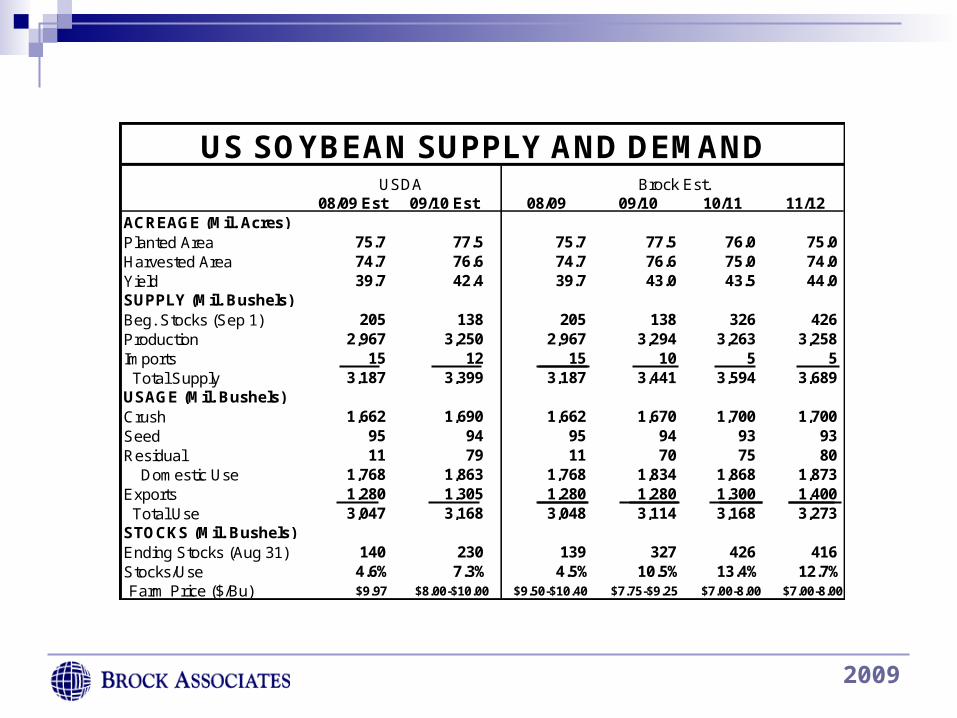
08/09 Est 09/10 Est 08/09 09/10 10/11 11/12ACREAGE (Mil. Acres)Planted Area 75.7 77.5 75.7 77.5 76.0 75.0Harvested Area 74.7 76.6 74.7 76.6 75.0 74.0Yield 39.7 42.4 39.7 43.0 43.5 44.0SUPPLY (Mil. Bushels)Beg. Stocks (Sep 1) 205 138 205 138 326 426Production 2,967 3,250 2,967 3,294 3,263 3,258Imports 15 12 15 10 5 5 Total Supply 3,187 3,399 3,187 3,441 3,594 3,689USAGE (Mil. Bushels)Crush 1,662 1,690 1,662 1,670 1,700 1,700Seed 95 94 95 94 93 93Residual 11 79 11 70 75 80 Domestic Use 1,768 1,863 1,768 1,834 1,868 1,873Exports 1,280 1,305 1,280 1,280 1,300 1,400 Total Use 3,047 3,168 3,048 3,114 3,168 3,273STOCKS (Mil. Bushels)Ending Stocks (Aug 31) 140 230 139 327 426 416Stocks/Use 4.6% 7.3% 4.5% 10.5% 13.4% 12.7%Farm Price ($/Bu) $9.97 $8.00-$10.00 $9.50-$10.40 $7.75-$9.25 $7.00-8.00 $7.00-8.00
US SOYBEAN SUPPLY AND DEMANDBrock Est.USDA
2009
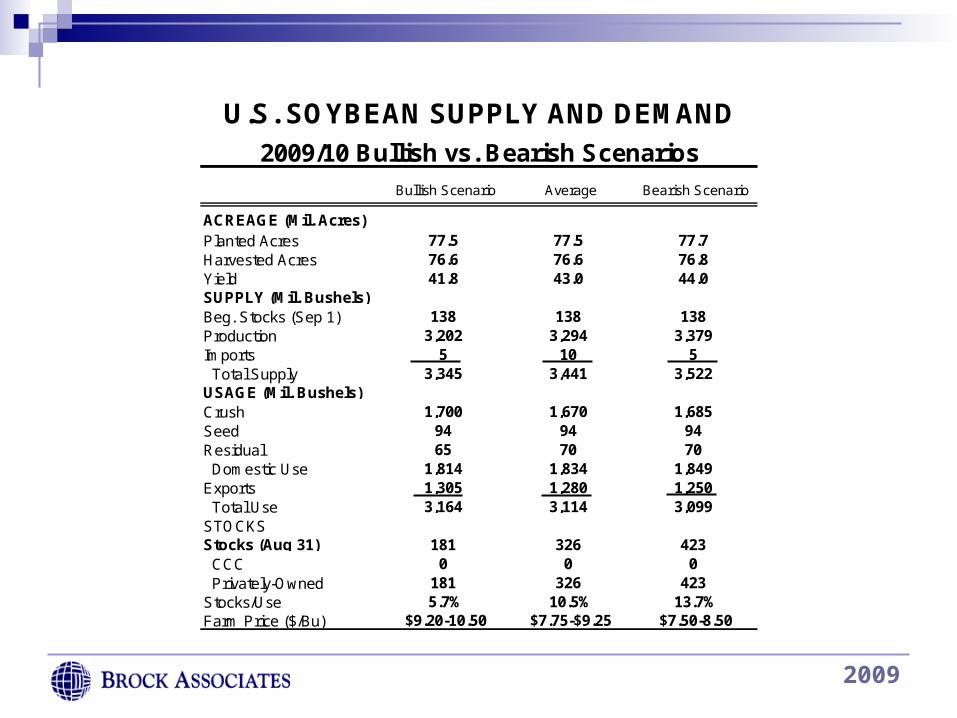
ACREAGE (Mil. Acres)Planted Acres 77.5 77.5 77.7Harvested Acres 76.6 76.6 76.8Yield 41.8 43.0 44.0SUPPLY (Mil. Bushels)Beg. Stocks (Sep 1) 138 138 138Production 3,202 3,294 3,379Imports 5 10 5 Total Supply 3,345 3,441 3,522USAGE (Mil. Bushels)Crush 1,700 1,670 1,685Seed 94 94 94Residual 65 70 70 Domestic Use 1,814 1,834 1,849Exports 1,305 1,280 1,250 Total Use 3,164 3,114 3,099STOCKSStocks (Aug 31) 181 326 423 CCC 0 0 0 Privately-Owned 181 326 423Stocks/Use 5.7% 10.5% 13.7%Farm Price ($/Bu) $9.20-10.50 $7.75-$9.25 $7.50-8.50
Bullish Scenario Average Bearish Scenario
U.S. SOYBEAN SUPPLY AND DEMAND
2009/10 Bullish vs. Bearish Scenarios
2009
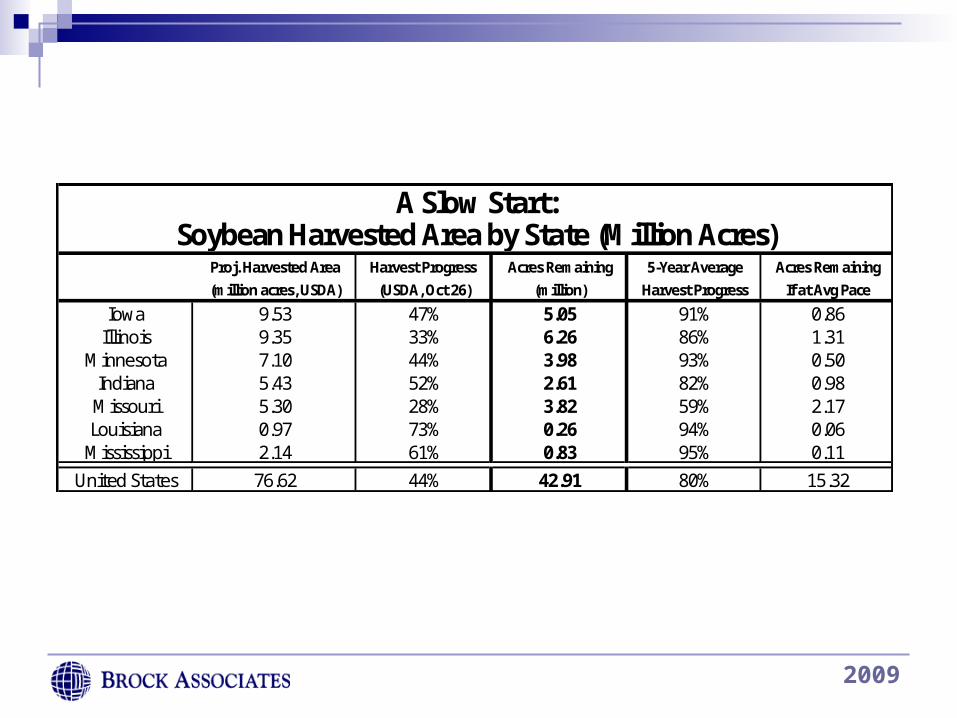
Proj. Harvested Area Harvest Progress Acres Remaining 5-Year Average Acres Remaining(million acres, USDA) (USDA, Oct 26) (million) Harvest Progress If at Avg Pace
Iowa 9.53 47% 5.05 91% 0.86Illinois 9.35 33% 6.26 86% 1.31
Minnesota 7.10 44% 3.98 93% 0.50Indiana 5.43 52% 2.61 82% 0.98
Missouri 5.30 28% 3.82 59% 2.17Louisiana 0.97 73% 0.26 94% 0.06
Mississippi 2.14 61% 0.83 95% 0.11United States 76.62 44% 42.91 80% 15.32
A Slow Start:Soybean Harvested Area by State (Million Acres)
2009
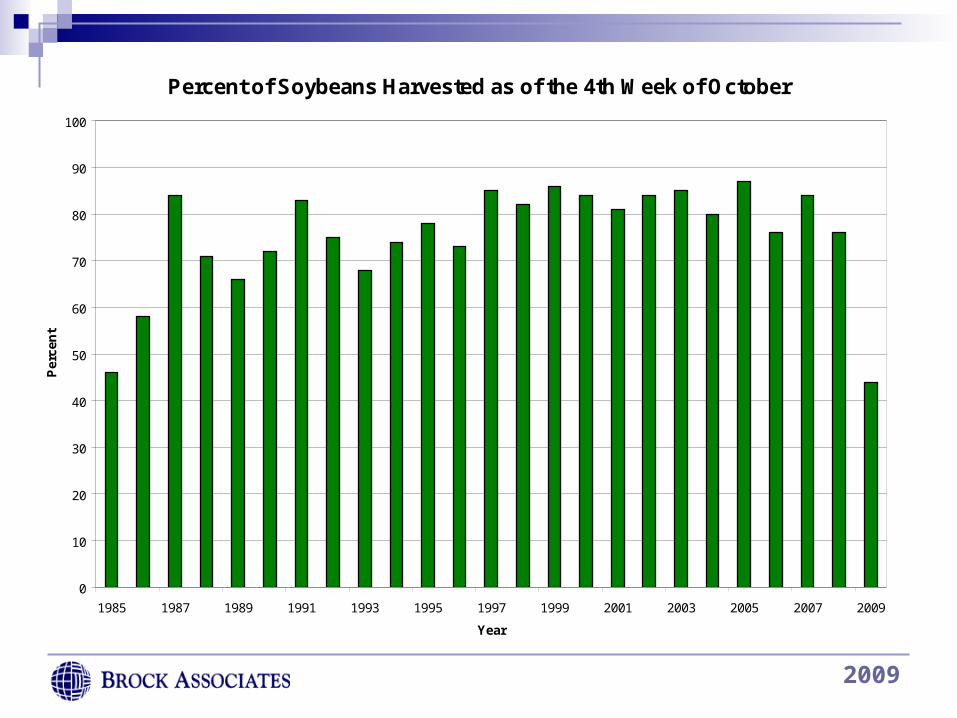
Percent of Soybeans Harvested as of the 4th Week of October
0
10
20
30
40
50
60
70
80
90
100
1985 1987 1989 1991 1993 1995 1997 1999 2001 2003 2005 2007 2009
Year
Per
cen
t
Source: USDA
2009
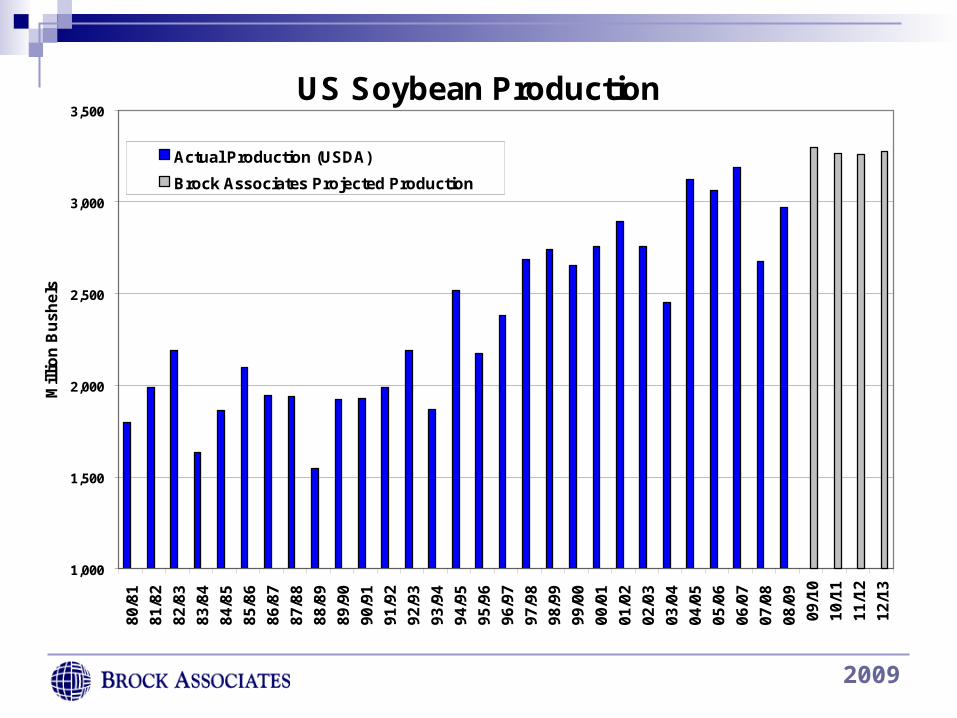
US Soybean Production
1,000
1,500
2,000
2,500
3,000
3,500
80
/81
81
/82
82
/83
83
/84
84
/85
85
/86
86
/87
87
/88
88
/89
89
/90
90
/91
91
/92
92
/93
93
/94
94
/95
95
/96
96
/97
97
/98
98
/99
99
/00
00
/01
01
/02
02
/03
03
/04
04
/05
05
/06
06
/07
07
/08
08
/09
09
/10
10
/11
11
/12
12
/13
Mil
lio
n B
us
he
ls
Actual Production (USDA)
Brock Associates Projected Production
Brock 2009/10 Projection: 3,294 Million Bushels
2009
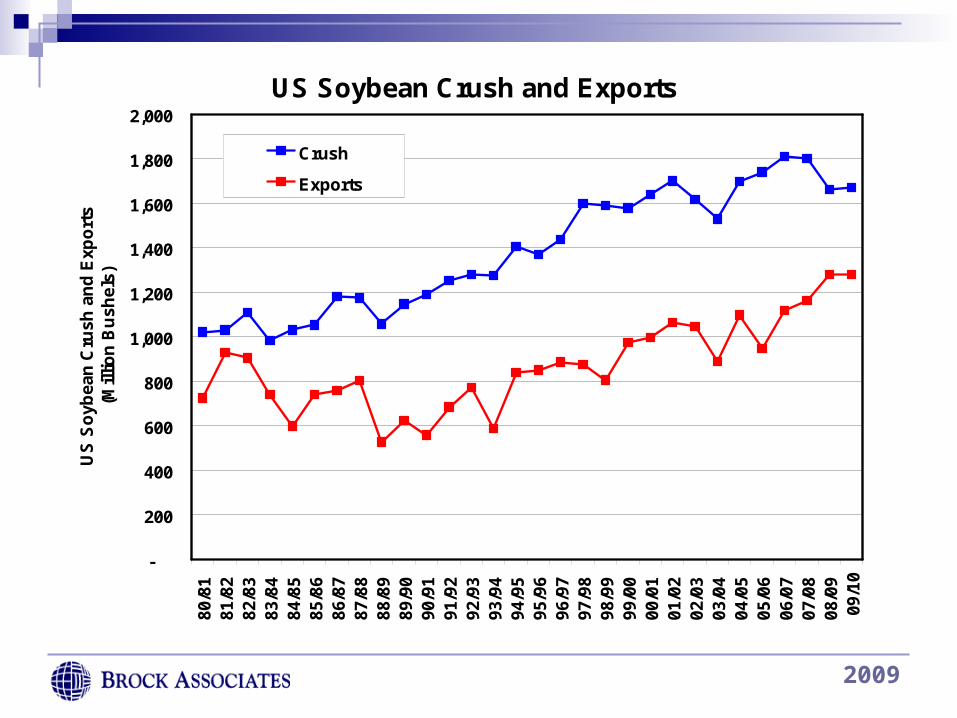
US Soybean Crush and Exports
-
200
400
600
800
1,000
1,200
1,400
1,600
1,800
2,000
80/8
1 81
/82
82/8
3 83
/84
84/8
5 85
/86
86/8
7 87
/88
88/8
9 89
/90
90/9
1 91
/92
92/9
3 93
/94
94/9
5 95
/96
96/9
7 97
/98
98/9
9 99
/00
00/0
1 01
/02
02/0
3 03
/04
04/0
5 05
/06
06/0
7 07
/08
08/0
9 09
/10
US
So
ybea
n C
rush
an
d E
xpo
rts
(Mil
lio
n B
ush
els)
Crush
Exports

2009
Soybean Export Commitments
0
5,000
10,000
15,000
20,000
25,000
30,000
35,000
40,000
Wk 1
Wk 3
Wk 5
Wk 7
Wk 9
Wk 1
1
Wk 1
3
Wk 1
5
Wk 1
7
Wk 1
9
Wk 2
1
Wk 2
3
Wk 2
5
Wk 2
7
Wk 2
9
Wk 3
1
Wk 3
3
Wk 3
5
Wk 3
7
Wk 3
9
Wk 4
1
Wk 4
3
Wk 4
5
Wk 4
7
Wk 4
9
Wk 5
1
Week of Crop Year
Th
ou
san
d M
etri
c T
on
s
2005/06
2006/07
2007/08
2008/09
2009/10
2009
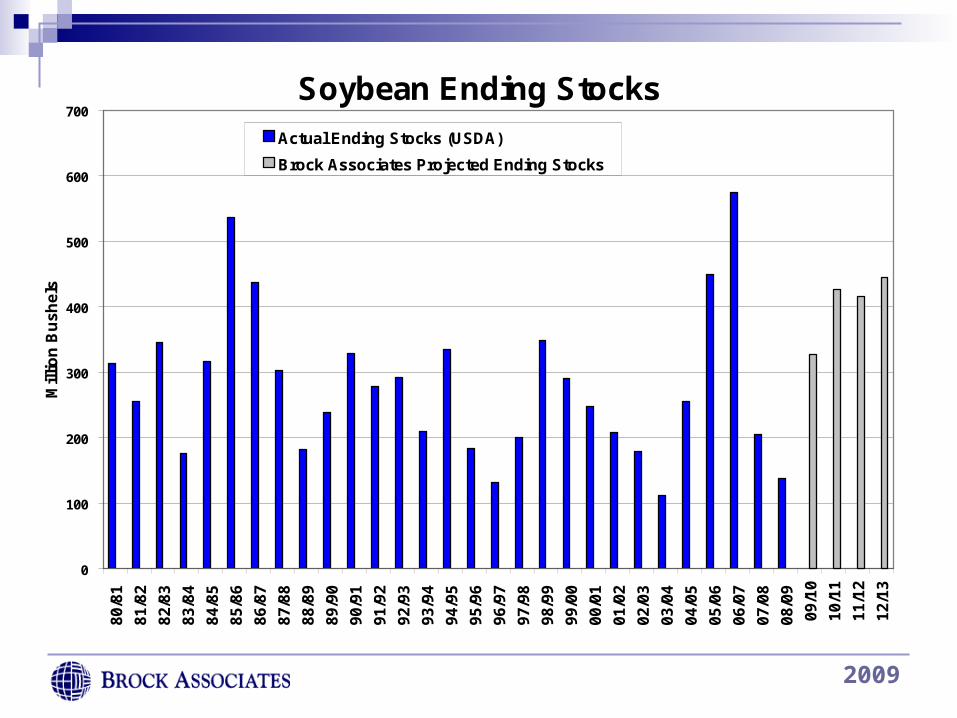
Soybean Ending Stocks
0
100
200
300
400
500
600
7008
0/8
1
81
/82
82
/83
83
/84
84
/85
85
/86
86
/87
87
/88
88
/89
89
/90
90
/91
91
/92
92
/93
93
/94
94
/95
95
/96
96
/97
97
/98
98
/99
99
/00
00
/01
01
/02
02
/03
03
/04
04
/05
05
/06
06
/07
07
/08
08
/09
09
/10
10
/11
11
/12
12
/13
Mil
lio
n B
us
he
ls
Actual Ending Stocks (USDA)
Brock Associates Projected Ending Stocks
Brock 2009/10 Projection: 326 Million Bushels
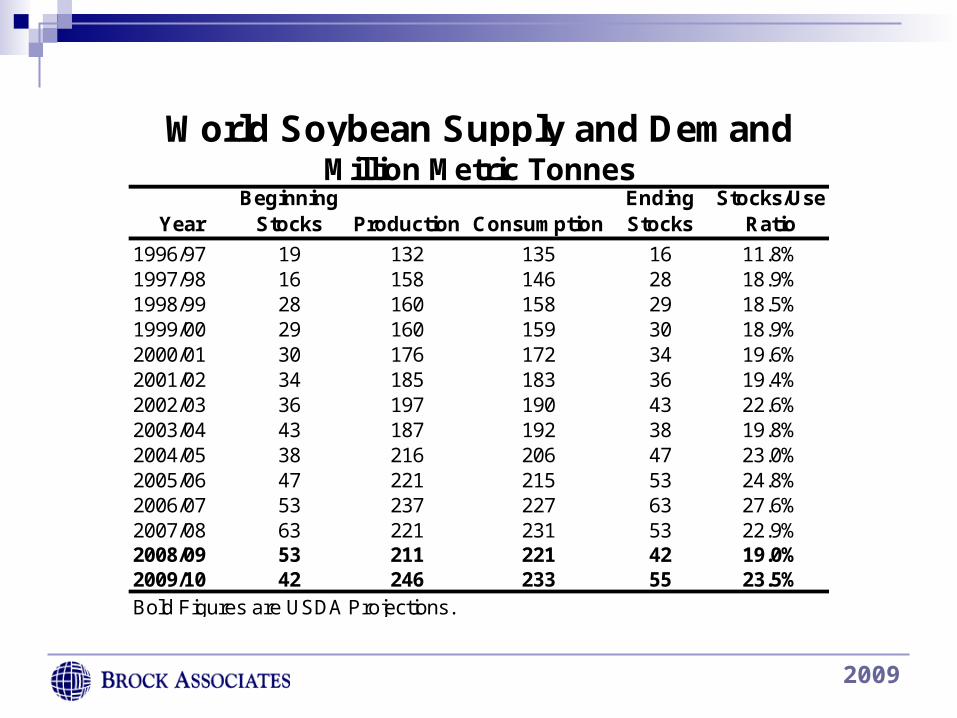
2009
YearBeginning
Stocks Production ConsumptionEnding Stocks
Stocks/Use Ratio
1996/97 19 132 135 16 11.8%1997/98 16 158 146 28 18.9%1998/99 28 160 158 29 18.5%1999/00 29 160 159 30 18.9%2000/01 30 176 172 34 19.6%2001/02 34 185 183 36 19.4%2002/03 36 197 190 43 22.6%2003/04 43 187 192 38 19.8%2004/05 38 216 206 47 23.0%2005/06 47 221 215 53 24.8%2006/07 53 237 227 63 27.6%2007/08 63 221 231 53 22.9%2008/09 53 211 221 42 19.0%2009/10 42 246 233 55 23.5%Bold Figures are USDA Projections.
World Soybean Supply and DemandMillion Metric Tonnes
2009
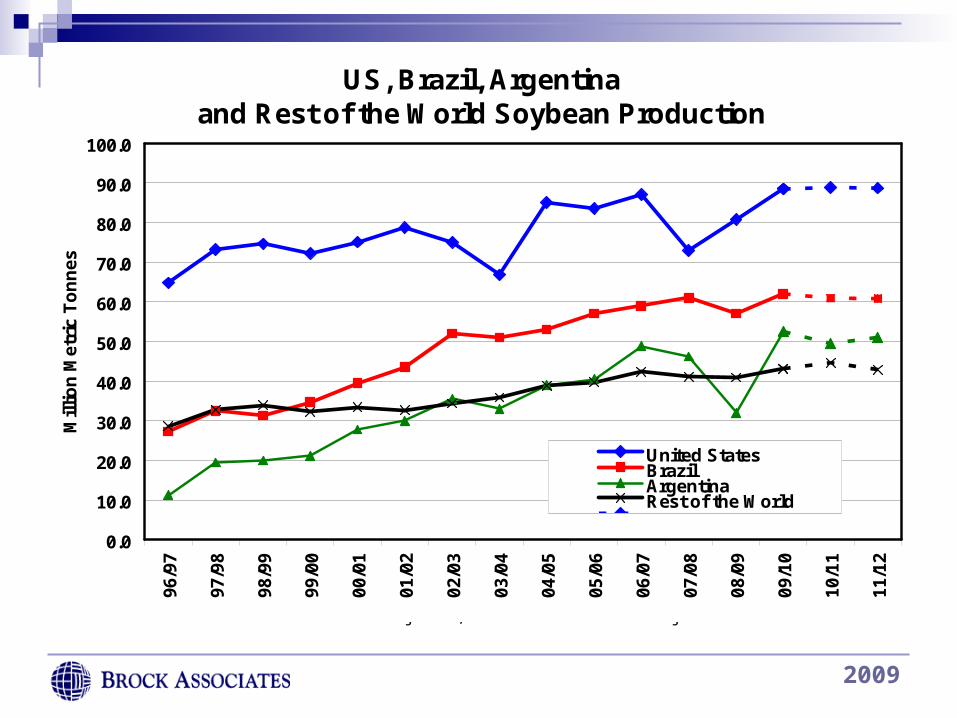
US, Brazil, Argentina and Rest of the World Soybean Production
0.0
10.0
20.0
30.0
40.0
50.0
60.0
70.0
80.0
90.0
100.096
/97
97/9
8
98/9
9
99/0
0
00/0
1
01/0
2
02/0
3
03/0
4
04/0
5
05/0
6
06/0
7
07/0
8
08/0
9
09/1
0
10/1
1
11/1
2
Mil
lio
n M
etri
c T
on
nes
United StatesBrazilArgentinaRest of the World
Series7Series8
Source: 1996-2009 USDA Data/Projections, 2010-11 Brock Associates Projections

2009
China Grain and Oilseed Imports
0.0
5.0
10.0
15.0
20.0
25.0
30.0
35.0
40.0
45.0
50.0
55.0
60.0
65.019
70/7
1
1972
/73
1974
/75
1976
/77
1978
/79
1980
/81
1982
/83
1984
/85
1986
/87
1988
/89
1990
/91
1992
/93
1994
/95
1996
/97
1998
/99
2000
/01
2002
/03
2004
/05
2006
/07
2008
/09
Mil
lio
n M
etri
c T
on
nes
Total Oilseed
Total Grain
2009
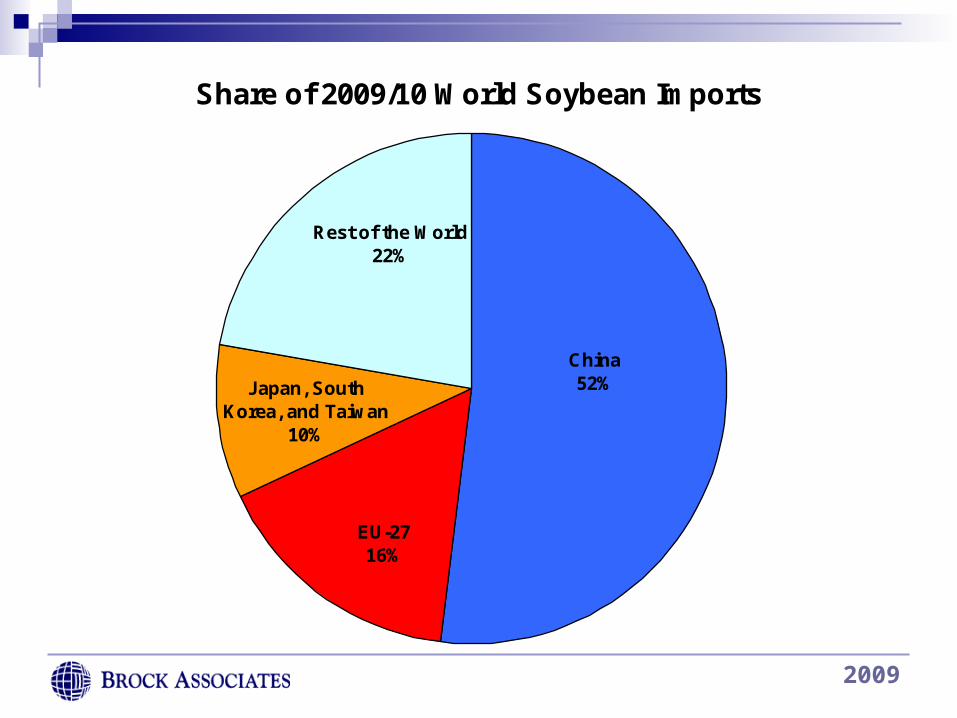
Share of 2009/10 World Soybean Imports
Rest of the World22%
EU-2716%
China52%Japan, South
Korea, and Taiwan10%
2009
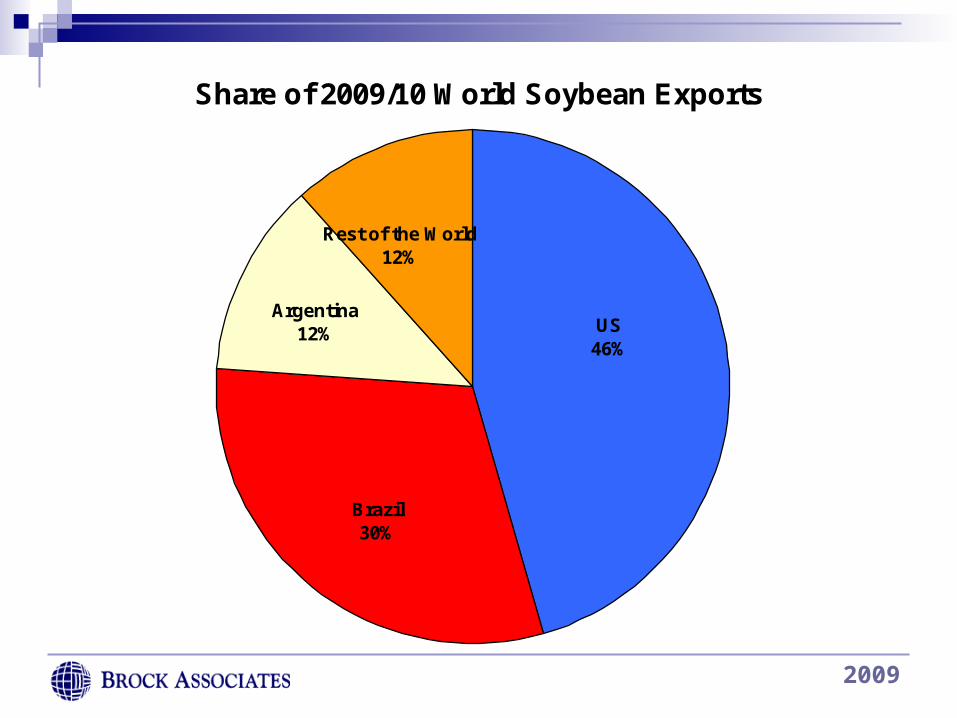
Share of 2009/10 World Soybean Exports
US46%
Brazil30%
Argentina12%
Rest of the World12%
2009
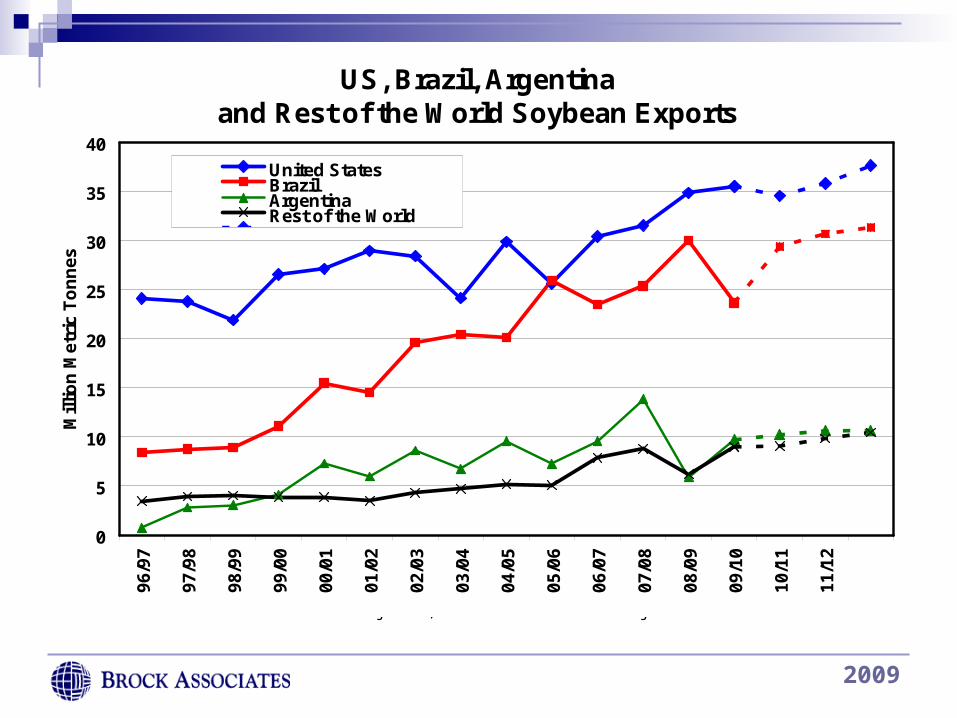
US, Brazil, Argentina and Rest of the World Soybean Exports
0
5
10
15
20
25
30
35
4096
/97
97/9
8
98/9
9
99/0
0
00/0
1
01/0
2
02/0
3
03/0
4
04/0
5
05/0
6
06/0
7
07/0
8
08/0
9
09/1
0
10/1
1
11/1
2
Mil
lio
n M
etri
c T
on
nes
United StatesBrazilArgentinaRest of the World
Series7Series8
Source: 1996-2009 USDA Data/Projections, 2010-11 Brock Associates Projections
2009
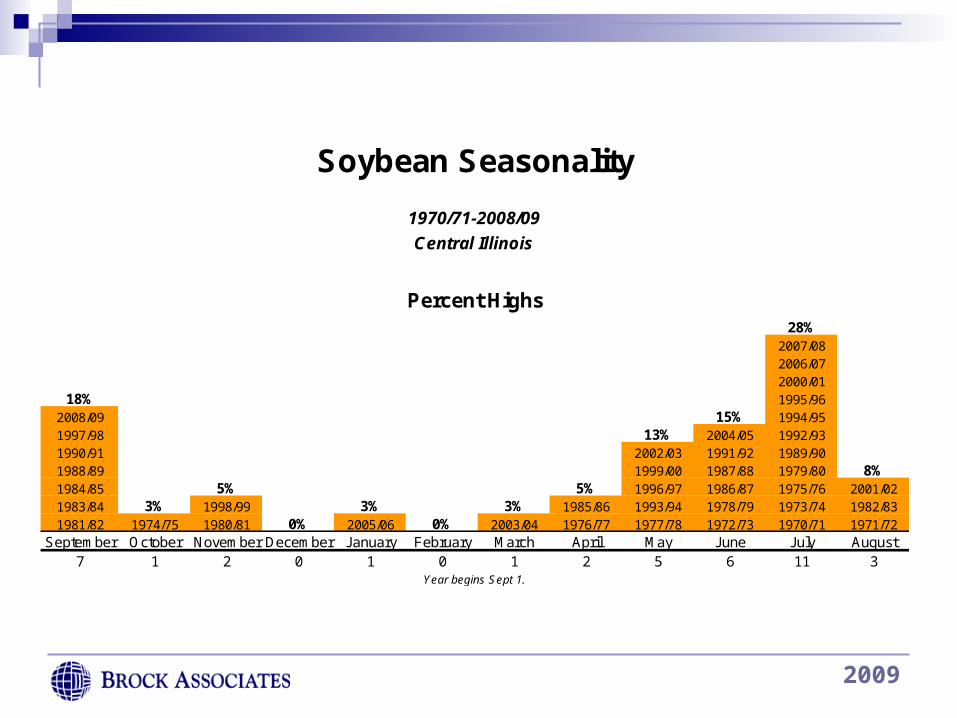
28%2007/082006/072000/01
18% 1995/962008/09 15% 1994/951997/98 13% 2004/05 1992/931990/91 2002/03 1991/92 1989/901988/89 1999/00 1987/88 1979/80 8%1984/85 5% 5% 1996/97 1986/87 1975/76 2001/021983/84 3% 1998/99 3% 3% 1985/86 1993/94 1978/79 1973/74 1982/831981/82 1974/75 1980/81 0% 2005/06 0% 2003/04 1976/77 1977/78 1972/73 1970/71 1971/72
September October November December January February March April May June July August7 1 2 0 1 0 1 2 5 6 11 3
Soybean Seasonality
1970/71-2008/09
Central Illinois
Percent Highs
Year begins Sept 1.
2009
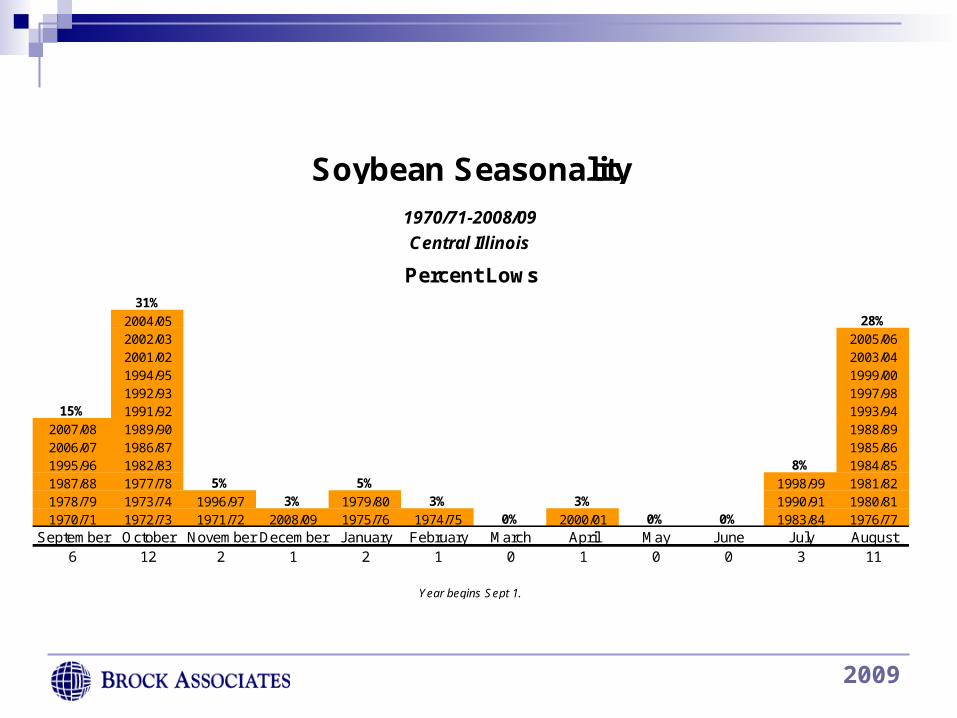
31%
2004/05 28%
2002/03 2005/062001/02 2003/041994/95 1999/001992/93 1997/98
15% 1991/92 1993/942007/08 1989/90 1988/892006/07 1986/87 1985/861995/96 1982/83 8% 1984/851987/88 1977/78 5% 5% 1998/99 1981/821978/79 1973/74 1996/97 3% 1979/80 3% 3% 1990/91 1980/811970/71 1972/73 1971/72 2008/09 1975/76 1974/75 0% 2000/01 0% 0% 1983/84 1976/77
September October November December January February March April May June July August6 12 2 1 2 1 0 1 0 0 3 11
Percent Lows
Year begins Sept 1.
Soybean Seasonality
1970/71-2008/09
Central Illinois
2009
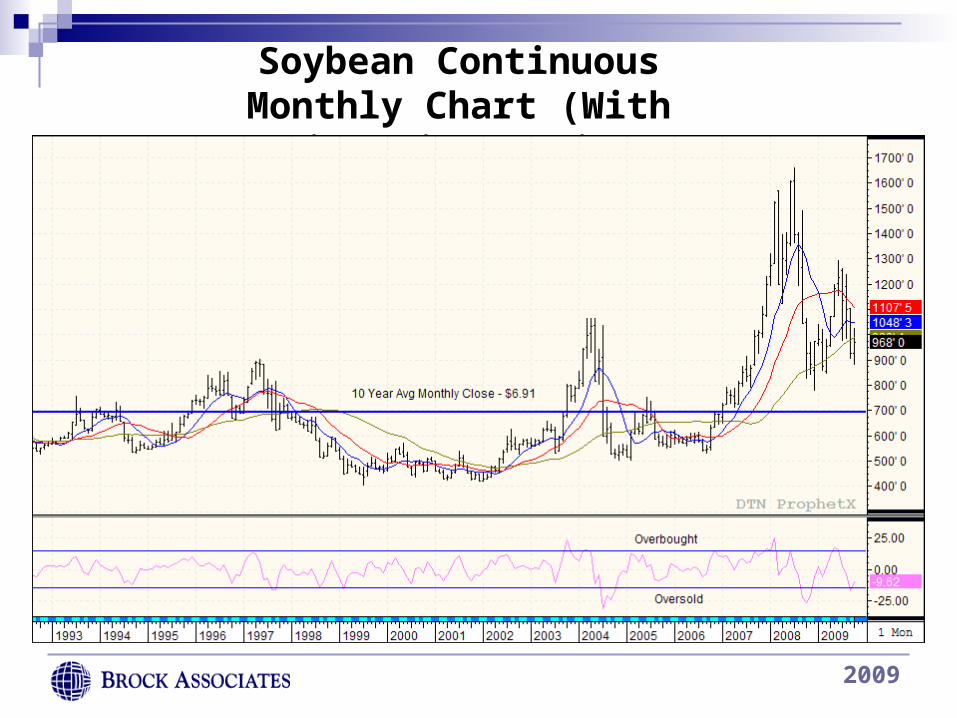
Soybean Continuous Monthly Chart (With Disparity Ratio)

2009
November 2009 Soybean Futures
2009
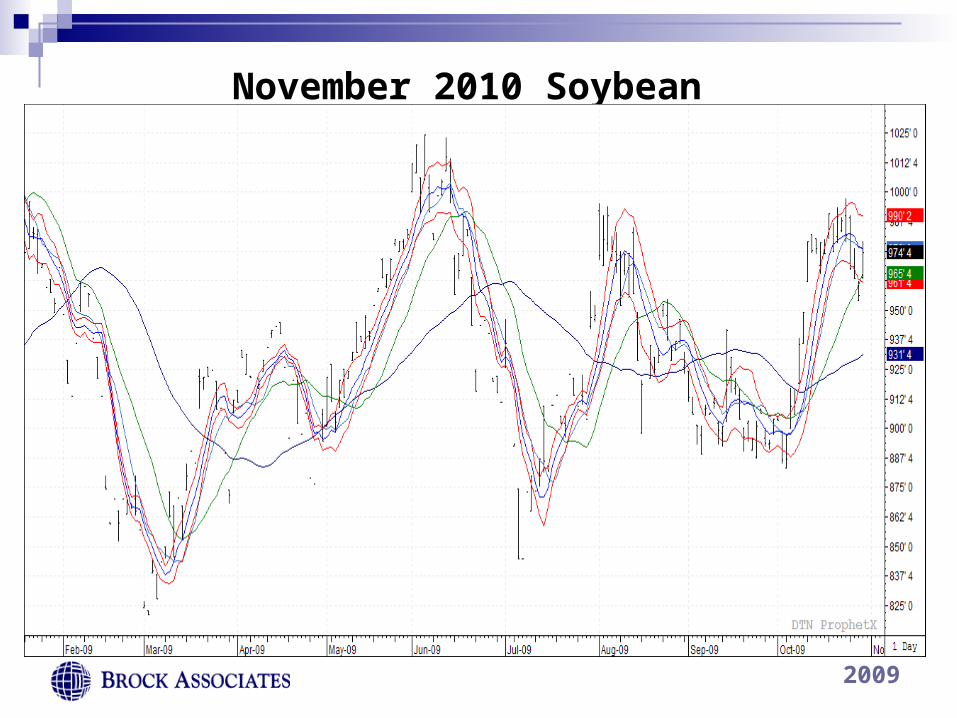
November 2010 Soybean Futures

2009
08/09 Est 09/10 Est 09/10 10/11 11/12 12/13ACREAGE (Mil. Acres)Planted Area 63.2 59.1 59.1 58.5 57.5 56.5Harvested Area 55.7 50.1 50.1 49.7 48.9 48.0Yield 44.9 44.4 44.4 43.1 43.4 44.0SUPPLY (Mil. Bushels)Beg. Stocks (Sep 1) 306 657 657 839 900 905Production 2,499 2,220 2,220 2,142 2,122 2,112Imports 127 110 110 100 100 75
Total Supply 2,932 2,987 2,987 3,081 3,123 3,092USAGE (Mil. Bushels)Food 925 955 955 968 977 977Seed 75 78 78 78 76 76Feed & Residual 260 190 200 210 215 215
Domestic Use 1,260 1,223 1,233 1,256 1,268 1,268Exports 1,015 900 915 925 950 950
Total Use 2,275 2,123 2,148 2,181 2,218 2,218STOCKS (Mil. Bushels)Ending Stocks (Aug 31) 657 864 839 900 905 874
CCC 0 0 0 0 0 0Privately Owned 657 864 839 900 905 874
Stocks/Use 28.9% 40.7% 39.1% 41.3% 40.8% 39.4%Farm Price ($/Bu) $6.78 $4.55-$5.15 $4.60-5.20 $4.75-5.50 $4.75-5.25 $5.00-5.75
US WHEAT SUPPLY AND DEMANDBrock Est.USDA
2009
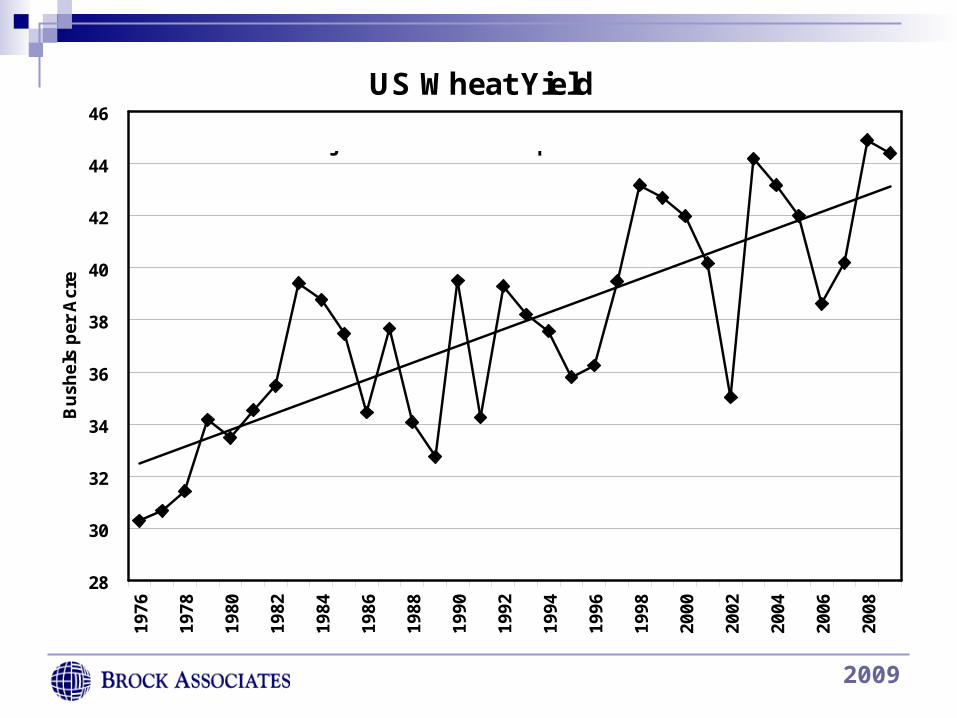
US Wheat Yield
28
30
32
34
36
38
40
42
44
46
1976
1978
1980
1982
1984
1986
1988
1990
1992
1994
1996
1998
2000
2002
2004
2006
2008
Bu
shel
s p
er A
cre
Brock 2009/10 Projection: 44.4 Bushels per Acre
2009
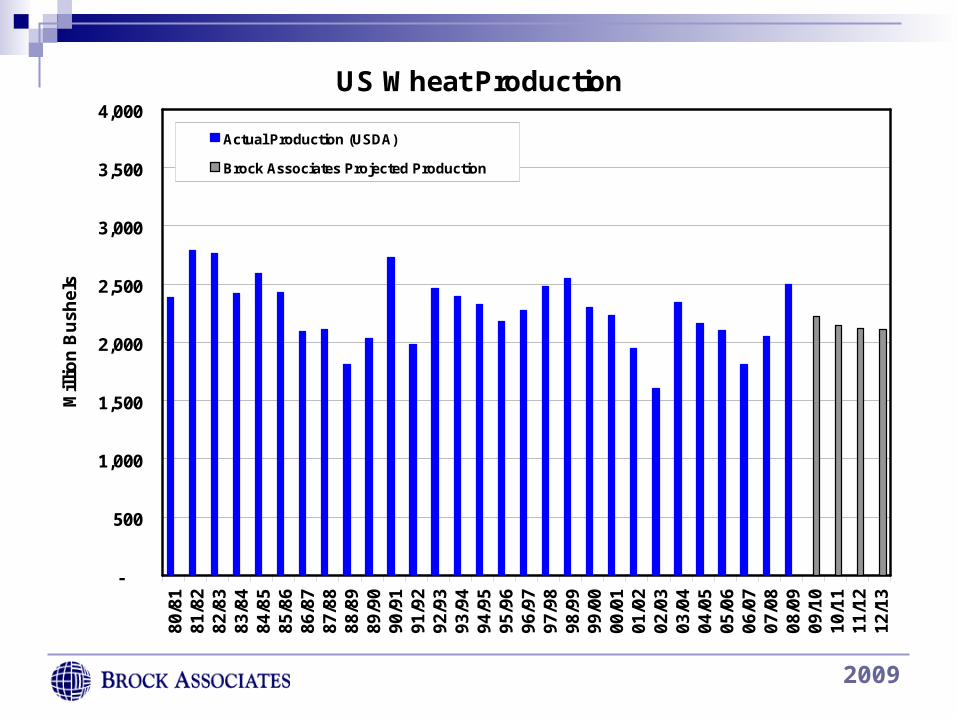
US Wheat Production
-
500
1,000
1,500
2,000
2,500
3,000
3,500
4,000
80/8
181
/82
82/8
383
/84
84/8
585
/86
86/8
787
/88
88/8
989
/90
90/9
191
/92
92/9
393
/94
94/9
595
/96
96/9
797
/98
98/9
999
/00
00/0
101
/02
02/0
303
/04
04/0
505
/06
06/0
707
/08
08/0
909
/10
10/1
111
/12
12/1
3
Mil
lio
n B
ush
els
Actual Production (USDA)
Brock Associates Projected Production
Brock 2009/10 Projection: 2,220 Million Bushels
2009
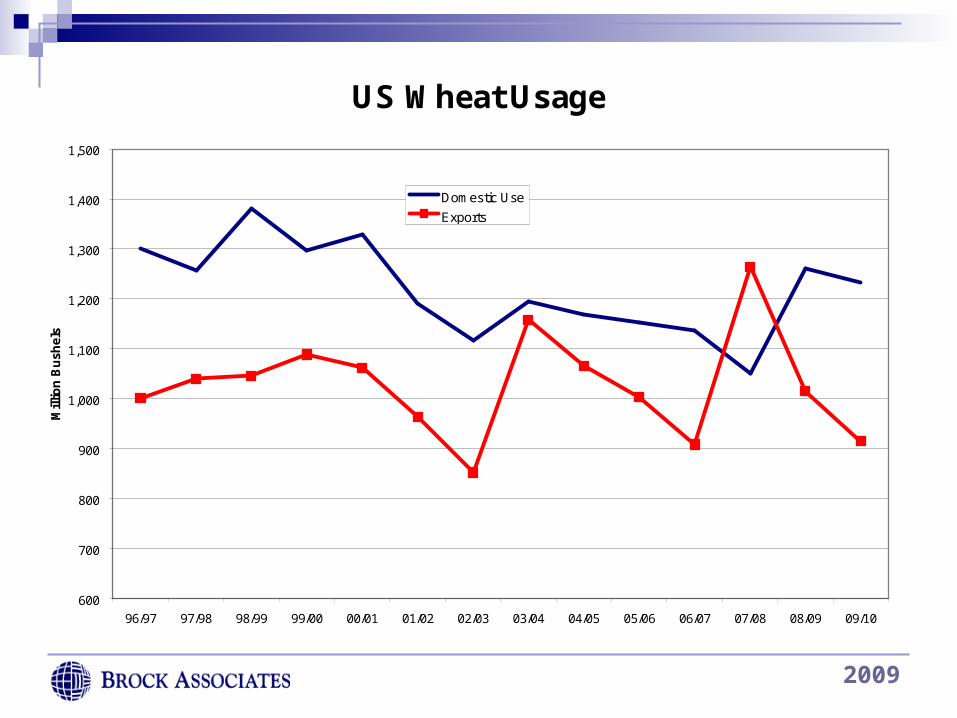
US Wheat Usage
600
700
800
900
1,000
1,100
1,200
1,300
1,400
1,500
96/97 97/98 98/99 99/00 00/01 01/02 02/03 03/04 04/05 05/06 06/07 07/08 08/09 09/10
Mill
ion
Bu
shel
s
Domestic Use
Exports
Source: USDA, Brock Estimates
2009
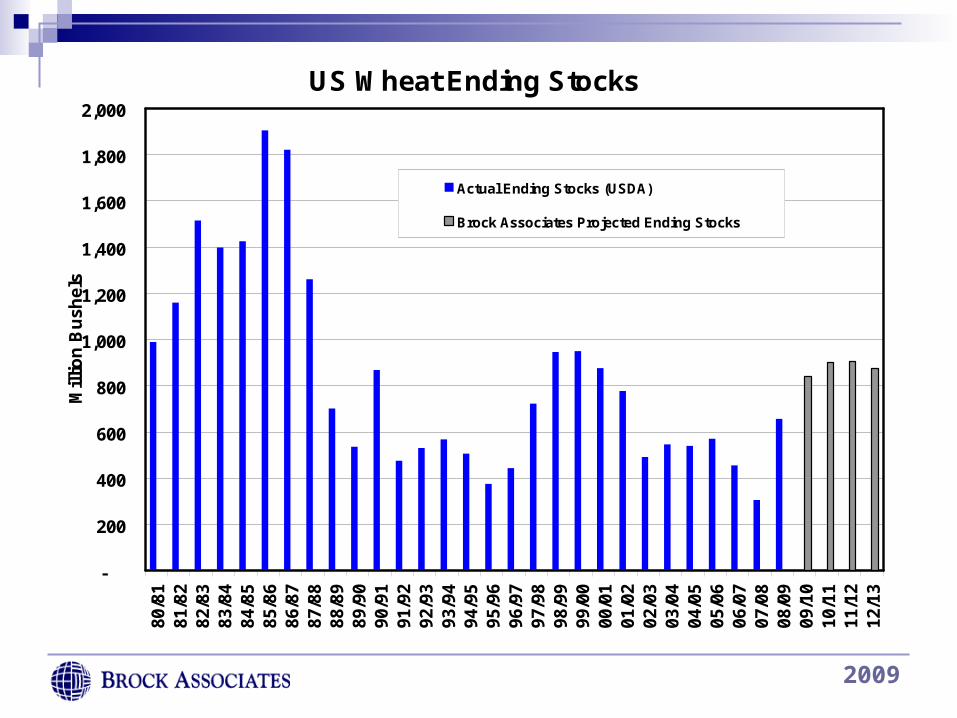
US Wheat Ending Stocks
-
200
400
600
800
1,000
1,200
1,400
1,600
1,800
2,000
80/8
181
/82
82/8
383
/84
84/8
585
/86
86/8
787
/88
88/8
989
/90
90/9
191
/92
92/9
393
/94
94/9
595
/96
96/9
797
/98
98/9
999
/00
00/0
101
/02
02/0
303
/04
04/0
505
/06
06/0
707
/08
08/0
909
/10
10/1
111
/12
12/1
3
Mil
lio
n B
ush
els
Actual Ending Stocks (USDA)
Brock Associates Projected Ending Stocks
Brock 2009/10 Projection: 839 Million Bushels
2009
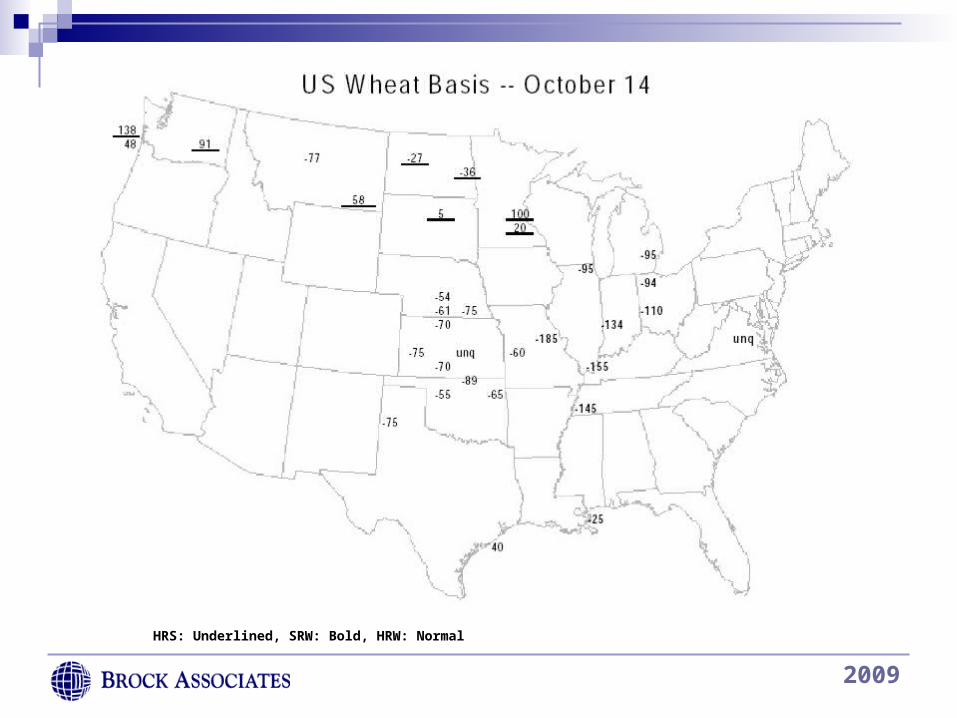
HRS: Underlined, SRW: Bold, HRW: Normal

2009
YearBeginning
Stocks Production ConsumptionEnding Stocks
Stocks/Use Ratio
1995/96 163 537 545 156 28.6%1996/97 156 581 573 163 28.5%1997/98 163 610 577 196 34.0%1998/99 196 590 579 208 35.9%1999/00 208 587 585 210 35.8%2000/01 210 583 585 207 35.4%2001/02 207 583 587 203 34.6%2002/03 203 568 604 167 27.6%2003/04 167 554 589 132 22.4%2004/05 132 626 607 150 24.7%2005/06 150 620 623 147 23.7%2006/07 147 596 615 128 20.7%2007/08 128 611 616 122 19.8%2008/09 122 682 638 167 26.2%2009/10 167 668 648 187 28.8%Bold Figures are USDA Projections.
World Wheat Supply and DemandMillion Metric Tonnes
2009
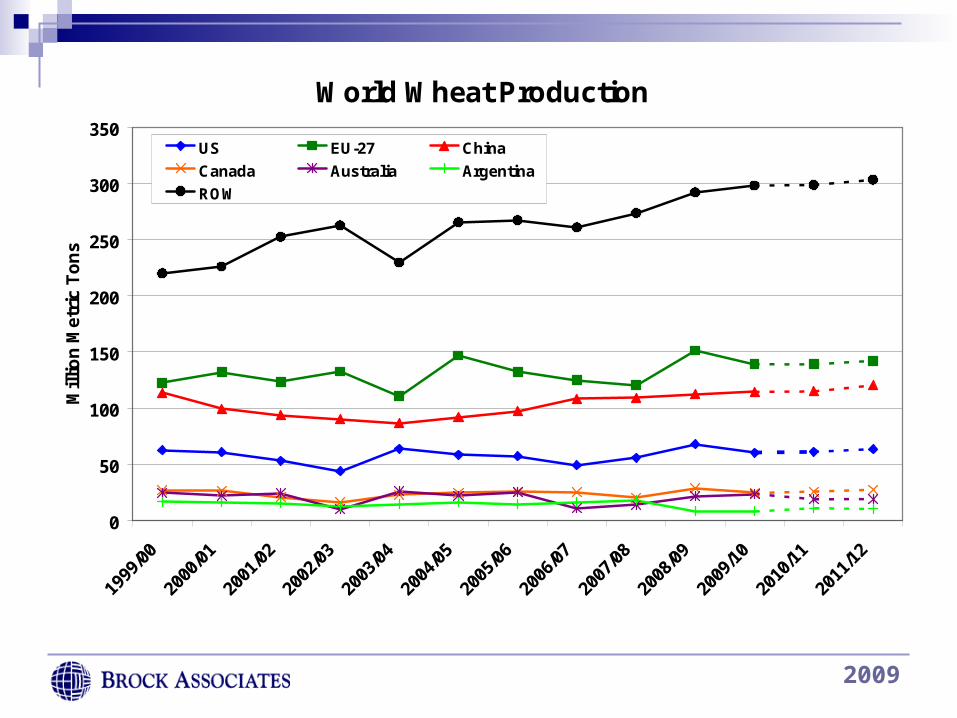
World Wheat Production
0
50
100
150
200
250
300
350
Mill
ion
Met
ric
To
ns
US EU-27 China
Canada Australia Argentina
ROW
Source: USDA, Dotted Lines are Brock Projections
2009
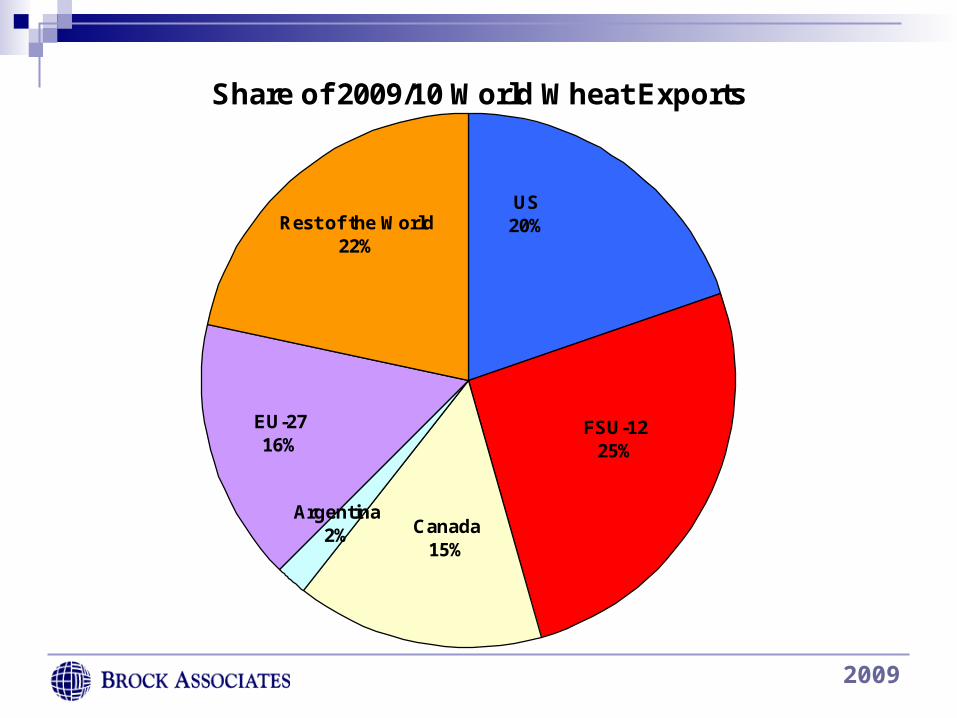
Share of 2009/10 World Wheat Exports
Rest of the World22%
US20%
FSU-1225%
Canada15%
Argentina2%
EU-2716%
2009
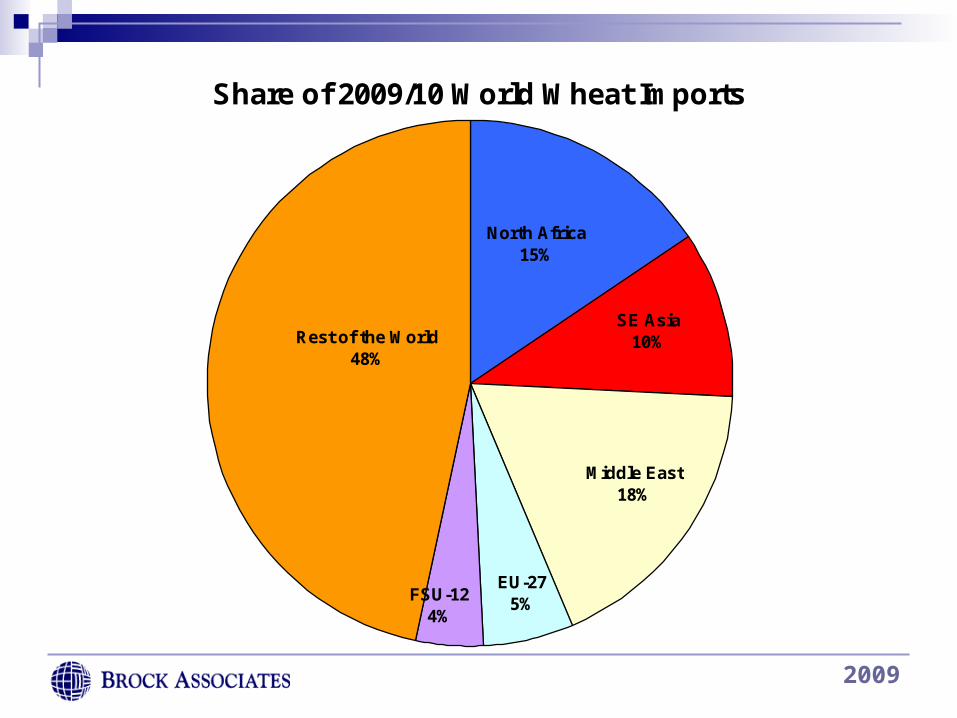
Share of 2009/10 World Wheat Imports
FSU-124%
EU-275%
Middle East18%
SE Asia10%
North Africa15%
Rest of the World48%
2009
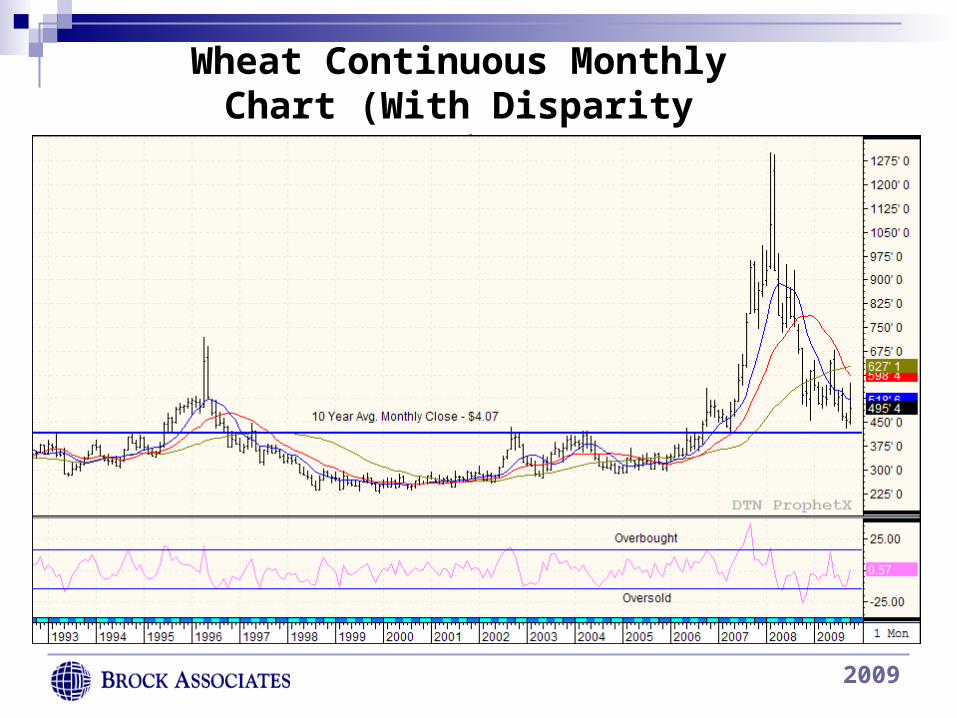
Wheat Continuous Monthly Chart (With Disparity Ratio)
2009
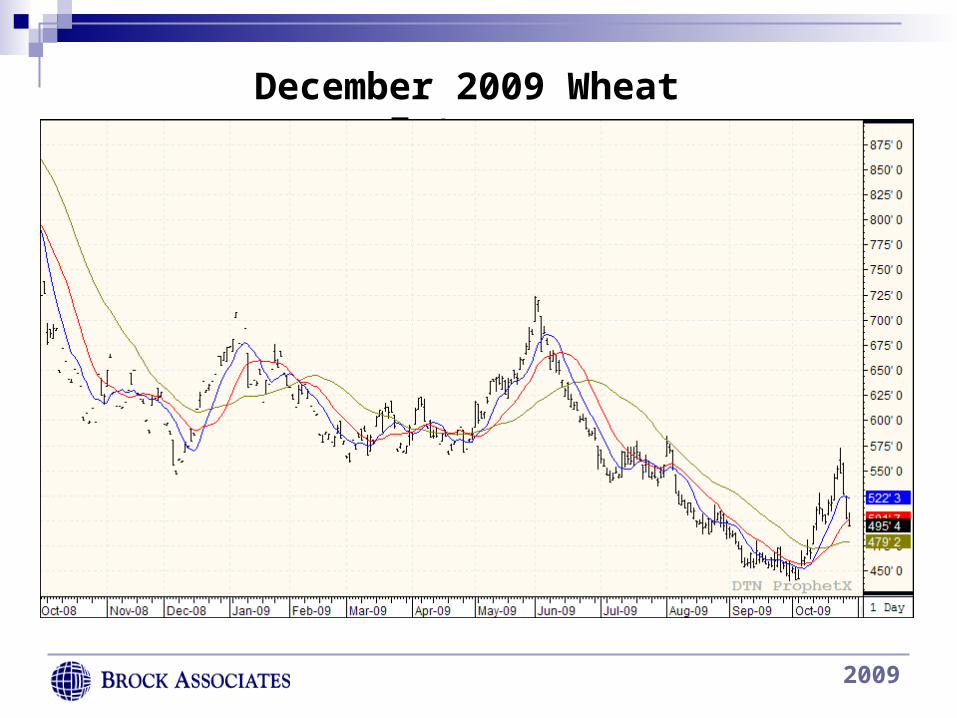
December 2009 Wheat Futures

2009

2009
US Meat Production
0
5,000
10,000
15,000
20,000
25,000
30,000
35,000
40,000
1980
1981
1982
1983
1984
1985
1986
1987
1988
1989
1990
1991
1992
1993
1994
1995
1996
1997
1998
1999
2000
2001
2002
2003
2004
2005
2006
2007
2008
2009
Mill
ion
Po
un
ds
Beef
Pork
Broilers
Turkeys
2009
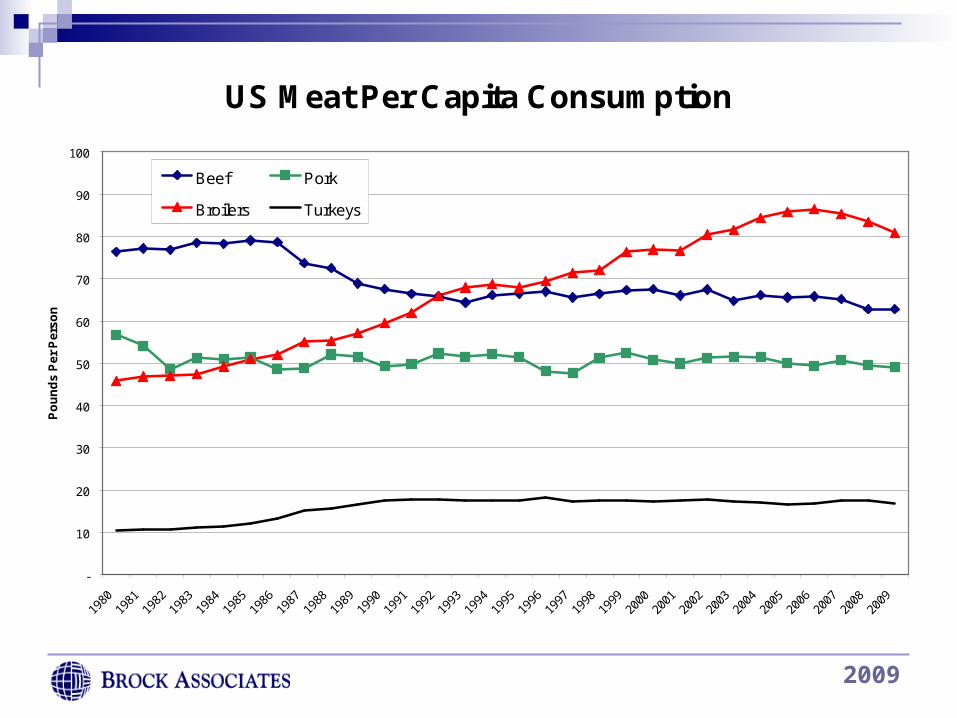
US Meat Per Capita Consumption
-
10
20
30
40
50
60
70
80
90
100
1980
1981
1982
1983
1984
1985
1986
1987
1988
1989
1990
1991
1992
1993
1994
1995
1996
1997
1998
1999
2000
2001
2002
2003
2004
2005
2006
2007
2008
2009
Po
un
ds
Pe
r P
ers
on
Beef Pork
Broilers Turkeys
Source: USDA
2009
Year & Qtr Beef Pork Red Meat Broiler Turkey
Total Poultry
Red Meat & Poultry Egg Milk
Mil Doz Bil lbs
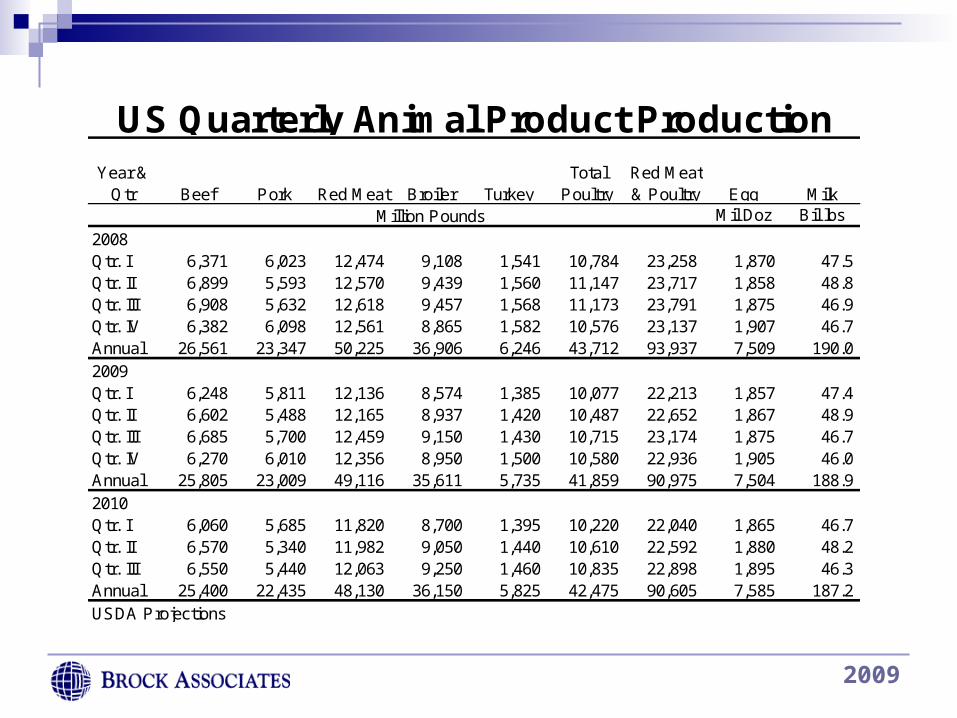
2008Qtr. I 6,371 6,023 12,474 9,108 1,541 10,784 23,258 1,870 47.5 Qtr. II 6,899 5,593 12,570 9,439 1,560 11,147 23,717 1,858 48.8 Qtr. III 6,908 5,632 12,618 9,457 1,568 11,173 23,791 1,875 46.9 Qtr. IV 6,382 6,098 12,561 8,865 1,582 10,576 23,137 1,907 46.7 Annual 26,561 23,347 50,225 36,906 6,246 43,712 93,937 7,509 190.0 2009Qtr. I 6,248 5,811 12,136 8,574 1,385 10,077 22,213 1,857 47.4 Qtr. II 6,602 5,488 12,165 8,937 1,420 10,487 22,652 1,867 48.9 Qtr. III 6,685 5,700 12,459 9,150 1,430 10,715 23,174 1,875 46.7 Qtr. IV 6,270 6,010 12,356 8,950 1,500 10,580 22,936 1,905 46.0 Annual 25,805 23,009 49,116 35,611 5,735 41,859 90,975 7,504 188.9 2010Qtr. I 6,060 5,685 11,820 8,700 1,395 10,220 22,040 1,865 46.7 Qtr. II 6,570 5,340 11,982 9,050 1,440 10,610 22,592 1,880 48.2 Qtr. III 6,550 5,440 12,063 9,250 1,460 10,835 22,898 1,895 46.3 Annual 25,400 22,435 48,130 36,150 5,825 42,475 90,605 7,585 187.2 USDA Projections
US Quarterly Animal Product Production
Million Pounds
2009
Year & Qtr
Choice Steers (Neb. Direct,
1100-1300 lb)
Barrows and Gilts (National Base, Live Eq. 51-52% Lean)
Broilers (Wholesale, 12-
City Avg.)Turkeys (8-16 lbs, hens East)
Eggs (Large, Grade A, New
York)
Milk (Prices Received by
Farmers)
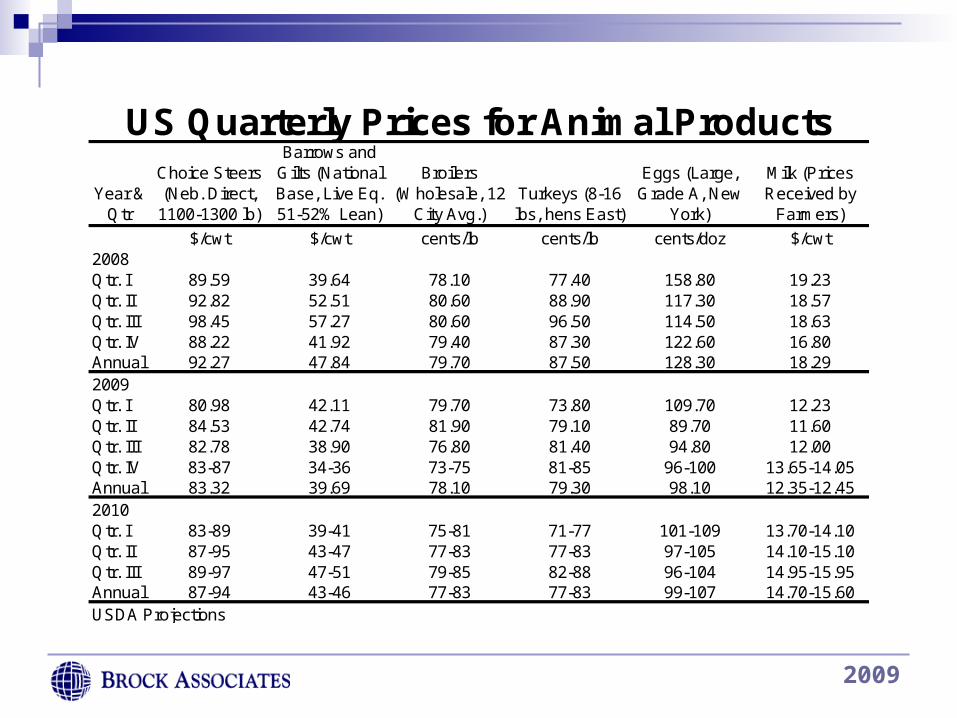
$/cwt $/cwt cents/lb cents/lb cents/doz $/cwt2008Qtr. I 89.59 39.64 78.10 77.40 158.80 19.23Qtr. II 92.82 52.51 80.60 88.90 117.30 18.57Qtr. III 98.45 57.27 80.60 96.50 114.50 18.63Qtr. IV 88.22 41.92 79.40 87.30 122.60 16.80Annual 92.27 47.84 79.70 87.50 128.30 18.292009Qtr. I 80.98 42.11 79.70 73.80 109.70 12.23Qtr. II 84.53 42.74 81.90 79.10 89.70 11.60Qtr. III 82.78 38.90 76.80 81.40 94.80 12.00Qtr. IV 83-87 34-36 73-75 81-85 96-100 13.65-14.05Annual 83.32 39.69 78.10 79.30 98.10 12.35-12.452010Qtr. I 83-89 39-41 75-81 71-77 101-109 13.70-14.10Qtr. II 87-95 43-47 77-83 77-83 97-105 14.10-15.10Qtr. III 89-97 47-51 79-85 82-88 96-104 14.95-15.95Annual 87-94 43-46 77-83 77-83 99-107 14.70-15.60USDA Projections
US Quarterly Prices for Animal Products
2009
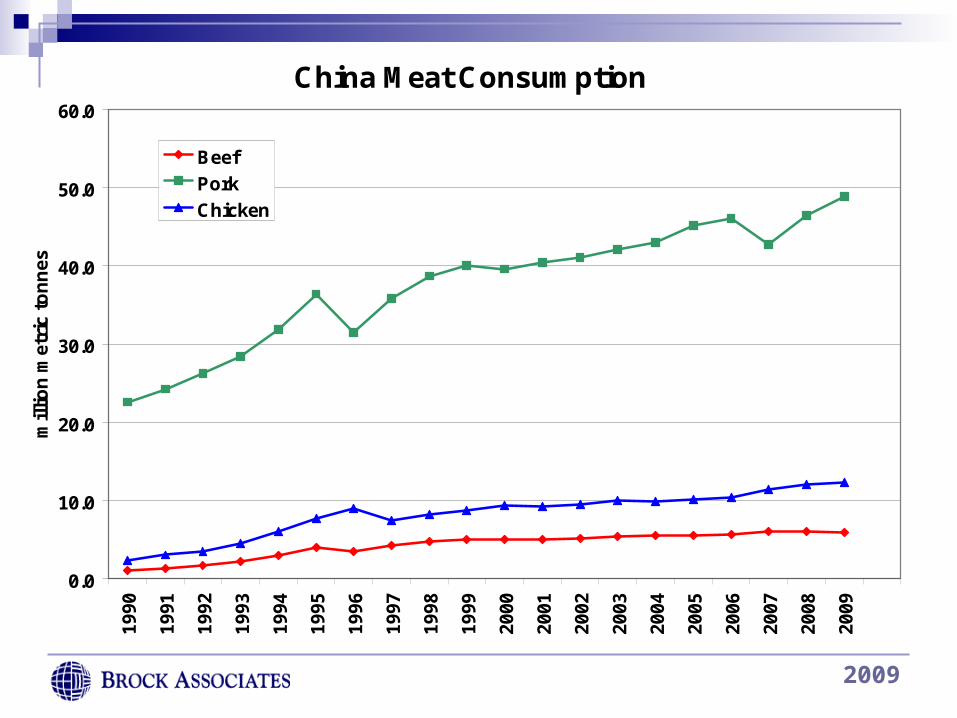
China Meat Consumption
0.0
10.0
20.0
30.0
40.0
50.0
60.019
90
1991
1992
1993
1994
1995
1996
1997
1998
1999
2000
2001
2002
2003
2004
2005
2006
2007
2008
2009
mil
lio
n m
etri
c to
nn
es
Beef
Pork
Chicken
2009
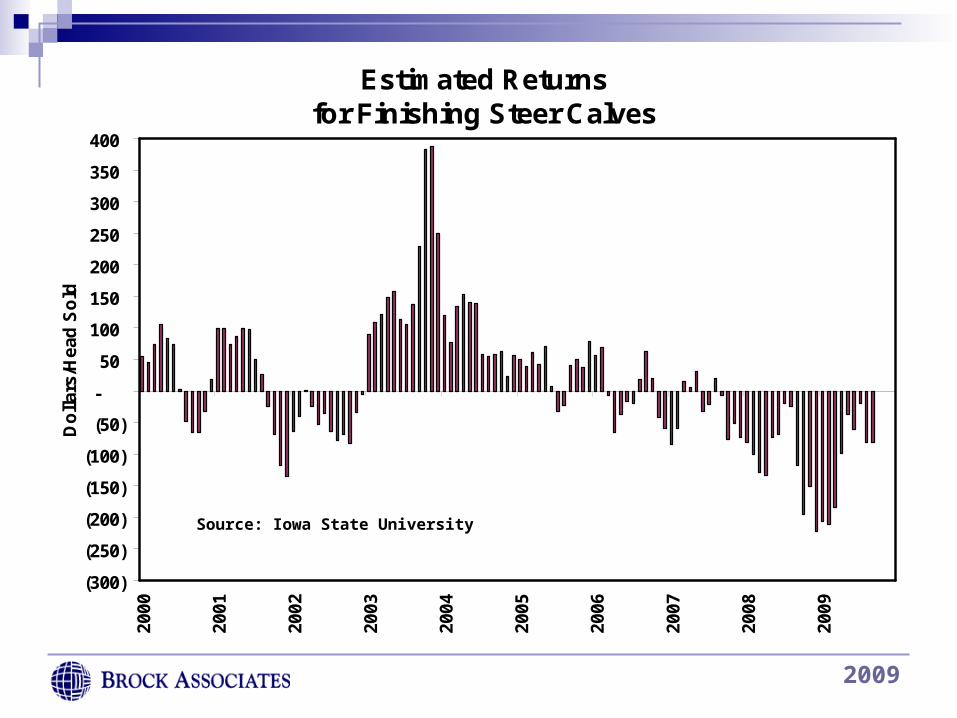
Estimated Returnsfor Finishing Steer Calves
(300)
(250)
(200)
(150)
(100)
(50)
-
50
100
150
200
250
300
350
40020
00
2001
2002
2003
2004
2005
2006
2007
2008
2009
Do
llar
s/H
ead
So
ld
Source: Iowa State University
2009
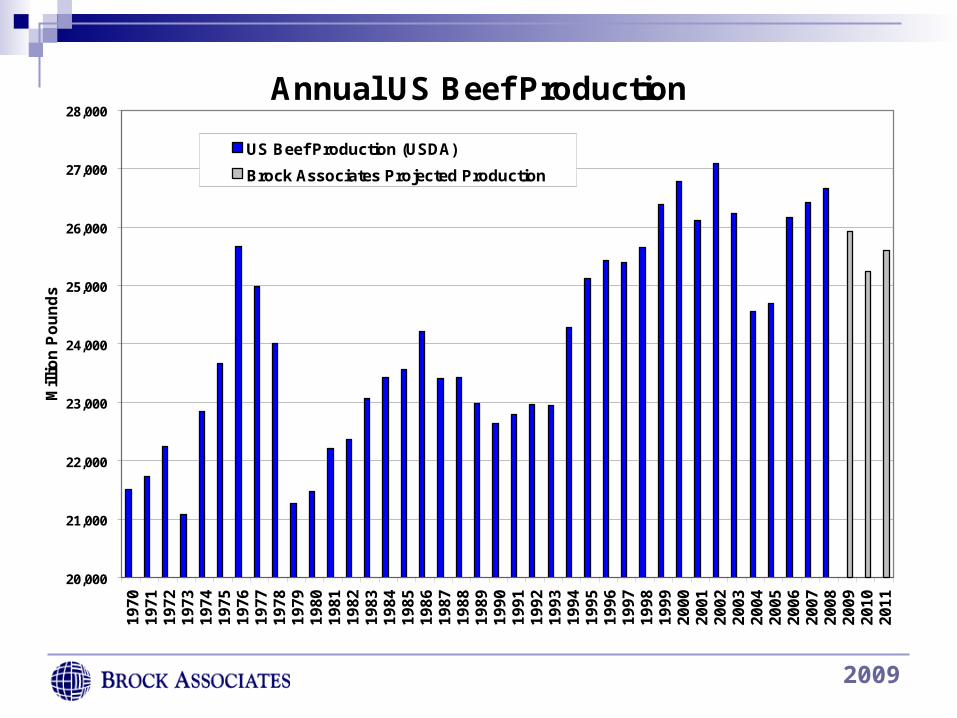
Annual US Beef Production
20,000
21,000
22,000
23,000
24,000
25,000
26,000
27,000
28,000
19
70
19
71
19
72
19
73
19
74
19
75
19
76
19
77
19
78
19
79
19
80
19
81
19
82
19
83
19
84
19
85
19
86
19
87
19
88
19
89
19
90
19
91
19
92
19
93
19
94
19
95
19
96
19
97
19
98
19
99
20
00
20
01
20
02
20
03
20
04
20
05
20
06
20
07
20
08
20
09
20
10
20
11
Mil
lio
n P
ou
nd
s
US Beef Production (USDA)
Brock Associates Projected Production
2009
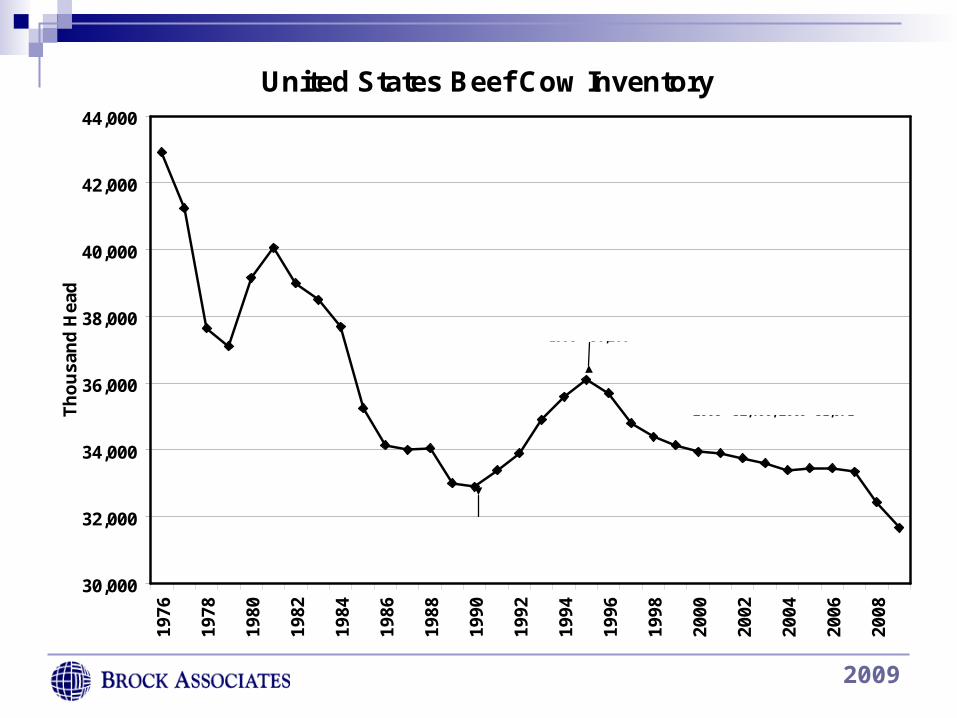
United States Beef Cow Inventory
30,000
32,000
34,000
36,000
38,000
40,000
42,000
44,000
1976
1978
1980
1982
1984
1986
1988
1990
1992
1994
1996
1998
2000
2002
2004
2006
2008
Th
ou
san
d H
ead
Key Statistics:
2004 - 33,400, 2005 - 33,450
2006 - 33,450, 2007 - 33,3502008 - 32,400, 2009- 31,671
1990 - 32,900
1995 - 36,100
2009
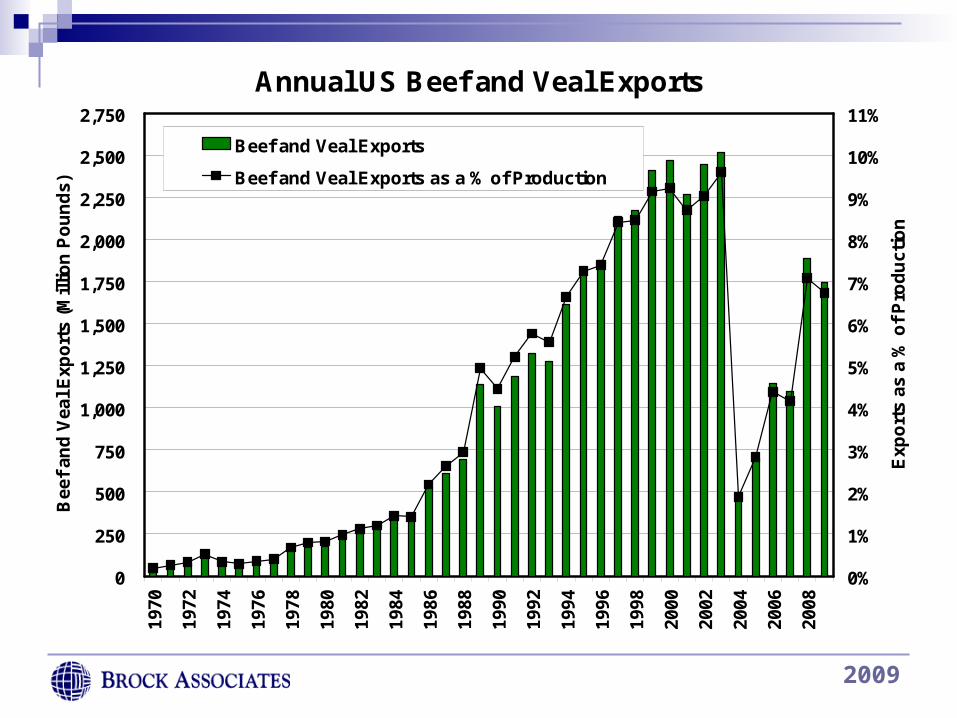
Annual US Beef and Veal Exports
0
250
500
750
1,000
1,250
1,500
1,750
2,000
2,250
2,500
2,750
1970
1972
1974
1976
1978
1980
1982
1984
1986
1988
1990
1992
1994
1996
1998
2000
2002
2004
2006
2008
Bee
f an
d V
eal
Exp
ort
s (M
illi
on
Po
un
ds)
0%
1%
2%
3%
4%
5%
6%
7%
8%
9%
10%
11%
Exp
ort
s as
a %
of
Pro
du
ctio
n
Beef and Veal Exports
Beef and Veal Exports as a % of Production

2009
Projected Finished Steer Profitability Based on Current Futures Prices
$0.00
$200.00
$400.00
$600.00
$800.00
$1,000.00
$1,200.00
$1,400.00
Oct 09 Nov 09 Dec 09 Jan 10 Feb 10 Mar 10 Apr 10 May 10
Co
st p
er S
teer
Gross Profit Before Fixed Costs Hay Costs Corn Costs w/Basis DDGS Cost Calf Purchase Fixed Costs
Net Profit is Gross Profit minus Fixed Cost -- Gross profit must exceed Fixed Cost line to realize a net profit
($30.58) ($43.05) ($45.42) ($47.04)($48.45) ($28.96) ($22.49) ($43.92)
Projected Net Profit (Loss) per head

2009
Live Cattle Continuous Monthly Chart (With Disparity Ratio)

2009
December 2009 Live Cattle Futures
2009
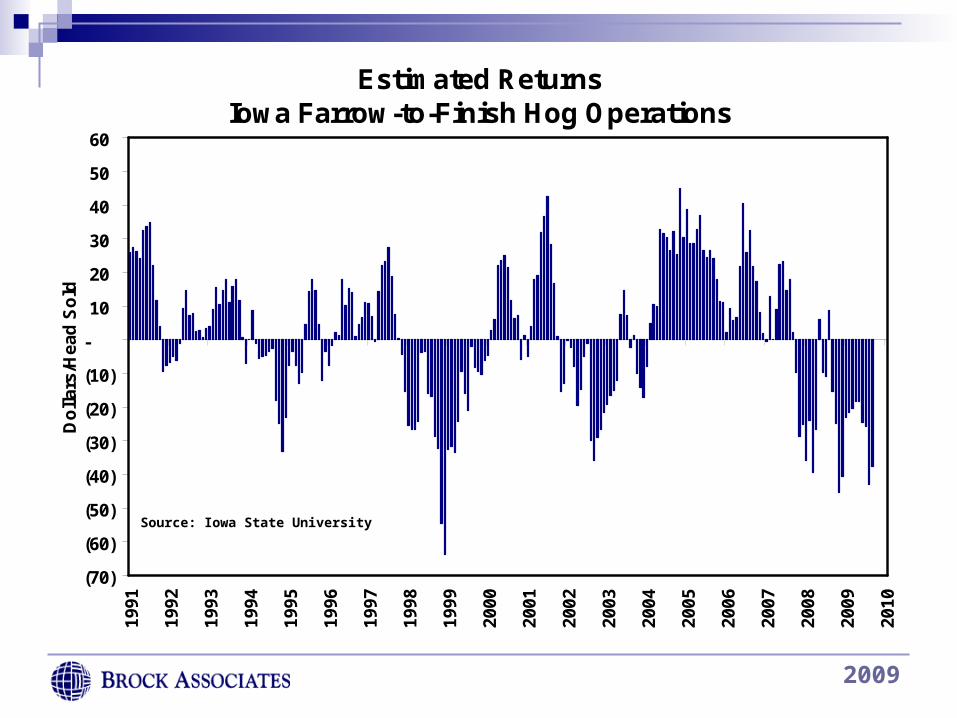
Estimated ReturnsIowa Farrow-to-Finish Hog Operations
(70)
(60)
(50)
(40)
(30)
(20)
(10)
-
10
20
30
40
50
6019
91
1992
1993
1994
1995
1996
1997
1998
1999
2000
2001
2002
2003
2004
2005
2006
2007
2008
2009
2010
Do
llar
s/H
ead
So
ld
Source: Iowa State University
2009
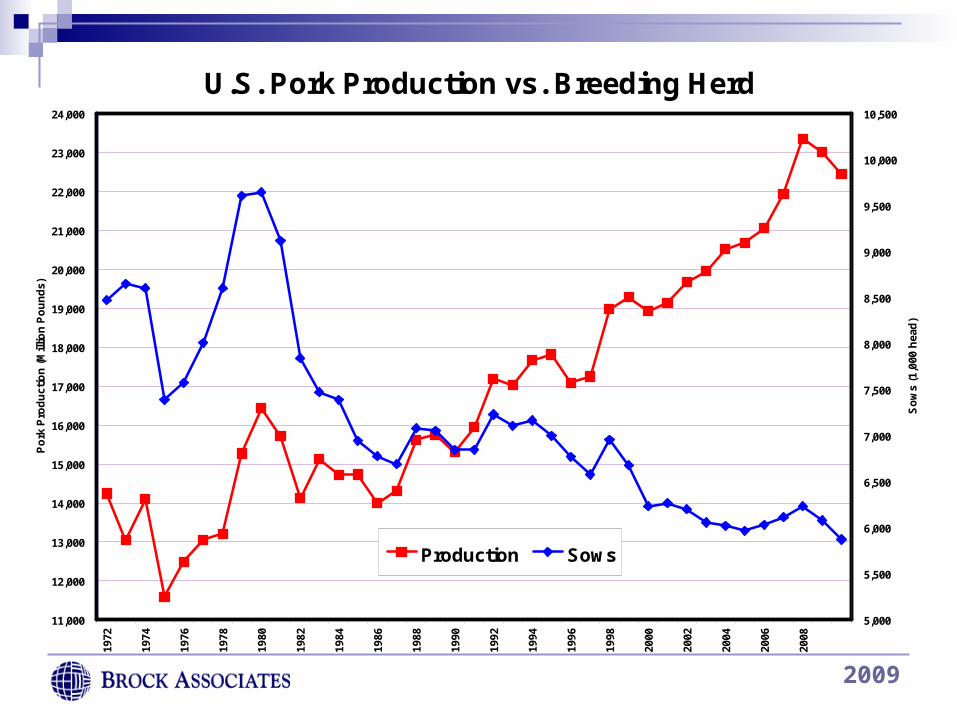
U.S. Pork Production vs. Breeding Herd
11,000
12,000
13,000
14,000
15,000
16,000
17,000
18,000
19,000
20,000
21,000
22,000
23,000
24,00019
72
1974
1976
1978
1980
1982
1984
1986
1988
1990
1992
1994
1996
1998
2000
2002
2004
2006
2008
Po
rk P
rod
uct
ion
(M
illio
n P
ou
nd
s)
5,000
5,500
6,000
6,500
7,000
7,500
8,000
8,500
9,000
9,500
10,000
10,500
So
ws
(1,0
00 h
ead
)
Production Sows
2009
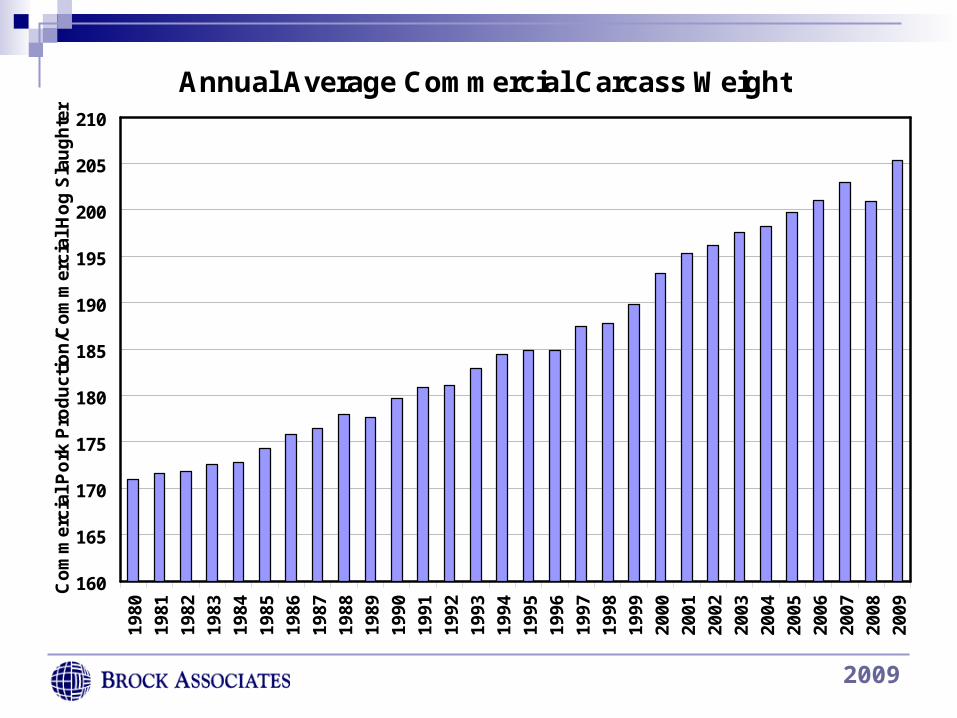
Annual Average Commercial Carcass Weight
160
165
170
175
180
185
190
195
200
205
21019
80
1981
1982
1983
1984
1985
1986
1987
1988
1989
1990
1991
1992
1993
1994
1995
1996
1997
1998
1999
2000
2001
2002
2003
2004
2005
2006
2007
2008
2009
Co
mm
erci
al P
ork
Pro
du
ctio
n/C
om
mer
cial
Ho
g S
lau
gh
ter
2009
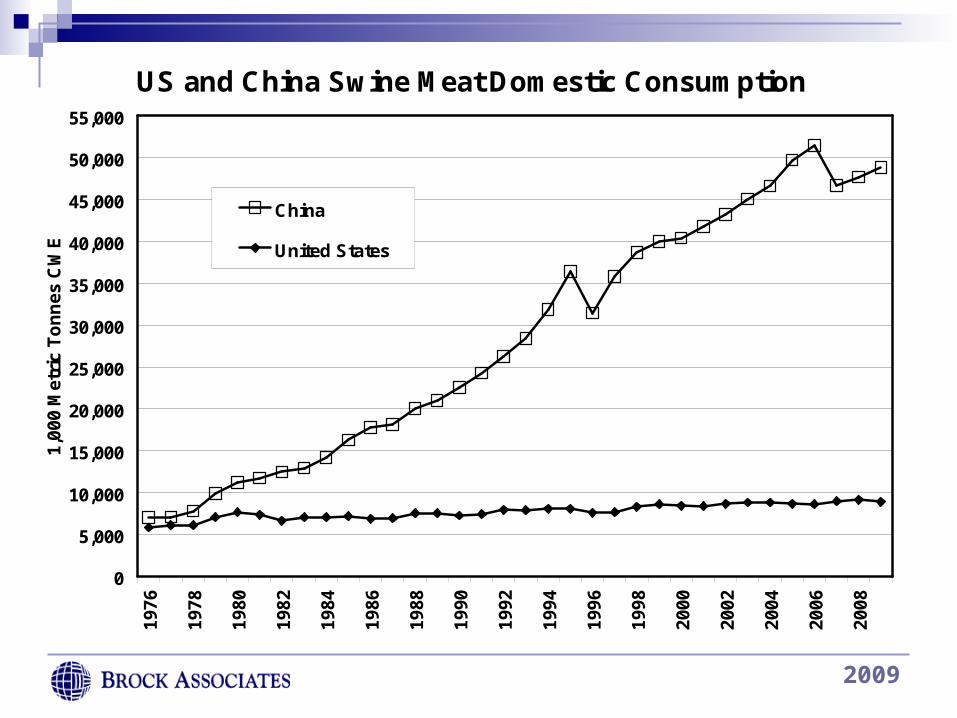
US and China Swine Meat Domestic Consumption
0
5,000
10,000
15,000
20,000
25,000
30,000
35,000
40,000
45,000
50,000
55,000
1976
1978
1980
1982
1984
1986
1988
1990
1992
1994
1996
1998
2000
2002
2004
2006
2008
1,00
0 M
etri
c T
on
nes
CW
E
China
United States
2009
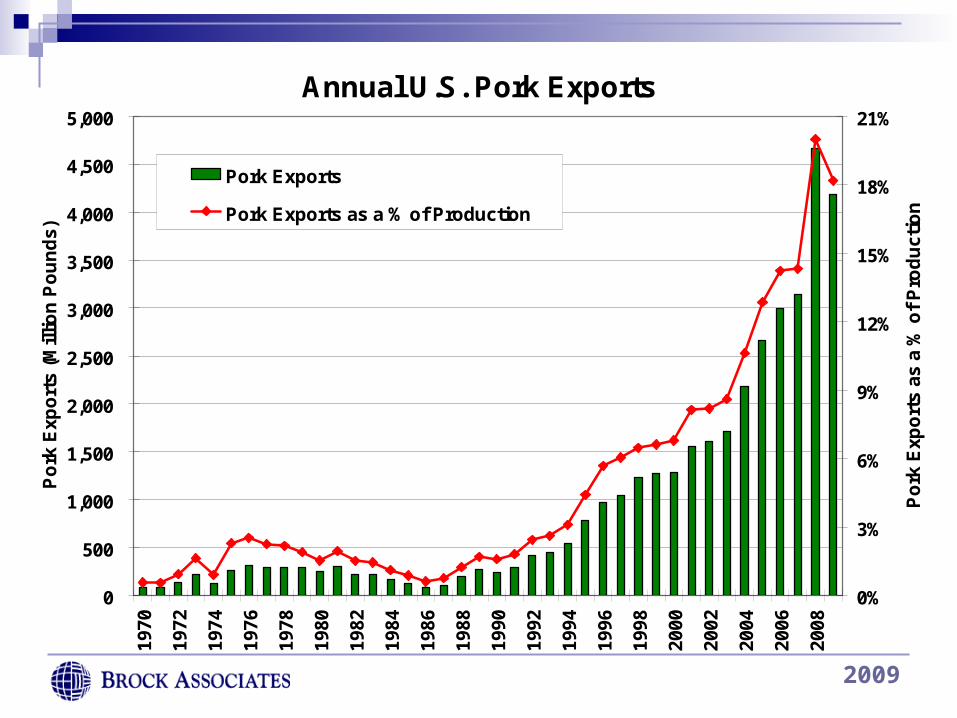
Annual U.S. Pork Exports
0
500
1,000
1,500
2,000
2,500
3,000
3,500
4,000
4,500
5,00019
70
1972
1974
1976
1978
1980
1982
1984
1986
1988
1990
1992
1994
1996
1998
2000
2002
2004
2006
2008
Po
rk E
xpo
rts
(Mil
lio
n P
ou
nd
s)
0%
3%
6%
9%
12%
15%
18%
21%
Po
rk E
xpo
rts
as a
% o
f P
rod
uct
ion
Pork Exports
Pork Exports as a % of Production

2009
Projected Hog Profitability Based on Current Futures Prices
$0.00
$20.00
$40.00
$60.00
$80.00
$100.00
$120.00
$140.00
$160.00
$180.00
Nov 09 Dec 09 Jan 10 Feb 10 Mar 10 Apr 10 May 10 Jun 10
Co
st p
er H
og
Gross Profit Before Fixed Costs Soybean Meal Costs w/Basis Corn Costs w/Basis DDGS Cost Fixed Costs
Net Profit is Gross Profit minus Fixed Cost -- Gross profit must exceed Fixed Cost line to realize a net profit
(270 pound live weight)
($26.13) ($26.13) ($13.66) ($4.05)($13.54) ($4.92) $12.71 $11.73
Projected Net Profit (Loss) per head
2009
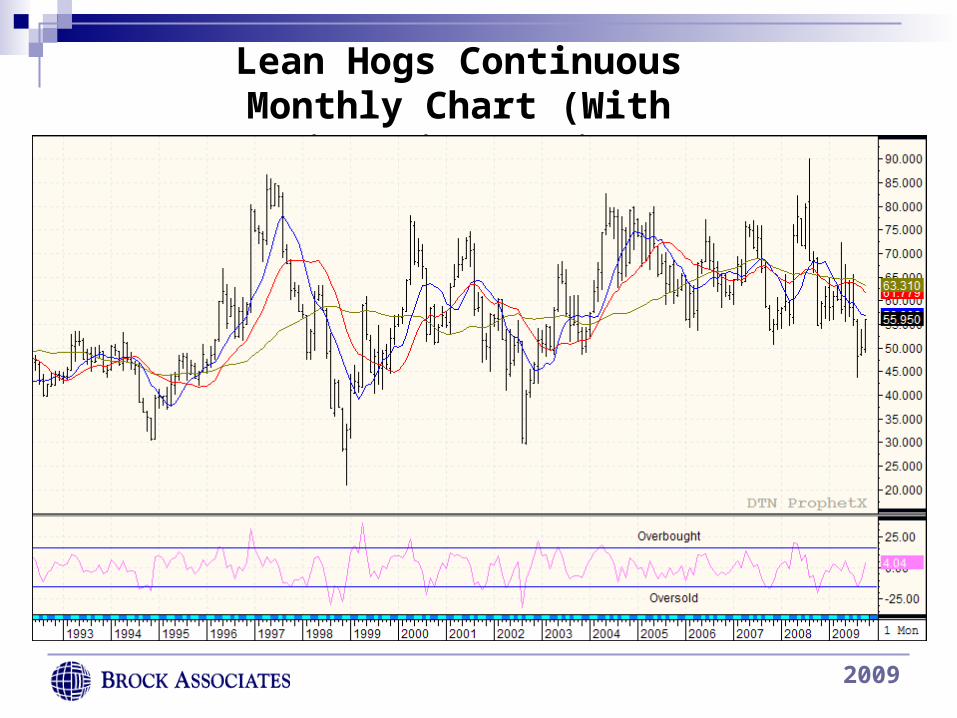
Lean Hogs Continuous Monthly Chart (With Disparity Ratio)
2009
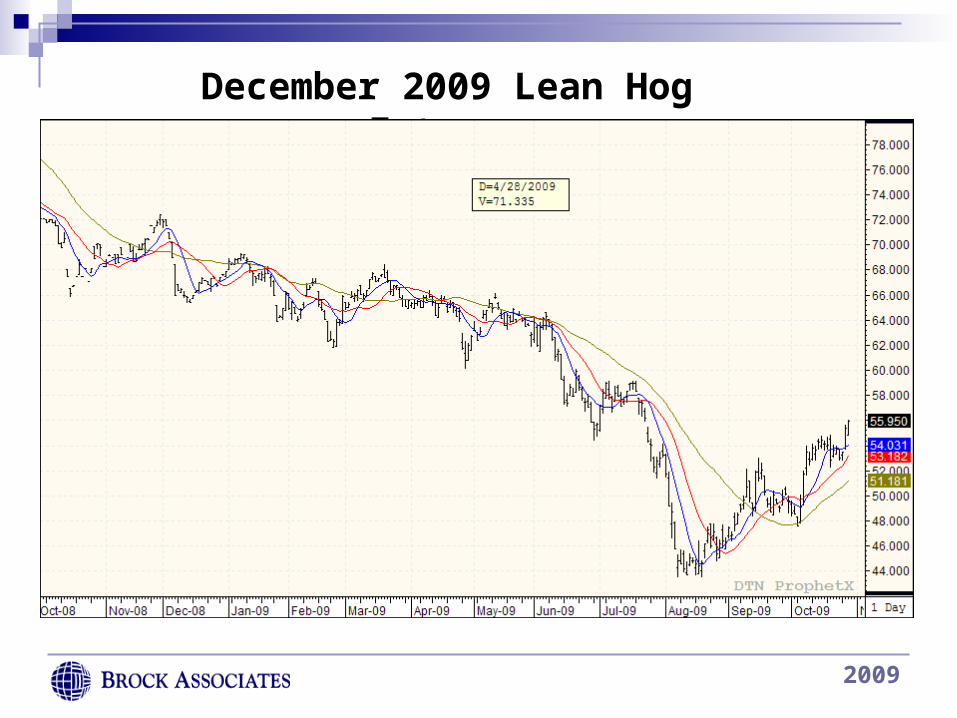
December 2009 Lean Hog Futures
2009
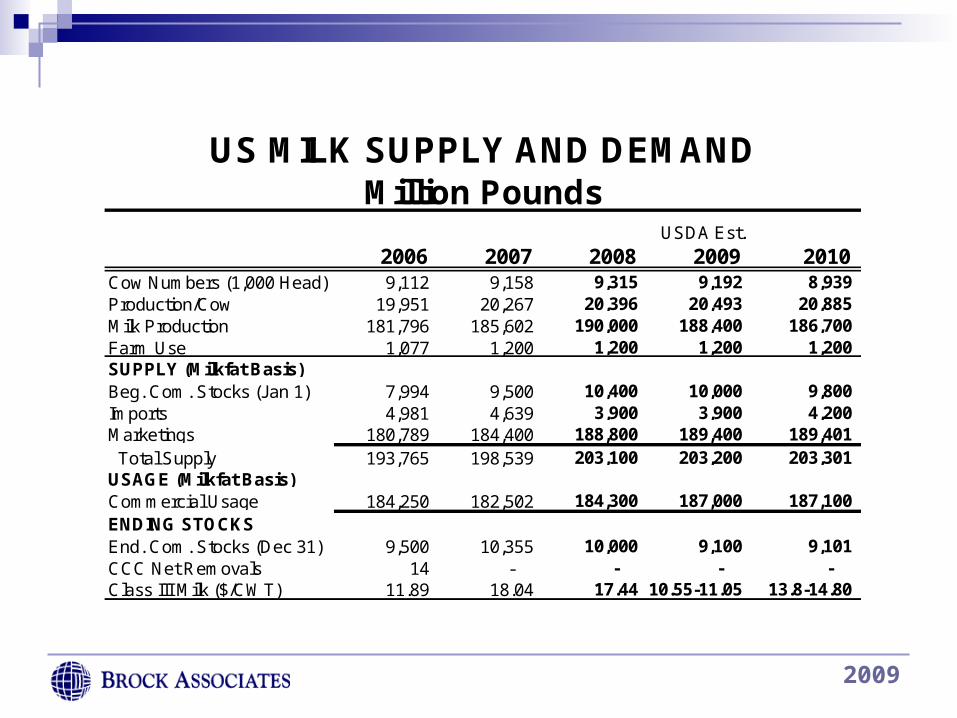
2006 2007 2008 2009 2010Cow Numbers (1,000 Head) 9,112 9,158 9,315 9,192 8,939 Production/Cow 19,951 20,267 20,396 20,493 20,885 Milk Production 181,796 185,602 190,000 188,400 186,700 Farm Use 1,077 1,200 1,200 1,200 1,200SUPPLY (Milkfat Basis)Beg. Com. Stocks (Jan 1) 7,994 9,500 10,400 10,000 9,800 Imports 4,981 4,639 3,900 3,900 4,200 Marketings 180,789 184,400 188,800 189,400 189,401 Total Supply 193,765 198,539 203,100 203,200 203,301 USAGE (Milkfat Basis)Commercial Usage 184,250 182,502 184,300 187,000 187,100 ENDING STOCKSEnd. Com. Stocks (Dec 31) 9,500 10,355 10,000 9,100 9,101 CCC Net Removals 14 - - - - Class III Milk ($/CWT) 11.89 18.04 17.44 10.55-11.05 13.8-14.80
USDA Est.
US MILK SUPPLY AND DEMANDMillion Pounds
2009
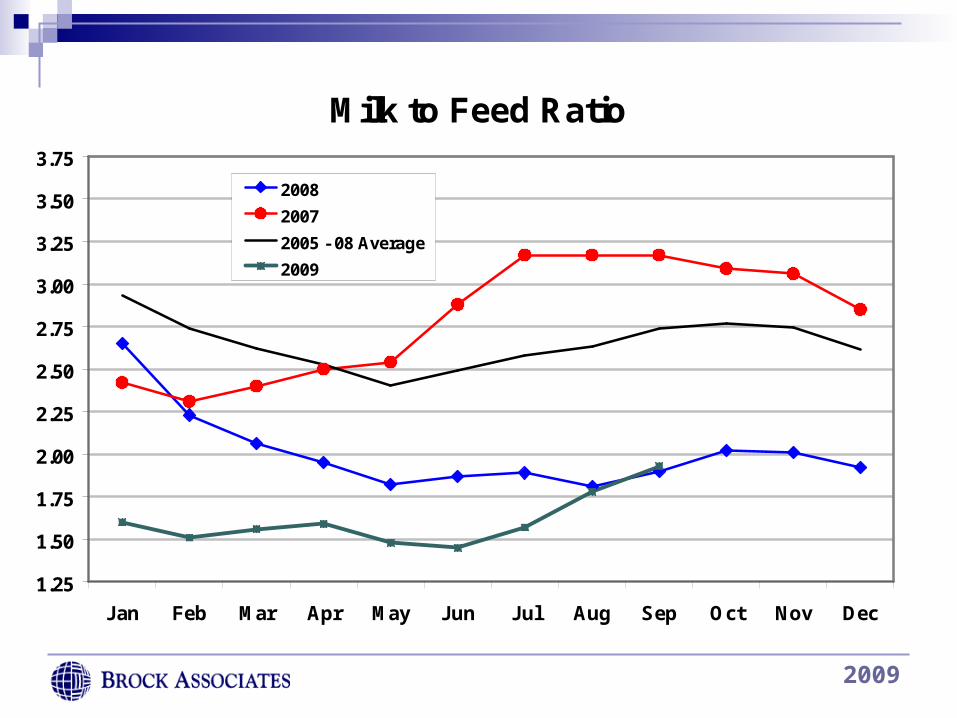
Milk to Feed Ratio
1.25
1.50
1.75
2.00
2.25
2.50
2.75
3.00
3.25
3.50
3.75
Jan Feb Mar Apr May Jun Jul Aug Sep Oct Nov Dec
2008
2007
2005 - 08 Average
2009
2009
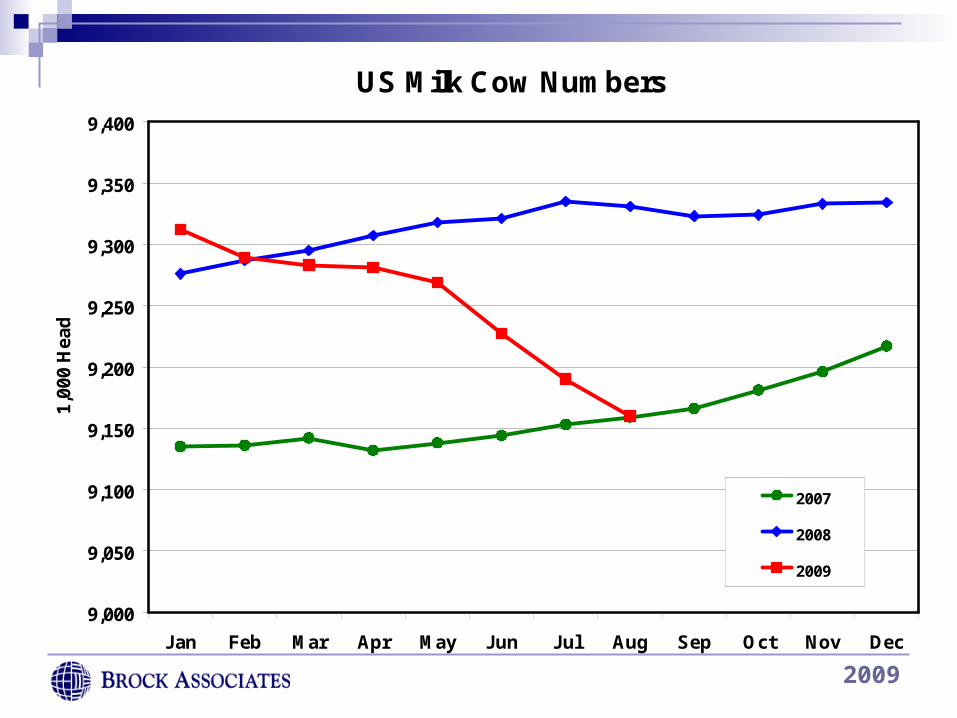
US Milk Cow Numbers
9,000
9,050
9,100
9,150
9,200
9,250
9,300
9,350
9,400
Jan Feb Mar Apr May Jun Jul Aug Sep Oct Nov Dec
1,00
0 H
ead
2007
2008
2009
2009
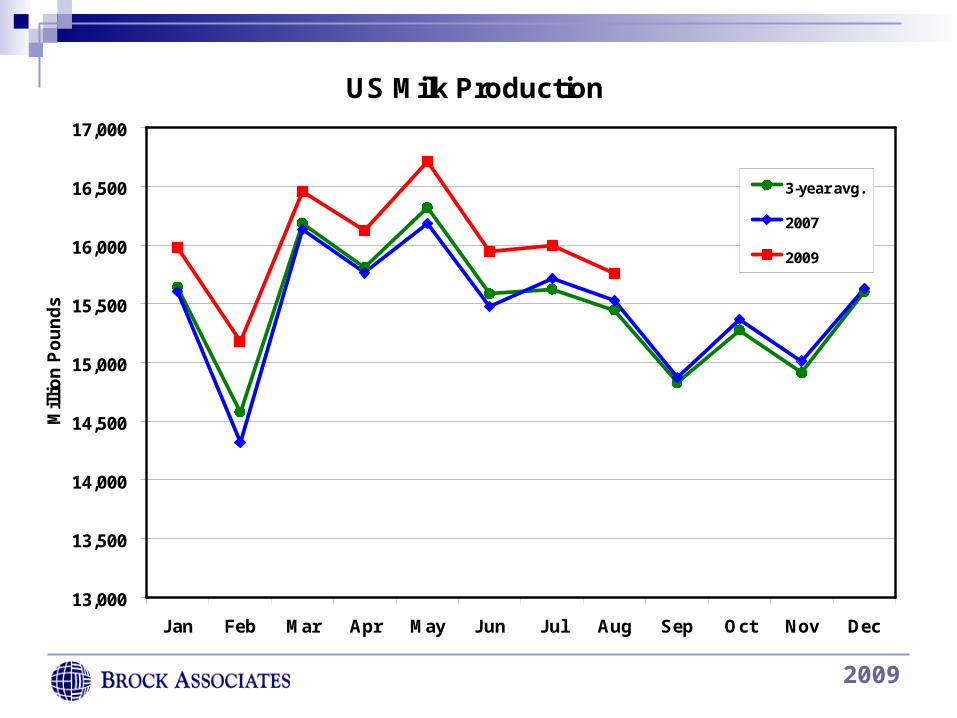
US Milk Production
13,000
13,500
14,000
14,500
15,000
15,500
16,000
16,500
17,000
Jan Feb Mar Apr May Jun Jul Aug Sep Oct Nov Dec
Mil
lio
n P
ou
nd
s
3-year avg.
2007
2009
2009
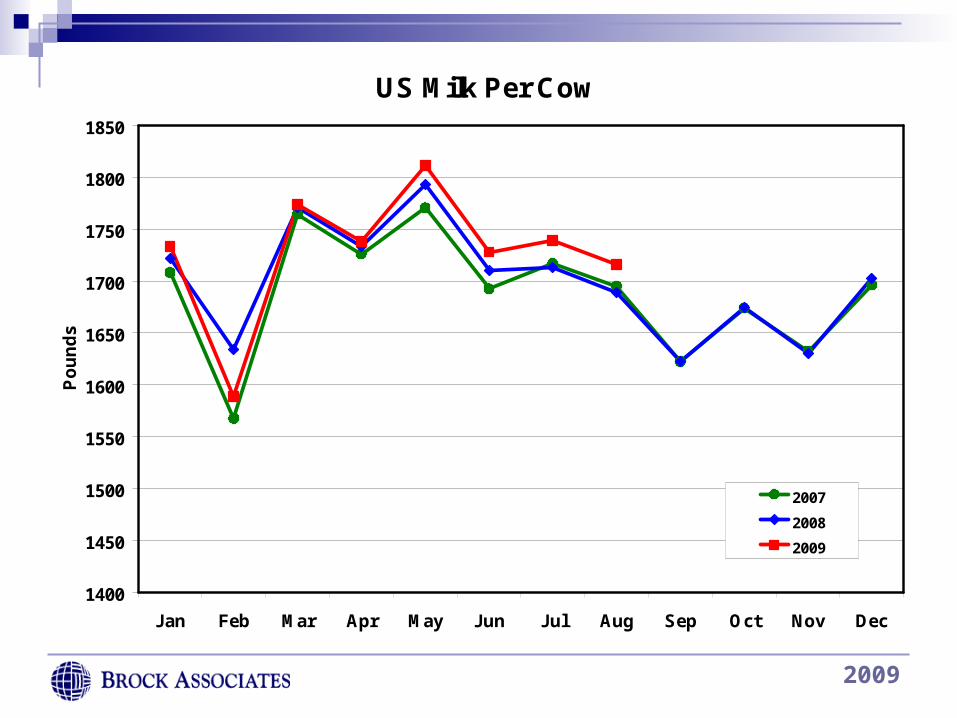
US Milk Per Cow
1400
1450
1500
1550
1600
1650
1700
1750
1800
1850
Jan Feb Mar Apr May Jun Jul Aug Sep Oct Nov Dec
Po
un
ds
2007
2008
2009

2009
Annual US Milk Production and Commercial Use
100,000
110,000
120,000
130,000
140,000
150,000
160,000
170,000
180,000
190,000
200,000
197
0
197
2
197
4
197
6
197
8
198
0
198
2
198
4
198
6
198
8
199
0
199
2
199
4
199
6
199
8
200
0
200
2
200
4
200
6
200
8
201
0
Mil
lio
n P
ou
nd
s
Milk Production
Milk Commercial Use
Data, Projections: USDA
2009
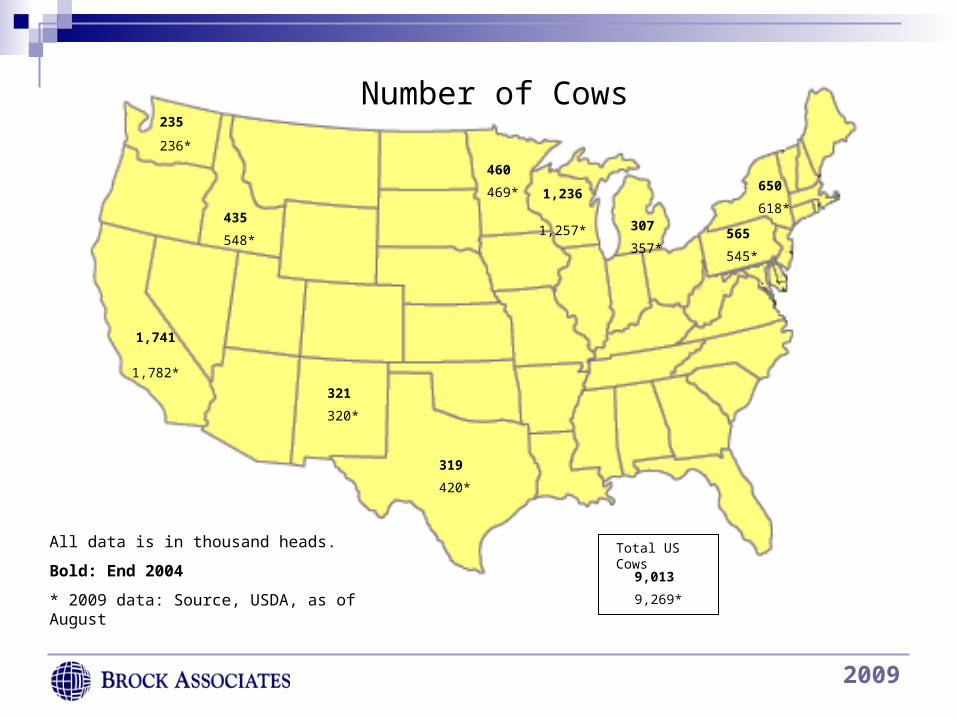
235
236*
All data is in thousand heads.
Bold: End 2004
* 2009 data: Source, USDA, as of August
435
548*
650
618*
565
545*
307
357*
1,236
1,257*
460
469*
319
420*
321
320*
1,741
1,782*
Number of Cows
9,013
9,269*
Total US Cows
2009
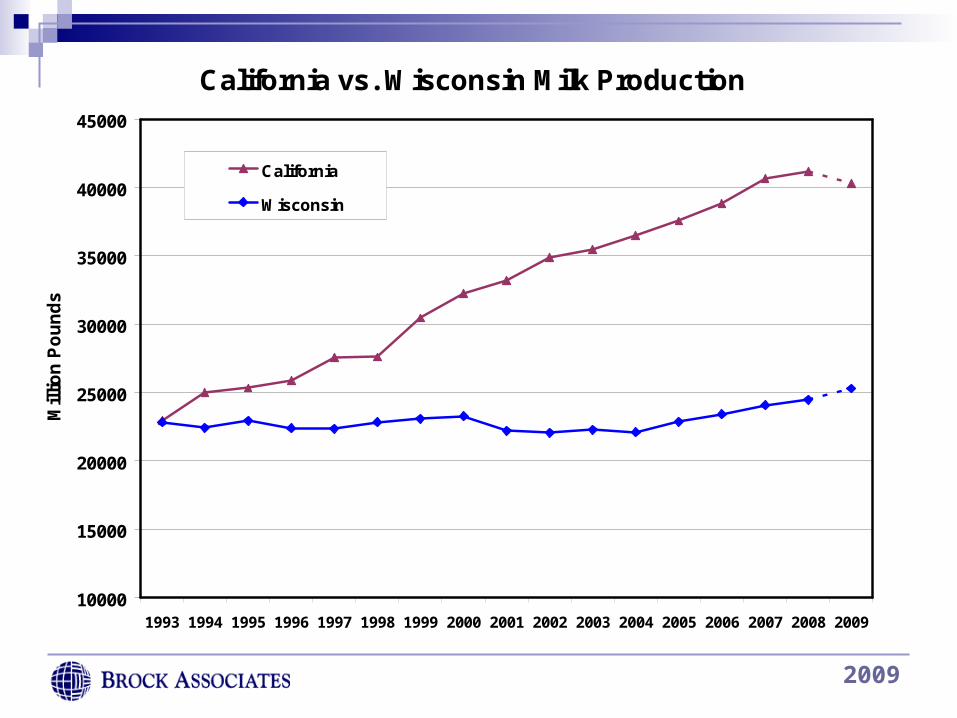
California vs. Wisconsin Milk Production
10000
15000
20000
25000
30000
35000
40000
45000
1993 1994 1995 1996 1997 1998 1999 2000 2001 2002 2003 2004 2005 2006 2007 2008 2009
Mil
lio
n P
ou
nd
s
California
Wisconsin
Source: USDA, 2009 Projection Brock Estimate
2009
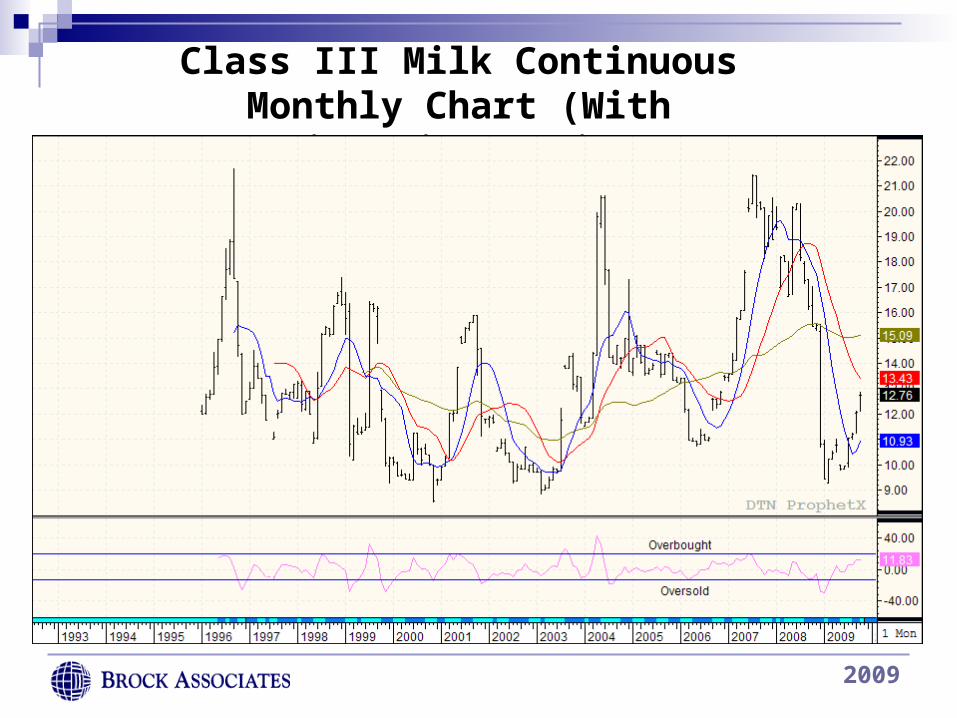
Class III Milk Continuous Monthly Chart (With Disparity Ratio)
2009
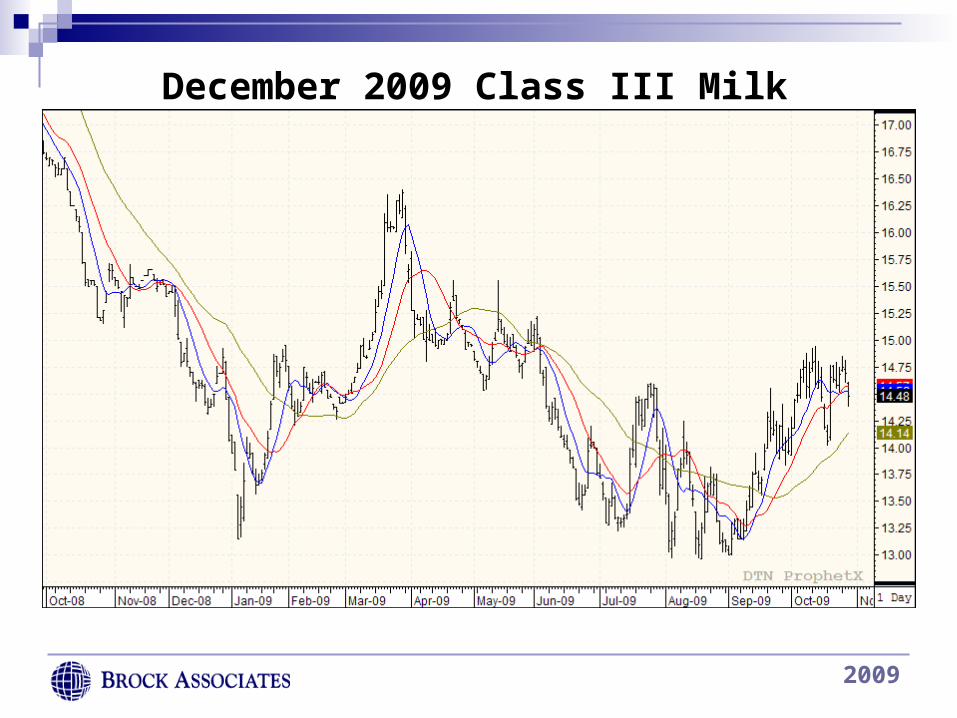
December 2009 Class III Milk Futures
2009
In Summary• Farm income will be down in 2009, due
primarily to livestock. Profits will bounce back in 2010.
• Producers in the southern half of the US will be mostly price buyers, not quality buyers, in the coming months.
• Yield increases in corn and soybeans are starting to ramp up sharply.
• Livestock prices have already made a major bottom.
2009
•Land prices and cash rents will stay strong in the Midwest. California and other states impacted by dairy losses, water availability and environmental issues will soften•Consolidation of farms will continue increasing the demand for farm management services and appraisals

2009
For More Information on the Brock Report, write, email or call
BROCK ASSOCIATES2050 W. Good Hope Rd.
Milwaukee, WI 53209(800) 558-3431
www.brockreport.com [email protected]


![[Commodity Name] Commodity Strategy](https://static.fdocuments.net/doc/165x107/568135d2550346895d9d3881/commodity-name-commodity-strategy.jpg)