Economic Analysis of Working Waterfronts in the United States · Economic Analysis of Working...
90
Economic Analysis of Working Waterfronts in the United States Draft Technical Report to U.S. Economic Development Administration for Sponsored Project Number 99-07-13873: Creating Community and Economic Development Tools for Preserving Working Waterfronts and Waterways Investigators: Alan W. Hodges, PhD, Thomas J. Stevens, PhD, Mohammad Rahmani, PhD Food and Resource Economics Department Robert Swett, PhD School of Forest Resources and Conservation, Florida Sea Grant University of Florida Gainesville, FL August 15, 2013
Transcript of Economic Analysis of Working Waterfronts in the United States · Economic Analysis of Working...

Economic Analysis of Working Waterfronts in the United States
Draft Technical Report to U.S. Economic Development Administration for Sponsored Project Number 99-07-13873: Creating Community and Economic
Development Tools for Preserving Working Waterfronts and Waterways
Investigators:
Alan W. Hodges, PhD, Thomas J. Stevens, PhD, Mohammad Rahmani, PhD Food and Resource Economics Department
Robert Swett, PhD
School of Forest Resources and Conservation, Florida Sea Grant
University of Florida Gainesville, FL
August 15, 2013

Table of Contents
List of Tables ....................................................................................................................................................... ii
List of Figures ..................................................................................................................................................... iii
Executive Summary ............................................................................................................................................ v
Glossary of Economic Terms .............................................................................................................................. x
Introduction ........................................................................................................................................................ 1
Literature Review ............................................................................................................................................... 1
Ocean Economic Data ..................................................................................................................................... 1
Statistical and Economic Surveys ................................................................................................................... 2
Economic Impact Studies................................................................................................................................ 3
Structural Change and Development ............................................................................................................. 5
Data and Methodology ....................................................................................................................................... 6
Data ................................................................................................................................................................ 6
Methodology .................................................................................................................................................. 8
Ocean Economic Regions ............................................................................................................................ 8
Inventory of Working Waterfront Communities ........................................................................................ 9
Analysis of Regional Economic Contributions .......................................................................................... 10
Forecast of Economic Activity .................................................................................................................. 11
Results .............................................................................................................................................................. 13
Inventory of Economic Activity in Working Waterfront Communities ........................................................ 13
Ocean-Related Share of Coastal Economies ................................................................................................. 25
Regional Economic Contributions ................................................................................................................ 36
Trends and Forecast of Ocean Sector Gross Domestic Product ................................................................... 42
Trends and Forecast of Port Shipping Activity ............................................................................................. 50
Trends in Commercial Fisheries .................................................................................................................... 63
Trends and Forecast of Cruise Ship Activity ................................................................................................. 73
Literature and Information Sources Cited ........................................................................................................ 75
Appendix A: Detailed Data Tables for U.S. Coastal Regions, States and Counties ........................................... 78
Appendix B: Maps of Counties in U.S. Coastal Regions .................................................................................. 166
i

List of Tables
Table 1. Ocean economic sectors and classification within the North American Industry Classification System (NAICS) and IMPLAN ................................................................................................................ 7
Table 2. U.S. coastal regions for economic analysis of working waterfronts ..................................................... 9 Table 3. Value added multipliers for ocean economic activities in eleven U.S. coastal regions ...................... 12 Table 4. Summary of ocean-related economic activity in 2009 for thirty coastal states within eleven U.S.
coastal regions ................................................................................................................................... 14 Table 5. Summary of GDP and share of ocean-related employment, wages, and GDP in 2009 for the top 50
U.S. coastal counties .......................................................................................................................... 28 Table 6. Summary of total economic contributions of ocean-related industries in U.S. coastal regions in
2009 ................................................................................................................................................... 38 Table 7. Summary of total economic contributions of ocean-related industries in U.S. coastal states in 2009
........................................................................................................................................................... 39 Table 8. Top 50 U.S. counties by GDP ocean-related economy contribution in 2009 ..................................... 42 Table 9. Summary of county level ocean-related sector GDP change predictions, positive or negative, 2009-
20, by U.S. coastal region and state ................................................................................................... 45 Table 10. Summary of county level ocean-related sector GDP change predictions exceeding 50 percent,
positive or negative, 2009-20, by U.S. coastal region and state........................................................ 46 Table 11. Top 50 U.S. county ocean-related sectors with greatest positive percentage GDP change predicted
in 2020 ............................................................................................................................................... 47 Table 12. Top 50 U.S. county ocean-related sectors with greatest negative percentage GDP change
predicted in 2020 ............................................................................................................................... 48 Table 13. Forecast ocean-related GDP in 2020 for U.S. coastal regions and states ......................................... 49 Table 14. Summary of marine port shipments, weight basis, 1997 and 2010, and forecast for 2020, by U.S.
coastal region, state and county ........................................................................................................ 52 Table 15. Summary of marine port shipments, value basis, 1997 and 2010, and forecast for 2020, by U.S.
coastal region, state and county (in Billion 2010 Dollars) ................................................................. 58 Table 18. Cruise ship thousand-passenger nights, by U.S. state and port city, 2004, 2011, and forecast for
2020 ................................................................................................................................................... 74 Table A1. Ocean-related economic activity for U.S. coastal regions, states and counties in 2009 ................. 78 Table A2. Gross Domestic Product for major ocean sectors in U.S. coastal regions, states and counties in
2009 ................................................................................................................................................... 87 Table A3. Total Gross Domestic Product contribution by ocean-related sectors in U.S. coastal regions, states
and counties in 2009 .......................................................................................................................... 96 Table A4. Change in ocean-related GDP for U.S coastal regions, states and counties, 1990-2009, and
predicted values in 2020 .................................................................................................................. 106
ii

List of Figures
Figure 1. Map of coastal economic regions in the United States ....................................................................... 8 Figure 2. Ocean-related employment in U.S. coastal regions in 2009 ............................................................ 15 Figure 3. Ocean-related Gross Domestic Product in U.S. coastal regions in 2009 ........................................... 15 Figure 4. Ocean-related employment in U.S. coastal states in 2009............................................................... 16 Figure 5. Ocean-related Gross Domestic Product in Coastal Counties of U.S. Coastal States in 2009 ............ 17 Figure 6. Map of ocean-related GDP in counties of the north and middle Atlantic coastal regions in 2009... 18 Figure 7. Map of ocean-related employment in counties of the north and middle Atlantic coastal regions in 2009 .................................................................................................................................................................. 18 Figure 8. Map of ocean-related GDP in counties of the south Atlantic coastal region in 2009 ....................... 19 Figure 9. Map of ocean-related employment in counties of the south Atlantic coastal region in 2009 ......... 19 Figure 10. Map of ocean-related GDP in counties of the Gulf of Mexico coastal region in 2009 .................... 20 Figure 11. Map of ocean-related employment in counties of the Gulf of Mexico coastal region in 2009 ...... 20 Figure 12. Map of ocean-related GDP in counties of the Pacific coastal region in 2009 ................................. 21 Figure 13. Map of ocean-related employment in counties of the Pacific coastal region in 2009.................... 21 Figure 14. Map of ocean-related GDP in counties of the Great Lakes coastal region in 2009 ......................... 22 Figure 15. Map of ocean-related employment in counties of the Great Lakes coastal region in 2009 ........... 22 Figure 16. Map of ocean-related GDP in counties of the Alaska coastal region in 2009 ................................. 23 Figure 17. Map of ocean-related employment in counties of the Alaska coastal region in 2009.................... 23 Figure 18. Map of ocean-related GDP in counties of the Hawaii coastal region in 2009 ................................. 24 Figure 19. Map of ocean-related employment in counties of the Hawaii coastal region in 2009 ................... 24 Figure 21. Ocean-related share of employment in U.S. coastal states in 2009................................................. 27 Figure 22. Map of ocean-related share of GDP in counties of the north and middle Atlantic coastal regions in 2009 .................................................................................................................................................................. 28 Figure 23. Map of ocean-related share of employment in counties of the north and middle Atlantic coastal regions in 2009 ................................................................................................................................................. 29 Figure 24. Map of ocean-related share of GDP in counties of the south Atlantic coastal region in 2009 ....... 30 Figure 25. Map of ocean-related share of employment in counties of the south Atlantic coastal region in 2009 .................................................................................................................................................................. 30 Figure 26. Map of ocean-related share of GDP in counties of the Gulf of Mexico coastal region in 2009 ...... 31 Figure 27. Map of ocean-related share of employment in counties of the Gulf of Mexico coastal region in 2009 .................................................................................................................................................................. 31 Figure 28. Map of ocean-related share of GDP in counties of the Pacific coastal region in 2009 ................... 32 Figure 29. Map of ocean-related share of employment in counties of the Pacific coastal region in 2009 ..... 32 Figure 30. Map of ocean-related share of GDP in counties of the Great Lakes coastal region in 2009 ........... 33 Figure 31. Map of ocean-related share of employment in counties of the Great Lakes coastal region in 2009 .......................................................................................................................................................................... 33 Figure 32. Map of ocean-related share of GDP in counties of the Alaska coastal region in 2009 ................... 34 Figure 33. Map of ocean-related share of employment in counties of the Alaska coastal region in 2009 ..... 34 Figure 34. Map of ocean-related share of GDP in counties of the Hawaii coastal region in 2009................... 35 Figure 35. Map of ocean-related share of employment in counties of the Hawaii coastal region in 2009 ..... 35 Figure 36. Ocean-related total GDP contributions in U.S. coastal regions in 2009 .......................................... 37
iii

Figure 39. Ocean-related total employment contributions in U.S. coastal states in 2009 .............................. 41 Figure B1. Map of counties within 50 miles of Atlantic coast from Maine to Virginia .................................. 166 Figure B2. Map of counties within 50 miles of Atlantic coast from Virginia to Georgia ................................ 167 Figure B3. Map of counties within 50 miles of Atlantic and Gulf coasts from Georgia to Louisiana ........... 168 Figure B4. Map of counties within 50 miles of Gulf Coast from Alabama to Texas ....................................... 169 Figure B5. Map of counties within 50 miles of Great Lakes coast from New York to Michigan .................... 170 Figure B6. Map of counties within 50 miles of Great Lakes coast from Ohio to Minnesota ......................... 171 Figure B7. Map of counties within 50 miles of Pacific Coast from Washington to Northern California ........ 172 Figure B8. Map of counties within 50 miles of Pacific coast of California...................................................... 173 Figure B10. Map of counties within 50 miles of coast of Hawaii ................................................................... 175
iv

Economic Analysis of Working Waterfronts in the United States
Executive Summary
Waterfront communities in the United States, whether rural or urban, recreational or industrialized, have
been subject to economic, technological, ecological, and demographic changes that challenge their
continued existence or development. The purpose of this study is to document the current status,
contribution to regional economies, and future prospects of U.S. coastal communities in order help
promote their long-term economic prosperity. A review of the relevant literature on economic valuation of
waterfront and ocean-related economic activities found that previous studies usually evaluated only one
particular economic sector or specific region. The present study attempts to provide a comprehensive
evaluation of all ocean-related economic activity for all coastal regions of the United States.
A commonly accepted definition of ocean-related economic activity was adopted for this analysis based on
specific industry sectors (NAICS codes) developed under the National Ocean Economics Program1. This
classification scheme includes six major industry groups: marine construction, marine living resources
(fishing, aquaculture, seafood processing), offshore minerals (oil and gas production, sand and gravel
mining), ship and boat building/repair, coastal tourism/recreation (boat dealers, marinas, waterfront
hotels, restaurants, tours, marine parks, etc.), and marine transportation (ports, shipping, warehousing,
passenger transportation) (Table 1). Data on economic activity in these sectors were compiled for the
period 1990-2010, including information on employment, wages and value added or contribution to Gross
Domestic Product (GDP)2. In addition, data were gathered on specific high profile industries such as
commercial fishing, port shipping, and passenger cruise ships.
Coastal regions of the U.S. were defined for this analysis to include counties within 50 miles of the coastline
or counties located in coastal zones as established by the Coastal Zone Management Act (Figures B1-B11).
The 11 coastal regions and the states included in each were: North Atlantic (ME, NH, MA, RI, CT, NY),
Middle Atlantic (NJ, DE, PA, VA), South Atlantic (NC, SC, GA, FL), Eastern Gulf of Mexico (FL, GA, AL, MS),
Western Gulf of Mexico (LA, TX), Eastern Great Lakes (NY, PA, OH, MI), Western Great Lakes (MN, WI, MI,
IL, IN), Pacific Northwest (OR, WA), and, California, Alaska and Hawaii (Pacific) (Figure 1, Table 2). Ocean-
related economic activity was inventoried for over 440 coastal zone counties in 30 states within these
regions.
1 See: www.oceaneconomics.org/ 2 The use of GDP here is defined as the measure of total value-added economic activity for any geographic area, i.e., county, state, region, or nation.
v

Total economic contributions of ocean-related activity were evaluated using IMPLAN® (IMpact analysis for
PLANning) regional economic multipliers that capture the secondary effects of supply chain activity or input
purchases (indirect effects) and respending of income by employees, business owners and governments
(induced effects) arising from new final demand (Table 3). Changes in ocean related GDP over the period
1990-2009 were analyzed to determine significant trends for major industry groups within each coastal
county, and to forecast associated economic activity to the year 2020.
In 2009, all coastal regions of the U.S. had over 130,000 ocean-related business establishments, with 2.398
million fulltime and part-time employees, who received $84.25 billion in wages and benefits, and produced
$217.87 billion in Gross Domestic Product. Nationally, ocean-related wages averaged around $35,127 per
job annually. The western Gulf of Mexico region led the nation in ocean-related GDP ($83.47 billion) and
wages ($19.93 billion) primarily due to its off-shore minerals sectors, while the North Atlantic region was
home to the largest ocean-related employment (439,633 jobs) and number of establishments (30,955) due
primarily to tourism and recreation (Table 4, Tables A1-A2, Figures 2-19).
In terms of its relative importance to the overall economy, ocean-related sectors in all coastal regions of the
U.S. represented 3.37 percent of total GDP and 4.81 percent of total employment. The states with the
largest share of ocean-related activity were Alaska (18%), Texas (18%) and Louisiana (17.2%), primarily due
to the presence of large offshore oil and gas production. In a second tier of states, including Alabama,
Hawaii, South Carolina, Maine, and Georgia, ocean-related activities represented between four and eight
percent of GDP, reflecting mainly tourism and recreation as the dominant ocean industries. The states with
the highest share of total employment (more than 12 percent) in ocean-related industries in coastal
counties include Hawaii, South Carolina, and Alaska. A second tier of states with between 8 and 12 percent
ocean sector jobs includes Louisiana, North Carolina, Maine, Georgia, Mississippi, South Carolina and
Alabama. More than half of ocean-related jobs in these states came from the relatively labor-intensive
tourism and recreation industries. In some individual coastal counties, especially in the western Gulf of
Mexico region and Alaska, ocean-related sectors represented over 50 percent of total GDP and
employment, although some of these counties were relatively small, with total GDP of less than $1 billion
(Table 5, Figures 20-39).
The total economic contributions of ocean industries in all U.S. coastal counties in 2009, including regional
multiplier effects estimated with the IMPLAN regional economic models, were 6.74 million jobs, $283.5
billion in wages, and $643.9 billion in value-added or GDP. These total contributions for the ocean economy
represented 2.81 to 3.37 times the direct contributions, indicating strong economic linkages in the
respective regional economies. The western Gulf of Mexico, California, and North Atlantic regions
experienced the largest value-added or GDP contributions from their ocean economies. The top five states
vi

for ocean-related GDP contributions were Texas ($155 billion), California ($115 billion), Florida ($64 billion),
New York ($59 billion), and Louisiana ($36 billion). In terms of ocean-related employment contributions, the
largest state was California (1,340,131 jobs), followed by Florida (914,482 jobs), Texas (817,556 jobs), New
York (622,057 jobs) and New Jersey (289,698 jobs). The largest individual counties for total GDP
contributions were Harris County (Houston), Texas ($140 billion), New York, New York ($38.4 billion), and
Los Angeles, California ($37.6 billion). Among the top 50 counties in terms of in total GDP contribution, the
middle Atlantic region had 12 counties, while the western Gulf of Mexico and California Pacific coasts each
had nine counties (Tables 6-8, Table A3).
Approximately one-fourth of the county-level ocean-related industry sectors analyzed had statistically
significant trends in GDP, either positive (increasing) or negative (decreasing), over the period 1990-2009,
with 70 percent of these changes being of 50 percent or greater in magnitude. The states with the largest
number of positive net changes in GDP across all ocean-related sectors were Massachusetts, Maryland,
Florida (Gulf coast), Texas, California, and Washington, while states with the largest negative net changes
were Pennsylvania, Florida (Atlantic coast), Alaska, and Michigan. The sector with the most positive changes
in GDP was tourism/recreation, with 155 counties experiencing a significant increase, and 41 counties with
a decrease. The Living Resources sector had the most negative changes: 60 counties decreased and 12
counties increased. Most of the 50 county-level economic sectors with the largest decreases in economic
activity over the past 20 years are predicted to disappear by the year 2020 (Tables 9-13, Table A4).
Marine cargo shipping remains one of the largest water-dependent activities in the U.S. The total tonnage
of marine port shipments for all waterfront counties in the United States increased from about 1.16 billion
tons in 1997 to almost 1.51 billion tons in 2010, or about 30 percent, and is forecast to increase to over
1.89 billion tons in 2020. The total value of marine port shipments in all U.S. waterfront counties increased
from $961 billion in 1997 to $1,640 billion in 2010 (+71%), and is forecast to be $2,364 billion in 2020. The
Western Gulf of Mexico region had the highest total weight of shipments in 2010 (645 million tons),
followed by the Middle Atlantic region ($228 million tons) and California (217 million Tons). California had
the highest marine port shipments value in 2010 ($461 billion), followed by the Western Gulf of Mexico
($368 billion), Middle Atlantic ($302 billion), and South Atlantic ($239 billion) regions. The Pacific-California
region had the greatest increase in tonnage from 1997 to 2010 (96%), followed by the South-Atlantic (63%)
and Middle-Atlantic (42%) regions. The Pacific-Alaska region showed the greatest decrease in total shipping
weight (-43%) followed by the Eastern- and Western-Great Lakes (-23, -19 percent), and North-Atlantic (-
18%). The value of marine shipments increased in all regions from 1997 to 2010, except for the Eastern
Great Lakes (-20%) (Tables 14-15).
vii

Commercial fishing is an economic activity traditionally associated with working waterfront communities;
however, the sustainability of commercial fishing is threatened in many areas of the U.S. The total landings
in 2010 by commercial fisheries in the United States was 4.5 billion pounds with a value of $2.70 billion.
This represented a decrease of 17 percent and 18 percent, respectively, since 1990 in inflation adjusted
dollars. The Alaska-Pacific region had the highest fishery landings in 2010, both in weight (1.76 billion
pounds) and value ($907 million). The regions with the next highest landed weights were the Western Gulf
of Mexico (769 million lbs.), Middle-Atlantic (556 million lbs.), California (414 million lbs.), North-Atlantic
(392 million lbs.), and Pacific–Northwest (368 million lbs.), while regions with the next highest landed
values were North-Atlantic ($563 million), Middle-Atlantic ($269 million), Pacific-Northwest ($276 million),
Western-Gulf of Mexico ($249 million), Eastern-Gulf of Mexico ($150 million), and California ($140 million).
Sixteen counties in the U.S. landed over 100 million pounds of fish each in 2010. The counties with the
largest fisheries landings in terms of value were Bristol County, Massachusetts ($306 million), Aleutians
West, Alaska ($163 million), Kenai Peninsula, Alaska ($150 million), Kodiak Island, Alaska ($128 million),
Bristol Bay, Alaska ($101 million), Valdez-Cordova, Alaska ($84 million), and Cape May, New Jersey ($81
million). Oregon, Washington and Alaska were the only states to experience an increase in landed weight
from 1990 to 2010 (+51%, +38%, +28%, respectively). The South-Atlantic region suffered the greatest
decrease in landed weight (-63%), followed by the Eastern Gulf of Mexico (-57%), Pacific-California (-44%),
Middle-Atlantic (-37%), Western Gulf of Mexico (-29%), and the North-Atlantic (-29%). States with a
significant increase in the value of fishery landings from 1990 to 2010 were Maine (40%), New Jersey (31%),
Florida-Gulf (30%), and Washington (25%); while Texas suffered the largest decrease (-76%), followed by
Rhode Island (-72%), California (-63%), Mississippi (-62%), Alabama (-44%), Louisiana (-42%), and Maryland
(-35%) (Tables 16-17).
Ocean-going cruise ships have become one of the premier venues for coastal tourism and recreation. Cruise
ships calling at U.S. ports reported a total of 49.1 million passenger-nights in 2011; however, this represents
a decrease of 12 percent from a total passenger volume of 55.6 million in 2004. There were 22 ports
hosting active cruise lines in 2011, including 13 with annual volumes of at least one million passenger-
nights. The top three cruise ports were in Florida: Ft. Lauderdale, Miami, and Port Canaveral (Brevard
County), with passenger volumes of 10.2, 7.7, and 5.3 million, respectively. Other top ports were New York
City (3.5 million), Los Angeles, California (3.2 million), Seattle, Washington (3.2 million), Anchorage, Alaska
(2.1 million), Galveston, Texas (2.0 million), Tampa, Florida (1.8 million), New Orleans, Louisiana (1.5
million), Baltimore, Maryland (1.4 million), Hudson, New Jersey (1.3 million), and San Diego, California (1.1
million). Ports with the largest increase in cruise passenger volume during 2004-11 were Hudson, New
Jersey (+102%), Baltimore (+65%), Seattle (+57%), Ft. Lauderdale (+8%), and New York City (+5%), while
ports with decreased volume were Honolulu (-52%), New Orleans (-39%), San Diego (-32%), Galveston (-
viii

29%), Tampa (-29%), Los Angeles (-28%), Anchorage (27%), Miami (-21%), and Port Canaveral, Florida (-
14%). Based on regression analysis, two ports are forecast to have significantly increased activity into the
future (Seattle, Washington and Hudson, New Jersey), while three ports were forecast to have lower
volume (Tampa, Florida, Mobile, Alabama, and Charleston, South Carolina) (Table 18).
ix

Glossary of Economic Terms
Employee compensation is comprised of wages, salaries, commissions, and benefits such as health and life insurance, retirement and other forms of cash or non-cash compensation.
Employment is a measure of the number of jobs involved, including fulltime, part-time and seasonal positions. It is not a measure of fulltime equivalents (FTE).
Exports are sales of goods to customers outside the region in which they are produced, and they represent a net inflow of money to the region. Exports are defined to also include sales of services to customers visiting from other regions.
Final Demand represents sales to final consumers, including households and governments, and exports from the region.
Gross Regional Product is a measure of total economic activity in a region, or total income generated by all goods and services. It represents the sum of total value added by all industries in that region, and is equivalent to Gross Domestic Product (GDP) for the nation.
IMPLAN is a computer-based input-output modeling system that enables users to create regional economic models and multipliers for any region consisting of one or more counties or states in the U.S. The current version of the IMPLAN software, version 3, accounts for commodity production and consumption for 440 industry sectors, 10 household income levels, taxes to local/state and federal governments, capital investment, imports and exports, transfer payments, and business inventories. Regional datasets for individual counties or states are purchased separately.
Impact or total impact is the change in total regional economic activity (e.g. output or employment) resulting from a change in final demand, direct industry output, or direct employment, estimated based on regional economic multipliers.
Imports are purchases of goods and services originating outside the region of analysis.
Income is the money earned within the region from production and sales. Total income includes labor income such as wages, salaries, employee benefits and business proprietor income, plus other property income.
Indirect business taxes are taxes paid to governments by individuals or businesses for property, excise and sales taxes, but do not include income taxes.
Input-Output (I-O) model and Social Accounting Matrix (SAM) is a representation of the transactions between industry sectors within a region that captures what each sector purchases from every other sector in order to produce its output of goods or services. Using such a model, flows of economic activity associated with any change in spending may be traced backwards through the supply chain.
Intermediate sales are sales to other industrial sectors. The value of intermediate sales is netted-out of Total Value Added.
Local refers to goods and services that are sourced from within the region, which may be defined as a county, multi-county cluster, or state. Non-local refers to economic activity originating outside the region.
x

Margins represent the portion of the purchaser price accruing to the retailer, wholesaler, and producer/manufacturer, in the supply chain. Typically, only the retail margins of many goods purchased by consumers accrue to the local region, as the wholesaler, shipper, and manufacturer often lie outside the local area.
Multipliers capture the total effects, both direct and secondary, in a given region, generally as a ratio of the total change in economic activity in the region relative to the direct change. Multipliers are derived from an I-O model of the regional economy. Multipliers may be expressed as ratios of sales, income, or employment, or as ratios of total income or employment changes relative to direct sales. Multipliers express the degree of interdependency between sectors in a region's economy and therefore vary considerably across regions and sectors. A sector-specific multiplier gives the total changes to the economy associated with a unit change in output or employment in a given sector (i.e. the direct economic effect) being evaluated. Indirect effects multipliers represent the changes in sales, income, or employment within the region in backward-linked industries supplying goods and services to businesses (e.g., increased sales in input supply firms resulting from more nursery industry sales). Induced effects multipliers represent the increased sales within the region from household spending of the income earned in the direct and supporting industries for housing, utilities, food, etc. An imputed multiplier is calculated as the ratio of the total impact divided by direct effect for any given measure (e.g. output, employment).
Other property income represents income received from investments, such as corporate dividends, royalties, property rentals, or interest on loans.
Output is the dollar value of a good or service produced or sold, and is equivalent to sales revenues plus changes in business inventories.
Output-consumption ratio is the total industry output divided by the apparent consumption, for any given commodity or industry, and is a measure of the degree to which local demands are met by local production.
Producer prices are the prices paid for goods at the factory or point of production. For manufactured goods the purchaser price equals the producer price plus a retail margin, a wholesale margin, and a transportation margin. For services, the producer and purchaser prices are equivalent.
Proprietor income is income received by non-incorporated private business owners or self-employed individuals.
Purchaser prices are the prices paid by the final consumer of a good or service.
Region defines the geographic area for which impacts are estimated, usually an aggregation of several counties defined on the basis of worker commuting patterns.
Sector is an individual industry or group of industries that produce similar products or services, or have similar production processes. Sectors are classified according to the North American Industrial Classification System (NAICS).
Value Added is a broad measure of income, representing the sum of employee compensation, proprietor income, other property income, indirect business taxes and capital consumption (depreciation). Value
xi

added is a commonly used measure of the contribution an industry makes to a regional economy because it avoids double-counting of intermediate sales.
xii

Economic Analysis of Working Waterfronts in the United States
Introduction
Waterfront communities in the United States, whether rural or urban, recreational or industrialized, have
been subject to economic, technological, ecological, and demographic changes that have challenged their
continued existence or revitalization. The purpose of this study is to help promote the long-term economic
prosperity of coastal communities through a better understanding of their current status, their role in the
regional and national economies, and their future prospects.
In a review of past literature on the economic valuation of waterfront and ocean-related economic activity,
it was found that previous studies were limited to one particular economic sector or geographic region. The
present study is the first to attempt a comprehensive evaluation of all ocean related economic activity for
all coastal regions of the United States.
Literature Review
A review of available data and literature was carried out to locate information resources and provide
background, perspective, and motivation for the objectives and findings of this study. Previous studies
published since 1990 were selected based on relevancy to ocean economic impacts. The review was divided
into four categories: Ocean Economics Data, Statistical and Economic Surveys, Economic Impact Studies,
and studies of Structural Change and Development. Studies and sources within each type are discussed
below.
Ocean Economic Data
The primary source of economic data for this analysis was the National Ocean Economics Program (NOEP),
which is a research arm of the Center for the Blue Economy at the Monterey Institute of International
Studies. The NOEP compiles, organizes and distributes data on ocean and coastal related economic activity
along the U.S. coasts and Great Lakes. Datasets or reference lists compiled and made available by NOEP
include business activity that is directly or indirectly dependent on the ocean, and business activity that is
located within the coastal regions of the U.S. Specific data sets include: fish landing weights and values at
major fishing ports; tonnage and value of marine shipments moving through coastal ports; and, off-shore
oil and gas production and value. Access to these datasets and other reports and articles is available
through the NOEP website at www.oceaneconomy.org.
1
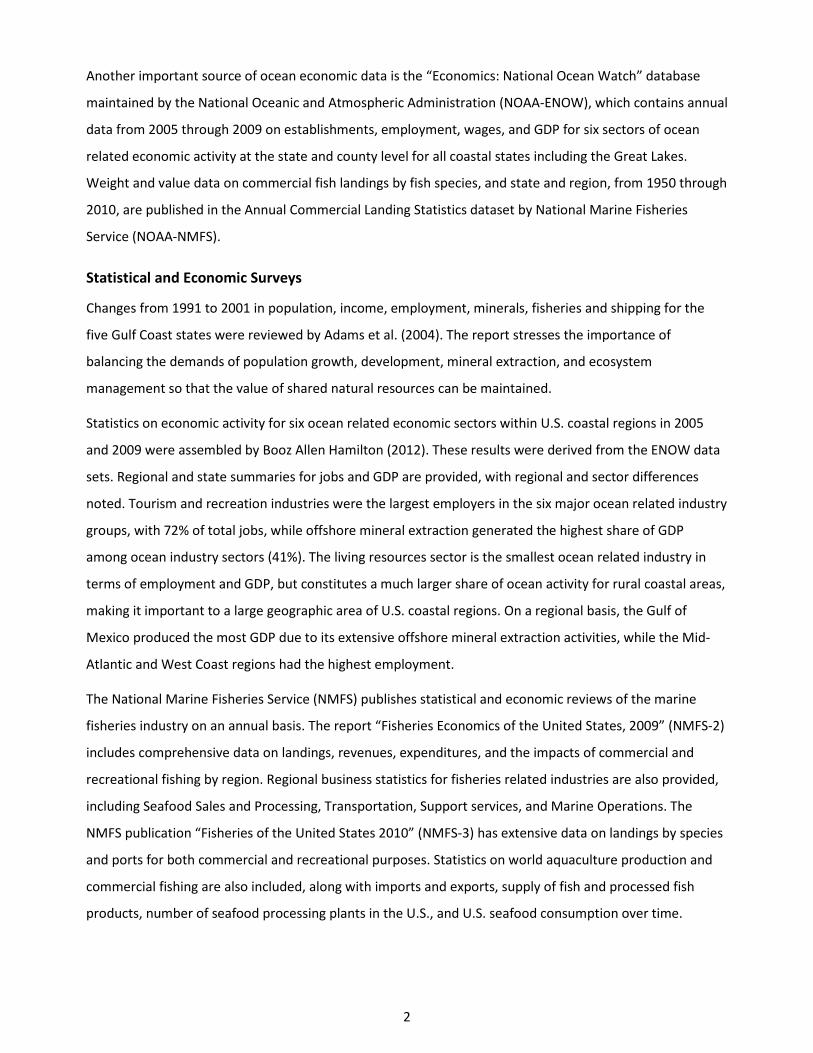
Another important source of ocean economic data is the “Economics: National Ocean Watch” database
maintained by the National Oceanic and Atmospheric Administration (NOAA-ENOW), which contains annual
data from 2005 through 2009 on establishments, employment, wages, and GDP for six sectors of ocean
related economic activity at the state and county level for all coastal states including the Great Lakes.
Weight and value data on commercial fish landings by fish species, and state and region, from 1950 through
2010, are published in the Annual Commercial Landing Statistics dataset by National Marine Fisheries
Service (NOAA-NMFS).
Statistical and Economic Surveys
Changes from 1991 to 2001 in population, income, employment, minerals, fisheries and shipping for the
five Gulf Coast states were reviewed by Adams et al. (2004). The report stresses the importance of
balancing the demands of population growth, development, mineral extraction, and ecosystem
management so that the value of shared natural resources can be maintained.
Statistics on economic activity for six ocean related economic sectors within U.S. coastal regions in 2005
and 2009 were assembled by Booz Allen Hamilton (2012). These results were derived from the ENOW data
sets. Regional and state summaries for jobs and GDP are provided, with regional and sector differences
noted. Tourism and recreation industries were the largest employers in the six major ocean related industry
groups, with 72% of total jobs, while offshore mineral extraction generated the highest share of GDP
among ocean industry sectors (41%). The living resources sector is the smallest ocean related industry in
terms of employment and GDP, but constitutes a much larger share of ocean activity for rural coastal areas,
making it important to a large geographic area of U.S. coastal regions. On a regional basis, the Gulf of
Mexico produced the most GDP due to its extensive offshore mineral extraction activities, while the Mid-
Atlantic and West Coast regions had the highest employment.
The National Marine Fisheries Service (NMFS) publishes statistical and economic reviews of the marine
fisheries industry on an annual basis. The report “Fisheries Economics of the United States, 2009” (NMFS-2)
includes comprehensive data on landings, revenues, expenditures, and the impacts of commercial and
recreational fishing by region. Regional business statistics for fisheries related industries are also provided,
including Seafood Sales and Processing, Transportation, Support services, and Marine Operations. The
NMFS publication “Fisheries of the United States 2010” (NMFS-3) has extensive data on landings by species
and ports for both commercial and recreational purposes. Statistics on world aquaculture production and
commercial fishing are also included, along with imports and exports, supply of fish and processed fish
products, number of seafood processing plants in the U.S., and U.S. seafood consumption over time.
2
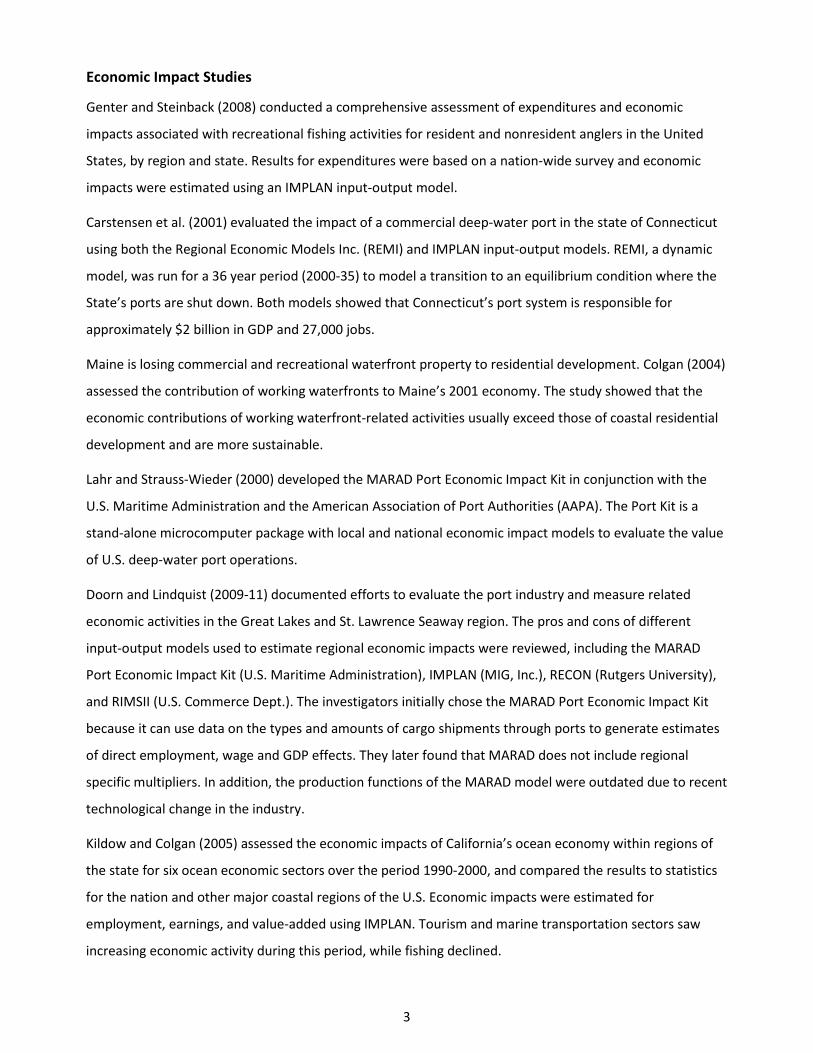
Economic Impact Studies
Genter and Steinback (2008) conducted a comprehensive assessment of expenditures and economic
impacts associated with recreational fishing activities for resident and nonresident anglers in the United
States, by region and state. Results for expenditures were based on a nation-wide survey and economic
impacts were estimated using an IMPLAN input-output model.
Carstensen et al. (2001) evaluated the impact of a commercial deep-water port in the state of Connecticut
using both the Regional Economic Models Inc. (REMI) and IMPLAN input-output models. REMI, a dynamic
model, was run for a 36 year period (2000-35) to model a transition to an equilibrium condition where the
State’s ports are shut down. Both models showed that Connecticut’s port system is responsible for
approximately $2 billion in GDP and 27,000 jobs.
Maine is losing commercial and recreational waterfront property to residential development. Colgan (2004)
assessed the contribution of working waterfronts to Maine’s 2001 economy. The study showed that the
economic contributions of working waterfront-related activities usually exceed those of coastal residential
development and are more sustainable.
Lahr and Strauss-Wieder (2000) developed the MARAD Port Economic Impact Kit in conjunction with the
U.S. Maritime Administration and the American Association of Port Authorities (AAPA). The Port Kit is a
stand-alone microcomputer package with local and national economic impact models to evaluate the value
of U.S. deep-water port operations.
Doorn and Lindquist (2009-11) documented efforts to evaluate the port industry and measure related
economic activities in the Great Lakes and St. Lawrence Seaway region. The pros and cons of different
input-output models used to estimate regional economic impacts were reviewed, including the MARAD
Port Economic Impact Kit (U.S. Maritime Administration), IMPLAN (MIG, Inc.), RECON (Rutgers University),
and RIMSII (U.S. Commerce Dept.). The investigators initially chose the MARAD Port Economic Impact Kit
because it can use data on the types and amounts of cargo shipments through ports to generate estimates
of direct employment, wage and GDP effects. They later found that MARAD does not include regional
specific multipliers. In addition, the production functions of the MARAD model were outdated due to recent
technological change in the industry.
Kildow and Colgan (2005) assessed the economic impacts of California’s ocean economy within regions of
the state for six ocean economic sectors over the period 1990-2000, and compared the results to statistics
for the nation and other major coastal regions of the U.S. Economic impacts were estimated for
employment, earnings, and value-added using IMPLAN. Tourism and marine transportation sectors saw
increasing economic activity during this period, while fishing declined.
3
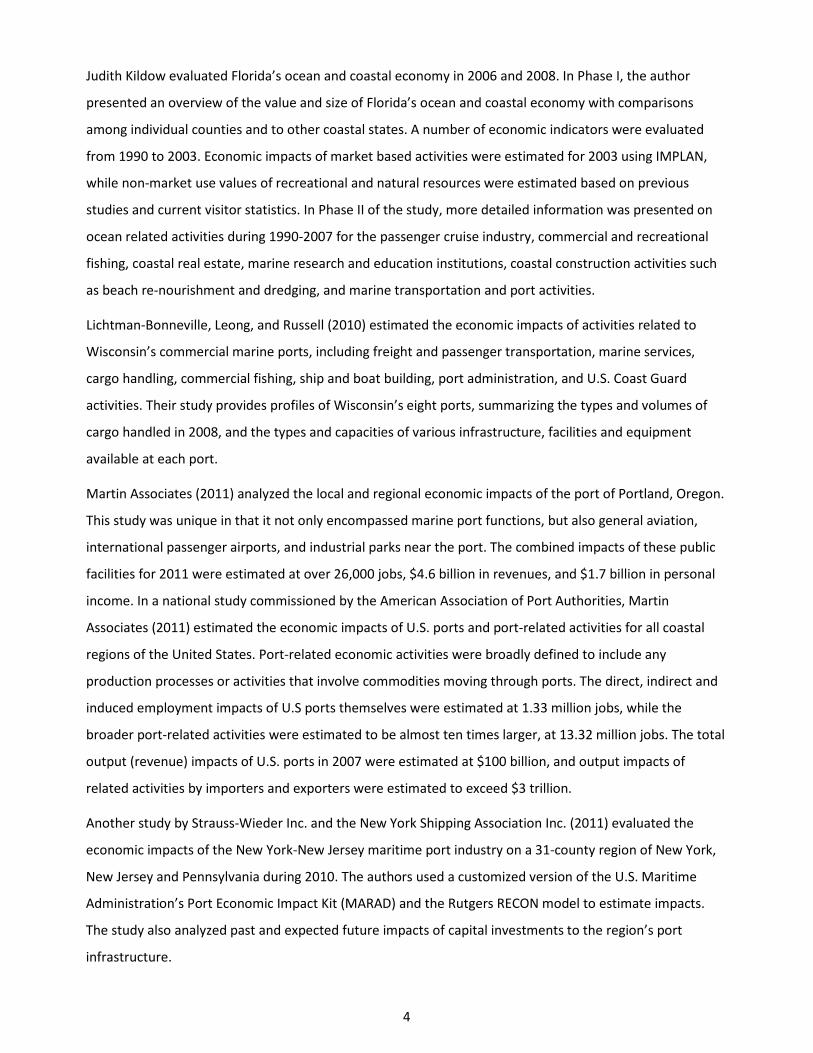
Judith Kildow evaluated Florida’s ocean and coastal economy in 2006 and 2008. In Phase I, the author
presented an overview of the value and size of Florida’s ocean and coastal economy with comparisons
among individual counties and to other coastal states. A number of economic indicators were evaluated
from 1990 to 2003. Economic impacts of market based activities were estimated for 2003 using IMPLAN,
while non-market use values of recreational and natural resources were estimated based on previous
studies and current visitor statistics. In Phase II of the study, more detailed information was presented on
ocean related activities during 1990-2007 for the passenger cruise industry, commercial and recreational
fishing, coastal real estate, marine research and education institutions, coastal construction activities such
as beach re-nourishment and dredging, and marine transportation and port activities.
Lichtman-Bonneville, Leong, and Russell (2010) estimated the economic impacts of activities related to
Wisconsin’s commercial marine ports, including freight and passenger transportation, marine services,
cargo handling, commercial fishing, ship and boat building, port administration, and U.S. Coast Guard
activities. Their study provides profiles of Wisconsin’s eight ports, summarizing the types and volumes of
cargo handled in 2008, and the types and capacities of various infrastructure, facilities and equipment
available at each port.
Martin Associates (2011) analyzed the local and regional economic impacts of the port of Portland, Oregon.
This study was unique in that it not only encompassed marine port functions, but also general aviation,
international passenger airports, and industrial parks near the port. The combined impacts of these public
facilities for 2011 were estimated at over 26,000 jobs, $4.6 billion in revenues, and $1.7 billion in personal
income. In a national study commissioned by the American Association of Port Authorities, Martin
Associates (2011) estimated the economic impacts of U.S. ports and port-related activities for all coastal
regions of the United States. Port-related economic activities were broadly defined to include any
production processes or activities that involve commodities moving through ports. The direct, indirect and
induced employment impacts of U.S ports themselves were estimated at 1.33 million jobs, while the
broader port-related activities were estimated to be almost ten times larger, at 13.32 million jobs. The total
output (revenue) impacts of U.S. ports in 2007 were estimated at $100 billion, and output impacts of
related activities by importers and exporters were estimated to exceed $3 trillion.
Another study by Strauss-Wieder Inc. and the New York Shipping Association Inc. (2011) evaluated the
economic impacts of the New York-New Jersey maritime port industry on a 31-county region of New York,
New Jersey and Pennsylvania during 2010. The authors used a customized version of the U.S. Maritime
Administration’s Port Economic Impact Kit (MARAD) and the Rutgers RECON model to estimate impacts.
The study also analyzed past and expected future impacts of capital investments to the region’s port
infrastructure.
4

Structural Change and Development
An international comparative study by Becker (2010) analyzed the management and development of the
Cities of Hamburg, Germany and Tampa, Florida around their ports. It was found that the development and
revitalization of the Tampa port area has been slower than expected because the city did not adapt to new
technology and never developed a cohesive approach to integrating port business activities with adjacent
residential communities or recreational activities. Also, it was noted that a key difference between the two
cities is that the Hamburg port authority is locally elected while Tampa Bay has been largely managed at the
State level.
Kotval and Mullin (2010) reviewed the evolution of port communities and sustainable waterfront
revitalization in relation to trade agreements, environmental issues, and consumer preferences. The
authors concluded that, to be successful, port communities must have strong long-term planning that
addresses how to integrate water-dependent or water-related activities into an overall city design. Factors
deemed important to future prosperity include land-use compatibility and sustainability, marketing and
promotion, an effective regulatory environment, and mutually beneficial trade and international
competition.
Despite its vast interior, economic activity in the U.S. remains overwhelmingly concentrated on its coasts.
Econometric analysis by Rappaport and Sachs (2003) attributed this to the large contribution that coastal
proximity has on productivity and quality of life. They note that coastal economic growth increasingly stems
from quality of life factors.
Sieber (1991) explored the process of waterfront redevelopment and revitalization for North American port
cities from an economic, anthropologic, and cultural perspective. It was concluded that waterfront
revitalization is a phase in a longer evolutionary process resulting from international economic
restructuring, technological obsolescence, and privatization.
Slack (1993) posited that ports have become handicapped players in the global transportation system.
Containerization and increasing economies of scale in shipping lines have put municipal port facilities at a
disadvantage in negotiating rates with large international shipping lines. Containerization has also eased
the transfer of cargo from one mode of transportation to another, thus making it possible for shippers to
deliver cargo to interior destinations from a larger set of coastal ports.
5

Data and Methodology
Data
To assess the economic activity of working waterfront communities, data were acquired and compiled on
industry employment, wages and Gross Domestic Product (GDP), for all coastal areas of the United States,
including the Great Lakes, at the county, state, and regional levels, for the period 1990 to 2010. In addition,
data for coastal areas was acquired on commercial fisheries landings, commercial shipping port volumes
and values, and passenger nights on cruise ships.
The principal source of data for this analysis was the National Ocean Economics Program (NOEP), which
maintains an interactive website (www.oceaneconomics.org) with extensive economic data resources for
coastal areas of the U.S., as described by Colgan (2007). The “Coastal Economy” dataset has economic data
on eleven major industry groups, whether they depend directly on the ocean or not, located in counties of
coastal states of the U.S. The “Ocean Economy” dataset is limited to industries or activities that rely directly
on the ocean, in counties that are adjacent to the coast, or within coastal zones as defined by the Coastal
Zone Management Act. These ocean-dependent economic data are available for six sectors at the county
level, or 23 industries at the state level, as shown in Table 1. The six major industry groups covered in the
ocean economy dataset include Marine Construction, Living Marine Resources, Offshore Minerals, Ship and
Boat Building, Coastal Tourism and Recreation, and Marine Transportation. The data for ocean-dependent
activity within the Tourism and Recreation group reflect only business establishments within ZIP codes
adjacent to the coasts, such that the activity can be reasonably attributed to the proximity to the
waterfront.
The source for the NOEP Market data on establishments, employment, and wages is the Bureau of Labor
Statistics, Quarterly Census of Employment and Wages (QCEW), formerly known as ES-202 data, collected
and distributed by the U.S. Department of Commerce, Bureau of Labor Statistics (DOC-BLS). Gross Domestic
Product (GDP) data are acquired from the Bureau of Economic Analysis, which develops these estimates
from a number of sources. For details on the structure and methodologies of the NOEP datasets see Colgan
(2007). It should be noted that NOEP market data for the years 1990 to 2004 were generated by NOEP,
while data for 2004 through 2009 were generated by the National Oceanic and Atmospheric Administration
(NOAA), Coastal Services Center.
NOEP’s Marine Living Resources Database, includes data on landed value and weight of fish for top fishing
ports and species in coastal states, including the Great Lakes, by region, state, and port from 1981 through
2010. The Marine Ports and Cargo database provides access to information on value and weight of total
cargo and containerized cargo imports and exports moving through ports in all coastal states including the
Great Lakes from 1997 through 2011. Data on volume and value of crude oil, natural gas, and condensate
6

Table 1. Ocean economic sectors and classification within the North American Industry Classification System (NAICS) and IMPLAN
Sources: Colgan, Charles S. A Guide to the Measurement of the Market Data for the Ocean and Coastal Economy in the National Ocean Economics Program. National Ocean Economics Program, January 2007; MIG Inc., IMPLAN Sector descriptions and NAICS bridge for the 440 IMPLAN sector scheme.
Ocean Economy
Sector
Ocean Economy Industry name
NAICS Code
NAICS Industry Name (1997 NAICS)
IMPLAN Code IMPLAN Sector Name
Construction - Marine
Marine Related Construction
237120 Oil & Gas Pipeline & Related Struct. 36 Construction of other new nonresidential
structures 237990 Other Heavy & Civil Engin. Constr.
Living Resources - Marine
Fish Hatcheries & Aquaculture
112511 Finfish Farming & Fish Hatcheries 14 Animal production, except cattle, poultry,
eggs 112512 Shellfish Farming
Fishing 114111 Finfish Fishing
17 Fishing 114112 Shellfish Fishing
Seafood Processing 311711 Seafood Canning
61 Seafood product preparation & packaging 311712 Fresh & Frozen Seafood Processing
Seafood Markets 445220 Fish & Seafood Markets 324 Retail - Food & beverage
Minerals - Offshore
Limestone, Sand & Gravel 212321 Construction Sand & Gravel Mining
26 Sand, gravel, clay, & other min. mining 212322 Industrial Sand Mining
Oil & Gas Exploration and Production
211111 Petroleum & Natural Gas Extraction 20 Oil & gas extraction 213111 Drilling Oil & Gas Wells 28 Drilling oil & gas wells 213112 Support Activates for Oil & Gas Ops. 29 Support activities for oil & gas operations 541360 Geophysical Expl. & Mapping Serv. 369 Architectural, engineering, & related serv.
Ship & Boat Building & Repair
Boat Building & Repair 336612 Boat Building & Repair 291 Boat building
Ship Building & Repair 336611 Ship Building & Repair 290 Ship building & repairing
Tourism & Recreation Coastal
Boat Dealers 441222 Boat Dealers 320 Retail - Motor vehicle & parts
Eating & Drinking Places
722110 Full Service Restaurants
413 Food services & drinking places 722211 Limited Service Eating Places 722212 Cafeterias 722213 Snack & Nonalcoholic Beverage Bars
Hotels & Lodging Places 721110 Hotels & Motels 411 Hotels & motels, including casino hotels 721191 Bed & Breakfast Inns 412 Other accommodations
Marinas 713930 Marinas 409 Amusement parks, arcades, & gambling RV Parks & Campsites 721211 RV Parks & Recreational Camps 412 Other accommodations
Scenic Water Tours 487210 Scenic & Sightseeing Transp., Water 338 Scenic & sightseeing transp. & support act.
Sporting Goods Retailers 451110 Sporting Goods Stores 328 Retail Stores: Sporting goods
Amusement & Recreation Services
487990 Scenic & Sightseeing Transp., Other. 338 Scenic & sightseeing transp. & support act.
611620 Sports & Recreation Instruction 393 Other educational services 532292 Recreation Goods Rental 363 Gen. & cons. goods rental except video 713990 Other Amusement & Recreation Serv. 410 Other amusement & recreation industries
Zoos and Aquaria 712130 Zoos & Botanical Gardens
406 Museums, historical sites, zoos, & parks 712190 Nature Parks & Other Similar
Trans- portation - Marine
Deep Sea Freight Transportation
483111 Deep Sea Freight Transportation 334 Water transportation
483113 Coastal & Great Lakes Freight Transp.
Marine Passenger Transportation
483112 Deep Sea Passenger Transportation 334 Water transportation
483114 Coastal & Great Lakes Passenger Transp.
Marine Transportation Services
488310 Port & Harbor Operations
338 Scenic & sightseeing transportation & support activities
488320 Marine Cargo Handling 488330 Navigational Services to Shipping 488390 Other Support Act. for Water Transp.
Search & Nav. Equip. 334511 Search, Detection, Nav. Guidance, Aero. & Naut. System & Inst. Manuf. 249 Search, detection, & navigational
instrument manufacturing
Warehousing 493110 General Warehousing & Storage
340 Warehousing & storage 493120 Refrigerated Warehousing & Storage 493130 Farm Product Warehousing & Storage
7

oil production by region and state, from both state and federal off-shore oil and gas leases, are available for
years 1970 through 2010 in the NOEP Off-Shore Minerals Database.
Methodology
Ocean Economic Regions
Economic regions were devised for this analysis based primarily on the bodies of water bounding the
United States’ coastline (Atlantic Ocean, Pacific Ocean, Gulf of Mexico, Great Lakes), and were further
subdivided by geographic direction (north, south, east, and west) or by individual states sharing a coastline,
as shown in Figure 1. Table 2 shows the states comprising eleven coastal economic regions created for this
analysis. Note that parts of Florida, New York, Pennsylvania and Michigan were allocated to two different
regions based on coastal proximity. There were a total of 444 coastal counties included in the study. Maps
of counties included in each region are presented in Appendix B.
Figure 1. Map of coastal economic regions in the United States
8

Table 2. U.S. coastal regions for economic analysis of working waterfronts *
Region- State Region-State
Atlantic – North Gulf of Mexico – West Connecticut Louisiana Maine Texas Massachusetts Pacific – Hawaii New Hampshire Hawaii New York (Atlantic coast) Pacific – California Rhode Island California
Atlantic – Middle Pacific – Northwest Delaware Oregon Maryland Washington New Jersey Pacific – Alaska Pennsylvania (Atlantic coast) Alaska Virginia Great Lakes – West
Atlantic – South Illinois Florida (Atlantic coast) Indiana Georgia Michigan (Lake Superior, Michigan & Huron coasts) North Carolina Minnesota South Carolina Wisconsin
Gulf of Mexico – East Great Lakes – East Alabama Michigan (Lake Erie coast) Florida (Gulf coast) New York (Lake Erie and Ontario coasts) Mississippi Ohio
Pennsylvania (Lake Erie coast)
* When states have counties in two regions, the relevant coasts are given in parentheses.
Inventory of Working Waterfront Communities
To inventory the current status of the nation’s waterfront communities, ocean related economic activity
was evaluated in absolute terms and as a share of the total economy in coastal regions, states and counties,
using the NOEP Coastal and Ocean Economy data cross-tabulated for 2009 by location, and economic
sector or industry. The overall approach to identify counties and states that are important with respect to
ocean related coastal economies was to first evaluate the absolute and relative size of these sectors or
industries within the overall economy. Data disclosure or confidentiality issues were a significant
complicating factor in completing this part of the analysis. To protect confidentiality of individual
businesses, the BLS and BEA are required to suppress data whenever there are fewer than 4 observations
for a particular industry within a geographic unit. This was a significant issue at the county level, even at the
six sector level of aggregation for the ocean economy data set. Of a total of 2,664 Ocean Economy County-
level observations (six sectors for 444 counties) for 2009, only about 1,000, or 38 percent, were complete,
while another 38 percent had suppressed numbers for all economic indicators except the number of
9

establishments, and the remaining 630 observations (24 percent) were completely suppressed. To mitigate
the consequences of this data suppression for observations with only establishment data, the state-level
average employment, wages, and GDP per establishment were calculated for each of the six sectors within
the eleven economic regions, and then multiplied by the available establishment numbers to impute
specific values. For counties with no information disclosed on establishment, no assessment or impact
analysis was possible.
Analysis of Regional Economic Contributions
Estimating economic contributions or impacts requires data on direct economic activity of a specific type
and corresponding industry-sector economic multipliers that represent the secondary (indirect and
induced) impacts of that direct activity. For this analysis, the locations and time periods for the impact
analysis were determined by the data available on the NOEP website. The most recent data for ocean
related activity was 2009, and the geographic units for those data are the counties, states and regions
already discussed in the inventory section.
Regional economic multipliers for the eleven coastal regions in this study were developed using the IMPLAN
input-output analysis software (version 3) and county datasets for 2010 (MIG Inc.). The regions included all
counties within 50 miles of the coast, as shown in Appendix B. The IMPLAN models were constructed using
the Commodity Trade Flows methodology, with social accounts in the Social Accounting Matrix for
households, local/state and federal governments included endogenously. Economic multipliers from these
models capture the effects of industry input purchases: i.e. supply chain activity, known as “indirect”
effects, and the effects of employee household and business owner spending in the local economy for
personal consumption, known as “induced” effects. The total regional economic contribution represents
the sum of direct, indirect and induced effects. Economic multipliers were applied for employment (fulltime
and part-time jobs), wages (labor income, including employee compensation and business proprietor or
owner income), and Gross Domestic Product (value added). Ocean sector economic activity was assumed to
represent new final demand to the respective regions by virtue of proximity to the coastal resource. Total
value added multipliers for each coastal region and for IMPLAN sectors used in this analysis are summarized
in Table 3.
A complicating factor is that the six-sector, county-level Ocean Economy data is much more aggregated
than the 440 sector set of IMPLAN multipliers. Fortunately, the 23-industry state-level Ocean economy
dataset is quite similar to the IMPLAN multiplier scheme and a bridge-table between these schemes and
the North American Industry Classification Scheme (NAICS) is available in the NOEP “Data Guide” (Colgan
2007). Such a bridge table allows one to subdivide or disaggregate economic data to a more refined set of
economic sectors. An adapted version of Colgan’s bridge table is shown in Table 1. It includes an additional
10

bridge between the 23 sectors NAICS designations and the IMPLAN 440 sector scheme. By using these
bridge tables in conjunction with a procedure similar to that used to fill in missing data for the inventory
analysis, disaggregated industry data was imputed for coastal counties so that it could then be applied to
the IMPLAN multipliers to estimate county-level contributions of ocean industries. This was done by first
calculating the share comprised by each of the 23 Ocean industries for each coastal state’s economy in
2009, then these 23 industry state-level shares were applied to the six-sector county-level data to split or
disaggregate it into 23 industries, and finally the IMPLAN regional multipliers were applied to these
imputed county-level values to estimate ocean-industry contributions for each county.
Forecast of Economic Activity
The NOEP Ocean Economy database provided time-series data for the period 1990-2009 for number of
business establishments, employment, wages and GDP within coastal counties. Linear regression (ordinary
least squares-OLS) was used to estimate trends over this period and to predict future economic activity at
the county, state and regional levels. Historical wage and GDP values were adjusted to represent constant
2009 dollars using the GDP Implicit Price Deflator published by the U.S. Commerce Department, Bureau of
Economic Analysis (USDOC-BEA), in order to remove the effects of general inflation. Only time-series with 3
or more observations were considered valid for the analysis. The OLS regression analysis was carried out in
Microsoft Excel spreadsheets. It should be noted that data for county-level GDP was not available in the
Ocean Economy dataset for the period 1990-96.
11

Table 3. Value added multipliers for ocean economic activities in eleven U.S. coastal regions
Sector Number IMPLAN Sector Description Atlantic
North Atlantic Middle
Atlantic South
Gulf East
Gulf West
Pacific HI
Pacific CA
Pacific NW
Pacific AK
Great Lakes East
Great Lakes West
14 Animal production, except cattle & poultry & eggs 2.86 3.58 3.33 3.01 2.61 2.20 3.22 2.93 2.57 3.00 2.89
17 Commercial Fishing 3.06 4.45 4.31 3.61 3.41 2.59 3.63 2.75 2.94 5.14 4.78
26 Mining & quarrying sand, gravel, clay, etc. 3.18 3.78 3.43 2.85 2.66 1.98 3.37 3.06 2.92 3.23 3.01
28 Drilling oil & gas wells 4.54 2.91 3.99 2.39 1.96 0.00 2.48 2.27 2.08 2.34 2.29
29 Support activities for oil & gas operations 5.34 5.38 8.39 4.02 3.00 13.34 4.51 4.36 2.56 3.81 4.47
36 Construction of other new nonresidential structures 3.32 4.10 3.83 3.71 3.13 2.12 3.82 3.25 2.59 3.62 3.57
61 Seafood product preparation & packaging 5.96 7.29 7.79 6.69 5.84 5.32 7.18 5.08 4.41 4.83 5.78
249 Search, detection, & navigation instruments manufacturing 3.99 4.61 4.45 3.99 3.39 3.37 4.49 3.78 0.00 3.89 4.08
290 Ship building & repairing 3.50 4.46 3.97 3.56 3.13 2.20 4.29 3.24 2.89 4.17 3.65
291 Boat building 3.88 4.75 4.06 3.74 3.26 2.37 4.78 3.48 3.10 3.43 3.87
320 Retail Stores - Motor vehicle & parts 3.47 4.17 3.77 3.57 2.98 2.27 3.94 3.24 2.72 3.61 3.67
334 Transport by water 3.31 4.07 3.82 3.51 2.84 2.57 3.89 3.30 2.98 3.82 3.50
338 Scenic & sightseeing transp. & support act. for transp. 3.13 3.77 3.48 3.22 2.63 2.19 3.50 2.89 2.65 3.33 3.23
340 Warehousing & storage 3.05 3.71 3.38 3.19 2.65 2.13 3.39 2.84 2.53 3.10 3.10
393 Other private educational services 3.44 3.91 3.57 3.43 2.89 2.38 4.02 3.40 2.92 3.51 3.37
406 Museums, historical sites, zoos, & parks 3.26 4.18 3.72 3.50 2.79 2.39 3.60 3.16 2.75 3.42 3.34
409 Amusement parks, arcades, & gambling industries 3.21 3.87 3.28 3.13 2.59 2.19 3.45 2.89 2.59 3.19 3.08
410 Other amusement & recreation industries 3.03 3.73 3.25 3.06 2.61 2.11 3.37 2.90 2.61 3.14 3.10
411 Hotels & motels, including casino hotels 3.23 4.02 3.54 3.33 2.75 2.13 3.66 3.07 2.74 3.40 3.38
412 Other accommodations 3.49 4.22 3.89 3.91 2.93 2.24 3.96 3.48 2.68 3.67 3.66 Source: IMPLAN® Version 3.0, 2010, county and state-level data for the United States (MIG Inc., Hudson, WI, http://www.implan.com).
12

Results
Inventory of Economic Activity in Working Waterfront Communities
A summary of regional and state ocean-related economic data for the number of business establishments,
employment, wages and value-added (GDP) in 2009 is presented in Table 4. More detailed results for
individual counties are provided in Appendix Table A1, and data for GDP by economic sector in individual
counties are shown in Appendix Table A2. Results for regional ocean sector employment and GDP are
charted in Figures 2 and 3, and results for coastal states are charted in Figures 4 and 5. Maps of ocean-
related county-level GDP and employment in coastal regions are presented in Figures 6-19.
In 2009, there were over 130,000 ocean-related business establishments, with 2.398 million employees
(fulltime and part-time), who received $84.25 billion in wages, and generated $217.87 billion in Gross
Domestic Product for all coastal regions of the U.S. The western Gulf of Mexico region led the nation in
both ocean-related GDP, at more than $83.47 billion, and ocean-related wages of almost $19.93 billion that
year (Table 4 and Figure 3). This activity came predominantly from its minerals sector. The North Atlantic
region and the state of California led the nation in ocean-related employment at 439,633 and 426,744 jobs
respectively (Table 4 and Figure 2), but the North Atlantic hosted substantially more ocean related
establishments (30,955) than California (19,003). New York State was home to more than half of the ocean-
related economic activity in the North Atlantic region, and Texas dominated the western Gulf of Mexico
region.
The top individual states with respect to ocean-related economic activity were California with 19,003
establishments and 426,744 jobs (Figure 2 and 4), and Texas with $67.11 billion in GDP or value added
(Figure 5) and $15.75 billion in wages. The next largest states in terms of ocean GDP were California, Florida
(both coasts), and New York (both coasts) at $30.79, $18.54 and $17.99 billion respectively. Both coasts of
Florida combined had the second highest ocean-related employment in the nation at 316,773 jobs,
followed by New York at 293,674 jobs (Figure 4).
13

Table 4. Summary of ocean-related economic activity in 2009 for thirty coastal states within eleven U.S. coastal regions
Region – State Business Establishments
Employment (fulltime & part-time
jobs)
Wages (million $)
GDP (million $)
Atlantic - North 30,955 439,633 12,920 26,452 Connecticut 2,548 30,908 791 1,562 Maine 2,594 34,881 1,065 1,772 Massachusetts 5,079 77,135 2,536 4,596 New Hampshire 655 9,129 191 358 New York 18,160 259,504 7,684 16,839 Rhode Island 1,919 28,077 652 1,324 Atlantic - Middle 18,094 323,198 10,021 16,944 Delaware 927 16,275 359 663 Maryland 4,157 80,186 2,469 4,344 New Jersey 7,011 100,493 3,325 5,456 Pennsylvania 1,840 32,904 873 1,619 Virginia 4,159 93,340 2,995 4,862 Atlantic - South 14,512 258,729 6,190 14,310 Florida 8,706 146,960 4,058 9,644 Georgia 1,011 19,622 439 909 North Carolina 2,100 33,455 549 1,156 South Carolina 2,695 58,692 1,144 2,601 Gulf of Mexico - East 13,109 200,584 4,729 10,910 Alabama 950 18,244 514 1,508 Florida 11,294 169,813 3,993 8,893 Mississippi 865 12,527 221 509 Gulf of Mexico - West 8,255 237,968 19,928 83,476 Louisiana 3,207 80,719 4,177 16,367 Texas 5,048 157,249 15,751 67,109 Pacific - Hawaii 3,872 94,275 2,857 5,156 Hawaii 3,872 94,275 2,857 5,156 Pacific - California 19,003 426,744 15,394 30,795 California 19,003 426,744 15,394 30,795 Pacific - Northwest 6,878 119,783 4,714 9,899 Oregon 1,359 16,534 506 1,017 Washington 5,519 103,248 4,208 8,882 Pacific - Alaska 2,085 37,552 1,978 8,731 Alaska 2,085 37,552 1,978 8,731 Great Lakes - West 8,457 167,728 3,741 7,819 Illinois 2,471 76,658 2,201 4,731 Indiana 435 7,485 140 257 Michigan 3,364 44,877 774 1,572 Minnesota 301 5,434 83 176 Wisconsin 1,886 33,274 543 1,083 Great Lakes - East 5,665 92,062 1,774 3,378 Michigan 946 17,469 449 781 New York 2,511 34,170 568 1,150 Ohio 1,999 37,605 714 1,358 Pennsylvania 209 2,817 43 89 Grand Total 130,885 2,398,255 84,246 217,870
Source: National Ocean Economics Program, Ocean Economy Dataset.
14

Figure 2. Ocean-related employment in U.S. coastal regions in 2009
Source: NOEP, Ocean Economy County Data with missing values imputed
Figure 3. Ocean-related Gross Domestic Product in U.S. coastal regions in 2009
0 10 20 30 40 50 60 70 80 90
Atlantic - North
Atlantic - Middle
Atlantic - South
Gulf of Mexico - East
Gulf of Mexico - West
Pacific - Hawaii
Pacific - California
Pacific - Northwest
Pacific - Alaska
Great Lakes - West
Great Lakes - East
GDP Billion $
0 100 200 300 400 500
Atlantic - North
Atlantic - Middle
Atlantic - South
Gulf of Mexico - East
Gulf of Mexico - West
Pacific - Hawaii
Pacific - California
Pacific - Northwest
Pacific - Alaska
Great Lakes - West
Great Lakes - East
1,000 Jobs
15

Figure 4. Ocean-related employment in U.S. coastal states in 2009
Source: NOEP, Ocean Economy County Data with missing values imputed
0 100 200 300 400 500
AlabamaAlaska
CaliforniaConnecticut
DelawareFlorida - East
Florida - WestGeorgiaHawaiiIllinois
IndianaLouisiana
MaineMaryland
MassachusettsMichigan - East
Michigan - WestMinnesotaMississippi
New HampshireNew Jersey
New York - EastNew York - West
North CarolinaOhio
OregonPennsylvania - East
Pennsylvania - WestRhode Island
South CarolinaTexas
VirginiaWashington
Wisconsin
1,000 Jobs
16

Figure 5. Ocean-related Gross Domestic Product in Coastal Counties of U.S. Coastal States in 2009
Source: NOEP, Ocean Economy County Data with missing values imputed
0 10 20 30 40 50 60 70
AlabamaAlaska
CaliforniaConnecticut
DelawareFlorida - East
Florida - WestGeorgiaHawaiiIllinois
IndianaLouisiana
MaineMaryland
MassachusettsMichigan - East
Michigan - WestMinnesotaMississippi
New HampshireNew Jersey
New York - EastNew York - West
North CarolinaOhio
OregonPennsylvania - East
Pennsylvania - WestRhode Island
South CarolinaTexas
VirginiaWashington
Wisconsin
GDP Billion $
17

Figure 6. Map of ocean-related GDP in counties of the north and middle Atlantic coastal regions in 2009
Figure 7. Map of ocean-related employment in counties of the north and middle Atlantic coastal regions in 2009
18

Figure 8. Map of ocean-related GDP in counties of the south Atlantic coastal region in 2009
Figure 9. Map of ocean-related employment in counties of the south Atlantic coastal region in 2009
19

Figure 10. Map of ocean-related GDP in counties of the Gulf of Mexico coastal region in 2009
Figure 11. Map of ocean-related employment in counties of the Gulf of Mexico coastal region in 2009
20

Figure 12. Map of ocean-related GDP in counties of the Pacific coastal region in 2009
Figure 13. Map of ocean-related employment in counties of the Pacific coastal region in 2009
21

Figure 14. Map of ocean-related GDP in counties of the Great Lakes coastal region in 2009
Figure 15. Map of ocean-related employment in counties of the Great Lakes coastal region in 2009
22

Figure 16. Map of ocean-related GDP in counties of the Alaska coastal region in 2009
Figure 17. Map of ocean-related employment in counties of the Alaska coastal region in 2009
23

Figure 18. Map of ocean-related GDP in counties of the Hawaii coastal region in 2009
Figure 19. Map of ocean-related employment in counties of the Hawaii coastal region in 2009
24
Ocean-Related Share of Coastal Economies
A way to evaluate the importance of the ocean economy for waterfront communities is in terms of the relative share of ocean activity to the overall coastal economy GDP or employment. The ocean sector share of total coastal county GDP and employment by state/region is presented in Figures 20 and 21, respectively. Maps of county-level share of ocean-related GDP and employment are presented in Figures 22-35. Alaska and Texas are essentially tied the largest ocean sector share of GDP in their respective coastal economies of around 18 percent, followed closely by Louisiana at 17.2 percent (Figure 20). In all three of these states, the off-shore minerals industries are significant and represent more than 72 percent of their ocean economic activity. The minerals industry in Alabama represents the largest component in its ocean economy, but is relatively small in comparison to the leading states. Alabama also has significant activity in ship and boat building, tourism and recreation, and transportation industries. In contrast, tourism and recreation are the dominant ocean industries in Georgia, Hawaii, Maine, and South Carolina. Along with Alabama, these comprise the second tier of states where the ocean economic sectors make up between four and eight percent of the total economic activity in their coastal counties. Note that imputed values were not substituted for suppressed data in the ocean economy share analysis.
A somewhat different picture is painted by the share of ocean-related industry employment (jobs) by state/region in 2009 (Figure 21). By this measure, ocean-related industries were most important in Hawaii, South Carolina, and Alaska, where they comprised 16.3, 14.7 and 13.6 percent respectively of the total employment in their coastal counties. States where ocean-related activities constituted between eight and twelve percent of coastal county employment included: Alabama, Georgia, Louisiana, Maine, Mississippi, and North Carolina. A notable difference among states between the ocean sector share of GDP and employment is that more than 50 percent of the jobs were in the tourism and recreation industries, with the exception of Texas and Louisiana. Since many tourism and recreational enterprises are service oriented, and thus more labor intensive, this is not surprising. In contrast, the minerals industry tends to be more capital intensive and have relatively fewer employees per dollar of output.
The top 50 U.S. coastal counties in terms of the share of total GDP, employment, wages attributed to ocean sectors in 2009 are shown in Table 5, in rank order by GDP share. Eleven of these top 50 counties are in the western Gulf of Mexico region and seven are in Alaska, reinforcing the significance of the off-shore minerals industry for working waterfront communities given the prevalence of these types of industries in these two regions. It should be noted that the overall economies of some of these top 50 counties are relatively small, including 22 counties with GDPs of less than $1 billion. As with the pattern of employment shares for coastal states, the top counties for ocean related employment, such as Bristol Bay and Aleutians West, Alaska, tend to have significant tourism and minerals industries.
25

Figure 20. Ocean-related share of Gross Domestic Product in U.S. coastal states in 2009
Source: NOPEP, Ocean and Coastal Economy datasets, County Data
0% 2% 4% 6% 8% 10% 12% 14% 16% 18% 20%
AlabamaAlaska
CaliforniaConnecticut
DelawareFlorida-Atlantic
Florida-GulfGeorgiaHawaiiIllinois
IndianaLouisiana
MaineMaryland
MassachusettsMichigan-WestMichigan-East
MinnesotaMississippi
New HampshireNew Jersey
New York-AtlanticNew York-Lakes
North CarolinaOhio
OregonPennsylvania East
Pennsylvania WestRhode Island
South CarolinaTexas
VirginiaWashington
Wisconsin
26

Figure 21. Ocean-related share of employment in U.S. coastal states in 2009
Source: NOPEP, Ocean and Coastal Economy datasets, County Data
0% 2% 4% 6% 8% 10% 12% 14% 16% 18%
AlabamaAlaska
CaliforniaConnecticut
DelawareFlorida-Atlantic
Florida-GulfGeorgiaHawaiiIllinois
IndianaLouisiana
MaineMaryland
MassachusettsMichigan-WestMichigan-East
MinnesotaMississippi
New HampshireNew Jersey
New York-AtlanticNew York-Lakes
North CarolinaOhio
OregonPennsylvania East
Pennsylvania WestRhode Island
South CarolinaTexas
VirginiaWashington
Wisconsin
Ocean Sector Share of Employment
27

Table 5. Summary of GDP and share of ocean-related employment, wages, and GDP in 2009 for the top 50 U.S. coastal counties
Rank Region State County GDP (Million $)
Share Employment
Share Wages
Share GDP
1 Gulf of Mexico – West Louisiana Vermilion 1,629 13.7% 17.8% 58.8% 2 Gulf of Mexico – West Louisiana Plaquemines 2,574 19.2% 20.8% 43.2% 3 Great Lakes – West Michigan Keweenaw 14 60.2% 50.7% 42.3% 4 Pacific – Alaska Alaska Bristol Bay 163 70.0% 61.7% 34.3% 5 Gulf of Mexico – West Texas Refugio 186 23.2% 27.0% 31.7% 6 Gulf of Mexico – West Louisiana Lafourche 4,585 13.2% 22.1% 29.3% 7 Gulf of Mexico – West Louisiana Orleans 22,955 12.8% 11.7% 28.5% 8 Pacific – Alaska Alaska Aleutians West 521 62.9% 52.3% 27.4% 9 Gulf of Mexico – West Louisiana Cameron 396 3.0% 5.4% 26.4%
10 Pacific – Alaska Alaska Kenai Peninsula 2,315 14.2% 11.4% 25.6% 11 Great Lakes – West Michigan Mackinac 271 29.0% 23.7% 23.6% 12 Pacific – Alaska Alaska Anchorage 22,031 11.4% 11.7% 23.6% 13 Gulf of Mexico – West Texas Harris 291,828 5.4% 12.0% 20.9% 14 Atlantic – Middle Maryland Worcester 1,501 29.4% 19.9% 20.1% 15 Pacific – Hawaii Hawaii Kauai 2,059 42.6% 29.6% 18.9% 16 Gulf of Mexico – East Florida Monroe 3,245 29.9% 21.1% 18.5% 17 Pacific – Hawaii Hawaii Maui 6,332 26.1% 21.9% 18.5% 18 Pacific – Northwest Washington Kitsap 8,477 12.5% 22.2% 18.4% 19 Atlantic – Middle Virginia Westmoreland 248 14.3% 9.3% 17.9% 20 Gulf of Mexico – West Louisiana Iberia 4,571 17.0% 20.2% 15.7% 21 Great Lakes – West Minnesota Cook 172 28.2% 16.9% 15.0% 22 Atlantic – Middle Virginia Portsmouth City 4,630 20.5% 30.8% 14.9% 23 Gulf of Mexico – West Texas Aransas 395 20.5% 17.4% 14.8% 24 Atlantic – South Georgia McIntosh 82 18.9% 11.4% 14.7% 25 Gulf of Mexico – West Louisiana Terrebonne 7,961 19.1% 21.9% 14.7% 26 Pacific – Alaska Alaska North Slope 6,606 43.3% 48.9% 14.5% 27 Atlantic – North Massachusetts Nantucket 429 24.5% 16.2% 14.2% 28 Pacific – Alaska Alaska Yakutat 16 27.6% 23.1% 14.2% 29 Atlantic – North Maine York 5,057 17.4% 19.9% 13.5% 30 Gulf of Mexico – East Florida Walton 1,427 19.4% 15.2% 12.9% 31 Atlantic – North Massachusetts Dukes 636 18.9% 13.0% 12.7% 32 Atlantic – South South Carolina Horry 7,234 21.2% 13.8% 12.3% 33 Atlantic – Middle New Jersey Cape May 2,944 22.0% 13.6% 12.1% 34 Pacific – Northwest Washington San Juan 392 16.5% 10.7% 11.2% 35 Atlantic – Middle Maryland Queen Anne's 842 18.1% 10.9% 11.1% 36 Atlantic – South North Carolina Hyde 180 17.6% 11.1% 10.9% 37 Atlantic – South Florida Nassau 1,442 20.2% 12.3% 10.9% 38 Pacific – Hawaii Hawaii Hawaii 5,931 17.6% 13.2% 10.6% 39 Pacific – Northwest Washington Pacific 441 15.2% 9.9% 9.9% 40 Atlantic – Middle Virginia Lancaster 306 13.8% 7.9% 9.8% 41 Atlantic – South North Carolina Dare 1,725 21.5% 15.8% 9.5% 42 Atlantic – North Massachusetts Barnstable 6,860 16.1% 9.5% 9.4% 43 Pacific – Northwest Oregon Lincoln 1,199 21.6% 12.7% 9.4% 44 Pacific – Alaska Alaska Valdez-Cordova 617 21.5% 12.9% 9.1% 45 Atlantic – North Maine Hancock 1,503 14.5% 9.9% 9.1% 46 Great Lakes – West Wisconsin Door 814 17.5% 9.8% 8.9% 47 Gulf of Mexico – East Florida Franklin 268 22.5% 13.9% 8.9% 48 Atlantic – South Georgia Glynn 3,025 17.6% 9.7% 8.5% 49 Gulf of Mexico – West Texas Nueces 13,266 9.0% 6.7% 8.3% 50 Gulf of Mexico – East Alabama Mobile 14,998 6.7% 6.0% 8.2%
28

Figure 22. Map of ocean-related share of GDP in counties of the north and middle Atlantic coastal regions in 2009
Figure 23. Map of ocean-related share of employment in counties of the north and middle Atlantic coastal regions in 2009
29
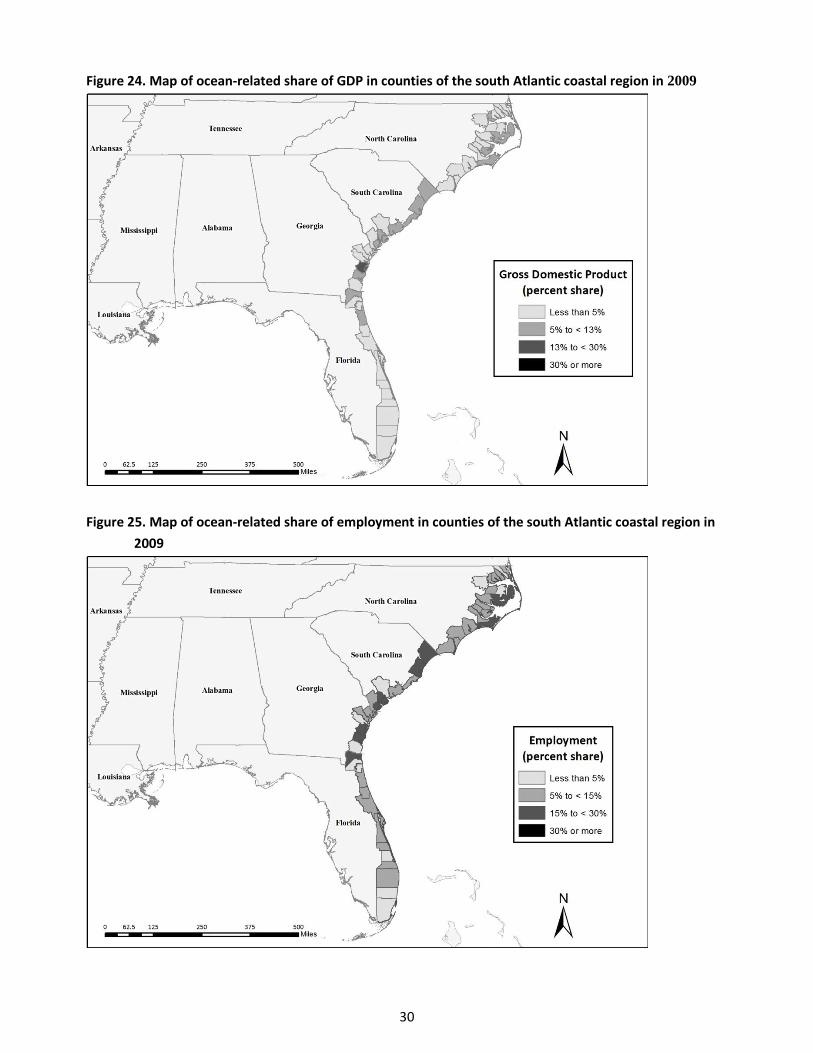
Figure 24. Map of ocean-related share of GDP in counties of the south Atlantic coastal region in 2009
Figure 25. Map of ocean-related share of employment in counties of the south Atlantic coastal region in 2009
30

Figure 26. Map of ocean-related share of GDP in counties of the Gulf of Mexico coastal region in 2009
Figure 27. Map of ocean-related share of employment in counties of the Gulf of Mexico coastal region in 2009
31

Figure 28. Map of ocean-related share of GDP in counties of the Pacific coastal region in 2009
Figure 29. Map of ocean-related share of employment in counties of the Pacific coastal region in 2009
32

Figure 30. Map of ocean-related share of GDP in counties of the Great Lakes coastal region in 2009
Figure 31. Map of ocean-related share of employment in counties of the Great Lakes coastal region in 2009
33

Figure 32. Map of ocean-related share of GDP in counties of the Alaska coastal region in 2009
Figure 33. Map of ocean-related share of employment in counties of the Alaska coastal region in 2009
34

Figure 34. Map of ocean-related share of GDP in counties of the Hawaii coastal region in 2009
Figure 35. Map of ocean-related share of employment in counties of the Hawaii coastal region in 2009
35

Regional Economic Contributions
The total regional economic contributions or impacts, including indirect/induced multiplier effects, from
ocean-related activities in coastal counties were estimated using regional multipliers, as discussed in the
Methods section. Results for employment (jobs), wages, and value-added (GDP) contributions for regions
and states are summarized in Table 6 and Figures 36 and 37 for regions, and, Table 7 and Figures 38 and 39
for states.
The total estimated contributions of ocean industries in coastal counties across the U.S. in 2009 included
6.74 million jobs, $283.5 billion in wages, and $643.9 billion in value-added or GDP. These total
contributions to employment, wages and GDP for the ocean economy represent implied multiplier effects
of 2.81, 3.37, and 3.02, respectively. In other words, the total economic contributions are 2.8 to 3.4 times
greater than the direct contributions. Nationally, the economic contributions of the ocean-related sectors
averaged 15,181 jobs, $639 million in wages, and $1.45 billion in GDP per county among the 444 counties in
the study, and wage contributions averaged around $42,000 per job. However, ocean economy impacts
varied considerably across regions, with the largest regions having contributions up to 17 times greater
than the smallest. In terms of jobs, the western Gulf of Mexico, California, and the mid-Atlantic were the
largest three regions in the nation’s ocean economy, together accounting for 58 percent of total
employment, 66 percent of total wages and 67 percent of total GDP contributions (Figures 36 and 37).
The top 5 states in terms of ocean-related GDP contribution were Texas ($154.5 billion), California ($115.1
billion), Florida ($64.4 billion), New York ($58.7 billion), and Louisiana ($36.2 billion) as shown in Figure 38
and Table 7. With respect to ocean-related employment contributions, the largest state was California
(1,340,131 jobs), followed by Florida (914,482 jobs), Texas (817,556 jobs) New York (622,057 jobs) and New
Jersey (289,698 jobs) (Table7). The difference in rankings among states in terms of GDP and job
contributions is due to the significant value-added revenues generated by off-shore minerals industries,
and the large job contributions generated by tourism and recreation industries.
The 50 counties generating the largest ocean related economic contributions are shown in Table 8. Unlike
the 50 counties whose economies had the largest share of ocean related activity relative to their overall
economies, the top 50 counties in absolute ocean related activities are comprised mostly of large urban
population centers, such as Houston, Texas ($139.5 billion GDP), New York, New York ($38.5 billion GDP),
and Los Angeles, California ($37.6 billion GDP). Regionally, California and the western Gulf of Mexico had
the most counties (9) in this top 50 GDP ranking, followed closely by the middle Atlantic, with eight. These
top counties, besides being large coastal cities that draw industry and visitors, also tend to have bigger
economic multipliers, which help generate larger economic contributions. Appendix Table A3 provides
detailed GDP contributions at the Region, State, and County level for the six NOEP ocean sectors.
36

Figure 36. Ocean-related total GDP contributions in U.S. coastal regions in 2009
Figure 37. Ocean-related total employment contributions in U.S. coastal regions in 2009
0 200 400 600 800 1,000 1,200 1,400
Atlantic - North
Atlantic - Middle
Atlantic - South
Gulf of Mexico - East
Gulf of Mexico - West
Pacific - Hawaii
Pacific - California
Pacific - Northwest
Pacific - Alaska
Great - Lakes - West
Great - Lakes - East
1,000 Job contributions
37
$0 $25 $50 $75 $100 $125 $150 $175 $200
Atlantic - North
Atlantic - Middle
Atlantic - South
Gulf of Mexico - East
Gulf of Mexico - West
Pacific - Hawaii
Pacific - California
Pacific - Northwest
Pacific - Alaska
Great - Lakes - West
Great - Lakes - East
GDP Contributions in $ Billions

Table 6. Summary of total economic contributions of ocean-related industries in U.S. coastal regions in 2009
Region Employment
(fulltime & part-time Jobs)
Wages (Million $)
GDP (Million $)
Atlantic - North 926,622 46,019 84,670 Atlantic - Middle 946,110 36,675 66,650 Atlantic - South 733,935 22,002 52,063 Gulf of Mexico - East 518,687 15,321 32,989 Gulf of Mexico - West 1,066,374 66,401 190,730 Pacific - Hawaii 164,200 5,205 10,973 Pacific - California 1,340,131 54,062 115,149 Pacific - Northwest 314,387 13,150 31,454 Pacific - Alaska 123,177 5,120 21,378 Great - Lakes - West 387,216 13,549 26,105 Great - Lakes - East 219,397 6,002 11,724 Grand Total 6,740,236 283,506 643,885
Source: NOEP Ocean economy county data and IMPLAN regional multipliers.
38

Table 7. Summary of total economic contributions of ocean-related industries in U.S. coastal states in 2009 *
State
Employment (fulltime and
part-time Jobs) Wages
(Million $) GDP
(Million $) Alabama 48,661 1,423 3,276 Alaska 123,177 5,120 21,378 California 1,340,131 54,062 115,149 Connecticut 64,243 2,263 4,854 Delaware 34,388 1,131 2,399 Florida 914,482 28,121 64,455 Georgia 45,948 1,644 3,133 Hawaii 164,200 5,205 10,973 Illinois 193,398 7,638 15,883 Indiana 15,648 402 815 Louisiana 248,818 10,979 36,187 Maine 59,819 1,825 3,911 Maryland 245,231 9,322 18,280 Massachusetts 185,119 11,103 16,195 Michigan 139,457 5,049 8,132 Minnesota 11,454 230 516 Mississippi 25,359 549 1,165 New Hampshire 18,304 2,008 1,091 New Jersey 289,698 10,910 19,501 New York 622,057 29,198 58,727 North Carolina 73,038 1,655 3,787 Ohio 92,059 2,386 4,662 Oregon 38,549 1,354 3,031 Pennsylvania 102,375 3,458 6,478 Rhode Island 54,184 1,657 3,849 South Carolina 145,135 3,931 9,236 Texas 817,556 55,423 154,543 Virginia 281,180 12,026 20,289 Washington 275,838 11,796 28,423 Wisconsin 70,730 1,636 3,566 Grand Total 6,740,236 283,506 643,885
* Note that estimated contributions for Florida, Michigan, New York and Pennsylvania represent combined totals from two different regions.
39

Figure 38. Ocean-related total GDP contributions in U.S. coastal states in 2009
$0 $20 $40 $60 $80 $100 $120 $140 $160
AlabamaAlaska
CaliforniaConnecticut
DelawareFlorida
GeorgiaHawaiiIllinois
IndianaLouisiana
MaineMaryland
MassachusettsMichigan
MinnesotaMississippi
New HampshireNew Jersey
New YorkNorth Carolina
OhioOregon
PennsylvaniaRhode Island
South CarolinaTexas
VirginiaWashington
Wisconsin
$ Billion in Value Added (GDP) contributions
40

Figure 39. Ocean-related total employment contributions in U.S. coastal states in 2009
0 200 400 600 800 1,000 1,200 1,400
AlabamaAlaska
CaliforniaConnecticut
DelawareFlorida
GeorgiaHawaiiIllinois
IndianaLouisiana
MaineMaryland
MassachusettsMichigan
MinnesotaMississippi
New HampshireNew Jersey
New YorkNorth Carolina
OhioOregon
PennsylvaniaRhode Island
South CarolinaTexas
VirginiaWashington
Wisconsin
1,000 jobs in economic contributions
41

Table 8. Top 50 U.S. counties by GDP ocean-related economy contribution in 2009
Region State County Employment (Jobs)
Wages (Million $)
GDP (Million $)
Gulf of Mexico - West Texas Harris 661,379 49,354 139,514 Atlantic – North New York New York 305,104 16,481 38,463 Pacific - California California Los Angeles 381,761 17,333 37,626 Pacific - California California San Diego 216,897 8,840 19,254 Gulf of Mexico - West Louisiana Orleans 60,809 3,001 15,281 Great Lakes - East Illinois Cook 178,672 7,052 14,744 Pacific - California California Orange 160,639 6,562 13,688 Pacific – Alaska Alaska Anchorage 40,786 2,029 12,233 Pacific - California California San Francisco 116,201 5,476 11,510 Pacific - Northwest Washington King 104,156 4,643 10,784 Atlantic – South Florida Miami-Dade 87,725 3,381 10,566 Gulf of Mexico - East Florida Pinellas 89,976 2,844 6,147 Atlantic – South Florida Broward 81,328 2,730 6,066 Pacific - California California Alameda 79,249 2,699 6,061 Pacific – Hawaii Hawaii Honolulu 98,550 2,878 5,928 Atlantic – South Florida Palm Beach 73,624 2,472 5,572 Pacific - Northwest Washington Kitsap 36,288 2,071 5,456 Atlantic - Middle Pennsylvania Philadelphia 80,070 2,792 5,403 Gulf of Mexico - West Texas Victoria 24,293 1,709 5,111 Atlantic – North New York Suffolk 58,954 2,832 4,839 Atlantic - Middle Maryland Anne Arundel 60,382 2,561 4,631 Atlantic – North Massachusetts Middlesex 34,966 2,419 4,351 Gulf of Mexico - East Florida Hillsborough 57,277 1,906 4,071 Atlantic – South Florida Duval 65,375 1,815 4,022 Pacific - California California San Mateo 53,585 1,950 3,983 Atlantic – South South Carolina Charleston 58,857 1,646 3,804 Atlantic - Middle Maryland Baltimore City 43,392 1,690 3,708 Atlantic - Middle New Jersey Hudson 55,843 1,839 3,647 Pacific - California California Santa Barbara 41,555 1,641 3,488 Gulf of Mexico - West Louisiana Lafourche 20,030 1,037 3,362 Atlantic - Middle Virginia Norfolk 26,991 1,400 3,312 Atlantic - Middle Virginia Virginia Beach 55,194 1,821 3,296 Atlantic – North Massachusetts Suffolk 34,644 1,730 3,241 Pacific - California California Santa Clara 32,030 1,514 3,205 Atlantic – South South Carolina Horry 50,249 1,296 3,141 Atlantic - Middle Virginia Portsmouth 38,384 2,031 3,071 Gulf of Mexico - West Louisiana St. Mary 16,202 1,035 2,877 Gulf of Mexico - West Texas Nueces 40,603 1,297 2,864 Gulf of Mexico - West Louisiana Terrebonne 44,137 1,674 2,800 Pacific - Hawaii Hawaii Maui 32,451 1,218 2,640 Atlantic – North New York Kings 35,463 1,227 2,578 Gulf of Mexico - West Louisiana Plaquemines 9,277 428 2,573 Atlantic - Middle New Jersey Middlesex 43,106 1,408 2,550 Pacific - California California Monterey 30,809 1,225 2,539 Gulf of Mexico - East Alabama Mobile 32,662 1,035 2,495 Pacific - Northwest Washington Skagit 19,939 948 2,459 Atlantic – North Connecticut Fairfield 25,780 1,071 2,399 Gulf of Mexico - West Louisiana Vermilion 7,614 346 2,344 Gulf of Mexico - East Florida Lee 35,237 1,040 2,297 Pacific - Northwest Washington Whatcom 23,502 903 2,288
Note that Florida, New York, and Michigan have counties in two different coastal regions.
Trends and Forecast of Ocean Sector Gross Domestic Product
Statistical forecasts of future ocean-related economic activity in 2020 were estimated using ordinary least
squares regression on historical county-level GDP data for the six ocean sectors available from the NOEP for
42

1997 to 2009, as described in the Methods section. There were 444 coastal counties in the NOEP dataset,
with six sectors per county, giving a possible total of 2,658 forecasting regressions. Additional regressions
were run on the sum of the sector values for each county, and likewise, on the sum of county values for
each state, and state values for each region, which added another 485 regressions, or 3,143 in total. To
perform the simplest linear OLS regression, a minimum of three observations is required. Numerous
county-sector data series were partially or entirely suppressed and this left 1,666 potential data series to
evaluate. Results are shown for regressions with non-zero slope coefficients, which were statistically
significant at the probability (p-value) level of 0.05 or less. This left approximately one-fourth of the county-
sector combinations. Summaries of these results are provided in Tables 9 through 13. The complete
forecast results for all individual economic sectors and counties are provided in Appendix Table A4.
The number or count of county-sector combinations within each state and region that had statistically
significant slope coefficients, either positive or negative, for the regressions of GDP over time are shown in
Table 9, arranged by sectors in columns and by geographic area in rows. The numbers in the table cells
represent the number of county-sectors that had significant positive or negative regression slope
coefficients. Positive slope coefficients indicate an upward trend in sector activity over time, while negative
coefficients indicate a downward trend over time. The numbers in the “net” columns in Table 9 represent
the number of positive coefficients minus the number of negative coefficients. For example, the state of
New York in the Atlantic–North region, for the Living Resources sector, there was one county that had a
significant positive slope coefficient, and four counties that had significant negative slope coefficients, so
the net difference in this case was minus three (-3). Using the net values allows one to see how individual
sectors are changing across states and regions, or how states and regions are doing across sectors.
Numbers shown in the regional rows in Table 9 are the sum of the individual state numbers in that region,
and the grand total row at the bottom equals the sum of all state counts for each sector. For the Living
Resources sector, there were 12 significant county-sector regressions for all geographic units that trended
significantly upward, while 60 county-sector regressions trended downward, resulting in a net of minus 48
county-sectors. For the Tourism and Recreation sector, there were 155 positive coefficients and 41 negative
coefficients, giving a net of +114 county-sectors. Totals in the far right column of Table 9 sum the values
across economic sectors for each region and state. For example, one can see that Maryland had 19 positive
and 7 negative county-sector coefficients. States with the largest number of positive net change predictions
included Massachusetts, Maryland, Florida (Gulf coast), Texas, California, and Washington. States with the
largest negative net predictions included Pennsylvania, Florida (Atlantic coast), Alaska, and Michigan.
Counts of significant regressions that predict increases or decreases in ocean-related county sectors
between 2009 and 2020 in excess of 50 percent are presented in Table 10. Over 70 percent of the
43

statistically significant regressions generated predictions of this magnitude, with a slight majority (52%) of
these larger predictions being negative. Again, the sectors with the most negative net predictions were
Living Resources and Transportation, while Tourism and Recreation, and Minerals had the most positive
predicted changes of 50 percent or more. States with larger positive net predictions included
Massachusetts, Maryland, the Gulf side of Florida, and Louisiana, while states with larger negative
predictions included New Jersey, Virginia, the Atlantic side of Florida, Alaska, and the east side of Michigan.
The top 50 coastal county-sectors with the highest positive predicted percentage changes between 2009
and 2020 are shown in Table 11. The top five county-sectors are Chowan, North Carolina-Ship and Boat
Building (500%), Cecil, Maryland-Transportation (263%), Mendocino, California-Transportation (243%),
Dare, North Carolina-Ship and Boat Building (232%) and, Saginaw, Michigan-Tourism and Recreation
(202%). It should be noted that these five county-sector changes are much smaller in absolute terms than
other county-sectors with smaller percentage changes, such as Anchorage, Alaska, Orleans, Louisiana, and
Harris, Texas (Table 11).
In Table 12, the 50 county-sectors with the largest predicted negative percent changes in GDP by 2020 are
listed. These top 50 negative percentage changes all resulted in negative predicted values for 2020. In order
to identify counties where waterfront communities may be threatened, these negative predicted values
were used to rank county-sectors in terms of negative percentage change; however, in Tables 13 and A4,
negative predictions were truncated at zero. The five county-sectors forecast to experience the largest
negative change in GDP by 2020 include Living Resources in Arlington, Virginia, Ship and Boat Building in
San Patricio, Texas, Living Resources in Northumberland, Virginia, Transportation in Aleutians West, Alaska,
and Marine Construction in Cheboygan, Michigan (Table 12). It should be noted that all of the 50 county-
sectors with the largest negative predicted changes were relatively small in absolute terms (less than $25
million) in 2009 and are predicted to disappear by the year 2020.
Trends and forecasts of ocean economic activity for regions and states using aggregated county level time
series are shown in Table 13. Forecasts are shown only for regressions that were statistically significant (P-
values of 0.05 or less). About half of the regressions produced statistically significant slope coefficients. The
largest predicted positive significant changes in percentage terms are shown to occur for Alaska, Texas, and
Florida (Atlantic and Gulf coasts). The sole negative predicted change at the state level occurs in Hawaii.
These results do not correlate well with county-sector level regressions; it is suspected that these results
may not be reliable due to suppressed data at the county level.
44

Table 9. Summary of county level ocean-related sector GDP change predictions, positive or negative, 2009-20, by U.S. coastal region and state
Region - State Construction Living Resources Minerals Ship & Boat Building Tourism &
Recreation Transportation Total All Sectors
Pos. Neg. Net Pos. Neg. Net Pos. Neg. Net Pos. Neg. Net Pos. Neg. Net Pos. Neg. Net Pos. Neg. Net Atlantic – North 4 3 1 6 8 -2 3 -3 1 4 -3 22 2 20 4 3 1 37 23 14
Connecticut 1 -1 1 1 1 -1 1 2 -1 Maine 2 -2 4 -4 5 5 1 1 6 6 0 Massachusetts 1 1 0 4 4 6 6 1 1 12 1 11 New Hampshire 1 1 1 1 New York 3 2 1 1 4 -3 3 -3 1 1 6 2 4 1 2 -1 12 13 -1 Rhode Island 1 1 0 4 4 5 1 4
Atlantic - Middle 4 5 -1 15 -15 1 -1 2 -2 38 1 37 11 12 -1 53 36 17 Delaware 3 3 1 1 4 4 Maryland 3 3 4 -4 11 11 5 3 2 19 7 12 New Jersey 1 2 -1 4 -4 1 -1 7 1 6 3 3 0 11 11 0 Pennsylvania 1 -1 2 -2 1 -1 1 1 2 1 1 3 5 -2 Virginia 2 -2 5 -5 1 -1 16 16 5 -5 16 13 3
Atlantic – South 7 2 5 11 -11 2 -2 3 3 17 2 15 4 7 -3 31 24 7 Florida 3 3 4 -4 2 -2 2 2 2 3 -1 7 9 -2 Georgia 1 -1 3 1 2 1 1 4 2 2 North Carolina 3 3 5 -5 2 2 7 1 6 2 -2 12 8 4 South Carolina 1 1 0 2 -2 1 1 5 5 1 2 -1 8 5 3
Gulf of Mexico - East 2 4 -2 1 4 -3 3 1 2 12 1 11 3 4 -1 21 14 7 Alabama 1 -1 1 -1 1 1 1 1 0 2 3 -1 Florida 2 3 -1 1 3 -2 2 1 1 9 9 3 2 1 17 9 8 Mississippi 2 2 2 -2 2 2 0
Gulf of Mexico - West 7 7 3 -3 8 1 7 2 3 -1 8 8 0 6 1 5 31 16 15 Louisiana 3 3 1 -1 4 1 3 1 2 -1 3 3 0 2 1 1 13 8 5 Texas 4 4 2 -2 4 4 1 1 0 5 5 0 4 4 18 8 10
Pacific – Hawaii 1 1 1 2 -1 1 1 1 1 4 2 2 Pacific - California 7 3 4 6 -6 1 2 -1 2 2 12 12 8 8 0 30 19 11 Pacific - Northwest 3 1 2 3 7 -4 2 2 3 3 10 4 6 1 1 0 22 13 9
Oregon 2 2 1 4 -3 4 1 3 1 -1 7 6 1 Washington 1 1 0 2 3 -1 2 2 3 3 6 3 3 1 1 15 7 8
Pacific – Alaska 1 1 1 2 -1 2 2 5 8 -3 3 -3 9 13 -4 Great Lakes - East 4 -4 2 -2 2 2 10 2 8 7 4 3 19 12 7
Michigan 1 -1 1 -1 1 1 1 2 -1 2 4 -2 New York 2 -2 1 1 4 1 3 3 1 2 8 4 4 Ohio 1 -1 1 -1 5 5 2 1 1 7 3 4 Pennsylvania 1 1 1 -1 1 1 2 1 1
Great Lakes - West 1 2 -1 2 1 1 20 13 7 2 5 -3 25 21 4 Indiana 1 -1 1 1 0 1 1 1 -1 2 3 -1 Illinois 1 1 2 -2 1 2 -1 Michigan 1 1 1 1 10 10 0 2 1 1 14 11 3 Minnesota 2 2 1 -1 2 1 1 Wisconsin 1 -1 6 3 3 6 4 2
Total All Regions 37 24 13 12 60 -48 17 10 7 15 10 5 155 41 114 46 48 -2 282 193 89
45

Table 10. Summary of county level ocean-related sector GDP change predictions exceeding 50 percent, positive or negative, 2009-20, by U.S. coastal region and state
Region, State Construction Living Resources Minerals Ship & Boat Bldg. Tourism & Rec. Transportation Total All Sectors
Pos. Neg. Net Pos. Neg. Net Pos. Neg. Net Pos. Neg. Net Pos. Neg. Net Pos. Neg. Net Pos. Neg. Net Atlantic – North 3 2 1 5 8 -3 3 -3 1 4 -3 12 2 10 4 3 1 25 22 3
Connecticut 1 -1 1 -1 2 -2 Maine 2 -2 4 -4 2 2 1 1 3 6 -3 Massachusetts 1 1 0 3 3 3 3 1 1 8 1 7 New Hampshire 1 1 1 1 New York 2 1 1 1 4 -3 3 -3 1 1 4 2 2 1 2 -1 9 12 -3 Rhode Island 1 1 0 3 3 4 1 3
Atlantic – Middle 2 5 -3 14 -14 1 -1 2 -2 20 1 19 8 11 -3 30 34 -4 Delaware 2 2 1 1 3 3 Maryland 1 1 3 -3 7 7 4 3 1 12 6 6 New Jersey 1 2 -1 4 -4 1 -1 3 1 2 2 2 0 6 10 -4 Pennsylvania 1 -1 2 -2 1 -1 1 1 1 1 0 2 5 -3 Virginia 2 -2 5 -5 1 -1 7 7 5 -5 7 13 -6
Atlantic – South 5 2 3 11 -11 2 -2 3 3 6 2 4 1 6 -5 15 23 -8 Florida 2 2 4 -4 2 -2 1 1 2 -2 3 8 -5 Georgia 1 -1 1 1 0 1 2 -1 North Carolina 2 2 5 -5 2 2 2 1 1 2 -2 6 8 -2 South Carolina 1 1 0 2 -2 1 1 2 2 1 2 -1 5 5 0
Gulf of Mexico – East 1 3 -2 1 4 -3 2 1 1 8 8 3 4 -1 15 12 3 Alabama 1 -1 1 -1 2 -2 Florida 1 2 -1 1 3 -2 2 1 1 7 7 3 2 1 14 8 6 Mississippi 1 1 2 -2 1 2 -1
Gulf of Mexico – West 4 4 3 -3 8 1 7 1 3 -2 3 8 -5 4 1 3 20 16 4 Louisiana 3 3 1 -1 4 1 3 1 2 -1 3 3 0 1 1 0 12 8 4 Texas 1 1 2 -2 4 4 1 -1 5 -5 3 3 8 8 0
Pacific – Hawaii 1 1 0 1 1 2 1 1 Pacific – California 5 3 2 6 -6 1 2 -1 1 1 4 4 5 6 -1 16 17 -1 Pacific – Northwest 3 1 2 3 6 -3 2 2 1 3 -2 1 1 0 10 11 -1
Oregon 2 2 1 4 -3 1 -1 3 5 -2 Washington 1 1 0 2 2 0 2 2 1 3 -2 1 1 7 6 1
Pacific – Alaska 1 1 1 2 -1 2 2 4 8 -4 3 -3 8 13 -5 Great Lakes – East 4 -4 2 -2 2 2 4 2 2 4 3 1 10 11 -1
Michigan 1 -1 1 -1 2 -2 4 -4 New York 2 -2 1 1 2 1 1 1 1 0 4 4 0 Ohio 1 -1 1 -1 2 2 2 2 4 2 2 Pennsylvania 1 1 1 -1 1 1 2 1 1
Great Lakes – West 1 -1 2 1 1 7 8 -1 2 4 -2 11 14 -3 Indiana 2 -2 2 -2 Illinois 1 -1 1 1 0 1 2 -1 Michigan 1 1 3 7 -4 2 1 1 6 8 -2 Minnesota 1 1 1 -1 1 1 0 Wisconsin 3 1 2 3 1 2
Total All Regions 24 21 3 11 57 -46 17 10 7 9 10 -1 69 34 35 32 42 -10 162 174 -12
46

Table 11. Top 50 U.S. county ocean-related sectors with greatest positive percentage GDP change predicted
in 2020
Region State County Sector
Average Annual Change
1990-2009 (Million $)
P value
Actual 2009
Value (Million $)
Predicted Value 2020
(Million $)
2009-20 change
(%)
Atlantic – South North Carolina Chowan Ship & Boat Building 2.3 0.02 9 52 500% Atlantic – Middle Maryland Cecil Transportation 10.9 0.00 46 167 263% Pacific – California California Mendocino Transportation 0.8 0.00 6 22 243% Atlantic – South North Carolina Dare Ship & Boat Building 4.1 0.00 27 89 232% Great Lakes – West Michigan Saginaw Tourism & Recreation 27.5 0.00 168 507 202% Pacific – Alaska Alaska Kenai Peninsula Minerals 68.4 0.03 504 1,510 200% Atlantic – Middle New Jersey Salem Transportation 10.3 0.05 57 171 199% Great Lakes – East New York Chautauqua Minerals 4.2 0.00 33 98 196% Gulf of Mexico - West Texas Nueces Minerals 83.2 0.00 715 2,041 186% Atlantic – South South Carolina Charleston Ship & Boat Building 16.6 0.03 116 329 183% Pacific – Alaska Alaska Anchorage Minerals 560.1 0.00 4,626 12,828 177% Pacific – Northwest Washington Mason Living Resources 2.3 0.00 20 54 172% Pacific – Northwest Washington Snohomish Minerals 7.1 0.03 43 117 169% Great Lakes – West Michigan Muskegon Transportation 1.4 0.00 14 37 164% Atlantic – Middle Maryland Prince George's Transportation 60.7 0.03 405 1,061 162% Atlantic – North Massachusetts Suffolk Living Resources 5.4 0.02 37 97 159% Atlantic – North New York Kings Ship & Boat Building 0.5 0.03 4 11 159% Atlantic – North Connecticut Middlesex Transportation 1.3 0.02 10 24 156% Atlantic – North Massachusetts Norfolk Living Resources 1.1 0.01 9 21 145% Gulf of Mexico - East Florida Monroe Living Resources 0.9 0.00 9 22 144% Atlantic – South Florida Clay Construction 2.9 0.01 27 66 143% Atlantic – South North Carolina New Hanover Construction 1.3 0.02 18 44 143% Gulf of Mexico - East Florida Walton Tourism & Recreation 24.1 0.04 185 448 143% Pacific – Northwest Oregon Douglas Construction 0.9 0.03 7 16 142% Pacific – Northwest Oregon Washington Construction 1.6 0.01 19 46 141% Great Lakes – West Michigan Arenac Minerals 0.5 0.02 4 9 141% Gulf of Mexico - East Florida Bay Ship & Boat Building 11.9 0.00 97 233 139% Gulf of Mexico - West Texas Refugio Minerals 5.5 0.00 55 130 137% Pacific – Northwest Washington King Minerals 2.9 0.00 23 53 135% Atlantic – Middle New Jersey Somerset Construction 1.7 0.02 14 32 134% Gulf of Mexico - West Louisiana Orleans Minerals 489.1 0.01 5,467 12,749 133% Pacific – California California Santa Clara Minerals 4.5 0.05 37 86 132% Atlantic – North Maine Hancock Transportation 0.3 0.01 2 5 131% Gulf of Mexico - East Florida Collier Tourism & Recreation 66.4 0.00 602 1,375 129% Atlantic – North Rhode Island Washington Living Resources 4.2 0.00 44 99 126% Gulf of Mexico - West Louisiana Lafourche Minerals 78.3 0.00 791 1,770 124% Atlantic – South North Carolina Beaufort Construction 0.1 0.02 1 2 123% Great Lakes – East Pennsylvania Erie Minerals 1.5 0.01 14 32 123% Great Lakes – East Pennsylvania Erie Transportation 1.4 0.00 15 32 123% Atlantic – Middle Maryland Dorchester Tourism & Recreation 4.8 0.00 51 112 121% Pacific – California California San Joaquin Construction 0.5 0.04 9 21 120% Atlantic – North Massachusetts Barnstable Living Resources 0.9 0.00 11 23 119% Pacific – Hawaii Hawaii Hawaii Living Resources 0.5 0.00 6 13 118% Pacific – Northwest Washington Snohomish Transportation 1.5 0.00 18 39 118% Pacific – Alaska Alaska Lake & Peninsula Tourism & Recreation 0.3 0.04 3 7 117% Gulf of Mexico - West Louisiana Terrebonne Tourism & Recreation 10.9 0.00 105 228 117% Atlantic – Middle Maryland Worcester Tourism & Recreation 30.0 0.00 299 646 116% Pacific – Northwest Oregon Douglas Ship & Boat Building 3.8 0.01 37 79 115% Gulf of Mexico - West Texas Harris Minerals 4,962.0 0.00 58,820 126,208 115% Atlantic – South Florida Duval Tourism & Recreation 26.6 0.01 283 605 114%
47

Table 12. Top 50 U.S. county ocean-related sectors with greatest negative percentage GDP change predicted in 2020
Region State County Sector
Average Annual Change
1990-2009 (Million $)
P value
Actual or Predicted
Value in 2009 (Million $)
Predicted Value in
2020 (Million $)
2009-20 change
(%)
Atlantic – Middle Virginia Arlington Living Resources -1.0 0.04 0.01 -11.02 -132183% Gulf of Mexico - West Texas San Patricio Ship & Boat Bldg. -6.7 0.04 0.50 -86.89 -17640% Atlantic – Middle Virginia Northumberland Living Resources -3.7 0.00 0.40 -44.88 -11223% Pacific – Alaska Alaska Aleutians West Transportation -3.0 0.02 0.37 -31.04 -8564% Great Lakes - West Michigan Cheboygan Construction -1.7 0.05 0.24 -18.86 -7825% Gulf of Mexico - West Louisiana St. Charles Construction -5.1 0.00 0.98 -55.57 -5743% Atlantic – Middle Virginia Newport News City Living Resources -0.3 0.00 0.07 -3.77 -5200% Atlantic – South North Carolina Brunswick Living Resources -3.6 0.01 0.84 -41.19 -5031% Atlantic – South Florida Brevard Minerals -1.9 0.01 0.41 -20.02 -5010% Gulf of Mexico - West Louisiana Orleans Ship & Boat Bldg. -10.2 0.00 3.53 -110.54 -3229% Great Lakes – East New York Niagara Construction -1.2 0.04 0.44 -13.31 -3114% Atlantic – Middle Virginia Fairfax Transportation -6.0 0.05 2.17 -63.79 -3034% Atlantic – Middle Pennsylvania Philadelphia Construction -11.0 0.00 4.77 -132.26 -2875% Gulf of Mex. - East Mississippi Harrison Living Resources -6.8 0.00 3.06 -71.29 -2433% Atlantic – North Maine Knox Living Resources -2.5 0.02 1.16 -23.55 -2135% Atlantic – Middle Maryland Dorchester Living Resources -6.7 0.00 3.29 -65.85 -2101% Pacific – Alaska Alaska Dillingham Tourism & Rec. -0.3 0.00 0.18 -3.54 -2084% Great Lakes – East New York Wayne Construction -0.2 0.00 0.13 -2.36 -1922% Atlantic – Middle New Jersey Essex Living Resources -2.7 0.04 1.72 -30.62 -1876% Atlantic – Middle Virginia Spotsylvania Construction -1.0 0.01 0.71 -12.52 -1867% Atlantic – South South Carolina Georgetown Transportation -0.5 0.03 0.31 -4.91 -1676% Atlantic – Middle Virginia Norfolk City Living Resources -1.6 0.00 1.21 -18.56 -1638% Pacific – Alaska Alaska Bethel Tourism & Rec. -0.2 0.00 0.18 -2.57 -1490% Atlantic – Middle Virginia Accomack Living Resources -7.9 0.00 5.44 -73.46 -1450% Pacific - Northwest Washington Skagit Living Resources -2.6 0.00 1.29 -15.98 -1342% Pacific – Alaska Alaska Aleutians West Tourism & Rec. -0.6 0.00 0.56 -6.93 -1340% Gulf of Mexico - East Florida Pinellas Living Resources -4.2 0.00 4.56 -49.58 -1187% Atlantic – South Florida Duval Minerals -1.7 0.00 1.57 -16.55 -1155% Atlantic – South North Carolina Beaufort Living Resources -10.5 0.00 12.76 -122.93 -1063% Great Lakes - West Michigan Ontonagon Tourism & Rec. -0.2 0.04 0.22 -2.09 -1047% Gulf of Mexico - West Texas Cameron Living Resources -5.3 0.00 4.53 -39.47 -971% Great Lakes - West Illinois Lake Minerals -0.1 0.02 0.14 -1.20 -929% Gulf of Mexico - East Florida Bay Transportation -2.1 0.00 3.10 -24.75 -899% Pacific – Alaska Alaska Haines Tourism & Rec. -1.8 0.00 2.45 -18.88 -871% Gulf of Mexico - West Texas Brazoria Tourism & Rec. -7.7 0.00 9.57 -73.15 -865% Atlantic – North Massachusetts Middlesex Construction -15.6 0.00 24.90 -188.63 -858% Atlantic – South Georgia Glynn Transportation -1.5 0.02 1.95 -14.58 -849% Atlantic – South North Carolina Dare Living Resources -1.6 0.00 2.15 -16.04 -848% Atlantic – Middle Virginia Richmond City Living Resources -2.5 0.00 3.02 -22.46 -845% Atlantic – South Florida Volusia Transportation -0.4 0.00 0.59 -4.32 -827% Atlantic – South North Carolina Brunswick Transportation -1.9 0.02 2.62 -18.97 -825% Atlantic – Middle New Jersey Passaic Tourism & Rec. -0.5 0.01 0.68 -4.63 -777% Great Lakes – East Ohio Cuyahoga Living Resources -0.8 0.00 1.21 -7.68 -735% Great Lakes - West Minnesota St. Louis Transportation -0.3 0.04 0.39 -2.45 -733% Pacific – Alaska Alaska Kenai Peninsula Transportation -2.2 0.01 3.58 -21.71 -707% Pacific – Alaska Alaska Kenai Peninsula Living Resources -6.2 0.00 12.31 -74.44 -705% Great Lakes - West Michigan Benzie Tourism & Rec. -2.8 0.00 4.22 -25.14 -695% Atlantic – South Florida Volusia Living Resources -0.4 0.01 0.58 -3.15 -643% Pacific - Northwest Oregon Clatsop Living Resources -3.7 0.00 6.81 -36.82 -641% Pacific – California California San Luis Obispo Transportation -0.4 0.01 0.52 -2.75 -624%
48

Table 13. Forecast ocean-related GDP in 2020 for U.S. coastal regions and states
Region – State 2009 value
(Million $)
Avg. Value 1997-2009 (Million $)
1997 to 2009 change
(%)
Coefficient of Deter-mination
Probability value (p)
Predicted value 2020 (Million $)
Predicted value change 2009-20 (%)
Atlantic – North 25,585 21,751 41% 0.52 0.01 37,009 45% Connecticut 1,496 1,822 -18% 0.07 0.39 Maine 1,534 1,704 -4% 0.03 0.60 Massachusetts 4,473 3,938 36% 0.86 0.00 5,645 26% New Hampshire 334 351 -8% 0.06 0.43 New York 16,661 13,007 61% 0.52 0.01 26,765 61% Rhode Island 1,087 929 53% 0.14 0.21
Atlantic – Middle 13,887 11,768 34% 0.57 0.00 19,903 43% Delaware 554 550 57% 0.27 0.07 Maryland 3,372 2,247 95% 0.74 0.00 5,319 58% New Jersey 4,724 4,510 4% 0.10 0.29 Pennsylvania 1,522 1,182 101% 0.84 0.00 2,616 72% Virginia 3,715 3,280 23% 0.27 0.07
Atlantic – South 13,466 9,802 137% 0.61 0.00 23,437 74% Florida 9,152 6,748 258% 0.71 0.00 18,884 106% Georgia 800 675 24% 0.01 0.81 North Carolina 1,001 920 5% 0.02 0.64 South Carolina 2,514 1,978 65% 0.88 0.00 3,530 40%
Gulf of Mexico – East 9,577 5,792 265% 0.65 0.00 16,742 75% Alabama 1,455 846 86% 0.05 0.47 Florida 7,756 4,959 412% 0.81 0.00 15,546 100% Mississippi 366 369 11% 0.15 0.20
Gulf of Mexico – West 77,968 58,110 125% 0.82 0.00 157,629 102% Louisiana 14,251 11,424 89% 0.66 0.00 24,509 72% Texas 63,718 46,686 135% 0.82 0.00 133,121 109%
Pacific – Hawaii 4,991 3,630 6% 0.32 0.05 0 -100% Hawaii 4,991 3,630 6% 0.32 0.05 0 -100%
Pacific – California 30,030 28,700 15% 0.12 0.24 California 30,030 28,700 15% 0.12 0.24
Pacific – Northwest 7,225 7,375 -6% 0.04 0.50 Oregon 449 442 3% 0.22 0.11 Washington 6,776 7,511 -7% 0.17 0.19
Pacific – Alaska 7,164 6,176 113% 0.83 0.00 16,160 126% Alaska 7,164 6,176 113% 0.83 0.00 16,160 126%
Great Lakes – West 7,288 6,818 23% 0.87 0.00 9,342 28% Illinois 4,728 4,408 22% 0.74 0.00 5,827 23% Michigan 1,222 1,151 28% 0.72 0.00 1,670 37% Minnesota 152 94 93% 0.51 0.01 191 25% Wisconsin 939 944 32% 0.70 0.00 1,533 63%
Great Lakes – East 3,266 3,437 2% 0.24 0.09 Michigan 770 1,168 -38% 0.26 0.08 New York 1,118 931 55% 0.92 0.00 1,549 39% Ohio 1,293 1,202 20% 0.80 0.00 1,778 38% Pennsylvania 85 136 -52% 0.27 0.07
Grand Total 200,447 163,359 64% 0.91 0.00 319,271 59%
Note: negative predicted values were truncated at 0
49

Trends and Forecast of Port Shipping Activity
Tables 14 and 15 present information on marine port shipments by weight and value, respectively, between
1997 and 2010, along with percent change statistics and a forecast for 2020. The total tonnage of marine
port shipments for all waterfront counties in the United States was about 1.16 billion tons in 1997 and
almost 1.51 billion tons in 2010, a 30 percent increase. The forecast for 2020, based on linear extrapolation,
puts the weight of marine port shipments over 1.89 billion tons (Table 14). The total value of marine port
shipments in all waterfront counties in the United States was about $961 billion in 1997, and just under
$1,640 billion in 2010, a 71 percent increase (all values are reported in 2010 dollars). The forecast for 2020
puts the total value of marine port shipments at just over $2,364 billion for that year, again, in 2010 dollars
(Table 15).
Among regions in the United States in 2010, the Gulf of Mexico-West had the highest weight of shipments
at 645 million tons, followed by the Atlantic-Middle (228 M Tons), Pacific–California at 216 M Tons,
Atlantic-South (117 M Tons), Pacific-Northwest (103 M Tons), and Atlantic-North (71 M Tons). The Pacific-
California region also had the highest marine port shipments value of $461 billion in 2010, followed by Gulf
of Mexico-West ($368 billion), Atlantic-Middle ($302 billion), Atlantic-South ($239 billion), Pacific-
Northwest ($109 billion), and Atlantic-North ($106 billion).
Among individual states in 2010, Texas had the highest marine port shipments by weight at 374 million
tons, followed by Louisiana (271 M Tons), California (216 M Tons), Washington (82 M Tons), New Jersey (67
M Tons), Virginia (67 M Tons), Pennsylvania (54 M Tons), Georgia (50 M Tons), Florida (37 M Tons), New
York (35 M Tons), and Maryland (35 M Tons). Comparing the values of marine port shipments across states
in 2010, California had the highest value of $461 billion, followed by Texas ($250 billion), New Jersey ($126
billion), Louisiana ($118 billion), Washington ($96 billion), Virginia ($88 billion), Georgia ($88 billion), New
York ($83 billion), Florida ($80 billion), and South Carolina ($61 billion).
Individual counties with more than 30 million tons in marine port shipments in 2010 included Harris County
in Texas (172 M Tons), Los Angeles County, California (158 M Tons), Orleans County, Louisiana (99 M Tons),
Jefferson County, Texas (72 M Tons), St. James Parish, Louisiana (64 M Tons), Essex County, New Jersey (59
M Tons), Nueces, Texas (54 M Tons), Chatham County, Georgia (48 M Tons), Newport News (City), Virginia
(47 M Tons) Galveston County, Texas (48 M Tons), Philadelphia County, Pennsylvania (42 M Tons),
Baltimore City, Maryland (34 M Tons), Calcasieu Parish, Louisiana (34 M Tons), and New York County in
New York (34 M Tons). Individual counties with more than $30 billion of marine port shipments value in
2010 included Los Angeles County, California ($381 billion), Harris County, Texas ($154 billion), Essex
County, New Jersey ($121 billion), Newport News, Virginia ($86 billion), New York County, New York ($82
billion), Chatham County, Georgia ($76 billion), Charleston County, South Carolina ($61 billion), Alameda
50

County, California ($52 billion), King County, Washington ($49 billion), Orleans Parish, Louisiana ($46
billion), Baltimore City, Maryland ($45 billion), Jefferson County, Texas ($34 billion) and Pierce County in
Washington ($31 billion).
The overall trend between 1997 and 2010 shows an increase in the total marine port shipments by weight,
however, the rates of increase among various region and states in the United States varied widely and
some regions have decreased (Table 14). The Pacific-California region had the highest increase in tonnage,
96 percent between 1997 and 2010, while the Atlantic-South and Atlantic-Middle regions showed increases
of 63 and 42 percent, respectively. The Pacific-Alaska region showed the greatest decrease in shipping
weight (-43%) followed by Great Lakes-East (-23 percent), Great Lakes-West (-19 percent), and Atlantic
North (-18 percent). In value terms, the overall trend of marine shipments from 1997 to 2010 also
increased, however, like the weight of shipments, the rates of increase among various U.S. regions and
states varied. From 1997 to 2010, the Western Gulf of Mexico region registered the highest increase (147
percent) in the value of marine port shipments, followed by the eastern Gulf of Mexico-West and the
Middle Atlantic (124 percent), Pacific-Hawaii (121 percent), Atlantic-South (61 percent), and Pacific-
California (54 percent). Only the Great Lakes-East experienced a decrease in total value of marine port
shipments (-20 percent) during the 1997-2010 time period.
There was also considerable variation in shipment trends within U.S. regions and states over time. For
example, from 1997 to 2010 the Atlantic-Middle region experienced a 64 percent increase in shipment
weight, while Pennsylvania showed an 11 percent decrease. Within the Atlantic-North region, with an 18
percent decrease in weight between 1997 and 2010, Connecticut’s marine port shipments increased by 34
percent. Georgia had a 147 percent increase, while Glynn County decreased by 8 percent; in South Carolina,
which experienced a 17 percent increase, Georgetown County had a 98 percent decrease. Shipping weights
in Pinellas County, Florida decreased by 93 percent, while the Gulf of Mexico-East region overall had a 58
percent increase. Within the Atlantic-North region, with only a 17 percent increase, Rhode Island and New
Hampshire had increases of 356 percent and 291 percent, respectively (Table 14).
While the value of shipments increased by 124 percent within the Gulf of Mexico-East region, that of
Pinellas (St. Petersburg) and Escambia (Pensacola) Counties in Florida decreased by 43 and 48 percent
respectively. Jefferson Parish in Louisiana saw a decrease in its shipping values by 46 percent from 1997
through 2010, while the state of Louisiana saw a 99 percent increase in the value of its marine shipments
(Table 15).
51

Table 14. Summary of marine port shipments, weight basis, 1997 and 2010, and forecast for 2020, by U.S. coastal region, state and county
Region State County Port
1997 (million
tons)
2010 (million
tons) Obser-
vations
Avg. Weight
(million tons)
1997-2010 % Change
Slope of regression
Forecast 2020
(million tons) Atlantic - North 86.6 71.4 14 82.9 -18% -2.12 48.0
Connecticut 3.3 4.4 14 4.8 34% 0.14 7.1 Fairfield Bridgeport 0.9 1.5 14 1.6 56% 0.08 3.0 Hartford Hartford 0.0 0.0 14 0.0 -22% New Haven New Haven 2.2 2.9 14 3.0 30% 0.06 4.0 New London New London 0.1 0.1 14 0.2 -64%
Maine 6.0 5.2 14 5.6 -14% Cumberland Portland 3.7 3.0 14 3.7 -21% Hancock Bar Harbor 0.0 0.0 14 0.0 -79% Knox Rockland 0.0 0.0 8 0.0 -100% Penobscot Bangor 0.0 0.1 14 0.0 954% Sagadahoc Bath 0.0 0.0 9 0.0 -100% Waldo Belfast 1.2 0.4 14 0.6 -69% -0.06 0.0 Waldo Searsport 0.8 1.3 14 1.0 51% 0.05 1.8 Washington Eastport 0.2 0.5 14 0.3 142% 0.02 0.7 Washington Jonesport 0.0 0.0 8 0.0 0.00 0.0
Massachusetts 13.6 16.7 14 17.9 23% 0.48 25.8 Barnstable Provincetown 0.0 0.0 12 0.0 Bristol Fall River 0.9 0.6 14 1.5 -32% 0.11 3.3 Bristol New Bedford 0.1 0.0 14 0.1 -85% -0.02 0.0 Essex Gloucester 0.0 0.0 14 0.0 78% Essex Salem 0.8 0.7 14 0.8 -6% Plymouth Plymouth 0.7 0.0 13 0.4 -100% -0.05 0.0 Suffolk Boston 11.1 15.3 14 15.1 38% 0.45 22.4
New Hampshire 6.2 5.1 14 7.4 -17% Rockingham Portsmouth 6.2 5.1 14 7.4 -17%
New York 53.7 34.7 14 42.5 -35% -2.83 0.0 Albany Albany 1.4 1.1 14 1.6 -17% New York New York 52.3 33.6 14 40.9 -36% -2.79 0.0
Rhode Island 3.9 5.2 14 4.8 36% 0.17 7.6 Newport Newport 0.1 0.4 14 0.2 270% 0.03 0.7 Providence Providence 3.7 4.8 14 4.6 29% 0.14 6.9
Atlantic - Middle 161.0 227.8 14 203.2 42% 8.37 341.3 Delaware 4.4 5.0 14 10.4 13%
New Castle Wilmington 4.4 5.0 14 10.4 13% District of Columbia 0.0 0.1 14 0.0 8234% District of Columbia Washington 0.0 0.1 14 0.0 8234%
Maryland 25.0 34.3 14 28.7 37% 0.64 39.2 Anne Arundel Annapolis 0.0 0.1 14 0.0 2468% Dorchester Cambridge 0.0 0.1 14 0.0 58101% Somerset Crisfield 0.0 0.2 14 0.0 1099% 0.01 0.2 Baltimore City Baltimore 24.9 34.0 14 28.6 36% 0.62 38.9
New Jersey 7.7 67.0 14 46.6 772% 6.29 150.5 Camden Camden 0.0 0.7 14 0.2 6198% 0.06 1.2 Camden Gloucester City 0.0 0.0 14 0.0 -57% Essex Newark 7.6 59.4 14 40.5 683% 5.64 133.5 Gloucester Paulsboro 0.0 0.8 14 0.4 3617% 0.09 1.8 Middlesex Perth Amboy 0.0 6.2 14 5.5 20557%
Pennsylvania 60.8 54.4 14 65.3 -11%
52

Table 14. Summary of marine port shipments, weight basis, 1997 and 2010, and forecast for 2020, by U.S. coastal region, state and county
Region State County Port
1997 (million
tons)
2010 (million
tons) Obser-
vations
Avg. Weight
(million tons)
1997-2010 % Change
Slope of regression
Forecast 2020
(million tons) Delaware Chester 6.7 11.9 14 10.3 79% 0.23 14.1 Philadelphia Philadelphia 54.1 42.5 14 55.0 -22%
Virginia 63.1 67.0 14 52.1 6% Alexandria (city) Alexandria 0.1 0.6 13 0.1 844% Hopewell (city) Hopewell 0.1 18.9 14 1.4 19997% Newport News (city) Newport News 15.7 47.4 14 15.1 201% Norfolk (city) Norfolk 46.4 0.1 14 34.8 -100%
Richmond (city) Richmond-Petersburg 0.8 0.0 14 0.8 -100%
Atlantic - South 71.8 116.7 14 99.5 63% 4.20 168.8 Florida 27.2 36.6 14 35.5 35% 0.92 50.6
Brevard Port Canaveral 1.9 1.9 14 2.6 -2% Broward Port Everglades 8.1 11.1 14 11.1 38% 0.36 17.1 Duval Jacksonville 9.1 12.8 14 11.8 40% 0.35 17.6 Miami-Dade Miami 6.2 8.7 14 7.9 40% 0.17 10.7
Nassau Fernandina Beach 0.6 0.6 14 0.5 8%
Palm Beach West Palm Beach 1.3 1.5 14 1.5 17%
St. Lucie Fort Pierce 0.1 0.1 14 0.1 2% 0.01 0.2 Georgia 20.4 50.3 14 34.0 147% 2.77 79.8
Chatham Savannah 17.8 47.9 14 31.8 169% 2.79 77.7 Glynn Brunswick 2.6 2.4 14 2.3 -8%
North Carolina 6.0 8.4 14 6.4 41% 0.20 9.8 Carteret Beaufort 1.7 1.9 14 1.2 12% New Hanover Wilmington 4.3 6.5 14 5.3 52% 0.22 8.9
South Carolina 18.2 21.4 14 23.5 17% Charleston Charleston 16.8 21.4 14 22.7 27% Georgetown Georgetown 1.4 0.0 14 0.8 -98% -0.11 0.0
Gulf of Mexico - East 53.2 67.5 14 63.4 27% 1.52 88.4 Alabama 18.6 21.3 14 24.0 14%
Mobile Mobile 18.6 21.3 14 24.0 14% Florida 10.1 16.0 14 14.2 58% 0.52 22.7
Bay Panama City 0.7 1.6 14 1.0 141% 0.08 2.3 Escambia Pensacola 0.3 0.2 14 0.3 -28% Hillsborough Tampa 7.8 12.5 14 10.3 60% 0.47 18.0 Lee Boca Grande 0.0 0.0 13 0.0 Manatee Port Manatee 1.4 1.8 14 2.5 25% Monroe Key West 0.0 0.0 14 0.0 260%
Pinellas Saint Petersburg 0.0 0.0 14 0.0 -93%
Mississippi 24.5 30.2 14 25.2 23% 0.52 33.7 Harrison Gulfport 2.7 2.7 14 2.5 -1% Jackson Pascagoula 21.8 27.5 14 22.7 26% 0.52 31.3 Warren Vicksburg 0.0 0.0 12.0 0.0 Washington Greenville 0.0 0.0 14.0 0.0 -0.2
Gulf of Mexico - West 520.0 645.4 14 603.4 24% 8.33 740.9 Louisiana 241.0 271.3 14 267.5 13%
Calcasieu Lake Charles 28.1 33.6 14 32.4 19% 0.38 38.6 East Baton Rouge Baton Rouge 36.9 21.2 14 29.3 -42% -1.28 8.2
53

Table 14. Summary of marine port shipments, weight basis, 1997 and 2010, and forecast for 2020, by U.S. coastal region, state and county
Region State County Port
1997 (million
tons)
2010 (million
tons) Obser-
vations
Avg. Weight
(million tons)
1997-2010 % Change
Slope of regression
Forecast 2020
(million tons) Jefferson Avondale 0.0 0.0 14 0.0 462% Orleans New Orleans 88.6 99.0 14 93.1 12% Plaquemines Port Sulphur 0.0 0.3 14 0.1 2033% 0.02 0.4 St. Charles Destrehan 0.0 0.0 13 0.0 3% St. Charles St. Rose 1.2 3.2 14 1.8 161% St. James Good Hope 0.0 0.0 10 3.9 -100% St. James Gramercy 52.9 64.4 14 54.3 22% St. Mary Morgan City 33.1 49.4 14 52.7 49% 1.24 73.2
Texas 279.0 374.1 14 335.9 34% 6.67 446.0 Brazoria Freeport 18.9 21.6 14 23.8 14% Calhoun Port Lavaca 6.7 5.4 14 6.6 -19% Cameron Brownsville 0.4 1.4 14 0.9 233% 0.09 2.4 Galveston Galveston 31.6 9.1 14 25.1 -71% -2.68 0.0 Galveston Texas City 1.0 38.6 14 17.7 3760% 3.34 72.8 Harris Houston 109.6 171.7 14 138.0 57% 5.06 221.4 Jefferson Beaumont 24.9 29.5 14 32.9 18% Jefferson Port Arthur 38.4 42.4 14 38.7 10% Jefferson Sabine 0.0 0.4 14 0.1 80234% 0.02 0.3 Nueces Corpus Christi 47.5 53.9 14 52.0 14% 0.37 58.2 Orange Orange 0.0 0.0 14 0.0 1796%
Pacific - Hawaii 8.0 8.5 14 8.5 6% 0.20 11.9 Hawaii 8.0 8.5 14 8.5 6% 0.20 11.9
Hawaii Hawaii County 0.0 0.0 1 0.0 Hawaii Hilo 0.1 0.0 14 0.1 -61% -0.01 0.0 Hawaii Kona 0.0 0.0 13 0.0 Honolulu Honolulu 7.9 8.3 14 8.4 5% 0.20 11.7
Kauai Nawiliwili-Port Allen 0.0 0.0 13 0.0
Maui Kahului 0.0 0.1 14 0.1 325% 0.01 0.2 Pacific - California 110.3 216.5 14 173.7 96% 8.84 319.5
California 110.3 216.5 14 173.7 96% 8.84 319.5 Alameda Alameda 0.0 0.0 14 0.0 -85% Alameda Oakland 13.2 24.1 14 21.5 83% 0.74 33.8 Contra Costa Crockett 0.5 0.5 14 1.1 -7% Contra Costa Martinez 2.1 5.9 14 2.7 177% 0.17 5.6 Contra Costa Richmond 5.4 13.5 14 8.1 148% 0.97 24.0 Contra Costa Selby 0.1 0.0 14 0.2 -33% Humboldt Eureka 0.6 0.1 14 0.3 -88% -0.05 0.0 Los Angeles El Segundo 3.4 12.1 14 10.2 251% 0.58 19.7 Los Angeles Long Beach 25.0 60.7 14 41.9 142% 2.87 89.2 Los Angeles Los Angeles 50.9 85.4 14 73.5 68% 3.07 124.1 Los Angeles Segundo 0.0 0.4 14 0.1 3216% 0.02 0.4 Marin San Pablo Bay 0.1 0.8 14 0.6 924% Mariposa El Capitan 0.0 0.0 10 0.0 -100% Monterey Monterey 0.0 0.0 14 0.0 -89% 0.00 0.0 Sacramento Sacramento 1.0 0.3 14 0.8 -72% -0.04 0.1 San Diego San Diego 0.8 1.0 14 2.1 30% San Francisco San Francisco 1.8 4.5 14 3.4 151% 0.41 10.2 San Joaquin San Joaquin 0.4 0.0 14 0.3 -100% -0.06 0.0
54

Table 14. Summary of marine port shipments, weight basis, 1997 and 2010, and forecast for 2020, by U.S. coastal region, state and county
Region State County Port
1997 (million
tons)
2010 (million
tons) Obser-
vations
Avg. Weight
(million tons)
1997-2010 % Change
Slope of regression
Forecast 2020
(million tons) River
San Joaquin Stockton 2.6 2.2 14 3.2 -15% San Luis Obispo Avila Beach 0.0 0.0 14 0.0 -78% San Luis Obispo Morro Bay 0.0 0.0 14 0.0 874% San Mateo Redwood City 0.4 0.4 14 0.9 12%
Solano Carquinez Strait 0.8 3.3 14 1.6 294% 0.18 4.6
Solano Suisun Bay 0.4 0.0 14 0.1 -100% -0.03 0.0
Ventura Port Hueneme 0.7 1.4 14 1.2 82% 0.04 1.8
Ventura Ventura 0.0 0.0 13 0.0 1317% Pacific - Northwest 82.7 103.5 14 87.2 25% 2.58 129.7
Oregon 23.6 21.3 14 19.9 -10% Clatsop Astoria 0.2 0.0 14 0.0 -96% -0.01 0.0 Coos Coos Bay 2.8 1.7 14 1.8 -37% -0.08 0.5 Lincoln Newport 0.1 0.0 14 0.0 -88% Multnomah Portland 20.6 19.5 14 18.1 -5%
Washington 59.0 82.3 14 67.3 39% 2.71 112.0 Clallam Neah Bay 0.0 0.0 10 0.0 -100% Clallam Port Angeles 0.9 0.2 14 0.3 -75% -0.05 0.0 Clark Vancouver 4.5 6.1 14 5.0 34% 0.15 7.4 Cowlitz Kalama 1.2 11.4 14 7.2 821% 0.68 18.4 Cowlitz Longview 8.6 5.2 14 4.7 -40% Grays Harbor Aberdeen 1.3 1.5 14 0.9 12% Jefferson Port Townsend 0.0 0.0 14 0.0 1211% King Seattle 22.4 29.0 14 22.7 29% 0.75 35.1 Pierce Tacoma 15.5 21.2 14 19.2 37% 0.94 34.8 San Juan Friday Harbor 0.1 0.0 14 0.0 -100% 0.00 0.0 Skagit Anacortes 1.1 2.0 14 2.4 77% Snohomish Everett 1.1 0.2 14 0.5 -83% -0.04 0.0 Thurston Olympia 0.1 0.6 14 0.2 327% 0.03 0.6 Whatcom Bellingham 1.5 4.5 14 3.6 208% 0.34 9.3 Whatcom Blaine 0.5 0.5 14 0.5 -10% Whatcom Point Roberts 0.0 0.0 14 0.0 271%
Pacific - Alaska 11.2 6.4 14 7.6 -43% -0.37 1.5 Alaska 11.2 6.4 14 7.6 -43% -0.37 1.5
Aleutians East Sand Point 0.0 0.0 1 0.0 Anchorage Anchorage 5.7 5.5 14 5.6 -3% Fairbanks North Star Fairbanks 0.0 0.0 13 0.0 -100% 0.00 0.0 Haines Dalton Cache 0.0 0.0 14 0.0 41% Juneau Juneau 0.3 0.2 14 0.3 -27% -0.01 0.1 Ketchikan Gateway Ketchikan 1.3 0.6 14 0.7 -54% -0.05 0.0 Kodiak Island Kodiak 0.0 0.0 14 0.0 -92% 0.00 0.0 Sitka Sitka 0.0 0.0 14 0.0 13% Skagway Skagway 0.2 0.0 14 0.1 -89% -0.01 0.0 Wrangell Wrangell 0.0 0.0 13 0.0 -19% 0.00 0.0 Hoonah-Angoon Pelican 0.0 0.0 5 0.0 Petersburg Petersburg 0.0 0.0 11 0.0 Valdez-Cordova Valdez 3.6 0.0 14 0.9 -100% -0.28 0.0
55

Table 14. Summary of marine port shipments, weight basis, 1997 and 2010, and forecast for 2020, by U.S. coastal region, state and county
Region State County Port
1997 (million
tons)
2010 (million
tons) Obser-
vations
Avg. Weight
(million tons)
1997-2010 % Change
Slope of regression
Forecast 2020
(million tons) Great Lakes - West 26.6 21.6 14 27.6 -19%
Illinois 6.2 3.1 14 4.9 -50% -0.18 1.8 Cook Chicago 6.2 3.1 14 4.9 -50% -0.18 1.9 Peoria Peoria 0.0 0.0 14 0.0 -88%
Indiana 0.3 0.1 14 0.3 -68% Lake East Chicago 0.1 0.0 8 0.0 -100% -0.01 0.0 Lake Gary 0.2 0.1 14 0.2 -59%
Michigan 8.8 13.1 14 12.9 49% 0.91 27.9 Alpena Alpena 0.1 0.2 14 0.2 13% Calhoun Battle Creek 0.0 0.1 12 0.1 128191% Chippewa De Tour Village 0.0 0.0 14 0.0 269% Chippewa Sault Ste. Marie 1.0 0.9 14 0.9 -11% Delta Escanaba 0.0 0.1 13 0.1 22546% 0.01 0.2 Mackinac Mackinac Island 0.0 0.0 7 0.0 461% Marquette Marquette 1.1 2.2 14 2.2 97% Muskegon Muskegon 0.5 0.0 14 0.4 -100% -0.04 0.0 Ottawa Ferrysburg 0.1 0.0 12 0.1 -100% -0.02 0.0 Ottawa Grand Haven 0.0 0.0 12 0.1 -100% Presque Isle Presque Isle 0.0 0.0 10 0.0 7797% Presque Isle Rogers City 0.5 0.1 14 0.3 -77% -0.02 0.0
Saginaw Saginaw/Bay City 1.2 0.4 14 0.9 -68% -0.07 0.0
St. Clair Algonac 0.0 0.0 10 0.0 St. Clair Port Huron 4.2 9.2 14 7.8 118% 1.00 24.2
Minnesota 5.4 0.8 14 2.8 -86% -0.45 0.0 Cook Grand Portage 0.0 0.0 10 0.0 -95% 0.00 0.0
Koochiching International Falls 0.0 0.4 14 0.1 730% 0.03 0.6
Lake Silver Bay 0.6 0.4 13 0.2 -33% Lake of the Woods Baudette 0.0 0.0 12 0.0 Roseau Warroad 0.0 0.0 14 0.0 796% St. Louis Duluth 4.8 0.0 9 2.5 -100% -0.50 0.0
Wisconsin 5.9 4.5 14 6.8 -24% Ashland Ashland 0.0 0.0 13 0.0 -98% Door Green Bay 0.4 0.3 14 0.4 -14% Douglas Superior 3.9 3.2 14 4.8 -16% Manitowoc Manitowoc 0.0 0.0 8 0.0 -100% Marinette Marinette 0.1 0.1 14 0.3 -37% Milwaukee Milwaukee 1.5 0.8 14 1.3 -46% Racine Racine 0.0 0.0 14 0.0 896% Sheboygan Sheboygan 0.0 0.0 7 0.0
Great Lakes - East 28.8 22.2 14 28.1 -23% -0.81 14.8 Michigan 7.2 4.3 14 5.9 -40% -0.20 2.6
Wayne Detroit 7.2 4.3 14 5.9 -40% -0.20 2.6 New York 5.3 6.5 14 6.6 22%
Jefferson Alexandria Bay 0.3 0.1 14 0.1 -70% -0.01 0.0 Jefferson Cape Vincent 0.0 0.0 7 0.0 Jefferson Clayton 0.0 0.0 9 0.0 766500% Monroe Rochester 0.2 0.1 14 0.1 -42% 0.00 0.1
56

Table 14. Summary of marine port shipments, weight basis, 1997 and 2010, and forecast for 2020, by U.S. coastal region, state and county
Region State County Port
1997 (million
tons)
2010 (million
tons) Obser-
vations
Avg. Weight
(million tons)
1997-2010 % Change
Slope of regression
Forecast 2020
(million tons) Niagara Niagara Falls 4.7 5.8 14 5.8 23% Oswego Oswego 0.0 0.4 14 0.3 14056% 0.04 0.9 St. Lawrence Ogdensburg 0.1 0.1 14 0.2 4% Wayne Sodus Point 0.0 0.0 8 0.0 4148%
Ohio 16.2 11.3 14 15.5 -30% -0.58 6.0 Ashtabula Ashtabula 4.7 0.0 10 2.7 -100% -0.52 0.0
Ashtabula Ashtabula/Conneaut 0.0 1.8 5 0.5 0.14 2.9
Ashtabula Conneaut 0.1 0.0 9 0.7 -100% Cuyahoga Cleveland 4.1 1.7 14 3.0 -58% -0.15 0.6 Erie Huron 0.0 0.0 14 0.0 100% Lake Fairport 0.4 0.0 10 0.1 -100% -0.02 0.0 Lorain Lorain 0.1 0.1 13 0.0 -14% Lucas Toledo 6.9 7.8 14 8.4 13%
Pennsylvania 0.1 0.1 14 0.1 -15% Erie Erie 0.1 0.1 14 0.1 -15%
Grand Total 1,160.1 1,507.5 14 1,385.1 30% 30.82 1893.7 Note: slope and forecasts were based on a linear Ordinary Least Squares regression over time (year). Slope coefficients and forecasted values for 2020 were only shown when the regressions yielded a statistically significant slope coefficient and the forecasted value was zero or greater.
57
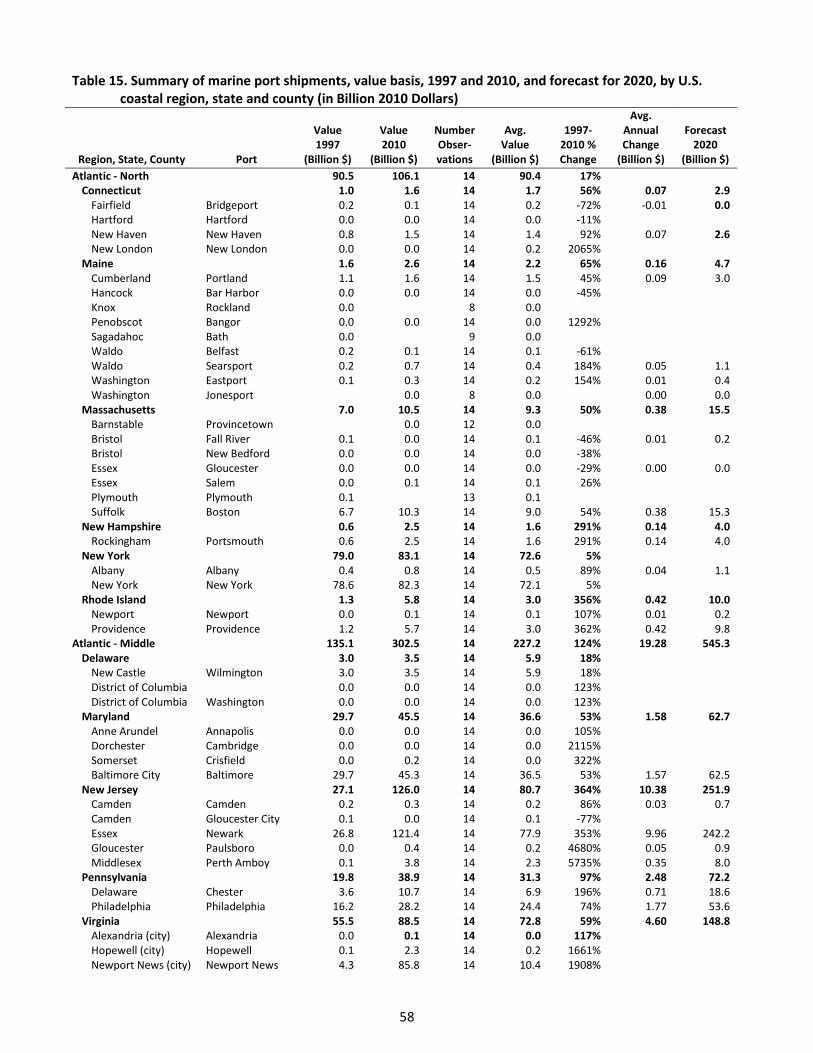
Table 15. Summary of marine port shipments, value basis, 1997 and 2010, and forecast for 2020, by U.S. coastal region, state and county (in Billion 2010 Dollars)
Region, State, County Port
Value 1997
(Billion $)
Value 2010
(Billion $)
Number Obser-vations
Avg. Value
(Billion $)
1997-2010 % Change
Avg. Annual Change
(Billion $)
Forecast 2020
(Billion $) Atlantic - North 90.5 106.1 14 90.4 17%
Connecticut 1.0 1.6 14 1.7 56% 0.07 2.9 Fairfield Bridgeport 0.2 0.1 14 0.2 -72% -0.01 0.0 Hartford Hartford 0.0 0.0 14 0.0 -11% 0.00 New Haven New Haven 0.8 1.5 14 1.4 92% 0.07 2.6 New London New London 0.0 0.0 14 0.2 2065% 0.01
Maine 1.6 2.6 14 2.2 65% 0.16 4.7 Cumberland Portland 1.1 1.6 14 1.5 45% 0.09 3.0 Hancock Bar Harbor 0.0 0.0 14 0.0 -45% 0.00 Knox Rockland 0.0 8 0.0 0.00 Penobscot Bangor 0.0 0.0 14 0.0 1292% 0.00 Sagadahoc Bath 0.0 9 0.0 0.00 Waldo Belfast 0.2 0.1 14 0.1 -61% 0.00 Waldo Searsport 0.2 0.7 14 0.4 184% 0.05 1.1 Washington Eastport 0.1 0.3 14 0.2 154% 0.01 0.4 Washington Jonesport 0.0 8 0.0 0.00 0.0
Massachusetts 7.0 10.5 14 9.3 50% 0.38 15.5 Barnstable Provincetown 0.0 12 0.0 0.00 Bristol Fall River 0.1 0.0 14 0.1 -46% 0.01 0.2 Bristol New Bedford 0.0 0.0 14 0.0 -38% 0.00 Essex Gloucester 0.0 0.0 14 0.0 -29% 0.00 0.0 Essex Salem 0.0 0.1 14 0.1 26% 0.00 Plymouth Plymouth 0.1 13 0.1 0.00 Suffolk Boston 6.7 10.3 14 9.0 54% 0.38 15.3
New Hampshire 0.6 2.5 14 1.6 291% 0.14 4.0 Rockingham Portsmouth 0.6 2.5 14 1.6 291% 0.14 4.0
New York 79.0 83.1 14 72.6 5% -1.05 Albany Albany 0.4 0.8 14 0.5 89% 0.04 1.1 New York New York 78.6 82.3 14 72.1 5% -1.09
Rhode Island 1.3 5.8 14 3.0 356% 0.42 10.0 Newport Newport 0.0 0.1 14 0.1 107% 0.01 0.2 Providence Providence 1.2 5.7 14 3.0 362% 0.42 9.8
Atlantic - Middle 135.1 302.5 14 227.2 124% 19.28 545.3 Delaware 3.0 3.5 14 5.9 18% 0.23
New Castle Wilmington 3.0 3.5 14 5.9 18% 0.23 District of Columbia 0.0 0.0 14 0.0 123% 0.00 District of Columbia Washington 0.0 0.0 14 0.0 123% 0.00
Maryland 29.7 45.5 14 36.6 53% 1.58 62.7 Anne Arundel Annapolis 0.0 0.0 14 0.0 105% 0.00 Dorchester Cambridge 0.0 0.0 14 0.0 2115% 0.00 Somerset Crisfield 0.0 0.2 14 0.0 322% 0.01 Baltimore City Baltimore 29.7 45.3 14 36.5 53% 1.57 62.5
New Jersey 27.1 126.0 14 80.7 364% 10.38 251.9 Camden Camden 0.2 0.3 14 0.2 86% 0.03 0.7 Camden Gloucester City 0.1 0.0 14 0.1 -77% -0.01 Essex Newark 26.8 121.4 14 77.9 353% 9.96 242.2 Gloucester Paulsboro 0.0 0.4 14 0.2 4680% 0.05 0.9 Middlesex Perth Amboy 0.1 3.8 14 2.3 5735% 0.35 8.0
Pennsylvania 19.8 38.9 14 31.3 97% 2.48 72.2 Delaware Chester 3.6 10.7 14 6.9 196% 0.71 18.6 Philadelphia Philadelphia 16.2 28.2 14 24.4 74% 1.77 53.6
Virginia 55.5 88.5 14 72.8 59% 4.60 148.8 Alexandria (city) Alexandria 0.0 0.1 14 0.0 117% 0.00 Hopewell (city) Hopewell 0.1 2.3 14 0.2 1661% 0.06 Newport News (city) Newport News 4.3 85.8 14 10.4 1908% 2.35
58

Table 15. Summary of marine port shipments, value basis, 1997 and 2010, and forecast for 2020, by U.S. coastal region, state and county (in Billion 2010 Dollars)
Region, State, County Port
Value 1997
(Billion $)
Value 2010
(Billion $)
Number Obser-vations
Avg. Value
(Billion $)
1997-2010 % Change
Avg. Annual Change
(Billion $)
Forecast 2020
(Billion $) Norfolk (city) Norfolk 46.2 0.3 14 59.3 -99% 2.34
Richmond (city) Richmond-Petersburg 4.9 0.0 14 2.9 -100% -0.16
Atlantic - South 148.5 239.2 14 184.0 61% 8.41 322.8 Florida 63.0 79.7 14 69.6 26% 1.69 97.4
Brevard Port Canaveral 0.6 0.8 14 0.7 28% -0.01 Broward Port Everglades 16.5 25.8 14 19.8 57% 0.90 34.7 Duval Jacksonville 15.5 21.5 14 18.3 39% 0.67 29.3 Miami-Dade Miami 27.1 28.0 14 27.3 4% 0.10
Nassau Fernandina Beach 0.7 0.7 14 0.6 8% 0.00
Palm Beach W. Palm Beach 2.7 2.8 14 2.9 2% 0.01 St. Lucie Fort Pierce 0.0 0.1 14 0.1 509% 0.01 0.2
Georgia 29.6 87.7 14 49.1 196% 4.82 128.6 Chatham Savannah 25.4 76.5 14 42.7 201% 4.46 116.3 Glynn Brunswick 4.2 11.2 14 6.3 167% 0.36 12.2
North Carolina 8.4 10.7 14 6.3 27% 0.13 Carteret Beaufort 1.2 0.9 14 0.9 -26% -0.02 New Hanover Wilmington 7.2 9.8 14 5.4 36% 0.15
South Carolina 47.4 61.0 14 59.0 29% 1.78 88.3 Charleston Charleston 47.2 61.0 14 58.9 29% 1.78 88.4 Georgetown Georgetown 0.1 0.0 14 0.1 -98% -0.01 0.0
Gulf of Mexico - East 14.7 33.0 14 23.1 124% 1.83 53.3 Alabama 4.3 10.2 14 6.6 136% 0.58 16.2
Mobile Mobile 4.3 10.2 14 6.6 136% 0.58 16.2 Florida 4.5 7.9 14 6.5 77% 0.50 14.7
Bay Panama City 0.5 3.2 14 1.8 606% 0.32 7.0 Escambia Pensacola 0.1 0.1 14 0.1 -48% -0.01 Hillsborough Tampa 3.5 4.0 14 3.9 15% 0.15 Lee Boca Grande 0.0 13 0.0 0.00 Manatee Port Manatee 0.4 0.6 14 0.6 51% 0.04 1.2 Monroe Key West 0.0 0.0 14 0.0 442% 0.00 Pinellas Saint Petersburg 0.0 0.0 14 0.0 -43% 0.00
Mississippi 5.9 14.8 14 10.0 152% 0.75 22.4 Harrison Gulfport 2.3 3.3 14 3.9 41% 0.00 Jackson Pascagoula 3.5 11.5 14 6.2 225% 0.75 18.5 Warren Vicksburg 0.0 12.0 0.0 0.00 Washington Greenville 0.0 0.0 14.0 0.0 -0.7 0.00
Gulf of Mexico - West 148.8 368.0 14 238.0 147% 21.25 588.6 Louisiana 59.4 118.2 14 80.6 99% 5.98 179.2
Calcasieu Lake Charles 4.8 14.2 14 8.3 195% 0.86 22.6 East Baton Rouge Baton Rouge 7.6 9.6 14 7.7 27% 0.36 13.6 Jefferson Avondale 0.0 0.0 14 0.0 -46% 0.00 Orleans New Orleans 32.1 46.4 14 34.6 44% 1.56 60.3 Plaquemines Port Sulphur 0.0 0.1 14 0.0 456% 0.01 0.1 St. Charles Destrehan 0.0 0.0 13 0.0 71% 0.00 St. Charles St. Rose 0.2 1.4 14 0.5 604% 0.06 1.5 St. James Good Hope 0.0 10 1.2 0.06 St. James Gramercy 9.5 21.6 14 11.8 128% 1.09 29.8 St. Mary Morgan City 5.2 25.0 14 16.7 381% 2.06 50.7
Texas 89.4 249.8 14 157.4 179% 15.28 409.4 Brazoria Freeport 3.8 10.6 14 7.9 177% 0.76 20.4 Calhoun Port Lavaca 0.5 1.0 14 0.9 77% 0.06 1.8 Cameron Brownsville 0.1 0.8 14 0.4 493% 0.06 1.5 Galveston Galveston 5.4 5.8 14 6.4 8% 0.00
59

Table 15. Summary of marine port shipments, value basis, 1997 and 2010, and forecast for 2020, by U.S. coastal region, state and county (in Billion 2010 Dollars)
Region, State, County Port
Value 1997
(Billion $)
Value 2010
(Billion $)
Number Obser-vations
Avg. Value
(Billion $)
1997-2010 % Change
Avg. Annual Change
(Billion $)
Forecast 2020
(Billion $) Galveston Texas City 0.6 19.3 14 8.0 3325% 1.69 35.9 Harris Houston 61.2 153.7 14 97.5 151% 8.88 244.0 Jefferson Beaumont 4.1 14.3 14 10.3 245% 0.96 26.1 Jefferson Port Arthur 6.4 19.2 14 11.2 199% 1.19 30.8 Jefferson Sabine 0.0 0.1 14 0.0 1446% 0.00 0.1 Nueces Corpus Christi 7.2 25.0 14 14.9 249% 1.67 42.4 Orange Orange 0.0 0.0 14 0.0 19512% 0.00 0.1
Pacific - Hawaii 1.9 4.3 14 3.3 121% 0.30 8.2 Hawaii 1.9 4.3 14 3.3 121% 0.30 8.2
Hawaii Hawaii County 0.0 1 0.0 #DIV/0! Hawaii Hilo 0.0 0.0 14 0.0 182% 0.00 Hawaii Kona 0.0 13 0.0 0.00 Honolulu Honolulu 1.9 4.3 14 3.2 120% 0.30 8.2
Kauai Nawiliwili-Port Allen 0.0 13 0.0 0.00
Maui Kahului 0.0 0.0 14 0.0 813% 0.00 0.0 Pacific - California 299.4 460.6 14 374.6 54% 14.07 606.7
California 299.4 460.6 14 374.6 54% 14.07 606.7 Alameda Alameda 0.0 0.0 14 0.0 -57% 0.00 Alameda Oakland 43.5 52.3 14 44.0 20% 0.48 Contra Costa Crockett 0.2 0.3 14 0.3 32% -0.01 Contra Costa Martinez 0.5 2.9 14 0.9 527% 0.14 3.2 Contra Costa Richmond 1.3 7.6 14 3.8 462% 0.70 15.3 Contra Costa Selby 0.0 0.0 14 0.1 73% 0.01 Humboldt Eureka 0.1 0.0 14 0.1 -88% -0.01 0.0 Los Angeles El Segundo 0.6 5.8 14 3.3 863% 0.48 11.2 Los Angeles Long Beach 92.4 112.7 14 95.7 22% 1.60 122.0 Los Angeles Los Angeles 150.4 262.5 14 210.4 75% 10.02 375.8 Los Angeles Segundo 0.0 0.1 14 0.0 6108% 0.01 0.2 Marin San Pablo Bay 0.1 0.3 14 0.2 421% 0.02 Mariposa El Capitan 0.0 10 0.0 0.00 Monterey Monterey 0.0 0.0 14 0.0 -2% 0.00 Sacramento Sacramento 0.2 0.2 14 0.2 -35% 0.01 San Diego San Diego 2.9 4.7 14 5.5 59% 0.17 San Francisco San Francisco 1.3 3.4 14 2.4 172% 0.30 7.3
San Joaquin San Joaquin River 0.0 0.0 14 0.0 -98% 0.00 0.0
San Joaquin Stockton 0.5 0.8 14 0.7 53% 0.03 1.3 San Luis Obispo Avila Beach 0.0 0.0 14 0.0 -69% 0.00 San Luis Obispo Morro Bay 0.0 0.0 14 0.0 732% 0.00 San Mateo Redwood City 0.0 0.0 14 0.0 -82% 0.00 Solano Carquinez Strait 1.2 1.6 14 1.1 30% 0.04 Solano Suisun Bay 0.1 0.0 14 0.0 -96% 0.00 0.0 Ventura Port Hueneme 4.0 5.4 14 5.7 37% 0.10 Ventura Ventura 0.0 0.0 13 0.0 1995% 0.00
Pacific - Northwest 104.8 108.7 14 100.5 4% 1.55 126.0 Oregon 16.6 12.7 14 14.9 -24% -0.01
Clatsop Astoria 0.0 0.0 14 0.0 -76% 0.00 0.0 Coos Coos Bay 0.4 0.1 14 0.2 -71% -0.01 0.0 Lincoln Newport 0.0 0.0 14 0.0 -88% 0.00 Multnomah Portland 16.2 12.6 14 14.8 -22% 0.00
Washington 88.2 96.0 14 85.6 9% 1.56 111.3 Clallam Neah Bay 0.0 10 0.0 0.00 Clallam Port Angeles 0.2 0.0 14 0.1 -79% -0.01 0.0 Clark Vancouver 1.4 3.3 14 2.4 135% 0.16 5.0
60
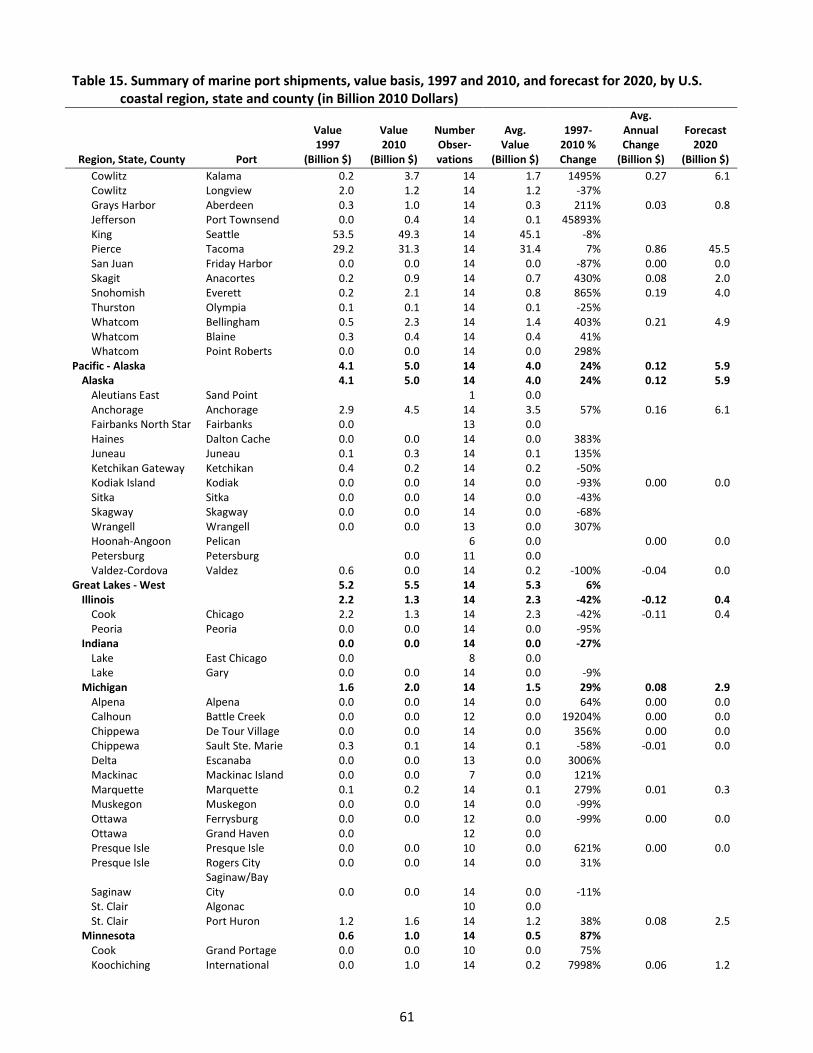
Table 15. Summary of marine port shipments, value basis, 1997 and 2010, and forecast for 2020, by U.S. coastal region, state and county (in Billion 2010 Dollars)
Region, State, County Port
Value 1997
(Billion $)
Value 2010
(Billion $)
Number Obser-vations
Avg. Value
(Billion $)
1997-2010 % Change
Avg. Annual Change
(Billion $)
Forecast 2020
(Billion $) Cowlitz Kalama 0.2 3.7 14 1.7 1495% 0.27 6.1 Cowlitz Longview 2.0 1.2 14 1.2 -37% -0.02 Grays Harbor Aberdeen 0.3 1.0 14 0.3 211% 0.03 0.8 Jefferson Port Townsend 0.0 0.4 14 0.1 45893% 0.01 King Seattle 53.5 49.3 14 45.1 -8% -0.23 Pierce Tacoma 29.2 31.3 14 31.4 7% 0.86 45.5 San Juan Friday Harbor 0.0 0.0 14 0.0 -87% 0.00 0.0 Skagit Anacortes 0.2 0.9 14 0.7 430% 0.08 2.0 Snohomish Everett 0.2 2.1 14 0.8 865% 0.19 4.0 Thurston Olympia 0.1 0.1 14 0.1 -25% 0.00 Whatcom Bellingham 0.5 2.3 14 1.4 403% 0.21 4.9 Whatcom Blaine 0.3 0.4 14 0.4 41% 0.01 Whatcom Point Roberts 0.0 0.0 14 0.0 298% 0.00
Pacific - Alaska 4.1 5.0 14 4.0 24% 0.12 5.9 Alaska 4.1 5.0 14 4.0 24% 0.12 5.9
Aleutians East Sand Point 1 0.0 #DIV/0! Anchorage Anchorage 2.9 4.5 14 3.5 57% 0.16 6.1 Fairbanks North Star Fairbanks 0.0 13 0.0 0.00 Haines Dalton Cache 0.0 0.0 14 0.0 383% 0.00 Juneau Juneau 0.1 0.3 14 0.1 135% 0.01 Ketchikan Gateway Ketchikan 0.4 0.2 14 0.2 -50% -0.01 Kodiak Island Kodiak 0.0 0.0 14 0.0 -93% 0.00 0.0 Sitka Sitka 0.0 0.0 14 0.0 -43% 0.00 Skagway Skagway 0.0 0.0 14 0.0 -68% 0.00 Wrangell Wrangell 0.0 0.0 13 0.0 307% 0.00 Hoonah-Angoon Pelican 6 0.0 0.00 0.0 Petersburg Petersburg 0.0 11 0.0 0.00 Valdez-Cordova Valdez 0.6 0.0 14 0.2 -100% -0.04 0.0
Great Lakes - West 5.2 5.5 14 5.3 6% 0.01 Illinois 2.2 1.3 14 2.3 -42% -0.12 0.4
Cook Chicago 2.2 1.3 14 2.3 -42% -0.11 0.4 Peoria Peoria 0.0 0.0 14 0.0 -95% 0.00
Indiana 0.0 0.0 14 0.0 -27% 0.00 Lake East Chicago 0.0 8 0.0 0.00 Lake Gary 0.0 0.0 14 0.0 -9% 0.00
Michigan 1.6 2.0 14 1.5 29% 0.08 2.9 Alpena Alpena 0.0 0.0 14 0.0 64% 0.00 0.0 Calhoun Battle Creek 0.0 0.0 12 0.0 19204% 0.00 0.0 Chippewa De Tour Village 0.0 0.0 14 0.0 356% 0.00 0.0 Chippewa Sault Ste. Marie 0.3 0.1 14 0.1 -58% -0.01 0.0 Delta Escanaba 0.0 0.0 13 0.0 3006% 0.00 Mackinac Mackinac Island 0.0 0.0 7 0.0 121% 0.00 Marquette Marquette 0.1 0.2 14 0.1 279% 0.01 0.3 Muskegon Muskegon 0.0 0.0 14 0.0 -99% 0.00 Ottawa Ferrysburg 0.0 0.0 12 0.0 -99% 0.00 0.0 Ottawa Grand Haven 0.0 12 0.0 0.00 Presque Isle Presque Isle 0.0 0.0 10 0.0 621% 0.00 0.0 Presque Isle Rogers City 0.0 0.0 14 0.0 31% 0.00
Saginaw Saginaw/Bay City 0.0 0.0 14 0.0 -11% 0.00
St. Clair Algonac 10 0.0 0.00 St. Clair Port Huron 1.2 1.6 14 1.2 38% 0.08 2.5
Minnesota 0.6 1.0 14 0.5 87% 0.01 Cook Grand Portage 0.0 0.0 10 0.0 75% 0.00 Koochiching International 0.0 1.0 14 0.2 7998% 0.06 1.2
61

Table 15. Summary of marine port shipments, value basis, 1997 and 2010, and forecast for 2020, by U.S. coastal region, state and county (in Billion 2010 Dollars)
Region, State, County Port
Value 1997
(Billion $)
Value 2010
(Billion $)
Number Obser-vations
Avg. Value
(Billion $)
1997-2010 % Change
Avg. Annual Change
(Billion $)
Forecast 2020
(Billion $) Falls
Lake Silver Bay 0.0 0.0 13 0.0 107% 0.00 0.1 Lake of the Woods Baudette 0.0 12 0.0 0.00 Roseau Warroad 0.0 0.0 14 0.0 1270% 0.00 St. Louis Duluth 0.5 9 0.4 -0.04 0.0
Wisconsin 0.8 1.1 14 0.9 37% 0.04 Ashland Ashland 0.0 0.0 13 0.0 -98% 0.00 Door Green Bay 0.0 0.1 14 0.1 455% 0.01 0.2 Douglas Superior 0.5 0.8 14 0.6 45% 0.02 Manitowoc Manitowoc 0.0 8 0.0 0.00 Marinette Marinette 0.0 0.0 14 0.1 -5% 0.00 Milwaukee Milwaukee 0.2 0.2 14 0.2 -29% 0.01 Racine Racine 0.0 0.0 14 0.0 317% 0.00 Sheboygan Sheboygan 0.0 8 0.0 0.00
Great Lakes - East 8.4 6.8 14 8.6 -20% 0.06 Michigan 5.6 3.9 14 5.9 -30% 0.02
Wayne Detroit 5.6 3.9 14 5.9 -30% 0.02 New York 1.0 1.1 14 1.0 8% 0.02
Jefferson Alexandria Bay 0.1 0.1 14 0.1 -21% 0.00 Jefferson Cape Vincent 0.0 7 0.0 0.00 Jefferson Clayton 0.0 0.0 9 0.0 38321% 0.00 Monroe Rochester 0.0 0.0 14 0.1 99% 0.00 Niagara Niagara Falls 0.9 0.8 14 0.7 -5% 0.00 Oswego Oswego 0.0 0.1 14 0.1 1702% 0.01 0.3 St. Lawrence Ogdensburg 0.0 0.0 14 0.0 -67% 0.00 Wayne Sodus Point 0.0 0.0 8 0.0 1724% 0.00
Ohio 1.8 1.8 14 1.6 0% 0.02 Ashtabula Ashtabula 0.3 10 0.2 -0.02 0.0
Ashtabula Ashtabula/Conneaut 0.2 5 0.2 0.03
Ashtabula Conneaut 0.0 9 0.0 0.01 Cuyahoga Cleveland 0.6 0.5 14 0.5 -22% 0.00 Erie Huron 0.0 0.0 14 0.0 2253% 0.00 Lake Fairport 0.0 10 0.0 0.00 Lorain Lorain 0.0 0.0 13 0.0 50% 0.00 Lucas Toledo 0.9 1.1 14 0.8 20% 0.04 1.5
Pennsylvania 0.1 0.0 14 0.0 -57% 0.00 Erie Erie 0.1 0.0 14 0.0 -57% 0.00
Grand Total 961.4 1,639.6 14 1,259.0 71% 67.00 2,364.4 Note: slope and forecasts were based on a linear Ordinary Least Squares regression over time. Slope coefficients and forecasted values for 2020 were only shown when the regressions yielded a statistically significant slope coefficient and forecasted values that were greater than or equal to zero.
62

Trends in Commercial Fisheries
Tables 16 and 17 provide data on landed weight and value, respectively, for U.S. commercial fisheries
during the period 1990 to 2010. The total landed weight of fish caught in the United States in 2010 was
more than 4.5 billion pounds. This represented a 17 percent decrease since 1990 (5.4 billion lbs.). The total
landed value in 2010 exceeded $2.70 billion, which was 18 percent less than the total value for 1990 ($3.3
billion) in inflation adjusted dollars. The Pacific-Alaska region had the highest landed weight of 1.76 billion
pounds in 2010 followed by the Gulf of Mexico-West (769 M lbs.), Atlantic-Middle (556 M lbs.), Pacific-
California (414 M lbs.), Atlantic-North (392 M lbs.), and Pacific-Northwest (368 M lbs.) (Table 16). The
region with the highest landed value from fishing in 2010 was Pacific-Alaska with $907 million, followed by
Atlantic-North ($563 M), Pacific-Northwest ($276 M), Atlantic-Middle ($269 M), Gulf of Mexico-West ($249
M), Gulf of Mexico-East ($150 M), and Pacific-California ($140 M). It is notable that in 2010 Alaska had both
the greatest landed weight and value of any state or region in the U.S. States with more than 100 million
pounds landed weight fishing in 2010 included Louisiana (747 M lbs.), Virginia (445 M lbs.), California (414
M lbs.), Massachusetts (248 M lbs.), Oregon (196 M lbs.), Washington (172 M lbs.), and Mississippi (111 M
lbs.). In addition to Alaska, the states with more than $100 million in landed-value from fishing in 2010
included Massachusetts ($398 M), Louisiana ($196 M), Washington ($180), New Jersey ($147 M), California
($140 M), Virginia ($113 M), and Florida ($108 M, for both south Atlantic and eastern Gulf of Mexico
regions).
There were sixteen counties or census areas in the United States in 2010 that had more than 100 million
pounds of landed weight fishing. The Aleutians West census Area in Alaska accounted for the highest
landed weight of 515 million pounds, followed by Northumberland, Virginia (426 M lbs.), Kodiak Island,
Alaska (325 M lbs.), Aleutians East, Alaska (302 M lbs.), Plaquemines, Louisiana (281 M lbs.), Vermilion,
Louisiana (260 M lbs.), Los Angeles, California (186 M lbs.), Cameron, Louisiana (150 M lbs.), Valdez-
Cordova, Alaska (147 M lbs.), Bristol, Massachusetts (133 M lbs.), Ventura, California (131 M lbs.), Bristol
Bay, Alaska (124 M lbs.), Kenai Peninsula, Alaska (115 M lbs.), Jackson, Mississippi (105 M lbs.), Clatsop,
Oregon (100 M lbs.), and Grays Harbor, Washington (100 M lbs.) (Table 16). Among individual counties,
Bristol County in Massachusetts had the highest landed value of fish at $306 million in 2010, followed by
Aleutians West, Alaska ($163 M), Kenai Peninsula, Alaska ($150 M), Kodiak Island, Alaska ($128 M), Bristol
Bay, Alaska ($101 M), Valdez-Cordova, Alaska ($84 M), and Cape May, New Jersey ($81 M).
Overall trends in fishery landings between 1990 and 2010 indicate decreases of 17.0 percent in weight and
18.2 percent in value in 2010 compared with 1990. The downward national trend in fishery landings and
values between 1990 and 2010 was not experienced everywhere. The Pacific-Northwest region had the
highest increase in landed weight of 44.6 percent from 1990 to 2010, whereas the Atlantic-South region
63

suffered the highest decrease of 62.8 percent. In addition to the Pacific-Northwest, the only other region to
record an increase in landed weight during 1990-2010 was Pacific-Alaska (28%). Other regions that
experienced a decrease in the landed weight included the Gulf of Mexico-East (-56.7 %), Pacific-California (-
43.8%), Atlantic-Middle (-36.9%), Gulf of Mexico-West (-29.5%), and Atlantic-North (-28.9 %) (Table 16). Not
all states and counties followed the overall regional pattern of increase or decrease in landed value
between 1990 and 2010. States with an increase in the fishery landings included Oregon (51.4%),
Washington (37.6%), and Alaska (28%). Rhode Island had the highest decrease in weight (-71.5%) followed
by Texas (-67.8%), Mississippi (-65.1%), Virginia (-38.6%), and New Jersey (31.7) (Table 16).
The Pacific-Northwest and The Atlantic-Middle were the only regions with an increase in landed value from
1990 to 2010, at 20 percent and 12 percent, respectively. The Pacific-California region experienced the
largest decrease in landed value at -63.4 percent, followed by The Gulf of Mexico-West (-55.1%), the
Atlantic-South (-34.3%), the Gulf of Mexico-East (-18.4%), and the Pacific-Alaska (-10.7%). The states with a
significant increase in the value of fishery landings from 1990 to 2010 were Maine (40.3%), New Jersey
(31.4%), Florida (30.0%), and Washington (25.2%). Texas suffered the largest decline in the value of fishery
landings from 1990 to 2010 with a 75.5 percent decrease. Other states that saw a decrease of more than 30
percent were Rhode Island (-72.0%), California (-63.4), Mississippi (-61.8%), Alabama (-44.1%), Louisiana (-
41.9%), and Maryland (34.6%) (Table 17). As with the landed weight, landed value in U.S. states and
counties did not always follow the overall patterns of the regions to which they belonged.
64

Table 16. Summary of commercial fishery landings, weight basis, in U.S. coastal regions, states and counties, 1990-2010
Region - State County 1990 1995 2000 2005 2010 Average annual change
Percent Change
1990-2010 -------------------------------Million pounds-------------------------------
Atlantic - North 550.5 402.3 371.3 473.6 392.0 -24.6 -29% Connecticut 0.0 0.0 13.5 0.0 9.0 1.8 New London 0.0 0.0 13.5 0.0 9.0 1.8 Maine 85.7 114.4 111.3 106.9 77.0 -2.5 -10% Cumberland 49.5 66.8 63.9 56.8 38.0 -3.3 -23% Hancock 0.0 2.2 15.9 15.5 17.0 4.7 Knox 36.2 44.6 28.3 34.6 22.0 -3.8 -39% Washington 0.0 0.8 3.2 0.0 0.0 -0.1 Massachusetts 295.5 164.0 158.0 299.7 248.0 4.1 -16% Barnstable 32.4 18.5 18.1 12.7 15.0 -4.1 -54% Bristol 117.8 70.8 89.9 153.4 133.0 11.3 13% Essex 125.6 64.6 43.2 124.2 88.0 -1.6 -30% Suffolk 19.7 10.1 6.8 9.4 12.0 -1.6 -39% New York 21.9 35.2 29.2 17.9 16.0 -2.9 -27% Suffolk 21.9 35.2 29.2 17.9 16.0 -2.9 -27% Rhode Island 147.4 88.7 59.3 49.1 42.0 -25.0 -72%
Newport 30.0 13.2 0.0 7.3 7.0 -5.2 -77% Washington 117.4 75.5 59.3 41.8 35.0 -19.9 -70% Atlantic - Middle 885.2 899.7 562.5 548.4 556.0 -101.0 -37%
Maryland 21.1 12.5 9.6 8.0 16.0 -1.5 -24% Worcester 21.1 12.5 9.6 8.0 16.0 -1.5 -24% New Jersey 139.1 160.9 160.5 138.8 95.0 -11.0 -32% Atlantic 39.2 42.3 50.4 31.8 24.0 -4.1 -39% Cape May 69.4 75.2 58.9 74.6 43.0 -5.3 -38% Monmouth 8.2 13.6 3.9 0.0 0.0 -3.0 -100% Ocean 22.3 29.8 47.3 32.4 28.0 1.4 26% Virginia 725.0 726.3 392.4 401.6 445.0 -88.5 -39% Accomack 1.1 1.1 2.9 4.7 3.0 0.7 173%
Norfolk 24.3 20.3 22.7 23.5 16.0 -1.3 -34% Northampton 7.2 0.4 0.0 0.0 0.0 -1.5 -100% Northumberland 692.4 704.5 366.8 373.4 426.0 -86.4 -38% Atlantic - South 155.8 208.4 171.6 78.4 58.0 -32.6 -63%
Florida 8.8 14.4 18.6 9.4 10.0 -0.3 14% Brevard 8.8 10.1 10.9 4.7 4.0 -1.5 -55% Duval 0.0 4.3 4.5 4.7 6.0 1.2 Saint Lucie 0.0 0.0 3.2 0.0 0.0 0.0 Georgia 12.0 10.0 6.1 3.9 0.0 -3.0 -100% Chatham 0.0 4.0 0.0 0.0 0.0 -0.4 Glynn 0.0 0.0 1.9 0.0 0.0 0.0 McIntosh 12.0 6.0 4.2 3.9 0.0 -2.6 -100% North Carolina 135.0 162.0 132.7 58.4 44.0 -28.6 -67%
Beaufort 0.0 10.0 7.3 0.0 0.0 -1.0 Carteret 102.0 87.0 68.4 19.3 6.0 -26.0 -94% Dare 23.0 39.0 33.3 27.2 25.0 -0.8 9% Hyde 0.0 11.0 12.0 6.8 9.0 1.4 Onslow 0.0 0.0 3.1 0.0 0.0 0.0
65

Table 16. Summary of commercial fishery landings, weight basis, in U.S. coastal regions, states and counties, 1990-2010
Region - State County 1990 1995 2000 2005 2010 Average annual change
Percent Change
1990-2010 -------------------------------Million pounds-------------------------------
Pamlico 10.0 9.0 8.6 5.1 4.0 -1.6 -60% Pasquotank 0.0 6.0 0.0 0.0 0.0 -0.6
South Carolina 0.0 22.0 14.2 6.7 4.0 -0.7 Beaufort 0.0 7.0 4.3 0.0 0.0 -0.7 Charleston 0.0 11.0 6.9 6.7 4.0 0.4
Georgetown 0.0 4.0 3.0 0.0 0.0 -0.4 Gulf of Mexico - East 376.2 221.1 292.9 236.5 163.0 -41.1 -57%
Alabama 19.4 27.6 28.5 22.4 14.0 -1.6 -28% Baldwin 5.7 5.5 5.5 5.1 11.0 1.0 93% Mobile 13.7 22.1 23.0 17.3 3.0 -2.6 -78% Florida 38.3 52.9 50.3 46.5 38.0 -0.7 -1% Bay 13.2 5.4 0.0 2.8 2.0 -2.5 -85% Collier 0.0 0.0 3.5 0.0 2.0 0.4 Franklin 5.0 4.7 10.3 4.9 3.0 -0.4 -40% Gulf 0.0 0.0 0.0 6.2 6.0 1.8 Hillsborough 0.0 10.9 11.7 10.0 5.0 0.9 Lee 8.7 8.5 7.9 8.6 7.0 -0.3 -20% Monroe 11.4 23.4 16.9 14.0 13.0 -0.6 14% Mississippi 318.5 140.6 214.1 167.6 111.0 -38.8 -65% Harrison 14.6 12.0 14.2 8.5 6.0 -2.1 -59%
Jackson 303.9 128.6 199.9 159.1 105.0 -36.7 -65% Gulf of Mexico - West 1,090.6 1,135.3 1,392.6 835.1 769.0 -94.3 -29%
Louisiana 1,022.3 1,074.3 1,293.5 767.6 747.0 -85.7 -27% Assumption 0.0 0.0 0.0 6.8 0.0 0.7 Cameron 232.6 280.0 414.5 10.6 150.0 -43.5 -36% Iberia 10.2 14.0 24.7 0.0 0.0 -3.4 -100% Jefferson 14.2 12.6 18.2 0.0 0.0 -4.1 -100% Lafourche 20.9 18.7 26.9 24.2 14.0 -0.8 -33% Orleans 0.0 6.5 0.0 0.0 0.0 -0.7 Plaquemines 252.2 303.3 403.6 194.0 281.0 -5.2 11% Saint Bernard 8.3 9.3 15.5 7.7 5.0 -0.8 -40% Saint Mary 146.5 127.4 20.2 17.7 5.0 -39.3 -97% Terrebonne 164.4 123.3 48.2 42.6 32.0 -34.6 -81% Vermilion 173.0 179.2 321.7 464.0 260.0 45.9 50% Texas 68.3 61.0 99.1 67.5 22.0 -8.6 -68% Aransas 18.0 12.0 6.7 0.0 0.0 -4.8 -100%
Brazoria 6.2 4.0 7.5 0.0 0.0 -1.6 -100% Calhoun 0.0 0.0 3.6 0.0 0.0 0.0 Cameron 25.2 16.0 29.2 20.1 22.0 -0.2 -13% Galveston 8.0 17.0 17.4 15.1 0.0 -1.8 -100% Harris 0.0 0.0 2.9 0.0 0.0 0.0 Jefferson 10.9 6.0 17.0 17.8 0.0 -1.0 -100% Matagorda 0.0 6.0 14.8 14.5 0.0 0.9 Pacific - Hawaii 0.0 23.9 27.0 22.2 23.0 4.4
66

Table 16. Summary of commercial fishery landings, weight basis, in U.S. coastal regions, states and counties, 1990-2010
Region - State County 1990 1995 2000 2005 2010 Average annual change
Percent Change
1990-2010 -------------------------------Million pounds-------------------------------
Hawaii 0.0 23.9 27.0 22.2 23.0 4.4 Honolulu 0.0 23.9 27.0 22.2 23.0 4.4 Pacific - California 736.4 823.4 535.9 568.8 414.0 -89.9 -44%
California 736.4 823.4 535.9 568.8 414.0 -89.9 -44% Colusa 0.0 13.6 0.0 0.0 0.0 -1.4 Del Norte 62.2 43.6 15.6 14.0 13.0 -12.8 -79% Humboldt 48.8 30.2 13.7 29.8 10.0 -7.8 -80% Los Angeles 317.0 337.0 254.7 279.4 186.0 -32.0 -41% Marin 25.2 12.8 0.0 0.0 0.0 -6.3 -100% Mendocino 35.0 23.6 7.4 12.2 6.0 -6.9 -83% Monterey 66.2 64.0 61.4 79.0 55.0 -0.7 -17% San Diego 7.0 7.4 2.6 3.8 0.0 -1.8 -100% San Francisco 53.6 31.4 11.2 10.2 8.0 -11.2 -85% San Luis Obispo 19.4 12.4 0.0 0.0 0.0 -5.1 -100% Santa Barbara 23.2 13.8 7.1 15.8 5.0 -3.4 -78% Ventura 78.8 233.6 162.2 124.6 131.0 -0.5 66% Pacific - Northwest 254.5 552.0 337.4 532.0 368.0 20.7 45%
Oregon 129.5 228.0 251.6 309.2 196.0 21.4 51% Clatsop 41.2 89.0 130.1 164.7 100.0 19.3 143% Coos 31.8 21.0 19.2 25.7 31.0 0.3 -3% Curry 16.4 6.0 0.0 5.4 7.0 -1.9 -57% Lincoln 34.0 112.0 102.3 110.0 57.0 4.4 68% Tillamook 6.1 0.0 0.0 3.4 1.0 -0.7 -84% Washington 125.0 324.0 85.8 222.8 172.0 -0.7 38%
Clallam 4.8 5.0 0.0 10.5 6.0 0.8 25% Grays Harbor 26.2 24.0 37.5 122.8 100.0 24.6 282% Jefferson 0.0 0.0 0.0 2.0 1.0 0.4 King 16.5 229.0 3.8 4.5 5.0 -24.8 -70% Kitsap 0.0 4.0 0.0 0.0 0.0 -0.4 Mason 3.5 5.0 0.0 10.4 7.0 1.2 100% Pacific 13.2 18.0 19.8 39.5 23.0 4.1 74% Pierce 0.0 0.0 0.0 2.2 2.0 0.6 Skagit 15.5 12.0 0.0 5.8 5.0 -2.7 -68% Snohomish 3.4 0.0 0.0 1.0 0.0 -0.6 -100% Thurston 2.6 0.0 0.0 2.3 2.0 0.1 -23% Whatcom 39.3 27.0 24.7 21.8 21.0 -4.2 -47% Pacific - Alaska 1,374.2 1,581.8 1,325.5 1,799.0 1,759.0 98.7 28%
Alaska 1,374.2 1,581.8 1,325.5 1,799.0 1,759.0 98.7 28% Aleutians East 0.0 0.0 0.0 0.0 302.0 60.4 Aleutians West (CA) 516.2 684.6 699.8 887.6 515.0 20.1 0% Anchorage 0.0 11.3 1.5 1.1 7.0 0.4 Bethel (CA) 9.4 0.0 0.0 0.0 0.0 -1.9 -100% Bristol Bay 90.4 120.9 63.1 105.3 124.0 5.2 37% Dillingham (CA) 24.7 0.0 0.0 0.0 0.0 -4.9 -100% Haines 0.0 0.0 9.9 0.0 0.0 0.0 Juneau 0.0 0.0 6.7 18.5 16.0 5.1
67

Table 16. Summary of commercial fishery landings, weight basis, in U.S. coastal regions, states and counties, 1990-2010
Region - State County 1990 1995 2000 2005 2010 Average annual change
Percent Change
1990-2010 -------------------------------Million pounds-------------------------------
Kenai Peninsula 93.1 82.7 60.2 94.3 115.0 5.5 24% Ketchikan Gateway 52.6 116.7 57.3 102.5 75.0 3.1 43% Kodiak Island 272.5 362.4 289.6 337.2 325.0 8.0 19% Lake and Peninsula 65.0 0.0 0.0 0.0 0.0 -13.0 -100% Nome (CA) 9.0 0.0 0.0 0.0 0.0 -1.8 -100% Petersburg (CA) 67.5 83.0 32.3 94.9 49.0 -2.5 -27%
Prince of Wales-Hyder (CA) 9.0 0.0 1.3 0.0 0.0 -1.8 -100%
Sitka 24.4 31.0 95.5 38.1 74.0 10.6 203% Valdez-Cordova (CA) 116.9 72.0 0.0 111.2 147.0 9.9 26% Wrangell 15.6 17.2 8.3 4.4 4.0 -3.6 -74% Yakutat 7.9 0.0 0.0 3.9 6.0 0.0 -24% Grand Total 5,423.4 5,847.9 5,016.7 5,094.0 4,502.0 -259.7 -17%
68

Table 17. Summary of commercial fishery landings, value basis, in U.S. coastal regions, states and counties, 1990-2010
Region - State County 1990 1995 2000 2005 2010
Average annual change
Percent change
1990-2010 ------------- Million dollars (2010) ------------
Atlantic - North 581.2 356.5 469.1 565.3 563.3 17.3 -3% Connecticut 0.0 0.0 16.5 0.0 29.1 5.8 New London 0.0 0.0 16.5 0.0 29.1 5.8 Maine 53.2 67.3 100.8 82.2 74.7 5.8 40% Cumberland 48.5 54.4 56.7 38.3 18.8 -7.5 -61% Hancock 0.0 3.1 22.5 35.7 45.3 12.3 Knox 4.7 7.7 10.2 8.2 10.6 1.2 123% Washington 0.0 2.0 11.4 0.0 0.0 -0.2 Massachusetts 356.2 185.0 269.2 397.5 397.6 29.5 12% Barnstable 24.9 14.8 19.6 22.1 19.9 -0.3 -20% Bristol 246.6 121.9 185.9 312.6 306.0 30.9 24% Essex 62.6 34.7 52.3 50.9 56.6 0.4 -10% Suffolk 22.0 13.6 11.4 11.8 15.1 -1.6 -31% New York 32.0 37.7 30.9 27.2 22.8 -2.9 -29% Suffolk 32.0 37.7 30.9 27.2 22.8 -2.9 -29% Rhode Island 139.8 66.6 51.7 58.4 39.1 -21.0 -72% Newport 41.6 15.5 0.0 16.0 6.9 -6.9 -83% Washington 98.2 51.1 51.7 42.4 32.2 -14.1 -67% Atlantic - Middle 239.0 224.5 226.2 301.4 268.8 13.7 12% Maryland 13.5 11.6 8.2 11.3 8.8 -1.0 -35% Worcester 13.5 11.6 8.2 11.3 8.8 -1.0 -35% New Jersey 111.8 107.0 112.2 149.7 146.9 11.3 31% Atlantic 27.2 30.2 32.6 20.5 17.3 -3.0 -36% Cape May 52.8 41.5 35.9 75.7 81.0 9.1 53% Monmouth 4.7 6.1 3.2 0.0 0.0 -1.6 -100% Ocean 27.1 29.2 40.5 53.6 48.6 6.7 79% Virginia 113.7 106.0 105.8 140.4 113.1 3.3 -1% Accomack 2.1 1.4 3.0 16.3 3.5 1.8 63% Norfolk 50.2 44.0 66.0 94.2 75.4 10.1 50% Northampton 7.0 0.4 0.0 0.0 0.0 -1.4 -100% Northumberland 54.3 60.2 36.9 30.0 34.2 -7.0 -37% Atlantic - South 118.1 226.9 183.4 77.8 77.6 -23.0 -34% Florida 20.2 33.8 37.1 15.7 17.5 -2.4 -13% Brevard 20.2 23.0 19.1 6.7 6.5 -4.4 -68% Duval 0.0 10.9 12.4 9.0 11.0 2.0 Saint Lucie 0.0 0.0 5.6 0.0 0.0 0.0 Georgia 27.5 23.1 18.1 6.3 0.0 -7.2 -100% Chatham 0.0 8.2 0.0 0.0 0.0 -0.8 Glynn 0.0 0.0 6.4 0.0 0.0 0.0 McIntosh 27.5 15.0 11.7 6.3 0.0 -6.4 -100% North Carolina 70.4 121.0 93.6 44.3 50.2 -11.7 -29%
69

Table 17. Summary of commercial fishery landings, value basis, in U.S. coastal regions, states and counties, 1990-2010
Region - State County 1990 1995 2000 2005 2010
Average annual change
Percent change
1990-2010 ------------- Million dollars (2010) ------------
Beaufort 0.0 8.2 7.0 0.0 0.0 -0.8 Carteret 35.2 47.6 21.1 11.5 9.2 -8.8 -74% Dare 22.9 34.0 30.0 21.7 22.0 -1.4 -4% Hyde 0.0 12.2 14.0 5.9 10.6 1.5 Onslow 0.0 0.0 7.9 0.0 0.0 0.0 Pamlico 12.2 13.6 13.6 5.2 8.4 -1.6 -31% Pasquotank 0.0 5.4 0.0 0.0 0.0 -0.5 South Carolina 0.0 48.9 34.6 11.5 9.9 -1.8 Beaufort 0.0 15.0 9.6 0.0 0.0 -1.5 Charleston 0.0 25.8 17.6 11.5 9.9 0.5 Georgetown 0.0 8.2 7.4 0.0 0.0 -0.8 Gulf of Mexico - East 183.6 267.6 276.5 165.0 149.9 -17.0 -18% Alabama 48.7 65.1 76.7 40.2 27.2 -6.8 -44% Baldwin 17.0 14.1 15.6 8.7 22.5 0.6 32% Mobile 31.7 51.0 61.1 31.4 4.7 -7.3 -85% Florida 77.6 154.1 134.8 98.7 100.8 -0.9 30% Bay 16.2 3.3 0.0 7.2 6.1 -1.6 -62% Collier 0.0 0.0 11.2 0.0 7.3 1.5 Franklin 11.5 13.9 14.2 9.6 9.0 -0.9 -22% Gulf 0.0 0.0 0.0 6.4 3.4 1.3 Hillsborough 0.0 24.7 25.5 19.7 12.6 2.0 Lee 16.7 21.6 20.6 16.9 12.4 -1.3 -26% Monroe 33.2 90.7 63.2 38.8 50.0 -1.8 51% Mississippi 57.4 48.4 65.0 26.1 21.9 -9.3 -62% Harrison 28.6 31.7 44.3 16.9 13.0 -4.6 -55% Jackson 28.8 16.7 20.6 9.2 8.9 -4.7 -69% Gulf of Mexico - West 554.0 613.3 788.9 409.3 248.9 -81.4 -55% Louisiana 338.3 348.2 448.4 251.3 196.4 -38.1 -42% Assumption 0.0 0.0 0.0 4.2 0.0 0.4 Cameron 31.5 37.8 59.5 15.2 11.5 -6.3 -64% Iberia 22.5 31.4 55.3 0.0 0.0 -7.6 -100% Jefferson 21.9 24.2 33.0 0.0 0.0 -6.8 -100% Lafourche 40.5 42.5 56.1 35.5 21.9 -4.4 -46% Orleans 0.0 13.9 0.0 0.0 0.0 -1.4 Plaquemines 87.8 79.4 90.4 72.0 74.1 -3.5 -16% Saint Bernard 11.6 17.4 25.1 14.2 11.7 -0.3 1% Saint Mary 30.1 15.4 13.2 8.0 5.7 -5.6 -81% Terrebonne 80.6 72.6 85.1 60.4 45.1 -8.3 -44% Vermilion 11.6 13.7 30.6 41.8 26.4 5.8 127% Texas 215.7 265.0 340.5 158.0 52.5 -43.3 -76%
70

Table 17. Summary of commercial fishery landings, value basis, in U.S. coastal regions, states and counties, 1990-2010
Region - State County 1990 1995 2000 2005 2010
Average annual change
Percent change
1990-2010 ------------- Million dollars (2010) ------------
Aransas 53.4 44.9 22.2 0.0 0.0 -15.2 -100% Brazoria 22.6 20.4 28.5 0.0 0.0 -6.6 -100% Calhoun 0.0 0.0 7.6 0.0 0.0 0.0 Cameron 87.5 89.7 110.7 49.8 52.5 -11.0 -40% Galveston 19.9 51.6 51.0 35.7 0.0 -5.6 -100% Harris 0.0 0.0 6.7 0.0 0.0 0.0 Jefferson 32.3 29.9 61.6 40.1 0.0 -5.4 -100% Matagorda 0.0 28.5 52.2 32.4 0.0 0.4 Pacific - Hawaii 0.0 63.5 70.0 63.5 71.6 14.3 Hawaii 0.0 63.5 70.0 63.5 71.6 14.3 Honolulu 0.0 63.5 70.0 63.5 71.6 14.3 Pacific - California 381.6 398.0 141.5 196.7 139.7 -68.5 -63% California 381.6 398.0 141.5 196.7 139.7 -68.5 -63% Colusa 0.0 17.9 0.0 0.0 0.0 -1.8 Del Norte 51.4 31.3 13.1 14.4 10.6 -9.8 -79% Humboldt 39.2 28.0 9.6 15.5 9.7 -7.1 -75% Los Angeles 65.2 73.4 47.6 58.9 37.8 -6.9 -42% Marin 25.7 15.8 0.0 0.0 0.0 -6.7 -100% Mendocino 26.0 24.5 8.4 13.5 6.8 -4.9 -74% Monterey 24.5 30.4 12.1 15.5 14.1 -3.6 -42% San Diego 15.6 16.9 6.5 9.1 0.0 -3.9 -100% San Francisco 46.2 41.9 10.6 18.4 15.1 -8.6 -67% San Luis Obispo 15.3 17.7 0.0 0.0 0.0 -4.8 -100% Santa Barbara 34.3 27.5 8.4 14.8 8.2 -6.5 -76% Ventura 38.2 72.9 25.2 36.7 37.4 -3.8 -2% Pacific - Northwest 229.5 232.8 149.0 273.7 276.2 13.4 20% Oregon 85.8 91.1 82.1 91.1 96.3 2.1 12% Clatsop 24.8 35.3 35.0 33.5 30.5 1.0 23% Coos 22.2 19.0 16.4 19.6 24.0 0.4 8% Curry 11.8 6.8 0.0 7.0 8.6 -0.6 -27% Lincoln 22.5 29.9 30.7 27.3 30.6 1.4 36% Tillamook 4.6 0.0 0.0 3.7 2.6 0.0 -43% Washington 143.7 141.8 67.0 182.7 179.9 11.3 25% Clallam 7.2 6.8 0.0 12.5 10.2 1.2 42% Grays Harbor 27.4 34.0 22.2 40.6 38.5 2.9 41% Jefferson 0.0 0.0 0.0 3.4 4.1 1.2 King 20.7 27.6 9.5 8.1 22.1 -1.7 7% Kitsap 0.0 8.2 0.0 0.0 0.0 -0.8 Mason 11.0 16.3 0.0 30.2 17.6 2.7 60% Pacific 11.0 13.6 8.6 34.5 17.9 3.5 62% Pierce 0.0 0.0 0.0 4.1 3.8 1.2
71

Table 17. Summary of commercial fishery landings, value basis, in U.S. coastal regions, states and counties, 1990-2010
Region - State County 1990 1995 2000 2005 2010
Average annual change
Percent change
1990-2010 ------------- Million dollars (2010) ------------
Skagit 15.9 15.0 0.0 8.7 13.6 -1.1 -15% Snohomish 8.0 0.0 0.0 1.3 0.0 -1.5 -100% Thurston 7.3 0.0 0.0 10.4 16.2 2.8 121% Whatcom 35.2 20.4 26.6 28.8 35.9 1.0 2% Pacific - Alaska 1,015.4 762.5 554.0 675.3 906.8 -30.4 -11% Alaska 1,015.4 762.5 554.0 675.3 906.8 -30.4 -11% Aleutians East 0.0 0.0 0.0 0.0 84.1 16.8
Aleutians West (CA) 194.8 198.7 156.0 183.8 163.1 -7.8 -16%
Anchorage 0.0 8.0 0.5 1.1 9.5 1.2 Bethel (CA) 7.5 0.0 0.0 0.0 0.0 -1.5 -100% Bristol Bay 139.4 114.6 46.6 60.1 100.9 -13.1 -28% Dillingham (CA) 36.7 0.0 0.0 0.0 0.0 -7.3 -100% Haines 0.0 0.0 5.1 0.0 0.0 0.0 Juneau 0.0 0.0 14.5 26.8 23.8 7.4 Kenai Peninsula 117.8 89.6 98.7 115.8 150.4 9.1 28% Ketchikan Gateway 43.3 45.7 25.0 25.6 41.3 -2.4 -5% Kodiak Island 155.6 143.3 118.3 106.0 128.1 -9.2 -18% Lake and Peninsula 102.4 0.0 0.0 0.0 0.0 -20.5 -100% Nome (CA) 4.1 0.0 0.0 0.0 0.0 -0.8 -100% Petersburg (CA) 60.3 60.9 24.2 41.1 36.3 -6.8 -40%
Prince of Wales-Hyder (CA) 6.0 0.0 2.0 0.0 0.0 -1.2 -100%
Sitka 33.8 44.0 55.7 49.5 62.2 6.2 84%
Valdez-Cordova (CA) 87.7 48.4 0.0 51.5 84.3 -0.4 -4%
Wrangell 12.9 9.4 7.4 6.9 7.9 -1.2 -39% Yakutat 13.3 0.0 0.0 7.3 14.9 1.0 12% Grand Total 3,302.3 3,145.6 2,858.6 2,728.1 2,702.8 -161.7 -18%
Note: fishery landings data not available for Great Lakes.
72

Trends and Forecast of Cruise Ship Activity
Table 18 summarizes information on cruise ship passenger nights for U.S. ports during the period 2004 to
2011, by region, state, county and port city. In 2011, Ft. Lauderdale (Broward County), Florida had the
highest number of passenger nights, exceeding 10 million. Twelve other U.S. ports had cruise ship
passenger nights exceeding one million in 2011. The five largest of these included Miami, Florida (7.74
million), Port Canaveral, Florida (6.11 million), New York City (3.47 million), Los Angeles, California (3.23
million), and Seattle, Washington (3.22 million).
For the nation as a whole, cruise-ship passenger nights declined by nearly 12 percent between 2004 and
2011, but trends varied widely among individual ports ranging from 100 percent declines for ports in
Pennsylvania, Mississippi and Texas, to more than a doubling for ports in New Jersey, Alabama and South
Carolina. Among ports with more than one million passenger nights in 2004, Hudson, New Jersey
experienced the highest percentage increase (102%) followed by Baltimore (65%), Seattle (57%), Ft.
Lauderdale (8%) and New York City (5%). Among large ports experiencing a decline in cruise ship activity,
Honolulu saw the largest percentage decrease (-52%) in passenger nights, followed by New Orleans (-39.3
percent), San Diego (-31.5 percent), Galveston (-29.2 percent), and Tampa (-28.7 percent).
Predictions of cruise ship activity in 2020 were made for five ports in which regression analyses yielded a
statistically significant slope coefficient. Four ports were forecast to experience increasing activity,
including: Seattle, Washington, Hudson, New Jersey, Mobile, Alabama, and Charleston, South Carolina.
Tampa, Florida, was predicted to experience a decline in passenger nights through 2020.
73

Table 18. Cruise ship thousand-passenger nights, by U.S. state and port city, 2004, 2011, and forecast for 2020
State County (Port city)
2004 Passenger
nights (1,000)
2011 Passenger
nights (1,000)
2004-2011 Total
2004-2011
Average
2004-2011
Percent change
2020 Prediction
Florida Broward (Fort Lauderdale) 9,438 10,197 80,090 10,011 8.0%
Florida Miami-Dade (Miami) 9,841 7,743 86,410 10,801 -21.3%
Florida Brevard (Port Canaveral) 6,114 5,281 48,301 6,038 -13.6%
New York New York (New York) 3,313 3,471 28,084 3,511 4.8%
California Los Angeles (Long Beach) 4,498 3,228 41,046 5,131 -28.2%
Washington King (Seattle) 2,055 3,216 22,713 2,839 56.5% 5,020
Alaska Anchorage (Anchorage) 2,824 2,060 20,868 2,608 -27.0%
Texas Galveston (Galveston Island) 2,822 1,997 22,871 2,859 -29.2%
Florida Hillsborough (Tampa) 2,534 1,806 18,848 2,356 -28.7% 1,250
Louisiana Orleans (New Orleans) 2,477 1,505 11,504 1,438 -39.3%
Maryland Baltimore (Baltimore) 872 1,436 6,854 857 64.6%
New Jersey Hudson (Cape Liberty) 631 1,273 9,366 1,171 101.6% 2,383
California San Diego (San Diego) 1,632 1,118 17,188 2,148 -31.5%
Hawaii Honolulu (Honolulu) 1,713 819 12,483 1,675 -52.2%
Alabama Mobile (Mobile) 134 689 4,498 562 412.7% 1,581
Florida Duval (Jacksonville) 679 675 5,375 672 -0.7%
South Carolina Charleston Charleston) 277 670 3,190 399 141.6% 1,085
California San Francisco (San Francisco) 874 495 5,729 716 -43.4% 0
Massachusetts Suffolk (Boston) 541 457 4,203 525 -15.5%
Alaska Kenai Peninsula (Seward) 538 456 4,048 506 -15.2%
Alaska Valdez-Cordova (Whittier) 618 435 5,245 656 -29.6%
Virginia Norfolk (Norfolk) 389 36 1,847 231 -90.8% 0
Pennsylvania Philadelphia (Philadelphia) 217 0 1,338 167 -100.0% 0
Mississippi Harrison (Gulfport) 20 0 20 2 -100.0%
Texas Harris (Houston) 592 0 1,893 237 -100.0% 0
Total all ports 55,643 49,063 464,012 58,117 -11.83% Note: predictions for 2020 were based on a linear Ordinary Least Squares regression over time. Predicted values for 2020 were only shown when the regressions yielded a statistically significant slope coefficient.
74

Literature and Information Sources Cited
Adams, Charles M., Emilio Hernandez, and James C. Cato. The Economic Significance of the Gulf of Mexico
Related to Population, Income, Employment, Minerals, Fisheries and Shipping. Ocean & Coastal
Management 47 (2004) 565–580. sciencedirect.com/science/article/pii/S096456910400095X
Becker, Gerhard. The Ports of Tampa and Hamburg and the Qualitative Impacts on their Communities.
Master’s Thesis, University of South Florida, 2010. scholarcommons.usf.edu/etd/3578/
Booz Allen Hamilton, Report on the Ocean and Great Lakes Economy of the United States, ENOW Final
Economic Report, National Oceanic and Atmospheric Administration, 2012.
csc.noaa.gov/digitalcoast/_/pdf/econreport.pdf.
Carstensen, Fred V., William Lott, Stan McMillen, and Hemanta Shrestha. The Economic Impact of
Connecticut’s Deepwater Ports: An IMPLAN and REMI Analysis. Connecticut Center for Economic
Analysis, University of Connecticut, Storrs, CT, 2001. ccea.uconn.edu/studies/Port%20Study.pdf
Colgan, Charles S. A Guide to the Measurement of the Market Data for the Ocean and Coastal Economy in
the National Ocean Economics Program. National Ocean Economics Program, January 2007.
oceaneconomics.org/Download/Market_Guide.asp.
Colgan, Charles S. The Contribution of Working Waterfronts to the Maine Economy. Maine's Working
Waterfront Coalition, Farm Credit of Maine, 2004.
maine.gov/doc/nrimc/mcp/downloads/workingwaterfront/workingwaterfronteconomy_feb04.pdf
Doorn, David and Peter Lindquist. Economic Impact of the Great Lakes and St. Lawrence Seaway System
(GLSLS): Phase I, Phase II and Phase II continued, 2009-11. Great Lakes Maritime Research Institute.
glmri.org/downloads/2009Reports/doorn.pdf; glmri.org/downloads/2010Reports/Doorn0910.pdf;
glmri.org/downloads/2011Reports/Doorn2011.pdf.
Gentner, Brad and Scott Steinback. Economic Contribution of Marine Angler Expenditures in the United
States, 2006. National Marine Fisheries Service, National Oceanic and Atmospheric Administration.
NOAA Technical Memorandum NMFS-F/SPO-94, 2008.
st.nmfs.noaa.gov/st5/publication/marine_angler.html.
Kildow, Judith, and Charles S. Colgan. California’s Ocean Economy. National Ocean Economics Program,
Report to the State of California Resources Agency, 2005.
resources.ca.gov/press_documents/CA_Ocean_Econ_Report.pdf
75

Kildow, Judith. Florida’s Ocean and Coastal Economies Report, Phase I. National Ocean Economics Program,
2006. floridaoceanscouncil.org/reports/Florida_Ocean_&_Coastal_Eco.pdf
Kildow, Judith. Florida’s Ocean and Coastal Economies Report, Phase II 2008. National Ocean Economics
Program, 2008. floridaoceanscouncil.org/reports/Florida_Phase_II_Report.pdf
Kotval, Zenia and John R. Mullin. The changing port city: Sustainable waterfront revitalization. Journal of
Town and City Management, Volume 1, Number 1, June–August, 2010.
henrystewart.com/resources/1/jtcm/KotvalandMullin-2.pdf
Lahr, Michael and Anne Strauss-Wieder. MARAD Port Economic Impact Kit, Volume I: Handbook, 2012.
aapa.files.cms-plus.com/PDFs/MartinAssociates.pdf
Lichtman-Bonneville, Liat, Dennis Leong, and Robert Russell. Economic Impact of Wisconsin’s Commercial
Ports. Wisconsin Department of Transportation, Bureau of Planning and Economic Development,
2010
Martin Associates. The Local and Regional Economic Impacts of the US Deepwater Port System, 2007.
Martin Associates. The Local and Regional Economic Impacts of the Port of Portland, 2011.
MIG Inc. IMPLAN input-output analysis and social accounting software and regional economic datasets. 502
2nd St., Suite 301, Hudson, WI, 54016-1543. implan.com.
National Marine Fisheries Service, National Oceanic and Atmospheric Administration (NMFS-NOAA), 2011.
Annual Commercial Landing Statistics.
st.nmfs.noaa.gov/st1/commercial/landings/annual_landings.html
National Marine Fisheries Service, National Oceanic and Atmospheric Administration (NMFS-NOAA), 2010.
Fisheries Economics of the United States, 2009. U.S. Dept. Commerce, NOAA, Tech. Memo. NMFS-
F/SPO-118, st.nmfs.noaa.gov/st5/publication/index.html.
National Marine Fisheries Service, National Oceanic and Atmospheric Administration (NMFS-NOAA), 2011.
Fisheries of the United States 2010. Current Fishery Statistics No. 2010
st.nmfs.noaa.gov/st1/fus/fus10/FUS_2010.pdf
National Ocean Economics Program (NOEP). Ocean and coastal economic activity interactive website, 2012.
Ocean Economy Market Data, oceaneconomics.org/Market/ocean/oceanEcon.asp; Coastal
Economy Market Data, oceaneconomics.org/Market/coastal/coastalEcon.asp; Living Resources
Data, Top Commercial Fishing Ports, oceaneconomics.org/LMR/topPorts.asp; Living Resources
Data, Top Ten Commercial Fish Species, oceaneconomics.org/LMR/topTen.asp; Ports and Cargo
76

Data, oceaneconomics.org/Transport/shipSearch.asp; Off Shore Minerals Data,
oceaneconomics.org/Minerals/.
National Oceanic and Atmospheric Administration. Economics: National Ocean Watch (ENOW) program and
web database, csc.noaa.gov/digitalcoast/data/enow.
Rappaport, Jordan, and Jeffery D. Sachs. The United States as a Coastal Nation. Journal of Economic
Growth, vol. 8, pages 5-46, 2003. springerlink.com/content/un678p2122h2227w/
Sieber, R. T. Waterfront Revitalization in Postindustrial Port Cities of North America. City & Society, Vol. 5,
Issue 2, pages 120–136, December 1991.
onlinelibrary.wiley.com/doi/10.1525/city.1991.5.2.120/abstract
Slack, B. Pawns in the Game: Ports in a Global Transportation System. Growth and Change, vol. 24, pages
579–588, October, 1993. onlinelibrary.wiley.com/doi/10.1111/j.1468-
2257.1993.tb00138.x/abstract
Strauss-Wieder Inc. and New York Shipping Association Inc. (2011). The Economic Impact of the New York-
New Jersey Port/Maritime Industry, 2010. Westfield, NJ.
panynj.gov/about/pdf/port-economic-impact-2011.pdf
U.S. Commerce Department, Bureau of Economic Analysis (USDOC-BEA). Gross Domestic Product Implicit
Price Deflator, seasonally adjusted, quarterly, 1947 to present, available at
research.stlouisfed.org/fred2/data/GDPDEF.txt.
U.S. Maritime Administration. Undertaking Port Economic Impact Assessments. Washington, D.C.,
December, 2000. www.ntis.gov/search/product.aspx?ABBR=PB2001500021
77