Econom ic liberalisation and industrial com … · 2 Economic liberalisation and industrial...
30
1 Economic liberalisation and industrial competitiveness in Brazil João Carlos Ferraz ([email protected]) - ECLAC-UN David Kupfer ([email protected]) - Instituto de Economia, UFRJ, Brasil Mariana Iootty ([email protected]) -Instituto de Economia, UFRJ, Brasil 2003
Transcript of Econom ic liberalisation and industrial com … · 2 Economic liberalisation and industrial...

1
Economic liberalisation and
industrial competitiveness in Brazil
João Carlos Ferraz ([email protected]) - ECLAC-UN
David Kupfer ([email protected]) - Instituto de Economia, UFRJ, Brasil
Mariana Iootty ([email protected]) -Instituto de Economia, UFRJ, Brasil
2003

2
Economic liberalisation and industrial competitiveness in Brazil
João Carlos Ferraz (ECLAC-UN)David Kupfer (Instituto de Economia, UFRJ, Brasil)
Mariana Iootty (Instituto de Economia, UFRJ, Brasil)
Abstract
This article examines the nature and the extent of transformation in the Brazilian industrybetween 1990 and 2002, a period of significant institutional changes towards economicliberalisation.
The first section provides the necessary analytical framework. The second section is anaccount of the most important institutional changes and an overview of the industry’sevolution between 1990 and 2002. The next four sections are focused on the analysis ofcompetitiveness of four industrial groups: commodities, durable goods industries, traditionalindustries and innovation carriers industries. The last section provides an overall balance andindicates future challenges.
A balance of production Made in Brazil, 10 years after economic liberalisation, indicates anstriking and different feature from other Latin American countries: most structural features ofindustry did not change. Very few genuinely new economic activities were added to thecountry’s industrial matrix and very few previously existing activities ceased to exist.Important changes were observed in the management of production processes and in theownership landscape of industry as modernisation and inward internationalisation becamegeneralised processes taking place between 1990 and 2002, across industry.
But Brazil may face a development paradox in the years to come. History tells us that localcapital and innovation capabilities have been outstanding features of countries successful insustaining economic and social development. If ownership internationalisation is to remainand local innovation capabilities must be pursued, then Brazilian private and public policymakers are facing challenges associated with how to attract investments of this nature. To agreat extent, this will mean an important departure from established policy practices, to newways of regulating and inducing firms towards local value creation.
1. INTRODUCTION
Between 1990 and 2002, the Brazilian economy went through major institutional changes.Rules governing relations among economic agents changed in many respects, tow of them ofmajor relevance. Firstly and most important, economic liberalisation became the centralfeature of the national regime of incentives and regulations. Secondly, after decades of highinflation, price stabilisation was achieved, becoming, thereafter, a major target ofmacroeconomic policies.
To what extent institutional changes imposed changes to industry? Did investment ratesincrease, incorporating new activities? Which ones ceased to exist? Are firms becoming morecompetitive? Are they relying on innovation capabilities which are widely known asconforming the basis for sustained or expanded market shares?
These are the questions guiding us in this article, which is based on a research project that

3
examined competitiveness of 20 industrial sectors1. The first section presents the analyticalframework. The second section provides an account of institutional changes and an overviewof industrial performance. The next sections analyse competitiveness in four industrialgroups: commodities, durable goods industries, traditional industries and innovation carriersindustries. The last section provides an overall balance, indicating commonalities anddifferences among them.
2. COMPETITIVENESS AND PATTERNS OF COMPETITION
In this article the focus of the analysis is on industrial competitiveness. Competitive firms arethose capable of formulating and implementing strategies leading to sustained or expandedmarket position in the segment of industry where they operate. To be competitive firm’sstrategies, capabilities and performance must be coherent with the pattern of competition(PoC) prevalent in the activity it operates. Patterns of competition are defined as thecollection of key factors (drivers) required for competitive success in each industry. Ascompetitiveness is defined at firm level, it is possible to consider, by aggregation, a sectorcompetitive if a large proportion of sectoral production value originates from competitivefirms in a given moment of time.
Competitiveness must be viewed as a dynamic concept for two reasons. Firstly, it isassociated with previously accumulated capabilities of firms. Thus present capacity resultsfrom past strategic decisions on where economic resources should be allocated. Revealedmarket or productive performance of a firm indicates whether past strategies and capabilitieswere adequate or not, from a competitive perspective. In this sense, present capabilities ormarket position does not necessarily ensure future competitiveness. Secondly, relevantcompetitive drivers conforming the PoC may change due to strategies pursued by innovativefirms. Thus competitiveness must be evaluated against expected, not necessarily the current,pattern of competition, in a given moment of time.
Given the large number of possible intervening drivers in the PoC, it is necessary to organisethem under some type of criteria. A simple and operational criteria is one in which factors areorganised according to the capacity of a single firm to influence their direction and evolution.
Some key factors lay within the boundaries of the firm (internal factors), where it hascomplete control. Others (structural factors) are industry specific, having equal level ofimportance for firms operating in similar market segments. In general, individual firms haveonly limited and indirect control over structural factors. Finally, there is a collection of drivers(macro factors) that are associated to the framework conditions surrounding a firm andplaced well beyond its capacity to exert direct influences. Thus, a competitive process has asystemic character, determined not only by individual firm’s efforts, but also by the nature ofthe industry in which it operates and by economic/institutional aspects.
Sectoral analyses of competition are usually built upon structural or behavioural orientedtaxonomies. Analysis of competition are commonly based on taxonomies of competitivedrivers, that bundles together apparently different economic activities. Usually, industrialactivities are organised in terms of common competitive drivers, from a “demand” or from a“supply” perspective. However, even though innovation has been long regarded as the basicsource of competitive differentiation and a direct driver of dynamic change, very few analystsplaced explicit efforts towards incorporating technical change to sectoral taxonomies. Among 1 Sectoral information is derived from “Estudo da Competitividade de Cadeias Integradas no Brasil”(www.mdic.gov.br), a research project contracted by the Brazilian government to UNICAMP, coordinated byLuciano Coutinho, Mariano Laplane, David Kupfer and Elizabeth Farina. We are in debt with them and also withAchyles Barcelos da Costa, Fábio Erber, Fernando Sarti, Germano Mendes de Paula, José Rubens Dória Porto, MárciaAzanha Ferraz Dias de Moraes, Marcos Fava Neves, Maria Graça Derengowsky Fonseca, Matheus Kfouri Marino,Mauro Thury de Vieira Sá, Rafael Oliva, Roberto Vermulm and Victor Prochnik for producing high quality sectoralanalysis. CNPq and FAPERJ provided support for the activities carried out by the authors in the Industry andCompetitiveness Research Group, at the Instituto de Economia, UFRJ. This article is based on a report produced forthe Institute of Developing Economies, Japan (Hamaguchi 2003).
4
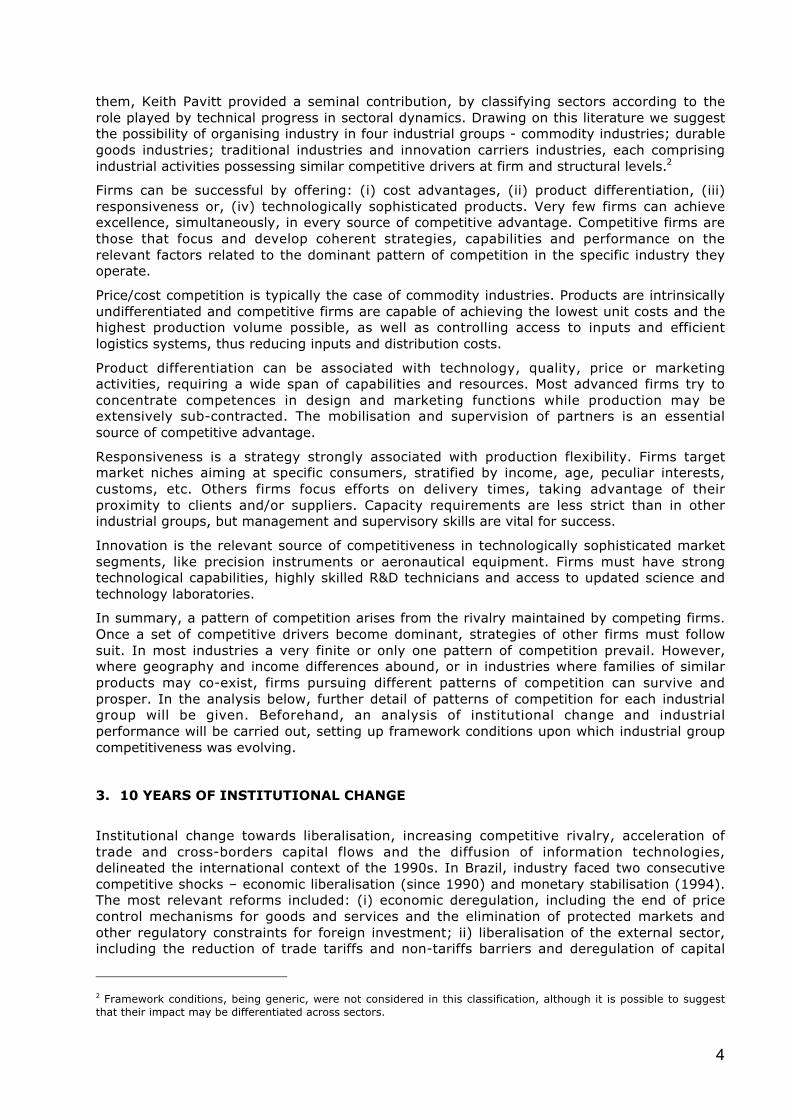
them, Keith Pavitt provided a seminal contribution, by classifying sectors according to therole played by technical progress in sectoral dynamics. Drawing on this literature we suggestthe possibility of organising industry in four industrial groups - commodity industries; durablegoods industries; traditional industries and innovation carriers industries, each comprisingindustrial activities possessing similar competitive drivers at firm and structural levels.2
Firms can be successful by offering: (i) cost advantages, (ii) product differentiation, (iii)responsiveness or, (iv) technologically sophisticated products. Very few firms can achieveexcellence, simultaneously, in every source of competitive advantage. Competitive firms arethose that focus and develop coherent strategies, capabilities and performance on therelevant factors related to the dominant pattern of competition in the specific industry theyoperate.
Price/cost competition is typically the case of commodity industries. Products are intrinsicallyundifferentiated and competitive firms are capable of achieving the lowest unit costs and thehighest production volume possible, as well as controlling access to inputs and efficientlogistics systems, thus reducing inputs and distribution costs.
Product differentiation can be associated with technology, quality, price or marketingactivities, requiring a wide span of capabilities and resources. Most advanced firms try toconcentrate competences in design and marketing functions while production may beextensively sub-contracted. The mobilisation and supervision of partners is an essentialsource of competitive advantage.
Responsiveness is a strategy strongly associated with production flexibility. Firms targetmarket niches aiming at specific consumers, stratified by income, age, peculiar interests,customs, etc. Others firms focus efforts on delivery times, taking advantage of theirproximity to clients and/or suppliers. Capacity requirements are less strict than in otherindustrial groups, but management and supervisory skills are vital for success.
Innovation is the relevant source of competitiveness in technologically sophisticated marketsegments, like precision instruments or aeronautical equipment. Firms must have strongtechnological capabilities, highly skilled R&D technicians and access to updated science andtechnology laboratories.
In summary, a pattern of competition arises from the rivalry maintained by competing firms.Once a set of competitive drivers become dominant, strategies of other firms must followsuit. In most industries a very finite or only one pattern of competition prevail. However,where geography and income differences abound, or in industries where families of similarproducts may co-exist, firms pursuing different patterns of competition can survive andprosper. In the analysis below, further detail of patterns of competition for each industrialgroup will be given. Beforehand, an analysis of institutional change and industrialperformance will be carried out, setting up framework conditions upon which industrial groupcompetitiveness was evolving.
3. 10 YEARS OF INSTITUTIONAL CHANGE
Institutional change towards liberalisation, increasing competitive rivalry, acceleration oftrade and cross-borders capital flows and the diffusion of information technologies,delineated the international context of the 1990s. In Brazil, industry faced two consecutivecompetitive shocks – economic liberalisation (since 1990) and monetary stabilisation (1994).The most relevant reforms included: (i) economic deregulation, including the end of pricecontrol mechanisms for goods and services and the elimination of protected markets andother regulatory constraints for foreign investment; ii) liberalisation of the external sector,including the reduction of trade tariffs and non-tariffs barriers and deregulation of capital
2 Framework conditions, being generic, were not considered in this classification, although it is possible to suggestthat their impact may be differentiated across sectors.

5
account; iii) privatisation of manufacturing industries and utilities services.
Privatisation was aimed at industrial modernisation and, above all, the reduction of fiscaldebt. Trade liberalisation was the most consistent of all institutional changes. Following asignificant tariff reduction schedule, the mean value of nominal tariffs was diminished from32.2% (with interval 0-105% and standard deviation of 19.5), in 1989, to 14.9% (withinterval 0-40% and standard deviation of 10.7) in July 1993. (Kume 1996)
Also very relevant were new rules that eliminated restrictions for foreign owned firms to:operate in information technology sectors (1991); remit royalties to parent companies(1991); participate in the privatisation process (1993); access credit lines of public agenciesor subsidies and other incentives (1994); operate in financial services, telecommunicationsand oil exploration (1995); patent (processes & products) in pharmaceuticals, food,biotechnology industries (1996).
Macroeconomic changes were equally relevant. These were intimately associated with themonetary reform implemented under the Real Plan, in 1994, and with the subsequent returnof capital inflows, due to increasing international liquidity and higher local interest rates whencompared to other national markets. The Real Plan successfully decreased the inflationspiral3, resulting in the short term, in growth of real wages. That associated with theresurgence of credit lines for consumption, implied significant increases in aggregatedemand. The return of capital inflows – US$ 600 million in 1993, US$ 2.2 billion in 1995, US$29.1 billion in 1998- was very important to finance current account deficits, mergers andacquisitions and capital investment. Overvaluation of the national currency followed and itwas pushed even further by a set of specific policies defined by the Central Bank, between1994 and 1999.
Appreciated exchange rate and high interest rates, the two pillars of the macroeconomicstabilisation plan, together with low tariffs and lower barriers to entry for foreign firmsimposed a new competitive environment to industry. The immediate result was a rapiddeterioration of trade balance. Foreign capital inflows financed trade deficits but, at the sametime, the vulnerability of the country’s external account increased to levels not compatiblewith macroeconomic stability. Consequently, the negative impacts of external financialdependence were revealed not only in a weak growth of expansion-related investments, butalso in an insufficient GDP growth during the 1990s.
The institutional transition towards a new paradigm “led by the market” was not a smoothprocess. Institutional change provoked and brought about institutional and economicuncertainty especially unpredictability in terms of the extent of entry of new competitors andimported goods. Firms lost the capacity to forecast the real size of its markets and reactedby undertaking defensive actions, most of them associated with cost reduction, productionrationalisation and product renewal, leading to further reductions on existing low levels ofmicroeconomic degree of confidence. Low levels of microeconomic confidence implied anegative propensity towards investments, thus negatively affecting macroeconomicsustainability.
After 10 years of adaptation to changing framework conditions, within industry, someregularities are discernible. Above all, economic liberalisation benefited those with standingeconomic power. Thus, firms capable of modernising processes and products raisedsuccessful defences against new entrants (investors or imports). Firms searched for allsources of rationalisation, resulting in drastic changes in output to labour ratios, whileinvestments in new capacity or in R&D became an item of low priority in the decision-makingagenda of the private sector. The internationalisation of the economy, on the contrary, wasincreased by means of expanding imports in technology intensive components and productsand, most important, asset acquisition, especially those with positive future prospects. MostM&A transactions involved high quality assets.
This is the aggregate view. Much more can be learned from in-depth sectoral analysis, which
3 Inflation rates decreased from more than 1000% in 1993 to 20% in 1995 and 5% in 1997.

6
is the subject matter of the following sections.
4. INDUSTRIAL COMMODITIES. FOLLOWING A DUAL TRACK STRATEGY: LOW COSTFOR EXPORTS, DIFFERENTIATION FOR THE LOCAL MARKET
4.1. PATTERN OF COMPETITION NOW AND THEN: WIDENING AND DEEPENING THE SEARCH FOR
LOW COSTS
Commodity related industries are engaged in the production of intermediate inputs forindustrial or final consumption, through large-scale production processes. Cost reductiondrives competition in commodity-based industries. The search for cost minimisation driversat company level, as well as in markets and industrial configurations was enhanced since1990. Due to increasing competitive pressures from developing countries, markets ofdeveloped countries are being defended for local firms by means of explicit protectionistmeasures. (See first two columns of Table 1)
Commodity products are intrinsically undifferentiated and production efficiency andeconomies of scale are ensured by three complementary sources: high capital intensiveplants, preferential access to inputs –raw materials and energy sources- and transportlogistics. In such a context, large, multi-plant companies, operating internationally arecapable of expanding the frontiers of relevant competitive drivers. During the last decade,similarly to trends in other sectors, most aggressive firms have become larger and moreinternationalised by means of mergers and acquisitions transactions.
At the level of the firm, core competences are related to five sources of competitiveadvantages: managing, acquiring or accessing process technology, inputs, transport,distribution networks and preferential clients. The diffusion of information systems based onmicroelectronics technologies has provided the technical base for co-ordinating large-scaleoperations and logistics.
The pattern of competition among firms has remained closely associated with what is knownas homogenous oligopoly. Competing firms try to master knowledge over marketperspectives and the behaviour of rivals, on a global basis. Thus, for competitive success, itis of fundamental importance to correctly anticipate demand growth and/or to effectivelyrespond to changes in price and quantity demanded from local and international markets.
Aggressive firms are those implementing greenfield and M&A investment strategies,expanding capacity ahead of demand growth of current products. Revenue possibilities haveexpanded significantly in the past 10 years, by means of widening product portfolio,exploring transportation assets for third parties or selling-off energy surplus. The preferentialaccess to capital markets is of vital importance for investment-driven strategies. On thismatter, large and internationalised companies have considerable advantages over firmsoperating single plants or in a limited number of national markets.
International competition in a context of liberalised national economies has strengthened aparticular and historical trend: although prices of most commodities fluctuate along worldeconomic cycles, relative prices have showed a declining trend, imposing problematic termsof trade for commodity dependent exporting nations.
Steel, pulp and paper and concentrated orange juice, among other commodity industries likesoy and iron ore, are considered to be pillars of Brazilian international competitiveness. Inthese industries, in 2002, Brazil held a significant market share in international exportmarkets: 80% in concentrated orange juice, 37% in sugar, 34% in soy grains, 32% in coffeeand 16% in the meat industry. In 1990, the relatively small size of leading companies andthe low levels of product value-added were the relevant competitive challenges facingBrazilian commodity producers. Since then these challenges were only partially addressed,while other sources of competitiveness were enhanced. (See last two columns of Table 1)

7
TABLE 1Patterns of competition (POC) and competitiveness in Commodities: now and then
SOURCES OF COMPETITIVE
ADVANTAGES
PoC COSTRELEVANT DRIVERS
1990
PoC COSTRELEVANT DRIVERS
2003
BRAZILIANCOMPETITIVENESS 1990
BrazilianCOMPETITIVENESS 2002
INTERNAL FACTORSMANAGEMENT Process control Efficient More efficientPRODUCTION Mass flow & energy efficiency NO CHANGE Efficient Efforts placed in energy control
SALES Access to distribution channels Efficient More effortsINNOVATION Process technology Incipient local efforts Incipient local efforts
STRUCTURAL FACTORS
Standardisation Prominence in low value addedsegments
Dual track more visible: low valueadded for exports and highervalue added for local consumption
MARKET Price, technical conformity NO CHANGE
Access to international trade Low growth of demandCyclical with worsening terms oftrade
Company and plant leveleconomies of scale
Efficient plant size but low sizeof companies; prominence ofSOE; low internationalisationefforts
Inside trajectory with importantownership change, prominent rolefor local capital and State aspartner; low internationalisationefforts
CONFIGURATION OF
INDUSTRY
Access to raw materials &transport logistics
NO CHANGEGood access to inputs anddeficiencies in logistics
More efficient
Specialised technical services Reasonable efforts Reasonable effortsAnti-dumping & commercialpolicy
INCREASED IMPORTANCE Trade restrictions Stronger pressure
REGIME OF REGULATIONAND
Environmental protection INCREASED IMPORTANCE Existing Stronger pressure
INCENTIVES Cost of capital NO CHANGE High Still high
Tax distortionsRisk of cartelisation, infantprivatisation
Tax distortions, Cartelisation yetto come, privatisation completedbut not consolidated

8
4.2. COMPETITIVENESS IN 2002: OWNERSHIP CONSOLIDATION AND PRODUCT UPGRADING MUST
BE FURTHER STRENGTHENED
4.2.1. Increasing size of firms
Privatisation of the steel industry and mergers and acquisitions in pulp and paper haschanged the ownership landscape of the commodities industrial group, providing theopportunity for the emergence of larger firms. Even so, leading Brazilian firms, whencompared to their international counterparts, remain relatively small and oriented towardsthe local market. However, asset consolidation of process has not ended. Further M&As arestill to come, leading to greater concentration of market structures and, perhaps, acquisitionsby Brazilian firms, of other corporations outside the country.
In the steel industry two outstanding processes were in place: the unfolding of theprivatisation process initiated in the late 1980s, and a substantial investment drive in stagesof the production process associated with the generation of new, higher unit value productsto be sold in the local market.
Six large steel companies and six small ones were privatised in Brazil, for a consideration ofUS$ 5.7 billion. Local capital prevailed in the privatisation process. Financial institutionsaccounted for 33.6%, pension funds for 15% and industrial corporations for 21.8% of totalvalue of privatisation. Due, to a great extent, to the privatisation technique – auctions – anoutstanding feature of the second half of the 1990s was ownership instability and furtherasset transactions. After privatisation was completed 20 private M&A transactions werecarried out. Between 1990 and 2000, only 17% of production units (measured in physicalcapacity) were not subject to at least one change in ownership. Besides ownership change,between 1994 and 2000 the industry invested, in average, US$ 1.4 billion. This was veryunexpected, given the country’s macroeconomic uncertainties and those arising from theprivatisation process. Most investments were focused in the rolling area, enabling productupgrading.
In pulp and paper, there are 220 companies operating in the country. In 2000, total salesreached US$ 7.5 billion; the largest 11 integrated companies were responsible for 2/3 of thistotal, revealing, for this industry, the importance of plant and company level economies ofscale. During that year, the 4 largest producers of pulp were responsible for 70% of totalproduction. In the paper segment, concentration levels are lower but they have beenincreasing since 1990. In that year, the 5 largest producers were responsible for 39.5% oftotal production; ten years later this share increased to 51.4%. Concentration levels wereincreased by means of a very active process of mergers and acquisitions, as shown in Table2.

9
TABLE 2MOST RELEVANT M&A IN THE BRAZILIAN PULP AND PAPER (1992-2001)
Company Sold Commanding Company Date Share ProductAnnual
Capacity1000 t
Simão Votorantim 1992 100%CFCB + Printing
paper250
Mad. Saguário Orsa 1996 100% Packing 90
Nicolaus Papeis Md Papeis 1997 100%Special Paper +
Cardboard70
Klabin Tissue Kimberly Klabin 1998 50% Tissue 155
InpacelChampion /
International Paper1998 100% LWC 185
Celpav Votorantim 1988 100% Printing paper 100
Igaras Klabin/Riverwwod 2000 100% Pulp / kraftliner 360 / 460
Klabin Joint Venture until 2002 2000 50+50% Newsprinting Paper 120
Norske Skog
Jarcel Orsa 2000 100% Pulp 300
Bacell Klabin Lenzig Na Pulp 100
Pisa Norske Skog 2000 100%PAR + Newsprinting
Paper270 / 190
Champion L. International Paper 2000 100% Pulp + Printing Paper. 305 / 365
Bahia Sul Suzano 2001 100% Pulp + Paper 600 / 250
Cenibra JBP 2001 100% Pulp 830
Portucel Suzano + Sonae 2001 28% Pulp + Paper 400
Aracruz Votorantim 2001 26% Pulp
Source: Fonseca (2002)
In the citrus industry there are two segments. In Frozen Concentrated Orange Juice (FCOJ)firms control the processing stage and co-ordinate the associated logistics (from orangeplantations to packaging corporations). Co-ordinating capabilities of firms are so developedthat important clients, like Coca-Cola, have transferred the managing of their productionunits, in the USA, to a Brazilian company. This is an important change from the early 1990sand largely due to the need to by jump over import restrictions. Most active firms havemoved to the south of the USA, acquiring or investing in new processing units and evensome plantations. The largest corporations have also increased their economic power. In theearly 1990s, six dominated Brazilian exports; in 1997 the share of the largest four producerswas 70%; in 2001 this share had increased to 90%. But these firms still remain distant fromfinal consumers; they are typically commodity producers, relying competitiveness on the lowcost of their undifferentiated product.
In Pasteurised Orange Juice (POJ), a segment that has been expanding at high rates inBrazil, the market structure is different. As shown in Table 3, searching for economies ofscale, firms have followed different verticalisation strategies. In one extreme, close to theresource base, processing firms are verticalised towards packaging operations. On the otherextreme, close to the final consumer, selling companies, including supermarkets exploringtheir own brands, incorporate distribution activities. Economic relations between these twoextremes are mediated, in most cases, by supply contracts among different companies. It isworth mentioning that the three leading FCOJ producers do not participate in supplycontracts of POJ to the major selling companies.

10
TABLE 3VERTICALISATION AND SUPPLY CONTRACTS IN THE PASTEURIZED ORANGE JUICE
PRODUCTION CHAIN
1- Sellingcompany
2- Distributioncompany
Relation1x2
3- Packagingcompany
Relation 2x3 4- Processingcompany
Relation 3x4
Nestle Nestle Vertical Cargill Contract Cargill VerticalDan’ Fresh Danone Vertical Citrovita Contract Citrovita Vertical
Leco Leco Vertical Citrovita Contract Citrovita VerticalYes Paulista Contract Cargill Contract Cargill Vertical
Parmalat Parmalat Vertical Parmalat Vertical Parmalat VerticalCarrefour Carrefour Vertical Cargill Contract Cargill VerticalSendas Sendas Vertical Nova América Contract Nova América Vertical
Source: compiled from Neves & Marino (2002)
4.2.2. Low unit value for exports, high unit value for the local market
Brazilian commodity producers supply international markets predominantly with low unitvalue products. Since the early 1990s they have consolidated their competitive position byinvesting in distribution networks and closer relations with large clients. For the Brazilianmarket, however, firms have evolved towards widening and upgrading product portfolio.Relatively to exports, sales to the local market have higher unit value. This dual trackstrategy has been consolidated throughout the years. Remains to be seen whether theexperience in the local market may prove useful for conquering new and more valuablesegments in international markets, in the years to come.
In 1999, in value terms, the world share of Brazilian steel semi-finished products was 14.1%but in galvanised sheets, only 0.4%. The share of semi-finished products in total Braziliansteel exports increased from 39.2% in 1990 to 68.4% in 2001, in physical production or28.6% to 47.3% in value terms, respectively. This expansion was attained even in a contextof increasing protectionist barriers, as the case of the USA demonstrates. Conversely, in thelocal market, between 1992 and 2001, total steel consumption increased 89% andgalvanised sheets 402%. Above 50% of total demand came from the automotive and civilconstruction sectors. The auto industries were responsible for 70.6% of special long steelproducts; the civil construction for 49.2% of carbon long steel products.
The strength of competitiveness in low value added products can also be found in theindustry’s cost structure, as shown in Table 4, competitiveness of the Brazilian steel industryalso relies on the low level of labour and iron ore costs. Financial costs and the costs of coalhave long being the basic source of competitive disadvantage.

11
TABLE 4 PRODUCTION COSTS OF COLD ROLLED SHEET, SELECTED COUNTRIES, APRIL 2001
(US$/DISPATCHED TONS)
USA Japan Germany UK S.Korea
China Brazil
Raw materials 115 106 109 105 112 118 103Coal 27 27 26 24 28 28 37Iron Ore 55 56 62 58 59 75 40Scrap / DRI 33 26 21 23 25 15 26
Other raw materials 172 150 148 153 134 152 135
Labour costs 154 142 136 113 62 26 57Hourly wage 38 36 34 27,6 13 1,25 10,5
Total operational costs 441 398 392 371 308 297 295
Financial costs 39 60 40 46 42 50 67Depreciation 29 40 30 26 30 30 32Interest 10 20 10 20 12 20 35
TOTAL COST 480 458 432 417 350 297 362* In man-hour per ton Source: Paula (2002)
Cost advantages in pulp production are quire similar. In 2001, Brazilian industry led theproduction of short fibre pulp, with a 19.4% share of total world supply, a 7-point increaseover the 1990 market share. Between 1990 and 2001 Brazilian industry expanded at 9.5%annually, inferior only to Indonesian expansion, a latecomer to the industry. In value terms,exports increased from US$ 556 million in the beginning of the 1990s, to US$ 1.3 billion in2000.
In paper production the picture is very different, in terms of volume of production and sharein world markets. In 2000, Brazil produced 7,188 thousand tons of paper, while internationalproduction reached 323,295 tons. Although the Brazilian industry has grown 4.3% during the1990s, its international market share is very small and has remained unchanged - 2.0% in1991, 2.2% in 2000-, for all types of papers.
Five types of papers respond to more than 50% of 2000 exports –printing/writing, non-coated paper, sanitary paper, cardboard and Kraft liner-; ten years before this concentrationwas higher, at 70%. But, since 1990, in value terms, paper exports have remained belowUS$ 1 billion for most years. Thus, in 2000, 62% of total paper production was sold in thelocal market; 22% represented self-consumption of the producer and only 15% wasexported.
The citrus industry faces a similar dual track pattern observed in steel and pulp and paperindustries. In the FCOJ segment, Brazil is an international leader; in the POJ segment salesare directed to the local market. The latter requires more sophisticated industrial operationsand it is very close to the final consumer market, requiring significant marketing efforts.
During the 1990s 50% of total world orange juice and 80% of FCOJ were produced in Brazil,generating, in average, US$ 1 billion in foreign exchange. Similarly to other commodityproducers, Brazil is very dependent on fluctuations of international prices. While total exportsof FCOJ expanded from 785 million tons in 1990, to 1,234 million in 2000, export revenuesreached a peak of US$ 1.3 billion in 1995, decreasing to US$ 800 million in 2001.
Most developed markets for FCOJ are stagnating while developing regions are expandingconsumption. It is estimated that West Europeans consume 24 litres of fruit juice per year,

12
while East Europeans consume 5 litres per year, having expanded 80% between 1995 and2000. This context has lead to reactions from important consumer/producer countriesthrough the imposition of trade barriers, like the USA 56% ad valorem tariff. In the POJsegment market perspectives are even more positive. While in the USA, annual consumptionlevels of POJ reaches 40 litres, in Brazil total orange juice consumption is around 20litres/year. Of that, only 1 litre is POJ but annual rates of growth in this segment are veryhigh, at around 30%.
4.2.3. Labour saving modernisation and efficient control over basic inputs
Along the 1990s, companies placed considerable emphasis on actions closely associated todecrease direct input costs like ensuring access to raw materials and transport infrastructure.Lowering energy costs was an important investment item, given its high burden on totalcosts and the supply crisis the country faced in 2001. Also they consolidated capabilities toefficiently operate technically updated plants, but still relying on capital goods suppliers todefine the technological possibilities of improving processes.
The investment drive in the steel industry had direct impact on efficiency levels. Even thoughoutput levels remained around 25 million tons per year, modernisation of installations andsharp cuts in employment levels – at an annual average of 7.6% between 1989 and 2000-resulted in corresponding sharp increases in productivity levels - from 11 to 5.4 man-hourper ton, between 1991 and 2000. (Figure 1)
FIGURE 1OUTPUT AND EMPLOYMENT IN THE STEEL INDUSTRY, 1988-2001
0
5
10
15
20
25
30
88 89 90 91 92 93 94 95 96 97 98 99 00 01
mill
ion
s to
n
0
30
60
90
120
150
180
nu
mb
er of d
irect emp
loyees
Production Number of employees
Source: Paula 2002
Investments in pulp and paper were not as pronounced as in steel. But, to sustaincompetitiveness firms engaged in expanding eucalyptus used for the production of short fibrepulp. Backward integration, towards rationalised eucalyptus forests is certainly a majorsource of competitiveness, given its relevant contribution to total costs and the high levels ofefficiency attained in plantations. In 1990, out of 64 million hectares planted by the industry,eucalyptus forests occupied 42 million and pine forests 20 million. Ten years later, the

13
extension of pine plantation remained constant while 100 million hectares of eucalyptusforests were planted.
The competitiveness of citrus is also to be found in efficient industrial operations, inprivileged access to inputs and in mastering and accessing a sophisticated transportinfrastructure. In relation to the agriculture base of the industry, there have beenconsiderable technological efforts to improve productivity. The most significant achievementwas the 2002 DNA sequencing of the genome of the bacteria Xyllela Fastidiosa that provokesdiseases to crops. According to Neves & Marino (2002), productivity has expanded, due toincreases in plantation intensiveness and greater use of fertilisers, while total plantation areahas decreased.
5. DURABLES GOODS. INWARD INTERNATIONALISATION AND CACTHING UP INMIDDLE INCOME SEGMENTS
5.1. PATTERN OF COMPETITION NOW AND THEN: INTERNATIONALISATION AND DIFFERENTIATION
The market structure of durable industries, like consumer electronics and automobileindustries, is characterised by differentiated and concentrated oligopolies, with few firmsoperating in global markets. Leading firms in this group are those capable of successfullyexploiting economies of scale and scope. The early 1990s competitive drivers have beenfurther stressed since then. (See first two columns of Table 5)
For competitive firms, product differentiation require constant introduction of new productswith new sets of attributes, such as price, brand, technology and technical assistance. Toachieve these product attributes, firms must invest in product development, marketing andpost-sales assistance, through authorised retailers’ network. Firms are constantly trying tocreate or expand market segments, in order to pay-off investments costs associated withproduct development and new or renewed installations.
To be competitive, it is mandatory to operate under minimum requirements in terms oftechnical and management economies of scale. The large minimum efficient scale becomes,then, a significant barrier to entry: incumbent firms must implement investment strategiesthat anticipate market growth. It is also relevant to operate production systems withincreasing levels of technical efficiency, quality and flexibility. Such needs implies anincreasing intensiveness in the use of microelectronic based automation and organisationaltechniques, devoted to continuous improvement of production processes, includingproduction organised around cells.
Given theses trends and due to the high contribution of components to total production cost,since the early 1990s, there has been a clear trend towards vertical disintegration, combinedwith new forms of articulation between assembler and suppliers. In relation to suppliers,essential competitive factors are: delivery times; price; technical conformity; stable industrialcontracts incorporating the transfer of stock administration costs to suppliers; and, jointdevelopment of components. The prevailing context of trade liberalisation has induced firmsto develop global sourcing systems. For some lines of electronic based consumer goods,there has also been an important trend towards subcontracting the production of final goodsto specialized contract manufacturing firms.
Investments carried out in these sectors normally induce dynamic effects in a host economy,directly or indirectly, including changing and upgrading the nature of employment of aregion. That is the reason why local authorities provide generous fiscal incentives to attractthese set of activities.
In Brazil, the consumer electronics and the automotive industries were strongly impacted bythe Real Plan and trade liberalisation. On one hand, the price stabilisation anchored in localcurrency overvaluation provoked an “income effect” that sharply expanded demand levels;

14
on the other hand, the late 1980s trade liberalisation was reinforced, imposing new and morerigid benchmarks for product attributes, like price and technical specification.
During the 1990s, firms in Brazil not only demonstrated the capacity to resist competitivepressure but also to implement pro-active strategies to exploit demand expansion, throughinvestment in new production capacity and higher levels of imports of parts and components.(See last two columns of Table 5). New entry took the form of green field investment,especially in automobile assembly, and acquisition of existing businesses in auto parts. Newentrants in consumer electronics combined both investment modes. As a result, by 2002, theinternationalisation of ownership, already a structural feature in these industries, waspractically completed. Representatives of most international leading players are currentlyoperating in Brazil.
Overall, it is possible to identify a reasonably homogeneous feature, in terms of product andinvestment strategies. Regardless their market segment, along the past decade, the share oftransnational affiliates has increased. Capabilities and performance among them do not differsignificantly and firms fiercely dispute market shares through investment in modernisationand expansion of productive capacity – acquiring local firms in the consumer electronic andauto parts industries and building of new production units in the automotive sector-. As aresult of the 1990s expansion, Brazil has become an important production platform of middlerange products, like sub-compact cars, in the international scenario. But, given the oscillatingand low growth trends of the Brazilian economy throughout the decade, most firms have yetto make full use of new installations.
Current competitive challenges are related to the consolidation of their position as reliableproducers of middle range products for the local, regional and international markets. Thisinvolves expanding their presence in international, especially intra regional trade flows andthe further exploitation of opportunities of global sourcing. This is especially true in a contextof low growth of the Brazilian market. Most probable, given existing newly acquired but idlecapacity, even in a scenario of local growth, most firms are well placed to sustaincompetitiveness, especially from imports, in the years to come.

TABLE 5PATTERNS OF COMPETITION (POC) AND COMPETITIVENESS IN DURABLES: NOW AND THEN
SOURCES OF COMPETITIVE
ADVANTAGES
PoC DIFFERENTIATIONRELEVANT DRIVERS
1990
PoC DIFFERENTIATIONRELEVANT DRIVERS
2002
BRAZILIANCOMPETITIVENESS 1990
BRAZILIANCOMPETITIVENESS 2002
INTERNAL FACTORS
MANAGEMENT Co-ordination capabilities Lack of capabilitiesClosing gap with internationalpractices
PRODUCTION Organisational flexibility Organisational rigidityClosing gap with internationalpractices
SALES Brand image NO CHANGE with increasingimportance of informationtechnologies
Brand imageClosing gap with internationalpractices
INNOVATION Product & components designLocal design capabilities butoutdated products
Demobilisation of localcapabilities but outsourcing ofupdated products
STRUCTURAL FACTORS
Segmentation by quality andmarketing INCREASED Low segmentation
Specialisation in middle rangesegments
MARKETPrice, brand, technologicalcontent, technical assistance INCREASED
High price, low technologicalcontent
Increased competition butinstability remains
Regional & global trade INCREASEDDistant from internationalnetworks
Regionalisation of markets; lessthreat of competition fromimports
Firm and plant level economiesof scale & scope INCREASED
Scale deficiencies in mostproduct lines
Optimisation throughspecialisation
CONFIGURATION OF
INDUSTRY
Articulation assembler-supplier,distribution INCREASED Infant articulation Closing relations with suppliers
Metrology & standardisation NO CHANGE Adequate AdequateProperty rights NO CHANGE Low levels of compliance Enforcement of property rights
REGIME OF REGULATIONAND
Consumer legislation NO CHANGE Infant legislation Stricter legislation
INCENTIVES Consumer credit NO CHANGE InexistentVariation according tomacroeconomic conditions
Fiscal incentives NO CHANGE Inexistent Extensive use of local incentives

16
5.2. COMPETITIVENESS IN 2002: EXPANSION, MODERNISATION AND PRODUCT UPGRADING. BUT,DEMAND CONTRAINTS STILL IMPOSE LIMITS TO FURTHER GROWTH
5.2.1. Capacity expansion and internationalisation
In the consumer electronic industry, the market expansion of the first half of the 1990sinduced the entry of new players and growth of incumbent competitors, both seeking tomove into new and expanding markets. It is worth emphasising that leading internationalplayers, such as Phillips, Panasonic, Sanyo and Toshiba have been operating in Brazil sincethe 1980s, thus, reproducing the international oligopoly structure in the Brazilian domesticmarket. Sony, and the national firms CCE and Gradiente, which have been traditional playersin the audio segments, strived to expand sales by diversifying into TV and video markets.Moreover, the Koreans Samsung Electronics and LG entered the country through newinvestments in the video segment. Entry of new competitors through M&A was even morepronounced in the freezers, fridges, cookers and washing machines segments.
During the last decade it has faced different periods of adaptation and change. After arecessive period in the early 1990s, leading manufacturers of audio and video segmentsimproved their economic performance, due to a significant increase in consumption levels,mostly from lower social classes. By 1996, sales of TV sets amounted to an unprecedentedlevel of 8,5 millions units. But, as shown in Figure 2, just as production expanded, it hasquickly contracted, during the second half of the 1990s.
High levels of credit default of low budget consumers damaged sales of major shoppingoutlets, leading to the bankruptcy of leading chains, thereby reducing revenue sales of mostelectronic manufacturers. As a result, the consumer electronic industry went through areorganisation process. Daewoo closed their operation plants, the Brazilian subsidiary ofSharp defaulted, and Samsung Electronics decided to focus their activities on mobiletelephony.
This inverted V shape of sales of Colour TV reveals two main features of the consumerelectronic industries: firstly these trends indicate how volatile the Brazilian economy hasbeen; secondly, that from a technical perspective, production of consumer electronics can beexpanded and contracted very fast, enabling firms to respond to positive and negativeevolution of demand.

17
FIGURE 2INDUSTRIAL SALES OF CONSUMER ELECTRONICS IN THE DOMESTIC MARKET (UNITS)
1990-2001
2.294.000
3.399.000
6.065.972
8.541.638
7.835.957
5.835.788
4.047.235
5.289.154
2.443.000 2.314.000
4.984.783
4.717.447
0
1.000.000
2.000.000
3.000.000
4.000.000
5.000.000
6.000.000
7.000.000
8.000.000
9.000.000
1990 1991 1992 1993 1994 1995 1996 1997 1998 1999 2000 2001 CD players Audio systems Radio/ tape recorders Camcorders Colour TV Videocassetes DVD-players
Source: Sá (2002)
In car assembly, green field investment prevailed. Table 6, below, informs new addedcapacity to the segment. Mitsubishi, Renault, Nissan and Peugeot-Citroen are newcomers,inaugurating production facilities in the country; Honda, Toyota, Daimler Chrysler,Volkswagen-Audi and Iveco were already operating in Brazil and added brand new productlines.
TABLE 6AUTOMOTIVE INDUSTRY - NEW ASSEMBLY PLANTS, 1996-2000
Firm Type of Good Location YearVolkswagen Engines São Carlos-SP 1996Volkswagen Lorries and buses Resende-RJ 1996Honda Cars Sumaré-SP 1997Mitsubishi Light commercial vehicles Catalão-GO 1998Renault Cars and engines São José dos Pinhais-PR 1998Toyota Cars Indaiatuba-SP 1998Daimler Chrysler Cars Campo Largo- PR 1999GM Components Mogi das Cruzes-SP 1999Volkswagen-Audi Cars São José dos Pinhais-PR 1999Mercedes Cars Juiz de Fora – MG 2000GM Cars Gravataí-RS 2000Iveco Engines Sete Lagoas-MG 2000Ford Cars Camaçari-BA 2001 Nissan Light commercial vehicles São José dos Pinhais-PR 2001Peugeot-Citroen Cars and engines Porto Real-RJ 2001
Source: Sarti (2002)
While new entrants and plants in car assembly increased competitive pressure, investments

18
in auto parts also brought in new firms but not via green field. Following international trends,mergers and acquisitions (M&A) was the dominant mode of entry. Hence, as only a smallproportion of resources were devoted to production expansion, higher rates ofinternationalisation and market concentration were observed. In 1994, local capital wasresponsible for at least 50% of total capital, sales and investment. By the end of the decade,the share of locally owned firms was down to approximately 25%.
5.2.2. Specialisation and modernisation
The Brazilian consumer electronics and automotive industries are very specialised in themiddle range segment strategy. Throughout the 1990s firms invested in upgrading technicalspecifications to international levels, while relying on established technology standards,imported components and on imported finished products for lower and upper end segments.This option can be explained by two factors: firstly, the income profile of local demand;secondly, competitive pressure from imports imposed minimum levels for product attributes.
This economic performance of this industrial group was very much influenced by theevolution of aggregate demand. For example, in 2000, sales revenue of audio and videomarkets plummeted to US$ 3.5 billion, well bellow the US$ 8.1 billion reached in 1996. Idlecapacity is more pronounced in auto producers as they are not able to shut down capacity aseasily as producers in consumer electronics.
This industry has yet to compensate the volatile local demand with greater exposure tointernational trade; exports in the audio and video segments have remained at around US$350 million since 1990, representing a very small proportion of local sales; imports of finalgoods are around US$ 150 million, increasing to US$ 450 million, when local demandexpanded. The main destinations of these exports were Argentina, Hungary, Italy and Spain.Nevertheless, infant and growing exports have not been able to compensate the significantincrease on the value of imports of electronic components from South Korea and Japan.According to Sá (2002), although the industry has reduced its trade deficit, from US$ 1.5billion in 1997 to US$ 1.1 billion in 2000, the lack of production capacity in componentsconstitute a structural weakness of this industry.
In the automotive sector, regardless of ownership changes, investments were significant andthe Brazilian competitive gap was significantly reduced, in terms of product attributes andefficiency levels of installations. In aggregate terms, as shown in Table 7, there weresignificant increases in productivity - the number of cars produced in a year per worker hasgrown three times in the period 1990-2001, reaching 21.3 units.
TABLE 7EMPLOYMENT AND PRODUCTIVITY IN CAR ASSSEMBLY
1990 1992 1994 1996 1998 2001Employment 117,396 105,664 107,134 101,857 83,049 85,257Labour productivity* 7.8 10.2 14.8 17.7 19.1 21.3* units per worker in a given yearSource: Sarti (2002)
At this point, it is important to call attention to changes in the nature of assembly-suppliersrelations in the automotive sector. Firstly, suppliers were induced to set up productionfacilities very close to assembly units, to enable just-in-time operations. Most new plantswere designed under the concept of condominium, were specific areas were designated to beoccupied by selected auto parts corporations that would enjoy exclusive relations withassemblers. In counterpart they would also bear and share investment costs. Secondly, inorder to deal with new modes of relations, auto parts companies – now, for most partsubsidiaries of key international players – developed an intense intra-firm trade, therebyexpanding auto parts imports from their original transnational corporations. From 1989 to2001, auto parts imports increased 300%, reaching US$ 4.3 billions in 2001 and a tradedeficit of US$ 445 million.

19
Within a context of capacity expansion, modernisation and ownership change, auto sales inBrazil evolved from 713.000 units in 1990, to 1.9 million in 1997 and 1.6 million units in2001. Most auto assemblers operating in Brazil focused the subcompact segment, withengines on the 1000 to 2000cc range. In 2001, 71% of domestic production was related tothis segment. International trade of the Brazilian auto industry was marked by strongcomplementarities with Argentina: after a brief expansion in the post-trade liberalisationyears, the level of cars imports was reduced to US$ 2 billion in the biennium 2000/2001.Almost 66% of these imports came from Argentina. By the same token, 44% of theArgentinean imports are originated in Brazil.
6. TRADITIONAL INDUSTRIES. COMPETITIVE CONSTRAINTS ARE STILL DEFINEDBY UNEQUAL INCOME LEVELS
6.1. PATTERN OF COMPETITION NOW AND THEN: MARKET SEGMENTATION CUM NETWORKING
Market segmentation is an inherent feature of traditional industries. Thus variety prevails, interms of number and technical specifications of products, nature of production processes(assembly, flow and batch production) and minimum size of technical economies of scale,verticalisation and outsourcing levels and organisational format of companies.
Industries are very sensitive to oscillations in demand and responsiveness is the keycompetitive driver of these industries. (see first two columns of Table 8) The importance ofresponsiveness comes from two sources. Firstly, with considerable marketing efforts,companies constantly have to introduce new product designs, creating niches or imposingthemselves in their markets. If successful, immediate demand expansion follows. Thus, theymust increase production levels to corresponding growth of demand, while keeping deliverytimes under control. Secondly, demand levels are subject to seasonal oscillations, imposingthe need of constant adaptation of production levels. Compliance to these two sources ofoscillations in demand is facilitated by the relatively technical easiness of productionprocesses and low investment costs in expanding capacity. In fact, regardless the importanceof imposing new consumer habits, investments by firms in these industries are closelyassociated to changes in demand levels.
The extent of market segmentation is defined by the size and income profile of a givenconsumer population. In such a context, the degree of importance for competitiveness ofproduct attributes like price, brand and adequacy to use are directly related to income levelsof consumers groups aimed at by corporations. The higher the income levels, the lessrelative importance the price attribute will have and the greater the value of attributesassociated with attending particular specifications of clients. Nationwide, if high-incomelevels prevail, firms with similar competences will co-exist but operating in different marketsegments. Otherwise, where income differentials are significant, firms with verydifferentiated competences, but operating in similar markets, will survive. It is important toremark that, given the relatively low unit value of traditional products in consumer baskets,high levels of product renovation and differentiated competences among firms may prevail,even in a context of very unequal income levels, but where the absolute size of the market isexpressive, as in the case of Brazil.
Entrepreneurial skills to promote product renovation and to keep updated organisationalformats - especially in relation to design, marketing, quality systems and relations withsuppliers- are essential for competitive success in traditional industries. The basic sources oftechnical change for these industries are equipment and input supplier industries. In the past10 years an increasing role has been played by information technology related equipmentand chemical related inputs. Those corporations capable of accessing these inputs in betterterms will definitely enjoy competitive advantages.
In general such privileged access to suppliers is related to size: smaller companies can

20
survive in specific market niches, but they may face economic and financial difficulties inmobilising the necessary resources to fully enjoy equipment and input sources of competitiveadvantage. Given the inherent economic variety of this industry, this may be the basicreason behind an increasing trend towards companies organising themselves around localproductive clusters –organised horizontally and/or vertically-. Through local clusterscompanies can benefit from another source of competitive advantage: economies ofagglomeration, through which they share costs associated with any and every kind of theireconomic activity: infrastructure, labour and other inputs, design and marketing, informationsystems, etc.
Traditional industries are among the oldest industrial activities in Brazil and competitiveheterogeneity was and still is their relevant structural feature. The co-existence of verydifferentiated levels of competences among firms in each sector –and even among stages ofproduction, within a given firm – can be directly associated with the country’s remarkableuneven income distribution profile. In 1990 competitiveness was directly associated withsize: large firms were likely to be more competent than their smaller counterparts.
Larger firms were able to explore different market segments, to invest in modernisation andto export. The analysis of textile, shoe and furniture industries indicate that, in 2002, suchstructural feature still prevails. But, as shown in the last two columns of Table 8, someprogress has also been observed. The rate of product renovation has increased, throughexplicit and increased design efforts. Production modernisation has been facilitated by theincorporation of more efficient machinery. Local clusters have emerged in increasing numberand are being consolidated in different industries and regions of the country. Companieshave further explored low labour cost opportunities, by transferring installations to theNortheast of the country.

Av. Pasteur 250 - Urca - RJ - CEP 22290-240 Tel: 55-21-3873 5242 – Fax: 55-21-541 8148 –e-mail: [email protected] http://www.ie.ufrj.br/gic
21
TABLE 8Patterns of competition (POC) and competitiveness in Traditional Industries: now and then
SOURCES OF COMPETITIVE
ADVANTAGES
PoC RESPONSIVENESSRELEVANT DRIVERS
1990
PoC RESPONSIVENESSRELEVANT DRIVERS
2002
BRAZILIANCOMPETITIVENESS 1990
BRAZILIANCOMPETITIVENESS 2002
INTERNAL FACTORS
MANAGEMENT Entrepreneurial skillsMore importance of creating newmarket segments
Existence of a core group ofcompetitive firms; size andnationality heterogeneity
Increased heterogeneity: leaders close tothe international frontier; reliance onoutsourcing and low labour costs
PRODUCTION Quality controlIncreasing trends towardsgreater flexibility and outsourcing
Incipient Increased competence
SALES Market informationIncreasing importance ofmarketing
Incipient Increased competences
INNOVATIONEmbodied technology, learningby doing
Increasing importance of design Copying strategySimilar, improvements in few segmentsand products
STRUCTURAL FACTORSSegmentation by levels ofincome & type of product
INCREASEDLimited segmentation due toinequalities in income levels
Inequalities remain but segmentationincreased
MARKETPrice, brand, delivery times,customer orientation
INCREASED Low use of product attributesHigher use of price attributes, increasedcompetition
Local & international tradeINCREASED importance ofinsertion on international supplychains
Potential large size of nationalmarket but reliance on localtrade; threats from imports
Demand fluctuation due to economicinstability; incipient internationalexposure
Economies of agglomeration andnetworking
GREAT INCREASE Limited to few segmentsSome dissemination of localarrangements; relocation due to labourcosts
CONFIGURATION OF
INDUSTRYEfficient supply of equipment NO CHANGE Deficient supply of equipment
Expansion of equipment imports withbetter price/efficiency ratio
Metrology, standardisation,certification; market & technicalinformation; training
NO CHANGELow efforts and lack of co-ordination
Improvements restricted to medium andlarge companies
Anti-dumpingINCREASED, due preferentialaccess in bilateral agreements
Low use Increased use in local markets
REGIME OF REGULATION AND Competition & consumer policies NO CHANGEInfant, unfair competition frominformal sector
Increased but still incipient importance;unfair competition from informal sectorremains
INCENTIVES Support for SME INCREASED in size and scope Lack of effective instrumentsImprovements in support formanagement but lack of financialinstruments remain
Tax system NO CHANGE Anti-competitiveness bias Bias remain

Av. Pasteur 250 - Urca - RJ - CEP 22290-240 Tel: 55-21-3873 5242 – Fax: 55-21-541 8148 –e-mail: [email protected] http://www.ie.ufrj.br/gic
22
6.2. COMPETITIVENESS IN 2002: INCREASING RESPONSIVENESS BUT HETEROGENEITY STILL
PREVAILS
6.2.1. Asymmetric capabilities
A clear difference prevails between traditional industries. For instance, while the shoeindustry exports 30% of total production, textiles and garment industries focus theirproduction on domestic market. Until the mid-1990s, most shoe exports were directed tolow-end market segments, where the price attribute is relevant. In despite of competitivepressure from Chinese producers –that occupy similar market segments -, exportperformance has evolved positively during the 1990s. As shown in Table 9, exports increasedfrom US$ 1.1 billion in 1990 to US$ 1.6 billion in 2001. Unit prices have also increased,indicating that the local industry is upgrading its product portfolio. It is necessary to bear inmind that since 1999, devaluation has helped exports.
TABLE 9BRAZILIAN SHOE EXPORTS, SELECTED YEARS (VALUE, QUANTITY AND AVERAGE PRICE)
Year Value (US$ million) Pairs (millions) Average price (US$)1990 1,107 143 7.741995 1,414 138 10.252000 1,547 163 9.522001 1,615 171 9.43
Source: Costa (2002)
Other factors have also contributed to the industry’s international performance: fiscalincentives and export credits; the consolidation of gains from economies of agglomeration,especially in the southern state of Rio Grande do Sul and the accumulated export experience.Nevertheless, labour costs still provide an important competitive edge to Brazilianproduction. In 1993 labour costs in Brazil was US$ 1 per man-hour, compared to US$ 0.5 inChina, US$2.5 in Korea and US$ 8 in Spain.
Costa (2002) suggests high importance of exchange rate to this exporting industry. Duringthe 1994/98 period, when the Real was overvalued, total employment fell by 56 thousand.But, as demand expanded – between 1999 and 2000 exports increased by US$ 270 millionor 26 million pairs of shoes-, companies quickly contracted 29 thousand extra workers.
Among the three most important segments of textiles –textiles, fibre and garment there areimportant economic differences, as shown in Table 20.
TABLE 10NUMBER OF ESTABLISHMENTS, EMPLOYMENT AND REVENUE SALES IN TEXTILE, FIBER AND
GARMENT INDUSTRIES, 2000
Chemical Fibres Textiles Garment
Establishments 25 3,305 18,797Employment (1,000) 15 339 1,233Production (1,000 ton/year) 640 1,750 1,287Sales/ year (U$ billion) 1.4 16.6 27.2
Source: Prochnik (2002)
Combined sales of 22 thousand establishments, employing 1.5 million workers, amounted toUS$ 45.2 billion, in 2000. The production of chemical fibres is technically more sophisticatedand the size of operations is larger, in general, controlled by foreign owned firms. On theother extreme, in the garment industry, small and medium size, locally owed firms prevail,employing 1.2 million workers in 18.000 establishments.
Contrary to the shoe industry, the international performance of the textile Brazilian industry,

Av. Pasteur 250 - Urca - RJ - CEP 22290-240 Tel: 55-21-3873 5242 – Fax: 55-21-541 8148 –e-mail: [email protected] http://www.ie.ufrj.br/gic
23
as shown in Table 11, was never economically significant, in despite of the fact that in somesegments, like garment, competitiveness drivers are similar to those prevailing in shoeindustry.
TABLE 11TEXTILES AND GARMENT WORLD TRADE AND BRAZILIAN SHARE, 1995/2000
Textiles 1995 1996 1997 1998 1999 2000
World trade (US$ billion) 111.1 113.6 119.3 112.5 113.0 126.1
Brazil export share (%) 0.90 0.89 0.86 0.79 0.73 0.71
Brazil import share (%) 1.23 0.98 1.01 0.95 0.79 0.88
Garment
World trade (US$ billion) 124.0 128.7 141.9 149.3 150.0 165.5
Brazil export share (%) 0.24 0.19 0.15 0.12 0.12 0.17
Brazil import share (%) 0.30 0.29 0.32 0.25 0.14 0.11
Source: Compiled from Prochnik (2002)
6.2.2. Modernisation and relocation of production
During the 1990s, a process of relocation towards the Brazilian Northeast region followed themodernisation process of Brazilian traditional industries.
In the shoe industry, companies implemented modernisation of product processes andproduct portfolio, including the introduction of automated equipment, new organisationaltechniques associated with increasing quality and decreasing waste and down time. Therewere also concerted efforts to increase product lines, associated with higher processflexibility.
In textiles and garment, modernisation was stimulated by three sources of dynamism.Firstly, during the first half of the 1990s, the Real Plan induced positive expectations inrelation to growth of demand; secondly, starting in 1995, the national development bank,BNDES, financed a US$ 2 billion program for machinery acquisition, especially for largerfirms; thirdly, import liberalisation and an overvalued Real on one hand, and advances intechnology, on the other, resulted in the possibility of importing updated machinery atdecreasing prices. Investments in new machinery implied changes in production processeswith negative impact on employment levels. As elsewhere, employment levels in textile andgarment industries fell substantially along the 1990s: these two segments have faced a40,7% decrease in employment levels between 1990 and 2000
Concurrently, a significant number of companies of these industries migrated from Southeastregions to the Northeast (Table 12), looking for lower labour costs and generous taxincentives, including VAT exemptions, the supply of physical infrastructure and export creditlines.

Av. Pasteur 250 - Urca - RJ - CEP 22290-240 Tel: 55-21-3873 5242 – Fax: 55-21-541 8148 –e-mail: [email protected] http://www.ie.ufrj.br/gic
24
TABLE 12SHARE OF DIFFERENT REGIONS IN BRAZILIAN TEXTILE PRODUCTION, 1990/2000
Industry Northeast Southeast South Total1990 2000 1990 2000 1990 2000 -
Fibre 24.9 35.4 55.2 42.6 17.2 21.7 100Fabric 17.6 21.5 65.6 62.0 12.8 13.7 100Knitted Garment 2.8 10.0 39.9 35.2 55.7 53.5 100Garment 8.0 11.3 66.6 56.1 21.6 25.4 100
Total 13.3 19.6 56.8 49.0 26.8 28.5 100Source: Prochnik 2002
7. INNOVATION CARRIERS. MOVING AHEAD, LAGGING BEHIND ANDCOMPETITIVENESS IS STILL VERY WEAK
7.1. PATTERN OF COMPETITION NOW AND THEN: THE INCREASING ROLE OF INNOVATION
Innovation carriers industries brings together activities that have the capacity to induceprogress to other economic activities, through embodied technical change incorporated incapital goods and components. Market segmentation is the main feature of demand. Sincetheir products have specific applications, in general, each firm competes directly with veryfew rivals. Along the years and with the pervasiveness of information technologies, sectoralleaders have evolved from supplying equipments to become providers of technical solutionsand services to clients.
These firms are also notable for their high levels of investments in R&D activities, reflectingthe sectors’ most relevant competitive driver: the capacity to implement product innovationsand to address particular demands of clients, in specific market segments. (see first twocolumns of Table 13) Innovation capabilities also define the most important barrier to entryin these sectors. R&D growing costs has led to the emergence of different modes of alliancesamong firms, mostly devoted to dilute technological risks of partners involved. Thesefeatures define an important role for the relationship between firms and research centres, ofpublic or private nature.
Due to its strategic role, nations with complex industrial structures have always implementedactive industrial policies to promote and consolidate the competitiveness of innovationcarriers in local and international markets. Besides an active support to technologicaldevelopment, imports restrictions, favourable financing conditions, the purchasing power ofgovernments and fiscal incentives are mechanisms used by nations.
Among all industrial groups, Brazilian innovation carriers suffered the worst consequencesfrom economic liberalisation. Until then firms presented reasonable levels of productioncapacity and well qualified human resources were available, mainly in mechanicalengineering. This was a result of a long learning process, partially as a result of an expandinglocal market, partially as a result of active industrial policies of the 1970s and 80s. But, eventhen, most producers of mechanical engineering and electronic based equipment were notcompetitively strong. Innovation carriers have always had high levels of verticalisation anddiversification, dependence on foreign technological suppliers and incipient relations with thelocal scientific infrastructure.
Along the 1990s, producers of mechanical engineering and telecommunication equipmentsand computers revealed a common feature, an important strengthening of productioncapabilities. However, this was not enough to resist foreign competitive pressures. Newentrants acquired local firms and intra-firm imports were extensively used. (see last twocolumns of Table 13)

Av. Pasteur 250 - Urca - RJ - CEP 22290-240 Tel: 55-21-3873 5242 – Fax: 55-21-541 8148 –e-mail: [email protected] http://www.ie.ufrj.br/gic
25
TABLE 13Patterns of competition and competitiveness in innovation carriers: now and then
SOURCES OF COMPETITIVEADVANTAGES
PoC INNOVATIONRELEVANT DRIVERS
1993
PoC INNOVATIONRELEVANT DRIVERS
2002
BRAZILIANCOMPETITIVENESS
1990
BRAZILIANCOMPETITIVENESS
2002INTERNAL FACTORS
MANAGEMENTR&D-production-marketingintegration
NO CHANGE Low capabilitiesLow capabilities with increasingmarketing efforts
PRODUCTION Design for manufacturing NO CHANGESome capabilities in mechanicalengineering
Reliance on imported design
SALESMarket creation & business tobusiness marketing
INCREASED due to thediffusion of IT
Low capabilities Infant
INNOVATION R&D + design NO CHANGE Low capabilitiesIncreasing reliance on importedtechnology
STRUCTURAL FACTORSSegmentation by technicalneeds
NO CHANGECapabilities in lower endsegments
Increasing segmentation
MARKET Attention to client specifications INCREASED Excessive standardisation Increasing responsiveness
Local & regional trade INCREASEDExports of standard andtechnologically simpleequipment
Increasing imports ofcomponents from OECD andexports of final goods to LatinAmerica
CONFIGURATION OFINDUSTRY
Economies of specialisation Related diversificationExcessive diversification andverticalisation
No clear emerging pattern
Interaction with users INCREASED Low interaction Increasing interactionScience & technology systems INCREASED Incipient Low technological investment
Intellectual property rights INCREASED Nationalistic oriented regulationsEnforcement of property rightsand stabilisation of rules
REGIME OF REGULATION AND Selective protection DECREASED Nationalistic oriented regulations Excessive liberalisation
INCENTIVES Risk support NO CHANGE Inexistent Limited
Credit for users NO CHANGE Limited Limited
State purchasing power DECREASEDFew attempts towardsarticulation
Disarticulated
Av. Pasteur 250 - Urca - RJ - CEP 22290-240 Tel: 55-21-3873 5242 – Fax: 55-21-541 8148 –e-mail: [email protected] http://www.ie.ufrj.br/gic
26
7.2. COMPETITIVENESS IN 2002: MODERNISATION, IMPORT DEPENDENCE AND OWNERSHIP
INTERNATIONALISATION
7.2.1. Growth, modernisation, deverticalisation and product upgrading
Suppliers for the telecommunications sector considerably expanded production capacity dueto the rules of privatisation of telecommunication utilities that imposed rigid expansiontargets for acquiring companies. As a result of changes in legislation, equalising opportunitiesfor local and foreign owned firms, computer assembling became internationalised by meansof foreign direct investment in new facilities and asset acquisition and substantial increases incomponent imports. Facing imports, mechanical engineering producers promoted arationalisation process strongly associated with a significant decrease in production capacity.
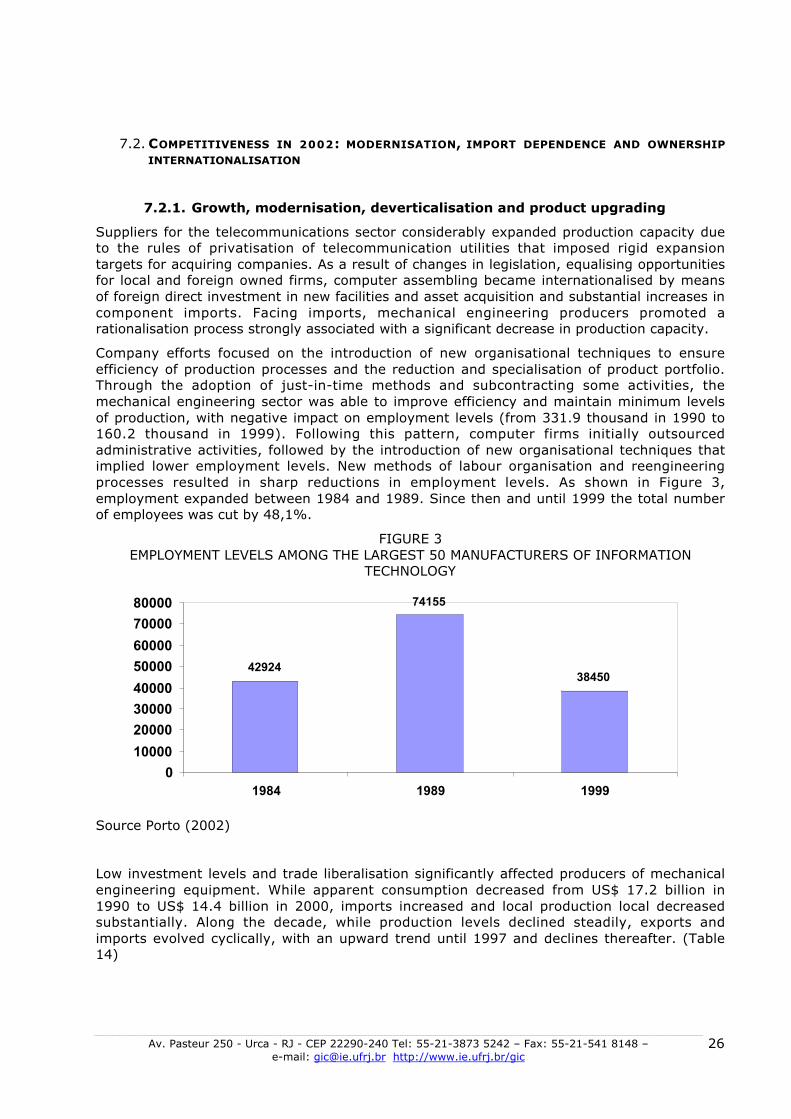
Company efforts focused on the introduction of new organisational techniques to ensureefficiency of production processes and the reduction and specialisation of product portfolio.Through the adoption of just-in-time methods and subcontracting some activities, themechanical engineering sector was able to improve efficiency and maintain minimum levelsof production, with negative impact on employment levels (from 331.9 thousand in 1990 to160.2 thousand in 1999). Following this pattern, computer firms initially outsourcedadministrative activities, followed by the introduction of new organisational techniques thatimplied lower employment levels. New methods of labour organisation and reengineeringprocesses resulted in sharp reductions in employment levels. As shown in Figure 3,employment expanded between 1984 and 1989. Since then and until 1999 the total numberof employees was cut by 48,1%.
FIGURE 3EMPLOYMENT LEVELS AMONG THE LARGEST 50 MANUFACTURERS OF INFORMATION
TECHNOLOGY
42924
74155
38450
0
10000
20000
30000
40000
50000
60000
70000
80000
1984 1989 1999
Source Porto (2002)
Low investment levels and trade liberalisation significantly affected producers of mechanicalengineering equipment. While apparent consumption decreased from US$ 17.2 billion in1990 to US$ 14.4 billion in 2000, imports increased and local production local decreasedsubstantially. Along the decade, while production levels declined steadily, exports andimports evolved cyclically, with an upward trend until 1997 and declines thereafter. (Table14)

Av. Pasteur 250 - Urca - RJ - CEP 22290-240 Tel: 55-21-3873 5242 – Fax: 55-21-541 8148 –e-mail: [email protected] http://www.ie.ufrj.br/gic
27
TABLE 14MECHANICAL EQUIPMENT: PRODUCTION AND INTERNATIONAL TRADE -1990-2000 (US$
BILLION)
Year Production Exports ImportsTrade
balanceApparent
consumptionExport
coefficient %Import
coefficient %1990 16.7 2.6 3.2 -0.5 17.2 15.9 18.51995 14.3 3.8 6.9 -3.1 17.4 26.6 39.82000 11.5 3.5 6.4 -2.9 14.4 30.5 44.7
Source: Vermulm and Erber (2002)
The scenario for suppliers of telecommunications equipment was very different from themechanical engineering sector. In the second half of the 1990s industry faced an expandingdemand imposed by rules of privatisation of telecommunication utilities coupled withintensive technical progress. An estimate by Oliva (2002) suggests that under investmentinductive rules of concessions amounted to US$ 20 billion, between 1998 and 2000.
Data from Oliva (2002) also show that sales revenue in 2000 were 124% higher than the1995 level. These figures alone indicate that growth in demand attracted firms to install newassembly units in the country. Brazilian firms were very efficient in setting up local facilities,strongly relying on global sourcing to ensure delivery times to clients. That is the reasonbehind the industry’s trade deficit that reached, in 2001, US$ 2 billion, a result of U$ 3.5billion of imports (43% from the ALCA region, 26% from UE) and US$ 1.5 billion of exports(90% to the ALCA region).
Regarding computer industry (computers and components), Porto (2002) found an importantexpansion of sales, departing from US$ 6 billion in 1990 to reach US$ 10.7 billion in 1998.Since then growth has slowed down. These figures suggest that the computer industry hasmanaged to outgrow component production. To a large extent, this is explained by theincreasing reliance of this industry on imported components.
Indeed, when contrasting imports of components and imports of final computer goods (Table15), the disparity is quite clear: from 1997 to 2001 the average annual value of componentsimports equalled US$ 5.1 billion, while the average annual value of imported computersamounted to US$ 1.02 billion. More important, when local computer sales decreased, after2000, and the Real was devalued -after 1999-, computer imports remained relatively stablebut imports of electronic components increased even further.
TABLE 15COMPUTER INDUSTRY, IMPORT/EXPORTS 1997/2001, US$ MILLION
Year 1997 1998 1999 2000 2001Exports (1+2) 1,331 1,458 1,587 1,865 1,8091- Computer 255 235 323 346 2512- Components 1,076 1,223 1,264 1,519 1,558 of which, components for computers 91 124 151 144 146
Imports (3+4) 6,406 5,840 5,874 7,690 6,7933- Computer 1,232 1,090 855 1,080 1,0324- Components 5,174 4,750 4,839 6,610 5,761 of which, components for computers 562 671 665 856 782
Trade Balance 5,075 4,382 4,287 5,825 4,984Source: Porto (2002)
7.2.2. The division of labour between local and foreign owned firms
The competitiveness of Brazilian mechanical engineering capital goods is higher in productlines of low and medium technological intensity, where product cycles have matured. Price

Av. Pasteur 250 - Urca - RJ - CEP 22290-240 Tel: 55-21-3873 5242 – Fax: 55-21-541 8148 –e-mail: [email protected] http://www.ie.ufrj.br/gic
28
competitiveness is decisive and company advantages lie on privileged access to low inputand labour costs. Brazilian industry is also competitive in specific market niches, especiallywhere equipments are technically more sophisticated, requiring strong interactions betweensuppliers and clients, and local and regional demand is economically relevant and relativelyhigh.
However, some of the structural features of the 1980s, especially the division of labourbetween local and foreign producers have not changed. Locally owned companies areprevalent in low technology segments, while foreign companies dominate sophisticatedproduct lines. These features indicate that companies that have managed to survive thehardships of the 1990s are in better competitive shape than before: they are leaner in termsof production processes and product portfolio. Specialisation levels have increased which mayconstitute the basis upon which to grow in the years to come. Even so, most of thecompetitive challenges of the early 1990s remain, especially those related to a weaktechnological base.
In telecommunications, even with increasing reliance on imports, to a great extent, demandcould be supplied from local sources because of the industry’s previous experience in thecountry. Before economic liberalisation most international players were already established inthe country and some local firms were equally very active. But the expansion of demandbrought in new foreign firms, through the acquisition of local firms. As a result, foreigncompanies controlled 91.3% of the 2000 US$ 8.8 billion total sectoral sales. (Oliva 2002)
Indeed, according to Porto (2002), when a broader definition is given to the computer andtelecommunication industries, the panorama is not different. Gross sales in InformationTechnology industries increased from US$ 16 billion to US$ 30 billion, between 1996 and2000. Foreign owned firms expanded their market share from 48.2 to 65.8%, at the expenseof private locally owned firms.
8. 10 YEARS INTO ECONOMIC LIBERALISATION, RATIONALISATION AND INWARDINTERNATIONALISATION HAS BEEN MADE IN BRAZIL. AND AFTER?
A balance of production Made in Brazil, 10 years after economic liberalisation, indicates anstriking and different feature from other Latin American countries: between 1990 and 2002most structural features of industry did not change. Very few genuinely new economicactivities were added to the country’s industrial matrix and very few previously existingactivities ceased to exist.
The most important changes were observed in the management of production processes andin the ownership landscape of industry. Modernisation and inward internationalisation werethe outstanding, economically significant and generalised processes taking place in the 1990-2002 period, across industry. In reality, these processes do not represent an innovation in aSchumpeterian sense. Foreign capital has always had a prominent role in industry becausethe Brazilian economy was never closed to foreign ownership as in it was in foreign trade. Inrelation to modernisation, around the mid-1980s, leading firms in most industrial sectorswere already introducing updated organisational techniques to increase efficiency andquality.
Along the years modernisation and inward internationalisation were strengthened amongleaders and diffused more extensively across sectors, assuming economically significantproportions. The role of foreign capital was considerably strengthened, especially in dynamicindustrial segments. Modernisation provided the basis upon which firms sustainedcompetitive pressures from expanding imports and the entry of new competitors. The widediffusion of labour saving techniques and machinery, deverticalisation and sub-contractingand a lack of sustained growth in demand levels impacted employment at levels never seenin Brazilian history.
The modernisation was strongly biased towards rationalisation and not towards expanding

Av. Pasteur 250 - Urca - RJ - CEP 22290-240 Tel: 55-21-3873 5242 – Fax: 55-21-541 8148 –e-mail: [email protected] http://www.ie.ufrj.br/gic
29
production capacity and developing innovation capabilities to support the introduction of newprocesses and products. Facing changing economic context and framework conditions,industrialists were not willing to invest in new plants and even less in R&D, the mostuncertain of all investments.
More interestingly though, modernisation did not induce changes in the relative position offirms. Those that were relatively stronger in the pre-change period have shown betteradaptive capacity and vice-versa. Large and foreign owned firms, from commodity or durableindustrial groups, located in the southern part of the country have increased their relativedistance from firms situated down below the competitive ladder.
Foreign trade expanded significantly, from US$ 50 billion in 1990 to US$ 100 billion in 2001.But trade patterns remained relatively unchanged: imported goods have high incomeelasticity of demand while low unit value prevails in exports. Production modernisationbenefited from imported electronic components and chemical inputs, while the commodityindustrial group still generates most of the country’s foreign exchange. Trade deficits surgedand were overcome only in 2000, after a strong currency devaluation. Regardless of theseadvances, the share of Brazilian foreign trade in world trade has declined from 1.4% in themid-1980s, to 0.75% in 2001.
Mergers and acquisitions changed the ownership landscape of Brazilian industry, stronglyreinforcing the share of foreign capital. Moreover, between 1990 and 2002, only in very fewsectors - steel, automotive, consumer electronics and equipments for telecommunications-investments in new plants and capacity expansion were carried out. These are examples ofpositive reactions to a combined phenomenon of demand expansion and pro-activeresponses to increasing competition. They are useful in indicating a potential vitality, pro-growth, in the Brazilian industry.
Among industrial groups interesting regularities exist. Strong competitiveness has been andremain essentially associated with commodity producers and local capital is still prevalent.But commodity producers have followed a dual track strategy: exports of low unit valueproducts and internal sales of high unit value goods. In durable industries, throughinvestments in new plants, increasing product differentiation and expanding imports ofcomponents, competitiveness was strengthened especially on middle range products. Foreignfirms are dominant in the ownership landscape and exports are increasing. Heterogeneity isstill an important feature of traditional industries, mostly dominated by local capital.Responsiveness, a key competitive driver, has increased, alongside with the formation oflocal production clusters and the relocation of plants to low cost regions, especially theNortheast. Among innovation carriers, weak competences still prevail, although firmssignificantly improved their ability to deliver equipment where demand was expanding.Ownership internationalisation has increased, inducing a marked division of labour: foreignfirms control the assembly of equipments and the imports of strategic components whilelocally owned firms are either suppliers of standardised components or producers oftechnologically simple machinery.
In summary, Brazilian industry has shown an important adaptive capacity to institutionalchange. Competitive capabilities were reinforced thanks to a modernisation drive, stronglybiased towards and limited to rationalisation. Interestingly though, in few areas, were growthprospects were high, industry responded by expanding capacity. However, responsiveness tochallenges imposed by economic liberalisation and growth prospects is unevenly distributed,favouring those firms with previously accumulated capabilities. Most probably this is animportant determinant behind the acceleration of ownership internationalisation.
Thus Brazil may face a development paradox in the years to come. History tells us that localcapital and innovation capabilities have been outstanding features of countries successful insustaining economic and social development. If ownership internationalisation is to remainand local innovation capabilities must be pursued, then Brazilian private and public policymakers are facing challenges associated with how to attract investments of this nature. To agreat extent, this will mean an important departure from established policy practices, to newways of regulating and inducing firms towards local value creation.

Av. Pasteur 250 - Urca - RJ - CEP 22290-240 Tel: 55-21-3873 5242 – Fax: 55-21-541 8148 –e-mail: [email protected] http://www.ie.ufrj.br/gic
30
9. REFERENCES
AMADEO, E.; SOARES, R.R. (1996). Abertura, Produtividade e Organização Industrial.CIET/SENAI. mimeo
BIELSHOWSKY, R. (1998). Investimentos na Industria Brasileira, 1995/97, Características eDeterminantes, CNI, Rio de Janeiro
BONELLI, R. (1996). Produtividade Industrial nos Anos 90: Controvérsias e Quase-Fatos inEconomia Brasileira em Perspectiva -1996. Vol 2. Cap 27.
COUTINHO, L.; FERRAZ, J.C. (coords). (1994). Estudo da competitividade da indústriabrasileira, Campinas, Editora Papirus
FERRAZ, J.C.; KUPFER, D.; HAGUENAUER, L. (1996a) The competitive challenge for BrazilianIndustry, CEPAL Review, vol. 58.
FERRAZ, J.C.; KUPFER, D.; HAGUENAUER, L. (1996b) Made in Brazil: Desafios Competitivospara a Indústria Brasileira, Rio de Janeiro, Campus.
GONZAGA, G. (1996). Determinação do Emprego Industrial no Brasil. CIET/SENAI. mimeo
HAMAGUCHI, N. (2003) A Study on the impact of Economic Liberalization in Brazil: 1995-2002, LAS Series n.4, Institute of Developing Economies, JETRO, Japan,mimeo
KUME, H. (1996). O Plano Real e as mudanças na estrutura da tarifa aduaneira. EstudosFUNCEX/RBCE. nº 48. RJ.
ROCHA, F. e KUPFER, D. (2002). Structural Changes and Specialization in Brazilian Industry:The Evolution of Leading Companies and the M&A Process. The DevelopingEconomies. No. 40. v 3. December.
SALM, C; SABÓIA, J.; CARVALHO, P. (1996). Produtividade da indústria brasileira – umacontribuição ao debate. Texto para Discussão 376. IE/UFRJ.